30
Lectures in Macroeconomics- Charles W. Upton Fitting the Facts D S SR S LR H* w*
| Date post: | 17-Dec-2015 |
| Category: |
Documents |
| Upload: | moses-newman |
| View: | 218 times |
| Download: | 0 times |
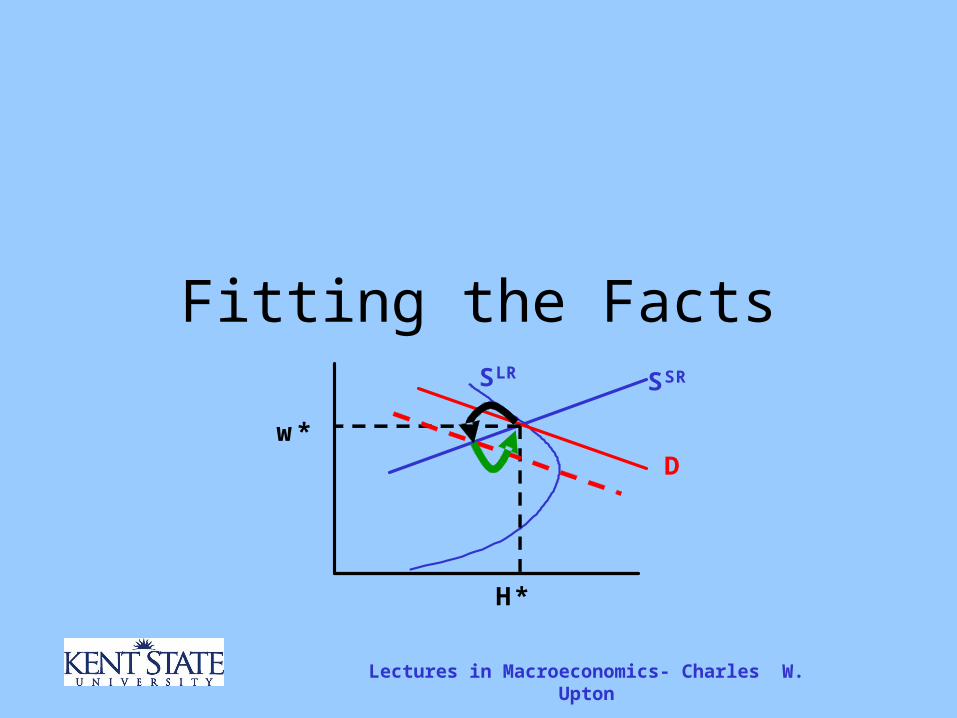
Lectures in Macroeconomics- Charles W. Upton
Fitting the Facts
D
SSRSLR
H*
w*

Fitting the Facts
Differences
D
SSRSLR
H*
w*

Fitting the Facts
A Temporary Demand Decrease
D
SSRSLR
H*
w*
Fitting the Facts
A Temporary Demand Decrease
D
SSRSLR
H*
w*Decline in output
followed by increase in
output
Fitting the Facts
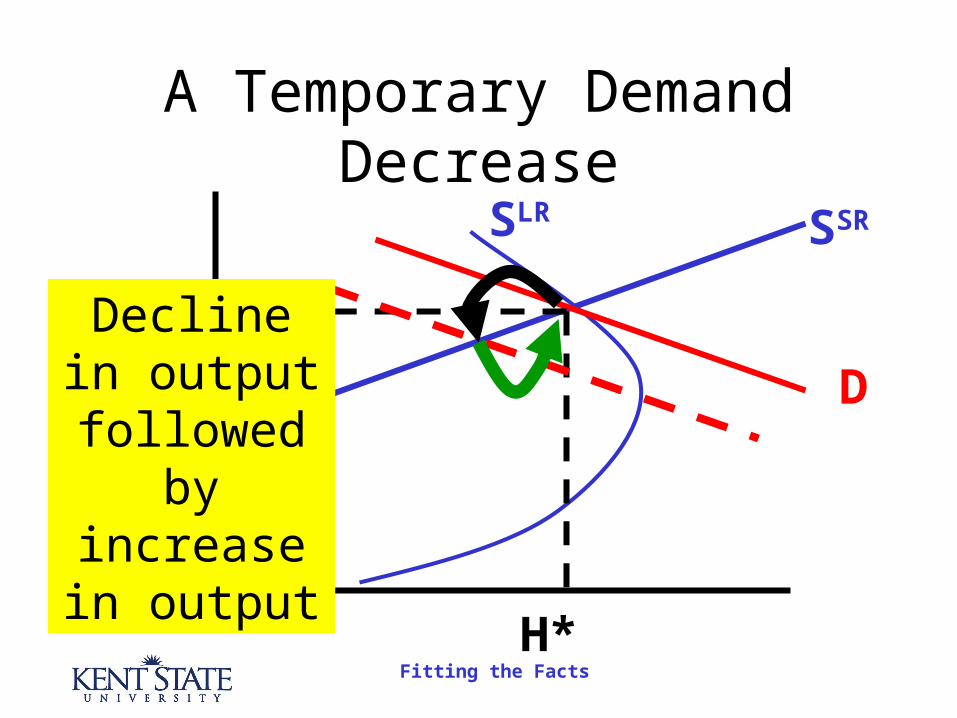
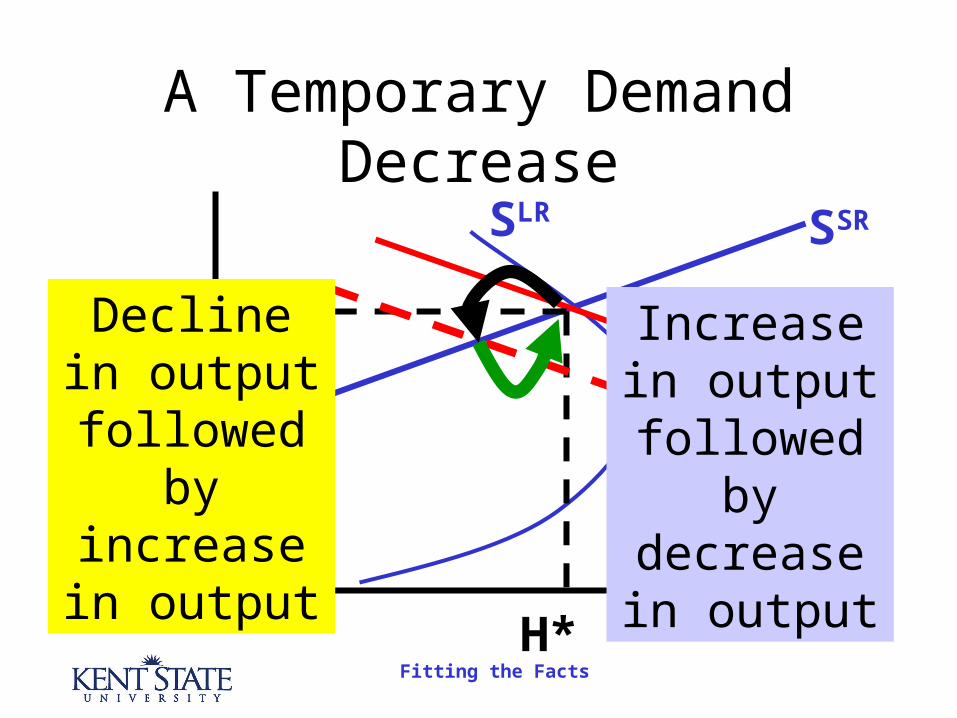
A Temporary Demand Decrease
D
SSRSLR
H*
w*Decline in output
followed by increase in
output
Increase in output
followed by decrease in
output

Fitting the Facts
Imperfect Information
D
SSRSLR
H*
w*

Fitting the Facts
Imperfect Information
D
SSRSLR
H*
w*Increase in
output followed by decrease in
output
Fitting the Facts
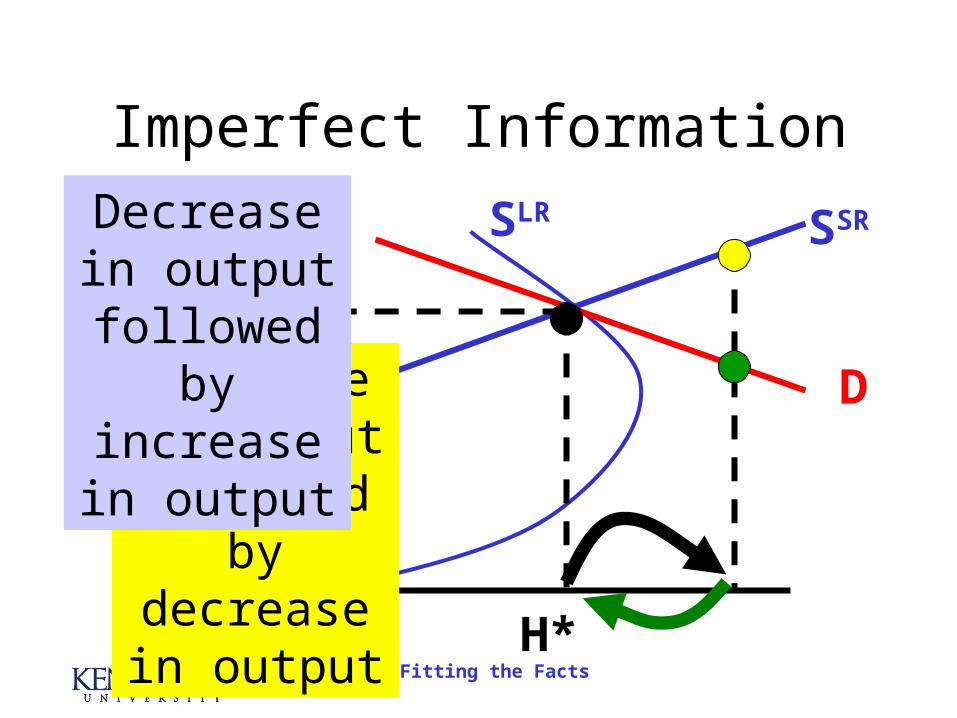
Imperfect Information
D
SSRSLR
H*
w*Increase in
output followed by decrease in
output
Decrease in output
followed by increase in
output

Fitting the Facts
Technology Decline
D
SSRSLR
H*
w*
Fitting the Facts
Technology Decline
D
SSRSLR
H*
w*
No secondary effects

Fitting the Facts
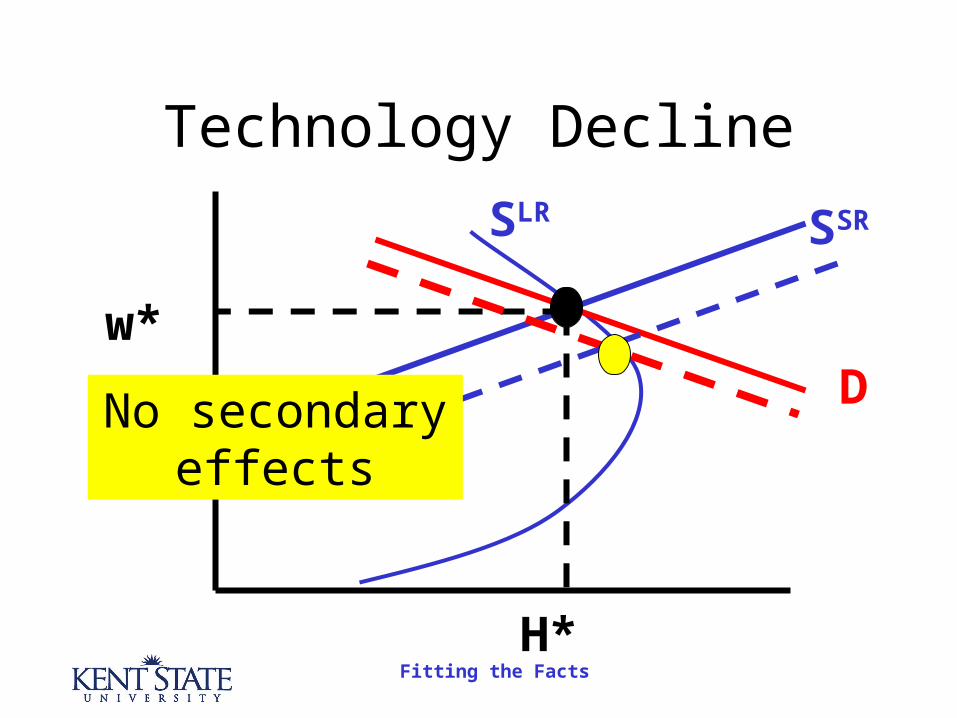
Technology Decline
D
SSRSLR
H*
w*
No secondary effects
A smaller than average growth
or negative growth is likely to be followed
by normal growth

Fitting the Facts
Technology Shift
11)()(
tt
tt
A
AA
A

Fitting the Facts
Technology Shift
0),(, 11])()[(
tttt corrA
A
A
Acorr

Fitting the Facts
Technology Shift
0])()[( 1,
tt Y
Y
Y
Ycorr

Fitting the Facts
Imperfect Information Model
0])()[( 1,
tt Y
Y
Y
Ycorr

Fitting the Facts
Temporary Demand Shift Model
0])()[( 1,
tt Y
Y
Y
Ycorr

Fitting the Facts
Which Fits the Facts
tY
Y
1
tY
Y

Fitting the Facts
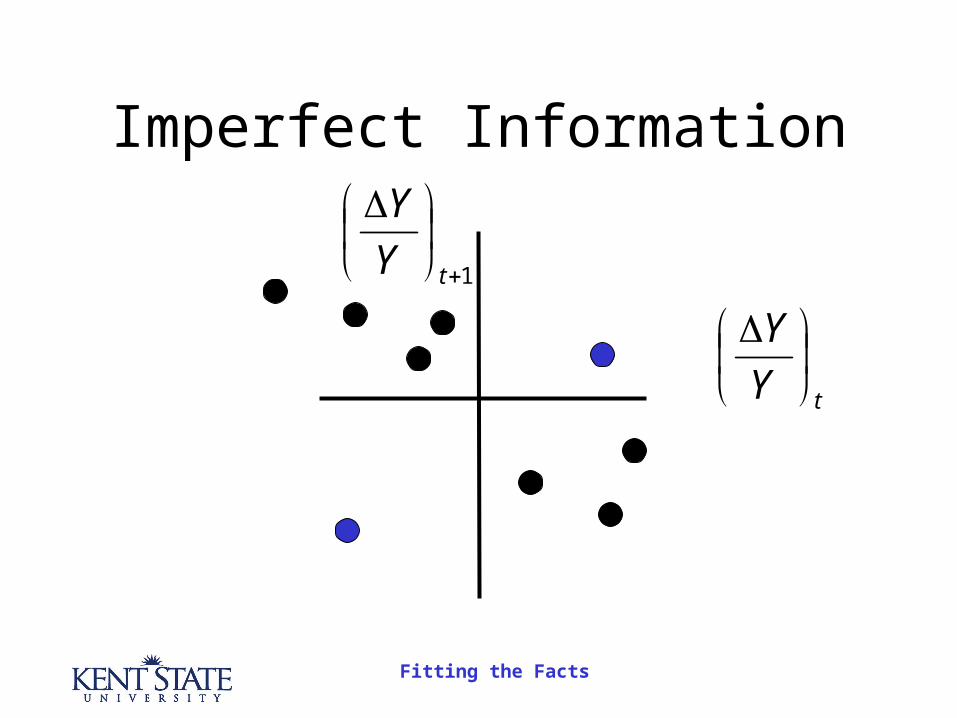
Imperfect Information
tY
Y
1
tY
Y
Fitting the Facts
Imperfect Information
tY
Y
1
tY
Y

Fitting the Facts
Real Business Cycles
tY
Y
1
tY
Y
tA
A

Fitting the Facts
Real Business Cycles
tY
Y
1
tY
Y

Fitting the Facts
Real Business Cycles
tY
Y
1
tY
Y

Fitting the Facts
So what are the facts
-4
-2
0
2
4
-4 -2 0 2 4
Fitting the Facts
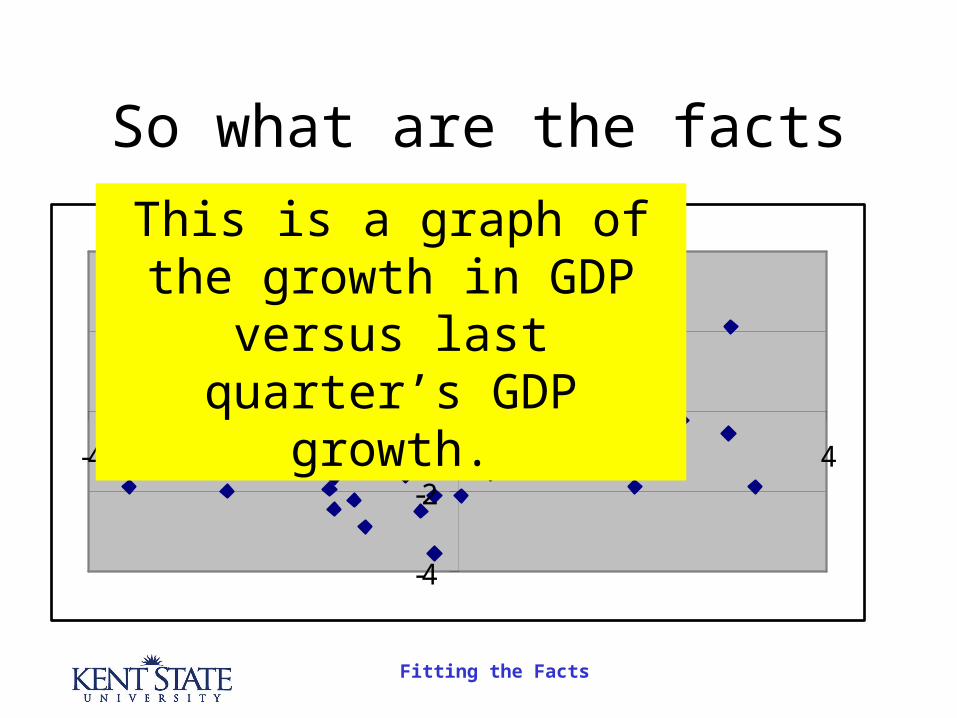
So what are the facts
-4
-2
0
2
4
-4 -2 0 2 4
This is a graph of the growth in GDP versus last
quarter’s GDP growth.

Fitting the Facts
So what are the facts
-4
-2
0
2
4
-4 -2 0 2 4
r=0.34

Fitting the Facts
So what are the facts
-4
-2
0
2
4
-4 -2 0 2 4
r=0.34
Other estimates are that 60% of the
fluctuations in GDP are due to
fluctuations in A

Fitting the Facts
So what are the facts
-4
-2
0
2
4
-4 -2 0 2 4
r=0.34
r=0.19

Fitting the Facts
So what are the facts
-4
-2
0
2
4
-4 -2 0 2 4
r=0.34
r=0.19
r=-0.01
Fitting the Facts
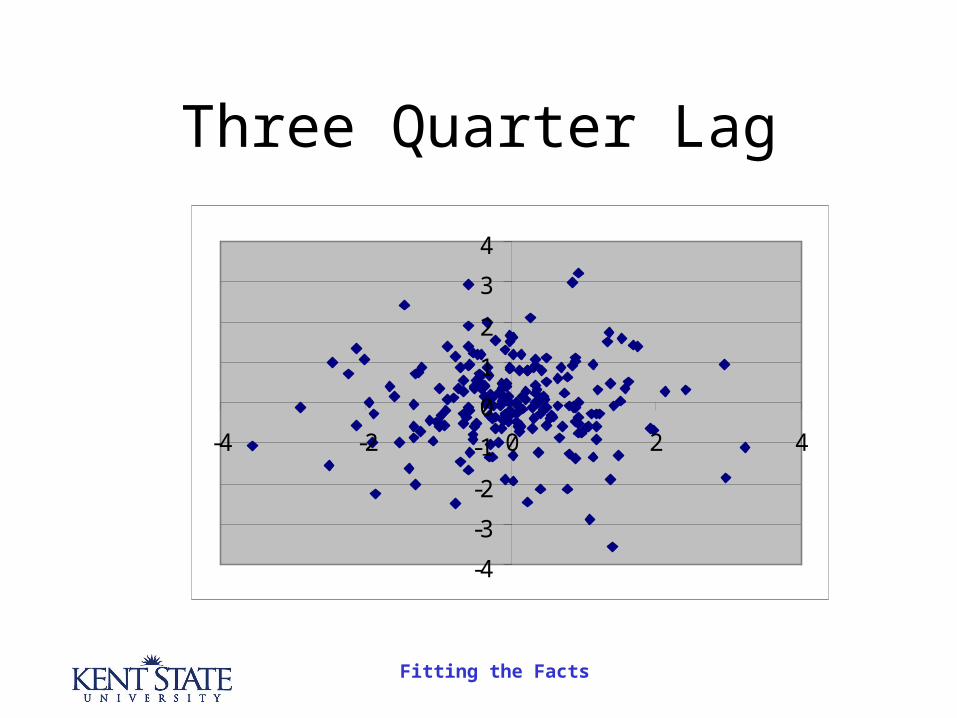
Three Quarter Lag
-4
-3
-2
-1
0
1
2
3
4
-4 -2 0 2 4

Fitting the Facts
End
©2004 Charles W. Upton. All rights reserved


