19
LED LIGHTING WORKSHOP Bangalore May 16, 2013

LED LIGHTING WORKSHOP
BangaloreMay 16, 2013

2

Industry growth
Growth per annum
US $ 2 Billion
0
2000
4000
6000
8000
10000
12000
2005 2006 2007 2008 2009 2010 2011 2012 2013
45005060
57116567
71677994
9290
10623
12.513
159
1217
14
Lighting Industry in India
YEAR Annual Turnover % Growth
Estimated

4
1 2 3 4 5 6 7 80
500
1000
1500
2000
2500
3000
3500
4000
4500
5000
300 500850
12501666
3065
4110
5000
Value Rs. Crores
Year
2009 2010 2011 2012 2013 2014 2015 2016
USD 225
Million
USD 1 Billion
ESTIMATES
LED business development in India

Electricity Generation – Shortage Vs Growth
5
2004-05 2005-06 2006-07 2007-08 2008-09 2009-10 2010-2011
2011-2012
0
2
4
6
8
10
12
14
16
18
11.712.3
13.8
16.6
12.3
9.9
8 8.2
5.2 5.1
7.36.3
8.4
10.02
5.6
8.1 ShortageGrowth
Data in percentage

LED Lighting
• Stimulating LED Lighting in India

Down Lighters
– Showrooms were using Incandescent Lamps– With government regulation, changed to CFL
down lights – CFL not effective on product display– Showrooms changed to halogen down lights– Proposal to initiate central and state governments
for regulation to commercial outlets to change to LED down lights
– Down Light specifications prepared by ELCOMA

Road Street Lights
– Presently haphazard installation of streetlights by small and medium municipalities
– Industry gearing up for designing LED street lights– Government (Bureau of Energy Efficiency)
initiative to provide LED streetlights to > 100 municipalities as per program
– ELCOMA prepared streetlight specifications for government procurement and end users
– Street lighting guideline prepared by BEE

Self Ballasted LED Lamp
• As an introduction for domestic application, attention provided for self Ballasted LED Lamp
• Specifications prepared by ELCOMA and government using it for DSM and CDM schemes
• BIS prepared standards for Self ballasted lamp• Product prototypes under tests• Price reduced from Rs. 1200 last year to Rs. 650.
Likely to further reduce to Rs. 300 to Rs. 400 by the end of this year

10
Graphical representation of 103 ULB’s
Survey done by BEE

11
Urban Local BodiesIndian Scenario
Urban Local Bodies
ULBsMunicipal
Corporations
Municipalities
Townships
Town Panchayats
Others
TOTAL
Year 1991
55
1808
620
453
319
3255
Year 2001
70
2250
810
422
948
4500
ULB Spent on Street Lighting
Cities• 5 – 7% of revenue
expenditure
Towns• 16% of revenue expenditure
Town Panchayats• 20% of revenue expenditure
Besides ULBs, there is significant potential in street lighting for Railways, Airports, Highways and public parks etc
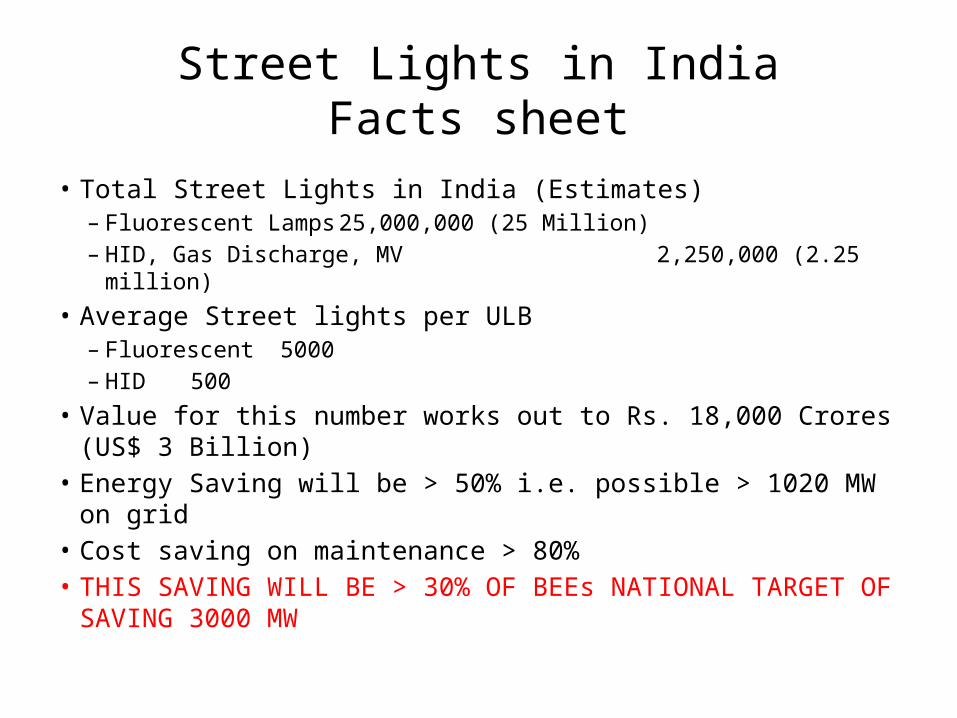
Street Lights in IndiaFacts sheet
• Total Street Lights in India (Estimates)– Fluorescent Lamps 25,000,000 (25 Million)– HID, Gas Discharge, MV 2,250,000 (2.25 million)
• Average Street lights per ULB– Fluorescent 5000– HID 500
• Value for this number works out to Rs. 18,000 Crores (US$ 3 Billion)
• Energy Saving will be > 50% i.e. possible > 1020 MW on grid• Cost saving on maintenance > 80%• THIS SAVING WILL BE > 30% OF BEEs NATIONAL TARGET OF
SAVING 3000 MW

13
Cost saving• Assuming an energy saving potential of 25%
– Potential for Municipal Energy Savings is 4000 MUs
– With this savings – can avoid capacity addition to the tune of 600MW
– Considering present Cost of Electricity at Rs. 6 per Unit, this amounts to annual savings of Rs. 2400 Crores

LED Standards & SpecificationsINDIAN STANDARDS ON LED PUBSLISHED
Following Indian Standards on LED have been published . Sl No IS No Title1. 16101 : 2012 General Lighting - LEDs and LED modules – Terms and
Definitions2. 16102(Part 1) : 2012 Self- Ballasted LED-Lamps for General Lighting Services Part 1 Safety Requirements3 16102(Part 2) : 2012 Self-Ballasted LED-Lamps for General Lighting Services Part 2 Performance
Requirements4 16103(Part 1) : 2012 Led Modules for General Lighting- Safety Requirements
5 15885(Part 2/Sec 13) : 2012 Lamp Control Gear Part 2 Particular Requirements Section 13 D.C. or A.C. Supplied Electronic Control gear for Led Modules
6 16104 : 2012 D.C. or A.C. Supplied Electronic Control Gear for LED Modules - Performance Requirements
7 16105 : 2012 Method of Measurement of Lumen Maintenance of Solid -State Light (LED) Sources
8 16106 : 2012 Method of Electrical and Photometric Measurements of Solid-State Lighting (Led) Products
9 16108 : 2012 Photo biological Safety of Lamps and Lamp Systems A few more standards on Led Modules (IS 16103-2) and Luminaires (IS 16107) are going to be published soon .

15
Ideal Lamp Lumen out put
HPSVL 80-90
HPMVL 40-50
MAL 80-90
Halogen lamp 15-20
Fluorescent Tubular Lamps T12 50-60
Fluorescent Tubular Lamps T8 55-65
Fluorescent Tubular Lamps T 5 90-100
LED Lamp 100-114
15
Guidelines

16
Recommended Light Levels for Street Lighting as per IS 1944 (Part I & II) -1970
Classification of Lighting Installation
Type of Road Avg Level of Illumi on Road Surface
Ratio Min/Avg
Generally used convention lamps
Suggested LED lamps
Group A1 Important traffic routes carrying fast traffic
30 LUX 0.4 250 W 80wGroup A2 Other main roads carrying
mixed traffic, like main city streets, arterial roads, throughways, etc
15 LUX 0.4 150W 40w
Group B1 Secondary roads with considerable traffic like principal local traffic routes,
shopping streets, etc
8LUX 0.3 70 W 25w
Group B2 Secondary roads with light
traffic 4LUX 0.3 48 W 12w
16
Guidelines

17

18
AWARENESS PROGRAM– Workshops / Seminars– LED Conclaves (Exhibition and Workshops)
• Delhi done in May 2010• Hyderabad in April 2011• Mumbai on January 5-7, 2012• Exhibition in Delhi in October 2012
– Workshops in 2013• Bangalore – 16th May 2013• Ahmedabad – 12th July 2013• Mumbai – 12th September 2013• Delhi – 14th October 2013
– In 2014 workshops to be organized in Kolkata, Chandigarh, Jaipur and Chennai– International Lighting exhibition in New Delhi in September 2014– Publication of LED Street lighting guide for Municipalities and Public Works
Departments– Articles and advertisements in special magazines– Media publicity

Thank You


