27
Next Generation Lighting Industry Alliance LED Systems Reliability Consortium LED Luminaire Reliability: Impact of Color Shift APRIL 2017
Next Generation Lighting Industry Alliance LED Systems Reliability Consortium
LED Luminaire Reliability: Impact of Color Shift APRIL 2017

2
Acknowledgements The Next Generation Lighting Industry Alliance wishes to acknowledge the valuable contributions of the
U.S. Department of Energy and its support for Dr. Lynn Davis of RTI International, whose reliability
testing work contributed significantly to the knowledge base for this document. We are grateful to the
members of the LED Systems Reliability Consortium (LSRC), who offered their considerable time and
expertise over the past three years to the development of this document.
Terry Clark, Finelite
Lynn Davis, RTI International
Mark Duffy, GE*
Jim Gaines, Philips*
Monica Hansen, LED Lighting Advisors**
Eric Haugaard, Cree*
Steve Paolini, Telelumen
Morgan Pattison, SSLS, Inc.**
Clark Robinson, National Energy Technology Laboratory**
Sanwal Sarraf, Lumentek Global
Wouter Soer, Philips*
Willem van Driel, Philips*
Please send any comments regarding this document to Sarah Cornelius, [email protected].
* NGLIA member
** On behalf of the U.S. Department of Energy
3
Table of Contents Introduction .................................................................................................................................................. 4
LED Lifetime and Lumen Maintenance ......................................................................................................... 4
Chromaticity Stability .................................................................................................................................... 6
Traditional Lighting Technologies ............................................................................................................. 7
LED Lighting ............................................................................................................................................... 8
Chromaticity Consistency ......................................................................................................................... 9
LED Packages ........................................................................................................................................... 10
Chromaticity Shift Mechanisms .............................................................................................................. 14
High-Power LEDs ................................................................................................................................. 16
Mid-Power LEDs .................................................................................................................................. 17
COB LEDs ............................................................................................................................................. 18
Phosphor Degradation ........................................................................................................................ 19
Remote Phosphor LED Modules ......................................................................................................... 21
Optical System Impacts ........................................................................................................................... 22
Optics and Diffusers ............................................................................................................................ 22
White Reflective Materials.................................................................................................................. 24
Summary ..................................................................................................................................................... 25
Path Forward ............................................................................................................................................... 26
List of Acronyms .......................................................................................................................................... 27

4
Introduction The emergence of solid state lighting (SSL) with its high efficiencies and long lifetimes has led to the
potential for significant energy and cost savings to our nation once wide-scale adoption occurs. Light
emitting diodes (LEDs) are the heart of SSL lighting products and can provide long lifetimes that last well
beyond 50,000 hours of operation, much longer than most conventional light sources. The end of life for
all lighting technologies is signaled by the loss of light, but this may be less evident for LED luminaires,
where the light output may continuously fade or the color may slowly shift to the point where low light
output or an unacceptably large color change constitutes practical failure.
As integrated lamps and luminaires appeared on the market, it was at first assumed that one could
estimate the lumen depreciation of the LED packages to describe the degradation characteristics of the
integrated lighting product. While the lifetime of an LED source is one important indicator of LED
luminaire life, it would be misleading to rate the entire LED luminaire based solely on the LED source.
Now, after further research, it is understood that electronics failures in the driver or degradation of
optical components can often occur long before LED lumen depreciation causes failures. Lifetime claims
should take into account the whole luminaire system, not just the LEDs. A system reliability model that
integrates the failure mechanisms in the various luminaire subsystems would create a much more
accurate lifetime claim from LED luminaire manufacturers.
To address the challenge of developing accurate lifetime claims, the SSL Program of the U. S.
Department of Energy (DOE) together with the Next Generation Lighting Industry Alliance (NGLIA)
formed the creation of an industry consortium, the LED Systems Reliability Consortium (LSRC), to
coordinate activities and foster improved understanding. The LSRC has published three editions of the
document LED Luminaire Lifetime: Recommendations for Testing and Reporting,1 in which they reviewed
studies intended to identify potential failure modes and provide additional understanding of product
life. The resulting conclusions were that numerous other subsystems and components in a luminaire
introduce other potential failure modes which will affect, and may actually dominate, the determination
of system lifetime. Work by the LSRC and other funded R&D by the DOE SSL program is focused on
understanding the various degradation mechanisms to enable the development of new models so that
system reliability can be confidently understood, modeled, predicted, and communicated.
LED Lifetime and Lumen Maintenance LED packages rarely fail abruptly (i.e., instantaneously stop emitting light), but rather experience
parametric failures such as degradation or shifts in luminous flux, color point (chromaticity coordinates),
color rendering index (CRI), or efficacy. Of these parametric shifts, lumen depreciation has received the
most attention because it was previously thought that the degradation of lumen output of the LED
source itself would be the prime determinant of lifetime for the completed product. While it is now
understood that this is not the case, lumen maintenance is still used as a proxy for LED lamp or
1 LED Systems Reliability Consortium, LED Luminaire Lifetime: Recommendations for Testing and Reporting, Third Edition,
September 2014. Available: http://energy.gov/sites/prod/files/2015/01/f19/led_luminaire_lifetime_guide_sept2014.pdf.

5
luminaire lifetime ratings, largely due to the availability of standardized methods for measuring and
projecting LED package lumen depreciation.
The useful life of an LED package is often cited as the point in time where the luminous flux output has
declined to 70% of its starting value or L70. For products with lifetimes of many years or even decades,
failures may be very slow to appear under normal operation. In 2008, the Illuminating Engineering
Society (IES) published IES LM-80, which is an approved method for measuring the lumen maintenance
of solid-state (LED) light sources, arrays, and modules.2 The LM-80 test method has been recently
updated to reflect the experience and knowledge gained by the LED industry. The LM-80-08 procedure
required measurements of lumen output and chromaticity for a representative sample of products to be
taken at least every 1,000 hours, for a minimum of 6,000 hours. Luminous flux and chromaticity shifts
are to be measured for three different LED case temperatures: 55oC, 85oC and a third temperature to be
selected by the manufacturer. A newer version, LM-80-15, has undergone changes to the testing
method, which now requires only two different case temperature, one of which should be 55°C or 85°C
(commonly used case temperatures for industry testing to support direct product comparisons of testing
results).
Many researchers have put a great deal of effort into devising a way to project the time at which L70 will
be reached for an LED package in a luminaire, and IES has documented a forecasting procedure, IES TM-
21,3 which uses the LM-80 test data for the lumen maintenance projections (a minimum of 6,000 hours
of test data is required). The LM-80 data (luminous flux vs. test hours) for the LEDs tested is averaged
and an exponential curve fit is applied to the data; the results of the curve fit are used to calculate a
lumen maintenance lifetime projection. This technical memorandum stipulates that any projection may
not exceed a set multiple (depending on sample size statistics) of the actual hours of LM-80 testing data
taken, which helps avoid exaggerated claims.
With the development of IES TM-21 for projecting lumen maintenance, experts agreed the projecting
method should use the trend (over a sufficient period of time) of single case temperature testing data.
There is a separate projection method in TM-21 based on using two tested case temperatures and
interpolating data between the tested case temperatures. Thus, the requirement of testing three case
temperatures is not completely necessary and leads to an unnecessary testing burden on LED
manufacturers. (LM-80-15 reduced the number of test temperatures.)
It should be noted that LM-80 measurements are taken with the LED packages operating continuously in
a temperature-controlled environment, where the solder point and ambient air temperature are at
equilibrium. This does not necessarily reflect real-world operating conditions, so there may not be a
perfect match between predictions based on laboratory test results and practical experiences with
lamps and luminaires in the field. Nevertheless, lumen maintenance projections can help sophisticated
users compare products, as long as their limitations are properly understood.
2 Illuminating Engineering Society, LM-80-08: Measuring Lumen Maintenance of LED Light Sources, 2008.
3 Illuminating Engineering Society, TM-21-11: Projecting Long Term Maintenance of LED Light Sources, 2011.
6
When LEDs are installed in a luminaire or system, there are many additional factors that can affect the
rate of lumen depreciation or the likelihood of catastrophic failure. These include temperature
extremes, humidity, chemical incursion, voltage or current fluctuations, failure of the driver or other
electrical components, damage or degradation of the encapsulant material covering the LEDs, damage
to the interconnections between the LEDs and the fixture, degradation of the phosphors, and yellowing
of the optics. In addition, abrupt semi-random short-term failures may be observed due to assembly,
material, or design defects. More information on system level lifetime can be found in LSRC’s LED
Luminaire Lifetime: Recommendations for Testing and Reporting.1
Chromaticity Stability While lumen maintenance has dominated discussions about LED lifetime, the color stability (also known
as chromaticity stability) is another important performance attribute that can be a barrier to purchase
or lead to unmet expectations of LED lighting. Shifts in color and appearance are a regular part of our
lives, whether it is fading paint, fabric colors, or lighting. Color shift in lighting has always occurred in
traditional lighting technology, but has gained more prominence with LED lighting due to its long
operating life of 10 years or more in many applications. Traditional lighting technology, such as halogen,
fluorescent, or metal halide technology, experiences color shifts. Frequent relamping every few years is
required due to catastrophic failures or lumen depreciation and this mitigates the impact of the color
shift of these lighting technologies.
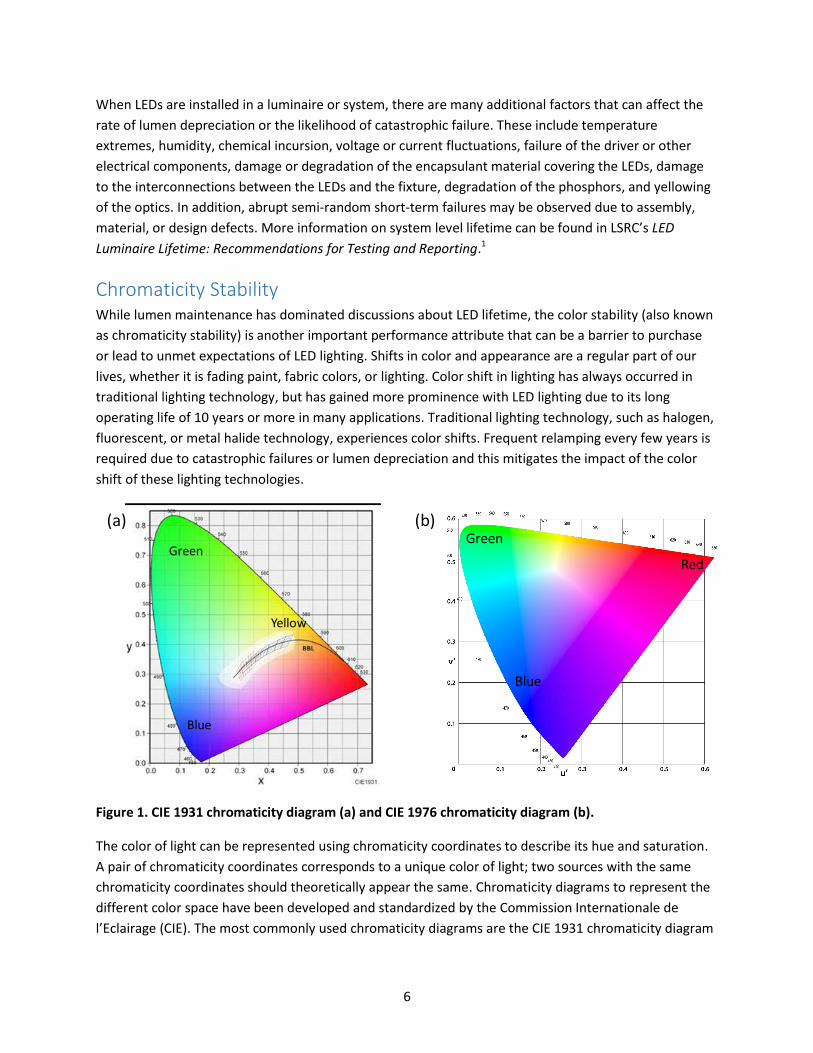
Figure 1. CIE 1931 chromaticity diagram (a) and CIE 1976 chromaticity diagram (b).
The color of light can be represented using chromaticity coordinates to describe its hue and saturation.
A pair of chromaticity coordinates corresponds to a unique color of light; two sources with the same
chromaticity coordinates should theoretically appear the same. Chromaticity diagrams to represent the
different color space have been developed and standardized by the Commission Internationale de
l’Eclairage (CIE). The most commonly used chromaticity diagrams are the CIE 1931 chromaticity diagram
Yellow
Blue
GreenGreen
Blue
Red
(a) (b)

7
using (x, y) coordinates to specify chromaticity and the CIE 1976 chromaticity diagram using (u', v')
coordinates. Examples of the chromaticity diagrams are shown in Figure 1. The 1976 CIE diagram has
been used more extensively by the LED industry in recent years to describe chromaticity changes with its
advantage of describing a linear color space, which allows for a more intuitive determination of
chromaticity differences or shifts (Δu'v'). Note: Δu'v' describes the magnitude of a chromaticity change,
but not the direction of shift; this is the value provided in the LM-80-08 reports. The newer LM-80-15
reports do require reporting of the individual chromaticity coordinates (u’ and v’) instead of the total
shift (Δu'v'). LED package manufacturers have been shifting to this new LM-80-15 reporting requirement
with newer LED product lines.
The importance of chromaticity stability varies by application. For example, a high degree of
chromaticity stability is crucial for light sources in a museum or retail store, but less important for street
lighting. Chromaticity stability of the lamp and luminaires is important where multiple lamps or
luminaires are being used to wash a wall, or where objects are being evaluated based on color, such as
in a hospital or factory. The chromaticity maintenance of LED lamps and luminaires varies among
different products, and potentially for the same product used in different applications. Like many other
metrics, there are no official standards limiting the amount of acceptable chromaticity shift.
Traditional Lighting Technologies
Many types of light sources have some chromaticity instability over time. The most pronounced is metal
halide, but fluorescent and halogen lamps can also shift. The problem with this chromaticity instability is
illustrated in Figure 2, where the lamps are creating a different visual appearance for the wall wash.
A DOE study on the chromaticity maintenance of LED PAR38 lamps was performed to understand the
current performance of LED products on the market. As part of this broader study on the chromaticity
Figure 2. A room lit with ceramic metal halide lamps shows the impact of poor chromaticity stability on the appearance of the wall wash. The varying color appearance of neighboring lamps would necessitate relamping.
8
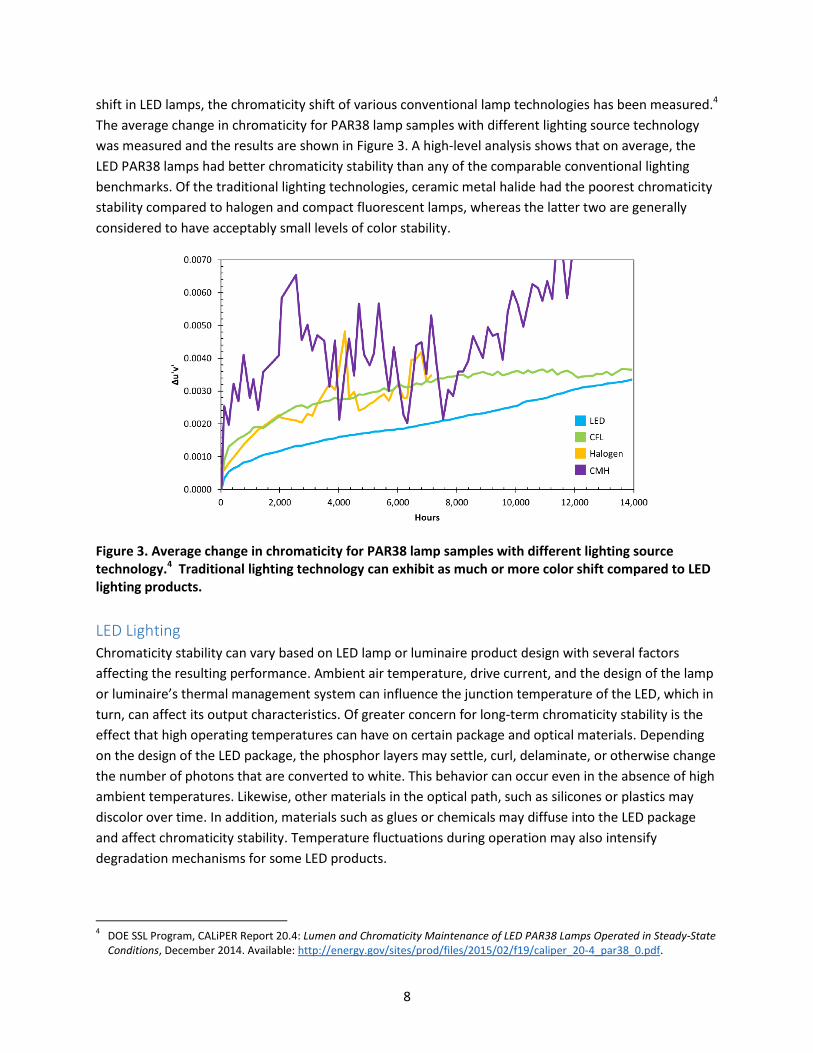
shift in LED lamps, the chromaticity shift of various conventional lamp technologies has been measured.4
The average change in chromaticity for PAR38 lamp samples with different lighting source technology
was measured and the results are shown in Figure 3. A high-level analysis shows that on average, the
LED PAR38 lamps had better chromaticity stability than any of the comparable conventional lighting
benchmarks. Of the traditional lighting technologies, ceramic metal halide had the poorest chromaticity
stability compared to halogen and compact fluorescent lamps, whereas the latter two are generally
considered to have acceptably small levels of color stability.
Figure 3. Average change in chromaticity for PAR38 lamp samples with different lighting source technology.4 Traditional lighting technology can exhibit as much or more color shift compared to LED lighting products.
LED Lighting
Chromaticity stability can vary based on LED lamp or luminaire product design with several factors
affecting the resulting performance. Ambient air temperature, drive current, and the design of the lamp
or luminaire’s thermal management system can influence the junction temperature of the LED, which in
turn, can affect its output characteristics. Of greater concern for long-term chromaticity stability is the
effect that high operating temperatures can have on certain package and optical materials. Depending
on the design of the LED package, the phosphor layers may settle, curl, delaminate, or otherwise change
the number of photons that are converted to white. This behavior can occur even in the absence of high
ambient temperatures. Likewise, other materials in the optical path, such as silicones or plastics may
discolor over time. In addition, materials such as glues or chemicals may diffuse into the LED package
and affect chromaticity stability. Temperature fluctuations during operation may also intensify
degradation mechanisms for some LED products.
4 DOE SSL Program, CALiPER Report 20.4: Lumen and Chromaticity Maintenance of LED PAR38 Lamps Operated in Steady-State
Conditions, December 2014. Available: http://energy.gov/sites/prod/files/2015/02/f19/caliper_20-4_par38_0.pdf.

9
There are no official standards limiting the amount of acceptable chromaticity shift in LED lighting
products, but different certifications have established requirements. For example, to qualify for the
ENERGY STAR® label, nine out of 10 samples of an LED lamp must have a measured chromaticity shift
(Δu'v') of less than 0.007 over the first 6,000 hours of operation. For applications that require high
chromaticity stability, a specification may be established on a project-by-project basis.
Beyond the lack of agreement on acceptable levels of chromaticity shift, there is currently no standard
methodology for projecting future chromaticity maintenance using standard test procedures like there
is for projecting LED package lumen maintenance. Furthermore, there are no established methods for
accelerated testing, leaving each manufacturer to develop their own testing methodologies and
predictive modeling approaches. A consensus methodology for predicting chromaticity shift will be a
challenge as different materials of construction and manufacturing processes can affect the results;
however, an IES committee is working to come to accord on this pressing issue (TM-31).
Chromaticity Consistency Chromaticity stability should not be confused with chromaticity consistency — also referred to as color
consistency. Chromaticity stability refers to the ability of a product to maintain a constant chromaticity
point over its lifetime, whereas chromaticity consistency refers to the product-to-product variation
within a lamp or luminaire type. This lamp-to-lamp consistency is important to provide uniform lighting
within a room and building. In LED lighting, the chromaticity consistency from lamp to lamp depends on
the consistency of the phosphor-converted LEDs. To counter variability that is inherent in the
manufacturing process, white LEDs are binned based on chromaticity, lumen output, and forward
voltage. This allows the manufacturers of LED lamps and luminaires to provide a more consistent
product.
Figure 4. A room lit with LED lamps with poor chromaticity consistency shows the differing white color appearance when these lamps are placed next to each other. This type of chromaticity variation from product-to-product will lead to customer disappointment in this application.5
5 Lumileds, Freedom from Binning and Hot Testing. Available: http://www.lumileds.com/technology/luxeon-
technology/freedom-from-binning.
10
Figure 4 illustrates the problem of poor chromaticity consistency from lamp to lamp upon installation.
Although this case represents a chromaticity consistency challenge, similar effects can be seen with
varying chromaticity maintenance over time. Both factors, chromaticity consistency (at time = 0) and
chromaticity stability (after thousands of hours in operation), are crucial for the customer.
LED Packages
The LED package construction often drives the performance and long term behavior of the LED light
source. The impact of LED package design and materials of construction on performance, color quality,
lumen maintenance and chromaticity shift, have been investigated for a variety of LED packages under
the DOE SSL Core Technology Research Project awarded to RTI International.6 One of the goals of this
project is to determine failure modes for LED packages and develop software approaches to model
failure rates in an effort to correlate package behavior to system reliability results.
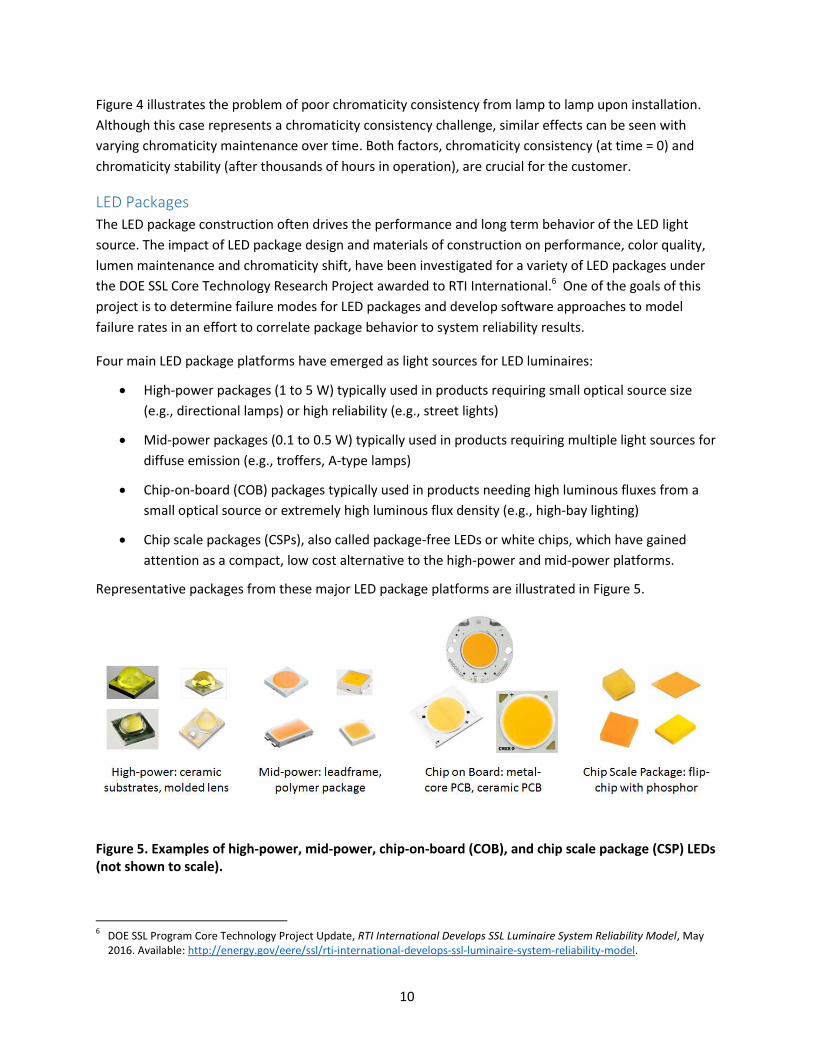
Four main LED package platforms have emerged as light sources for LED luminaires:
High-power packages (1 to 5 W) typically used in products requiring small optical source size
(e.g., directional lamps) or high reliability (e.g., street lights)
Mid-power packages (0.1 to 0.5 W) typically used in products requiring multiple light sources for
diffuse emission (e.g., troffers, A-type lamps)
Chip-on-board (COB) packages typically used in products needing high luminous fluxes from a
small optical source or extremely high luminous flux density (e.g., high-bay lighting)
Chip scale packages (CSPs), also called package-free LEDs or white chips, which have gained
attention as a compact, low cost alternative to the high-power and mid-power platforms.
Representative packages from these major LED package platforms are illustrated in Figure 5.
Figure 5. Examples of high-power, mid-power, chip-on-board (COB), and chip scale package (CSP) LEDs (not shown to scale).
6 DOE SSL Program Core Technology Project Update, RTI International Develops SSL Luminaire System Reliability Model, May
2016. Available: http://energy.gov/eere/ssl/rti-international-develops-ssl-luminaire-system-reliability-model.

11
To begin the modeling work of the lumen maintenance and chromaticity shift of LEDs, a methodology
was developed to analyze LM-80 data across multiple LED manufacturers to provide new insights into
LED-level factors impacting lifetime. Data from more than 200 different LED data sets was analyzed
using this methodology combined with TM-21 projections and supplemented with experimental data.
This process calculates a decay rate constant () that provides a measure of the rate of luminous flux
change. Higher values indicate faster lumen depreciation whereas small values indicate longer
lumen maintenance times. The analysis provided a detailed look at lumen maintenance and chromaticity
shift behavior for a range of LED packages with different designs and materials of construction from
multiple manufacturers and found that the materials of construction have a direct impact on long-term
performance of LEDs.
Figure 6. Summary of the LM-80 report records by year and LED platform type.7
The different LED package platforms have different intrinsic characteristics based on materials of
construction and manufacturing processes, which impact their lumen depreciation and chromaticity
point stability. Figure 7 shows the decay rate constants as a function of LED junction temperature for
different package platforms. Mid-power LEDs can often exhibit more rapid lumen degradation than
high-power LEDs or chip on board LEDs; this faster decay of luminous flux is largely due to degradation
of the plastic resin body used in the mid-power LED compared to the more stable ceramic substrate
used in the high-power LED. The plastic material most commonly employed in mid-power LED packages
is polyphthalamide (PPA), a thermoplastic resin. At high temperatures and long operating times, the
materials in the package can discolor, crack, or delaminate, leading to lumen depreciation and
chromaticity shift.
Different types of plastic resin, however, have different lumen degradation behavior. Improved plastic
resins such as epoxy molding compound (EMC) can reduce the thermal constraints associated with
conventional mid-power commodity packages. Mid-power LEDs based on EMC resin are more resistant
to degradation than PPA and compatible with higher operating temperatures. Figure 8 compares the
7 M. Hansen, "Package Impact on Color Shift in LEDs," Strategies in Light, Santa Clara, CA, March 2016.
0
5
10
15
20
25
30
35
40
2011 2012 2013 2014 2015
Nu
mb
er
of
Re
cord
s
Publication Date for LM-80 Test Report
COB-LED
MP-LED
HP-LED

12
Figure 7. Decay rate constants for high-power, mid-power, and COB LEDs as a function of junction temperature. These were calculated using LM-80 and TM-21 projections combined with the new analysis methodology described.7
Figure 8. Lumen degradation performance of mid-power packages (PPA and EMC plastic resins) operating at 150 mA and a high-power package (ceramic substrates) operating at 1 A drive current.8
lumen degradation performance of mid-power packages using PPA and EMC plastic resins to high power
packages using ceramic substrates. While the quality of mid-power packages can vary between LED
manufacturers, one commonly seen trend is that EMC-based LED packages can achieve high lumen
maintenance at higher temperatures and drive currents than PPA-based LED packages. In addition, it is
commonly observed that the ceramic substrates in high power LEDs provide improved heat dissipation
and thus result in higher lumen maintenance behavior, especially at high currents and temperatures.
Though the various package materials of construction have different lumen maintenance performance,
8 M. Hansen, "The True Value of LED Packages," Strategies in Light, Las Vegas, NV, February 2015.
-5.0E-06
1.0E-20
5.0E-06
1.0E-05
1.5E-05
2.0E-05
0 50 100 150 200De
cay
Rat
e C
on
stan
t, A
lph
a
Junction Temperature (C)
All LEDs SIL 2016
High-Power
Mid-Power
COB Arrays

13
both PPA and EMC mid-power packages can achieve excellent lumen maintenance performance (e.g.,
better than 50,000 hours in some cases), as long as their drive currents are kept low enough to stay in a
‘safe operating zone’ (below where that particular resin material discolors and breaks down over time).
While lumen maintenance is important, other forms of parametric failure for LED packages must not be
overlooked. Chromaticity shift, for example, may be more detrimental than lumen depreciation for
some applications; however, this is sometimes difficult to know in advance. To date, the industry
generally quantifies chromaticity shift using Δu'v', which describes the magnitude of chromaticity shift,
but it does not capture the direction of the shift. (The actual chromaticity coordinates u’ and v’ are
required to know the direction of the chromaticity shift.) The point at which a chromaticity shift
becomes noticeable and results in parametric failure will depend on the lighting application. If the
chromaticity change occurs slowly over a very long period (e.g., 25,000 hours), it may not be
objectionable in the case where the light sources shift by the same magnitude and in the same direction
(unlikely in practice).
Factors impacting chromaticity point stability in LEDs include aging-induced changes in the emitter,
phosphor, encapsulant materials, and plastic resin. Emitters can exhibit decreases in radiant flux over
time; phosphors can experience decreases in quantum efficiency or shifts in emission spectrum due to
oxidation; encapsulants can exhibit cracking, oxidation and yellowing, or changes in index of refraction;
and resins can discolor and absorb photons. Higher temperatures will accelerate these degradation
mechanisms leading to greater color shift, though the magnitude of the color shift as a function of
temperature will vary with packaging materials and manufacturing processes. As with lumen
maintenance behavior, if the LEDs are operated at low drive currents and lower than normal operating
temperatures, these materials changes leading to chromaticity shift will be very slow to develop, if they
occur at all.
Figure 9. 1976 CIE chromaticity diagram (u', v') illustration the white chromaticity region (denoted by the black circle) and the common directions of chromaticity shift in LED packages. The right figure is an enlargement of the black circle, showing the white chromaticity bins.
2700K
3000K
3500K
0.49
0.50
0.51
0.52
0.53
0.54
0.2
2
0.2
3
0.2
4
0.2
5
0.2
6
0.2
7
v'
u'
Blue Shift
Green Shift
Yellow Shift
Red Shift
Green
Blue
Red
Yellow

14
The resulting direction of chromaticity shift depends on the dominant degradation mechanisms
occurring in the package, which in turn depends on the package materials and methods of construction.
The chromaticity shifts can be towards the yellow, blue, green, or red colors as illustrated using the CIE
1976 chromaticity diagram in Figure 9. Different package platforms have shown distinct differences in
the chromaticity shift signatures.
Chromaticity Shift Mechanisms
Many different mechanisms can lead to chromaticity shift modes in LED lamps and luminaires. Since the
chromaticity shifts can come from various materials and subsystems — from the LED package and its
materials to the optical lens or diffusers — the result is many different directions of chromaticity shift.
Table 1 summarizes several commonly seen chromaticity shift mechanisms that can occur in LED lighting
systems and the root causes of such a shift.
Table 1. Summary of chromaticity shift mechanisms that can occur in LED lamps and luminaires.9
Shift Direction Cause
Blue shift
Loss of phosphor quantum efficiency due to chemical change or temperature effects
Oxidation of the molding compound in PLCC (plastic leaded chip carrier) or tarnishing of exposed metal surfaces such as lead frames and reflectors
Operating the phosphor above the saturation flux level, settling and precipitation of the phosphor
Top-to-bottom fractures of the binder in the phosphor-binder layer, resulting in blue photons bypassing the phosphor layer
Yellow Shift
Increase in phosphor quantum efficiency due to chemical changes or temperature decreases
Cracking or delamination of phosphor-binder layer, which can lengthen the path of blue photons through the phosphor
Discoloration/oxidation of the lenses
Discoloration of the reflector
Green Shift
Chemical changes in the phosphor such as oxidation that shift emission intensity to lower wavelengths
Reduction in red emissions such as those from a red LED
Red Shift Shift in emission properties of direct red emitter
Reduction in the emissions from green phosphors
Beyond the mere direction of the chromaticity shift, other general behavior characteristics of LED lamps
shift have been observed. A DOE sponsored study was performed to investigate the different
chromaticity shift modes on a series of LED PAR38 lamps. The various characteristic behaviors of these
15
LED lamps have been measured and then subsequently classified into chromaticity shift modes (CSMs),
as summarized in Table 2. Four main CSMs were identified and caused by changes in the LED packaging
materials including the behavior of the LED chip, the phosphor and silicone binder, and the plastic
molding used as in the package body. More details of this study and its analysis can be found in the
CALiPER report titled Chromaticity Shift Modes of LED PAR38 Lamps Operated in Steady-State
Conditions.9
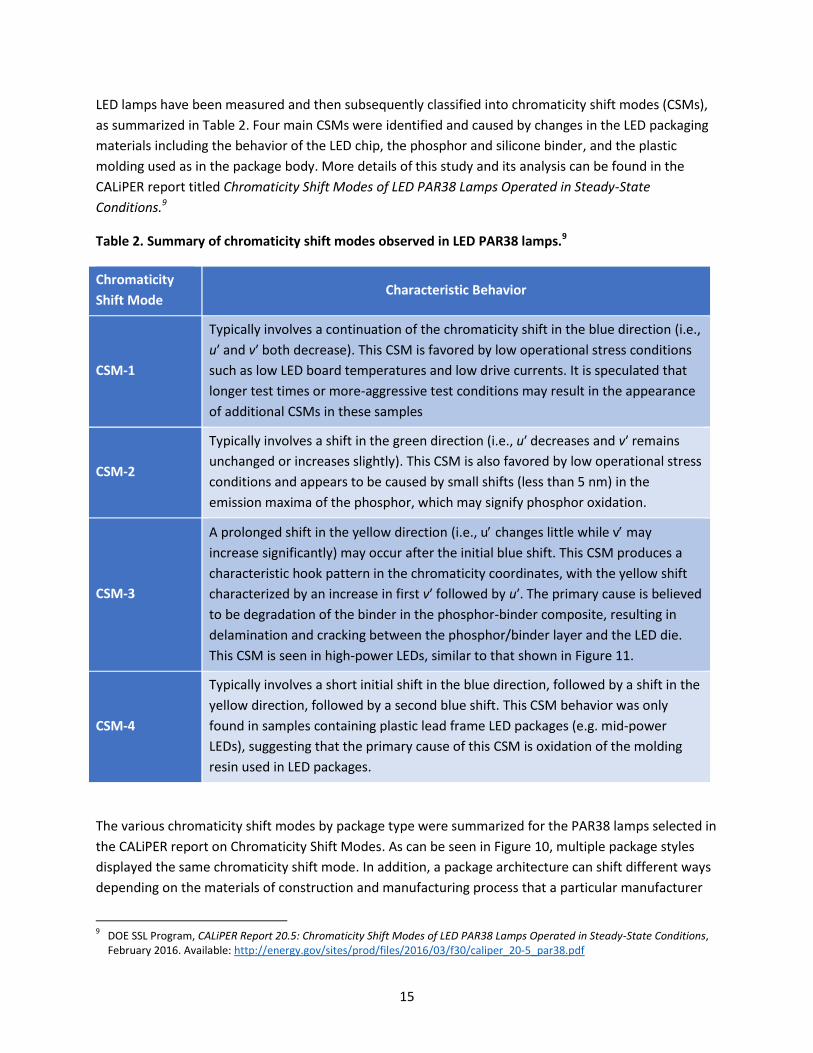
Table 2. Summary of chromaticity shift modes observed in LED PAR38 lamps.9
Chromaticity
Shift Mode Characteristic Behavior
CSM-1
Typically involves a continuation of the chromaticity shift in the blue direction (i.e.,
u′ and v′ both decrease). This CSM is favored by low operational stress conditions
such as low LED board temperatures and low drive currents. It is speculated that
longer test times or more-aggressive test conditions may result in the appearance
of additional CSMs in these samples
CSM-2
Typically involves a shift in the green direction (i.e., u′ decreases and v′ remains
unchanged or increases slightly). This CSM is also favored by low operational stress
conditions and appears to be caused by small shifts (less than 5 nm) in the
emission maxima of the phosphor, which may signify phosphor oxidation.
CSM-3
A prolonged shift in the yellow direction (i.e., u changes little while v may
increase significantly) may occur after the initial blue shift. This CSM produces a
characteristic hook pattern in the chromaticity coordinates, with the yellow shift
characterized by an increase in first v′ followed by u′. The primary cause is believed
to be degradation of the binder in the phosphor-binder composite, resulting in
delamination and cracking between the phosphor/binder layer and the LED die.
This CSM is seen in high-power LEDs, similar to that shown in Figure 11.
CSM-4
Typically involves a short initial shift in the blue direction, followed by a shift in the
yellow direction, followed by a second blue shift. This CSM behavior was only
found in samples containing plastic lead frame LED packages (e.g. mid-power
LEDs), suggesting that the primary cause of this CSM is oxidation of the molding
resin used in LED packages.
The various chromaticity shift modes by package type were summarized for the PAR38 lamps selected in
the CALiPER report on Chromaticity Shift Modes. As can be seen in Figure 10, multiple package styles
displayed the same chromaticity shift mode. In addition, a package architecture can shift different ways
depending on the materials of construction and manufacturing process that a particular manufacturer
9 DOE SSL Program, CALiPER Report 20.5: Chromaticity Shift Modes of LED PAR38 Lamps Operated in Steady-State Conditions,
February 2016. Available: http://energy.gov/sites/prod/files/2016/03/f30/caliper_20-5_par38.pdf

16
uses for that product line. The chromaticity shift modes an LED package product exhibits can change
over the product generations due to the use of newer or more robust materials in that product family.
The data in Figure 10 represent packages that were manufactured in 2013 or earlier; today’s LED
packages may not have the same distribution of color shift modes in some cases.
Figure 10. Count of the CSMs found in the LED PAR38 lamp models from the CALiPER report on chromaticity shift modes.10 Different LED package platforms and similar platforms from different manufacturers exhibited different CSMs.
High-Power LEDs
The high-power LED architecture often produces the most stress to the phosphor and binder materials,
because the phosphor is applied directly on the LED chip using an optical-grade binder. The large blue
LED chips in high-power packages can operate at very high currents, resulting in high optical flux
densities (approximately 1 W/mm2) hitting the phosphor and binder. In addition, the heat from the LED
chip plus the heat generated in the phosphor matrix (from the Stokes losses of the phosphor conversion
of the blue [or violet] photon to yellow), creates high thermal stresses. Phosphor temperatures can
easily be 30°C to 50°C above the junction temperature of the LED.
With time and high temperatures, the phosphor layer can crack and delaminate from the surface of the
LED chip. When phosphor cracking and delamination occurs, a yellow shift in the spectrum arises due to
an increase in the distance the blue photons travel through the phosphor to escape.11 The majority of
high-power LED packages exhibit a steady yellow shift over time, as seen in Figure 11, due to phosphor
cracking or delamination. This steady yellow shift is the most commonly observed terminal chromaticity
shift mechanism for high-power packages and is consistent across a variety of manufacturers and
product generations.
10
J. Lynn Davis, "The Causes of Color Shift in LED Devices," Strategies in Light, Santa Clara, CA, March 2016. 11
M. Royer, C. Stalker, R. Tuttle, “LED color stability: 10 important questions,” DOE webinar, April 15, 2014. Available: http://apps1.eere.energy.gov/buildings/publications/pdfs/ssl/color-stability-webinar_4-15-2014.pdf.
0
2
4
6
8
10
12
14
CSM-1 CSM-2 CSM-3 CSM-4 Other
Nu
mb
er
of
LED
Lam
p M
od
els
Chromaticity Shift Mode (CSM)
Color Shift Modes for CALiPER LED PAR38 Lamps
COB
HPLED
PLCC
Hybrid

17
Figure 11. The chromaticity shift of a representative warm white high power package demonstrating a steady yellow shift. This yellow shift results from phosphor delamination from the chip, leading to a longer path-length through the phosphor.7
Mid-Power LEDs
Mid-power LED packages typically undergo a different chromaticity shift mechanism than high-power
LEDs due to differences in their construction. Discoloration of the plastic resin (illustrated in Figure 12) is
a dominant chromaticity shift mechanism in the mid-power LED packages. When a photon hits the
reflective package sidewall, it will travel a longer path length through the phosphor matrix, resulting in a
warmer color temperature compared to the photons that leave through the top surface of the LED
without a sidewall reflection. As the sidewall becomes discolored, the photons creating the warmer
white color component are increasingly absorbed, resulting in a blue chromaticity shift as photons
taking the shorter path length (cooler white) begin to dominate. The resin discoloration not only leads to
chromaticity shift, but also results in reduced lumen output due to light absorption by the sidewalls.
Figure 12. LED package schematics showing sidewall discoloration that absorbs long-path length blue photons resulting in an overall blue chromaticity shift.8
10,000 hours
2700K
3000K
3500K
0.49
0.50
0.51
0.52
0.53
0.54
0.2
2
0.2
3
0.2
4
0.2
5
0.2
6
0.2
7
v'
u'
Yellow Shift
2700K
3000K
3500K
0.49
0.50
0.51
0.52
0.53
0.54
0.2
2
0.2
3
0.2
4
0.2
5
0.2
6
0.2
7
v'
u'
Blue Shift
Phosphor
LED chips Plastic
Blue photon with shorter path-length escapes
Blue photon is absorbed by the plastic, reducing the amount of long path-length photons that escape

18
While discoloration of the plastic package is a dominant color shift mechanism in many mid-power
packages, other factors can lead to color shift. Oxidation of exposed lead frames, phosphor
delamination, and selective reduction of emission intensities from one component of the phosphor mix
can also produce chromaticity shifts in mid-power packages.
Improved package materials can mitigate the thermal constraints and discoloration. Different types of
resin, such as EMC and silicone molding compound, have an improved resistance to discoloration at
higher temperatures and thus delay the onset of lumen degradation and chromaticity shift. The decay
rate constants are lower for the more thermally stable plastics, as shown in Figure 13.
Figure 13. Decay rate constants for LED packages made with different materials of construction including mid-power packages with different resin material such as PPA, EMC and silicone molding compound. These are compared to high power ceramic-based packages.8
COB LEDs
The architecture of COB LEDs changes how the materials interact compared to the previously discussed
high-power and mid-power LEDs. COBs do not have the strong package sidewall interaction like in mid-
power LEDs, nor the heat sinking for the phosphor found in the high-power LEDs, making them a
thermally constrained system. If the COB LEDs are not properly heat sunk, the light emitting surface
(LES) of the LED will crack catastrophically and lead to failure.
COB LEDs show a chromaticity shift behavior that falls between the blue and green directions, but is
predominately shifting green. Figure 14 shows a typical chromaticity shift of a warm white COB LED. A
previous analysis of small COB LEDs in PAR38 lamps in the CALiPER Report 20.5 showed several different
color shift modes depending on the COB manufacturer.9 Some shifted blue (CSM-1), some shifted green
(CSM-2) and some shifted yellow (CSM-3).
Further study on the color shift behavior of COBs is needed since evidence from the field is indicating
changes in the materials properties of the silicone at the LES. Other indications are that the reflective
-5.0E-06
1.0E-20
5.0E-06
1.0E-05
1.5E-05
2.0E-05
0 50 100 150 200
Dec
ay R
ate
Co
nst
ant,
Alp
ha
Junction Temperature (C)
Ceramic
PPA
EMC
Silicone

19
white coating on the printed circuit board (PCB) can degrade and darken slightly, leading to higher
absorption and color shift.
Figure 14. Example of chromaticity shift of a warm white COB LED moving in a stable fashion predominantly in the green direction.7
Phosphor Degradation
Experimental studies utilizing accelerated life tests (ALT) performed by RTI International have also
provided insights into the impact of LED package materials on color point stability. Commercially
available cool white and warm white high-power LEDs were run under wet high temperature operating
life (WHTOL) testing at 75oC and 75% relative humidity (75/75). Cool white LEDs showed a lower overall
chromaticity shift compared to warm white LEDs. After 3,500 hours of ALT, the cool white LEDs had a
u’v’ shift of 0.012 toward the yellow direction, whereas the warm white LEDs showed a u’v’ shift of
0.028 towards the green direction. To understand the mechanism of these color shifts, the emission
spectra were studied. The cool white LEDs showed a stable yellow peak, with a slight loss in the red
wavelength region of the emission spectra.
The chromaticity shift seen in the warm white LEDs after 3,500 hours ALT is attributed to a significant
change in the characteristics of the emission spectrum in the red/orange region, with the main peak
shifting from approximately 610 nm to 601 nm (Figure 15). This shift in the red peak wavelength will
continue to increase under more aggressive ALT conditions. After 4,000 hours of ALT at 85oC and 85%
relative humidity (85/85), the peak shifted from 610 nm to 580 nm, as seen in Figure 16. The move from
75/75 to 85/85 corresponds to an acceleration factor of approximately 4X. The study concluded that the
spectral shift was due to degradation of the red oxy-nitride phosphor in the presence of oxygen from
the moisture present in WHTOL testing, causing the red emission wavelength peak to shift shorter. The
shortened red emission ultimately caused chromaticity shift of the warm white LED emission towards
the green spectral region.
0.53
0.531
0.532
0.533
0.534
0.535
0.536
0.537
0.266 0.267 0.268 0.269 0.27 0.271 0.272 0.273
v'
u'
3600mA, 55C
3600mA, 85C
3600mA, 105C
Tj
77C
107C
127C
Direction of shift
2700K
3000K
3500K
0.49
0.50
0.51
0.52
0.53
0.54
0.2
2
0.2
3
0.2
4
0.2
5
0.2
6
0.2
7
v'
u'
Green Shift
Blue Shift
COBs
6000 hours

20
Figure 15. Accelerated testing at 75oC and 75% relative humidity for a cool white high-power LED shows a stable yellow peak from the YAG phosphor (left image). The warm white LED exhibits a shift in red phosphor wavelength from 610 nm to 601 nm after 3,500 hours for the warm white LED (right image), which results in an overall green chromaticity shift.8
The different phosphor materials in the LED packages can lead to different chromaticity shift
mechanisms. Cool white high-power LEDs with a YAG:Ce phosphor typically exhibit a chromaticity shift
towards the yellow direction due to phosphor binder delamination or cracking, which is often the result
of the silicone binder degrading under heat and blue flux. Warm white high-power LEDs contain a
phosphor blend, typically using a YAG:Ce yellow phosphor and a nitride red phosphor. This red phosphor
is not as stable under oxidizing environments and can shift emission wavelength leading to a green shift,
as illustrated in Figure 17. While the humidity in the ALT testing drove the red phosphor peak
wavelength to shorter values, this chromaticity shift mechanism is also seen in LED lamps in the field.9
Figure 16. Under accelerated testing at 85oC and 85% relative humidity, the warm white high-power LED exhibits a larger shift in red phosphor wavelength from 610 nm to 580 nm after 4,000 hours, compared to testing at 75oC and 75% relative humidity. This results in an overall green chromaticity shift due to the red phosphor emission peak shifting.
Cool White HP-LEDs Warm White HP-LEDs

21
Figure 17. Chromaticity shifts and the commonly associated chromaticity shift mechanisms for the direction of chromaticity shift are displayed.8
Remote Phosphor LED Modules
Remote phosphor LED modules exhibit different chromaticity shift behavior compared to discrete LED
packages due to their differing architecture. The major difference is that the phosphor matrix is not
placed in direct contact with the LED chips, but instead located remotely from the LEDs to minimize
direct heat transfer from the LED to the phosphor matrix. The remote location of the phosphor results in
lower temperature rises in the phosphor layer, even at high flux levels.
A variety of materials and architectures can be realized using the remote phosphor approach, as seen in
Figure 18. A common configuration of the remote phosphor approach involves coating a phosphor onto
a glass or polycarbonate disk using a binder for insertion into an LED module or luminaire. Another
approach is to embed the phosphor material into polymeric lenses using a molding process.
Figure 18. Examples of coated remote phosphor configurations and molded remote phosphor configurations.12
12
Intematix ChromaLit product family. Available: http://www.intematix.com/products/chromalit/chromalit-specifications.
2700K
3000K
3500K
0.49
0.50
0.51
0.52
0.53
0.54
0.2
2
0.2
3
0.2
4
0.2
5
0.2
6
0.2
7
v'
u'
Yellow Shift
Green Shift
Red phosphor degradation due to O2
Phosphor delamination and silicone cracking
Coated Remote Phosphor Products Molded Remote Phosphor Products

22
Accelerated testing of commercially available remote phosphor disks established that chemical
properties of the phosphors and binder materials have a significant impact on lumen maintenance,
chromaticity shift, and chromaticity stability.13 Red nitride phosphors used in warm white LEDs can
experience chromaticity point shifts due to oxidation. When this phosphor is combined with silicone
binders, it will exhibit larger chromaticity shifts in WHTOL testing due to the high water permeability of
silicones. The degree of chromaticity change can be mitigated to some extent by selecting less water-
permeable materials, like polyurethane as the binder, though these materials can have their own optical
stability issues. In addition to changes in the phosphor material or chemical changes in polymer binder,
WHTOL testing can lead to increased absorption at certain wavelengths and altered index of refraction
of the remote phosphor. These findings emphasize that understanding the properties of materials used
in LED devices is critical to achieving high lumen maintenance and chromaticity stability over the life of
the product.
Optical System Impacts The optical system of the luminaire or lamp contain secondary lenses, diffusers, and reflective layers
intended to optimize light extraction and reflections in the mixing chamber and diffuse the light pattern
from the LEDs. The optical system of the luminaire or lamp can also impact the chromaticity shift
beyond that in the LED package.
Optics and Diffusers
Optical materials such as polycarbonate (PC) or poly-methyl methacrylate (PMMA) are broadly used as
secondary lens materials for indoor lighting applications due to their relative low cost and mature
manufacturing process. Studies have been carried out to investigate the impact of thermal aging stress
and blue irradiation on PC and PMMA lens materials. The observed change in lens color can lead to
varying spectral power distributions thus leading to chromaticity shifts. Often, these shifts are in the
yellow direction since the discoloration of the lens preferentially decreases the transmission of blue
light.
Figure 19. Spectral power distribution (left) and chromaticity diagram (right) of BPA-PC lens after 3,000 hours of aging at 85oC, exhibiting an overall chromaticity shift in the yellow direction.14
13
J. Lynn Davis et al., “The Influence of Phosphor and Binder Chemistry on the Aging Characteristics of Remote Phosphor Products,” publication pending, Solid State Lighting Technology and Application Series, Springer-Verlag, New York, 2017.

23
BPA-PC (biphenyl A polycarbonate) is more sensitive to the exposure of temperature and blue
irradiation than PMMA. In one study, BPA-PC showed a decrease in the blue spectral peak intensity
while the broad yellow peak intensity remained the same after 3,000 hours exposure at 85oC (Figure 19),
thus leading to a yellow-shift.14 When PMMA was tested under similar conditions, no significant change
was observed in chromaticity (Figure 20). Further studies on PMMA showed no yellowing under aging of
85oC for 5,000 hours, or with additional blue light irradiation and additional 85% relative humidity (RH)
for 5,000 hours. PMMA withstood aging of 100oC for 3,000 hours as well, as seen in the lack of
transmittance change in Figure 21.15 In these experiments, the discoloration of PMMA was not observed
until high temperatures (150˚C), thus demonstrating the resistance to oxidation of this material.
Figure 20. Spectral power distribution (left) and chromaticity diagram (right) of PMMA after 3,000 hours of aging at 85oC, showing minimal chromaticity shift.14
Figure 21. Transmittance behavior of PMMA as a function of wavelength under various thermal aging conditions. PMMA withstood aging of 100oC for 3,000 hours as well.15
14
Guangjun Lu, et al., “Color Shift Investigations for LED Secondary Optical Designs: Comparison between BPA-PC and PMMA,” Optical Materials vol. 45, p. 37-41, 2015.
15 Guangjun Lu, et al., “Colour shift and mechanism investigation on the PMMA diffuser used in LED-based luminaires,” Optical Materials vol. 54, p. 282-287, 2016.

24
Other studies have observed the same yellowing phenomena when the lens is aged as part of an entire
LED system. In a CALiPER study of PAR38 lamps tested for lumen and chromaticity maintenance,9 a
discolored lens was observed upon disassembly of one of the tested lamps, as shown in Figure 22. This
secondary lens was in direct contact with an LED board at the elevated temperature, which resulted in
oxidation of the lens causing it to yellow. The yellowing of the secondary lens can be contributed to
increasing absorbance of blue photons that then produce a shift in the blue-emission-peak shape and
shift the emission peak to longer wavelengths (which can be used as an indicator of lens yellowing
during use).
Figure 22. Secondary lenses taken from PAR38 LED lamps measured under accelerated testing showing the yellowing of the optic on the right after nearly 14,000 hours of testing due to excessive heat. The clear optic on the left shows the coloration after 2,000 hours of testing before the onset of yellowing.9
White Reflective Materials
In addition to secondary lenses and diffusers, spectrally reflective layers are included in many lamps and
luminaires to reduce the absorbing surfaces around the LED board to help improve light emission from
the system. White reflective materials made from microcellular PET (polyethylene terephthalate) or
spun polymer microfibers composites like high density polyethylene (HDPE) embedded with reflective
particles have advantages for the luminaire, including high total reflectivity across the visible spectrum,
high diffuse reflectivity, and light weight.
The color shift and lumen degradation of microcellular PET (MC-PET) was investigated in a downlight
luminaire configuration.16 The white color of this material arises naturally from the microcellular
structure and is not the result of added pigments. After aging for 4,000 hours at 85oC, MC-PET did not
show any significant changes in reflectivity under thermal aging or later when combined with blue light
irradiation, though when 85% RH was subsequently applied to the aging test, the reflectivity did drop
slightly in the low wavelength regime (380-430 nm), as seen in Figure 23. The resulting chromaticity shift
under thermal aging of MC-PET was minimal, though it increased a bit when aged at temperature and
16
Guangjun Lu, et al., “Degradation of Microcellular PET reflective materials used in LED-based products,” Optical Materials vol. 49, p. 79-84, 2015.

25
humidity. In addition, the exposure of temperature and humidity reduced the mechanical strength of
MC-PET, leading to embrittlement and fracturing during handling.
Some reflector materials use rutile pigments to achieve high reflectance across the visible spectrum.
Rutile is a photocatalyst and its absorption band can overlap slightly with the low wavelength side of the
main blue emission peak. Depending upon the polymer used in these materials, they may discolor due
to activation of the photocatalyst by the combined influence of heat, humidity, and exposure to blue
photons.
Figure 23. Reflectivity of microcellular PET after 4,000 hours testing under various aging conditions. The material maintains stable reflectivity except under aging with humidity.16
Summary Chromaticity shift in LED packages is very complex, with different mechanisms at play depending on
package materials and construction, but the chromaticity shift can progress in a fairly predictable
pattern depending on junction temperature. The ambient temperature, optical flux density, and
presence of moisture for phosphor particles, and the neighboring binder material also affect the rate of
chromaticity shift. Within an LED package, the phosphor temperatures can be 30°C to 50°C above the
junction temperature of the LED chip. At high temperatures and long operating times, the materials in
the package can discolor, crack, or delaminate — leading to chromaticity shift and lumen depreciation.
Red phosphors also can experience a decrease in peak wavelength in the presence of moisture and heat,
which can impact the chromaticity of warm white LED packages.
The initial chromaticity shift in many LEDs begins in the blue direction, but then can change direction
depending on the particular terminal chromaticity shift mechanism. This initial shift is likely due to
changes in the LED and package materials that began during manufacturing and continue for a short
time when the LED is first turned on. After this initial incubation period, the chromaticity of the LED
package will usually shift according to one of four chromaticity shift modes. For high-power LEDs, often
the dominant mechanism is a stable long-term chromaticity shift towards yellow due to phosphor
delamination from the chip, silicone micro-cracks or yellowing, or blue LED degradation. For many mid-

26
power LEDs, the chromaticity shift can move in the blue direction when operated at high temperatures
and drive currents due to discoloration of the package resin. Shifts in the green and red directions can
also occur in mid-power LEDs depending upon the specifics of the phosphor mix, the LED junction
temperature, and the drive current. Improved package resin materials can delay the onset of
chromaticity shift due to discoloration. COBs exhibit various chromaticity shifts with a common shift
predominantly towards the green direction. The chromaticity shift behavior of COB LEDs is still under
investigation for correlation to a physical mechanism. One possibility is discoloration on the white
reflective layer of the PCB.
Another area of investigation for LED packages is the new chip scale package (CSP) LED platform. CSP
LEDs have gained prominence recently due to their lower cost from minimizing materials and
manufacturing steps, as well as their small footprint allowing for tighter packing in a luminaire. The
number of CSP product offerings continues to grow, as well as the number of manufacturers offering
this LED product type. CSP products are finally starting to reach the 6,000 hour test point for LM-80
reports and analysis can begin on this new LED package platform.
In addition to the chromaticity shift behavior from the LED packages, optical materials in the lamps and
luminaires tend to yellow or discolor due to oxidation effects, leading to chromaticity shifts in the yellow
direction.
While LED chromaticity shift does occur and can impact the performance of LED lighting products, the
new understanding summarized in this paper has allowed the industry to manage the negative impact of
such a shift. While LED based lighting can exhibit significantly improved color stability compared to
conventional lighting products, their long lifetime requires an understanding of how color might shift
over this long life. Further research is needed to develop improved predictive models that will enable
manufacturers and consumers to understand the tradeoffs and make informed decisions regarding LED
lighting performance requirements and product capabilities.
Path Forward Further work is needed in understanding and projecting the chromaticity shift behavior in LED packages.
A TM-31 working group is developing a standard for projecting long-term chromaticity maintenance of
LED packages, possibly from LM-80-15 data. Ideally, a chromaticity shift model can be developed for
different package types to determine the time to a certain chromaticity shift magnitude (e.g. 7-step
MacAdam ellipse) that can be inserted in a system reliability model to predict the behavior of an LED
luminaire or lamp. Beyond the efforts of the TM-31 working group, the DOE SSL program has funded
R&D on this topic. RTI International has been investigating this topic by analyzing color shift data from
LED packages (LM-80 reports), LED lamps (CALiPER 20.5 study), and luminaires from accelerated stress
testing. Models are currently being developed and need to be tested. Further research is required to
understand the different color shift mechanisms in the different luminaire subsystems and to develop
accelerated testing methods and predicative models to further improve the manufacturer’s ability to
bring color-stable lighting products to the customer.

27
List of Acronyms
HDPE High density polyethylene
IES Illuminating Engineering Society
LED Light emitting diodes
LES Light emitting surface
LSRC LED Systems Reliability Consortium
MC-PET Microcellular PET
NGLIA Next Generation Lighting Industry Alliance
PAR Parabolic aluminized reflector
PC Polycarbonate
PET Polyethylene terephthalate
PLCC Plastic leaded chip carrier
PMMA Poly-methyl methacrylate
PPA Polyphthalamide, a thermoplastic resin
SSL Solid-State Lighting
WHTOL Wet high temperature operating life
YAG Yttrium Aluminum Garnet
YAG:Ce Yttrium Aluminum Garnet doped with Cerium


