Left Posterior Temporal Regions are Sensitive to Auditory Categorization Rutvik Desai, Einat Liebenthal, Eric Waldron, and Jeffrey R. Binder Abstract & Recent studies suggest that the left superior temporal gyrus and sulcus (LSTG/S) play a role in speech perception, although the precise function of these areas remains unclear. Here, we test the hypothesis that regions in the LSTG/S play a role in the categorization of speech phonemes, irrespective of the acoustic properties of the sounds and prior experience of the listener with them. We examined changes in functional mag- netic resonance imaging brain activation related to a percep- tual shift from nonphonetic to phonetic analysis of sine-wave speech analogs. Subjects performed an identification task be- fore scanning and a discrimination task during scanning with phonetic (P) and nonphonetic (N) sine-wave sounds, both before (Pre) and after (Post) being exposed to the phonetic properties of the P sounds. Behaviorally, experience with the P sounds induced categorical identification of these sounds. In the PostP > PreP and PostP > PostN contrasts, an area in the posterior LSTG/S was activated. For both P and N sounds, the activation in this region was correlated with the degree of categorical identification in individual subjects. The results suggest that these areas in the posterior LSTG/S are sensitive neither to the acoustic properties of speech nor merely to the presence of phonetic information, but rather to the listener’s awareness of category representations for audi- tory inputs. & INTRODUCTION Speech perception is shaped by the biological signif- icance of speech in human cognition, the complex spectro-temporal structure of human vocalizations, and the categorical nature of phoneme representations. A common neuroimaging paradigm for studying the neural substrates mediating speech perception is to compare brain activation patterns elicited during the process- ing of speech and nonspeech sounds (Obleser et al., 2006; Uppenkamp, Johnsrude, Norris, Marslen-Wilson, & Patterson, 2006; Liebenthal, Binder, Spitzer, Possing, & Medler, 2005; Davis & Johnsrude, 2003; Binder et al., 2000; Scott, Blank, Rosen, & Wise, 2000; Mummery, Ashburner, Scott, & Wise, 1999; Demonet et al., 1992). Stronger activation in the left superior temporal gyrus and sulcus (STG/STS) is typically observed for speech compared to nonspeech sounds. However, interpre- tation of this result is complicated by the fact that the speech and nonspeech control sounds may differ in their acoustic properties, such that differences in the pattern of activation that they elicit may reflect the differential analysis of their physical properties in auditory regions generally concerned with analysis of complex sounds. Even when the speech and non- speech sounds are carefully matched in their spectro- temporal characteristics (Liebenthal et al., 2005), another difficulty is that they typically differ in their familiarity to the listener, such that the differential speech versus nonspeech activation may reflect the extensive experi- ence of humans with speech sounds rather than a specialization for phoneme perception per se. Here we circumvent the problem of matching speech and nonspeech sounds on acoustic properties and familiarity by using sine-wave analogs of speech and speech-like sounds. Sine-wave speech analogs are tone complexes in which the time-varying center frequency and power of each speech formant are represented by a tone varying in frequency and amplitude (Remez, Rubin, Pisoni, & Carrell, 1981). A naı ¨ve listener typically perceives these sounds as nonspeech. When informed that the sounds correspond to speech, and after brief training, listeners can usually perceive them as speech (Liebenthal, Binder, Piorkowski, & Remez, 2003; Remez, Pardo, Piorkowski, & Rubin, 2001; Best, Studdert-Kennedy, Manuel, & Rubin-Spitz, 1989). Sine-wave analogs lack the fine-grain acoustic properties of speech such as pitch and harmonic structure and are therefore unfamiliar to the listener (whether they replicate speech or not). How- ever, they preserve the coarse dynamic features of in- dividual formants, which is sufficient to evoke phonetic perception. We used functional magnetic resonance imaging (fMRI) to assess brain activation patterns associated with phonetic perception by comparing the activation with sine-wave speech analogs, before and after being in- Medical College of Wisconsin D 2008 Massachusetts Institute of Technology Journal of Cognitive Neuroscience 20:7, pp. 1174–1188
Transcript
Left Posterior Temporal Regions are Sensitiveto Auditory Categorization
Rutvik Desai, Einat Liebenthal, Eric Waldron, and Jeffrey R. Binder
Abstract
& Recent studies suggest that the left superior temporal gyrusand sulcus (LSTG/S) play a role in speech perception, althoughthe precise function of these areas remains unclear. Here,we test the hypothesis that regions in the LSTG/S play a role inthe categorization of speech phonemes, irrespective of theacoustic properties of the sounds and prior experience of thelistener with them. We examined changes in functional mag-netic resonance imaging brain activation related to a percep-tual shift from nonphonetic to phonetic analysis of sine-wavespeech analogs. Subjects performed an identification task be-fore scanning and a discrimination task during scanning withphonetic (P) and nonphonetic (N) sine-wave sounds, both
before (Pre) and after (Post) being exposed to the phoneticproperties of the P sounds. Behaviorally, experience with theP sounds induced categorical identification of these sounds.In the PostP > PreP and PostP > PostN contrasts, an areain the posterior LSTG/S was activated. For both P and Nsounds, the activation in this region was correlated with thedegree of categorical identification in individual subjects. Theresults suggest that these areas in the posterior LSTG/S aresensitive neither to the acoustic properties of speech normerely to the presence of phonetic information, but rather tothe listener’s awareness of category representations for audi-tory inputs. &
INTRODUCTION
Speech perception is shaped by the biological signif-icance of speech in human cognition, the complexspectro-temporal structure of human vocalizations, andthe categorical nature of phoneme representations. Acommon neuroimaging paradigm for studying the neuralsubstrates mediating speech perception is to comparebrain activation patterns elicited during the process-ing of speech and nonspeech sounds (Obleser et al.,2006; Uppenkamp, Johnsrude, Norris, Marslen-Wilson, &Patterson, 2006; Liebenthal, Binder, Spitzer, Possing, &Medler, 2005; Davis & Johnsrude, 2003; Binder et al.,2000; Scott, Blank, Rosen, & Wise, 2000; Mummery,Ashburner, Scott, & Wise, 1999; Demonet et al., 1992).Stronger activation in the left superior temporal gyrusand sulcus (STG/STS) is typically observed for speechcompared to nonspeech sounds. However, interpre-tation of this result is complicated by the fact thatthe speech and nonspeech control sounds may differin their acoustic properties, such that differences inthe pattern of activation that they elicit may reflectthe differential analysis of their physical propertiesin auditory regions generally concerned with analysisof complex sounds. Even when the speech and non-speech sounds are carefully matched in their spectro-temporal characteristics (Liebenthal et al., 2005), another
difficulty is that they typically differ in their familiarityto the listener, such that the differential speech versusnonspeech activation may reflect the extensive experi-ence of humans with speech sounds rather than aspecialization for phoneme perception per se.
Here we circumvent the problem of matching speechand nonspeech sounds on acoustic properties andfamiliarity by using sine-wave analogs of speech andspeech-like sounds. Sine-wave speech analogs are tonecomplexes in which the time-varying center frequencyand power of each speech formant are represented bya tone varying in frequency and amplitude (Remez,Rubin, Pisoni, & Carrell, 1981). A naıve listener typicallyperceives these sounds as nonspeech. When informedthat the sounds correspond to speech, and after brieftraining, listeners can usually perceive them as speech(Liebenthal, Binder, Piorkowski, & Remez, 2003; Remez,Pardo, Piorkowski, & Rubin, 2001; Best, Studdert-Kennedy,Manuel, & Rubin-Spitz, 1989). Sine-wave analogs lack thefine-grain acoustic properties of speech such as pitchand harmonic structure and are therefore unfamiliar tothe listener (whether they replicate speech or not). How-ever, they preserve the coarse dynamic features of in-dividual formants, which is sufficient to evoke phoneticperception.
We used functional magnetic resonance imaging(fMRI) to assess brain activation patterns associated withphonetic perception by comparing the activation withsine-wave speech analogs, before and after being in-Medical College of Wisconsin
D 2008 Massachusetts Institute of Technology Journal of Cognitive Neuroscience 20:7, pp. 1174–1188
formed of their phonetic nature, while subjects wereengaged in a discrimination task. Because identicalstimuli were used in the naıve and informed conditions,any differences in activation between these scans couldnot be attributed to differences in the acoustic proper-ties of the sounds. This design, contrasting activationassociated with the same sine-wave speech and non-speech analogs under naıve and informed conditions,builds upon a previous study from our group (Liebenthalet al., 2003). The previous study, however, used ademanding auditory task requiring resolution of sine-wave words into their constituent tones, thereby in-terfering with their phonetic analysis. Here we used athree-interval, two-alternative (ABX) discrimination taskrequiring integral analysis of the sounds without interfer-ence with phonetic perception. This task also imposed arelatively high memory load, which was expected topromote phonetic perception in the informed condition(Crowder, 1982; Repp, Healy, & Crowder, 1979). In ad-dition, a control condition was created using tone com-plexes with acoustic properties similar to the sine-wavespeech but lacking phonetic information, analogous tothe control sounds used in Liebenthal et al. (2005).Participants were unfamiliar with the sine-wave speechand nonspeech analogs. Thus, any changes in activationbetween the Pre and Post scans due simply to increasedpractice were expected to be similar for the phoneticand nonphonetic sounds. Finally, we tested whetherawareness of the phonetic properties of the speechanalogs would trigger a shift in their analysis fromcontinuous to categorical (i.e., would enhance percep-tual differences between phoneme categories and min-imize perceptual differences within categories; for areview, see Harnad, 2003). We hypothesized that thelevel of activation in a subset of regions more responsiveto speech sounds may also demonstrate sensitivity tothe level of categorization of these sounds.
METHODS
Participants
Participants were 28 healthy adults (19 women), 18–43(average 26) years old, with no known neurologicalor hearing impairments. All subjects were native speak-ers of General American English and were right-handedaccording to the Edinburgh Handedness Inventory(Oldfield, 1971). Data from four other subjects wereexcluded due to poor behavioral performance (over-all discrimination accuracy as well as across-category(AC) discrimination accuracy of less than 55%, wherechance = 50%, in the Post phonetic condition). Datafrom 10 other subjects, scanned between certain dates,were not used due to potential scanner artifacts. In-formed consent was obtained from each subject prior tothe experiment, in accordance with a protocol sanc-tioned by the Medical College of Wisconsin InstitutionalReview Board.
Stimuli
The stimuli consisted of seven-step phonetic and non-phonetic sine-wave analog continua. The phonetic itemsreplicated a /ba/–/da/ continuum, and the nonphoneticitems replicated a corresponding nonphonetic contin-uum created by spectrally inverting the first formant ofthe syllables. The third formant of the nonphonetictokens was further manipulated to render the overallnonphonetic discrimination accuracy comparable tothat of the phonetic continuum (Liebenthal et al., 2005).Tokens 3 and 5 from both continua are shown in Fig-ure 1. Thus, the phonetic and nonphonetic continua werematched on token duration, amplitude, and spectro-temporal complexity. However, tokens in the nonpho-netic continuum were not analogous to any Englishphoneme. The sine-wave analogs were generated usingin-house sine-wave synthesis software. Sine-wave tonesreplicating each of the first three formants of the syl-lables and of the nonphonetic sounds were synthesizedbased on time-varying formant center-frequency andintensity values of the original speech and nonspeechsounds measured at 10-msec intervals. Frequency andintensity values at intermediate time points were com-puted using cubic spline interpolation. Intensity valuesfor the second and third formants were scaled, respec-tively, to 95.7% and 78.6% of their value for the firstformant in order to maintain the amplitude relationshipbetween the first three formants of the original sounds.The resulting sine-wave formant analogs were sampledat 22050 Hz. The three sine-wave formants of each tokenwere then combined into a complex tone and edited to
Figure 1. Spectrograms of the sine-wave sounds used in the study.
Tokens 3 and 5 in the phonetic (top) and nonphonetic(bottom) continuum are shown.
Desai et al. 1175
150 msec duration with a 5-msec rise-decay envelopeusing Macromedia SoundEdit 16 (v.2.0) software.
The sounds were delivered binaurally through a stetho-scopic headset with insert eartips using the AvotecSS-3100 pneumatic audio system (Jensen Beach, FL).This system provides a flat frequency response (±5 dB)at 150–4500 Hz, covering the spectral range used in thisstudy. The sound intensity was set to a comfortable levelof approximately 70 dB and was slightly adjusted be-tween participants to accommodate for individual differ-ences in hearing and in positioning of the eartips. Foreach participant, the level was kept constant throughoutthe session.
Sound presentation was controlled by a personal com-puter running PsyScope (Cohen, MacWhinney, Flatt, &Provost, 1993).
Experimental Procedure
The experimental procedure is summarized in Table 1.Prior to scanning, subjects were familiarized with thestimuli and tested with an identification task. They firstlistened to nine instances of each of the two anchorpoints (i.e., Tokens 1 and 7) of the phonetic (P) con-tinuum and then completed 20 trials in which theywere required to identify the anchor points as ‘‘sound1’’or ‘‘sound2’’ by pressing one of two keys. For eachtrial, they received visual feedback in form of the cor-rect response displayed on the computer screen. Thesubjects were then tested on identification of 10 pre-sentations in random order of all seven tokens ofthe continuum, using the same labels (‘‘sound1’’ or‘‘sound2’’). No feedback was provided. The same pro-cedure was repeated with the nonphonetic (N) contin-uum. The N sounds were also labeled ‘‘sound1’’ and‘‘sound2.’’
The subjects were then briefly familiarized with theABX discrimination task. This was a two-alternativeforced-choice task, in which the subjects heard threesounds in succession, separated by 500-msec interstim-ulus intervals, and decided whether the third sound (X)was identical to the first or the second sound in thepreceding AB pair, by pressing one of two keys. Visualfeedback was provided after each trial during training,showing the correct response. Only anchor points wereused for this familiarization task.
In the scanner, subjects performed the ABX task forfour runs, alternating between P and N conditions witheach run. Previous research using this /ba–da/ speechcontinuum (Liebenthal et al., 2005) and pilot studieswith the sine-wave analogs used for this experimentindicated a category boundary near Token 4 in thecontinuum. There were a total of 20 across-category(AC; Tokens 3–5) and 20 within-category (WC; 10 eachof Tokens 1–3 and 5–7) AB pairs in each run, presentedin random order. A trial consisted of three tokens pre-sented during an otherwise silent period between image
acquisitions. No feedback was provided. There were 10additional silent baseline trials in each run, insertedrandomly, in which no stimuli were presented.
Following this first (Pre) scan session of four runs,subjects were asked whether they had noticed speech inany of the sounds presented so far during the scan. Theywere then informed that ‘‘sound1’’ and ‘‘sound2’’ in theP trials were actually modified versions of /ba/ and /da/syllables. They were also informed that ‘‘sound1’’ and‘‘sound2’’ in the N trials were computer-generated non-speech sounds. The subjects were instructed to listen forthe speech sounds /ba/ and /da/ in the sine-wave stimuli.They were then subjected to the same familiarizationprocedure used to introduce the test stimuli prior toscanning [listening to P anchor points (now identified as/ba/ and /da/), identification of P anchor points with
Table 1. A Summary of the Experimental Procedure
Location Task No. of Trials
Outside thescanner
P Iden. with feedbackon anchor points
40
P Iden. without feedbackon continuum
70
N Iden. with feedbackon anchor points
40
N Iden. without feedbackon continuum
70
P ABX with feedbackon continuum
18
N ABX with feedbackon continuum
18
Inside thescanner
Pre: P–N–P–N ABX(4 runs)
40 � 4
Inform subjects aboutthe nature of stimuli
P Iden. with feedbackon anchor points
30
P Iden. without feedbackon continuum
70
N Iden. with feedbackon anchor points
30
N Iden. without feedbackon continuum
70
Post: P–N–P–N ABX(4 runs)
40 � 4
In the ‘‘Task’’ column, regular text indicates tasks performed prior toor between functional scans. Bold text indicates tasks performed dur-ing functional scans.
P = phonetic; N = nonphonetic; Iden. = identification task; ABX =ABX discrimination task. Tasks are listed in the order that they wereadministered except that the order of P and N blocks was counter-balanced across subjects.
1176 Journal of Cognitive Neuroscience Volume 20, Number 7
visual feedback, followed by identification testing usingthe whole P continuum]. The training and testing pro-cedures were then repeated with the N sounds, usingthe same ‘‘sound1’’ and ‘‘sound2’’ labels as before. Thisentire training and testing procedure lasted approxi-mately 20 min and was performed while the subjectslay in the scanner.
The subjects were then scanned again (Post scans)while performing the ABX task, using exactly the sameprocedure as in the Pre scans.
The order of P and N runs in training, testing, andscanning was counterbalanced across subjects such thatapproximately half the subjects were exposed to the Pstimuli first and the other half were exposed to the Nstimuli first, in both Pre and Post scans.
Image Acquisition
Images were acquired on a 1.5-T GE Signa scanner (GEMedical Systems, Milwaukee, WI). Clustered (or ‘‘sparse’’)acquisition (acquisition time = 2100 msec) was used tocollect functional image volumes separated by interveningperiods of silence. T2*-weighted, gradient-echo, echo-planar images (TE = 40 msec, flip angle = 908, NEX =1) were collected at 8-sec intervals. Trials were positionedsuch that they started 1 sec after the end of each imageacquisition and were followed by a silent window ofapproximately 3.5 sec for subjects to respond. The he-modynamic response to the last stimulus in a trial (X) wasexpected to peak at 4–6 sec after the onset of X,coinciding with the time of the next image acquisition.Response time (RT) was measured from the onset of X.The functional images were constructed from axiallyoriented 22 contiguous slices with 3.75 � 3.75 � 4 mmvoxel dimensions, covering the whole brain except themost dorsal fronto-parietal regions. Fifty images wereacquired in each of the four Pre and four Post runs. Anadditional image, collected at the beginning of each run,was discarded. High-resolution anatomical images of theentire brain were obtained using a 3-D spoiled gradient-echo sequence (‘‘SPGR’’; GE Medical Systems, Milwaukee,WI), with 0.9 � 0.9 � 1.2 mm voxel dimensions.
Categorical Perception Index
To assess the categorical nature of behavioral perfor-mance, logistic regression was performed on each sub-ject’s identification data. Logistic regression (Hosmer &Lemeshow, 2004) fits an S-shaped curve to the datausing the maximum-likelihood method, and generatescoefficient estimates for the function that is most likelyto describe the observed pattern of data. Under thelogistic regression framework, the probability of a /ba/response can be modeled as
pð=ba=Þ ¼ 1= 1 þ E�ðaþbXÞ� �
where X is the predictor variable (here, the position of thetoken or token-pair in the continuum). The coefficient bcan be interpreted as the steepness or slope of the S-curve.High values of jbj suggest a steep, step-like curve charac-teristic of categorical perception. Low values suggest a morelinear or continuously varying response, and values closeto 0 indicate a flat response curve or chance performance.
Here, a categorical perception index (CPI) was de-fined as the increase in b from Pre to Post scans (bpost �bpre). A high CPI indicates that the perception of soundsbecame substantially more categorical from Pre to Postscan, whereas a CPI of 0 indicates no change.
Image Analysis
Within-subject analysis consisted of spatial coregistration(Cox & Jesmanowicz, 1999), deconvolution and voxelwisemultiple linear regression (Ward, 2001) with referencefunctions representing four experimental conditions: pre-phonetic (PreP), pre-nonphonetic (PreN), post-phonetic(PostP), and post-nonphonetic (PostN). Individual datawere smoothed with a Gaussian filter of 4 mm full widthat half maximum. Anatomical scans and functional mapswere projected into standard stereotaxic space (Talairach& Tournoux, 1988) using AFNI (Cox, 1996). In a random-effects analysis, individual coefficient maps were contrastedagainst a constant value of 0 to create group t maps. Thegroup maps were thresholded at voxelwise p < .03. Clus-ters smaller than 732 Al (13 voxels) were removed toachieve a corrected mapwise p < .05 as determined byMonte Carlo simulations (Ward, 2000), which provide theprobability of clusters of various sizes occurring by chance.
To examine the relation between activation and behav-ioral performance, individual CPI measures for P soundswere correlated with the activation in the PostP–PrePcontrast of each participant on a voxelwise basis, usingSpearman’s rank correlation. Spearman’s correlation wasused because it is relatively robust to the presence ofoutliers in the activation or in the CPI. To gain moresensitivity, a region of interest (ROI) containing bilateraltemporal lobes was defined for computing correlations,using area definitions from the Talairach Daemon inAFNI (Lancaster et al., 2000) This ROI included Heschl’sgyrus, the superior, middle, and inferior temporal gyri,and the supramarginal gyrus in the left and right hemi-spheres. The correlation maps were thresholded at vox-elwise p < .03, and clusters smaller than 281 Al (5 voxels)were removed to obtain a corrected p < .05. An identicalprocedure was performed for N sounds, using the PostN–PreN contrast.
RESULTS
Behavioral
Accuracy and RT data from the identification and ABXtasks are shown in Figure 2. In the identification task,
Desai et al. 1177
both PreP and PreN conditions showed a continuous,mostly linear change in identification accuracy alongthe continuum (Figure 2A). This is consistent withthe suggestion that the participants did not have dis-crete representations for the sounds in either Pre con-ditions, and they did not spontaneously perceive the
P sine-wave stimuli as speech. In contrast, after theparticipants were informed about the phonetic natureof the P stimuli, their performance became morecategorical with them, in that the two ends of thecontinuum were consistently identified as /ba/ or /da/.This was not the case for the PostN condition, in
Figure 2. Performance of the subjects on the identification and discrimination tasks in Pre (naıve) and Post (informed) conditions. Errorbars indicate the standard error of the mean. (A) Accuracy and (B) RT in milliseconds (msec). ‘‘Across’’ and ‘‘Within’’ represent across- and
within-category discriminations, respectively.
1178 Journal of Cognitive Neuroscience Volume 20, Number 7
which there was no significant change from the PreNperformance.
The identification performances were assessed quan-titatively by entering the b coefficients (slope parame-ters) obtained by logistic regression into a two-wayrepeated-measures analysis of variance with factors fortraining (Pre vs. Post) and sound type (P vs. N). Therewas a main effect of training [F(1, 27) = 4.82, p < .037],a main effect of sound type [F(1, 27) = 6.78, p < .015],and an interaction [F(1, 27) = 6.32, p < .019]. Post hoccomparisons with Tukey’s HSD tests revealed a signifi-cant increase in b from PreP to PostP ( p < .013) but nochange in b from PreN to PostN ( p > .9).
On the discrimination task, performance did not varyin the Post condition compared to the Pre condition forboth P and NP sounds. AC accuracy was better than WCaccuracy in the PostP condition, consistent with cate-gorical perception in that condition. However, thisdifference was already present in the PreP condition,before subjects could categorize the P sounds. For the Nsounds, AC and WC discrimination did not differ foreither PreN or PostN conditions. A three-way repeated-measures analysis of variance was carried out withfactors for sound type (P, N), training (Pre, Post), andcontrast (AC, WC). There were main effects of soundtype [F(1, 27) = 6.15, p < .020], training [F(1, 27) =7.54, p < .011], and contrast [F(1, 27) = 59.79, p < 10�6].There was also an interaction between sound type andcontrast [F(1, 27) = 36.18, p < 10�5]. No other inter-actions were significant. Post hoc comparisons usingTukey’s HSD revealed that AC accuracy was higher thanWC accuracy in both PreP and PostP conditions (bothp < .0001). The increase in AC and WC accuracy fromPreP to PostP was not significant (both p > .32). Therewas no difference between AC and WC accuracy forPreN or PostN conditions, and the change in accuracyfrom PreN to PostN was also not significant (all p > .76).
The overall improvement in discrimination accuracy,from Pre to Post conditions, was the same for P and Nconditions. The mean improvement in P was 8.9% (SD =22.9), and in N it was 6.3% (SD = 12.7) ( p > .59).
The RT results (Figure 2B) largely mirrored the accu-racy data. In the identification task, RT was similar acrossmost of the continuum in the PreP and PreN conditions.In the PostP condition, there was a reduction in RT fortokens at either end of the continuum and an increasein RT at the middle of the continuum (Token ba4), cor-responding to the category boundary indicated by theaccuracy data. The discrimination RT results also mir-rored the accuracy data, in that RT was lower AC thanWC for both PreP and PostP conditions.
In summary, the behavioral data indicate that partic-ipants did not have discrete category representations foreither the P or N sounds in the Pre phase, but dividedthe P continuum into two perceptual categories in thePost phase. This change in categorization from nonpho-netic to phonetic perception was reflected by a shift inidentification but not in discrimination curves. Verbalreports of the participants after the Pre scan indicatedthat no participant had recognized the sounds in the Preconditions as speech.
Functional Magnetic Resonance Imaging
The fMRI results for various conditions and contrasts areshown in Figures 3 and 4. The Appendix lists peak andactivation cluster information for the contrasts. Com-pared to the baseline, each condition showed extensiveactivation that included bilateral temporal, frontal, andparietal areas (Figure 3).
PreP versus PreN
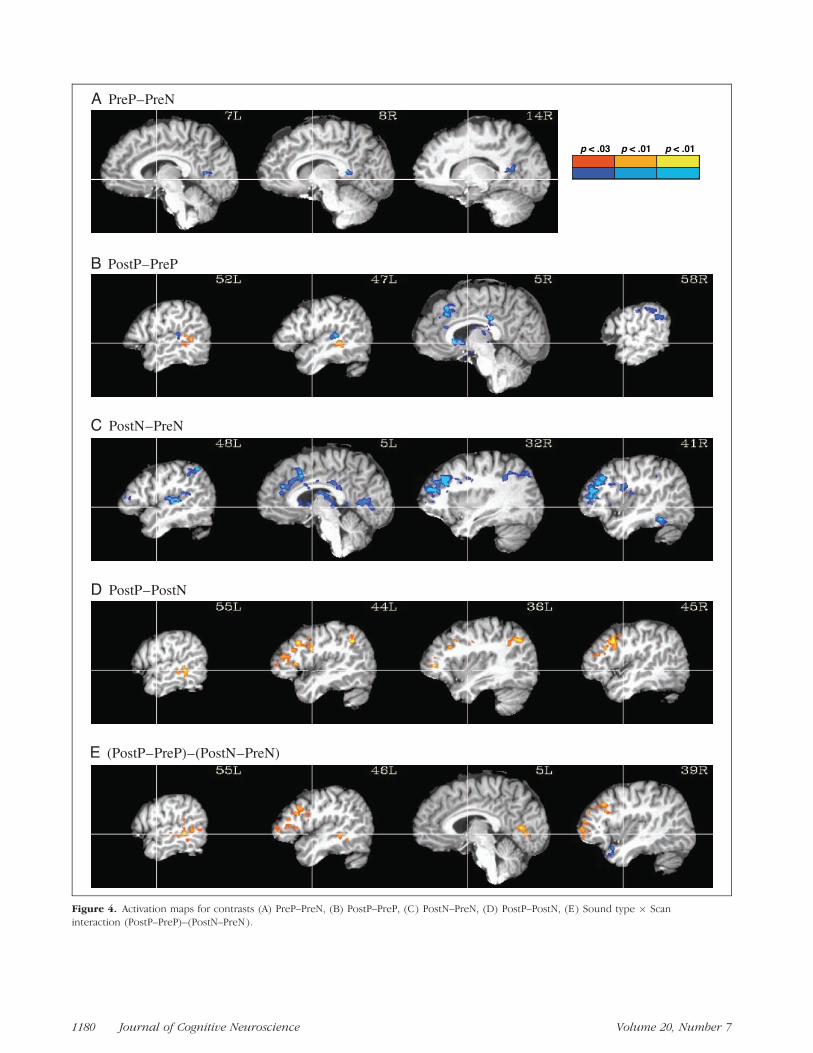
No areas were found to be more active for PreP, whereassmall clusters in the left and right posterior cingulategyrus were found to be more active for PreN (Figure 4A).
PostP versus PreP
In this critical contrast, the only area activated more forthe PostP condition was in the posterior left STG/STS.
Figure 3. Activation for each experimental condition compared to the baseline, overlaid on sagittal slices of an anatomical image of one
subject. Captions on each image indicate the lateral distance (mm) of the slice from the anterior-to-posterior commissure line in the right (R)
or left (L) hemisphere. All maps are thresholded at corrected p < .05. The crosshairs show the stereotaxic y- and z-axis.
Desai et al. 1179
Figure 4. Activation maps for contrasts (A) PreP–PreN, (B) PostP–PreP, (C) PostN–PreN, (D) PostP–PostN, (E) Sound type � Scan
interaction (PostP–PreP)–(PostN–PreN).
1180 Journal of Cognitive Neuroscience Volume 20, Number 7
A number of areas showed higher activation for the PrePcondition, including the bilateral posterior and anteriorcingulate gyrus and the basal ganglia. The right superiorand middle frontal gyri (SFG and MFG), precentralgyrus, and supramarginal gyrus (SMG), as well as a clus-ter on the left planum temporale, were also more activefor the PreP condition (Figure 4B).
PostN versus PreN
No areas were more active for the PostN condition com-pared to the PreN condition. A number of areas weremore active for the PreN condition, and these over-lapped to a large degree with those activated for thePreP condition in the previous contrast. These includedthe bilateral anterior and posterior cingulate gyrus, in-traparietal sulcus (IPS), basal ganglia, and MFG (right >left); the right precentral gyrus and fusiform gyrus; andthe left STG/planum temporale (Figure 4C).
PostP versus PostN
The left inferior frontal gyrus (IFG), IPS, STG/STS, andprecentral gyrus, as well as the bilateral MFG and pre-cuneus, and the right SFG, were activated more in thePostP than in the PostN condition. No areas were ac-tivated more for the PostN condition (Figure 4D).
(PostP � PreP) versus (PostN � PreN)
Some of the difference in activation between Pre andPost scans could be due simply to differences in taskdifficulty as a result of practice and training. Some of thistraining effect can be removed by comparing Post–Preactivation in phonetic and nonphonetic conditions (i.e.,the interaction between training and sound type). In thiscontrast, positively activated areas included the bilateral
MFG and IFG (right > left) and the posterior left STGand STS (Figure 4E). By comparison with the othercontrasts, it is apparent that the positive values in theleft STG/STS are due to a greater increase of activitywith training for the P than for the N sounds, where-as positive values in other areas are due to a largerdecrease in activity with training for the N soundsthan for the P sounds. The right anterior STG showednegative values in the interaction contrast, due mainlyto an increase in activation from the PreN to PostNcondition.
Correlation with Behavioral Data
Behavioral performance on both identification and dis-crimination tasks varied across participants. Subjectsalso varied in their ability to hear the sine-wave soundsas speech, presumably leading to variation in the degreeof categorical perception of the sounds. As noted in theMethods section, the CPI measures the change indegree of categorical identification, estimated by thechange in slope of the logistic regression curve, fromPre to Post scans. High values indicate a change fromcontinuous to categorical identification, whereas lowvalues indicate little change. The mean CPI for the Psounds (CPIP) was 1.24 (SD = 2.63), whereas the meanCPI for the N sounds (CPIN) was �0.08 (SD = 0.94). CPIP
and CPIN for individual subjects are shown in Figure 5.The individual variation in behavioral performance pro-vided an opportunity to examine whether the degree ofactivation in the different brain regions was correlatedwith the degree of change in categorical identificationexhibited behaviorally by the participants, as measuredby the CPI.
We correlated the CPIP for each participant with thelevel of activation in the PostP–PreP contrast in an ROIthat included the bilateral lateral temporal lobes and theSMG. Two clusters in the left STG/STS and SMG were
Figure 5. Categoricalperception index (CPI) for
phonetic and nonphonetic
sounds for individual subjects,sorted according to the
phonetic CPI. CPI measures
the change in categorical
perception from Pre toPost scans.
Desai et al. 1181
found to be correlated with the CPIP (Figure 6A). Ascatterplot of the individual training-induced activationin the PostP � PreP contrast at the maximally correlatedvoxel in the posterior STS (Talairach coordinates �52,�34, 7) plotted against individual CPIP values is shown inFigure 7A. Because Spearman’s rank correlation wasused, subjects’ rank is plotted on the x-axis.
We similarly correlated the CPIN with the level ofactivation in the PostN–PreN contrast in the same ROI.Although no additional information was provided aboutthe N sounds prior to the Post scan, some variation inCPIN was observed. The mean and variance in CPIN werenot as large as those of CPIP, as expected (across allsubjects, b did not change significantly between PreN
Figure 6. (A) Areas in the
lateral temporal lobes in the
PostP–PreP contrast that are
correlated with the CPI forP sounds (CPIP). (B) Areas in
the lateral temporal lobes in
the PostN–PreN contrast thatare correlated with the CPI for
N sounds (CPIN).
Figure 7. Scatterplot of
peak activation and CPI. (A)Activation at �52, �34, 7 in the
PreP–PostP contrast and CPI
for P sounds. (B) Activation
at �56, �50, 18 in thePostN–PreN contrast and
the CPI for N sounds.
1182 Journal of Cognitive Neuroscience Volume 20, Number 7
and PostN, as mentioned in the behavioral results). Wewere interested, however, in testing whether changesin categorical perception of nonspeech sounds mightbe correlated with the level of activation in temporalregions and whether the regions emerging in this anal-ysis would overlap with those found to be sensitiveto speech categorization. A cluster in the left SMG, ex-tending into the posterior STS, was found to be corre-lated with the CPIN. Smaller clusters in the left anteriorMTG and right SMG were also correlated with CPIN
(Figure 6B). A scatterplot of the individual level ofactivation at the maximally correlated voxel in the leftSMG (Talairach coordinates �56, �50, 18) plottedagainst the individual CPIN is shown in Figure 7B.
We then examined whether the area in the leftposterior STG/STS that was correlated with CPIP in thePostP–PreP contrast was also correlated with CPIN in thePostN–PreN contrast. To this end, a spherical ROI withradius of 10 mm centered at the peak of the cluster inSTS (Talairach coordinates �52, �34, 7) was created.Activation in the PostN–PreN contrast was correlatedwith CPIN (voxelwise p < .03, corrected p < .05) in asmall cluster within this ROI (peak Talairach coordinates�51, �39, 10; cluster volume 94 Al).
Finally, we examined whether the correlations be-tween CPI and the Pre to Post change in level of activa-tion in the left posterior temporal region could beexplained by the small general improvement in dis-crimination ability from Pre to Post scans rather thanby changes in categorization ability. Overall change indiscrimination (combining WC and AC trials) was cal-culated for each subject for both P and N sounds andcorrelated with the activation in the spherical ROI definedabove, for PostP–PreP and PostN–PreN contrasts, respec-tively. No correlation between level of activation and over-all change in discrimination was found in either analyses.
DISCUSSION
Behavioral Data
The identification functions suggest that perception ofthe P sounds shifted from continuous to dichotomousafter subjects were informed of the phonetic potential ofthe sounds, indicative of categorical perception. Percep-tion of the N sounds remained continuous in both Preand Post conditions.
The discrimination results were consistent with cate-gorization of the P sounds in the Post condition andcontinuous perception of the NP sounds in both the Preand the Post conditions. However, the advantage for ACdiscrimination over WC discrimination for P sounds inthe Pre condition was unexpected in light of the con-tinuous identification function and the fact that subjectsreported not hearing the sounds as speech in thatcondition. Interestingly, a similar effect was observedby Dehaene-Lambertz et al. (2005), who reported a small
but significant advantage for the AC sine-wave /ba/–/da/discrimination relative to the WC discrimination in thenaıve subjects. It is possible that the AC advantage inthe naıve condition in both of these studies reflects aphysical discontinuity in the sine-wave continuum thatcoincides with the phonetic category boundary. Schwab(1981) observed that naıve listeners to sine-wave speechanalogs could label as accurately as informed listenerssounds in which the first and second formants (F1 andF2, respectively) spectral transitions changed in thesame direction (such as in /ba/) but were less accuratewhen changes were in opposite directions (such as in/da/). The change in direction of the F2 transition thatoccurs at the boundary between /ba/ and /da/ mayfacilitate the discrimination between them in the naıvecondition. Subjects may have been able to capitalize onthis perceptual discontinuity in the phonetic continuumduring the discrimination but not the identification taskin the naıve condition. This is because the latter taskrelies on retrieval of internal representations of thesound categories and the only representations availableto them for the sine-wave speech analogs in the naıvestate were the trained anchor points. The discriminationresults for N sounds were consistent with their contin-uous perception, with no accuracy or RT differencesacross the continuum. A perceptual discontinuity akin tothat in the phonetic continuum did not occur in thenonphonetic continuum, possibly because in that con-tinuum the F1 and F2 transitions, which contain the bulkof the sound energy and are the main cues for identifi-cation of the sounds, never closely covaried in direction.In that continuum, F1 changed from a falling pattern to adip whereas F2 concurrently changed from a rising pat-tern to a falling pattern.
fMRI Data
Phonetic Perception in the Posterior STS
Compared to the PreP condition, the PostP conditionmore strongly activated an area in the left middle/posterior STS (approximately between Talairach y =�30 and y = �40). Activation in this general regionhas been reported in a number of previous studiescomparing speech sounds to nonspeech sounds, butthe interpretation of these differences has been prob-lematic. For example, the lateral STG/STS (L > R) wasactivated for words > tones, pseudowords > tones, andreversed speech > tones contrasts in a study by Binderet al. (2000). Because the activation did not appear todepend on the phonetic intelligibility of the stimuli,these authors raised the possibility that it may havebeen due simply to the greater spectro-temporal com-plexity of the speech and reversed speech soundscompared to the tones. Liebenthal et al. (2005) subse-quently compared CV syllables and nonspeech soundsof comparable acoustic complexity, and found greater
Desai et al. 1183
activation for the speech sounds in a similar region. Inthat study, the left STG/STS activation could not be at-tributed to the acoustic properties of the speech soundsor to differences in task demands between the speechand nonspeech conditions because the speech andnonspeech sounds were closely matched in spectro-temporal complexity, harmonic structure and period-icity, and task performance was equivalent betweenthe conditions. However, the differential STG/STS acti-vation could be attributed either to the linguistic na-ture of the speech stimuli, their categorical perception,or their familiarity. Dehaene-Lambertz et al. (2005)also found activation in the left posterior STS for sine-wave speech stimuli in the informed compared to thenaıve condition. However, a nonspeech condition wasnot included in the Dehaene-Lambertz study to con-trol for stimulus repetition and practice effects betweenthe naıve and the informed scans. A similar pattern offMRI activation was also reported by Mottonen et al.(2006) using a mixed-effects analysis in a sine-wavespeech perception task. Behavioral measures of thedegree of speech or nonspeech perception, however,were not reported in this study. The analysis was alsorestricted to a small posterior temporal ROI, so theeffects in other regions were not clear. The presentstudy goes a step further in showing unequivocallythat activation in the left posterior STS region duringspeech perception cannot be attributed to the spectro-temporal complexity or familiarity of speech, or to prac-tice effects.
In this study, the PostP > PostN activation highlightsthe difference between perception of phonetic and non-phonetic sounds, while controlling for the effects of taskpractice and habituation to the stimuli. This contrastrevealed a focus in the left STS near the focus found forPostP > PreP. Activation in the same left posterior STG/STS region was also observed in the interaction betweensound type (P, N) and scan (Pre, Post), consistent withthe suggestion that it is due to perception of the sine-wave phonetic analogs as speech.
Effects of Practice and Habituation
A number of areas activated more in the PreP comparedto the PostP condition, such as the anterior cingulategyrus, basal ganglia, SFG, and MFG, have been associat-ed with general task difficulty, attention, working mem-ory, decision making, and response selection processes(Culham & Kanwisher, 2001; Bush, Luu, & Posner, 2000;Duncan & Owen, 2000). Very similar areas were alsoactivated for the PreN condition compared to the PostNcondition. We suggest that with practice and repeatedexposure to the task and stimuli, the subjects becamemore efficient at the task in Post conditions comparedto Pre conditions, requiring fewer resources for taskperformance. Similar fronto-parietal areas were alsoactivated in the PostP > PostN contrast, in which both
conditions have similar practice effects. The PostP condi-tion, however, is associated with additional informationabout sound categories. This activation likely reflectsworking memory and decision-making processes en-gaged when attempting to map sounds onto knowncategories, which are absent from the PostN condition.
There was also an area on the left mid/dorsal STG,including the planum temporale, which was activatedmore for the PreP compared to PostP condition, andalso for the PreN compared to PostN condition. Thedecrease in activity from Pre to Post in this regionmay represent the habituation of early auditory pro-cessing stages due to repeated exposure to the samestimuli. This area was not activated in the PostP–PostNcomparison, likely because both the PostP and PostNconditions entail similar habituation effects. Altogether,these results demonstrate a clear dissociation of func-tion between the dorsal STG/planum temporale, whichis sensitive to a wide variety of sounds and showshabituation to repeated sine-wave sounds, and the moreventral STG/STS, which is associated with representa-tion of more abstract categorical properties of thesounds, showing an increased response when the samesounds can be mapped onto categories (Hall, Hart, &Johnsrude, 2003; Griffiths & Warren, 2002; Binder et al.,2000; Binder, Frost, Hammeke, Rao, & Cox, 1996).
Correlations with Behavioral Data
We hypothesized that if activation in the posterior STS/STG region is associated with the categorical percep-tion of sounds, the level of this activation should becorrelated with a behavioral index of the degree ofcategorical perception. As predicted, a voxelwise cor-relation analysis conducted on left and right temporallobe ROIs showed an area in the posterior STG/STS thatwas correlated with CPI. The subjects with a larger CPIalso showed greater activation in the PostP–PreP con-trast in this region. Activation in this region was notcorrelated with the overall improvement in discrimina-tion ability.
The inclusion of the N conditions in the experimentprovided an opportunity to examine whether the pos-terior STS activation was specific to phonetic categori-zation, or was related to categorical perception ingeneral. Although this study was not designed to inducechanges in CPIN and a significant systematic change wasneither expected nor observed, there were small indi-vidual variations in CPIN. Some subjects appear to havedeveloped weak categories for the N sounds (smallpositive changes in the CPIN), perhaps encouraged bythe identification training and testing procedures. A fewother subjects apparently suppressed these categoricalrepresentations (small negative changes in the CPIN;Figure 5). The ROI analysis showed that an area in theposterior STS (near y = �40) in the PostN–PreN con-trast was positively correlated with CPIN. The magnitude
1184 Journal of Cognitive Neuroscience Volume 20, Number 7
and extent of the correlated area were small, possiblydue to the fact that the variation in CPIN was also small.Nevertheless, this association of the posterior STS withcategorical perception of nonphonetic sounds tenta-tively suggests that this region is not just sensitive towell-learned phonetic representations, but also to re-cently learned nonphonetic categories. Regions in theinferior SMG/posterior STG were also correlated withthe degree of improvement in categorical identification,more strongly for N sounds. The SMG has been sug-gested to subserve acoustic–phonetic recoding (Hickok& Poeppel, 2000; Caplan, Gow, & Makris, 1995). SMGactivation is also reported in training studies in whicha nonnative sound category is learned (Golestani &Zatorre, 2004; Callan et al., 2003), and differences inthe white matter volume near the SMG are associatedwith the ability to learn novel sounds (Golestani, Paus, &Zatorre, 2002). Along with the current results, theseresults are consistent with the suggestion that theSMG plays a role in representing or learning auditorycategories in general, not just phonetic ones.
Conclusions
Physically identical auditory stimuli can engage differ-ent areas of the brain or engage the same area todifferent degrees, depending on whether they are per-ceived as phonetic or nonphonetic. An area in the leftposterior STS, surrounding Talairach y = �40, is acti-vated more when sine-wave speech analogs are per-ceived as speech and can be associated with learnedphoneme categories. Unlike activations in most com-parisons of speech and nonspeech stimuli, this acti-vation cannot be attributed to acoustic differencesbetween the stimuli. Activation in this region is alsocorrelated with the degree of categorical identificationof phonetic, and also to some extent, nonphoneticsounds. We therefore infer that in this brain region,prelinguistic representations of auditory inputs activatecategory representations. The left SMG also plays a rolein the categorical perception of auditory information,perhaps particularly in the learning of novel soundcategories.
APPENDIX
The location of activation peaks in various contrasts. The volume of the cluster (Al), the mean and maximum z-scoreof the cluster, the location of the peaks in the atlas of Talairach and Tournoux (1988), and approximate Brodmann’sareas (BAs) of the peaks are reported. Multiple peaks are reported for some of the larger clusters.
Volume Mean Max x y z Structure Approx. BA
(a) PreP–PreN
PreP > PreN
None
PreN > PreP
759 �2.5 �3.7 8 �43 10 R poCiG 29
�3.1 17 �62 18 R Precuneus 31
742 �2.5 �3.4 �7 �60 9 L Cuneus 30
(b) PostP–PreP
PostP > PreP
1066 2.6 3.4 �51 �43 5 L STS 21/22
3.3 �58 �33 5 L STG 22
3.2 �47 �31 �1 L STS 21/22
PreP > PostP
8470 �2.7 �5.4 7 �28 31 R poCiG 31
�4.8 �17 14 3 L Putamen
�4.8 3 17 1 R Caudate
�3.5 �12 �20 6 L Thalamus
�3.4 19 �2 �21 R Uncus 34
�2.9 1 �9 36 R CiG 24
3693 �2.6 �4.0 5 25 43 R SFG 8
Desai et al. 1185
APPENDIX (continued)
Volume Mean Max x y z Structure Approx. BA
�3.5 �11 37 6 L antCiG
�3.3 12 30 20 R antCiG 32
�3.3 �13 22 26 R antCiG 32
1104 �2.6 �4.3 61 �41 31 R SMG 40
�3.4 56 �18 39 R prCG 4
1020 �2.5 �4.0 28 �36 1 R Hippocampus
�3.3 �22 �32 �19 L Culmen
983 �2.5 �3.6 31 32 26 R MFG 9
847 �2.6 �3.9 �46 �29 10 L STG/HG 41
(c) PostN–PreN
PostN > PreN
None
PreN > PostN
12683 �2.8 �4.8 35 37 26 R MFG 9
�3.7 47 10 37 R MFG 8/9
�3.7 39 1 21 R prCG 6/13
�2.7 48 10 4 R prCG 13
10411 �2.7 �5.0 12 12 3 R Caudate
�4.9 3 �10 10 R Thalamus
�4.6 �21 11 9 L Putamen
6099 �2.7 �4.7 �1 17 37 L antCiG 32
�4.1 �7 37 24 L antCiG 32
�3.4 �6 �6 32 L CiG 24
3533 �2.5 �4.2 7 �69 40 R Precuneus 7
�3.7 24 �67 21 R Precuneus 31
�3.3 31 �45 35 R IPS 40
�3.2 24 �87 29 R Cuneus 18/19
3190 �2.7 �4.0 �50 �24 9 L STG/HG 41
�3.7 �61 �22 26 L SMG 40
2217 �2.6 �4.1 �48 �50 47 L IPS 7/40
�2.9 �27 �59 33 L IPS
2100 �2.6 �4.0 �43 37 13 L IFG 46
�3.6 �33 28 28 L MFG 9
1874 �2.5 �3.5 5 �34 25 R poCiG 23
1541 �2.6 �3.7 0 �73 �3 LG 18
817 �2.6 �3.6 41 �46 �15 R FG 37
(d) PostP–PostN
PostP > PostN
3034 2.6 4.2 46 12 37 R MFG 9
1186 Journal of Cognitive Neuroscience Volume 20, Number 7
APPENDIX (continued)
Volume Mean Max x y z Structure Approx. BA
1938 2.5 3.4 5 �79 40 R Precuneus 7/19
1848 2.6 4.0 �40 �57 39 L IPS 7
3.4 �25 �71 35 L IPS 19
1776 2.6 3.9 �44 0 26 L prCG 6
1298 2.5 3.8 �37 41 6 L IFS 46
3.5 �44 20 8 L IFG 44/45
1006 2.5 3.3 18 50 20 R SFG 10
736 2.6 3.4 �55 �36 0 L STS 21/22
PostN > PostP
None
(e) (PostP–PreP)–(PostN–PreN)
(PostP–PreP) > (PostN–PreN)
1569 2.5 3.9 25 20 37 R MFG 8
3.5 45 21 27 R MFG 46
3.0 28 56 23 R SFG 10
1543 2.5 3.6 �51 �33 �1 L STS 21/22
3.2 �52 �17 2 L STG 22
3.1 �54 �44 6 L STS 21/22
1495 2.5 3.7 43 34 12 R IFG 46
3.0 43 24 8 R IFG 13
979 2.5 3.4 �6 �64 8 L Cuneus 18/30
942 2.5 3.7 �36 40 6 L IFS 46
3.3 �43 19 7 L IFG 44/45
737 2.5 3.2 �49 16 34 L MFG 9
(PostN–PreN) > (PostP–PreP)
2033 �2.5 �3.8 29 10 �31 R STG 38
(f) Temporal Lobe Areas in PostP–PreP Correlated with Behavioral CP Index
764 2.53 4.46 �52 �34 7 L poSTG/STS 22
324 2.54 3.54 �54 �47 19 L poSTG/SMG 40/22
(g) Temporal Lobe Areas in PostN–PreN Correlated with Behavioral CP Index
This study was supported by NIH grant R01 DC 006287-01 (E. L.)and NIH GCRC M01 RR00058. We thank Stephanie Spitzer forhelp in preparing the sine-wave stimuli, Anjali Desai for helpwith data analysis, and Jason Bacon for writing the sine-wavesynthesis software WaveGen used to generate the stimuli.
Reprint requests should be sent to Rutvik Desai, Departmentof Neurology, Medical College of Wisconsin, 8701 WatertownPlank Rd., MEB 4550, Milwaukee, WI 53226, or via e-mail:[email protected].
REFERENCES
Best, C. T., Studdert-Kennedy, M., Manuel, S., & Rubin-Spitz, J.(1989). Discovering phonetic coherence in acousticpatterns. Perception & Psychophysics, 45, 237–250.
Binder, J. R., Frost, J. A., Hammeke, T. A., Bellgowan, P. S.,Springer, J. A., Kaufman, J. N., et al. (2000). Humantemporal lobe activation by speech and nonspeechsounds. Cerebral Cortex, 10, 512–528.
Binder, J. R., Frost, J. A., Hammeke, T. A., Rao, S. M., & Cox,R. W. (1996). Function of the left planum temporale inauditory and linguistic processing. Brain, 119, 1239–1247.
Bush, G., Luu, P., & Posner, M. I. (2000). Cognitive andemotional influences in anterior cingulate cortex. Trends inCognitive Sciences, 4, 215–222.
Callan, D. E., Tajima, K., Callan, A. M., Kubo, R., Masaki, S., &Akahane-Yamada, R. (2003). Learning-induced neuralplasticity associated with improved identificationperformance after training of a difficult second-languagephonetic contrast. Neuroimage, 19, 113–124.
Caplan, D., Gow, D., & Makris, N. (1995). Analysis of lesions byMRI in stroke patients with acoustic–phonetic processingdeficits. Neurology, 45, 293–298.
Cohen, J. D., MacWhinney, B., Flatt, M., & Provost, J. (1993).PsyScope: A new graphic interactive environment fordesigning psychology experiments. Behavioral ResearchMethods, Instruments, and Computers, 25, 257–271.
Cox, R. W. (1996). AFNI: Software for analysis and visualizationof functional magnetic resonance neuroimages. Computersand Biomedical Research, 29, 162–173.
Cox, R. W., & Jesmanowicz, A. (1999). Real-time 3D imageregistration of functional MRI. Magnetic Resonance inMedicine, 42, 1014–1018.
Crowder, R. G. (1982). A common basis for auditory sensorystorage in perception and immediate memory. Perception &Psychophysics, 31, 477–483.
Culham, J. C., & Kanwisher, N. G. (2001). Neuroimaging ofcognitive functions in human parietal cortex. CurrentOpinions in Neurobiology, 11, 157–163.
Davis, M. H., & Johnsrude, I. S. (2003). Hierarchical processingin spoken language comprehension. Journal ofNeuroscience, 23, 3423–3431.
Dehaene-Lambertz, G., Pallier, C., Serniclaes, W.,Sprenger-Charolles, L., Jobert, A., & Dehaene, S.(2005). Neural correlates of switching from auditory tospeech perception. Neuroimage, 24, 21–33.
Demonet, J. F., Chollet, F., Ramsay, S., Cardebat, D., Nespoulous,J. L., Wise, R., et al. (1992). The anatomy of phonological andsemantic processing in normal subjects. Brain, 115, 1753–1768.
Duncan, J., & Owen, A. M. (2000). Common regions of thehuman frontal lobe recruited by diverse cognitive demands.Trends in Neurosciences, 23, 475–483.
Golestani, N., Paus, T., & Zatorre, R. J. (2002). Anatomicalcorrelates of learning novel speech sounds. Neuron, 35,997–1010.
Golestani, N., & Zatorre, R. J. (2004). Learning new sounds ofspeech: Reallocation of neural substrates. Neuroimage, 21,494–506.
Griffiths, T. D., & Warren, J. D. (2002). The planum temporale asa computational hub. Trends in Neurosciences, 25, 348–353.
Hall, D. A., Hart, H. C., & Johnsrude, I. S. (2003). Relationshipsbetween human auditory cortical structure and function.Audiology & Neuro-Otology, 8, 1–18.
Harnad, S. (2003). Categorical perception. In Encyclopedia ofcognitive science. London: Macmillan, Nature Publishing Group.
Hickok, G., & Poeppel, D. (2000). Towards a functionalneuroanatomy of speech perception. Trends in CognitiveSciences, 4, 131–138.
Hosmer, D. J., & Lemeshow, S. (2004). Applied logisticregression (2nd ed.). New York: Wiley.
Lancaster, J. L., Woldorff, M. G., Parsons, L. M., Liotti, M.,Freitas, C. S., Rainey, L., et al. (2000). Automated Talairachatlas labels for functional brain mapping. Human BrainMapping, 10, 120–131.
Liebenthal, E., Binder, J. R., Piorkowski, R. L., & Remez, R. E.(2003). Short-term reorganization of auditory cortex inducedby phonetic expectation. Journal of CognitiveNeuroscience, 15, 549–558.
Liebenthal, E., Binder, J. R., Spitzer, S. M., Possing, E. T., &Medler, D. A. (2005). Neural substrates of phonemicperception. Cerebral Cortex, 15, 1621–1631.
Mottonen, R., Calvert, G. A., Jaaskelainen, I. P., Matthews,P. M., Thesen, T., Tuomainen, J., et al. (2006). Perceivingidentical sounds as speech or non-speech modulates activityin the left posterior superior temporal sulcus. Neuroimage,30, 563–569.
Mummery, C. J., Ashburner, J., Scott, S. K., & Wise, R. J.(1999). Functional neuroimaging of speech perception insix normal and two aphasic subjects. Journal of theAcoustical Society of America, 106, 449–457.
Obleser, J., Boecker, H., Drzezga, A., Haslinger, B.,Hennenlotter, A., Roettinger, M., et al. (2006). Vowel soundextraction in anterior superior temporal cortex. HumanBrain Mapping, 27, 562–571.
Oldfield, R. C. (1971). The assessment and analysis ofhandedness: The Edinburgh inventory. Neuropsychologia,9, 97–113.
Remez, R. E., Pardo, J. S., Piorkowski, R. L., & Rubin, P. E.(2001). On the bistability of sine wave analogues of speech.Psychological Science, 12, 24–29.
Remez, R. E., Rubin, P. E., Pisoni, D. B., & Carrell, T. D. (1981).Speech perception without traditional speech cues. Science,212, 947–949.
Repp, B. H., Healy, A. F., & Crowder, R. G. (1979). Categoriesand context in the perception of isolated steady-statevowels. Journal of Experimental Psychology: HumanPerception and Performance, 5, 129–145.
Schwab, E. (1981). Auditory and phonetic processing fortone analogs of speech. Buffalo, NY: State University ofNew York, Buffalo.
Scott, S. K., Blank, C. C., Rosen, S., & Wise, R. J. S. (2000).Identification of a pathway for intelligible speech in the lefttemporal lobe. Brain, 123, 2400–2406.
Talairach, J., & Tournoux, P. (1988). Co-planar stereotaxicatlas of the human brain. New York: Thieme.
Uppenkamp, S., Johnsrude, I. S., Norris, D., Marslen-Wilson,W., & Patterson, R. D. (2006). Locating the initial stages ofspeech–sound processing in human temporal cortex.Neuroimage, 31, 1284–1296.
Ward, B. D. (2000). Simultaneous inference for fMRI data.AFNI manual.
Ward, B. D. (2001). Deconvolution analysis of fMRI time seriesdata. AFNI manual.
1188 Journal of Cognitive Neuroscience Volume 20, Number 7