2002 Data Book The Texas Department of Protective and Regulatory Services 35 Legal Responsibility for Child Protective Services Statutory References Social Security Act Texas Family Code Human Resources Code Major Provisions • Definitions of abuse and neglect of children; • Mandatory reporting of suspected abuse or neglect of children; • Prepare and disseminate statistics by county relating to CPS in an annual report made available to the legislature and general public; • Responsibility for receiving reports of suspected abuse or neglect of children; • Responsibility for thorough investigation of a report of child abuse or neglect allegedly committed by a person responsible for a child’s care, custody or welfare; • Responsibility to assign priorities and prescribe investigative procedures for investigations based on the severity and immediacy of the alleged harm to the child; • Take action to protect abused and neglected children from further harm; • Establish review teams to evaluate department casework and decision-making related to investigations of child abuse or neglect. • Employ a CPS investigations coordinator (Risk Director) to conduct staff reviews and evaluations of cases determined to involve high risk, monitor cases with multiple referrals, and approve decisions and assessments related to investigations which involve a high risk to the health or safety of a child. • Work with children and their families, providing services to prevent further abuse, help alleviate the effects of the abuse suffered, prevent removal of the child from the home, and provide reunification services when appropriate for the return of the child to the home; • When necessary, secure appropriate court orders and take possession of a child if there is an immediate danger to the physical health or safety of the child or the child has been a victim of neglect or sexual abuse and that continuation in the home would be contrary to the child’s welfare; • Make reasonable efforts to secure the return of the child; • Develop a service plan in conference with the child’s parents to determine return of the child to the child’s parents, termination of parental rights and placement of the child for adoption, or because of the child’s special needs or exceptional circumstances continue the child’s care out of the child’s home; • Provide substitute care for children until the problems have been sufficiently resolved; • Provide permanent placement for children who cannot safely return to their home. • Establish a database of all verified foster homes willing to accept foster care placement of a child in care; • Recruit potential adoptive parents for children whose parents have had their parental rights terminated.
Transcript
2002 Data Book The Texas Department of Protective and Regulatory Services
35
Legal Responsibility for Child Protective Services Statutory References
Social Security Act Texas Family Code Human Resources Code
Major Provisions
• Definitions of abuse and neglect of children; • Mandatory reporting of suspected abuse or neglect of children; • Prepare and disseminate statistics by county relating to CPS in an annual report made available to the
legislature and general public; • Responsibility for receiving reports of suspected abuse or neglect of children; • Responsibility for thorough investigation of a report of child abuse or neglect allegedly committed by a
person responsible for a child’s care, custody or welfare; • Responsibility to assign priorities and prescribe investigative procedures for investigations based on the
severity and immediacy of the alleged harm to the child; • Take action to protect abused and neglected children from further harm; • Establish review teams to evaluate department casework and decision-making related to investigations of
child abuse or neglect. • Employ a CPS investigations coordinator (Risk Director) to conduct staff reviews and evaluations of
cases determined to involve high risk, monitor cases with multiple referrals, and approve decisions and assessments related to investigations which involve a high risk to the health or safety of a child.
• Work with children and their families, providing services to prevent further abuse, help alleviate the effects of the abuse suffered, prevent removal of the child from the home, and provide reunification services when appropriate for the return of the child to the home;
• When necessary, secure appropriate court orders and take possession of a child if there is an immediate danger to the physical health or safety of the child or the child has been a victim of neglect or sexual abuse and that continuation in the home would be contrary to the child’s welfare;
• Make reasonable efforts to secure the return of the child; • Develop a service plan in conference with the child’s parents to determine return of the child to the
child’s parents, termination of parental rights and placement of the child for adoption, or because of the child’s special needs or exceptional circumstances continue the child’s care out of the child’s home;
• Provide substitute care for children until the problems have been sufficiently resolved; • Provide permanent placement for children who cannot safely return to their home. • Establish a database of all verified foster homes willing to accept foster care placement of a child in care; • Recruit potential adoptive parents for children whose parents have had their parental rights terminated.
2002 Data Book The Texas Department of Protective and Regulatory Services
36
Concepts Guiding Risk Determination
Child Vulnerability Home Environment Caregiver Capability Quality of Care Child Fragility Stressors Knowledge Quality of connection Child Behavior Dangerous Exposure Skills Emotional care Capacity Physical care
Social Environment Response to CPS Maltreatment Pattern Social climate Attitude Chronicity Social violence Deception Current severity Trends
Fiscal Year 2002 Expenditures and Staffing CPS Staff Costs $225,453,368
4,689 Direct Delivery (supervisors, workers, clerical) 5,069 Total Staff
Purchased Services $50,815,798
• Counseling/Evaluation/Testing • Homemaker Services • Parent/Community Groups • Post Adoption Services Program • Day Care Services . . . and many more
Foster Care Payments $300,376,050 Adoption Subsidy Payments $83,194,340 Federally Funded Special Projects, Staff Costs and Purchased Services $2,812,033 21 Total Staff
2002 Data Book The Texas Department of Protective and Regulatory Services
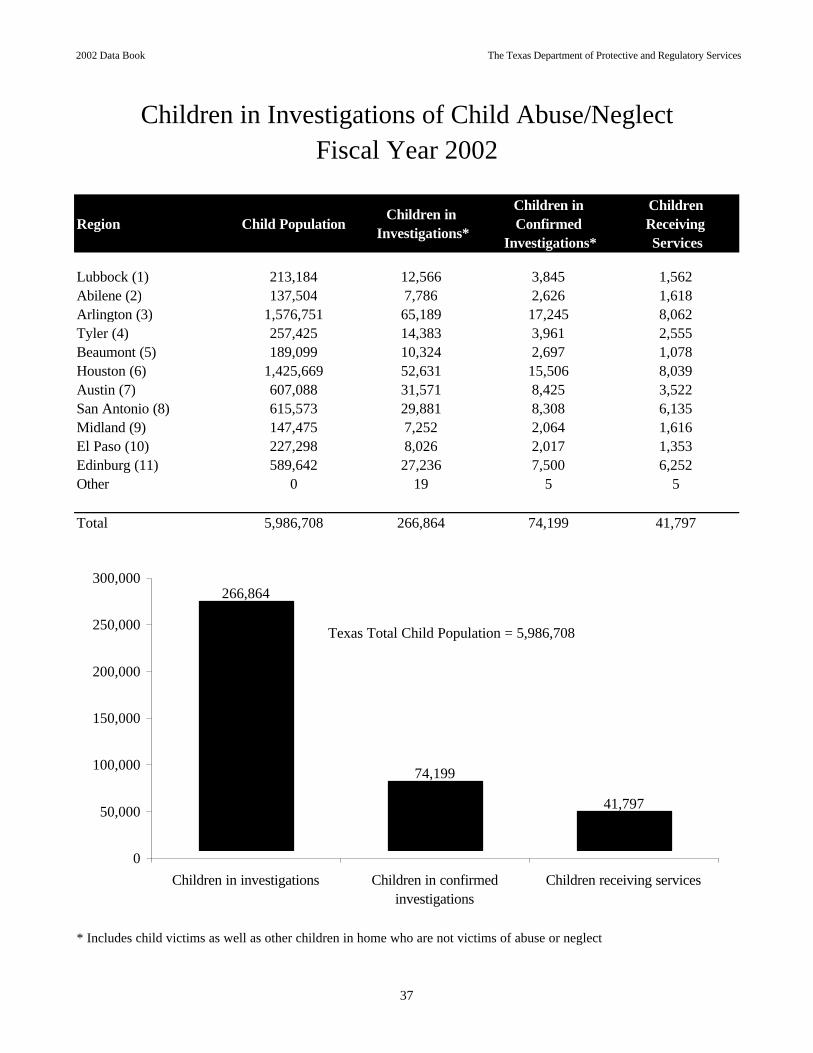
Region Child Population Children in Investigations*
* Includes child victims as well as other children in home who are not victims of abuse or neglect
Children in Investigations of Child Abuse/NeglectFiscal Year 2002
266,864
74,199
41,797
0
50,000
100,000
150,000
200,000
250,000
300,000
Children in investigations Children in confirmedinvestigations
Children receiving services
Texas Total Child Population = 5,986,708
37
2002 Data Book The Texas Department of Protective and Regulatory Services
38
Texas Total Child Population Ages Birth Through 17 Years by County
Fiscal Year 2002
State Total 5,986,708
Region 7 607,088
6 Region 5 189,099
10
Region 9 147,475
Region 1 213,184
Region 2 137,504 Region 3
1,576,751 Region 4 257,425
Region 6 1,425,669
Region 11 589,642
Region 8 615,573
Region 10 227,298
1
2 34
57
11
8
9
Population
Under 2,000 2,000 to 5,000 5,000 to 10,000 10,000 to 50,000 50,000 to 100,000 100,000 and Over Population data source: Texas State Data Center, Texas A&M University
2002 Data Book The Texas Department of Protective and Regulatory Services
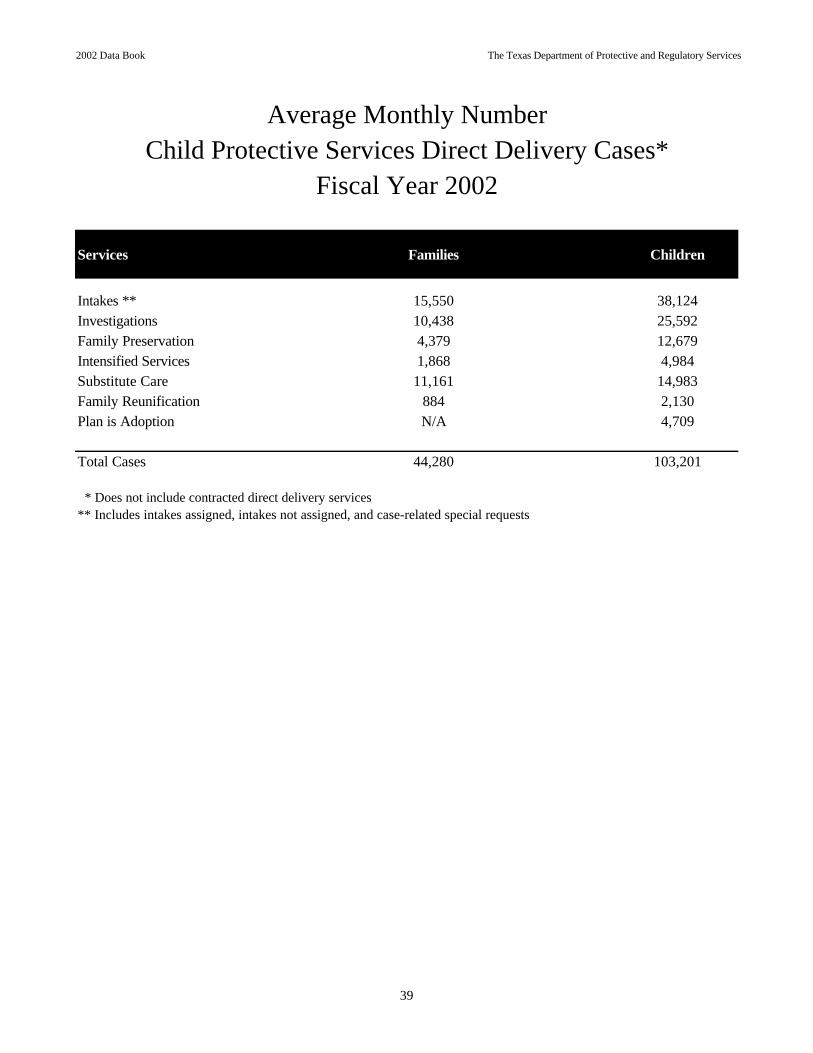
* Does not include contracted direct delivery services** Includes intakes assigned, intakes not assigned, and case-related special requests
Average Monthly NumberChild Protective Services Direct Delivery Cases*
Fiscal Year 2002
39
2002 Data Book The Texas Department of Protective and Regulatory Services
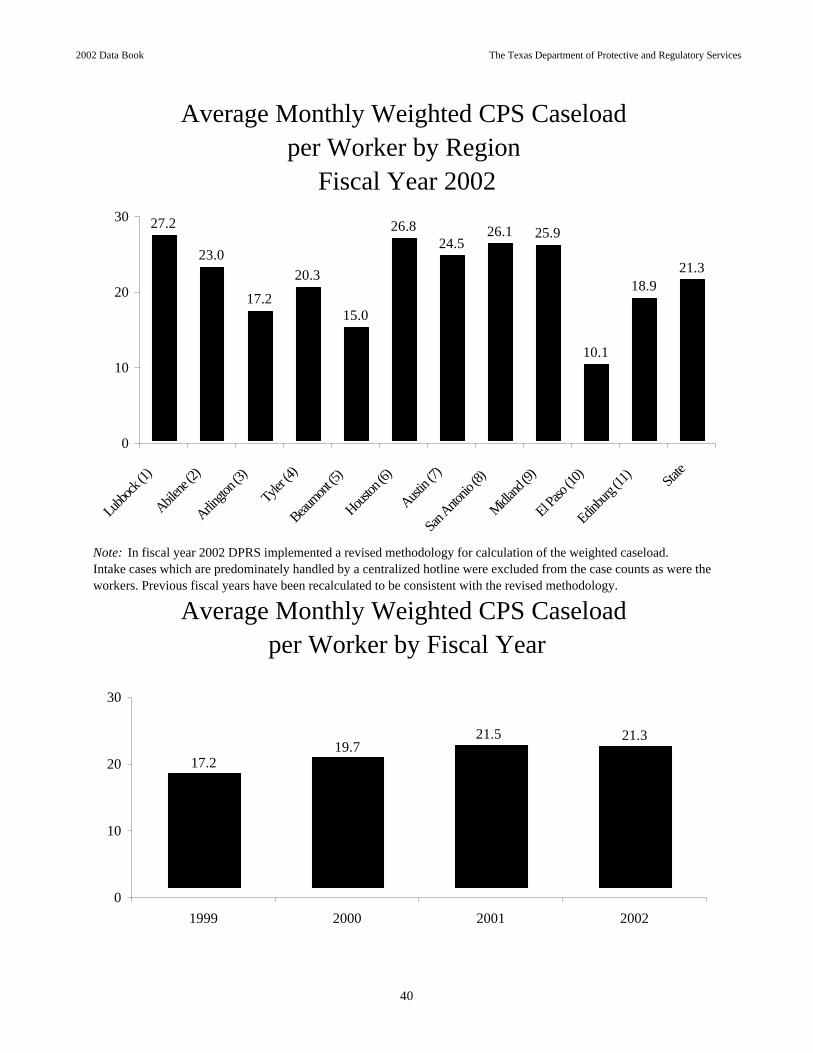
Note: In fiscal year 2002 DPRS implemented a revised methodology for calculation of the weighted caseload. Intake cases which are predominately handled by a centralized hotline were excluded from the case counts as were theworkers. Previous fiscal years have been recalculated to be consistent with the revised methodology.
Average Monthly Weighted CPS Caseload
Fiscal Year 2002
Average Monthly Weighted CPS Caseload per Worker by Fiscal Year
per Worker by Region
27.2
23.0
17.2
20.3
15.0
26.824.5
26.1 25.9
10.1
18.921.3
0
10
20
30
Lubbock
(1)
Abilene
(2)
Arlingto
n (3)
Tyler (4
)
Beaumont
(5)
Houston
(6)
Austin (
7)
San Anto
nio (8)
Midland
(9)
El Paso
(10)
Edinbur
g (11) Sta
te
21.321.519.7
17.2
0
10
20
30
1999 2000 2001 2002
40
2002 Data Book The Texas Department of Protective and Regulatory Services
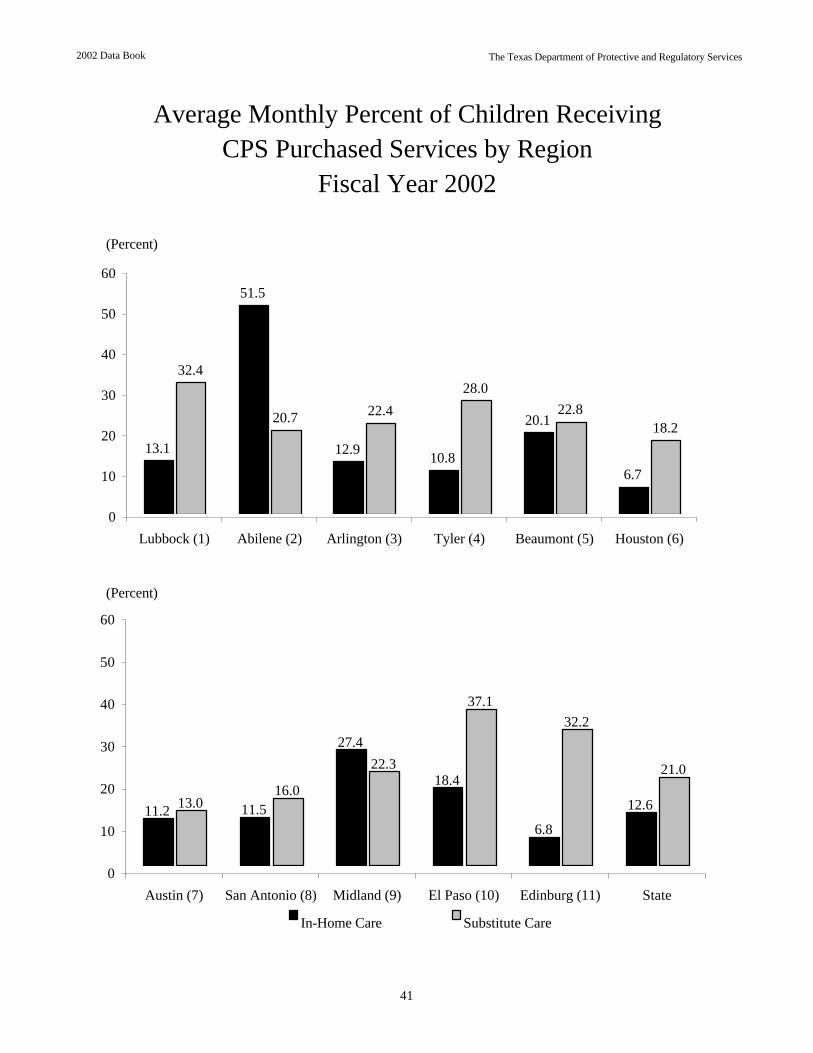
Average Monthly Percent of Children Receiving CPS Purchased Services by Region
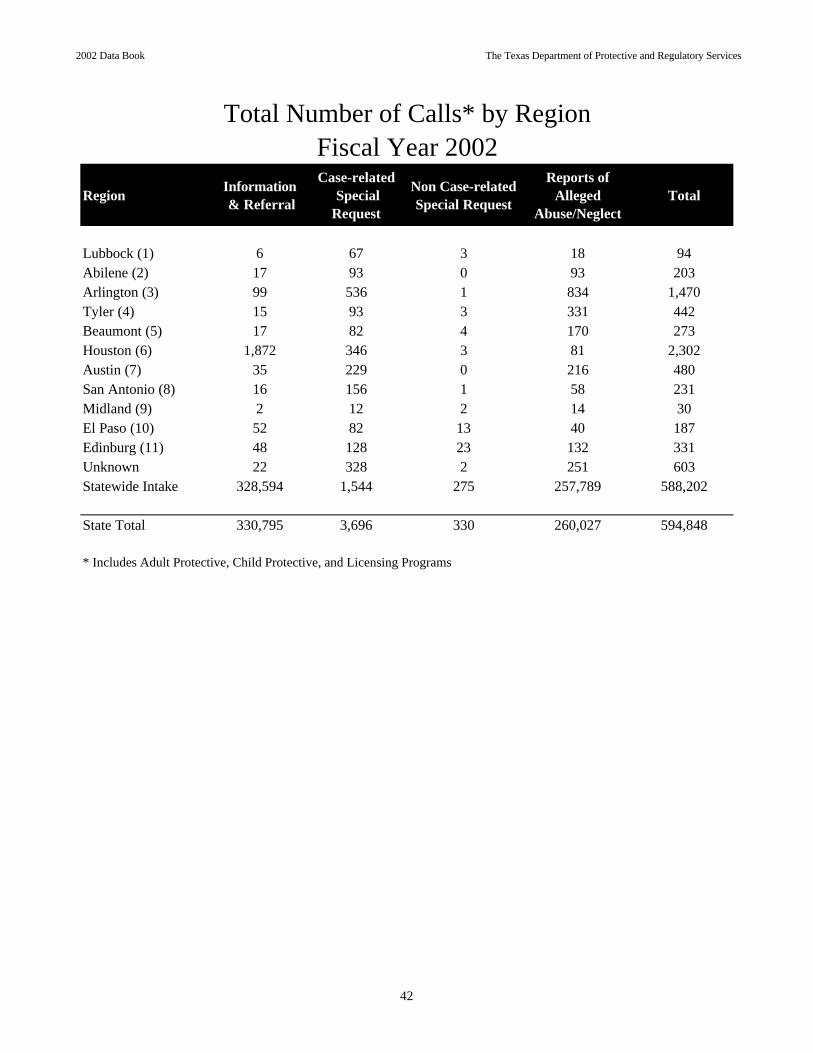
* Includes Adult Protective, Child Protective, and Licensing Programs
Total Number of Calls* by RegionFiscal Year 2002
42
2002 Data Book The Texas Department of Protective and Regulatory Services
* Reports meeting the statutory definition of child abuse/neglect with sufficient identifying information are assigned. ** Reports not meeting the statutory definition or without sufficient identifying information to locate the family are not assigned.*** Region unknown
Note: Information and referral requests, written or verbal are not included in the data in these charts and graphs.
Reports of Child Abuse/Neglect by RegionFiscal Year 2002
Reports of Child Abuse/Neglect by Fiscal Year
7,33
2
4,78
6 9,70
9
6,03
4
29,6
38
19,4
89
16,7
95
4,23
5
4,49
5
14,5
62
26854
1,21
7 5,14
4
1,02
8
1,14
9 5,59
6
2,94
5
4,22
4
963
800
1,31
6
277
40,4
43
0
10,000
20,000
30,000
40,000
50,000
Lubbock
(1)
Abilene
(2)
Arlingto
n (3)
Tyler (4
)
Beaumont
(5)
Houston
(6)
Austin (
7)
San Anto
nio (8)
Midland
(9)
El Paso
(10)
Edinbur
g (11)
Other**
*
Assigned* Not assigned**
157,544142,910139,898
131,920
25,51328,85831,04629,379
0
25,000
50,000
75,000
100,000
125,000
150,000
175,000
1999 2000 2001 2002
Assigned* Not assigned**
43
2002 Data Book The Texas Department of Protective and Regulatory Services
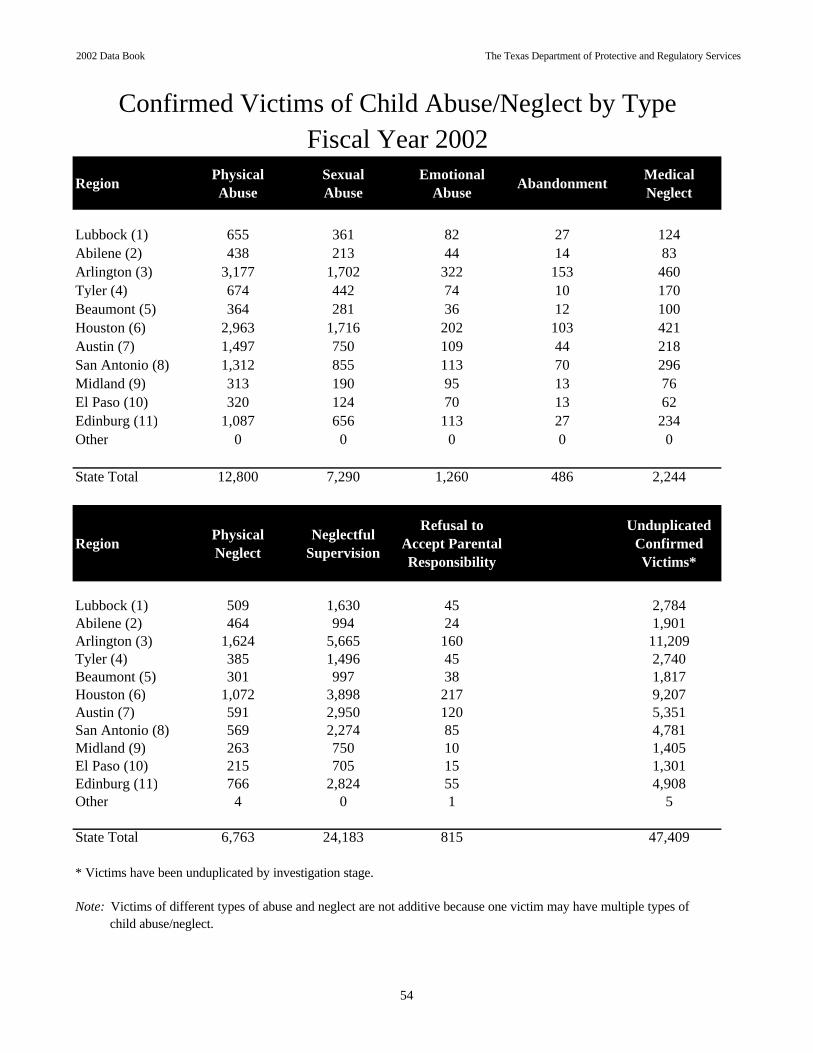
The categories used to record the findings and initial assessment/investigation of child abuse/neglectare defined as: Confirmed Investigations
Reason to believe -- Based on a preponderance of evidence, staff concludedthat abuse or neglect occurred.
Unconfirmed InvestigationsRuled out -- Staff determined, based on available information, that it is reasonableto conclude that abuse or neglect has not occurred.Moved -- Before staff could reach a conclusion, the persons involved in the report moved and could not be located.Unable-to-determine -- Staff concluded that none of the other dispositions were appropriate.
Region Total Confirmed PercentConfirmed Unconfirmed
* PRS licensing staff investigations of child abuse/neglect in licensed child care facilities and registered family homes are not included in the above totals.
Note: For information regarding child abuse/nelgect investigations in child care facilities see "Complaint Investigations in Child Care Facilities" on page 90.
Child Abuse/Neglect Allegation Dispositions
Number of Child Abuse/Neglect Investigations*Fiscal Year 2002
44
2002 Data Book The Texas Department of Protective and Regulatory Services
Disposition of Investigation
No Significant Risk Identified
Risk Controlled
Risk Indicated
Risk Not Applicable
Blank/ Invalid Total
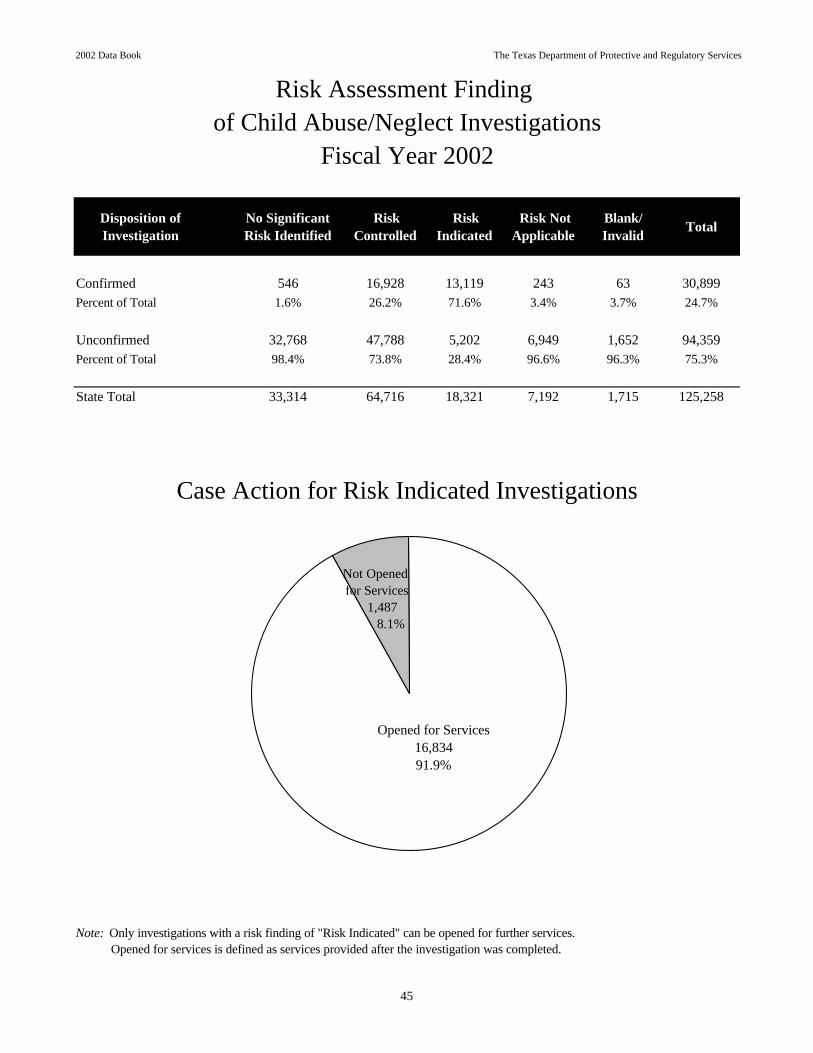
Confirmed 546 16,928 13,119 243 63 30,899Percent of Total 1.6% 26.2% 71.6% 3.4% 3.7% 24.7%
Unconfirmed 32,768 47,788 5,202 6,949 1,652 94,359Percent of Total 98.4% 73.8% 28.4% 96.6% 96.3% 75.3%
State Total 33,314 64,716 18,321 7,192 1,715 125,258
Note: Only investigations with a risk finding of "Risk Indicated" can be opened for further services. Opened for services is defined as services provided after the investigation was completed.
Risk Assessment Finding
Fiscal Year 2002of Child Abuse/Neglect Investigations
Case Action for Risk Indicated Investigations
Not Opened for Services
1,487 8.1%
Opened for Services 16,83491.9%
45
2002 Data Book The Texas Department of Protective and Regulatory Services
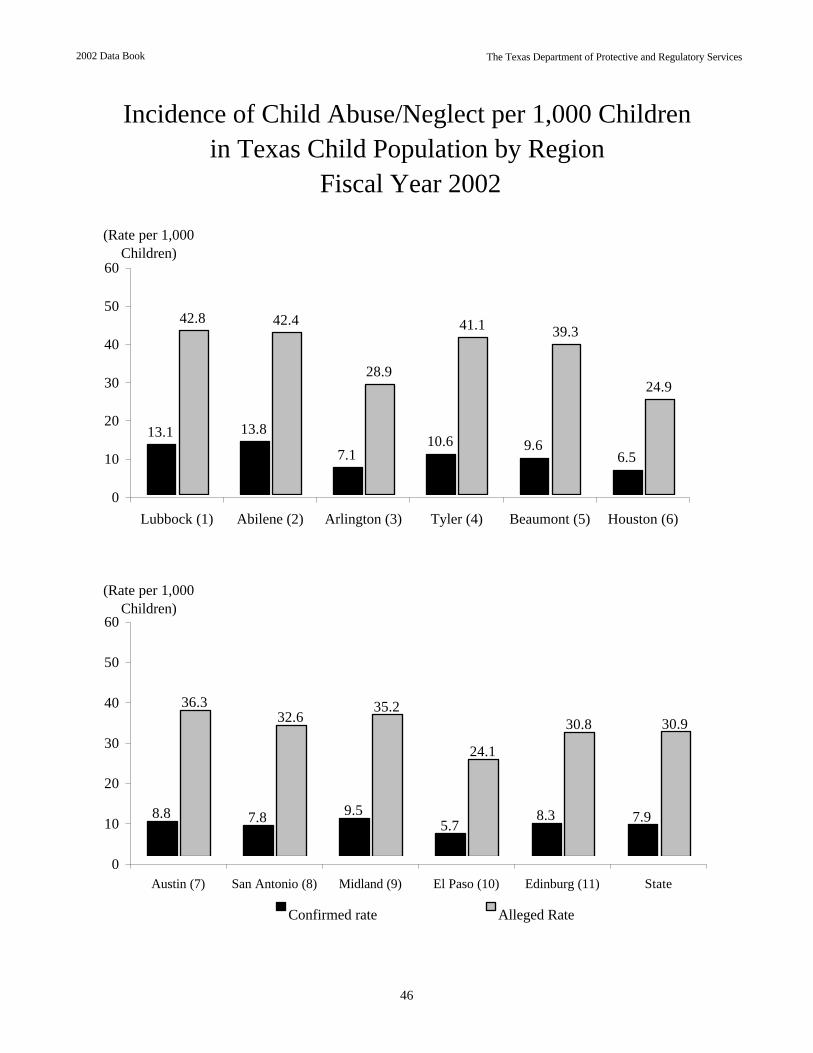
Incidence of Child Abuse/Neglect per 1,000 Childrenin Texas Child Population by Region
Note: Foster Care is a sub-set of Substitute Care, and includes youth who have aged out of PRS legal responsibility but remain in foster care.
Legal Status of Children in PRS Legal Responsibility
Number Percent
Care, Custody & Control 123 0.6%
Temporary Managing Conservatorship 10,448 49.4%
Permanent Managing Conservatorship Parental Rights Not Terminated 3,186 15.1% Parental Rights Terminated (All) 6,442 30.5% Parental Rights Terminated (One Parent) 538 2.5%
Possessory Conservatorship 409 1.9%
Total 21,146 100.0%
19,516 14,843
3261,277 1,000
1,994347281
2,722
3,3192,151
742989526
5,2182,873
924488
4,837
August 2002
1,095
401
Legal Status
3461,416
21,146
1,408609
4,567
at the End of Fiscal Year 2002Substitute
Care
1,312543
PRS Legal Responsibility
Children in PRS Legal Responsibility, inSubstitute Care, and in Foster Care Placements
472
2,6892,565440
Foster Care
4653,0484,115
64
2002 Data Book The Texas Department of Protective and Regulatory Services
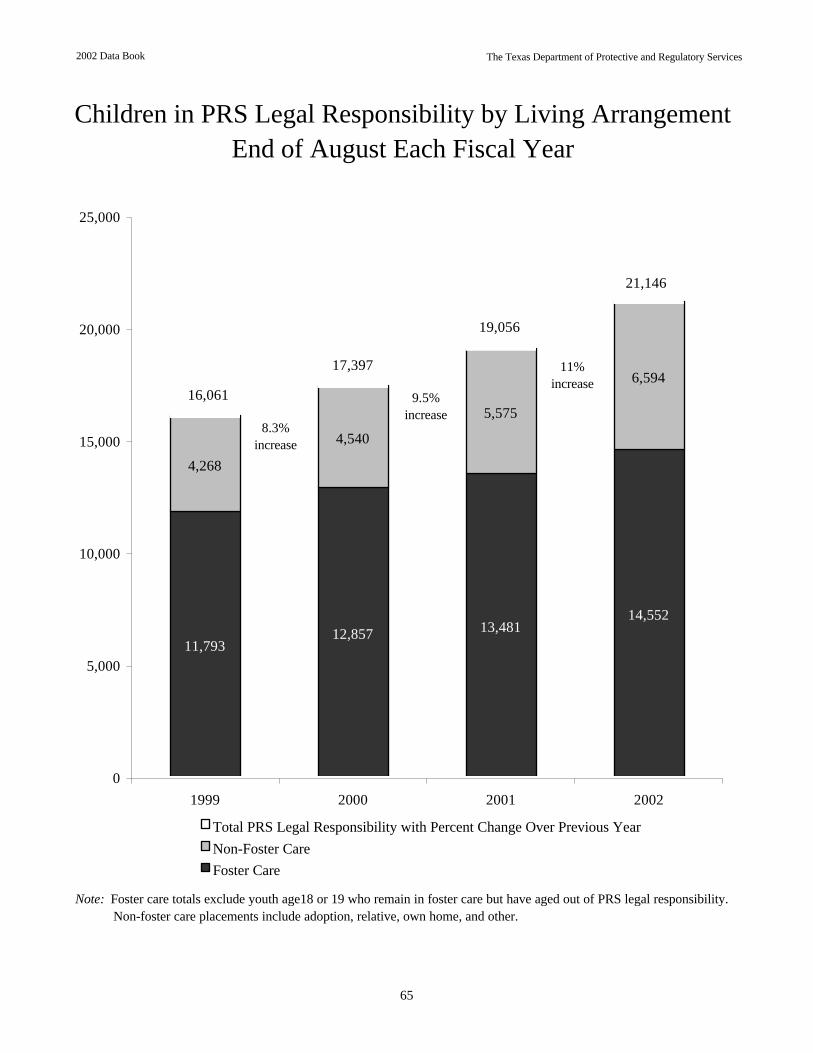
Note: Foster care totals exclude youth age18 or 19 who remain in foster care but have aged out of PRS legal responsibility. Non-foster care placements include adoption, relative, own home, and other.
Children in PRS Legal Responsibility by Living ArrangementEnd of August Each Fiscal Year
11,79312,857 13,481
14,552
4,268
4,540
5,575
6,59416,061
17,397
19,056
21,146
0
5,000
10,000
15,000
20,000
25,000
1999 2000 2001 2002
Total PRS Legal Responsibility with Percent Change Over Previous YearNon-Foster CareFoster Care
8.3%increase
9.5%increase
11%increase
65
2002 Data Book The Texas Department of Protective and Regulatory Services
* Other includes independent living, hospitals, nursing homes, correctional facilities, and unauthorized absence (left without permission).
Children in PRS Legal Responsibilityin Non-Foster Care Placements
by Fiscal Year
857
2,0482,443
3,494
935 732
759
869
104
1,5111,2551,181
2,871
690
720
508
6,594
5,575
4,5404,268
0
1,000
2,000
3,000
4,000
5,000
6,000
7,000
1999 2000 2001 2002
Own Home Relative Adoption Other*
66
2002 Data Book The Texas Department of Protective and Regulatory Services
Note: Averages have been rounded to the nearest whole number.
Status of Children No Longer in PRS Legal Responsibility
Fiscal Year 2002
Other5.5%
Custody Given to Relatives
21.5%
Adoption Consummated
26.3%
Children Emancipated
10.1%
Returned Home36.6%
67
2002 Data Book The Texas Department of Protective and Regulatory Services
Permanency Goal of Children in Substitute Care for Whom PRS Had Legal Responsibility
on August 31, 2002
Note: Children counted had an approved permanency goal recorded. Policy allows up to 45 days from entry into care to record the permanency goal.
Family Reunification
28.3%
Adult Living10.7%
Permanent Placement with
Relatives8.7%
Adoption by Non-Relative
39.3%
Alternative Long-term Livng
13.0%
68
2002 Data Book The Texas Department of Protective and Regulatory Services
* Cost of care not covered by Title IV-E or State Paid Foster Care** State Paid Foster Care may be funded with Federal Block Grant (TANF).Note: All averages rounded to the nearest whole number.
87
8328
21714
0
1113748
6,304
1,426943695137
185
Fiscal Year 2002Monthly Average by Region
State Paid Foster Care**
368218
1,450
Other Care*
63
Children in Foster CareMonthly Average by Fiscal Year
Children in Foster Care
386185
69
2002 Data Book The Texas Department of Protective and Regulatory Services
Note: Calculations exclude children where cost of care was not covered by Title IV-E or state paid foster care.State Paid Foster Care may be funded with Federal Block Grant (TANF).Also, averages are rounded to the nearest whole number.
as of August 31, 2002
2000 2001 2002
Average Monthly Number of Children in Paid Foster Care by Level of Care (LOC)
Sources of Foster Care
Level of Care
Each Fiscal Year
Title IV-EFoster Care
8,88458.5%
State Paid Foster Care
6,30441.5%
71
2002 Data Book The Texas Department of Protective and Regulatory Services
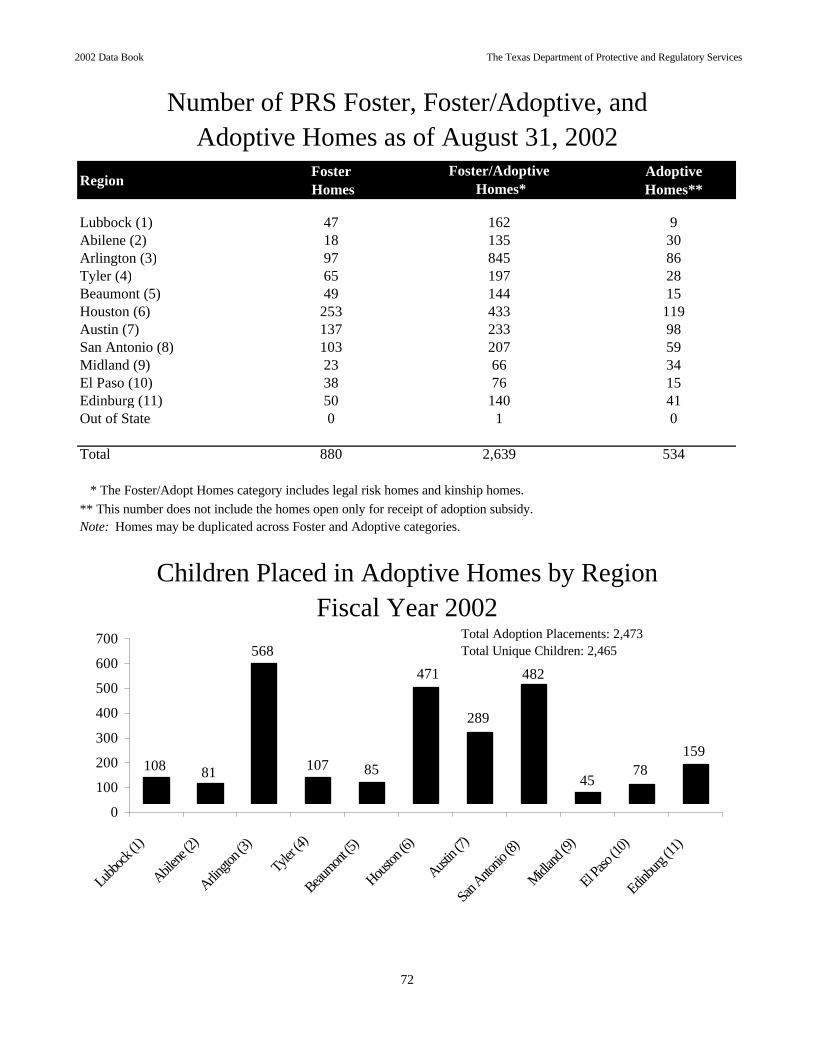
Number of PRS Foster, Foster/Adoptive, andAdoptive Homes as of August 31, 2002
* The Foster/Adopt Homes category includes legal risk homes and kinship homes.** This number does not include the homes open only for receipt of adoption subsidy.Note: Homes may be duplicated across Foster and Adoptive categories.
Fiscal Year 2002Children Placed in Adoptive Homes by Region
Foster/Adoptive Homes*
162135845197144433233207
2,639
6676
1401
15978
45
289
471
8510781108
482568
0
100
200
300
400
500
600
700
Lubbock
(1)
Abilene
(2)
Arlingto
n (3)
Tyler (4
)
Beaumont
(5)
Houston
(6)
Austin (
7)
San Anto
nio (8)
Midland
(9)
El Paso
(10)
Edinbur
g (11)
Total Adoption Placements: 2,473Total Unique Children: 2,465
72
2002 Data Book The Texas Department of Protective and Regulatory Services
Demographics of 2,465 Children Placed in Adoptive HomesFiscal Year 2002
Age
Under 1 year4.6%
13 years and Over
6.5%
6 - 12 years
33.5%
1 - 5 years
55.4%
Child Characteristics
52.0%
48.0%
No Special Characteristics
Disabling Condition
Ethnicity
Asian0.5%
Other1.3%
Native American
0.4%
Hispanic36.1%
Anglo31.8%
African American
29.9%
Sex
Female49.8%
Male50.2%
73
2002 Data Book The Texas Department of Protective and Regulatory Services
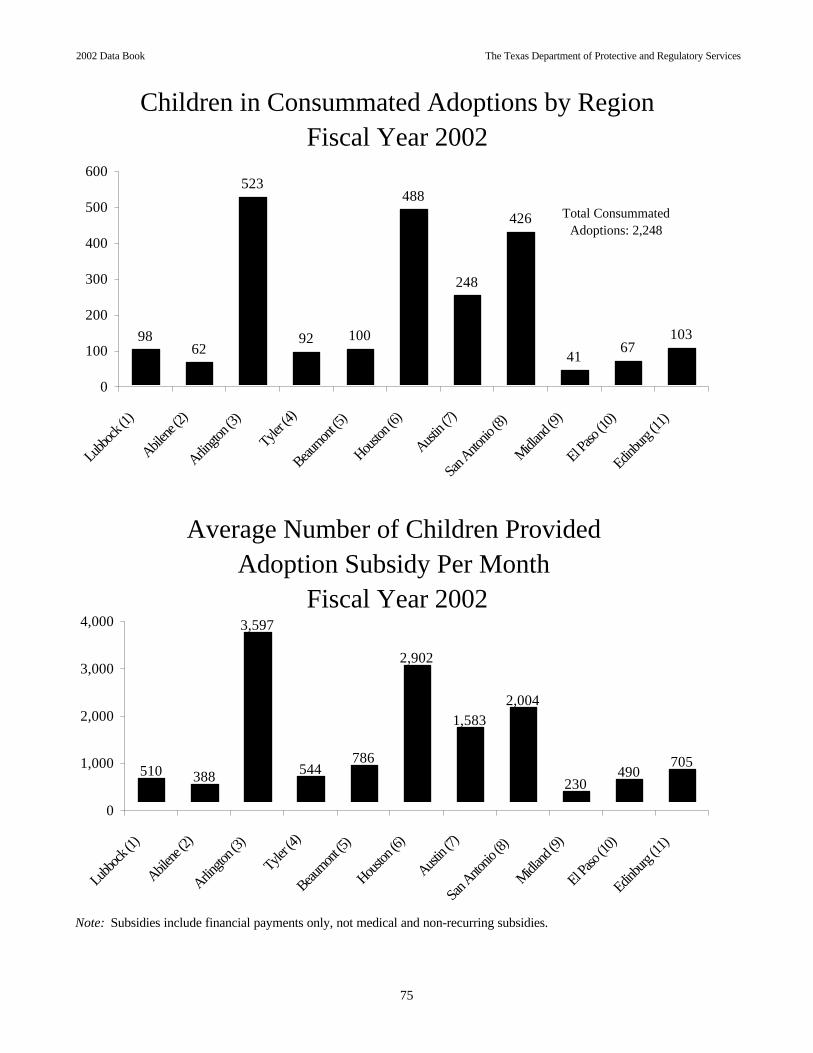
Total Consummations 2,054 100.0% 2,063 100.0% 2,261 100.0% 2,248 100.0%
2000 20011999 2002
Race/Ethnicity of Children and Adoptive Parentsby Fiscal Year
Adoption Consummations by Type of Agencyby Fiscal Year
2000 20011999 2002
77
2002 Data Book The Texas Department of Protective and Regulatory Services
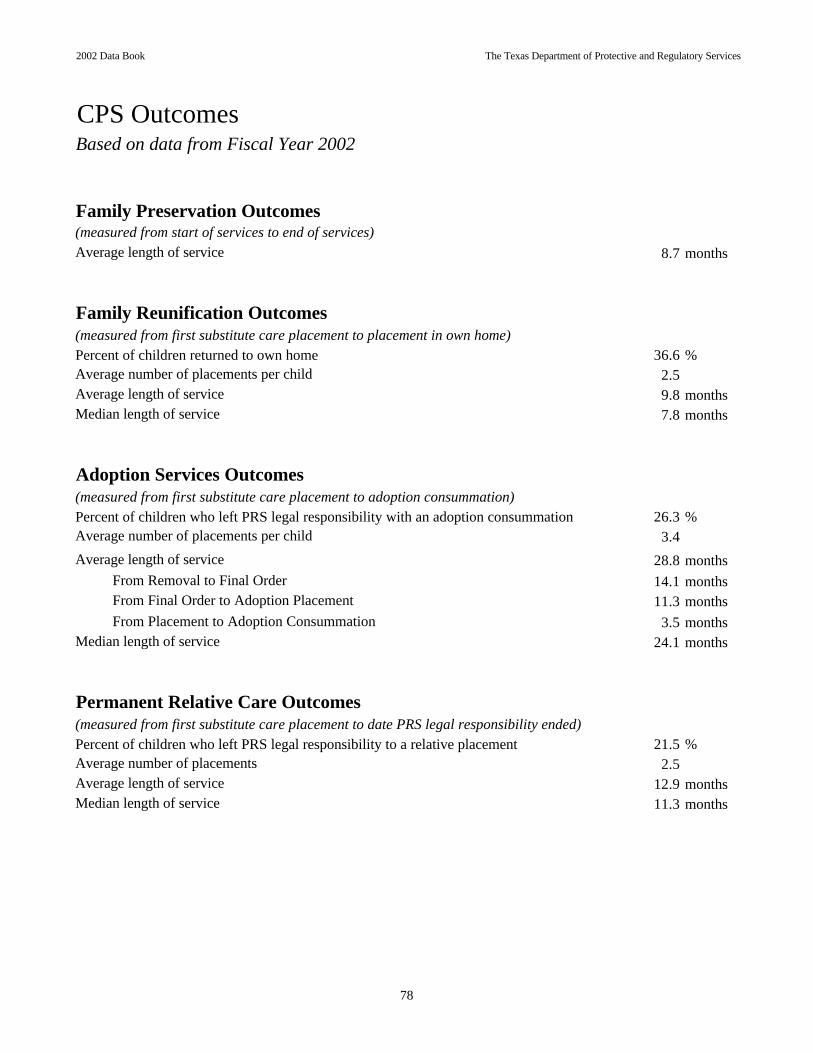
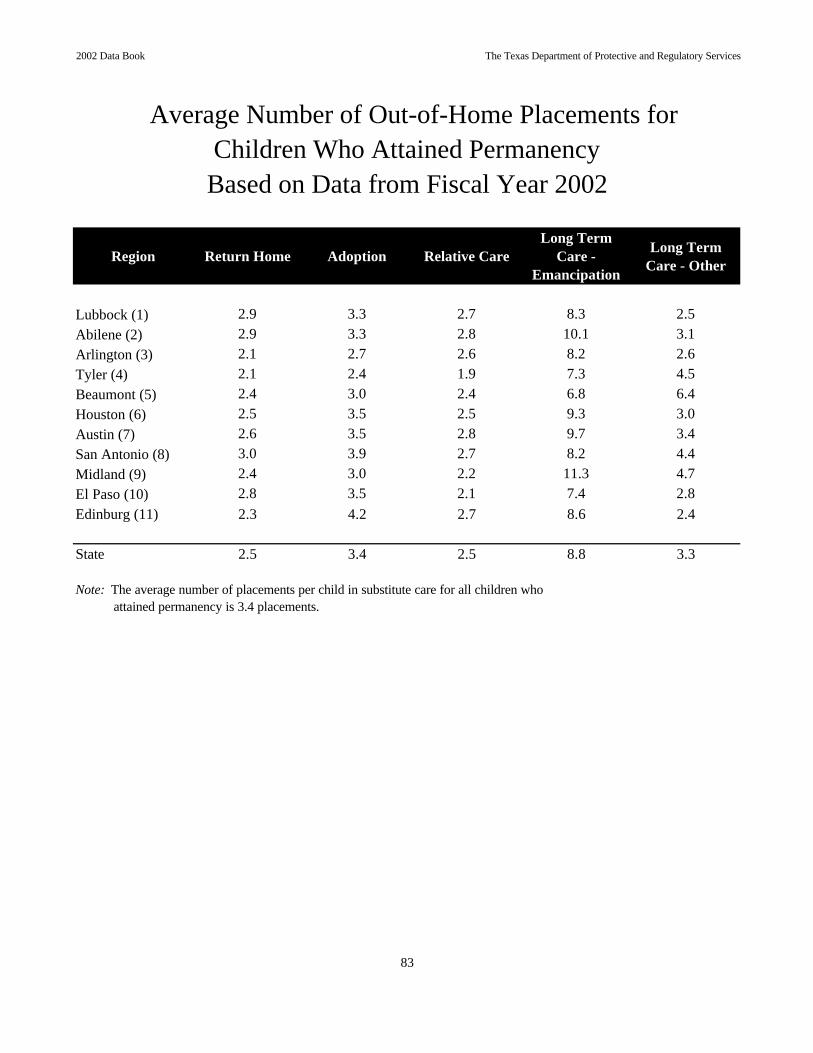
CPS Outcomes Based on data from Fiscal Year 2002
Family Preservation Outcomes (measured from start of services to end of services)Average length of service 8.7 months
Family Reunification Outcomes(measured from first substitute care placement to placement in own home)Percent of children returned to own home 36.6 %Average number of placements per child 2.5Average length of service 9.8 monthsMedian length of service 7.8 months
Adoption Services Outcomes(measured from first substitute care placement to adoption consummation)Percent of children who left PRS legal responsibility with an adoption consummation 26.3 %Average number of placements per child 3.4Average length of service 28.8 months From Removal to Final Order 14.1 months From Final Order to Adoption Placement 11.3 months From Placement to Adoption Consummation 3.5 monthsMedian length of service 24.1 months
Permanent Relative Care Outcomes(measured from first substitute care placement to date PRS legal responsibility ended)Percent of children who left PRS legal responsibility to a relative placement 21.5 %Average number of placements 2.5Average length of service 12.9 monthsMedian length of service 11.3 months
78
2002 Data Book The Texas Department of Protective and Regulatory Services
Long-term Substitute Care Outcomes
Emancipation (includes children who left PRS legal responsibility by emancipation or turning 18)(measured from first substitute care placement to date PRS legal responsibility ended or date child turns 18 years of age)Percent of children who left PRS legal responsibility 10.1 %Average number of placements 8.8Average length of service 66 monthsMedian length of service 55.4 months
Other Long-term Substitute Care (measured from first substitute care placement to date PRS legal responsibility ended)Percent of children who left PRS legal responsibility 5.5 %Average number of placements 3.3Average length of service 12.6 monthsMedian length of service 5 months
Fiscal Year 2002 Recidivism Outcomes
For All Stages:(measured as a new confirmed reason to believe allegation within 12 months of the end of services or a return to substitute care or new Family Preservation services provided) 9.6 %For Family Preservation:
(measured as a new confirmed reason to believe allegation within 12 months of the end of Family Preservationservices or new Family Preservation services provided) 7.8 %For Family Reunification:(measured as a new confirmed reason to believe allegation or a return to substitute care within 12 months of the end of family reunification services) 14.4 %
79
2002 Data Book The Texas Department of Protective and Regulatory Services
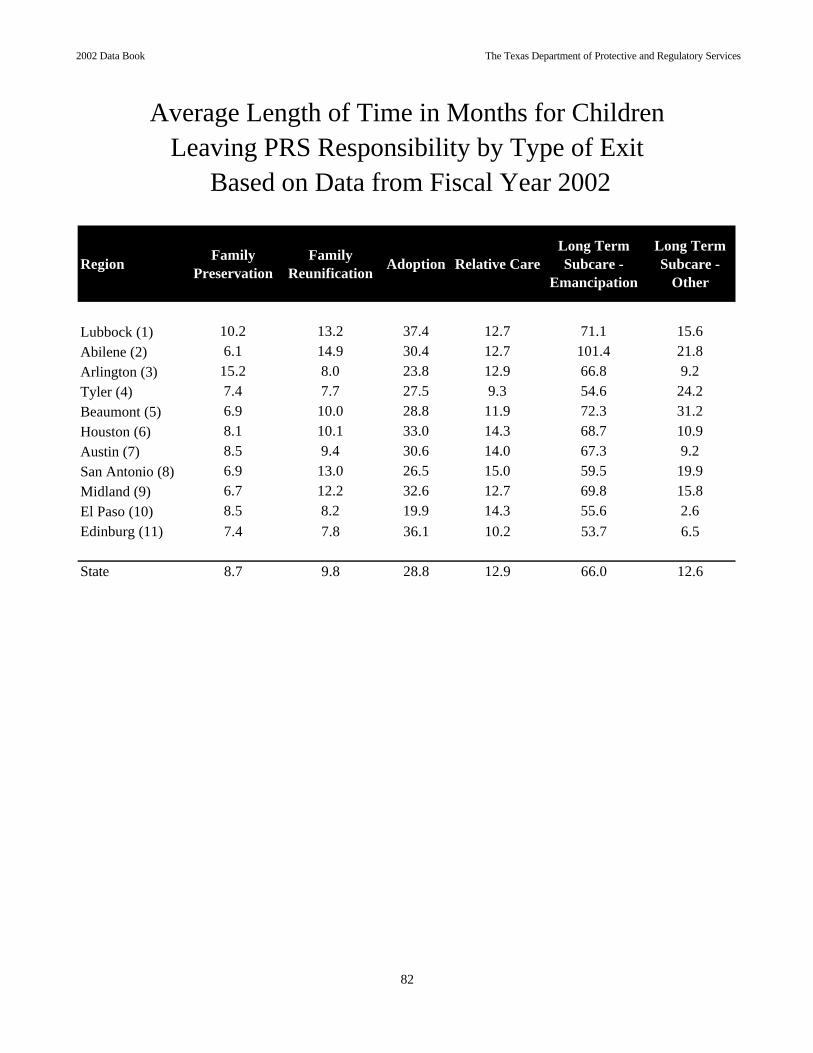
Average Length of Time in Months Children are in
Permanent Living Arrangement by Region Based on Data from Fiscal Year 2002
Temporary Substitute Care until Placed in a 4.
7 5.5
4.7
3.3 5.9
5.113
.2
14.9
8.0
7.7 10
.0
10.1
32.9
23.7
20.6
20.2 23
.3 28.1
57.7
56.5
43.3
58.3
53.9
9.0
18.5
5.8
19.6 28
.4
8.5
84.6
0
10
20
30
40
50
60
70
80
90
Lubbock (1)
Abilene (2)
Arlington (3)
Tyler (4)
Beaumont (5)
Houston (6)
5.25.26.97.6
5.5
3.5 9.
8
8.29.4 13
.0
7.812
.2
24.329
.5
15.821
.9
23.5
25.5
54.7
47.2
47.1
70.2
46.1
60.2
22.4
2.7 6.
8 11.2
22.5
10.6
0
10
20
30
40
50
60
70
80
90
Austin (7)
San Antonio (8)
Midland (9)
El Paso (10)
Edinburg (11)
State
Relative Care Return to FamilyAdoption Long Term Subcare - EmancipationLong Term Subcare - Other
80
2002 Data Book The Texas Department of Protective and Regulatory Services
* Children who left substitute care via an own home, permanent relative placement or adoption consummation and PRS legal responsibility was ended.
Length of Time in Care for Children Who Achieved Permanency Status*
During Fiscal Year 2002
62.3%
71.0%
64.5% 63.5% 62.6%
19.8%18.0% 18.1%
22.9% 23.1%
13.6%
17.50%
11.0%
17.9%
14.3%
0%
10%
20%
30%
40%
50%
60%
70%
80%
1998 1999 2000 2001 2002
0 to 12 months 13 to 24 months More than 24 months
81
2002 Data Book The Texas Department of Protective and Regulatory Services
Average Number of Placements for Children Who Left Substitute Care
Median length of service for children whose cases are still open in long-term substitute care.
Based on Data from Fiscal Year 2002
Substitute Care Outcomes for Cases Open
Average length of service for children whose cases are still open in temporary substitute care.
Median length of service for children whose cases are still open in temporary substitute care.
Average length of service for children whose cases are still open in long-term substitute care.
at End of Fiscal Year 2002
84
2002 Data Book The Texas Department of Protective and Regulatory Services
* 685 youth who were not served in FY 2002 received services prior to FY 2002.
Fiscal Year 2002
by Fiscal Year
Preparation for Adult Living (PAL) Services
Preparation for Adult Living (PAL) Services
Youth Ages 16 through 20
1,571 1,189 837 786 975
3,1104,297
2,310 2,822 3,684
5,272
4,4703,881 4,011 3,947
0
1,000
2,000
3,000
4,000
5,000
6,000
1998 1999 2000 2001 2002Not Served Served
The Preparation for Adult Living (PAL) program was implemented to ensure that older youth in substitute care are prepared for their departure from the Department of Protective and Regulatory Services’ care and support. The PAL program’s goal is to provide each youth with the skills and resources they will need to be a productive adult. The agency is required to provide PAL services to youth aged 16 and older who reside in PRS paid substitute care.
Not Served*975
Served4,297
85
2002 Data Book The Texas Department of Protective and Regulatory Services
Preparation for Adult Living (PAL) ServicesMovement of Youth in Fiscal Year 2002
4,395
1,696
1,477
4,614
0
500
1000
1500
2000
2500
3000
3500
4000
4500
5000
1Start of Year Entered During Exited During End of Year