1 Paper presented at the EPLA 2008 Conference. Byron Bay, October 16 th -18 th 2008 Legislative and policy challenges for the protection of biodiversity and bushland habitats: An evidence-based approach Mark Patrick Taylor Land and Environment Court, 225 Macquarie Street, Windeyer Chambers, Sydney, 2000, NSW. Contact email: [email protected]Abstract Balancing the needs of biodiversity in the context of ESD remains a challenging and ongoing issue for consent authorities, developers and scientists alike. This article explores some of practical, scientific, legislative and policy issues facing the protection of biodiversity in the context of urbanisation. The application of legislative and policy instruments to environmental decision-making needs to be complemented with more site-specific evidenced-based research and with regard to the biodiversity of the broader landscape. It is argued that such an approach will help determine more accurately the likely long-term environmental outcomes that can be expected from setbacks, offsets, buffers and corridors. In examining the question of setbacks adjacent to development, various relevant examples of court decisions are considered. In addition, a range of recent research studies are used to show that biodiversity outcomes are both place and space orientated and that wide buffers and those adjacent to riparian zones tend to result in greater biodiversity outcomes. The application of site-specific empirical findings in biodiversity planning and decision-making will help limit and mitigate the key threatening processes of clearing and fragmentation. Keywords: Biodiversity, buffers, corridors, ecology, legislation, policy, setbacks, urbanisation 1. Introduction Urban ecosystems are under severe pressure from the effects of land use change associated with human activity. These impacts are not confined to a particular geographic region of the world but affect all areas where urbanisation dominates the landscape. It is a well-established fact that urbanisation is one of the major drivers of biodiversity loss since it modifies landscapes to suit only the human species (McKinney, 2006). This often results in vegetation loss and modification, invasion of exotic species and disruption of ecological processes and cycles (McKinney, 2002 and 2006). By 2050, it is projected that the worldʼs population living in urban areas will increase by more than 3.1 billion (48 %), which is greater than the total projected global population increase (~2.5 billion). Consequently, urbanisation may therefore be considered as one of the most pressing threats to biodiversity facing the world in the 21 st century (McKinney, 2002; Beatley, 2000), exceeding even those posed by resource extraction or agriculture (Marzluff, 2002). This article examines, in brief, some of the broader practical, scientific, legislative and policy issues facing the protection of biodiversity and bushland habitats.
Transcript
1
Paper presented at the EPLA 2008 Conference. Byron Bay, October 16th-18th 2008
Legislative and policy challenges for the protection of biodiversity
and bushland habitats: An evidence-based approach
Mark Patrick Taylor
Land and Environment Court, 225 Macquarie Street, Windeyer Chambers, Sydney, 2000, NSW. Contact email: [email protected]
Abstract Balancing the needs of biodiversity in the context of ESD remains a challenging and ongoing issue for consent authorities, developers and scientists alike. This article explores some of practical, scientific, legislative and policy issues facing the protection of biodiversity in the context of urbanisation. The application of legislative and policy instruments to environmental decision-making needs to be complemented with more site-specific evidenced-based research and with regard to the biodiversity of the broader landscape. It is argued that such an approach will help determine more accurately the likely long-term environmental outcomes that can be expected from setbacks, offsets, buffers and corridors. In examining the question of setbacks adjacent to development, various relevant examples of court decisions are considered. In addition, a range of recent research studies are used to show that biodiversity outcomes are both place and space orientated and that wide buffers and those adjacent to riparian zones tend to result in greater biodiversity outcomes. The application of site-specific empirical findings in biodiversity planning and decision-making will help limit and mitigate the key threatening processes of clearing and fragmentation. Keywords: Biodiversity, buffers, corridors, ecology, legislation, policy, setbacks, urbanisation 1. Introduction Urban ecosystems are under severe pressure from the effects of land use change associated with human activity. These impacts are not confined to a particular geographic region of the world but affect all areas where urbanisation dominates the landscape. It is a well-established fact that urbanisation is one of the major drivers of biodiversity loss since it modifies landscapes to suit only the human species (McKinney, 2006). This often results in vegetation loss and modification, invasion of exotic species and disruption of ecological processes and cycles (McKinney, 2002 and 2006). By 2050, it is projected that the worldʼs population living in urban areas will increase by more than 3.1 billion (48 %), which is greater than the total projected global population increase (~2.5 billion). Consequently, urbanisation may therefore be considered as one of the most pressing threats to biodiversity facing the world in the 21st century (McKinney, 2002; Beatley, 2000), exceeding even those posed by resource extraction or agriculture (Marzluff, 2002). This article examines, in brief, some of the broader practical, scientific, legislative and policy issues facing the protection of biodiversity and bushland habitats.
2
2. Recognition of the importance of biodiversity and ESD The complexities of urban ecology with multiple land uses and confounding environmental stresses such as pollutants, exotics and edge effects has made traditional empirical research problematic (McDonnel et al., 1997; Niemela, 1999; Marzluff, 2002). Consequently, conservation efforts and research have focused predominantly more on natural or wilderness areas rather than urban environments. However, in more recent times, the significance of urban environments, their ecological significance and contribution to broader regional biodiversity conservation goals (Broberg, 2003; Beatley, 2000), human wellbeing (e.g. psychological health and recreational amenity) (Jim and Chen, 2006; Kuo, 2001; Fuller et al., 2007) and promotion of a conservation ethic within society (McKinney, 2002; Miller, 2005) have been recognised increasingly and promoted (Rebele, 1994). These and others factors (see below) have led to an increased interest in retaining and protecting biodiversity in urban environments. Recognition of the importance of biodiversity as a whole gained significant momentum in the legislative and policy sense following 1992 Rio de Janeiro United Nations Conference on Environment and Development. This meeting established the often cited operational meaning of biodiversity as: “the variability among living organisms from all sources ... and the ecological complexes of which they are a part; this includes diversity within species, between species and of ecosystems”. The Australian response to Agenda 21 of the 1992 Rio Conference, the first global-scale comprehensive plan of action for sustainable activity, was the establishment of the overarching philosophy of Ecologically Sustainable Development (ESD). This was formalised following the release of Australiaʼs National Strategy for Ecologically Sustainable Development (NSESD) (Ecologically Sustainable Development Steering Committee, 1992). The strategy defines ESD as: “using, conserving and enhancing the community's resources so that ecological processes, on which life depends, are maintained, and the total quality of life, now and in the future, can be increased”. The NSESD (1992) identifies three core objectives for ESD:
i. to enhance individual and community well-being and welfare by following a path of economic development that safeguards the welfare of future generations
ii. to provide for equity within and between generations iii. to protect biological diversity and maintain essential ecological processes and
life-support systems With respect to the latter objective, the principal subject of this article, it has become clear that local government policy and strategy is especially significant for combating biodiversity loss in Australia. Aside from threatened species listings at the Federal (Environment Protection and Biodiversity Conservation Act 1999) or State level (Threatened Species and Conservation Act, 1995 (New South Wales (NSW)), it is at this more local spatial scale that many opportunities exist to appreciate realistically the multiple values of biodiversity and to act upon them within a legal and policy framework. Consequently, local government policy is highly significant because it influences directly how and where urban development takes place, which in turn shapes the
3
biodiversity ecology of urbanised landscapes. The success of the myriad of regional and local environmental and development controls is paramount if we are to avoid an environmental equivalent of Kahnʼs (1966) “tyranny of small decisions” in which the accumulation of incremental habitat losses and deterioration in urban landscapes would result in tragic and irreversible biodiversity loss, or “death by a thousand cuts” (Murlan Consulting Pty Limited v Ku-ring-gai Council [2007] NSWLEC 374 (26 June 2007) [at 85]. In NSW conservation approaches that encompass broader biodiversity values have been realised through various legislative instruments. These include, inter alia, The Native Vegetation Act 2003, Threatened Species Conservation Amendment (Biodiversity Banking) Act 2006, and via biodiversity certification of environmental planning instruments such as local environmental Plans (Department of Environment and Climate Change, 2008). However, because many of the processes contributing to urban biodiversity loss take place at the local scale and are often the result of piecemeal decision-making by the consent authority, they must therefore be addressed more adequately by local policy. This is clearly outlined in the UN Agenda 21 (Section 28.1) (http://www.un.org/esa/sustdev/documents/agenda21/english/agenda21toc.htm):
“Because so many of the problems and solutions being addressed by Agenda 21 have their roots in local activities, the participation and cooperation of local authorities will be a determining factor in fulfilling its objectives. Local authorities construct, operate and maintain economic, social and environmental infrastructure, oversee planning processes, establish local environmental policies and regulations, and assist in implementing national and sub-national environmental policies. As the level of governance closest to the people, they play a vital role in educating, mobilizing and responding to the public to promote sustainable development.”
In recognition of the need for action relating to ESD at the local scale, the Australian Government developed the Local Agenda 21 Program (LA21) (1997) to provide a framework to address this issue directly and to:
“build upon existing local government strategies and resources (such as Corporate plans, vegetation management plans, and transport strategies) to better integrate environmental, economic and social goals” (http://www.environment.gov.au/esd/la21/index.html)
Thus, although both conservation and development concepts are embedded in ESD principles, each development proposal should be examined to ascertain whether conservation and development can be compatibly combined or whether one or another should prevail (McDonald, 2008). McClellan CJ discussed this in BGP Properties Pty Limited v Lake Macquarie City Council [2004] NSWLEC 399 (12 August 2004):
“113. In my opinion, by requiring a consent authority (including the Court) to have regard to the public interest, s 79(C)(e) of the EP&A Act obliges the decision-maker to have regard to the principles of ecologically sustainable development in cases where issues relevant to those principles arise. This will have the consequence that, amongst other matters, consideration must be given to matters of inter-generational equity, conservation of biological diversity and ecological integrity. Furthermore,
4
where there is a lack of scientific certainty, the precautionary principle must be utilised. As Stein J said in Leatch [Leatch v National Parks and Wildlife Servce and Anor (1993) 81 LGERA 270], this will mean that the decision-maker must approach the matter with caution but will also require the decision-maker to avoid, where practicable, serious or irreversible damage to the environment. 114. Consideration of these principles does not preclude a decision to approve an application in any cases where the overall benefits of the project outweigh the likely environmental harm. However, care needs to be taken to determine whether appropriate and adequate measures have been incorporated into such a project to confine any likely harm to the environment.”
and:
“118. In most cases it can be expected that the Court will approve an application to use a site for a purpose for which it is zoned, provided of course the design of the project results in acceptable environmental impacts. 119. However, there will be cases where, because of the history of the zoning of a site, which may have been imposed many years ago, and the need to evaluate its prospective development having regard to contemporary standards, it may be difficult to develop the site in an environmentally acceptable manner and also provide a commercially viable project.”
3. Provisions for biodiversity in the context of development and economic growth Biodiversity and the free ecosystem services it provides such as pollination; the conversion of CO2 into O2 by plants; the filtration and removal of pollutants by plants, animals and soil systems; the recycling and global transfer of water by the hydrological cycle and nutrient conversion undertaken by soil micro-organisms that produce edible and consumable products for humans), cannot be realistically valued in economic terms (Figure 1). Constanza et al. (1997) considered this notion and estimated that natureʼs services were US$33 Trillion (1012) (range 16 – 54 trillion per annum). Global GDP in 1997 amounted to $18 trillion. Thus, it is clear that humanity cannot afford to substitute these ʻfreeʼ ecosystem services that are derived from the maintenance of biodiversity with technological alternatives. In this sense they cannot be replaced and are beyond monetary value. A comparison of art with biodiversity provides a useful consideration of its utilitarian services and its inherent and irreplaceable value. → Insert Figure 1 Art forms part of the human global and cultural heritage and irrespective of ownership, its wilful destruction is considered vandalism, an act that permeates every facet of society (Collar, 2003). A pertinent recent example of this was the destruction of the stone buddhas in Afghanistan. Biodiversity is like art, in that one can pay to own it, but one can never pay to replace a singular entity. This is because biodiversity is inseparable from both space and place, and like art, it is a unique formulation. Biodiversity arises from its individualistic aspect, soil, geology, biotic composition, structure and heterogeneity and consequently it cannot be replicated. Since
5
biodiversity is irreplaceable, it could be argued that in this sense it is not the property of the owner to dispose of it, since to do so would prevent future generations from being able to either enjoy or derive benefit from it. The aims of bio-banking devised under the Threatened Species Conservation Amendment (Biodiversity Banking) Act 2006, and Biodiversity Certification procedures are worthy attempts at mitigating and off-setting the rapid and ongoing destruction of Australiaʼs biodiversity. However, they cannot, in an absolute sense, be considered to replace biodiversity nor the ecosystem services that result from their existence.” 4. Economic development and it effect on ecological systems The whole concept of development as it is understood currently, does not rest comfortably with ecological sustainability, at least in its purest meaning. The migration of any species into new habitats can generate environmental modification and degradation, a fact that is true especially of human migration (Hinrichsen and Robey, 2000). In Australia for example, the arrival of humans some 40,000 years ago was likely the cause of a significant decline in the continent’s mega fauna. A similar extinction pattern is thought to have occurred in north America following the arrival of humans on that continent. The next major impact in Australia occurred following the arrival of Europeans in 1788. Their arrival precipitated the loss of 34 % of our total forest, which included some 75 % of all rainforest and more than 60 % of the wetlands in southern and eastern Australia (now the most densely populated and urbanised parts of the continent). In addition, about a quarter of surface water management areas are close to or have exceeded sustainable extraction limits and about a third of all the rivers are ecologically impaired (Trewin, 2006). Despite overwhelming evidence that natural resources are being rapidly depleted and that this is likely to pose a severe limit to future economic and population growth (Pimentel et al., 1999; Taylor, 2007), the ecological impacts of migration, population growth and development are frequently overlooked (cf. Tamar, 2006). There is plenty of evidence to suggest we are living on ʻenvironmental creditʼ – that is we are borrowing from our natural resources and capital to sustain a lifestyle that is beyond the long-term capacity of the earth (Figure 2a,b). The side effects of our economic growth paradigm are becoming more evident. In Australia for example, in addition to problems of water supply (quality and quantity), erosion and increasing salinisation of soils, widespread land clearing for agriculture and urban expansion has contributed to the extinction of at least 115 plants and animals. → Insert Figure 2a,b However, while many are aware of the problem, we are somewhat trapped by the fact we are part of a global economy which can only function if it is growing. The growth occurs in two basic forms: per capita growth and consumption and increased population growth consuming more total resources. Combined, these provide the powerhouse for economic growth, which results in the need to develop more land for inhabitation, food production or to access basic mineral resources. Most economists point to the positive benefits of market driven labour movements, but rarely calculate the environmental costs. The Rudd Government’s plans to introduce carbon trading to mitigate very serious potential climate change effects represents a significant
6
change to our previous approach of disconnecting the real economic and environmental costs. Despite arguments over the final details of its structure and formulation, carbon trading, like other environmental legislation and policy, represents a positive step in the right direction. It is unarguable that increasing development and productivity will produce significant global social and economic benefits, such as lifting many individuals and nations out of poverty. Unfortunately though, this increased consumption, the principal driver of the economy, will result, inevitably, in the need to develop ever more land for settlement, food production and access to basic minerals. The consequences will be further losses of biota, mineral and water resources, wetlands, wilderness areas and virgin forests (Wackernagal et al., 2002). While increased consumption and population growth can be compatible in the short to medium term, it is inevitable that serious environmental problems will occur as local and total global natural resources dwindle (Pimentel et al., 1999). As growth continues, it will be necessary to produce more food from the already diminishing amount of cropland available. Unfortunately herein lies an important contradiction: whilst it is feasible under most circumstances to increase food production in the short or medium term, elevated soil erosion rates or salinity problems arising from intensive agricultural production means that it is unlikely to be sustainable in the longer term (Pimentel et al., 1999). The Club of Rome outlined in their seminal book ʻThe Limits to Growthʼ (Meadows et al., 1972), that infinite growth of the current type is not possible because it is supported by resources that are either not renewable or are not being used at a renewable rate. Thus, in pursuing growth and development without proper consideration of ecological sustainability, we risk catastrophic global social, economic and environmental collapse as we reach the limits to growth. Societal collapse as a result of a depletion of resources is not a new phenomena. Such effects have a potent historical context in that the Polynesian inhabitants of Easter Island, the Anasazi, a Native-American tribe, and Petra, an ancient city of the Middle East have all suffered similar catastrophic collapses of their highly developed societies (Saier, 2004). 5. Interrelationships between legislation, development and sustainability The impact of urbanisation is often greatest along riparian zones, since these are typically the last single tracks of bushland in cities. This is particularly the case in Sydney where much of the remnant bushland can be found along the creeks and rivers that drain into Sydney harbour. In many cases, these areas were significantly less attractive to developers not only due to their propensity to be flooded but also because of their terrain. Streams draining the Hawkesbury sandstone catchments in northern Sydney are often steep, deeply incised and richly vegetated. However, as the population of Sydney increases so has the pressure to increase urban infill. There is also significant and simultaneous pressure on the western plains area where Sydneyʼs growth centres are expected to absorb at least 280,000 people. It is unfortunate that these areas contain the last remnants (6 % of the original cover) of the now highly fragmented Cumberland Plain forest (Benson and Howell, 1990). Are there any solutions to the problem? In the short term, to help society function more effectively and equitably, it would be useful to re-evaluate and define accurately
7
the natural limits of resource distribution, use, and consumption (economic, environmental, and social opportunities). It is unfortunate that despite the various Federal, State and Local government legislative and policy frameworks protecting habitats and environments, they are often fragmented, and as a result issues may fall ʻbetween the cracksʼ. A good example is the application of the Commonwealth Environment Protection and Biodiversity Conservation Act 1999 (EPBC Act) and the NSW Threatened Species and Conservation Act, 1995, for the protection of Sydneyʼs Blue Gum High Forest (BGHF). The difference in definition between the EPBC Act and the NSW Threatened Species Conservation Act 1995 was used by the applicant in Murlan Consulting Pty Limited v Ku-ring-gai Council [2007] NSWLEC 374 (26 June 2007) [71-80] to argue that the BGHF on the site was not a bona fide community and therefore should not be afforded protection as a critically endangered community. Blue Gum High Forest, as listed under the EPBC Act, includes patches with an intact vegetation structure, a tree canopy cover greater than 10%, and an area greater than 1 ha (Department of the Environment and Heritage 2005). Patches with less than 10% tree canopy cover are also included if they are part of a native vegetation remnant larger than 5 ha. Severely modified stands of trees characteristic of the canopy of Blue Gum High Forest, but without a native understorey, are not included in the definition of the community, and do not form part of the listing, even though they are recognised as important biodiversity reservoirs (Threatened Species Scientific Committee 2005). However, the legislation at the State level allows for a different definition and therefore a different level of protection. The Notice of Final Determination (gazetted 20th April 2007) under the NSW Threatened Species Conservation Act 1995 (NSW Government, 2007) stated that under the Act, there is no minimum number of species specified as defining a BGHF as a critically endangered ecological community. Indeed, paragraph 9 of the Final Determination notes that the distribution of the community comprises a series of small remnant patches, the largest of which is less than 20 ha. Highly modified relics of the community also persist as small clumps of trees without a native understorey. This determination states clearly that small patches of trees with or without an intact understorey may be considered to be included as a BGHF community. This latter issue has proved problematic for ecologists, developers and consent authorities in terms of determining the value of remnant patches of bushland in a number of cases. In the case of Murlan Consulting Pty Limited v Ku-ring-gai Council, it was determined that the small stand of BGHF on the subject site was indeed a critically endangered community as per the Final Determination under the NSW Threatened Species Conservation Act 1995 at [12]. Differences of expert opinion and interpretation of remnant patches of bushland are not uncommon. For example, in Bow v Blacktown City Council [2008] NSWLEC 211 (28 July 2008), two expert ecologists gave evidence about the presence of Cumberland Plain Woodland on a plot of land to be compulsorily acquired in order to determine the amount of developable land. The two experts (Ms Hayes and Mr Fanning) came to completely different conclusions as to the ecological value and long-term viability of the vegetation.
8
“11. ……Ms Hayes concluded (see s 79B of the Environmental Planning and Assessment Act 1979): - (i) the CPW could be cleared in part from lot 39, (ii) the width of the riparian corridor would be 40m in total (20m each side of the creek), (iii) the width of any buffer of CPW to the riparian corridor would need to be negotiated as part of the species impact process but, probably, another 20m on each side (80m in total) would need to be provided, and (iv) an offset by way of compensatory payment would be required to establish, maintain and improve CPW in the vicinity of lot 39 in the order of $520,000.
12. Mr Fanning agreed that a riparian corridor of a total of 40m width would be likely to be required due to the creek. However, he considered the small size of the patch and its isolation from other vegetation meant that long-term viability of ecological diversity on lot 39 was most unlikely. He described the vegetation on lot 39 as a “small isolated patch in a sea of suburbia”. Mr Fanning thought it well established that such patches were marginal, serving no material biodiversity conservation, their real function being aesthetic or amenity based. In consequence, Mr Fanning did not accept a need for a buffer to the riparian corridor, thinking it more likely that there was an argument available to decrease rather than increase the corridor, perhaps to 20m in total (10m either side of the creek). Mr Fanning acknowledged that the Director-General of National Parks and Wildlife was likely to require a compensatory offset payment in the order of between $100,000 and $200,000 (adopting $150,000 in his report) for clearing of the CPW outside the riparian corridor. However, the Director-General would only be involved if a species impact statement was required.”
Jagot J comments at paragraph 13 in Bow (see below) are significant in the context of the discussions contained herein; it is clear that there is a need to apply a more empirical-based approach to establishing the environmental benefits of setbacks and off-sets:
“13. Ms Hayes and Mr Fanning agreed that their opinions did not involve the applications of hard and fast rules.”
The absence of targeted research extending environmental impact statements means it is difficult, if not impossible, to ascertain the true impacts or otherwise of any development over environmentally-informative spatial and temporal scales. To not undertake such research as part of an evidence-based decision-making approach, is likely to result in what Mr Fanning described in Bow as a landscape that has no material biodiversity and provides merely aesthetics or amenity functions only. These examples highlight important challenges pertaining to questions of ecological viability of populations or communities, which typically operate at vastly larger spatial and temporal scales than the impacts arising from the development of a plot of land. Although the use of the phrase a “a death by a thousand cuts” in Murlan was contended to be an emotive concept (Murlan Consulting Pty Ltd v Ku-ring-gai Council and Anor [2007] NSWLEC 704 (29 October 2007) at [21], it does, in reality, have meaning in an ecological sense. This is because habitat fragmentation and land clearing are well known to be primary threats to Australiaʼs biodiversity (Beeton et al., 2006). In assessing the biodiversity impacts arising from a development, it is desirable therefore that expert ecologists consider and provide evidence about the impacts that stem from a proposal over a broader scale. This will allow any impacts to be assessed in a more ecologically meaningful sense.
9
In assessing environmental impacts and attempting to decipher whether appropriate and adequate measures have been incorporated into any project so as to limit any likely harm to the environment (cf. BGP Properties Pty Limited v Lake Macquarie City Council [2004] at [114]), consideration of the potential efficacy of off-sets or bio-banking (notwithstanding the limitations discussed above) must be considered. These considerations should also encompass the aims and objectives of the Environmental Protection and Assessment Act 1979 (NSW), namely s 5 (Objects):
(i) the proper management, development and conservation of natural and artificial resources, including agricultural land, natural areas, forests, minerals, water, cities, towns and villages for the purpose of promoting the social and economic welfare of the community and a better environment, (vi) the protection of the environment, including the protection and conservation of native animals and plants, including threatened species, populations and ecological communities, and their habitats, and (vii) ecologically sustainable development
and s 79C (Evaluation):
(b) the likely impacts of that development, including environmental impacts on both the natural and built environments, and social and economic impacts in the locality
Therefore in dealing with the nexus between development and sustainability, the question that frequently arises in addressing environmental impacts is what bushland should we keep, why should it be retained and if so, how much should be preserved in order to retain integrity and viability. These are extremely difficult questions, to which there is no single, perfect or correct answer. The underlying objectives of providing terrestrial and aquatic habitat have been researched poorly with respect to policy, particularly in urban areas (see Ives et al., 2005; 2007), in part because of the difficulty in establishing the spatial habitat requirements of different species. The different requirements can have significant implications for the establishment of appropriate corridor dimensions. For example, Spackman and Hughes (1995) showed that a width of 30 m was required to capture >90 % of vascular plant species; Semlitsch and Bodie (2003) showed that between 127 – 289 m of vegetated riparian habitat may be necessary for the maintenance of reptiles; and Keller et al. (1993) showed that at least 100 m may be necessary to provide appropriate habitat for birds. While these spatial scales may well be species dependent, the point is that corridor dimensions need to reflect accurately the intended goals and needs of biodiversity. In addressing the spatial requirements for retaining maximum biodiversity, the case of retaining single or clumps of trees should be considered as well as the biodiversity benefits derived from the use of different buffer widths in the case larger tracks of bushland adjacent to development. The use of site-specific empirical data to define and elucidate the validity of long-term biodiversity goals will assist ecologists in their expert evidence and consent authorities in assessing
10
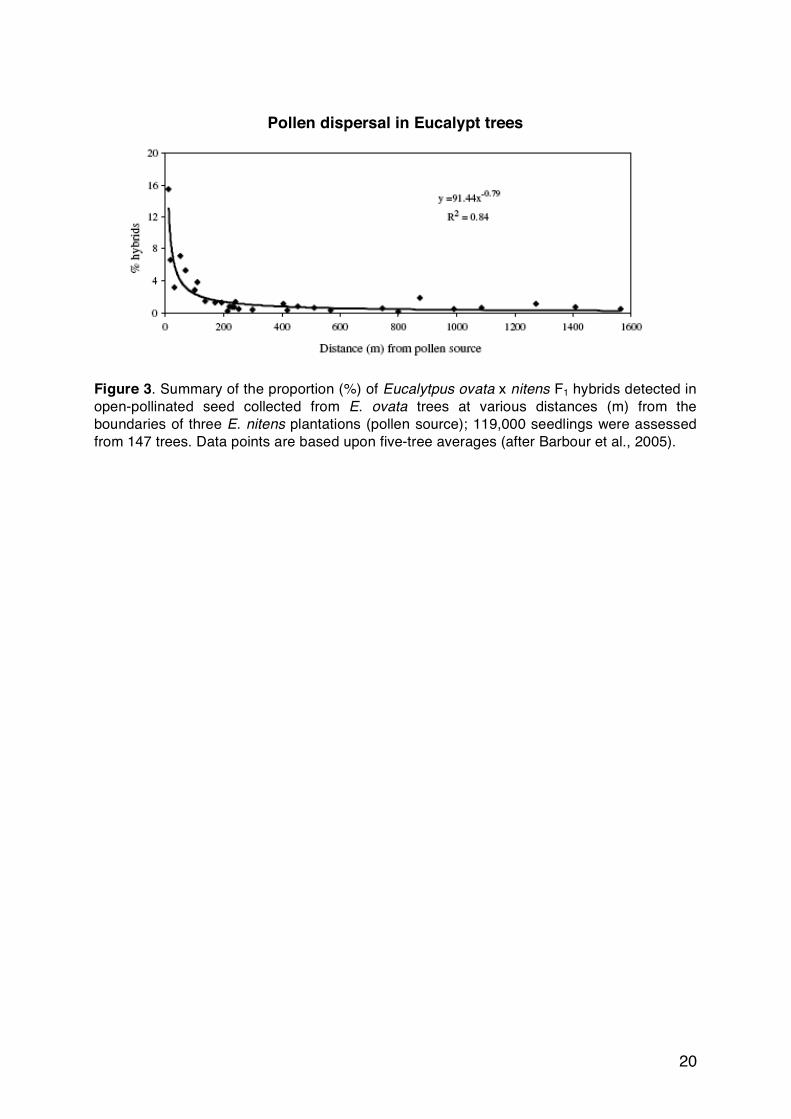
whether a proposal can be carried out in an environmental acceptable manner viable. Importantly, it will also provide the developer with evidence that the environmental works or setbacks and/or offsets that are requested are feasible and can be undertaken in an economically viable manner (cf. BGP at [119]). 6. Dealing with single and small isolated clumps of trees - the case of BGHF The importance of small patches of critically endangered ecological communities (EEC) has been highlighted in the Final Determination with respect to BGHF (Department of the Environment and Heritage 2005). In determining the ecological value of isolated fragments of EECs it is important to consider whether or not the conservation of single trees or isolated clumps will contribute to the long-term viability of that community. If they do, then serious consideration should be given to their protection. Eucalypts, the dominant tree species of the Australian continent, are outcrossed and pollinated preferentially by generalist insects, birds and mammals (Southerton et al., 2004). Barbour et al., (2005) studied the pollination of Tasmanian eucalypt plantations to evaluate the footprint of pollination and gene dispersal. This study showed that small insects (< 10 mm in length) disperse pollen regularly over 100 m and up to 1.6 km (Figure 3). Other studies have reported progenies up to 6 km from pollen source (Ashton and Sandiford, 1988; Potts 1990). Such long pollination distances have been reported elsewhere and eucalypts that are subject to pollen dispersal by larger biota may well have an even larger footprint. Importantly, in fragmented or low-forest density landscapes the dispersal curve may well extend over much greater distances (Dick et al., 2003). These studies support the conservation argument that retaining isolated and distal stands of trees is essential since they add to the genetic diversity, viability and robustness of remnant populations. The protection of remnant stands may be even more significant in cases where they are dispersed widely but retain some connectivity because genetic differentiation is likely to be greater between more distal populations. Incorporating these ideas into development decisions would undoubtedly assist in biodiversity protection and help safeguard ecological systems from fragmentation and piecemeal destruction. → Insert Figure 3 7. Setbacks, buffer and corridor widths on larger tracks of bushland The use of different buffer widths to protect biodiversity and maintain ecological functioning have been employed in numerous situations with respect to minimising development impacts. For example, in Silverwater Estate Pty Ltd v Auburn Council [2001] NSWLEC 60 (4 April 2001) a dispute arose in regard to the width of riparian setback along the Duck River, in Silverwater, Sydney. Much of the dispute centred on the width of riparian buffer required for achieving particular environmental outcomes. These included the protection of an endangered plant; provision of habitat for migratory and endangered birds; protection of an adjacent wetland ecosystem and its functioning as a wildlife corridor to increase connectivity between terrestrial habitats. The corridor was also meant to provide a protective barrier against sediments,
11
pollutants, excess nutrients and poor quality water entering the aquatic environment. Although each of these objectives required different management approaches, the attempts to include all the goals within a 30 m riparian buffer was the cause of much conflict in the case. Similarly in Gerroa Environmental Protection Society Inc v Minister for Planning and Clearly Bro (Bombo) Pty Ltd [2008] NSWLEC 173, Preston CJ had to formulate a decision with respect to corridor and buffer widths. In making his decision Preston CJ took a conservative approach:
117. The loss of native vegetation is not an optimal situation but, balancing the other relevant matters, the removal of the vegetation can be accepted. Although the proposed development results in clearing of areas of vegetation comprising endangered ecological communities, the offset package, comprising greater conservation status and better management of much larger areas of native vegetation (in Zones 1, 4 and 5), themselves mostly comprising endangered ecological communities, together with the establishment of compensatory habitats (primarily Zone 2 although Zones 3 and 6 would be of some habitat value), seeks to restore the functions provided by the vegetation to be cleared. In the longer term, I am satisfied that this can occur.
and
124. Accepting that Areas 2B.1 and 2C.1 can be provided with appropriate planting, the remaining question is whether the width of this corridor should be 40 m or 50 m. Because Areas 2B.1 and 2C.1 are to perform the important function of a fauna corridor (in addition to other functions) I am satisfied that it is more appropriate to adopt a cautious approach and require the corridor to be 50 m in width. I have come to this conclusion because of the potential edge effects along the northern boundary of this corridor and also the uncertainty over the future use of the land adjoining the corridor. Clearly, the protection of the fauna corridor should be given a high priority as it is a fundamental part of the application and should be given considerable weight in the assessment of the development application. If for no other reason, the additional 10 m will provide a buffer from edge effects and give greater protection to the corridor and consequently its long-term integrity.
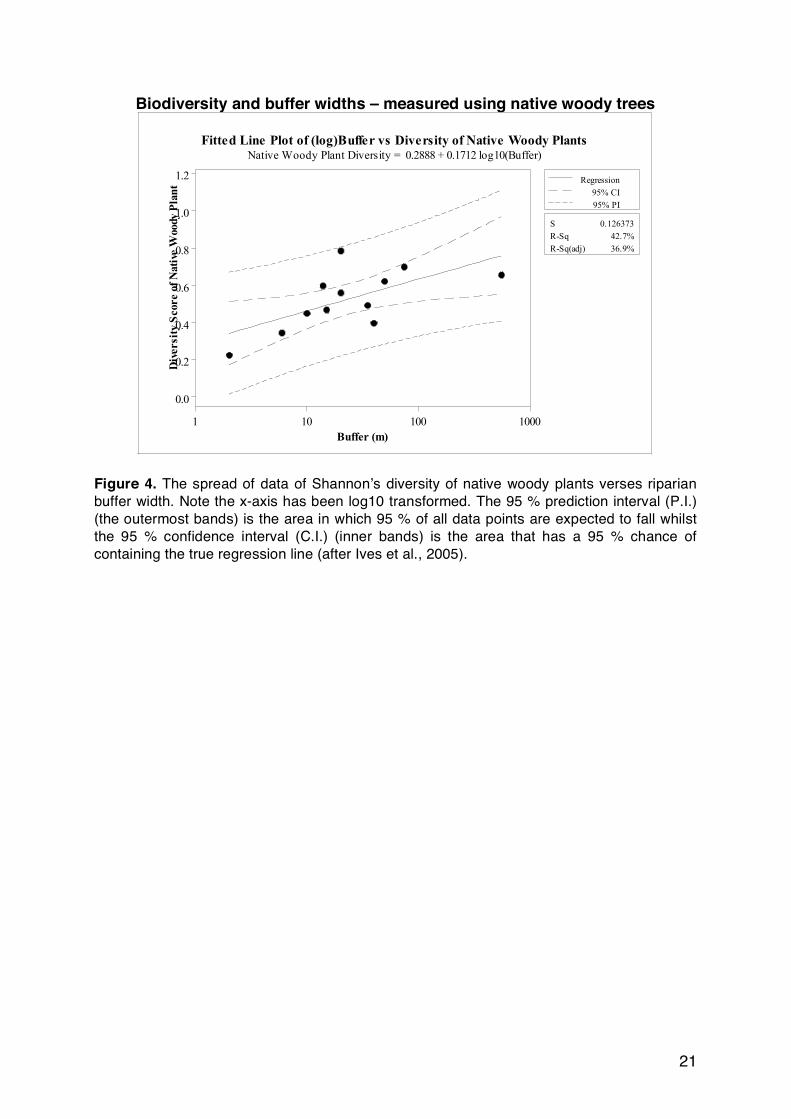
Although there was no specific empirical basis for extension of the buffer to 50 m in Gerroa or 30 m in Silverwater, it is likely that these setbacks will provide a useful level of environmental protection. However, the fact that there has been a paucity of research examining the utility of different setback widths for achieving specific environmental goals is of serious concern. Ives et al. (2005) in a preliminary study examined varying buffer widths and the diversity of native woody species along stream systems and showed that wider buffers influence species diversity (r2 = 42.7, Figure 4). However, while it was clear that a high diversity of native woody plants is possible with small buffer widths, these corridors suffer considerable influence from edge effects. These effects include weed encroachment, pollutants, noise and urban runoff and a high degree of maintenance would be required to retain such an area in a natural state. → Insert Figure 4
12
Building on these findings, Ives et al. (2007) examined the biodiversity composition and condition of a range of terrestrial bushland environments across Ku-ring-gai in northern Sydney. This study revealed a range of important findings with respect to biodiversity preservation. Firstly, it was identified that riparian zones were significantly richer taxonomically than ʻuplandʼ i.e. non-riparian areas and that invertebrate assemblage structures are significantly different between these two habitat types (Figure 5a). It was also shown that fire and bushland regeneration significantly influenced the taxonomic structure of invertebrate communities (5b). The juxtaposition of terrestrial and aquatic habitats is well known to support greater biodiversity, in part because the ecological structure is more heterogeneous but also because food webs and species variability are greater at the land-water interface. Ives et al.ʼs (2007) study of species biodiversity and of the processes influencing it provides useful empirical evidence to support policy approaches for the protection of riparian bushland corridors from future urban development pressures (Taylor and Peterson, 2005). → Insert Figure 5a,b More recent research has examined specifically the extent to which different riparian buffer widths relate to biodiversity outcomes (Ives et al., 2008). The research explored the question of off-sets, corridor and buffer widths in order to optimize decision-making, such as that undertaken in Silverwater and Gerroa. The findings of this research are shown in Figures 6a,b. Similar trends were evident from the values returned for biodiversity surrogate measurements (assemblages) using ants and plants. Where buffers are of > 125 m width they have distinctly different community assemblages as compared to equivalent sampling undertaken in corridor widths of 75 m or less. A confounding factor of these findings is that as the buffer width increases so does the distance from the true riparian zone. Notwithstanding this fact, it is clear that wider buffers produce distinctly different assemblages, which is in part due to reduced edge effects compared to narrow corridors. Therefore, the evidence suggests that when providing for biodiversity in the context of development, consideration should be given to retaining and constructing the maximum buffer widths possible. → Insert Figure 6a,b There are a number of conclusions that can be drawn from this study. Firstly, wide riparian corridors were found to contain significantly more species (and micro-habitats) compared to narrow corridors. The width of a riparian corridor also influenced species assemblages of plants and ants. However, it was evident that this relationship was not clear-cut, especially in the corridors less than 75 m in width. This indicates that other factors such as vegetation type, soil, landscape context, adjacent landuse etc. may also contribute to the biodiversity of a riparian corridor. This finding is supportive of the argument that biodiversity is very much indeed space and place orientated and that site specific studies are essential in understanding the potential or otherwise of setbacks. Overall, the research findings highlight the importance of understanding the specific ecology of a site in order to conserve maximum biodiversity and ecological functions, rather than simply prescribing a minimum
13
riparian and/or bushland corridor width as part of a generic urban biodiversity management plan. 8. Summary A more considered and thoughtful approach towards biodiversity protection is required, particularly in relation to development. The combined impacts of biodiversity loss, climate change and population growth will continue to present serious long-term challenges for scientists, developers and decision-makers in attaining true ecological sustainable development. These issues have been addressed at all social and political levels from world bodies such as the United Nations and World Wildlife Fund, to federal and local governments through to activist (e.g. the Wentworth Group) and community groups. Indeed, success will only eventuate with a concerted effort at all levels. Although there has been a significant increase in environmental awareness along with numerous good reforms, legislative frameworks and guiding principles (e.g. the ʻPrecautionary Principleʼ), many decisions are still made on a relatively piecemeal basis. This often occurs because decisions relating to development projects are restricted to the subject site and there is limited scope to consider the real impacts on a broader scale. This results in fragmentation and degradation of habitats and the reduction of species resilience to survive. To overcome these issues in development projects, there is a need to consider setbacks, offsets and buffers based on specific biodiversity objectives, rather than the broad legislative interpretations currently permissible. By utilising a research-based approach to development, the intended outcomes of environmental protection legislation will be achieved. General guiding principles for any given region and for any given set of features remain poorly supported by research. However, the technical capacity to assess patterns and types of risk and to determine the most effective monitoring and management programs do exist (Gaston et al., 2002). Indeed, such an approach will help to sustain and support more effectively the matrix of biodiversity and ecological systems across the wider landscape and will strengthen the implementation and effectiveness of legislative objectives. Acknowledgements I would like to thank Chris Ives my MPhil student at Macquarie University, whose research work and ideas have stimulated my thinking in ecology. Heʼs been the font of many interesting and challenging ideas and discussions. References Ashton, D.H. and Sandiford, L.M. 1988. Natural hybridisation between Eucalyptus regnans F. Muell. And E. macrorhyncha F. Muell in the Cathedral Range, Victoria. Australian Journal of Botany, 36, 1-22.
14
Barbour, R.C., Potts, B.M. and Vaillancourt, R.E. 2005. Pollen dispersal from exotic eucalypts. Conservation Genetics, 6, 253-257. Beatley, T. 2000. Preserving Biodiversity: Challenges for Planners. Journal of the American Planning Association, 66(1): 5-20. Beeton, R.J.S., Buckley, K.I., Jones, G.J., Morgan, D., Reichelt, R.E., (2006 Australia State of Environment Committee) 2006. Australia State of Environment Report, 2006. Independent report to the Australian Government Minister for the Environment and Heritage. Department of the Environment, Water, Heritage and the Arts. Australian Commonwealth Government. http://www.environment.gov.au/soe/2006/publications/drs/biodiversity/issue/68/index.html - Accessed October 14th 2008. Benson, D. and Howell, J. 1990. Sydneyʼs vegetation 1788—1988: utilization, degradation and rehabilitation. Proceedings of Ecological Society of Australia, 16, 115-127. Broberg, L. 2003. Conserving ecosystems locally: a role for ecologists in land-use planning. Bioscience, 53(7): 670-673. Collar, N.J. 2003. Beyond value: biodiversity and the freedom of the mind. Global Ecology and Biography, 12, 265-269. Constanza, R., dʼArge, R., de Groot, R., Farber, S., Grasso, M., Hannon, B., Limberg, K., Naeem, S., OʼNeill, R.V., Paruelo, J., Raskin, R.G., Sutton, P., van den Belt, M. 1997. The value of the worldʼs ecosystem services and natural capital. Nature, 387, 253-260. Cork, S. 2002. What are ecosystems services? RipRap, Land and Water Australia, 21, 1 & 3-9. Available at http://www.rivers.gov.au/Publications_and_Products/Rip_Rap/index.aspx - Accessed October 14th 2008. Department of Environment and Climate Change (New South Wales Government) 2008. Biodiversity Certification. http://www.environment.nsw.gov.au/biocertification/index.htm - Accessed October 12th 2008. Department of the Environment and Heritage 2005. Blue Gum High Forest of the Sydney Basin Bioregion. Department of the Environment, Water, Heritage and the Arts. Australian Commonwealth Government. http://www.environment.gov.au/biodiversity/threatened/publications/sydney-blue-gum.html - Accessed October 12th 2008. Dick, C.W., Etchelecu, G., Austerlitz, F. 2003. Pollen dispersal of tropical trees (Dinizia excelsa): Fabaceae) by native insects and Africa honeybees in pristine and fragmented Amazonian rainforest. Molecular Ecology, 12, 753-764.
15
Ecologically Sustainable Development Steering Committee (1992) National Strategy for Ecologically Sustainable Development (NSESD). Department of the Environment, Water, Heritage and the Arts. Australian Commonwealth Government. http://www.environment.gov.au/esd/national/nsesd/strategy/intro.html - Accessed October 12th 2008. Fuller, R. A., Irvine K. N., Devine-Wright, P., Warren, P. H. and Gaston, K. J. 2007. Psychological benefits of greenspace increase with biodiversity. Biology Letters, 3(4), 390-394. Gaston, K.J., Pressey, R.L., Margules, C.R. 2002. Persistence and vulnerability: retaining biodiversity in the landscape and in protected areas. Journal of Bioscience, 27(4), 361-384. Hinrichsen, D. and Robey, B. 2000. Population and the Environment: The Global Challenge, Population Reports, Series M, No 15, Baltimore, Johns Hopkins University School of Public Health Information Program, Fall, 2000, pp. 31. Ives, C., Taylor, M.P., Davies, P., Wilks, D. 2005. How wide is wide enough? The relationship between riparian buffer width, condition and biodiversity: An assessment of urban creek systems in the Ku-ring-gai Local Government Area, North Sydney, NSW. In Khanna, N., Barton, D., Beale, D., Cornforth., R., Elmahdi, A., McRae, J., Seelsaen, N., Shalav, A. (Eds), Environmental Change: making it happen: 9th Annual Environmental Research Conference, 29th November to 2nd December 2005, Hobart, Tasmania. (Available on CD and at http://www.es.mq.edu.au/physgeog/staff/mt/ERE2005/Chris%20Ives%20ERE%202005.pdf - Accessed October 12th 2008). Ives, C., Taylor, M.P. and Davies, P. 2007. Ecological condition and biodiversity value of urban riparian and non-riparian bushland environments: Ku-ring-gai, Sydney. In Wilson, A.L., Dehaan, R.L., Watts, R.J., Bowmer, K.H. and Curtis, A. Proceedings of the 5th Australian Stream Management Conference. Australian Rivers: making a difference. Charles Sturt University, Thurgoona, New South Wales, pp. 163-168. Ives, C., Taylor, M.P. Nipperness, D., Davies, P. 2008. Riparian Corridor Width Influences Ant and Vegetation Assemblages. Poster [resentation at the Society for Conservation Biology, Annual Meeting, July 2008, Chattanooga, Tennessee, USA.
Jim, C. Y. and Chen, W. Y. 2006. Recreation–amenity use and contingent valuation of urban greenspaces in Guangzhou, China. Landscape and Urban Planning, 75, 81-96. Kahn, A. E. 1966. The tyranny of small decisions: Market failures, imperfections, and the limits of economics. Kyklos 19(1), 23-47. Keller, C. M. E., Robbins, C. S. and Hatfield, J. S. 1993. Avian communities in riparian forests of different widths in Maryland and Delaware. Wetlands, 13, 137-144. Kuo, F. E. 2001. Coping with poverty: Impacts of environment and attention in the
16
inner city. Environment and Behaviour, 33(1), 5-34. Local Agenda 21 Program (LA21) 1997. Department of the Environment, Water, Heritage and the Arts. Australian Commonwealth Government. http://www.environment.gov.au/esd/la21/index.html - Accessed October 12th 2008. Marzluff, J. M. 2002. Fringe conservation: a call to action. Conservation Biology, 16(5), 1175-1176. McDonald, T. 2008. Is new language – or a new attitude – needed for innovations that integrate conservation and development? Ecological Management and Restoration, 9(2), 85. McDonnell, M. J., Pickett, S., Groffman, P., Bohlen, P., Pouyat, R., Zipperer, W., Parmelee, R., Carreiro, M. and Medley, K. 1997. Ecosystem processes along an urban-to-rural gradient. Urban Ecosystems, 1: 21-36. McKinney, M. L. 2002. Urbanization, biodiversity and conservation. Bioscience, 52(10), 883-890 McKinney, M. L. 2006. Urbanization as a major cause of biotic homogenisation, Biological Conservation, 127, 247-260. Meadows, D.H., Meadows, D.L., Randers, J. and Behrens III, W.W. 1972. The limits to growth. A report for the Club of Rome's Project on the Predicament of Mankind (Paperback) Universe Books, New York, pp. 205. Miller, J. R. 2005. Biodiversity conservation and the extinction of experience. Trends in Ecology and Evolution, 20(8), 430-434. Niemela, J. Ecology and urban planning. Biodiversity and Conservation, 8, 119-131. NSW Government 2007. Notice of Final Determination under the Threatened Species Conservation Act 1995. Government Gazette of the State of New South Wales, 54, 2357-2363, April 20th 2007. Pimentel, D., Bailey, O., Kim, P., Mullaney, E., Calabrese, J., Walman, L., Nelson, F. and Yao, X. 1999. Will limits of the Earthʼs resources control human numbers? Environment, Development and Sustainability, 1(1), 19-39. Potts, B.M. 1990. The response of eucalypt populations to a changing environment. Tasforests, 2 (2), 17-93. Available at http://www.forestrytas.com.au/assets/0000/0416/tf_2_issue_2_article_15.pdf - Accessed 12th October 2008. Rebele, F. 1994. Urban ecology and special features of urban ecosystems Global Ecology and Biogeography Letters 4(6), 173-187. Saier, M. 2004. The rise and fall of civilizations. The Environmentalist, 24, 195-197.
17
Semlitsch, R. D. and Bodie, J. R. 2003. Biological criteria for buffer zones around wetlands and riparian habitats for amphibians and reptiles. Conservation Biology, 17(5), 1219-1228. Southerton, S.G., Birt, P., Ford, H.A. 2004. Review of gene movement by bats and birds and its potential significance for eucalypt plantation forestry. Australian Forestry, 67(1), 44-53. Spackman, S. C. and Hughes, J. 1995. Assessment of minimum stream corridor width for biological conservation: species richness and distribution along mid-order streams in Vermont, USA. Biological Conservation 71, 325-332. Tamar, J. 2006. Immigration Nation. Foreign Affairs, 85(6), 50-65. Taylor, M.P. 2007. The drivers of immigration in contemporary society: unequal distribution of resources and opportunities. Human Ecology, 35 (6), 775-776. Taylor, M.P. and Peterson, R. 2005. Riparian zones and urban development: impacts, values, challenges and opportunities – Keynote Lecture. In Khanna, N., Barton, D., Beale, D., Cornforth, R., Elmahdi, A., McRae, J., Seelsaen, N., Shalav, A. (Eds), Environmental Change: making it happen: 9th Annual Environmental Research Conference, 29th November to 2nd December 2005, Hobart, Tasmania. (Available on CD and at http://www.es.mq.edu.au/physgeog/staff/mt/ERE2005/Taylor%20ERE%202005.pdf - Accessed October 12th 2008). Trewin, D. 2006. Measuring Australiaʼs Progress. Australian Bureau of Statistics, Canberra, Commonwealth of Australia, pp. 216. Wackernagal, M., Schulz, N.B., Deumling, D., Linares, A.C., Jenkins, M., Kapos, V., Monfreda, C., Loh, J., Myers, N., Norgaard, R. and Randers, J. 2002. Tracking the ecological overshoot of the human economy. Proceedings of the National Academy of Sciences, 99(14), 9266-9271.
18
Figure 1. Ecosystem services. These services emerge from the transformation of natural assets into useable products (production services), or the recycling and transformation of end products back into natural assets (assimilation services) or internal transformations that maintain natural assets (maintenance services). Modified from Cork (2002).
19
Global ecological demand over time, in global hectares Figure 2a. Global ecological demand over time, in global hectares. This graph documents humanity's area demand in six different categories. The six categories are shown on top of each other, demonstrating a total area demand of over 13 billion global hectares in 1999. Global hectares represent biologically productive hectares with global average bioproductivity in that year (after Wackernagel et al., 2002).
Time trend of humanity's ecological demand Figure 2b. Time trend of humanity's ecological demand. This graph shows human demand over the last 40 years as compared with the earth's ecological capacity for each year. One vertical unit in the graph corresponds to the entire regenerative capacity of the earth in a given year. Human demand exceeds nature's total supply from the 1980s onwards, overshooting it by 20 % in 1999. If 12 % of the bioproductive area were set aside to protect other species, the demand line crosses the supply line in the early 1970s rather than the 1980s (after Wackernagel et al., 2002).
20
Pollen dispersal in Eucalypt trees
Figure 3. Summary of the proportion (%) of Eucalytpus ovata x nitens F1 hybrids detected in open-pollinated seed collected from E. ovata trees at various distances (m) from the boundaries of three E. nitens plantations (pollen source); 119,000 seedlings were assessed from 147 trees. Data points are based upon five-tree averages (after Barbour et al., 2005).
21
Biodiversity and buffer widths – measured using native woody trees
Buffer (m)
Div
ersit
y S
core o
f N
ati
ve W
oody P
lan
t
1000100101
1.2
1.0
0.8
0.6
0.4
0.2
0.0
S 0.126373
R-Sq 42.7%
R-Sq(adj) 36.9%
Regression
95% CI
95% PI
Fitted Line Plot of (log)Buffer vs Diversity of Native Woody PlantsNative Woody Plant Diversity = 0.2888 + 0.1712 log10(Buffer)
Figure 4. The spread of data of Shannonʼs diversity of native woody plants verses riparian buffer width. Note the x-axis has been log10 transformed. The 95 % prediction interval (P.I.) (the outermost bands) is the area in which 95 % of all data points are expected to fall whilst the 95 % confidence interval (C.I.) (inner bands) is the area that has a 95 % chance of containing the true regression line (after Ives et al., 2005).
22
Bushland biodiversity – riparian, non-riparian, burnt and unburnt habitat patches
Figure 5a. Box plots of Margalefʼs richness index (d) comparing biodiversity in riparian and upland i.e. non-riparian bushland habitats. The results show that riparian bushland has higher measures of biodiversity compared to upland bushland. Figure 5b. Box plots of Margalefʼs richness index (d) comparing biodiversity in burnt and unburnt bushland habitats. The results show that unburnt patches of bushland have higher measures of biodiversity. Note: The biodiversity of each site was measured using pitfall fall traps to capture a range of invertebrates (beetles, flys, cockroaches, ants, wasps, bees and crustaceans). The box plots show the distribution of the data: the dark line marks the median value (50th percentile), while the upper part of the box marks the 75th percentile and the lower envelope marks the 25th percentile. The lower whisker marks the 0th percentile while the upper one demarks the 100th percentile.
23
Biodiversity of ants and plants measured across different buffer widths
Figure 6a. This figure shows the response of ant assemblages to corridor width using Non-Metric Multidimensional Scaling (MDS) techniques.
Figure 6b. This figure shows the response of plants assemblages to corridor width using Non-Metric Multidimensional Scaling (MDS) techniques. The results from both samples types (6a,b) show that there is a significant difference in composition between narrow corridors < 75 m width and the > 125 m wide reference sites. Essentially, the closer together any two points (samples) are in two-dimensional space, the more similar they are in composition. The critical point here is that the results from the widest corridor (> 125 m) are, on the whole, separate and distinct from the other samples. ANOSIM = Analysis of Similarity; P = Probability value.