BscB 6. Semester Department of Economics The First of May, 2013 Authors: Peter Fedders Examination Number: 301668 Rasmus Villadsen Examination Number: 301667 Advisor: Baran Siyahhan Characters: 135853 Bachelor Thesis LEGO GROUP ------------------------------------------- A STRATEGIC AND VALUATION ANALYSIS Aarhus University Business and Social Sciences Spring 2013
Transcript
BscB 6. Semester Department of Economics The First of May, 2013 Authors: Peter Fedders Examination Number: 301668 Rasmus Villadsen Examination Number: 301667 Advisor: Baran Siyahhan Characters: 135853
Bachelor Thesis
LEGO GROUP ------------------------------------------- A STRATEGIC AND VALUATION
ANALYSIS
Aarhus University
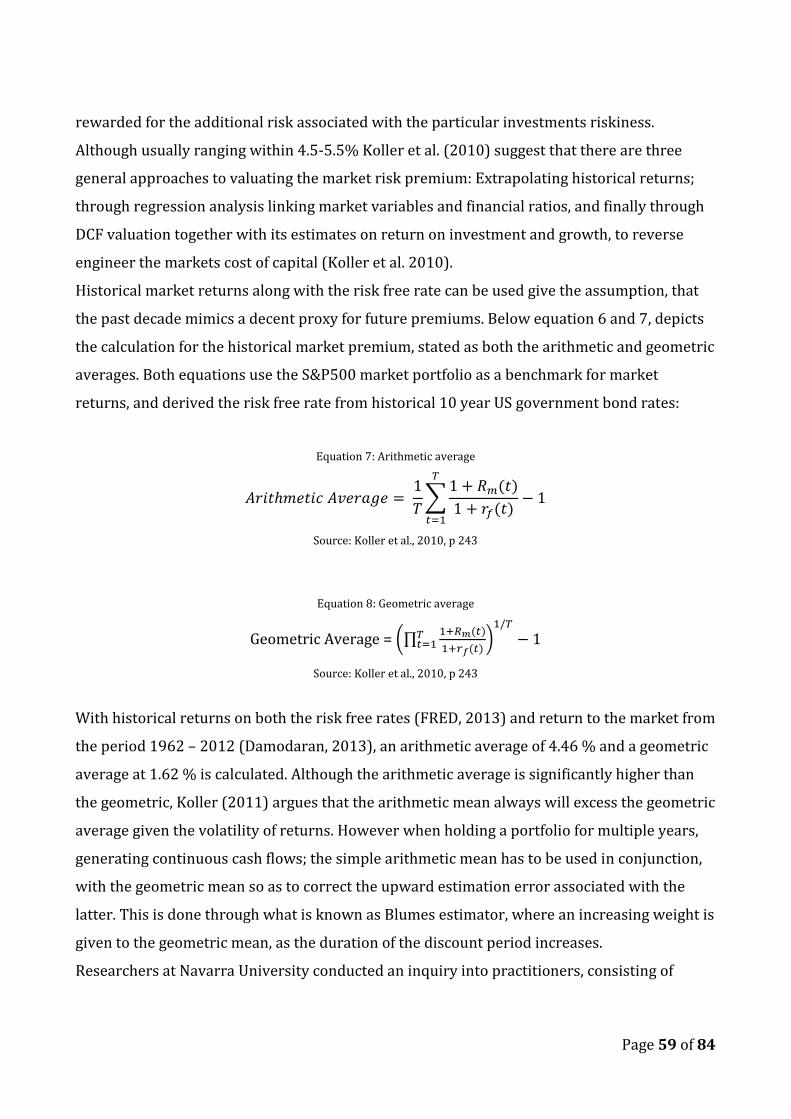
Business and Social Sciences
Spring 2013
Page 1 of 84
1. Abstract:
The purpose of this thesis is to quantify and estimate the value of Danish toy manufacturer
LEGO. Thus the external and internal environment in conjunction with recent years financial
statements, will assess the hypothetical value associated with the projections and assets
related to said company.
LEGO operates in a market, which has seen interesting developments within the past decade.
During this period LEGO managed to recover from the severe difficulties they faced at the
beginning of the second millennium. With impressive recent growth rates, exceeding 25 % in
2012, the thesis set about valuation whether this could be sustained.
To arrive at a concrete firm value, future revenue steams was estimated and evaluated based
on strategic performance along with historical financial ratios. Within the strategic analysis
several leavers was identified, providing LEGO with competitive advantages. Among others
these advantages included the successful use of licenses from well-known franchises and
skillful handling of their operating processes. In addition areas of opportunity such as blue
ocean markets and widening of the product portfolio was argued to help sustain growth,
whilst threats from entrants to the market and price competition constituted future
uncertainties.
Given the inflow of additional competitors on the construction toy market, and as the current
market structure changes from a dominant firm and oligopolistic competition structure, to a
more balanced competitive market, lead us to conclusion that future revenue growths
eventually in the year 2019 will growth in line with the overall market.
Through enterprise discounted cash flow, together with estimations regarding weighted
average cost of capital, future free cash flows has been discounted back to the present value.
This discount rate is based on a fixed capital structure, using 10-year government bonds along
with a synthetic company specific beta and market return estimations. Through these
estimations a total weighted average cost of capital (WACC) was estimated at 6.61 %. Given
this discount rate, a total firm value of roughly 140 billion DKK was estimated, based on a
4.1.1 Primary activities ............................................................................................................................................................ 14 4.1.1.2 Inbound logistic ............................................................................................................................................................................................... 14 4.1.1.3 Operations .......................................................................................................................................................................................................... 14 4.1.1.4 Outbound logistic ............................................................................................................................................................................................ 15 4.1.1.5 Marketing and Sale ......................................................................................................................................................................................... 16 4.1.1.6 Service .................................................................................................................................................................................................................. 18
4.1.2 Support Activities: ........................................................................................................................................................... 19 4.1.2.1 Firm infrastructure ........................................................................................................................................................................................ 19 4.1.2.2 Human resources management ............................................................................................................................................................... 19 4.1.2.3 Technology development ............................................................................................................................................................................ 20 4.1.2.4 Procurement ...................................................................................................................................................................................................... 21
4.2 PORTERS FIVE FORCES ........................................................................................................................................................ 22 4.2.1 Bargaining power of suppliers: ................................................................................................................................. 23 4.2.2 Buying power of consumers: ...................................................................................................................................... 24 4.2.3 Threat of new competition .......................................................................................................................................... 25 4.2.4 Threat for substitutions ................................................................................................................................................ 26 4.2.5 Rivalry ................................................................................................................................................................................... 27
5.1.1 Reformulation of balance sheet ................................................................................................................................ 39 5.1.2 Reformulation of income statement ....................................................................................................................... 41
5.2 HISTORICAL ANALYSIS ........................................................................................................................................................ 41 5.2.1 Return on Invested Capital .......................................................................................................................................... 41 5.2.2 Invested capital ................................................................................................................................................................ 43 5.2.3 Net operating profit less adjusted taxes ............................................................................................................... 44 5.2.4 Free cash flow .................................................................................................................................................................... 46 5.2.6 Efficiency analysis ........................................................................................................................................................... 47
5.3.2 Revenue growth in explicit period ........................................................................................................................... 49 5.3.3 Explicit period ratios ...................................................................................................................................................... 50
5.4 COST OF CAPITAL ................................................................................................................................................................. 53 5.4.1 Capital structure .............................................................................................................................................................. 53 5.4.2 Cost of debt ......................................................................................................................................................................... 54
5.4.4 WACC ..................................................................................................................................................................................... 63 5.5 EXPLICIT AND CONTINUING VALUE PERIOD VALUATION .............................................................................................. 63
5.5.1 Projected company value ............................................................................................................................................. 63 5.6 COMPETITOR COMPARISON ................................................................................................................................................ 64 5.7 SENSITIVITY ANALYSIS ........................................................................................................................................................ 65
5.7.1 Scenario 1: Change in WACC ...................................................................................................................................... 65 5.7.2 Scenario 2: Change in revenue growth in the explicit period ..................................................................... 66 5.7.3 Scenario 3: Change in net-profit margin .............................................................................................................. 67
Equation 1: N-firm concentration ratio ........................................................................................................................... 83 Equation 2: HH-index ................................................................................................................................................................ 83 Equation 4: ROIC ......................................................................................................................................................................... 83 Equation 5: Cost of debt ........................................................................................................................................................... 83 Equation 6: Cost of equity ....................................................................................................................................................... 84 Equation 7: Arithmetic average ........................................................................................................................................... 84 Equation 11: Equity beta ......................................................................................................................................................... 84 Equation 12: WACC .................................................................................................................................................................... 84 Equation 13: Continuing value in period 7 ..................................................................................................................... 84 Equation 14: Present value of continuing value ........................................................................................................... 84
Page 4 of 84
2. Introduction
“Consumer companies from Mattel Inc to AutoNation Inc. are beating analysts’ sales estimates
by the broadest margin in Standard & Poor’s 500 Index as shoppers help spur growth in the U.S.
economy” (Burritt, 2013) Immediately after this leading paragraph in a recent article from
financial company Bloomberg, stock prices rose as the positive critique helped boost
anticipations regarding the future for the respective companies. The stock market is quick to
react to news regarding sales or other company and market specific news in order to make a
profit. In this way the stock markets help discipline companies and managers to return profits
and outperform its competitors, in order to satisfy investors expectations. At any given point,
these expectations can be measured in terms of stock prices and market capitalization; for
private companies however, the same scrutiny and observation is not present, therefore the
‘current estimated market value’ are often not up-to-date, nor reflecting the latest market
developments.
With the American company Mattel often attributed as the world’ biggest toy manufacturer, it
would be interesting for us to try and estimate one of their biggest private contenders, namely
LEGO, to valuate this claim. Therefore we wish to investigate and divulge the current internal
and external marked and strategic situation applicable to said company, so as to estimate the
future performance necessary in valuating the underlying assets and growth potential. Taking
its point of departure primarily from Mckinsey’ ‘measuring and managing the value of
companies’ along with acknowledged theoretical frameworks, within the business
environment, the aforementioned estimations will be forecasted so as to arrive at a concrete
valuation of the LEGO group.
LEGO have since 2004 experienced tremendous growth and transformation allowing them to
recover from a morass of inefficient strategies along with sever financial difficulties that
characterized the years leading up to this date. At early spring 2013, LEGO disclosed yet
another superb annual report, with revenue growths around 25 % following years of
aggressive growth in an otherwise declining market toy market. This naturally raise the
question whether LEGO can sustain these phenomenal performances into the future, or if they
faces significant challenges in the future, that might dampen growth along the future value of
the company.
Page 5 of 84
Research question:
Given this introduction, our researches question can be stated as follows: “Determining the
overall firm value, for the Danish toy manufacturer LEGO, through a discounted cash flow
analysis, with projections from a strategic and financial performances.”
2.1 Limitations:
Given the extent and steep learning curve when faced with examining and learning a new and
unfamiliar subject, such as company valuation, this naturally imposes some restrictions on the
extend of content. Having previously touched upon subjects such as WACC, CAPM and
Discounted cash flow, we only had very limited experience within these fields, at the initiation
of the writing process. In addition to said issue, additional restrictions are imposed by the lack
of perfect information, prohibiting accuracy within certain estimations and forecasts.
Therefore we have sometimes resorted to assumptions and approximations, which albeit
sincere, might have mitigated the sense of reality. These assumptions are especially related to
the estimations of growth and cost of capital, where issues such as growth in the continuing
value period or the amount of debt/equity to value ratios have been derived under the
presence of either pseudo or proxy variables.
This paper do not wish to argue and include the discussion, whether an introduction to the
stock market would be beneficial from an economical point of view; given the relative amount
of time and focus spend on the strategic and valuation part, that only renders a small section
left to elaborate whether this would be beneficial. Nor have each of the elements within the
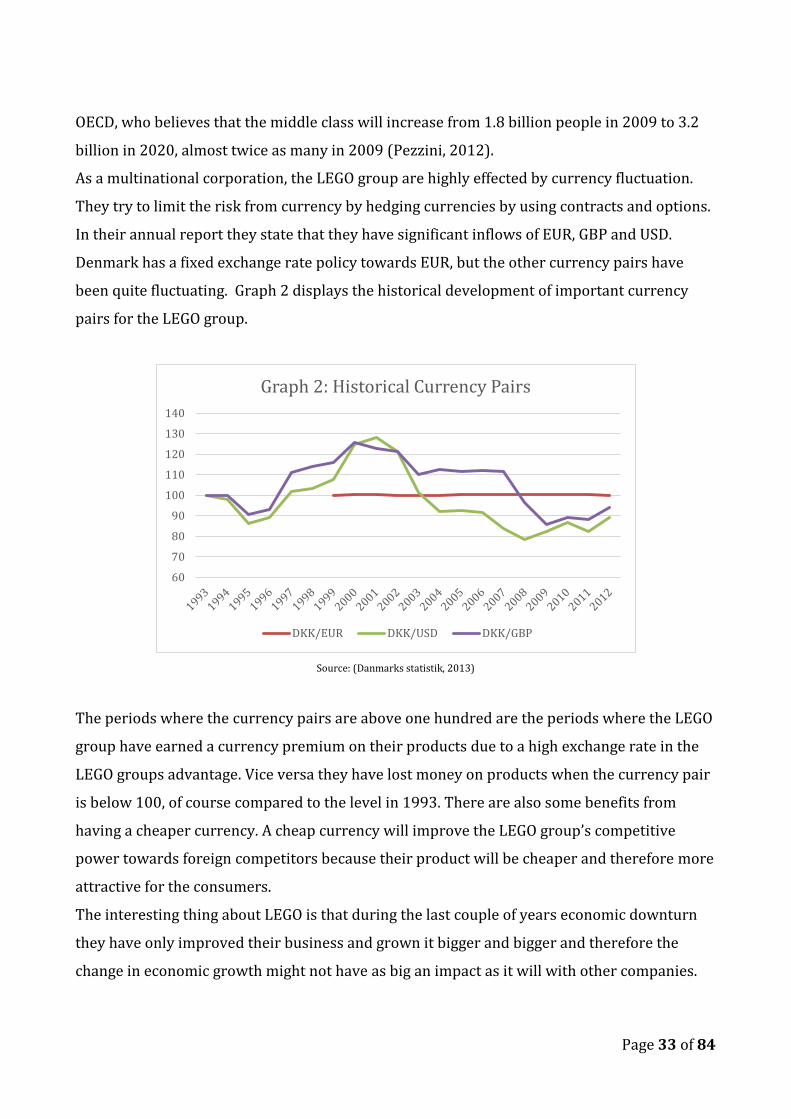
strategic analysis been completely desiccated in minute details, as this would make this
portion un-proportionally extensive.
We still believe however, that our approach serves as a decent approximation given the
abilities and skills available at the initiation of this thesis.
Page 6 of 84
2.2 LEGO Company Profile:
The historical foundation of the LEGO group dates back to 1932, when the original founder,
Ole Kirk Christiansen, started making wooden toys, in the small provincial Danish town of
Billund, emphasizing the motto ‘Only the best is good enough’; a motto which is still in use
today. Deriving their company name from the Danish words ‘Leg godt’ loosely translating into
‘play well’ and coincidentally ‘I create’ in Latin. Following years of hardship, with many
setbacks through most of the 1930’s and early 40’s, along with the death of the founder Ole
Kirk Kristiansen in 1958, the control of the company was handed over to one of his four sons,
Godtfred Kirk Christiansen. Godtfred had being working alongside his dad for the most of his
life, and continued the development of plastic bricks and toys, which only had been
introduced a few years earlier. This development resulted in the patent submission of the
LEGO brick, which we know today, in 1958(Christiansen, 1961). Following a fire in 1960,
where most of the wooden toy manufacturing facilities was damaged, Godtfred chose to
disclose the production of wooden toys, in favor of producing only plastic products. This
proved to be a good decision as sales, helped by an introduction of their products to
neighboring north European countries, quickly rose. With increased international sales,
Godtfred decided to open Billund airport, which would allow easier distribution and means of
travel, today Billund airport is Denmark’s second largest, but not longer have any direct
connection to the LEGO group.
Sales of LEGO continued to increase through the later half of the twentieth century, however
with the rise of electronic entertainment and more sluggish sales, the company began to
diversify away from their historical core products. Management hoped that with increased
innovation and more autonomous control, sales would improve. This, however, proved to be a
disastrous experiment, as the many new products failed to compete with already established
producers. Furthermore the number of different components used for the individual sets rose
at unprecedented speed, deteriorating operating costs. Perhaps one of the most famous failed
attempts, was the renaming in 2001 of the LEGO subsection ‘Duplo’ to ‘Explorer’, sales quickly
dropped, as parents no longer recognized the new name, which had no brand equity, and
ultimately LEGO had to change the name back to Duplo (Lipkowitz, 2012).
As a result of the failed strategies and high losses, LEGO had to make a turnaround; this was
materialized with the resignation of Kjeld Kirk Christiansen, and the promotion of the new
Page 7 of 84
CEO, Jørgen Vig Knudstorp. Knudstorp emphasized the need to reduce the wide product
portfolio, narrowing down the number of different components, and going back to basic.
Under Knudstrops management, LEGO have managed to increase their revenue by more than
15 percent for eight consecutive years.
3. Theory
3.1 Philosophical foundations At the philosophical level, this thesis takes its point of departure within case study-oriented
accounting and organization research. Related to this are our philosophical position, which
can be stated as positivistic. Coined by Auguste Comte, positivism refers to the assumption
that empiricism i.e. “observations and measurements are the essence of scientific endeavor”, are
the true way to acquire new knowledge (Eriksson & Kovalainen, 2008, p 18). Published texts,
such as annual reports and announcements are studied as ‘artifacts’ (Ryan et al. 1992-2002, in
Eriksson & Kovalainen, 2008), therefore the texts used are taken as a representation of
reality, as we believe in their ability to inform about the issues they represent, may they be
financial or managerial.
According to Cresweel (1998) a case study is the exploration of “’a bounded system’ that can
be defined in terms of time and place” (Eriksson & Kovalainen, 2008, p 118). Given this
definition, our study regarding LEGO can be said to evaluate their strategic and financial
performance in the period 2007 and onwards. According to Humphrey and Scapens (1996 in
Eriksson & Kovalainen, 2008 p 100) “establishing the case itself as the focal point of the
research process (rather than focusing on a particular social theory), accounting research
becomes driven by problems and issues relating to account practice, rather than by the concerns
of social theorists”. Based on this definition our analysis focuses on the issues relating to the
value retention and creation employed by LEGO.
However some degree of observation-expected effect is inevitably, which naturally are going
to interplay with the final conclusion and total firm value. Given the degree of freedom in the
future estimation of performance measures and economical drivers, one might argue that we
subconsciously tweak or manipulate said estimates to arrive at a biased or preconceived
result. Therefore the ultimate findings, to some degree, represent our subjective
interpretation.
Page 8 of 84
3.2 Strategic part This section of the report describes the theory used in the strategic analysis of the LEGO
group. The different theories are described and criticized to determine strengths and
weaknesses of incorporating a specific model.
The strategic analysis is used to create a basis for the forecasting process related to the firm
valuation. The analysis will be summed up in a SWOT analysis which determines the
strengths, weaknesses, opportunities and threat for the LEGO group, as this will help us better
determine the future growth potential. To create a SWOT analysis both the internal and
external environment of the LEGO group will be analyzed.
3.2.1 Porter’s Value chain To evaluate the LEGO group’s internal environment we have chosen to use Michael E. Porter’s
value chain concept. The theory suggest a way to evaluate a company’s competitive advantage
by analyzing the basic activities within the company that create value. The model is divided
into primary and secondary processes. The primary processes in the value chain is inbound
logistics, operations, outbound logistics, marketing and sales and customer service. These are
the activities, which directly affect the company’s product, which is why they are the main
contributors in creating value. Beneath the primary activities there are activities that is not
directly related to the product or service that the company provides, usually denoted support
activities, and consists of firm infrastructure, human resource management, technology
development and procurement (O'Brien & Marakas, 2009). When using this theory it is
important to remember that all the activities are generic and therefore could vary between
industries. This is by far one of the biggest weaknesses of the value chain model because the
value chain is not necessarily the same in all industries and if it is customized to a specific
company then it is hard to compare with competitors and identify competitive advantages.
Many have suggested changes to the value chain model and some believe that it is outdated
but we believe it is the most suitable way to analyze a company’s internal environment and
capabilities if adapted correctly.
For the analysis of the their external environment, Porters five forces are employed to
evaluate the microeconomic external environment alongside the PEST framework to clarify
macroeconomic perspectives.
Page 9 of 84
3.2.2 Porter’s five forces To analyze the external environment there will be formed an analysis of the competitive
situation by using Michael E. Porter’s theory of competitive forces. Porter suggests that five
different forces, which a company must find a way to deal with to be successful, decide the
competitive situation within an industry. The model evaluates the rivalry within the industry
and tries to describe how fierce the competition is (O'Brien & Marakas, 2009). Here it would
be natural to introduce industry concentration ratios to describe how concentrated the
industry are. In this thesis both the n-firm concentration ratio and Herfindahl-Hirschman
index will be used to describe the rivalry in the industry, through their measurements of
concentration. The model then describes how the industry must cope with the threat of new
competition, threat of substitution, buying power of consumers and the bargaining power of
suppliers (O'Brien & Marakas, 2009).
These forces are good general factors to evaluate an industry but the model has been a
recipient of fierce criticism through the years and as with the value chain, many believe that
the theory has become outdated in today’s society and it is not a model that you are able to
build your entire competitive strategy by.
One of the factors, which should be taken into consideration when using this framework, is
that it assumes that the industry it analyses is a perfect market where there are not
interventions from government or other sort of regulation.
Consultant and author, Larry Downes, gives Porter’s five forces this criticism for being
outdated and tries to impose 3 new forces. The new forces Downes (in Recklies, 2001) wants
to introduce are digitalization, globalization and deregulation. He believe that these new
forces will give a more comprehensive picture of the competition situation and emphasizes
that especially that digitalization has become the biggest driver in modern economics but it is
not a natural part of the five forces model. But as Dagmar Recklies (2001) argues then the five
forces framework haven’t become obsolete because in every competitive industry you will see
the forces from Porter’s theory and Larry Downes have only made it more complicated.
Even though the framework received a lot of criticism through the years, we still believe
however, that it will help us with a good framework for analyzing the external competitive
situation within the toys and games industry, especially when it’s combined with the PEST
framework.
Page 10 of 84
3.2.3 PEST As already briefly mentioned, there will be conducted a PEST analysis to assess the
macroeconomic environment of the LEGO group. The PEST model analyses the
macroeconomic factors of political, environmental, social and technological components
(Kumar & Gopinathan, 2009). These components are analyzed because of their great
importance in the external environment of the LEGO group. A change in any of these factors
can create new opportunities or threats, which the organization will have to cope with to
create a successful business. Since macroeconomic factors are country specific and the LEGO
group is a multinational organization then it is important that all relevant countries will be
analyzed to give a credible evaluation of the LEGO group’s macroeconomic environment.
There is another variation to the PEST analysis and that is the PESTLE analysis (Barrows &
Neely, 2010), which also includes a legal and an environmental perspective. These two
perspectives was in some form already a part of the original PEST analysis but have been
extracted because they have become more significant over the years. These two new
parameters should only the analyzed separately if they are of significant importance to the
organization or else they should be mentioned as a part of the original PEST analysis. In this
thesis these legal and environmental parameters will not be analyzed individually.
One of the weaknesses of the PEST analysis is that all factors effect each other in various ways.
A political factor like a tax reduction will always have a great impact on the economy and a
change in the technological perspective could change political parameters like trade
restrictions.
3.2.3 SWOT When the three subcomponents of the strategic environments have been conducted, they will
be summarized within a SWOT analysis. The strengths and weaknesses will primarily be
coming from Porter’s value chain, which analyses the internal environment, whilst the
opportunities and threats are assessed through Porter’s five forces and a PEST framework.
The SWOT will be included so as to give a clearer picture of the LEGO group competitive
advantages and basis to forecast from.
Page 11 of 84
3.3 Valuation part:
When going about valuating a company, there are many methods, which could be applied;
among others are methods such as enterprise discounted cash flow DCF, adjusted present
value APV or equity cash flow (Koller, Goedhart & Wessels, 2010). We have chosen to apply
the methods, which are related to the discounted cash flows approach. As will be visible later
through the valuation, assumptions such as stable capital structure renders DCF more
attractive, then had we allowed for unstable capital structures, - a situation where adjusted
present value, might have been more suitable (Koller et al, 2010). Furthermore as one of the
most commonly used methods when valuating a set of assets, or a going concern, along with
the amount of existing literature and theoretical material in connection with DCF attributes to
this approach’s attractiveness.
Originally invented by the two Nobel laureates, Franco Modigliani and Merton Miller, DCF sets
itself apart from equity valuation models, which value equity holders claim again operating
cash flow, by recognizing that the value of a company’s economic assets must equal the claim
against them. The enterprise DCF also allows the user to value multiple strategic business
units or projects separately using a single methodology. As the name discounted cash flow
implies, this valuation method discounts future cash flows so as to arrive at the present value
of these future streams of income. Therefore it is the analyst’s job to estimate future cash
flows, based on the information available at the moment of valuation. In order to arrive at
these estimations, the analyst estimate future growth or decline in total capital invested, net
operating profit less adjust tax and the return on the invested capital. These performance
measures are then discounted back using discount rates, which themselves are estimates of
cost of debt and equity. Since this requires quite subjective assessments about growth in
revenue and other drivers of earnings and costs, some have argued that valuation is not really
a true science, but rather an ‘art form’ or ‘skill’ that is acquired through a long career
(Damodaran).
In the process of finding the net operating profits less adjusted tax, total invested capital and
the return it generates, the usual point of departure are the companies annual reports. While
there is a difference from account and financial performance measures, the need for
Page 12 of 84
separation or ‘cleansing’ of non-financial and financial items arises, so as to arrive at the
correct returns that only relates to the company’s core business, and not e.g. the income they
generate on unrelated investments. In our case the provided excel sheet along with the
historical and reformulated balance and incomes sheets in the appendix, shows this process
of separation.
In our case, we will try and use relevant methods and approximations to estimates the
individual line items, that are associated with the before mentioned forecast requirements.
The main source of theory will be derived from the book titled ‘Measuring and Managing the
Value of Companies’ from the esteemed management consulting firm McKinsey & Co.
Furthermore we will try and included different scenarios so as to allow for both pessimistic
and optimistic views about that future. Being that LEGO is a private company, they are not
subjected to the regular laws in connection with disclosure of financial health and accounting
standards that a public company faces. The company, however, still manages to attract good
coverage from the financial medias, because of the size and their profound impact on the toy
market. When relevant we will try and included news articles to the extent they are relevant
as pointers for the future development of LEGO. The main source of inspiration when
forecasting into the future, will stem from the strategic analysis, including its findings on the
internal and external environment to help predict about future development in sales or
competition and their associated impact on the future financial performance.
There are naturally many limitations to the discounted cash flow approach, most profoundly
is it’s reliance on estimations. Another limitation is that a large amount of estimated value
that captured within the terminal or continuing value period, which naturally also are the
most difficult period to predict. Therefore an explicit period of seven years has been chosen,
as this constitutes a manageable timeframe. Albeit nobody have yet invented a crystal ball to
look into the future, these are the downsides one would have to accept when try to give their
best estimation on the future value.
Page 13 of 84
4. Strategic analysis
In this section, the internal and external environment of LEGO will be investigated. Due to the
nature of traditional valuation exercises, which take their point of departure in the historical
financial performance, it is important to also devote attention to the other factors, which are
also is of significant importance for the future value of the company, so as to give a holistic
picture, as stated earlier the findings from the following sections, will be included later when
forecasting for the future performance of LEGO, therefore the strategic analysis remains of
major importance. To achieve this holistic picture, the use of the aforementioned theoretic
frameworks from within the areas of strategic organization and marketing, will be applied so
as to highlight the internal and external environment of LEGO.
4.1 Value Chain Analysis
As the name implies, a value chain analysis, is a tool that is useful when trying to uncover and
highlight the process in which the company adds value to their products through the
manufacturing sequence (Whittington, Scholes & Johnson, 2011). A value chain analysis is as
such nothing ground breaking, but serves as a good tool that emphasizes the incremental
primary and secondary (support) processes, which ultimately add value to the final product.
These individual steps will next be examined respectively, starting with the primary activities.
However while relating LEGO to these activities, a natural point of departure would be to
highlight some of the previous implementations LEGO has undertaken in order to improve
some of the most predominant processes in the value chain.
Previously LEGO had several plants and distributions centers located throughout Europe,
Latin America and Asia, with Europe being the main place of production. During the first years
of the twenty-first century, particular the period until 2003, the number of different elements
used in the respective products exploded, along with an increasingly difficult production
schedules (Delingpole, 2009). Therefore the need to restructure the supply-chain steadily
increased; something that was immediately recognized by the new management who had
replaced the previous senior management during the major reorganization of LEGO in 2004.
Page 14 of 84
In dealing with its multiple sites throughout Europe, LEGO as the first manufacturing
company ever, decided to serve all of its European and Asian markets from new locations in
Hungary and the Czech Republic, whilst drastically imposing restrictions on the introduction
of new components in future assembly kits. This has proved to be an extremely wise decision
as LEGO managed to cut logistic costs by more than the projected 20 % whilst at the same
time improving handling time of the daily operations (Madsen, 2012). After this strategic
decision, LEGO have on several occasions announced that they would expand their operations
in Hungary and the Czech Republic, greatly increasing their production capabilities, whilst
gradually transferring more of the production from labor expensive Denmark. Furthermore,
following their record breaking annual report for the fiscal year of 2012, LEGO announced a
new factory in China, which in the future are going to serve the rising Asian markets (Riising,
2013).
4.1.1 Primary activities
4.1.1.2 Inbound logistic Sharing many activities with outbound logistics, inbound logistics are concerned with the
transportation, warehousing, inventory management and control, what primarily separate the
two, are inbound logistics emphasis on raw materials. LEGO receives the main bulk of their
chemical raw materials, used in the production of plastic bricks, from the German company
Lanxess, a subsidiary of the worldwide chemical cooperation Bayer AG. Whilst the properties
of the final brick is specially developed to LEGO and their needs, the ingredients can be
assumed as fairly standardized commodities, therefore LEGO as such, do not face any special
bottleneck situations, which could hamper their future production.
Although with the introduction of 3d printing, and its potential widespread applicability,
future raw material prices might be influenced, either positively or negatively giving its
utilization of the same materials as in the production of LEGO brick (Heathcote & Roux, 2012).
4.1.1.3 Operations Through the daily operations, which are the actual manufacturing of the final product, LEGO
strives to correctly forecast future demand, so as to have the right amount of product mix to
meet future demand. This is naturally a complicated procedure, however LEGO has been
Page 15 of 84
increasingly better at projecting future demand, through the use of sophisticated software
and a analytical approach to their given assignment and allocation problems (Madsen, 2012).
On the mechanical side, even though the very high output of elements, LEGO has managed to
optimize their manufacturing processes enough to reduce waist and limit the amount of faulty
elements, only 18 of every million elements produced, fail to meet the rigorous quality
requirements, which among other things require the products to be within 5 my accuracy
(0.005mm)(Company Profile, 2012). LEGO’s patented plastic ingredient a derivative of
Acrylonitrile butadiene styrene, usually abbreviated ABS, insures the right durability and
color properties that LEGO desires. All LEGO products adhere to the European CE-labeling,
which insure that their products and production methods are aligned with the concurrent
legislation within the European union (Sikkerhedsstyrrelsen, 2010). Furthermore LEGO is a
member of several Toy industry organizations with the aim of promoting and harmonizing
safety and quality standards (Jensen, 2012).
The wish to always deliver top quality and reliable products, with no missing elements or
components, is consistent with their identified values about quality, and zero product recalls.
Relating these values and operational procedures to the value chain, it can be concluded that
LEGO tries to imbue their products with superior quality and safety standards along with the
right practical management to insure, correctly forecasted availability of products of the right
standards.
4.1.1.4 Outbound logistic In connection with LEGO’s production expansion in Eastern Europe, LEGO opted to outsource
distribution to DHL Excel Supply Chain, as much of their sale is seasonal based. By
outsourcing the distribution, they do not need to carry excess capacity during the summer,
where sales usually are lower. Furthermore by outsourcing these activities, from a ‘make or
buy’ perspective, LEGO get to do what they do best: Product innovation and creative designs,
and establishing new product licenses, whilst leaving distribution in the hands of experts.
When relating in/out bound logistics along with operations to the financial performance of
LEGO, there has been a clear tendency of optimization, befitting from the aforementioned
improvements. Below table 1 illustrates the historical reductions in production along with
selling and distribution expenses. Since nominal values would have displayed rising costs due
Page 16 of 84
to the increase in sales, the relative costs compared to operating revenue have been reported
instead. LEGO managed in the period 2008 – 2012 to reduce their relative cost of production
along with selling and distribution expenses by 4.35% and 4.89% respectively, constantly
improving their performance in all years except 2011 (LEGO.Bachelor.xlxs). These findings
substantiate the aforementioned initiatives that LEGO have undertaken to improve said
accounts. Whether LEGO will be able to continue improving their performance in this
connection remains uncertain, there do however appear to be a tendency for a reduction in
the efficiency improvements.
Table. 1
Annual relative changes in costs associated with in/out logistics and operations in percentage changes.
Source: Own calculations, based on annual reports. See “Analysis tab” LEGO.Bachelor.xlsx
4.1.1.5 Marketing and Sale According to E. Jerome McCarthy marketing is the mix of price, product, place and promotion
that are associated with the company or good in question (In Kotler, Keller, Brady, Goodman
& Hansen, 2009). On the product side, LEGO now follows a portfolio of successful themes and
licenses. This was a reaction to the before mentioned period where LEGO had diversified too
far away from their initial core products, into a morass of different themes and product lines.
LEGO was among other things, saved by entering into strategic partnerships with companies
such as Lucas Arts and Warner Bros, who hold the licenses for Star Wars and Harry Potter
respectively. Therefore Star Wars and Harry Potter have often been attributed as the saviors
of LEGO during their recent crisis (Sielen, 2013). With a predominantly male audience, LEGO
have recently tried to increase its product portfolio to included products, which targets the
female segment. During the financial year 2012, LEGO launched its new product ‘LEGO
friends’ with this particular audience in mind, proving to be a major success (Trangbæk,
2013). Following these successes LEGO has been able to identify additional areas of
cooperation, example of which includes: Batman, Pirates of the Caribbean, and Lord of the
Page 17 of 84
Rings. Some of the most immediate benefits from these strategic partnerships are the synergy
effects that can be assumed to arise from the combination of contemporary and well-known
fictional fantasy realms and the many combination possibilities of LEGO. Not only will LEGO
enjoy the indirect marketing of their licensed products, but episodes and event in the
respective movies, serves as a good basis of inspiration, that can be recreated as LEGO
products e.g. the Death Star from Star wars or Bilbo Baggins ‘Bagend’ from Lord of the Rings.
In the light of the financial success following from these portfolio changes, LEGO proves its
ability to choose correctly among license holders and the future themes, giving them a
positive outlook for the future.
In relation to the place of sales, LEGO have in recent years dramatically increased their points
of sale. Previously relying on external companies to buy and sell their products, LEGO have
increasingly sold its products through both the Internet and its own specialized retail stores.
These specialized stores offer exclusive products, activities and exhibits, which only can be
acquired and experienced there (Yohn, 2012). These features add to the purchasing
experience while also aid in retaining their large fan base and promoting the company to
future costumers. Further up the supply chain, with its recent announcement of expansion on
the Asian market, LEGO are also increasing their presence to the markets, by expanding with
production facilities closer to their customers (Knudstorp, 2013).
Lego utilizes several promotional strategies, ranging from traditional medias such as
television ads and social medias to philanthropic charity (Progress report, 2012). Covering all
however, would be beyond the scope of this segment. Besides regular promotion, LEGO also
receive large exposure through their collaborating with Merlin entertainment, the main
shareholder of the LEGOLAND theme parks (Merlin Entertainment Group, 2013) and the
promotion done via their specialized stores and annual returning event created by their large
fan communities.
Finally turning to the pricing strategy, LEGO has always pursued a pricing strategy of superior
prices, not engaging in price competition. Whilst adhering to the ‘only the best is good enough’
motto, LEGO justifies its relative expensive products with their superior quality and designs.
Price per piece has however, declined in recent years, this price reduction has though been
mitigated by the increase in the average number of pieces included in the product sets (Sielen,
2013) maintaining the perception as an expensive toy. Whilst being more expensive than its
direct competitors such as MEGA BLOCKS and Mattel, LEGO face competition from direct
Page 18 of 84
substitutes, who offer pieces that fit together with traditional LEGO but at cheaper prices
(Hansegard, 2013). This threat of substitution is examined further in the external analysis
more specifically porters five forces.
4.1.1.6 Service Beyond the LEGO group pledge to superior quality, they utilize costumer retention schemes
via its official website, these schemes include ‘VIP’ points that is awarded to costumers for
online purchase; These purchases can then be used as an online currency, giving price
reductions for future purchase (Enjoy the VIP treatment (LEGO), 2013). In addition to these
services, a lot of material are available online, customers who lost their construction manuals,
are able to download them in PDF form via their website, or to contact the company directly
for special requests.
Given its large fan base, LEGO have dedicated staff to sever and maintain contact with LEGO
clubs throughout the world. Often these clubs host annual events, where they exhibit special
recreations of famous buildings or special scenery. Given this help building on the LEGO
reputation and gives great promotion to a wide audience, LEGO naturally has a large interest
in maintaining these communities and therefore actively tries and collaborate and engage
with their community (Community Team Blog, 2012).
Generally LEGO actively interact with their audience providing additional service and a loyal
fan base. This might be one of the reasons why ‘substitute LEGO’ i.e. Mega brands or Mattel,
have not yet caught more on, although their significantly cheaper prices. As analysts, the
impression we get as we investigated these communities online, are very loyal fan bases,
which spots ‘obvious’ flaws in their competitors products, and who would never consider
mixing their LEGO bricks with ‘non-pure’ LEGO. Therefore the catering and service of these
communities should not be neglected, even though it comprises an axillary activity, with no
‘apparent’ revenue streams.
Page 19 of 84
4.1.2 Support Activities:
4.1.2.1 Firm infrastructure
It has been a prevailing strategy within the LEGO organization to delegate many activities to
individual companies who have superior knowledge within their respective fields of
expertise. Whilst several of the assets that LEGO posses have been mentioned, especial in
connection with production capabilities, it is important to highlight the additional
infrastructure components that is at their disposal. One of these additional components is the
usage of IBM solutions in connection with the production and accounting management,
through the use of business applications such as SAP. This strategic partnership gives LEGO
the right capacities to manage daily operations and utilize their production capabilities in the
most efficient manner (Case Study (IBM), 2010). As mentioned earlier DHL excel supply chain
handles most of the distribution, pulling on their large network and big capacity, alongside
announced expansions of production facilities throughout LEGO is rapidly enhancing their
infrastructure to be as cost efficient and productive as possible.
4.1.2.2 Human resources management “Through our approach we want to play an active part in improving the wellbeing for all
employees, in our supply chain, as this helps protect our company’s strong reputation” (LEGO
Progress report 2012, p. 135). This is one of the ways that Lego describes its active
involvement in the wellbeing of its employees. There are many theoretical frameworks that
emphasize different motivators and drivers for good employee performance. These
frameworks are usually divided into either content or process theory (Buelens, 2011). In
terms of content theory, where professors such as Herzberg and Alderfer are recognized
framework setters, LEGO strives to ensure a motivating work environment. It does this
through what Herzberg calls hygiene factors, i.e. remuneration, benefits, and other
quantifiable monetary rewards, but also with motivators such as an exiting work
environment, challenging tasks, and a strong culture and collegial bond (LEGO Process report,
2012).
Their moral ethics do not only apply to those directly employed by LEGO. To insure that
throughout the entire value chain, there are no moral hazards LEGO require that partners
fulfill a range of metrics. Those requirements are summarized in their code of conduct, which
Page 20 of 84
among others require partners and suppliers to recognize the rights of the employees, their
right to minimum payment, and discrimination free workplace (LEGO progress report 2012).
LEGO performs unannounced audits to insure that there is no violation of these terms of
conduct, which is contractual binding between LEGO and the suppliers. With its numerous
and widespread presence through the world along with a contemporary and modern
corporate firm structure, LEGO are assumed to be able to continue attracting a qualified and
effective workforce in the future. Along with their rigorous requirements to their suppliers,
there is not deemed to be any future reputational hazards regarding human relations in the
supply chain, albeit the information provided is one sides.
4.1.2.3 Technology development
LEGO has always had a close connection to the educational world, one example of which could
be the close relationship with prestigious universities such as Massachusetts Institute of
Technology (MIT media lab). This close relationship to the educational sector follows from the
natural extension of the creative possibilities and functional combinations of products such as
LEGO Technic and Mindstorm, both of which include programming and mechanics. To
capitalize on their applicability to the educational sector, LEGO employ their subgroup LEGO –
Education, which product segment ranges from preschool to the secondary level of education
(LEGO education). LEGO utilizes several development departments to enhance their current
products and activities, earlier we mentioned the constant improvement of the quality and
durability of the plastic components, and the progress on improving their forecasting
methods through IT solutions, derived from academic research (Madsen, 2012).
Equally important in relation to the value chain are technological capabilities related to the
development of new products and production methods. As identified under marketing and
sales, the acquisition of rights to concurrent and well-known brands and themes are of vital
importance to LEGO, in this connection technology, or maybe more specifically product
development, which means having to keep pace with the introduction of new product lines.
This put constraints on the technological capacity of LEGO to make quick adjustments and
introductions of said products. This responsiveness has been greatly improved through the
latter part of the first decade of the new millennia, via both formularized design schedules
(Design Council LEGO case study) and capacity improvements, giving LEGO the flexibility to
meet these constraints.
Page 21 of 84
Although some maybe would consider LEGO to be analogue players in a digital world, LEGO
have managed to employ technological features such as cloud computing and software. Online
project communities such as LEGO Cuusoo, enable fans and innovators to submit their own
suggestions to new products; designs which often are created through free LEGO software
programs that allow the user to build the idea three dimensionally before actually assembly. If
chosen the respective designers are entitled to 2 % (Cuusoo (LEGO)) of the revenue their
ideas generate, whilst LEGO benefit from the relatively inexpensive creativity that their
community posses, and the inspiration that fans give to one another, hopefully generating
excess sales. Continuing on the software front, LEGO has through joint venture collaborating
with TT games (TT Games, 2013) experiences good results, with title series such as Harry
Potter, Indiana Jones and Star Wars all having being well received, and helped LEGO mitigate
the impact from virtual games on traditional toys.
To aid their in-store sales and make their products stick out relative to their competitors,
LEGO has also introduced technology such as ‘augmented reality’ via the in-store kiosk, which
allows you to view what is inside the packages in an innovation and capturing way. This
feature gives enhanced buying experiences that most certainly make their products stick out
(Metaio).
The abovementioned initiatives and competences, combined with their long company history,
manages to secure LEGO a more active community and fan base, this ultimately is a
competitive advantage relative to their competitors. Together with increased responsiveness
to new product launches that employs the right features and creative designs, often inspired
by their fans, LEGO can be said to hold an competitive advantage. This advantage could not
have been sustained without the use of informational technologies and the use of technology
altogether.
4.1.2.4 Procurement Whilst being closely related to logistics and operations, procurement is inherently different,
since these activities also include the acquisition and provision of items not necessarily
directly included in the production of the company’s final product. Since the procurement of
raw materials and supplies already have been discussed, leaving yet another description
redundant, the attention turns to the procurement of financial assets and credits.
Together with their parent company, LEGO has engaged in multiple transactions, assisting
Page 22 of 84
each other with several loans and financial support, with these activities being labeled
‘transaction to related parties’ in the balance sheet. During the fiscal year of 2012, these
transactions amounted to roughly 26 billion DKK, more than the total revenue of the year. The
net amount to related parties at the end of the year however, was considerably lower, with a
net loan investment of 3,442 billion DKK. The sheer volume of these transactions goes to
show, the financial capabilities of LEGO and their mother company, and can therefore be view
positively. As will be seen later in the valuation section, the coverage ratio of LEGO, i.e. their
abilities to meet their financial obligations, was considerably high, with an EBIT/Interest ratio
of 400! This goes to show, that the capital structure of LEGO highly favors an equity approach
where debt are kept low and hence also interest payments, the ratio has however also been
inflated violently by the rapid increase in earnings before interest and tax (since interest is an
tax deductible). With this leverage ratio, LEGO can be assume to conform to an AAA rating in
terms of creditworthiness, which further allows them to secure further financing at relatively
lower interest rates (Damodaran, 2013) This however will be explained more deeply in the
cost of capital section.
With their rigorous requirements discussed in the human relations section, the list of
potential suppliers naturally diminishes. However, this is deemed a competitive necessity, as
a global company like LEGO, could potentially face large reputational damage, if they were to
cut cost excessively in the procurement process.
From the above mentioned, LEGO is evaluated to have a good source of financing
opportunities along with a good market knowhow that enables for future procurement.
4.2 Porters five forces When analyzing the LEGO group’s non-financial value, it is important to analyze the industry
they are acting within. To do so, Michael Porters five forces were chosen and explained under
the theory section.
The LEGO group acts within the toys and games industry. Toys and games can be divided into
several sub-industries and this analysis will take into account that the LEGO group have a
larger stake in some parts of the industry compared to other, although in general the
preceding analysis of the toys and game industry on a more holistic level.
Page 23 of 84
4.2.1 Bargaining power of suppliers: Within the toys and games industry and in relation to the LEGO group the most important
supplier is within the chemical market. LEGO bricks are produced mainly out of a plastic
material called ABS (Virksomhedsinformation (LEGO), 2013). It was hard to gain access to
information regarding the chemicals market and the competition within plastic chemicals, but
we believe that this market is very competitive and therefore the suppliers does not possess
any threatening bargaining power over the toy manufacturers.
It is important to evaluate whether the suppliers to a specific industry have any bargaining
power towards the companies. Suppliers have bargaining power if there is a high industry
concentration for the given market. From the theory of supply and demand, we know that a
decrease in supply will increase the prices, and if there is only few firms within the given
supplier industry they will be able to control the supply and therefore have a higher
bargaining power. High supplier bargaining power will increase the production prices within
the industry and it will create an entry barrier.
The big companies within the toy and industry sector have demands when it come to the code
of conduct of suppliers. The companies have to protect their image and brand equity, which is
why they cannot allow their suppliers to slack on the code of conduct. The LEGO group have
divided their suppliers into categories after how high the risk is of the LEGO group’s code of
conduct being broken. The largest part of their suppliers are in low risk countries but the
second largest group of suppliers are in high risk countries. (Progress report 2012) We
believe that it is reasonable to generalize this for the industry, which is why some suppliers
might not be able to compete with the other suppliers due to poor code of conduct. This will
reduce the amount of suppliers eligible for the toy industry and increase the bargaining
power of the suppliers.
A threat from suppliers worth valuating is whether if they decide forward integrate in their
value chain. In this case chemical producers would start making toys, which seems highly
unlikely because the lack of expertise need to achieve with such and conglomerate
diversification. Furthermore the competition within the target area along with value in their
own industry further inhibits these threats.
An untraditional supplier in the toy and games industry, compared to other industries, is the
film industry. The companies within the industry buys the license from different movie
franchises to benefit from the brand equity created by popular movie franchises. A large part
Page 24 of 84
of the LEGO groups revenue growth in the last couple of years have been due do license
agreement with the like of Warner Bros, Lucas Arts and Disney for movie franchises with a
large fan basis (Bomsdorf & Hansegard, 2013).
Mattel and Hasbro also have several movie licenses and it has become common for these
companies that there are also being produced movies based on original toys. The best
example is the Transformers trilogy, soon quad-trilogy, which originated as a toy produced by
Hasbro (Transformers (Hasbro)). Alone in admission fee the trilogy it has generated more
than 2.6 billion USD putting it in eight place of the most grossing movie franchises of all time
(Adams, 2011). So the toy and games industry are very dependent of these movie franchises
and that there are not only being produced new movies, but also that existing series are being
maintained. This gives the film industry a great power over the toy companies, and which
companies to choose collaboration with; this might emphasize why the companies are paying
several billions to the franchise holders, to benefit from popular movie themes.
4.2.2 Buying power of consumers: One of the most important factors within the subject of consumers buying power is whether
the individual buyer have economic muscle towards the actors within the industry. In this
case it is not the case that the consumers on the toy market have any kind of economic power
over companies within the industry. A single person is not able to force a company down in
price or inflict damageable impact on the company. The consumers is of course the most
important buyer in the industry and they are the ones who determine if a product is
successful or not but you should not neglect how vital the B2B market is for the industry. On
the B2B market, the manufacturers are co-operating with retailers who are their face to the
final consumer. The retailers possess some form of power over the toy companies because
they decide how they sell their products and they are their main distribution channel, which
puts them in a favorable position. However most toy companies distribute an increasingly
larger portion of products through their own retail stores or online sales.
By segmenting consumers into geographies then some continents possess more power over
the industry compared to the number of people who lives there. The Asia Pacific accounts for
52.5% of kids between 0-14 but they are far from purchasing an equivalent amount within the
toys and games market. USA, Western Europe accounts for 61% of the retail sales of toys and
games worldwide (Daujotas, 2013). The fact that the highest part of toy and games sold in
Page 25 of 84
more developed countries is of course strongly connected with the fact that there is a larger
disposable in these places. The skewed distribution of sales means that the toy companies
have a larger risk if the economy takes a downturn. In the future, the Asia pacific markets will
probably become a bigger part of the toy and games market due to the economic development
in this area.
An obstacle for the toy manufacturers is that the buyers are tied to their specific product and
there are no severe cost of switching to another product. In an industry where the clientele
have rapidly changing preferences, it can be lethal for the toy manufacturers that there are no
costs of switching from one product to another. This problem is something that the players
within the industry tries to avoid by constantly improving their brand quality for instance by
buying licenses to famous movie themes which kids associates themselves with.
4.2.3 Threat of new competition Within the toy industry, there are some difficult entrance barriers, which a new competitor
would have to penetrate. The players within the industry is benefiting from economies of
scale to give them a big cost advantage. Big players like Mattel, Hasbro and LEGO produce
their products in countries where they can benefit from low wages to reduce their production
cost. The companies who are already in the industry also have a lot of expertise to help them
make the correct decisions and help them optimize their value chain. A new entrant to the
market would not be able to take advantage of economies of scale because of their assumed
limited expertise within production and limited resources.
The actors already in the toy industry is benefitting from a high brand equity, which they have
created through several years on the market creating toys, which have been a part of society
through generations. Mattel created the Barbie doll in 1959 (Barbie Media) where parents of
today were kids themselves and the doll have followed several generations who can
remember the doll when they get kids themselves and of course they will buy one for their
children. Since 1959 it is estimated that there have been sold more than 1 billion Barbie dolls
(Sherman, 2009) this is an extremely tough brand to compete with. Companies like Hasbro
and LEGO have similar stories with their product lines and it is hard to defeat brands who
have sold continuously through decades.
As mentioned in the section of bargaining power of suppliers, the toy and games industry is in
some sort benefitting from other industries like the film industry. LEGO have several patents
on movie franchises like Star Wars, Harry Potter and Indiana Jones. This gives them a
Page 26 of 84
possibility to benefit from strong franchises and give them an advantage in the industry. A
new competitor would have difficulties to compete with high profiled movie franchises and on
the other hand, it would ease the entry if a new competitor would be able to buy the license
for a popular movie franchise because they would buy a set of costumers, which are the fans
of the movie.
Because of the importance of these movie franchises, it would be a great threat if a studio like
Warner Brothers would cut all their license agreements and begin to produce all toys
themselves. They would make a shortcut into the market because they already have a very
large fan base and would be able to compete for market shares relatively fast.
In the favor of new entrant is the fact that children’s preferences changes swiftly and the costs
of switching from one toy to another is relatively small. The preferences of children changes
according to what is fashionable now and that is why the established company’s theme
licenses are important. However, a new entrant will be successful if it is able to draw the
children’s attention toward their product and establish a brand equity, then they will be
successful.
It is important to notice that the preferences of toys are different from continent to continent,
so a new entrant might have success by only entering one market and then build a business
from there. The producer concentration will be discussed under the Rivalry sections in the
Porters Five Forces analysis.
4.2.4 Threat for substitutions The biggest threat for substitution in the perspective of toys and games industry is the
increasing modernization of kid’s entertainment. This means that kids are playing more
computer games than before and some are making the switch from traditional toys. The LEGO
group have tried to cope with this issue by moving into the electronic gaming scene
themselves. They have made several LEGO games (Games (LEGO)) and are trying to create a
diversified portfolio, which will cover the most parts of children entertainment.
When assessing the threat for substitutions it is important, to evaluate if there is high
switching cost for the consumers to choose another product. Here we believe that traditional
toys in general are cheaper than computer games and therefore it would be more expensive
to make the switch. It can be discussed whether the kids will get a higher satisfaction from
Page 27 of 84
switching to computer games but so far we believe that the parents still prefer the traditional
toys over computer games because of the educational aspect there are in toys like LEGO, along
with higher perceived stigmatization associated with computer games, relative to traditional
toys.
If it is only the basic need of entertaining a child, substitution could be quite easy, through
differentiation LEGO tries and position themselves differently from other toys, by having a
unique concept, which activates kids. Having a play system instead of a finished solution.
One of the biggest threat of the LEGO group is the fact that several big players have moved
into the construction toys market. The world’s second largest toy manufacturer have created
an almost identical product to LEGO, which they call Kre-o. Mega brands, who have produced
a product identical to LEGO in several years, called Mega Bloks, and have received several law
suits from the LEGO group. Furthermore they have entered into a strategic alliance with
Mattel where Mega Brands will produce toys within the popular themes Barbie and Hot
Wheels (Mega Bloks, 2012). If this strategic alliance between Mattel and Mega Brands
continues then it will give Mega Brands an improved position on the market since they will be
able to benefit from Mattel’s strong brand and distribution channels.
Even though this seems as a large threat for the LEGO group, they themselves refuse to
acknowledge the extended to this threat. LEGO believe that these new companies usually just
imitate the LEGO group’s popular themes, and they are not able to keep up with their
innovation and high quality. However, Jorgen Kudstorp, CEO of the LEGO group, believes that
their biggest threat comes from competition, which just covers the same needs as LEGO, but
not necessarily ‘cheaper LEGO’ (Knudstorp, 2013).
4.2.5 Rivalry When discussing the rivalry within the toy and games industry it is important to define the
competition situation within the market. This will be done by valuating the industry
concentration. We could have incorporated the industry concentration in ‘’Threat of new
competition’’ to describe the entry barrier but we decided to discuss this problem in this
section.
The industry concentration can be evaluated by several measures and we will do so by using
the n-firm concentration ratio along with the Herfindahl-Hirschman (HH) index. The n-firm
concentration ratio (denoted CRn) simply measures the largest firms within an industry, we
Page 28 of 84
have decided to measure the concentration for the largest four firms and the largest eight
firms. The advantage of CRn is that you only need limited data and only from the largest four
and eight firms (Lipczynski, Wilson & Goddard, 2009). The formula for CRn is as follows:
Equation 1:N-firm concentration ratio
𝐶𝑅𝑛 = ∑ 𝑆𝑖
𝑛
𝑖=1
Source: Lipczynski et. al. 2009
From the data collected from Euromonitor (2012) it is calculated that CR4 is equal to 29.54%
in 2011 and CR8 is equal to 36.59%. The general notion is that if CR4 is smaller than 40% then
there is a strong competition within the industry. Within the Toys and Games industry there is
only 29.54% and CR8 is 36.59% this tells us that there is a high level of competition within the
industry. N-firm concentration ratio does not however meet several of the Hannah-Kay
criteria and are therefore only a good indicator of the industry composition (Lipczynski et al.
2009).
We want to assess whether de distribution of the market share is skewed, which the n-firm
concentration ratio fails to evaluate. Basically the CR4 could give the same number if the
industry leader had 25% of the market and the remaining 3 companies shared the remaining
4.54%. The HH index gives larger weight to the big companies, which makes it possible to
evaluate if the distribution of the market share is skewed. The HH index ranges from 0 to 1
where 0 is equal to full competition and 1 is equal to monopoly. Full information regarding
market shares is demanded by this model to get an exact number but there can be made a
reasonable approximation by only using the data available. The formula for the Herfindahl-
Hirschman index is:
Equation 2: Herfindahl-Hirschman
𝐻𝐻 = ∑ 𝑆𝑖2
𝑁
𝑖=1
Source: Lipczynski et al. 2009
In 2011, the HH-index was 0.027, which indicates that the industry is very close to perfect
competition, which also was the notion we got from the n-firm concentration ratio. In the
Page 29 of 84
period from 2008 to 2011, both indexes showed a small increase in the concentration ratio
but far from rapid growth. Even though there is a high level of competition then Mattel have a
market share of 12.29%, which is a lot higher than their competitors.
The fact that there is a high level of competition in the Toy and Games industry explains that
there is a high level of rivalry in the industry and it would be easy for a new competitor to
enter the market.
Even though there is a high level of competition within the market for traditional toys then
the market for construction toys are completely different. As mentioned competitors are
trying to move into this part of the market where the LEGO group are enjoying oligopoly-like
(if not even monopoly) conditions with more than 60% of the market (Euromonitor, 2012)
The industry has an intense rivalry through several distribution channels. The companies
tries not only to sell their products through retailers but also through own shops and online
sales. This intense competition is being confirmed by the CEO of the LEGO group, Jørgen
Knudstorp, who believes that the intense retailer competition is lowering the value of the
market (Hansegard, 2013).
In the industry it is all about being the next trendsetter within the industry, because the next
big thing is what creates a larger revenue and opportunities to increase your market share
and brand equity.
4.3 PEST Framework
4.3.1 Political There are several factors, which effect a global organization like the LEGO group. The LEGO
group have facilities all over the world, some places more than others, but they are constantly
affected by the political situation in the countries where they are present. The LEGO group are
present in Denmark where they still have some production and most of their administration
and research and development they also have production in Hungary, Czech Republic and
Mexico. They are planning to begin building a new factory in China in 2014, which should be
ready to produce in 2017 (Ritzau, 2013). These places are off course where they are most
affected politically but they are distributing their product to more than 130 countries (LEGO
(About us), 2013) and therefore they are affected of all local political decisions.
Page 30 of 84
An increasing debate in the western part of the world is the issue of gender neutrality. Gender
neutrality is not differentiating between boys and girls in general and in the case of the toys
and games industry, it concerns not advertising specific toys to a specific gender. In Sweden
there was a case not too long ago concerning a toy retailer who received a lot of criticism for
gender profiling changed their catalogue so both genders would be in a picture (Gara, 2012).
The LEGO group also took a lot of criticism after launching their new product, LEGO friends,
which they tried to target against girls in the age of 0-14. LEGO friends has been one of the
LEGO group’s biggest successes so it could have some negative effects to change the
marketing mix for this product. Some are trying to get a petition signed to make LEGO stop
their allegedly genders biased advertising and include both boys and girls in their marketing
of their products (Miller & Gray, 2012). The increased awareness of genders neutrality could
turn out to change laws in some of the LEGO group’s core markets, which is something they
will have to adapt to in the future.
In recent months the Danish corporate tax have received a lot of attention after the
government proposed the opposition that the corporate tax in Denmark should be reduced
with 1% each year until 2016 so that the new tax rate would be 22% (Matzen, 2013) This
reduction in the corporate tax rate was agreed upon the 24. Of April 2013. The concrete
corporate tax reduction will be 0.5% in 2014, 1% in 2015 and 1.5% in 2016
(Finansministeriet, 2013). A reduction of the corporate tax level will have an increasing effect
on the earnings of the LEGO group because corporate taxes is a large part of expensives. Even
though the corporate tax rate in Denmark are not that high, then the personal tax rate is one
of the highest in the world, which drives the wages up to a high level. LEGO have already
realized that Denmark are not able to reduce the wages to the level of countries like Czech
Republic, Hungary, Mexico and China, which is why they are moving all of their production to
these countries and only keep ‘’desk jobs’’ in Denmark (Kristensen, 2013).
Of political factors one of the most discussed for the Toys and Games industry is labor politics.
The industry are notorious for producing their products in low waged countries and have
been heavily criticized for the working conditions in these factories (Clark, 2007). There are
constantly being created more awareness in these developing countries on labor rights and
therefore this is of course of great importance for the LEGO group because of their production
facilities all over the world.
Page 31 of 84
4.3.2 Economic There are several economic factors, which affect the LEGO group. Change in different
economic parameters in the LEGO group’s external environment can have crucial impact on
their sales and business in general.
In the latest projection from the International Monetary Fund (IMF) they state that they
believe that the general world economy will see a gradual upturn in growth in 2013. They
believe that there will be a global growth of 3 percent in 2013 when combining both
developing and advanced economies. An increase in growth will create more wealth in the
public and therefore increase the spending of public. An increase in spending will be
beneficial for the toy and games industry, as it will increase sales.
Source: IMF, 2013
As mentioned the LEGO group’s most important markets are Western Europe, USA and Japan,
which all are part of advanced economies. IMF believes that the growth in advanced
economies will increase from 1.3 in 2012 to 1.4 in 2013 and 2.0 in 2014. The LEGO group’s
biggest market USA will see a small decrease in growth in 2013 but in 2014, it will increase to
more than 2012 level. Thereby IMF keep their growth outlook even on Japan, which are
struggling with recession but they believe that it only will be a short-term crisis.
0%
1%
2%
3%
4%
5%
6%
7%
2011 2012 2013 2014
Graph 1: GDP growth
World Advanced Economies Developing economies
Page 32 of 84
There are several threats concerning the economy. The EURO area, which is one of the LEGO
group’s core markets, are still trying to survive a persistent debt crisis in southern Europe.
The IMF believes that there have to be taken political action to limit the downside risk of the
euro area. If the crisis in euro continues and maybe spread to northern Europe, it would have
a negative effect on the LEGO group’s revenue growth (IMF, 2013).
The middle class is of great significance to not only the LEGO group but to the toy and games
industry in general since this must be recognized to be where the biggest part of consumers
are located. An economic crisis in core markets like North America would have a slowing
effect on the markets since the advanced economies by far have the highest consumption
compared to size of middle class population. Table 2 describes the distribution of the world’s
middle class and how large the consumption is for each geographical segment. Homi Karas
(2010), from OECD, defines the middleclass as the people with expenditures between 10 USD
and 100 USD. The table shows us that North America accounts for 18% of the global middle
class but has 26% of the consumption and Europe have 36% of the middle class and consume
38% of the total. These are the only geographies who consumes more than they account for,
all other consumes less than their global share of population. This tells us that a crisis in
either of these areas will reduce the global consumption significantly.
Table 2: Distribution of middle class and consumption
Source: Kharas, 2010
The LEGO group are targeting the emerging companies as a new big market and the growth
will keep on the same high level and even increase in the next couple of years. The increase in
the growth in emerging economies is particularly important for LEGO, as it will get more
people into the middle class and into the LEGO group’s target group. This is confirmed by
North America 338 18% 26%
Europe 664 36% 38%
Central and South America 181 10% 7%
Asia Pacific 525 28% 23%
Sub-Saharan Africa 32 2% 1%
Middel East and North Africa 105 6% 4%
World 1845 100% 99%
ConsumptionNumber of People (Millions
and global share)
Page 33 of 84
OECD, who believes that the middle class will increase from 1.8 billion people in 2009 to 3.2
billion in 2020, almost twice as many in 2009 (Pezzini, 2012).
As a multinational corporation, the LEGO group are highly effected by currency fluctuation.
They try to limit the risk from currency by hedging currencies by using contracts and options.
In their annual report they state that they have significant inflows of EUR, GBP and USD.
Denmark has a fixed exchange rate policy towards EUR, but the other currency pairs have
been quite fluctuating. Graph 2 displays the historical development of important currency
pairs for the LEGO group.
Source: (Danmarks statistik, 2013)
The periods where the currency pairs are above one hundred are the periods where the LEGO
group have earned a currency premium on their products due to a high exchange rate in the
LEGO groups advantage. Vice versa they have lost money on products when the currency pair
is below 100, of course compared to the level in 1993. There are also some benefits from
having a cheaper currency. A cheap currency will improve the LEGO group’s competitive
power towards foreign competitors because their product will be cheaper and therefore more
attractive for the consumers.
The interesting thing about LEGO is that during the last couple of years economic downturn
they have only improved their business and grown it bigger and bigger and therefore the
change in economic growth might not have as big an impact as it will with other companies.
60
70
80
90
100
110
120
130
140
Graph 2: Historical Currency Pairs
DKK/EUR DKK/USD DKK/GBP
Page 34 of 84
However, it will without a doubt be important for the LEGO group that there is a continued
growth in the emerging markets which will get more people up in the middle class.
4.3.3 Societal factors
Due to the close interrelationship between politics and culture, the gender neutrality issue,
which have been widely debate within the Nordic countries, could easily have been included
from a societal aspect, however, to avoid any unnecessary repetition, this issue will not be
debate once more. There are however several external factors within the social aspect, that
might be of significant importance to LEGO.
A recent OECD report about fertility rates paints a negative forecast in relation to the future
target core audience for the company, namely children. Between 1984 and 2009, the fertility
rates within the whole OECD area fell from around 1.98 children per women, to 1.74 (OECD,
2011). The organization defines a self-sustaining level of reproduction to 2.1 children per
women, allowing for some child mortality, disproportional gender mixes etc. Since this level
for the entire region is well below this self-sustaining threshold, approximately 12.5%, at face
value, fewer potential costumers are to be expected in the future. Without divulging too much
into the exact numbers, one has however to take into consideration differences between
nominal values and the reported simple arithmetic mean for the OECD region.
Below the historic fertility rates for six of the important markets (Euromonitor, 2012) have
been reported:
Table 3: Fertility rates for selected markets
Source: (OECD, 2011)
Visible from the table is the trend in the fertility rate, within the latter part of the twentieth
and early twenty-first centaury, especially important markets such as Germany have
consistently experienced low fertility rates, with only 1.36 and children per women in 2009.
Furthermore different trends across regions are observed, some nations have experienced
stabilizing and recovering trends (Denmark, United States, France and the United Kingdom)
whilst others have remained consistent with the previous levels (Canada and Germany) and
Page 35 of 84
lastly only Japan experiencing a major negative structural decline. As the generations replace
themselves, however, it is reasonable to assume, the target audience consist of ever smaller
proportions, due to the fact that every market have remained below or adjacent to the self-
sustaining level, resulting in previous generations having fewer offspring’s.
Low fertility rates need not necessarily translate into lower sales, naturally it is fair to assume
there is some kind of correlation between number of children and sales, but one also has to
consider the reason for these developments. Increased participation in the labor market
among women, and increased standards of living and education (Rosling, 2012) have delayed
pregnancies, but conversely, these attributes also increase the spending power of the families
in question, increasing the amount they can afford to spend of toys. The question on whether
these developments will have negative or positive implications therefore remains somewhat
ambiguous and case specific.
Whilst the OECD area mainly covers the western hemisphere, and therefore do not include
emerging markets, other sources of information must be acquired. A recent overview from
Euromonitor concluded that, although experiencing declining birth rates, almost a third of the
global child population, would be located within the two nations of China and India. The
rapport further highlights the lack of causal relations between number of children and sales,
pointing to the need for threshold incomes in order to foster sales of self-actualization
products such as toys. Increasing disposable income and general economic growth in the
region, however, are expected to see a rise in the demand for such products, therefore these
areas will serve as good blue oceans in the future toy market.
Beyond the demographics, the societal aspect within the PEST framework, also consider
public opinion, health consciousness, culture etc. some of areas are dealt with, within LEGO’s
corporate social responsibility (CSR). LEGO have implemented several initiatives to be among
the top companies in the world in regards to work safety and renewable energy (Progress
rapport, 2012). There is no doubt that the decision to rely only on renewable energy, and
zero waste, is to counter the argument, that LEGO bricks in general the product of oil and
therefore a burden to the environment. As R. Edward Freeman argues in his Strategic
Management: a stakeholder approach, along with traditional stakeholder theory, companies’
do not necessarily only has a fiduciary duty to the shareholders, but also other relevant
stakeholders. As such this serves as a barrier to entry for future competitors who wish to
imitate LEGO and their products, to deliver on areas beyond the product itself.
Page 36 of 84
4.3.4 Technological
From an external viewpoint, the technological requirements to compete in a market such as
construction toys must be characterized as difficult. The machinery to match an equal
minimum efficient scale, to produce the approximately 36 billion bricks produced in 2011,
will require intense capital and technological investments. This barrier to entry helps protect
the incumbent against new entrants on the construction toy market, which might highlight
the lack of newcomers after the license on the LEGO brick expired in 1988, where only well
established companies can hope to achieve similar cost advantages (Bender, 2010).
During the fiscal year of 2012, 60 % of the sales revenue was generated through sales of new
product launches (Annual rapport, 2012); therefore technology and product development is
of vital importance to LEGO.
With the many technological capabilities possessed by LEGO being explored in the value-
chain, technology in this section should be viewed from an external perspective, which is the
main scope of the PEST framework. These capabilities, however, are useful in highlighting
some of the competitive requirements future competitors would have to align.
As a future risk for LEGO is the growth in novel markets such as three dimensional printing,
which use the same materials, acrylonitrile butadiene styrene, as LEGO in the printing
process (The Economist, 2012). One might therefore worry that someday people would be
able to download the patterns for the bricks required in each product and simply produce
them at home. While this also opens some possibilities, there net effect will still not only be
considered a threat the to existing business model, but for the whole industry.
Turning from technology related to the delivery and product of their products, the attentions
turns to the future substitution threats from new ideas and leisure products. The rise of
tablets and smartphones and the market for entertainment it provide, could be one of there
areas that might continue to diverge attention away from LEGO, due to their ease of use, even
by children. While it is difficult to predict the future interest in children and adults, relative to
not yet invented products, this becomes difficult to evaluate. Historically LEGO have been very
anxious towards the expansion of software entertainment, dreading that it would carve out
the basis for the traditional toy market. With their current mix of games and toys however,
they seem to found the right balance. Whether this mix holds true for the future is beyond the
scope of this paper to evaluate.
Page 37 of 84
4.4 SWOT analysis
Throughout the strategic analysis, several issues have been highlight, with the aim of which to
provide a holistic insight into future and current events, ultimately affecting the entire
valuation. Below table 4 highlight some of the issues that has been raised throughout this
process:
Table 4: SWOT analysis
Strengths Weaknesses - High brand equity - Loyal customers - Exclusive Licenses - Market experience - Solid distribution network - Financial liberty
- Expensive products - Narrow product portfolio - Low presence in Asia -
Opportunities Threats - Economic growth in core markets - Increasing global middle class - Further acquisition of market share - Continued franchises collaboration - Blue ocean markets in Asia
- Skewed geographical distribution - Low switching cost - Increased modernization of children
entertainment - Easy to enter the industry because of
a low industry concentration - Low fertility rates in core markets - If the film industry is not able to
deliver new movie franchises - Vertical or horizontal integration
from suppliers or the film industry - Other toy companies starting to sell
construction toys - Environmental concerns - Increased raw material prices - Reduced interested in construction
toys
Although the above table displays quite a number of threats, the overall impression, we as
authors get, through that strategic analysis, are a very solid market leader position, with many
valuable resources that are difficult to imitate. (Whittington et al 2011) argues that resources
and capabilities can be valuated through the so-call VRIN test, essentially asking whether the
issue at hand either provides value or rarity along with non-imitability and substitutability,
not possessed by competitors. Whilst this test has not been explicitly carried out, several
unique components has been recognized as attained by LEGO.
Page 38 of 84
LEGO has a very high brand equity that enables them to price their products at superior
prices relative to their competitors and still maintain an advantage. The price level, can still
however be seen as a weakness in the long run, as their competitors catch up, along with the
market recognizes cheaper alternatives. Traditional microeconomics dictates that markets
that are characterized by abnormal profits, entice future entrants to the market, which
correspond with recent events from either Hasbro or Mattel. The current market situation
might though be somewhat characterized by a dominant firm price leadership, where LEGO
manage to sell at price greater than marginal cost, whilst its competitors must resort to lower
prices (Lipczynski et al 2009). Although the overall toy industry might be defined by high
competition the construction toys marked, as concluded earlier, might be of a more
oligopolistic structure furtherer attributing to this pricing strategy view.
Their utilization of well-known franchises has given them very popular exclusive rights,
whilst at the same time inhibiting their competitors, providing them with additional market
barriers. The experience of senior management along with a long company history has
provided LEGO with good ballast to navigate the competitive environment and the abilities
needed in the successful exploitation of current assets related to their operating processes
and value creation.
Beyond high prices further weaknesses or liabilities exist; the narrow product portfolio
relative to e.g. Mattel, makes LEGO more susceptible to a slowdown in the enthusiasm of their
core products (Metcalf & LaFranco, 2013); along with a weak presence on future growth
markets, such as India or China, essentially giving them the same point of departure as their
competitors.
It is not surprising that although the solid position of LEGO, several threats are recognized, as
this can be considered a natural extension from the dominant position, given they have so
much more to lose. Throughout the internal and external analysis we highlighted some of the
threats that might affect LEGO in the future, although ranging in probability, these accounts
will be factored into the valuation, so as to account for those most likely. The same applies to
some of the many opportunities they face, given some of the threats inverse relationship with
opportunities.
Page 39 of 84
5. Valuation Analysis
5.1 Reformulation annual reports In this section of the thesis, the balance sheet and the income statement will be reformulated
to get invested capital and net operating profit less adjusted taxes (NOPLAT). These numbers
are used to calculate return on invested capital (ROIC) and the free cash flow.
5.1.1 Reformulation of balance sheet The formula for invested capital is.
Under the assumption that unleveraged companies within the industry, face similar
operating risks, the operating betas should also be alike. By dethatching the betas from the
capital structure, making the all equity financed, we arrive at a unlevered industry average
beta on 0.7, calculated through equation 11:
Table 13: Unlevered beta for representative companies, aggregated averages and debt to market capitalization.
Unlevered Calculation Mattel Hasbro Bandai Namco
Takara Tomy
Walt-Disney Average
Regression based beta 0.98 0.95 0.75 0.93 1.21 0.96
Debt to equity 2012 0.11 0.30 0.55 1.48 0.18 0.52
Unlevered beta 0.88 0.73 0.49 0.38 1.03 0.70
Source: Own calculations, see: LEGO.Bachelor.xlxs
With the unlevered industry average in mind, usually practitioners would leverage the
company to its specific debt-equity ratio, where equity is measured by market capitalization
(Koller et al. 2010). Given the private firm structure of LEGO, we cannot observe the market
capitalization, restricting this approach. Instead we relay on the average debt equity ratio for
Mattel and Hasbro, the two most similar competitors of LEGO, to use as a proxy instead. This
amounted to an average debt to equity ratio of 0.2 ((0.11+0.3)/2) in 2012; applying equation
11 this gives a corresponding leveraged beta for LEGO on 0.84. To this value an additionally
beta increases has been added, given that LEGO do not reflect the marginal investor, and
hence not is fully diversified. Together with the rapid expansion in terms of assets in the near
future, they must be assumed to be additionally susceptible to the market environment; as a
result we have chosen to add an additional premium to the beta of 0.26 arriving at a total beta
of 1.1. This amount reflects the slightly higher volatility to the market, based on that above
arguments, that we deem associated with the future for LEGO and its financial performance.
Therefore with these estimations in place regarding beta, through equation 6 a cost of equity
of 9.02% is calculated (see appendix).
Page 63 of 84
5.4.4 WACC Now that all the components regarding the weighted average cost of capital are estimated,
showed in equation 11, we are ready to estimate the cost of capital for LEGO:
Equation 12: WACC
𝑊𝐴𝐶𝐶 =𝐷
𝑉𝑘𝑑(1 − 𝑇𝑚) +
𝐸
𝑉𝑘𝑒
Source: Koller et. al., 2010
Given our assumption that the market value of both debt and equity equals the book value, we
arrive at a WACC equal to 6.61 % for 2013. Due to the recent political decision regarding
company tax discussed in the strategic analysis, this rate changes slightly to 6.65 % in 2016.
5.5 Explicit and Continuing value period valuation Given the complexity and difficulty to correctly estimate future performance, growth in the
continuing value period is difficult to assert. Although LEGO currently remains a dominant
player in the market, based on the strategic analysis, along with our own subjective opinions,
growth premiums above average GDP growth are assumed unreasonable.
Given these uncertainties the average GDP growth are assumed a reasonable approximation
for revenue growth beyond the explicit period (Koller et al. 2010). Using the historical values
a growth rate of 2.16 % is therefore chosen (Own calculations from Eurostats, 2013).
Return on incremental invested capital is set equal to WACC in the continuing period. Based
on the before mentioned arguments; We do not believe that the LEGO group will be able to
sustain their competitive advantage and competition will eventually reduce their ROIC to the
level of their WACC (Koller et al. 2010).
5.5.1 Projected company value With the cost of capital in place, along with the estimates for the future development in the
respective drivers that make up the future free cash flows, the overall firm value can be
projected. This value consists of the aggregated discounted free cash flows for all the explicit
years added to the present value of the continuing period. Equation 13 shows the calculation
for the present value of the continuing period, by discounting the continuing value after the
explicit period to the present value:
Page 64 of 84
Equation 13: Continuing value in period 7
𝐶𝑜𝑛𝑡𝑖𝑛𝑢𝑖𝑛𝑔 𝑉𝑎𝑙𝑢𝑒7 =𝑁𝑂𝑃𝐿𝐴𝑇𝐶𝑉(1 −
𝑔𝑅𝑂𝑁𝐼𝐶)
𝑊𝐴𝐶𝐶 − 𝐺
Source: Koller et al., 2010
Equation 14: Present value of continuing value
𝐶𝑜𝑛𝑡𝑖𝑛𝑢𝑖𝑛𝑔 𝑉𝑎𝑙𝑢𝑒0 =𝐶𝑉7
(1 + 𝑊𝐴𝐶𝐶)7
Source: Koller et al., 2010
By combining the present value of the continuing period with those of the explicit period, we
arrive at a total value for the LEGO Group at 140,433.06 mia, DKK.
This price is estimated to be a reasonable amount, given the assumption made concerning the
LEGO group. However, other financial analysts has also tried to value the LEGO group albeit
their firm value are significant lower. Sean MacGowan (in Okkels, 2013), who is a toy analysis,
believes that the value of the LEGO group is in the area of 20 billion USD (about 114 billion
DKK). Analysist, Gerrick Johnson (in Metcalf & LaFranco, 2013), confirms this lower value and
goes all the way down to a value about 15 billion USD (about 85.5 billion DKK) and that is
after have discounted the value from 17 billion because of the relatively narrow product
portfolio. These estimates from professional could lead to believe that our firm value is
overpriced but it is hard to conclude based on numbers where we do not know the underlying
assumptions. Another reason why these estimates might have been lower, could be due to
extrapolations of ratios and prices from their nearest competitors, thereby neglecting some of
the intrinsic values captured within our discounted cash flow.
5.6 Competitor comparison To get a deeper comprehension of the validity of our value we can compare P/E ratio with
their competitors. The P/E tells us how high a price investors are willing to pay for earnings. A
high P/E ratio will also tell us that the valuation suggests high growth in the future
(Investopedia, 2013).
The LEGO group’s P/E ratio is 21.38, high compared to their main competitors, Mattel and
Hasbro, who have a P/E of 17.8 and 16.04 respectively. Whilst the average P/E of Mattel,
Hasbro, Disney and Bandai Namco’s arriving at 16.7; putting the LEGO group well over. The
high P/E of the LEGO group could suggest that we have valued the organization too high.
Page 65 of 84
However, we do believe that if the LEGO group was available on the stock exchange their price
would be high because of the growth potential, above market growth, and strong market
position they hold.
Table 14: Competitors P/E ratio
Source: Bloomberg and own calculations, ‘’Beta’’ in LEGO.bachelor.xlsx
5.7 Sensitivity analysis
The sensitivity analysis contains various scenarios and how these affect the firm value. In the
scenarios there is assumed that all parameters not indicated are held fixed from original level.
5.7.1 Scenario 1: Change in WACC
The first scenario will contain an overview of what will happen to the firm value if there is a
change in the weighted average cost of capital. A change in WACC could happen through a
different capital structure, unforeseen change in the risk free rate or in the risk premium.
Graph 10 shows what the firm value would be in case of different WACC’s-
Source: Own calculation, ‘’Sensitivity analysis’’ in spreadsheet
Company P/E ratio 2013
Mattel 17,80
Hasbro 16,04
Walt Disney 17,91
Bandai Namco 15,06
Average 16,70
The LEGO group 21,38
Page 66 of 84
As we can see from the graph, a change in WACC would have serious effect on the firm value.
A higher WACC would decrease the value significantly. This emphasizes the importance of
cheap cost of equities and debt, as this allows for greater firm value.
5.7.2 Scenario 2: Change in revenue growth in the explicit period
The second scenario contains an description of what happens to firm value when there is a
change in the revenue growth in the explicit period. There is assumed the same rate of
revenue growth through the explicit period.
Source: Own calculation, ‘’Sensitivity analysis’’ in spreadsheet
From graph 11 we can see that an increase in revenue growth would have a large effect on the
firm value. This also confirms that a too skeptical view on the revenue growth or to optimistic
view would have serious implication, which is why the revenue growth estimation have to be
done carefully or else the firm value will be either undervalued or overvalued. In a practical
situation the revenue growth should be a bit skeptic because you do not want to pay for
unrealistic growth.
Page 67 of 84
5.7.3 Scenario 3: Change in net-profit margin
In our analysis, we have not based our NOPLAT on a net-profit margin ratio but on several
ratios, which would give a net-profit margin. In this analysis, it is assumed that NOPLAT is
based on net-profit margin and graph 12 displays how a changing market affects the firm
value.
Source: Own calculations, ‘’Sensitivity analysis’’ in spreadsheet
It would have been easier to forecast on a net-profit margin instead of several line items,
because it would be easier to reduce an over-performing net-profit margin, compared to the
market. Along with profits aligning towards the level of competitors. Graph 12 illustrates how
a lower net-profit margin would significantly reduce the firm value.
Page 68 of 84
6. Conclusion
The goals throughout this thesis were to analyses the strategic and financial performance of
LEGO, so as to arrive at a concrete tangible value. This has been achieved through a variety of
acknowledged theoretical framework within strategic analysis, along with valuation
frameworks from within enterprise-discounted cash flow, each of which merits its own
strengths and weaknesses discussed in the theory section.
Analyzing the strategic environment highlighted the extend to which LEGO is affected by both
the general market externalities along with the internal company specific issues. Here it was
found that although difficult global financial performance, LEGO has managed to grow and
capture market shares; however facing increasing constraints as further growth are restricted
by the economical development on especially their core markets in Europe and America. In
relation to growth, the skewed global sales distribution, relaying heavily on cultivated
markets, both acts as a liability and opportunity for future expansions. We further argued that
their historical results were achieved through excellent operating performances along with
good value added, analyzed via the value chain. This revealed their effective utilization in
connection with their production facilities, along with relevant concurrent market strategies
allowing them to retain its dominant position with in the construction toy market.
Externally LEGO face increased competition as entrants into the construction toy market, join
in on the lucrative market. LEGO has however successfully navigated their competitors, but
we still assumed a somewhat pessimistic view, that eventually prices would decline as
essentially similar products drive up competition; driven by competitors such as Mattel,
Hasbro and Mega Brands.
Further externalities such as demographics along with political and societal factors accounted
within the PEST framework, highlighted the future demographic composition of their target
audience, painting a somewhat ambiguous picture as fertility rates decline, whilst average
income increase. The strategic analysis was sub-concluded by summarizing these individual
items within a brief SWOT table.
Page 69 of 84
Within the valuation analysis, the strategic conclusion was extrapolated helping estimate
future developments along with the historical financial ratios. Here it we firstly reformulated
the financial income statements along with balance sheets, so as to prepare them for the
enterprise discounted cash flow model. This involved determining and separating operating
and non-operating items within the aforementioned sheets so as to correctly forecast future
value only related to LEGO.
Secondly followed an historical analysis, where we uncovered items such as return on
invested capital, along with other measures showing impressive growth and superior
performance in relation to their competitors. This analysis was continued with accounts
regarding invested capital and net operating profit less adjusted tax. Furthermore an
efficiency analysis was conducted showing, that LEGO have managed to generate higher asset
and inventory turnovers than their competitors.
Combining these inputs forecasts about the future value was estimated. An explicit period of
seven years was chosen, as this was the time period in which we felt that we could give
relevant estimations. Most importantly was the estimation of future revenue, as this drives
almost every line item. With an expected growth rate around 8 % in 2013, eventually reaching
a market growth of 4 % in 2019, this is a major reduction compared to previous years. By
calculation the additional line items based on these revenue estimations future free cash flows
and net operating profits was determined.
Finally to arrive at the overall firm value, we calculated a weighted average cost of capital
equal to 6.61 % changing slightly during the explicit years due to changes from lower
corporate taxes. Using this cost of capital to discount free cash flows a total firm value of
140,433,06 billion DKK was estimate, which hypothetically would make the world’ largest toy
manufacturer.
Page 70 of 84
7. Literature list
7.1 Books
- Ackert, L. F. (2010). Behavioural finance. (1st ed.). South-western.
- Barrows, E., & Neely, A. (2011). Managing performance in turbulent times. Hoboken: Wiley.
- Bender, J. (2010). Lego: A love story. John Wiley & Sons.
- Buelens, M. (2011). Organisational behaviour. (4th ed.). McGraw-Hill.
- Koller, T., Goedhart, M., & Wessels, D. (2010). Valuation - measuring and managing the value of companies. (5th ed.). McKinsey & Company.
- Kotler, P., Keller, K. L., Brady, M., Goodman, M., & Hansen, T. (2009). Marketing management. (European ed.). Pearson Education Limited.
- Kumar, V. B., & Gopinathan, S. (2009). Organisational behaviour and mass media.
Mumbai: Global Media.
- Lipczynski, J., Wilson, J. O. S., & Goddard, J. (2009).Industrial organization - competition, strategy, policy. (3rd ed.). Prentice Hall.
- Lipkowitz, D. (2012). The lego book. Dorling Kindersley.
- O'Brien, J. A., & Marakas, G. M. (2009). Management information systems. (9th ed.).
McGraw-Hill
- Whittington, R., Scholes, K., & Johnson, G. (2011).Exploring strategy. (9th ed.). Pearson Education Limited.
7.2 Articles and interviews
- Adams, B. (2011, November 10). The most profitable movie franchises of all time. The Blaze. Retrieved from http://www.theblaze.com/stories/2011/11/10/the-most-profitable-movie-franchises-of-all-time/
- Bomsdorf, C., & Hansegard, J. (2013, Marts 7). Lego weighs tie-up with 'the simpsons'. The Wall Street Journal. Retrieved from
Page 71 of 84
- Burritt, C. (2013, April 23). Mattel to autonation show consumers drive s&p 500 sales. Bloomberg. Retrieved from http://www.bloomberg.com/news/2013-04-23/mattel-to-autonation-show-consumers-drive-s-p-500-sales.html
- Clark, E. (2007, August 15). Mattel's real toy story: slave labour in sweatshops. London Evening Standard. Retrieved from http://www.standard.co.uk/news/mattels-real-toy-story-slave-labour-in-sweatshops-6606274.html
- Delingpole, J. (2009, December 18). When lego lost its head - and how this toy story got its happy ending.Daily Mail. Retrieved from http://www.dailymail.co.uk/home/moslive/article-1234465/When-Lego-lost-head--toy-story-got-happy-ending.html
- Gara, T. (2012, November 29). Highlights from the gender-neutral swedish toys “r” us catalog. The Wall Street Journal. Retrieved from http://blogs.wsj.com/corporate-intelligence/2012/11/29/highlights-from-the-gender-neutral-swedish-toys-r-us-catalogue/
- Hansegard, J. (2013, February 21). Lego shrugs off toy-market blues. The Wall Street
Journal. Retrieved from http://online.wsj.com/article/SB10001424127887323549204578317603729616028.html?KEYWORDS=lego mega brands
- Heathcote, E., & Roux, C. (2012, October 26). Things ain’t what they used to be .. Financial Times. Retrieved from http://www.ft.com/intl/cms/s/2/b2a9fa26-19f3-11e2-a179-00144feabdc0.html
- Knudstorp, J. V. (2013, February 21). Interview by Deidre Bolton []. Lego ceo knudstorp on performance, growth outlook., Retrieved from http://www.bloomberg.com/video/lego-ceo-knudstorp-on-performance-growth-outlook-LzsCco8ORgGkHR_3ujJ~2w.html
- Kristensen, M. (2013, January 9). Lego vil investere milliarder i udenlandsk produktion. Mandag Morgen. Retrieved from https://www.mm.dk/lego-vil-investere-milliarder-i-udenlandsk-produktion?utm_source=apsis-anp-3&utm_medium=email&utm_content=unspecified&utm_campaign=unspecified
- Matzen, E. (2013, April 12). Srsf foreslår lavere selskabsskat fra 2014 i forligstilbud. Reuters. Retrieved from http://apps.infomedia.dk.ez.statsbiblioteket.dk:2048/Ms3E/ShowArticle.aspx?outputFormat=Full&Duid=e3beef0d).
- Miller, F., & Gray, E. (2012, January 15). Lego friends petition: Parents, women and girls ask toy companies to stop gender-based marketing. The Huffington Post. Retrieved from http://www.huffingtonpost.com/2012/01/15/lego-friends-girls-gender-toy-marketing_n_1206293.html
Page 72 of 84
- Pezzini, M. (2012). An emerging middle class. OECD Yearbook 2012, Retrieved from http://www.oecdobserver.org/news/fullstory.php/aid/3681/An_emerging_middle_class.html
- Riising, T. (2013, February 21). Niels lunde: Sådan bygger lego sin succes. Børsen. Retrieved from http://borsen.dk/nyheder/investor/artikel/1/252483/niels_lunde_saadan_bygger_lego_sin_succes.html
- Ritzau. (2013, March 18). Lego bygger fabrik i kina.Børsen. Retrieved from http://borsen.dk/nyheder/virksomheder/artikel/1/254220/lego_bygger_fabrik_i_kina.html?hl=TEVHTztMZWdv
- Sherman, L. (2009, May 3). In depth: Barbie by the numbers. Forbes. Retrieved from http://www.forbes.com/2009/03/05/barbie-design-manufacturing-business_numbers_slide_3.html
- Wienberg, C. (2013, February 21). Lego profit soars 35% as toy bricks for girls drive sales growth.Bloomberg. Retrieved from http://www.bloomberg.com/news/2013-02-21/lego-profit-soars-35-as-toy-bricks-for-girls-drive-sales-growth.html
- Metcalf, T., & LaFranco, R. (2013, March 13). Lego builds new billionaires as toymaker topples mattel.Bloomberg. Retrieved from http://www.bloomberg.com/news/2013-03-13/lego-builds-new-billionaires-as-toymaker-topples-mattel.html
7.3 Websites
- Barbie Media. (n.d.). History. Retrieved from http://www.barbiemedia.com/about-barbie/history/1970s.html
- Christiansen, G. K. (1961, October 24). Toy building brick. Retrieved from http://www.google.com/patents?id=dNtXAAAAEBAJ&printsec=abstract&zoom=4&hl=da
- Community Team Blog. (2012). [Web log message]. Retrieved from http://ceeteamblog.com/about/
- Cuusoo (LEGO). (n.d.). Cuusoo. Retrieved from http://lego.cuusoo.com
- Damodaran, A. (n.d.). What is corporate finance?. Retrieved from http://people.stern.nyu.edu/adamodar/ TOPICS->Valuation ''What is it''
Page 73 of 84
- Damodaran, A. (2013, January). Ratings, interest coverage ratios and default spread. Retrieved from http://people.stern.nyu.edu/adamodar/New_Home_Page/datafile/ratings.htm
- Damodaran, A. (n.d.). Estimating discount rates. Retrieved from http://people.stern.nyu.edu/adamodar/pdfiles/eqnotes/dcfrates.pdf
- Damodaran, A. (2013, January 5). Annual returns on stock, t.bonds and t.bills: 1928 - current. Retrieved from http://people.stern.nyu.edu/adamodar/New_Home_Page/datafile/histretSP.html
- Danmarks statistik. (2013). Valutakurser efter valuta, kurstype og opgørelsesmetode (dagsobservationer). Retrieved from http://www.statistikbanken.dk/DNVALD
- Design Council. (n.d.). Idea generation at lego. Retrieved from http://www.designcouncil.org.uk/case-studies/lego/idea-generation-at-lego/
- Enjoy the VIP treatment (LEGO). (2013). Retrieved from http://shop.lego.com/en-US/VIP/index.jsp;jsessionid=LIlBrgYNIazB3Mk3Ov1gbw**.lego-ps-3-3
- European Central Bank. (2013). Interest rate statistics (2004 eu member states & accbs). Retrieved from http://sdw.ecb.europa.eu/browseTable.do?sk=IRS.M.BG.L.L40.CI.0000.BGN.N.Z&sk=IRS.M.CZ.L.L40.CI.0000.CZK.N.Z&sk=IRS.M.DK.L.L40.CI.0000.DKK.N.Z&sk=IRS.M.LV.L.L40.CI.0000.LVL.N.Z&sk=IRS.M.LT.L.L40.CI.0000.LTL.N.Z&sk=IRS.M.HU.L.L40.CI.0000.HUF.N.Z&sk=IRS.M.PL.L.L40.CI.0000.PLN.N.Z&sk=IRS.M.RO.L.L40.CI.0000.RON.N.Z&sk=IRS.M.SE.L.L40.CI.0000.SEK.N.Z&sk=IRS.M.GB.L.L40.CI.0000.GBP.N.Z&REF_AREA=124&node=SEARCHRESULTS&sfl2=4&DATASET=0&SERIES_KEY=229.IRS.M.DK.L.L40.CI.0000.DKK.N.Z
- Eurostats. (2013). Gdp and main components - volumes. Retrieved from http://epp.eurostat.ec.europa.eu/portal/page/portal/national_accounts/data/database
- Finansministeriet. (2013, April 24). Aftale om vækstplan. Retrieved from http://www.fm.dk/nyheder/pressemeddelelser/2013/04/vaekstaftale/~/media/Files/Nyheder/Pressemeddelelser/2013/04/vækstplan/aftale om en vækstplan.pdf
- Games (LEGO). (n.d.). Games. Retrieved from http://www.lego.com/games/
- Hasbro (Google finance). (2013). Retrieved from http://www.google.com/finance?cid=270458
Page 74 of 84
- Hasbro. (2013, April 22). Hasbro reports growth for the first quarter 2013. Retrieved from http://investor.hasbro.com/releasedetail.cfm?ReleaseID=758021
- IMF. (2013, January 23). World economic outlook update - gradual upturn in global growth during 2013. Retrieved from http://www.imf.org/external/pubs/ft/weo/2013/update/01/
- Investopedia. (2013). Price-earnings ratio - p/e ratio. Retrieved from http://www.investopedia.com/terms/p/price-earningsratio.asp
- Jensen, M. V. S. (2012, January 9). Product quality and safety. Retrieved from http://aboutus.lego.com/en/lego-group/product-quality-and-safety/
- Knudstorp, J. V. (Performer) (2013). Jørgen vig knudstorp, chief executive officer of the lego group [Web]. Retrieved from http://www.thenewsmarket.com/j248rgen-vig-knudstorp-chief-executive-officer-of-the-lego-group/a/6d179a34-4d52-455e-9307-27294d4edd9d?cl=d5e43685-6c68-4514-bd44-74d3913d6872
- LEGO (About us). (2013). About the lego group. Retrieved from http://aboutus.lego.com/da-dk/default.aspx
- LEGO education. (n.d.). Products. Retrieved from http://education.lego.com/en-us/products/
- Madsen, B. (Performer) (2012). The future of supply chain part - 1/4 [Web]. Retrieved from http://www.youtube.com/watch?v=SU06UsXT2PE&feature=player_embedded
- Mattel (Google finance). (2013). Retrieved from http://www.google.com/finance?q=NASDAQ:MAT&ei=9PZ0UYj6DuGJwAP6Cg
- Mattel. (2013, April 17). Mattel reports first quarter 2013 financial results and declares quarterly dividend. Retrieved from http://news.mattel.com/News/Mattel-Reports-First-Quarter-2013-Financial-Results-and-Declares-Quarterly-Dividend-150.aspx
- Mega Bloks. (2012, March 29). [Web log message]. Retrieved from http://blog.megabloks.com/posts/tag/mattel/
- Merlin Entertainment Group. (2013). What we do. Retrieved from http://www.merlinentertainments.biz/en/company/do.aspx
- Metaio. (n.d.). Lego digital box augmented reality kiosk. Retrieved from http://www.metaio.com/kiosk/lego/
- MIT media lab. (n.d.). Mitchel resnick. Retrieved from http://www.media.mit.edu/people/mres
Page 75 of 84
- Recklies, D. (2001, June). Porters five forces. Retrieved from http://www.themanager.org/Models/P5F_2.htm
- Recklies, D. (n.d.). Beyond porter – a critique of the critique of porter. Retrieved from
- Rosling, H. (Performer) (2012). Hans rosling: Religions and babies [Web]. Retrieved from http://www.ted.com/talks/hans_rosling_religions_and_babies.html
- Scott, G. (2012, December). 2013 outlook: Consumer discretionary. Retrieved from https://www.fidelity.com/bin-public/060_www_fidelity_com/documents/Sectors_2013_Consumer_Discretionary2.pdf
- Sielen, A. (2013, January 17). What happened with lego. Retrieved from
- Sikkerhedsstyrrelsen. (2010, August 20). Hvad er ce-mærkning?. Retrieved from http://www.sik.dk/Professionelle/Produktsikkerhed/Maerkning-af-produkter/Hvad-er-CE-Maerkning
- The Economist. (2012, September 9). [Web log message]. Retrieved from http://www.economist.com/blogs/babbage/2012/09/3d-printing
- Trangbæk, R. R. (2013, February 21). Successful lego strategy delivers continued strong growth. Retrieved from http://aboutus.lego.com/en-us/news-room/2013/february/annual-result-2012/
- Transformers (Hasbro). (n.d.). Beast hunters. Retrieved from http://www.hasbro.com/transformers/en_US/play/games/
- TT Games. (2013). History. Retrieved from http://www.ttgames.com/history/
- Virksomhedsinformation (LEGO). (2013). Om os - virksomhedsinformation. Retrieved from http://www.lego.com/da-dk/aboutus/corporate-responsibility/product-quality-and-safety/
- Yohn, D. L. (2012, April 26). Brand experience brief: Lego. Retrieved from http://www.futurelab.net/blogs/marketing-strategy-innovation/2012/04/brand_experience_brief_lego.html
Page 76 of 84
7.4 Reports and papers
- Baker, M. P. (2011). Behavioral corporate finance: An updated survey. Informally published manuscript, National Bureau of Economic Research, Retrieved from http://papers.ssrn.com/sol3/papers.cfm?abstract_id=1909013
- Bandai Namco. (2012). Annual report 2012. Retrieved from http://www.bandainamco.co.jp/en/ir/annual/pdf_bnh/en_2012_3.pdf
- Case Study (IBM). (2010, May 19). Lego creates model business success with sap and ibm. Retrieved from http://www-01.ibm.com/software/success/cssdb.nsf/CS/STRD-85KGS6?OpenDocument&Site=igf&cty=en_us
- Daujotas, G. (2013, January 09). Future markets for toys: Demographic outlook. Euromonitor International
- Fernández, P., Aguirreamalloa, J., & Corres, L. (2011).Market risk premium used in 56 countries in 2011: A survey with 6,014 answers. Informally published manuscript, IESE business school, University of Navarra, Spain. Retrieved from http://www.iese.edu/research/pdfs/di-0920-e.pdf
- Euromonitor. (2012). Lego group in toys and games (world).Passport,
- Kharas, H. (2010, January). The emerging middle class in developing countries. Retrieved from http://www.oecd.org/dev/44457738.pdf
- OECD. (2011). Society at a glance - oecd social indicators.Society at a glance, 6,
Retrieved from http://www.oecd-ilibrary.org/social-issues-migration-health/society-at-a-glance-2011_soc_glance-2011-en
- Tomy company. (2012, March 31). Annual report 2012. Retrieved from