1 FINAL Lehigh River Watershed TMDL Monroe, Wayne, Lackawana, Luzerne, Carbon, Schuykill, Bucks, Lehigh, and Northhampton Counties, Pennsylvania Prepared by : Pennsylvania Department of Environmental Protection March 27, 2009
Transcript
1
FINAL
Lehigh River Watershed TMDL Monroe, Wayne, Lackawana, Luzerne, Carbon, Schuykill,
Bucks, Lehigh, and Northhampton Counties, Pennsylvania
Prepared by:
Pennsylvania Department of Environmental Protection
March 27, 2009
2
TABLE OF CONTENTS
Introduction................................................................................................................................. 4 Directions to the Lehigh River Watershed ................................................................................. 5 Segments addressed in this TMDL............................................................................................. 5 Clean Water Act Requirements .................................................................................................. 6 303(d) Listing Process ................................................................................................................ 7 Basic Steps for Determining a TMDL........................................................................................ 7 Watershed History ...................................................................................................................... 8 AMD Methodology..................................................................................................................... 8 Method to Quantify Treatment Pond Pollutant Load ............................................................... 11 Changes in TMDLs That May Require EPA Approval............................................................ 15 Changes in TMDLs That May Not Require EPA Approval..................................................... 15 TMDL Endpoints...................................................................................................................... 15 TMDL Elements (WLA, LA, MOS) ........................................................................................ 16 TMDL Allocations Summary ................................................................................................... 16 Allocation Summary ................................................................................................................. 17 Recommendations..................................................................................................................... 19 Public Participation................................................................................................................... 22
TABLES
Table 1. 303(d) Sub-Delaware River ................................................................................................ 4 Table 2 Applicable Water Quality Criteria............................................................................. 16 Table 3. Reference Stream Lehigh River (WQN125) Criteria .................................................... 16 Table 4. Summary Table–Lehigh River Watershed................................................................ 17 Table 4. Waste Load Allocation of Permitted Discharges............................................................ 19
ATTACHMENTS
ATTACHMENT A ....................................................................................................................... 23
Lehigh River Watershed Maps ................................................................................................. 23 ATTACHMENT B ....................................................................................................................... 27
Method for Addressing Section 303(d) Listings for pH ........................................................... 27 ATTACHMENT C ....................................................................................................................... 30
TMDLs By Segment................................................................................................................. 30 ATTACHMENT D ....................................................................................................................... 41
Use of reference stream for High Quality waters ..................................................................... 41 ATTACHMENT E ....................................................................................................................... 43
Excerpts Justifying Changes Between the 1996, 1998, and 2002 Section 303(d) Lists and Integrated Report/List (2004, 2006)........................................................................................................... 43
ATTACHMENT F ....................................................................................................................... 46
3
Water Quality Data Used In TMDL Calculations .................................................................... 46 ATTACHMENT G ....................................................................................................................... 50
TMDLs and NPDES Permitting Coordination ......................................................................... 50 ATTACHMENT H ....................................................................................................................... 53
Comment and Response............................................................................................................ 53
Introduction This Total Maximum Daily Load (TMDL) calculation has been prepared for segments in the Upper and Middle Lehigh River Watershed (Attachment A). It was done to address the impairments noted on the 1996 Pennsylvania 303(d) list, required under the Clean Water Act, and covers the eight listed segments shown in Table 1. Metals in acidic discharge water from abandoned coalmines causes the impairment. The TMDL addresses the three primary metals associated with acid mine drainage (iron, manganese, aluminum), and pH.
Table 1. 303(d) Sub-Delaware River HUC 02040106 State Water Plan (SWP) Subbasin: 02B
Year Miles Segment ID
DEP Stream Code
Stream Name Desig-nated Use
Data Source
Source EPA 305(b) Cause Code
1996 30.2 * 3335 Lehigh River HQ-
CWF, TSF
303 (d) List
Resource Extraction Metals
1998 29.45 540 03335 Lehigh River HQ-
CWF, TSF
303 (d) List AMD Metals
2002 25.1 540 03335 Lehigh River HQ-
CWF, TSF
SWMP AMD Metals
2004 25.1 540 03335 Lehigh River HQ-
CWF, TSF
SWMP AMD Metals
2006 26.7 * 03335 Lehigh River HQ-
CWF, TSF
SWMP AMD Metals
Cold Water Fisheries =CWF Trout Stocked Fisheries = TSF High Quality = HQ Resource Extraction = RE Surface Water Monitoring Program = SWMP Abandoned Mine Drainage = AMD It is difficult to determine, from the composite listings in the various 303(d) lists and the more recent integrated list, the actual extent of the various designated uses. They are described here: The HQ use extends from, slightly downstream of, Nesquohoning Creek to upstream of the last listed segment of the Lehigh River. Sample points LR1, LR2, LR3 and LR4 are all within the HQ designated use area and the reference watershed method was used for aluminum and iron for the at Risk calculations. See the last paragraph on page 30 and Attachment D.
5
Sample points LR5, LR7 and LR8 are all in the Trout Stock Fisheries portion of the Lehigh River watershed. Directions to the Lehigh River Watershed The Upper and Middle Lehigh River Watersheds are located in Eastern Pennsylvania in portions of Carbon, Luzerne, Monroe, Schuylkill, Lackawanna and Wayne counties. The area within the watershed consists of approximately 885 square miles. The focus of this TMDL is the Lehigh River in Carbon County. Segments addressed in this TMDL The only mining permit with a discharge is Panther Creek Partners which is addressed in the Nesquehoning TMDL. Although there is only one mining permit with NPDES discharges in the watershed, there are several active strip mines and refuse processing operations. None of these operations discharge or have NPDES permits. The active operations are located in areas where the surface drainage has been destroyed by underground mining and surface water infiltrates into the mine pool. This AMD TMDL document contains one or more future mining Waste Load Allocations (WLA). These WLAs were requested by the Pottsville District Mining Office (DMO) to accommodate one or more future mining operations. All comments and questions concerning permitting issues and the future mining WLAs in this TMDL are to be directed to the appropriate DMO. Future wasteload allocations are calculated using the method described for quantifying pollutant load on page 11. The following are examples of what is or is not intended by the inclusion of future mining WLAs. This list is by way of example and is not intended to be exhaustive or exclusive:
1. The inclusion of one or more future mining WLAs is not intended to exclude the issuance of future non-mining NPDES permits in this watershed or any waters of the Commonwealth.
2. The inclusion of one or more future mining WLAs in specific segments of this watershed is not intended to exclude future mining in any segments of this watershed that does not have a future mining WLA.
3. The inclusion of future mining WLAs does not preclude the amending of this AMD TMDL to accommodate additional NPDES permits.
All of the remaining discharges in the watershed are from abandoned mines and are considered to be nonpoint sources of pollution because they are from abandoned Pre-Act mining operations or from coal companies that have settled their bond forfeitures with the Pennsylvania Department of Environmental Protection (PADEP). The distinction between non-point and point sources in this case is determined on the basis of whether or not there is a responsible party for the discharge. Where there is no responsible party the discharge is considered to be a non-point source. Each segment on the 303(d) list will be addressed as a separate TMDL. These TMDLs
6
will be expressed as long-term, average loadings. Due to the nature and complexity of mining effects on the watershed, expressing the TMDL as a long-term average gives a better representation of the data used for the calculations. The designation for this stream segment can be found in PA Title 25 Chapter 93. Clean Water Act Requirements Section 303(d) of the 1972 Clean Water Act requires states, territories, and authorized tribes to establish water quality standards. The water quality standards identify the uses for each waterbody and the scientific criteria needed to support that use. Uses can include designations for drinking water supply, contact recreation (swimming), and aquatic life support. Minimum goals set by the Clean Water Act require that all waters be “fishable” and “swimmable.” Additionally, the federal Clean Water Act and the U.S. Environmental Protection Agency’s (USEPA) implementing regulations (40 CFR 130) require:
• States to develop lists of impaired waters for which current pollution controls are not stringent enough to meet water quality standards (the list is used to determine which streams need TMDLs);
• States to establish priority rankings for waters on the lists based on severity of pollution
and the designated use of the waterbody; states must also identify those waters for which TMDLs will be developed and a schedule for development;
• States to submit the list of waters to USEPA every two years (April 1 of the even
numbered years);
• States to develop TMDLs, specifying a pollutant budget that meets state water quality standards and allocate pollutant loads among pollution sources in a watershed, e.g., point and nonpoint sources; and
• USEPA to approve or disapprove state lists and TMDLs within 30 days of final
submission. Despite these requirements, states, territories, authorized tribes, and USEPA have not developed many TMDLs since 1972. Beginning in 1986, organizations in many states filed lawsuits against the USEPA for failing to meet the TMDL requirements contained in the federal Clean Water Act and its implementing regulations. While USEPA has entered into consent agreements with the plaintiffs in several states, many lawsuits still are pending across the country. In the cases that have been settled to date, the consent agreements require USEPA to backstop TMDL development, track TMDL development, review state monitoring programs, and fund studies on issues of concern (e.g., AMD, implementation of nonpoint source Best Management Practices (BMPs), etc.).
7
303(d) Listing Process Prior to developing TMDLs for specific waterbodies, there must be sufficient data available to assess which streams are impaired and should be on the Section 303(d) list. With guidance from the USEPA, the states have developed methods for assessing the waters within their respective jurisdictions. The primary method adopted by the Pennsylvania Department of Environmental Protection (Pa. DEP) for evaluating waters changed between the publication of the 1996 and 1998 303(d) lists. Prior to 1998, data used to list streams were in a variety of formats, collected under differing protocols. Information also was gathered through the 305(b) reporting process. Pa. DEP is now using the Unassessed Waters Protocol (UWP), a modification of the USEPA Rapid Bioassessment Protocol II (RPB-II), as the primary mechanism to assess Pennsylvania’s waters. The UWP provides a more consistent approach to assessing Pennsylvania’s streams. The assessment method requires selecting representative stream segments based on factors such as surrounding land uses, stream characteristics, surface geology, and point source discharge locations. The biologist selects as many sites as necessary to establish an accurate assessment for a stream segment; the length of the stream segment can vary between sites. All the biological surveys included kick-screen sampling of benthic macroinvertebrates, habitat surveys, and measurements of pH, temperature, conductivity, dissolved oxygen, and alkalinity. Benthic macro invertebrates are identified to the family level in the field. After the survey is completed, the biologist determines the status of the stream segment. The decision is based on the performance of the segment using a series of biological metrics. If the stream is determined to be impaired, the source and cause of the impairment is documented. An impaired stream must be listed on the state’s 303(d) list with the documented source and cause. A TMDL must be developed for the stream segment. A TMDL is for only one pollutant. If a stream segment is impaired by two pollutants, two TMDLs must be developed for that stream segment. In order for the process to be more effective, adjoining stream segments with the same source and cause listing are addressed collectively, and on a watershed basis. Basic Steps for Determining a TMDL Although all watersheds must be handled on a case-by-case basis when developing TMDLs, there are basic processes or steps that apply to all cases. They include:
1. Collection and summarization of pre-existing data (watershed characterization, inventory contaminant sources, determination of pollutant loads, etc.);
2. Calculate TMDL for the waterbody using USEPA approved methods and computer models;
3. Allocate pollutant loads to various sources; 4. Determine critical and seasonal conditions; 5. Submit draft report for public review and comments; and 6. USEPA approval of the TMDL.
8
This document will present the information used to develop the Lehigh River Watershed TMDL. Watershed History The Upper and Middle Lehigh River Watersheds are situated in the Appalachian Ridge and Valley Physiographic Province. It is characterized by folding, faulting and steeply dipping anticline and synclinal geology. Portions of the Eastern Middle and Southern Anthracite Fields are within the Lehigh River Watershed. Coal mining first began in the area in 1792 and continues through the present. Deep mining methods were prevalent until the 1940’s when surface mining became the prevailing method of mining. When the deep mines were abandoned, the mining companies stopped pumping and underground mine pools formed in the lower levels of some mines. Although pumping ceased, a large portion of the deep mine workings remain above the mine pool because many of the coalries are dewatered by gravity drainage tunnels which convey the mine water to topographic low points in neighboring valleys. The source of the acid mine drainage (AMD) is abandon mine discharges which lie to the west of the Lehigh River in Carbon, Luzerne and Schuylkill counties. There are eight major AMD discharges in the Lehigh River Watershed. The Lausanne Drainage Tunnel, near the mouth of Nesquehoning Creek, contributes AMD from the Nesquehoning and Lansford Colliers in the Southern Anthracite Field. The Quakake Tunnel Discharge which is located in the Quakake watershed conveys AMD from the eastern portion of the Jeansville Basin into Quakake Creek. The Hazlebrook overflow is a collection of discharges that drains the eastern portion of the Hazleton Basin into Hazle Creek. The Buck Mountain No. 1 and No. 2 Tunnels drain the Buck Mountain Basin and flow into Buck Mountain Creek. The Sandy Run Tunnel dewaters the eastern portion of the Cross Creek Basin and forms the headwaters of Sandy Run. The Owl Hole Tunnel drains the eastern portion of the Big Black Creek Basin and flows into Sandy Run. The Pond Creek Overflow is a collection of discharges that drain the Upper Lehigh Basin forming the headwaters of Pond Creek. AMD Methodology A two-step approach is used for the TMDL analysis of AMD impaired stream segments. The first step uses a statistical method for determining the allowable instream concentration at the point of interest necessary to meet water quality standards. This is done at each point of interest (sample point) in the watershed. The second step is a mass balance of the loads as they pass through the watershed. Loads at these points will be computed based on average annual flow. The statistical analysis described below can be applied to situations where all of the pollutant loading is from non-point sources as well as those where there are both point and non-point sources. The following defines what are considered point sources and non-point sources for the purposes of our evaluation; point sources are defined as permitted discharges, non-point sources are then any pollution sources that are not point sources. For situations where all of the impact is due to nonpoint sources, the equations shown below are applied using data for a point in the stream. The load allocation made at that point will be for all of the watershed area that is above
9
that point. For situations where there are point-source impacts alone, or in combination with nonpoint sources, the evaluation will use the point-source data and perform a mass balance with the receiving water to determine the impact of the point source. Allowable loads are determined for each point of interest using Monte Carlo simulation. Monte Carlo simulation is an analytical method meant to imitate real-life systems, especially when other analyses are too mathematically complex or too difficult to reproduce. Monte Carlo simulation calculates multiple scenarios of a model by repeatedly sampling values from the probability distribution of the uncertain variables and using those values to populate a larger data set. Allocations were applied uniformly for the watershed area specified for each allocation point. For each source and pollutant, it was assumed that the observed data were log-normally distributed. Each pollutant source was evaluated separately using @Risk1 by performing 5,000 iterations to determine the required percent reduction so that the water quality criteria, as defined in the Pennsylvania Code. Title 25 Environmental Protection, Department of Environmental Protection, Chapter 93, Water Quality Standards, will be met instream at least 99 percent of the time. For each iteration, the required percent reduction is:
PR = maximum {0, (1-Cc/Cd)} where (1) PR = required percent reduction for the current iteration
Cc = criterion in mg/l
Cd = randomly generated pollutant source concentration in mg/l based on the observed
data
Cd = RiskLognorm(Mean, Standard Deviation) where (1a) Mean = average observed concentration Standard Deviation = standard deviation of observed data
The overall percent reduction required is the 99th percentile value of the probability distribution generated by the 5,000 iterations, so that the allowable long-term average (LTA) concentration is:
LTA = Mean * (1 – PR99) where (2) LTA = allowable LTA source concentration in mg/l
Once the allowable concentration and load for each pollutant is determined, mass-balance accounting is performed starting at the top of the watershed and working down in sequence. This mass-balance or load tracking is explained below. 1
@Risk – Risk Analysis and Simulation Add-in for Microsoft Excel, Palisade Corporation, Newfield, NY, 1990-1997.
10
Load tracking through the watershed utilizes the change in measured loads from sample location to sample location, as well as the allowable load that was determined at each point using the @Risk program. There are two basic rules that are applied in load tracking; rule one is that if the sum of the measured loads that directly affect the downstream sample point is less than the measured load at the downstream sample point it is indicative that there is an increase in load between the points being evaluated, and this amount (the difference between the sum of the upstream and downstream loads) shall be added to the allowable load(s) coming from the upstream points to give a total load that is coming into the downstream point from all sources. The second rule is that if the sum of the measured loads from the upstream points is greater than the measured load at the downstream point this is indicative that there is a loss of instream load between the evaluation points, and the ratio of the decrease shall be applied to the load that is being tracked (allowable load(s)) from the upstream point. Tracking loads through the watershed gives the best picture of how the pollutants are affecting the watershed based on the information that is available. The analysis is done to insure that water quality standards will be met at all points in the stream. The TMDL must be designed to meet standards at all points in the stream, and in completing the analysis, reductions that must be made to upstream points are considered to be accomplished when evaluating points that are lower in the watershed. Another key point is that the loads are being computed based on average annual flow and should not be taken out of the context for which they are intended, which is to depict how the pollutants affect the watershed and where the sources and sinks are located spatially in the watershed. In Low pH TMDLs, acidity is compared to alkalinity as described in Attachment B. Each sample point used in the analysis of pH by this method must have measurements for total alkalinity and total acidity. Net alkalinity is alkalinity minus acidity, both in units of milligrams per liter (mg/l) CaCO3. Statistical procedures are applied, using the average value for total alkalinity at that point as the target to specify a reduction in the acid concentration. By maintaining a net alkaline stream, the pH value will be in the range between six and eight. This method negates the need to specifically compute the pH value, which for streams affected by low pH may not a true reflection of acidity. This method assures that Pennsylvania’s standard for pH is met when the acid concentration reduction is met. Information for the TMDL analysis performed using the methodology described above is contained in the “TMDLs by Segment” section of this report. This document contains one or more future mining Waste Load Allocations (WLA) to accommodate possible future mining operations. The Pottsville District Mining Office determined the number of and location of the future mining WLAs. All comments and questions concerning permitting issues and future mining WLAs are to be directed to the appropriate DMO.
11
The following are examples of what is or is not intended by the inclusion of future mining WLAs. This list is by way of example and is not intended to be exhaustive or exclusive:
1 The inclusion of one or more future mining WLAs is not intended to exclude the issuance of future non-mining NPDES permits in this watershed or any waters of the Commonwealth.
2 The inclusion of one or more future mining WLAs in specific segments of this watershed is not intended to exclude future mining in any segments of this watershed that does not have a future mining WLA.
3 The inclusion of future mining WLAs does not preclude the amending of this AMD TMDL to accommodate additional NPDES permits.
Method to Quantify Treatment Pond Pollutant Load Calculating Waste Load Allocations for Active Mining in the TMDL Stream Segment. The end product of the TMDL report is to develop Waste Load Allocations (WLA) and Load Allocations (LA) that represent the amount of pollution the stream can assimilate while still achieving in-stream limits. The LA is the load from abandoned mine lands where there is no NPDES permit or responsible party. The WLA is the pollution load from active mining that is permitted through NPDES. In preparing the TMDL, calculations are done to determine the allowable load. The actual load measured in the stream is equal to the allowable load plus the reduced load.
Total Measured Load = Allowed Load + Reduced Load If there is active mining or anticipated mining in the near future in the watershed, the allowed load must include both a WLA and a LA component.
Allowed Load (lbs/day) = WLA (lbs/day) + LA (lbs/day) The following is an explanation of the quantification of the potential pollution load reporting to the stream from permitted pit water treatment ponds that discharge water at established effluent limits. Surface coalmines remove soil and overburden materials to expose the underground coal seams for removal. After removal of the coal the overburden is replaced as mine spoil and the soil is replaced for revegetation. In a typical surface mining operation the overburden materials is removed and placed in the previous cut where the coal has been removed. In this fashion, an active mining operation has a pit that progresses through the mining site during the life of the mine. The pit may have water reporting to it, as it is a low spot in the local area. Pit water can be the result of limited shallow groundwater seepage, direct precipitation into the pit, and surface Riveroff from partially regarded areas that have been backfilled but not yet revegetated. Pit water is pumped to nearby treatment ponds where it is treated to the required treatment pond effluent limits. The standard effluent limits are as follows, although stricter effluent limits may
12
be applied to a mining permit’s effluent limits to insure that the discharge of treated water does not cause in-stream limits to be exceeded.
Standard Treatment Pond Effluent Limits: Alkalinity > Acidity
6.0 <= pH <= 9.0 Al <0.75 mg/l Fe < 3.0 mg/l Mn < 2.0 mg/l
Discharge from treatment ponds on a mine site is intermittent and often varies as a result of precipitation events. Measured flow rates are almost never available. If accurate flow data are available, they can be used to quantify the WLA. The following is an approach that can be used to determine a waste load allocation for an active mining operation when treatment pond flow rates are not available. The methodology involves quantifying the hydrology of the portion of a surface mine site that contributes flow to the pit and then calculating waste load allocation using NPDES treatment pond effluent limits. The following formula is used:
Flow (MGD) X BAT limit (mg/l) X 8.34 = lbs/day The total water volume reporting to ponds for treatment can come from two primary sources: direct precipitation to the pit and Runoff from the unregraded area following the pit’s progression through the site. Groundwater seepage reporting to the pit is considered negligible compared to the flow rates resulting from precipitation. In an active mining scenario, a mine operator pumps pit water to the ponds for chemical treatment. Pit water is often acidic with dissolved metals in nature. At the treatment ponds, alkaline chemicals are added to increase the pH and encourage dissolved metals to precipitate and settle. Pennsylvania averages 41.4 inches of precipitation per year (Mid-Atlantic River Forecast Center, National Weather Service, State College, PA, 1961-1990, http://www.dep.state.pa.us/dep/subject/hotopics/drought/PrecipNorm.htm). A maximum pit dimension without special permit approval is 1500 feet long by 300 feet wide. Assuming that 5 percent of the precipitation evaporates and the remaining 95 percent flows to the low spot in the active pit to be pumped to the treatment ponds, results in the following equation and average flow rates for the pit area.
41.4 in. precip./yr x 0.95 x 1 ft./12/in. x 1500’x300’/pit x 7.48 gal/ft3 x 1yr/365days x 1day/24hr. x 1hr./60 min. =
= 21.0 gal/min average discharge from direct precipitation into the open mining pit area. Pit water can also result from runoff from the unregraded and revegetated area following the pit. In the case of roughly backfilled and highly porous spoil, there is very little surface runoff. It is estimated that 80 percent of precipitation on the roughly regarded mine spoil infiltrates, 5 percent evaporates, and 15 percent may River off to the pit for pumping and potential treatment (Jay Hawkins, Office of Surface Mining, Department of the Interior, Personal Communications 2003). Regrading and revegetation of the mine spoil is conducted as the mining progresses. DEP encourages concurrent backfilling and revegetation through its compliance efforts and it is
13
in the interest of the mining operator to minimize the company’s reclamation bond liability by keeping the site reclaimed and revegetated. Experience has shown that reclamation and revegetation is accomplished two to three pit widths behind the active mining pit area. DEP uses three pit widths as an area representing potential flow to the pit when reviewing the NPDES permit application and calculating effluent limits based on best available treatment technology and insuring that in-stream limits are met. The same approach is used in the following equation, which represents the average flow reporting to the pit from the unregraded and unrevegetated spoil area.
41.4 in. precip./yr x 3 pit areas x 1 ft./12/in. x 1500’x300’/pit x 7.48 gal/ft3 x 1yr/365days x 1day/24hr. x 1hr./60 min. x 15 in. Riveroff/100 in. precipitation =
= 9.9 gal./min. average discharge from spoil Runoff into the pit area.
The total average flow to the pit is represented by the sum of the direct pit precipitation and the water flowing to the pit from the spoil area as follows:
Total Average Flow = Direct Pit Precipitation + Spoil Riveroff
Total Average Flow = 21.0 gal./min + 9.9 gal./min. = 30.9 gal./min.
The resulting average waste load from a permitted treatment pond area is as follows.
Allowable Aluminum Waste Load Allocation: 30.9 gal./min. x 0.75 mg/l x 0.01202 = 0.28 lbs./day
Allowable Iron Waste Load Allocation:
30.9 gal./min. x 3 mg/l x 0.01202 = 1.1 lbs./day
Allowable Manganese Waste Load Allocation: 30.9 gal./min. x 2 mg/l x 0.01202 = 0.7 lbs./day
(Note: 0.01202 is a conversion factor to convert from a flow rate in gal/min. and a concentration in mg/l to a load in units of lbs./day.) There is little or no documentation available to quantify the actual amount of water that is typically pumped from active pits to treatment ponds. Experience and observations suggest that the above approach is very conservative and overestimates the quantity of water, creating a large margin of safety in the methodology. County specific precipitation rates can be used in place of the long-term state average rate, although the margin of safety is greater than differences from individual counties. It is common for many mining sites to have very “dry” pits that rarely accumulate water that would require pumping and treatment. Also, it is the goal of DEP’s permit review process to not issue mining permits that would cause negative impacts to the environment. As a step to insure that a mine site does not produce acid mine drainage, it is common to require the addition of alkaline materials (waste lime, baghouse lime, limestone, etc.) to the backfill spoil materials to neutralize any acid-forming materials that
14
may be present. This practice of ‘alkaline addition’ or the incorporation of naturally occurring alkaline spoil materials (limestone, alkaline shale or other rocks) may produce alkaline pit water with very low metals concentrations that does not require treatment. A comprehensive study in 1999 evaluated mining permits issued since 1987 and found that only 2.2 percent resulted in a post-mining pollution discharge (Evaluation of Mining Permits Resulting in Acid Mine Drainage 1987-1996: A Post Mortem Study, March 1999). As a result of efforts to insure that acid mine drainage is prevented, most mining operations have alkaline pit water that often meets effluent limits and requires little or no treatment.
While most mining operations are permitted and allowed to have a standard, 1500’ x 300’ pit, most are well below that size and have a corresponding decreased flow and load. Where pit dimensions are greater than the standard size or multiple pits are present, the calculations to define the potential pollution load can be adjusted accordingly. Hence, the above calculated Waste Load Allocation is very generous and likely high compared to actual conditions that are generally encountered. A large margin of safety is included in the WLA calculations. The allowable load for the stream segment is determined by modeling of flow and water quality data. The allowable load has a potential Waste Load Allocation (WLA) component if there is active mining or anticipated future mining and a Load Allocation (LA). So, the sum of the Load Allocation and the Waste Load Allocation is equal to the allowed load. The WLA is determined by the above calculations and the LA is determined by the difference between the allowed load and the WLA.
Allowed Load = Waste Load Allocation + Load Allocation Or
Load Allocation = Allowed Load – Waste Load Allocation This is an explanation of the quantification of the potential pollution load reporting to the stream from permitted pit water treatment ponds that discharge water at established effluent limits. This allows for including active mining activities and their associated Waste Load in the TMDL calculations to more accurately represent the watershed pollution sources and the reductions necessary to achieve in-stream limits. When a mining operation is concluded its WLA is available for a different operation. Where there are indications that future mining in a watershed are greater than the current level of mining activity, an additional WLA amount may be included in the allowed load to allow for future mining. Derivation of the flow used in the future mining WLAs:
30.9 gal/min X 2 (assume two pits) X 0.00144 = 0.09 MGD
Future TMDL Modifications In the future, the Department may adjust the load and/or wasteload allocations in this TMDL to account for new information or circumstances that are developed or discovered during the implementation of the TMDL when a review of the new information or circumstances indicate that such adjustments are appropriate. Adjustment between the load and wasteload allocation
15
will only be made following an opportunity for public participation. A wasteload allocation adjustment will be made consistent and simultaneous with associated permit(s) revision(s)/reissuances (i.e., permits for revision/reissuance in association with a TMDL revision will be made available for public comment concurrent with the related TMDL’s availability for public comment). New information generated during TMDL implementation may include, among other things, monitoring data, BMP effectiveness information, and land use information. All changes in the TMDL will be tallied and once the total changes exceed 1% of the total original TMDL allowable load, the TMDL will be revised. The adjusted TMDL, including its LAs and WLAs, will be set at a level necessary to implement the applicable WQS and any adjustment increasing a WLA will be supported by reasonable assurance demonstration that load allocations will be met. The Department will notify EPA of any adjustments to the TMDL within 30 days of its adoption and will maintain current tracking mechanisms that contain accurate loading information for TMDL waters. Changes in TMDLs That May Require EPA Approval
• Increase in total load capacity. • Transfer of load between point (WLA) and nonpoint (LA) sources. • Modification of the margin of safety (MOS). • Change in water quality standards (WQS). • Non-attainment of WQS with implementation of the TMDL. • Allocations in trading programs.
Changes in TMDLs That May Not Require EPA Approval
• Total loading shift less than or equal to 1% of the total load. • Increase of WLA results in greater LA reductions provided reasonable assurance of
implementation is demonstrated (a compliance/implementation plan and schedule). • Changes among WLAs with no other changes; TMDL public notice concurrent with
permit public notice. • Removal of a pollutant source that will not be reallocated. • Reallocation between LAs. • Changes in land use.
TMDL Endpoints One of the major components of a TMDL is the establishment of an instream numeric endpoint, which is used to evaluate the attainment of acceptable water quality. An instream numeric endpoint, therefore, represents the water quality goal that is to be achieved by implementing the load reductions specified in the TMDL. The endpoint allows for comparison between observed instream conditions and conditions that are expected to restore designated uses. The endpoint is based on either the narrative or numeric criteria available in water quality standards. Because of the nature of the pollution sources in the watershed, the TMDLs component makeup will be load allocations that are specified above a point in the stream segment. All allocations will be specified as long-term average daily concentrations. These long-term average daily
16
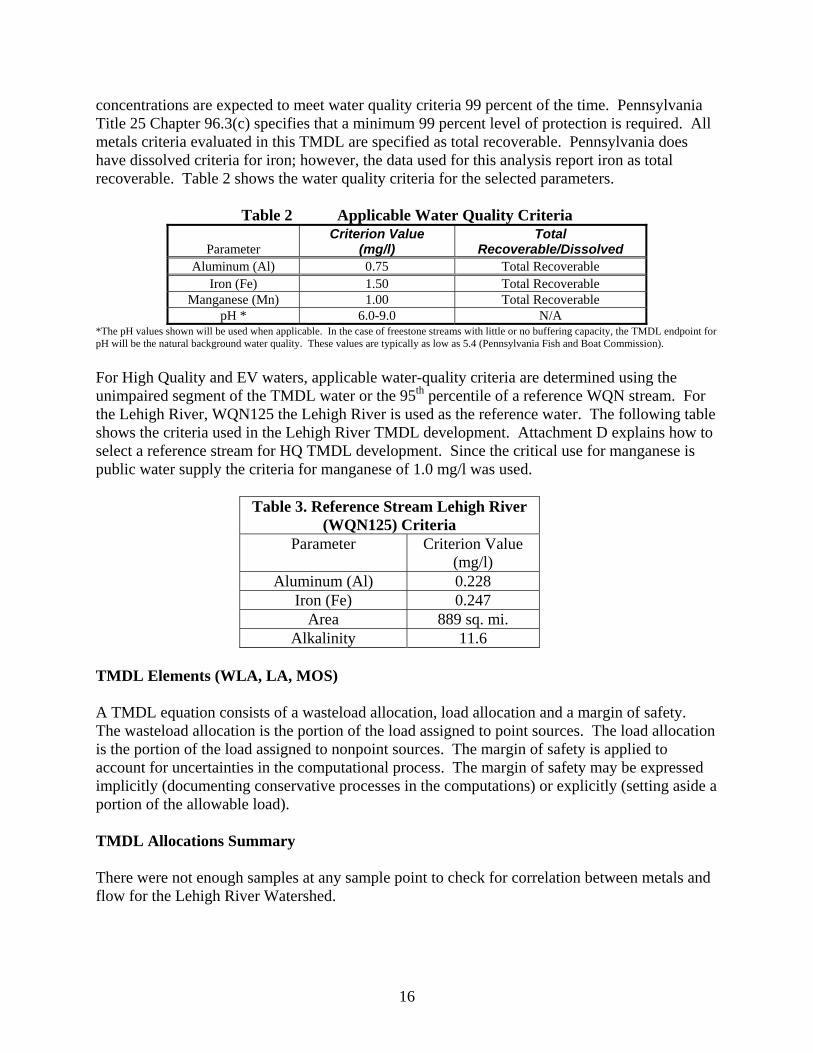
concentrations are expected to meet water quality criteria 99 percent of the time. Pennsylvania Title 25 Chapter 96.3(c) specifies that a minimum 99 percent level of protection is required. All metals criteria evaluated in this TMDL are specified as total recoverable. Pennsylvania does have dissolved criteria for iron; however, the data used for this analysis report iron as total recoverable. Table 2 shows the water quality criteria for the selected parameters.
Table 2 Applicable Water Quality Criteria
Parameter Criterion Value
(mg/l) Total
Recoverable/Dissolved Aluminum (Al) 0.75 Total Recoverable
Iron (Fe) 1.50 Total Recoverable Manganese (Mn) 1.00 Total Recoverable
pH * 6.0-9.0 N/A *The pH values shown will be used when applicable. In the case of freestone streams with little or no buffering capacity, the TMDL endpoint for pH will be the natural background water quality. These values are typically as low as 5.4 (Pennsylvania Fish and Boat Commission). For High Quality and EV waters, applicable water-quality criteria are determined using the unimpaired segment of the TMDL water or the 95th percentile of a reference WQN stream. For the Lehigh River, WQN125 the Lehigh River is used as the reference water. The following table shows the criteria used in the Lehigh River TMDL development. Attachment D explains how to select a reference stream for HQ TMDL development. Since the critical use for manganese is public water supply the criteria for manganese of 1.0 mg/l was used.
Table 3. Reference Stream Lehigh River (WQN125) Criteria
Parameter Criterion Value (mg/l)
Aluminum (Al) 0.228 Iron (Fe) 0.247
Area 889 sq. mi. Alkalinity 11.6
TMDL Elements (WLA, LA, MOS) A TMDL equation consists of a wasteload allocation, load allocation and a margin of safety. The wasteload allocation is the portion of the load assigned to point sources. The load allocation is the portion of the load assigned to nonpoint sources. The margin of safety is applied to account for uncertainties in the computational process. The margin of safety may be expressed implicitly (documenting conservative processes in the computations) or explicitly (setting aside a portion of the allowable load). TMDL Allocations Summary There were not enough samples at any sample point to check for correlation between metals and flow for the Lehigh River Watershed.
17
Allocation Summary This TMDL will focus remediation efforts on the identified numerical reduction targets for each watershed. The reduction schemes in Table 3 for each segment are based on the assumption that all upstream allocations are achieved and take in to account all upstream reductions. Attachment C contains the TMDLs by segment analysis for each allocation point in a detailed discussion. As changes occur in the watershed, the TMDLs may be re-evaluated to reflect current conditions. An implicit MOS based on conservative assumptions in the analysis is included in the TMDL calculations. The allowable LTA concentration in each segment is calculated using Monte Carlo Simulation as described previously. The allowable load is then determined by multiplying the allowable concentration by the flow and a conversion factor at each sample point. The allowable load is the TMDL. In some instances, instream processes, such as settling, are taking place within a stream segment. These processes are evidenced by a decrease in measured loading between consecutive sample points. It is appropriate to account for these losses when tracking upstream loading through a segment. The calculated upstream load lost within a segment is proportional to the difference in the measured loading between the sampling points. Table 4. Summary Table–Lehigh River Watershed
Station
Parameter
Existing Load
(lbs/day)
TMDL Allowable
Load (lbs/day)
WLA (lbs/day)
LA (lbs/day)
Load Reduction (lbs/day)
Percent Reduction
%
LR1 LR1 Most Upstream Sample Point on Lehigh River Al 748.1 NA 0.0 NA NA 0 Fe 871.4 217.8 0.0 206.55 653.6 75 Mn 264.5 264.5 0.0 257.0 0.0 0 Acidity 45722.5 10058.9 0.0 10058.9 35663.6 78
SR7 SR7 Mouth of Sandy Run Upstream of Confluence with Lehigh River Al 176.8 10.8 1.12 9.68 166.0 94 Fe 22.8 22.8 4.5 18.3 0.0 0 Mn 53.3 3.9 3.0 0.9 49.4 93 Acidity 3810.1 267.3 0.0 267.3 3542.8 93
LR2 LR2 Lehigh River Upstream of Confluence with Buck Mountain Creek Al 1105.5 NA 0.0 NA NA 0 Fe 663.3 NA 0.0 NA NA 0 Mn 410.3 410.3 0.0 402.8 0.0 0 Acidity 42272.3 11413.5 0.0 11413.5 0.0 0
BM7 Mouth of Buck Mountain Creek Upstream of Confluence with Lehigh River Al 55.8 4.6 0.0 4.6 51.2 92 Fe 9.8 9.8 0.0 9.8 0.0 0 Mn 21.6 0.5 0.0 0.5 21.1 98 Acidity 746.7 159.0 0.0 159.0 587.7 79
LR3 LR3 Lehigh River Upstream of Confluence with Black Creek Al 1287.3 NA 0.0 NA NA 0 Fe 965.5 560.0 0.0 548.75 405.5 42 Mn 244.6 244.6 0.0 237.1 0.0 0
18
Station
Parameter
Existing Load
(lbs/day)
TMDL Allowable
Load (lbs/day)
WLA (lbs/day)
LA (lbs/day)
Load Reduction (lbs/day)
Percent Reduction
%
Acidity 58187.8 14547.0 0.0 14547.0 12194.4 46 BC3 Mouth of Black Creek Upstream of Confluence with Lehigh River
LR4 Lehigh River Upstream of Confluence with Nesquohoning Creek Al 1411.7 NA 0.0 NA NA 0 Fe 847.0 NA 0.0 NA NA 0 Mn 378.3 378.3 0.0 370.8 0.0 0 Acidity 54433.2 11431.0 0.0 11431.0 1159.9 9
NC6 Mouth of Nesquohoning Creek Upstream of Confluence with Lehigh River Al 98.9 98.9 2.8 96.1 0.0 0 Fe 351.4 112.5 11.25 101.25 238.9 68 Mn 206.2 88.7 7.5 81.2 117.5 57 Acidity 3778.5 680.1 0.0 680.1 3098.4 82
LR5 Lehigh River Al 1457.0 NA 2.8 NA NA 0 Fe 874.2 NA 11.25 NA NA 0 Mn 461.9 NA 7.5 NA 0.0 0 Acidity 32637.6 15992.4 0.0 15992.4 0.0 0
LR7 Mouth of Aquashicola Creek Upstream of Confluence with Lehigh River Al 172.0 NA 2.8 NA NA 0 Fe 103.2 NA 11.25 NA NA 0 Mn 50.0 50.0 7.5 42.5 0.0 0 Acidity 0.0 0.0 0.0 0.0 0.0 0
LR8 Last Downstream Sample Point on Lehigh River Al 2139.4 NA 2.8 NA NA 0 Fe 1283.6 NA 11.25 NA NA 0 Mn 530.6 530.6 7.5 523.1 0.0 0 Acidity 27726.1 23567.2 0.0 23567.2 0.0 0
Numbers in italics are set aside for future mining operations. All waste load allocations were calculated using the methodology explained previously in the Method to Quantify Treatment Pond Pollutant Load section of the report. Wasteload allocations for the existing NPDES permits were incorporated into the calculations at LR5 (Jim Thorpe Municipal Authority, JT001, NPDES PA0062421) and (Lehighton Water Authority, LWA001, NPDES PA0062936). This is the first downstream monitoring points that receive all the potential flow of treated water from these treatment sites. No required reductions of these permits are necessary at this time because there are upstream non-point sources that when reduced will met the TMDL or there is available assimilation capacity. All necessary reductions are assigned to non-point sources. Both the Jim Thorpe Municipal Authority and the Lehighton Water Authority are permitted industrial discharges. The waste load allocations for these permits were calculated using the permitted effluent limitations and the effluent discharge rates.
19
The third industrial discharge: Lehighton Water Authority, NPDES permit PA0063860, does not require wasteload allocations because neither aluminum, iron nor manganese are in the permit.
Table 4. Waste Load Allocation of Permitted Discharges Parameter Allowable
Average Monthly
Conc. (mg/l)
Calculated Average
Flow (MGD)
Wla (lbs/day)
Parameter Allowable Average Monthly
Conc. (mg/l)
Calculated Average
Flow (MGD)
WLA (lbs/day)
Jim Thorpe Muicipal Authority (NPDES PA0062421) JT001
Lehighton Water Authority (NPDES PA0062936) LWA001
Al 1.2 0.082 0.82 Al 4.0 0.0135 0.45 Fe 2.0 0.082 1.37 Fe 2.0 0.0135 0.23 Mn 1.0 0.082 0.68 Mn 1.0 0.0135 0.11
Recommendations
Various methods to eliminate or treat pollutant sources and to provide a reasonable assurance that the proposed TMDLs can be met exist in Pennsylvania. These methods include PADEP’s primary efforts to improve water quality through reclamation of abandoned mine lands (for abandoned mining) and through the National Pollution Discharge Elimination System (NPDES) permit program (for active mining). Funding sources available that are currently being used for projects designed to achieve TMDL reductions include the Environmental Protection Agency (EPA) 319 grant program and Pennsylvania’s Growing Greener Program (which has awarded over almost $37 M since 1999 for watershed restoration and protection in mine-drainage impacted watersheds and abandoned mine reclamation). In 2006 alone, federal funding through the Office of Surface Mining (OSM) contributed $949 K for reclamation and mine drainage treatment through the Appalachian Clean Streams Initiative and another $298 K through Watershed Cooperative Agreements. According to the Department of the Interior, Office of Surface Mining (www.osmre.gov/annualreports/05SMCRA2AbandMineLandReclam.pdf), during 2005, Pennsylvania reclaimed 54 acres of gob piles, 73 acres of pits, 2,500 acres of spoil areas, 7,658 feet of highwall, and treated 94,465 gallons of mine drainage under their environmental (Priority 3) program only (priority 1&2 are for reclaiming features threatening public health and safety with much larger number of features reclaimed).
OSM reports that nationally, of the $8.5 billion of high priority (defined as priority 1&2 features or those that threaten public health and safety) coal related AML problems in the AML inventory, $6.6 billion (78%)have yet to be reclaimed; $3.6 billion of this total is attributable to Pennsylvania watershed costs. Almost 83 percent of the $2.3 billion of coal related environmental problems (priority 3) in the AML inventory are not reclaimed. The Bureau of Abandoned Mine Reclamation, Pennsylvania’s primary bureau in dealing with abandoned mine reclamation (AMR) issues, has established a comprehensive plan for abandoned mine reclamation throughout the Commonwealth to prioritize and guide reclamation efforts for throughout the state to make the best use of valuable funds (www.dep.state.pa.us/dep/deputate/minres/bamr/complan1.htm). In developing and implementing a comprehensive plan for abandoned mine reclamation, the resources (both human
20
and financial) of the participants must be coordinated to insure cost-effective results. The following set of principles is intended to guide this decision making process:
• Partnerships between the DE • P, watershed associations, local governments, environmental groups, other state agencies,
federal agencies and other groups organized to reclaim abandoned mine lands are essential to achieving reclamation and abating acid mine drainage in an efficient and effective manner.
• Partnerships between AML interests and active mine operators are important and essential in reclaiming abandoned mine lands.
• Preferential consideration for the development of AML reclamation or AMD abatement projects will be given to watersheds or areas for which there is an approved rehabilitation plan. (guidance is given in Appendix B to the Comprehensive Plan).
• Preferential consideration for the use of designated reclamation moneys will be given to projects that have obtained other sources or means to partially fund the project or to projects that need the funds to match other sources of funds.
• Preferential consideration for the use of available moneys from federal and other sources will be given to projects where there are institutional arrangements for any necessary long-term operation and maintenance costs.
• Preferential consideration for the use of available moneys from federal and other sources will be given to projects that have the greatest worth.
• Preferential consideration for the development of AML projects will be given to AML problems that impact people over those that impact property.
• No plan is an absolute; occasional deviations are to be expected.
A detailed decision framework is included in the plan that outlines the basis for judging projects for funding, giving high priority to those projects whose cost/benefit ratios are most favorable and those in which stakeholder and landowner involvement is high and secure.
In addition to the abandoned mine reclamation program, regulatory programs also are assisting in the reclamation and restoration of Pennsylvania’s land and water. PADEP has been effective in implementing the NPDES program for mining operations throughout the Commonwealth. During 2006, District Mining Offices issued 31 new remining permits with the potential for reclaiming 1,058 acres of abandoned mine lands; an additional 328 acres were reclaimed during 2006 from existing remining permits. This reclamation was done at no cost to the Commonwealth or the federal government. Long-term treatment agreements were initialized for 109 facilities/operators who need to assure treatment of post-mining discharges or discharges they degraded which will provide for long-term treatment of 211 discharges. Of the 109 agreements, 34 have been finalized with 17 conventional bonding agreements totaling $75 M and
21
17 with treatment trusts totaling $73 M. According to OSM, “PADEP is conducting a program where active mining sites are, with very few exceptions, in compliance with the approved regulatory program”. In addition, the Commonwealth dedicates 359 full-time equivalents (staff) to its regulatory and AML programs. The Commonwealth is exploring all options to address its abandoned mine problem. During 2000-2006, many new approaches to mine reclamation and mine drainage remediation have been explored and projects funded to address problems in innovative ways. These include:
• Project XL - The Pennsylvania Department of Environmental Protection (“PADEP”) has proposed this XL Project to explore a new approach to encourage the remining and reclamation of abandoned coal mine sites. The approach would be based on compliance with in-stream pollutant concentration limits and implementation of best management practices (“BMPs”), instead of National Pollutant Discharge Elimination System (“NPDES”) numeric effluent limitations measured at individual discharge points. This XL project would provide for a test of this approach in up to eight watersheds with significant acid mine drainage (“AMD”) pollution. The project will collect data to compare in-stream pollutant concentrations versus the loading from individual discharge points and provide for the evaluation of the performance of BMPs and this alternate strategy in PADEP’s efforts to address AMD.
• Awards of grants for 1) proposals with economic development or industrial application as their primary goal and which rely on recycled mine water and/or a site that has been made suitable for the location of a facility through the elimination of existing Priority 1 or 2 hazards, and 2) new and innovative mine drainage treatment technologies that will provide waters of higher purity that may be needed by a particular industry at costs below conventional treatment costs as in common use today or reduce the costs of water treatment below those of conventional lime treatment plants. Eight contracts totaling $4.075 M were awarded in 2006 under this program.
• Projects using water from mine pools in an innovative fashion, such as the Shannopin Deep Mine Pool (in southwestern Pennsylvania), the Barnes & Tucker Deep Mine Pool (the Susquehanna River Basin Commission into the Upper West Branch Susquehanna River), and the Wadesville Deep Mine Pool (Excelon Generation in Schuylkill County).
Citizen and stakeholder involvement is critical to watershed reclamation in Pennsylvania and is strongly encouraged through the TMDL program and process. There currently isn’t a watershed organization interested in the Leatherwood Creek Watershed. It is recommended that agencies work with local interests to form a watershed group that will be dedicated to the remediation and preservation of these watersheds through public education, monitoring and assessment, and improvement projects. Information on formation of a watershed group is available through websites for the PADEP (www.dep.state.pa.us), the AMR Clearinghouse (www.amrclearinghouse.com), the EPA (www.epa.gov), the Susquehanna River Basin Commission (www.srbc.net) and others. In addition, each DEP Regional Office (6) and each District Mining Office (5) have watershed managers to assist stakeholder groups interested in restoration in their watershed. Most Pennsylvania county conservation districts have a watershed specialist who can also provide assistance to stakeholders (www.pacd.org). Potential funding
22
sources for AMR projects can be found at www.dep.state.pa.us/dep/subject/pubs/water/wc/FS2205.pdf. There is currently no watershed group focused on the Lehigh River Watershed area. It is recommended that agencies work with local interests to form a watershed organization. This watershed organization could then work to implement projects to achieve the reductions recommended in this TMDL document. Candidate or federally-listed threatened and endangered species may occur in or near the watershed. While implementation of the TMDL should result in improvements to water quality, they could inadvertently destroy habitat for candidate or federally-listed species. TMDL implementation projects should be screened through the Pennsylvania Natural Diversity Inventory (PNDI) early in their planning process, in accordance with the Department's policy titled Policy for Pennsylvania Natural Diversity Inventory (PNDI) Coordination During Permit Review and Evaluation (Document ID# 400-0200-001). Public Participation Public notice of the draft TMDL was published in the Pennsylvania Bulletin on December 6, 2009 to foster public comment on the allowable loads calculated. A public meeting was held on January.28, 2009 beginning at 10:00 am, at the Pottsville District Mining Office in Pottsville, PA, to discuss the proposed TMDL.
23
Attachment A
Lehigh River Watershed Maps
24
25
26
27
Attachment B
Method for Addressing Section 303(d) Listings for pH
28
Method for Addressing 303(d) Listings for pH There has been a great deal of research conducted on the relationship between alkalinity, acidity, and pH. Research published by the Pa. Department of Environmental Protection demonstrates that by plotting net alkalinity (alkalinity-acidity) vs. pH for 794 mine sample points, the resulting pH value from a sample possessing a net alkalinity of zero is approximately equal to six (Figure 1). Where net alkalinity is positive (greater than or equal to zero), the pH range is most commonly six to eight, which is within the USEPA’s acceptable range of six to nine and meets Pennsylvania water quality criteria in Chapter 93. The pH, a measurement of hydrogen ion acidity presented as a negative logarithm, is not conducive to standard statistics. Additionally, pH does not measure latent acidity. For this reason, and based on the above information, Pennsylvania is using the following approach to address the stream impairments noted on the 303(d) list due to pH. The concentration of acidity in a stream is at least partially chemically dependent upon metals. For this reason, it is extremely difficult to predict the exact pH values, which would result from treatment of abandoned mine drainage. Therefore, net alkalinity will be used to evaluate pH in these TMDL calculations. This methodology assures that the standard for pH will be met because net alkalinity is a measure of the reduction of acidity. When acidity in a stream is neutralized or is restored to natural levels, pH will be acceptable. Therefore, the measured instream alkalinity at the point of evaluation in the stream will serve as the goal for reducing total acidity at that point. The methodology that is applied for alkalinity (and therefore pH) is the same as that used for other parameters such as iron, aluminum, and manganese that have numeric water quality criteria. Each sample point used in the analysis of pH by this method must have measurements for total alkalinity and total acidity. Net alkalinity is alkalinity minus acidity, both being in units of milligrams per liter (mg/l) CaCO3. The same statistical procedures that have been described for use in the evaluation of the metals is applied, using the average value for total alkalinity at that point as the target to specify a reduction in the acid concentration. By maintaining a net alkaline stream, the pH value will be in the range between six and eight. This method negates the need to specifically compute the pH value, which for mine waters is not a true reflection of acidity. This method assures that Pennsylvania’s standard for pH is met when the acid concentration reduction is met. Reference: Rose, Arthur W. and Charles A. Cravotta, III 1998. Geochemistry of Coal Mine Drainage.
Chapter 1 in Coal Mine Drainage Prediction and Pollution Prevention in Pennsylvania. Pa. Dept. of Environmental Protection, Harrisburg, Pa.
29
Figure 1. Net Alkalinity vs. pH. Taken from Figure 1.2 Graph C, pages 1-5, of Coal Mine Drainage Prediction and Pollution Prevention in Pennsylvania
30
Attachment C
TMDLs By Segment
31
Lehigh River The TMDL for Lehigh River consists of load allocations for seven sampling sites along Lehigh River. Lehigh River is listed for metals from AMD as being the cause of the degradation to the stream. The method and rationale for addressing pH is contained in Attachment B. An allowable long-term average in-stream concentration was determined at the points below for aluminum, iron, manganese and acidity. The analysis is designed to produce an average value that, when met, will be protective of the water-quality criterion for that parameter 99% of the time. An analysis was performed using Monte Carlo simulation to determine the necessary long-term average concentration needed to attain water-quality criteria 99% of the time. The simulation was River assuming the data set was lognormally distributed. Using the mean and standard deviation of the data set, 5000 iterations of sampling were completed, and compared against the water-quality criterion for that parameter. For each sampling event a percent reduction was calculated, if necessary, to meet water-quality criteria. A second simulation that multiplied the percent reduction times the sampled value to insure that criteria were met 99% of the time. The mean value from this data set represents the long-term average concentration that needs to be met to achieve water-quality standards. Sampling points L1, L2 L3 and L4 are located within the HQ designated use portion of the Lehigh River. This requires the use of the reference watershed method to determine the values to use in place of the water quality values for aluminum (0.75 mg/l) and iron (1.5 mg/l). Using the alkalinity and the drainage of the area of the Lehigh River in question it was determined that WQN 125 was the one to use. The values used were: aluminum 0.228 mg/l and iron 0.247 mg/l. Since the critical use for manganese is public water supply the criteria for manganese of 1.0 mg/l was used. LR1 Most Upstream Sample Point on Lehigh River The TMDL for this sample point on Lehigh River consists of a load allocation to the segment upstream. The load allocation for this segment was computed using water-quality sample data collected at point LR1. The average calculated by the unit area flow method at the sampling point LR1 (358.79 MGD), is used for these computations. There currently is an entry for this segment on the Pa Section 303(d) list for impairment due to pH. Sample data at point LR1 shows pH ranging between 6.6 and 6.9; pH will be addressed in this TMDL because of the mining impacts. The method and rationale for addressing pH is contained in Attachment B. Allocations were not calculated for aluminum and manganese because WQS were met. TMDLs for aluminum and manganese are not necessary. Although TMDLs are not necessary, the measured loads are considered at the next downstream point LR2.
32
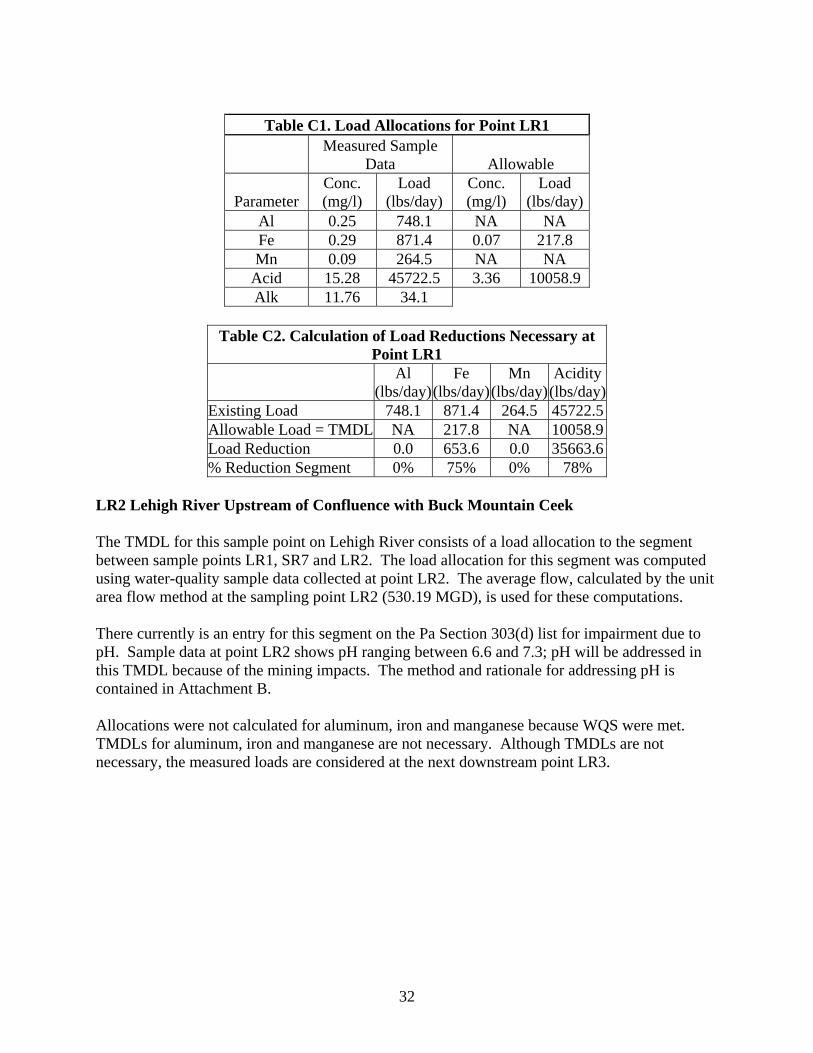
Table C1. Load Allocations for Point LR1
Measured Sample
Data Allowable
Parameter Conc. (mg/l)
Load (lbs/day)
Conc. (mg/l)
Load (lbs/day)
Al 0.25 748.1 NA NA Fe 0.29 871.4 0.07 217.8 Mn 0.09 264.5 NA NA
Acid 15.28 45722.5 3.36 10058.9 Alk 11.76 34.1
Table C2. Calculation of Load Reductions Necessary at
LR2 Lehigh River Upstream of Confluence with Buck Mountain Ceek The TMDL for this sample point on Lehigh River consists of a load allocation to the segment between sample points LR1, SR7 and LR2. The load allocation for this segment was computed using water-quality sample data collected at point LR2. The average flow, calculated by the unit area flow method at the sampling point LR2 (530.19 MGD), is used for these computations. There currently is an entry for this segment on the Pa Section 303(d) list for impairment due to pH. Sample data at point LR2 shows pH ranging between 6.6 and 7.3; pH will be addressed in this TMDL because of the mining impacts. The method and rationale for addressing pH is contained in Attachment B. Allocations were not calculated for aluminum, iron and manganese because WQS were met. TMDLs for aluminum, iron and manganese are not necessary. Although TMDLs are not necessary, the measured loads are considered at the next downstream point LR3.
33
Table C3. Load Allocations for Point LR2
Measured Sample
Data Allowable
Parameter Conc. (mg/l)
Load (lbs/day)
Conc. (mg/l)
Load (lbs/day)
Al 0.25 1105.5 NA NA Fe 0.15 663.3 NA NA Mn 0.09 410.3 0.09 410.3
Acid 9.56 42272.3 2.58 11413.5 Alk 11.24 49700.9
The calculated load reductions for all the loads that enter point LR2 must be accounted for in the calculated reductions at sample point LR2 shown in Table C4. A comparison of measured loads between points LR1, SR7 and LR2 shows that there is no additional loading entering the segment for iron and acidity. For iron and acidity the percent decrease in existing loads are applied to the allowable upstream loads entering the segment. There is additional loading entering the segment for aluminum and manganese. The total segment aluminum and manganese load is the sum of the upstream allocated load and any additional loading within the segment.
Table C4. Calculation of Load Reduction at Point LR2
Al Fe Mn Acidity Existing Load 1105.5 663.3 410.3 42272.3 Difference in Existing Load between LR1, SR7 & LR2 180.5 -230.9 92.5 -7260.3 Load tracked from LR1 &SR7 758.9 240.7 268.4 10326.3 Percent loss due to instream process - 26 - 15 Percent load tracked from LR1 & SR7 - 74 - 85 Total Load tracked from LR1 & SR7 939.4 178.5 360.9 8812.67 Allowable Load at LR2 1105.4 663.3 410.3 11413.5 Load Reduction at LR2 0.0 0.0 0.0 0.0 % Reduction required at LR2 0 0 0 0
LR3 UNT (49536) Lehigh River Upstream of Confluence with Black Creek The TMDL for this sample point on Lehigh River consists of a load allocation to all of the area between sample points LR2, BM7 and LR3. The load allocation for this segment was computed using water-quality sample data collected at point LR3. The average flow, calculated by the unit area flow method at the sampling point LR3 (617.43MGD), is used for these computations. There currently is an entry for this segment on the Pa Section 303(d) list for impairment due to pH. Sample data at point LR03 shows pH ranging between 6.5 and 7.2; pH will be addressed in this TMDL because of the mining impacts. The method and rationale for addressing pH is contained in Attachment B.
34
Allocations were not calculated for aluminum and manganese because WQS were met. TMDLs for aluminum and manganese are not necessary. Although TMDLs are not necessary, the measured loads are considered at the next downstream point LR4.
Table C5. Load Allocations for Point LR3
Measured Sample
Data Allowable
Parameter Conc. (mg/l)
Load (lbs/day)
Conc. (mg/l)
Load (lbs/day)
Al 0.25 1287.3 NA NA Fe 0.19 965.5 0.11 560.0 Mn 0.05 244.6 NA NA
The calculated load reductions for all the loads that enter point LR3 must be accounted for in the calculated reductions at sample point LR3 shown in Table C6. A comparison of measured loads between points LR2, BM7 and LR3 shows that there is no additional loading entering the segment for manganese. For manganese the percent decrease in existing loads are applied to the allowable upstream loads entering the segment. There is additional loading entering the segment for aluminum, iron and acidity. The total segment aluminum, iron and acidity load is the sum of the upstream allocated load and any additional loading within the segment.
Table C6. Calculation of Load Reduction at Point LR3
Al Fe Mn Acidity Existing Load 1287.342 965.5062 244.5949 58187.84 Difference in Existing Load between LR2, BM7 & LR3 126.10 292.41 -187.31 15168.84 Load tracked from LR2 & BM7 1110.02 673.10 410.82 11572.52 Percent loss due to instream process - - 43 - Percent load tracked from LR2 & BM7 - - 57 - Total Load tracked from LR2 & BM7 1236.1 965.5 232.66 26741.4 Allowable Load at LR3 1287.342 559.99 244.5949 14546.96 Load Reduction at LR3 0.0 405.5 0.0 12194.4 % Reduction required at LR3 0 42 0 46
LR4 Lehigh River Upstream of Confluence with Nesquohoning Creek The TMDL for this sample point on Lehigh River consists of a load allocation to all of the area between sample points LR3, BC3 and LR4. The load allocation for this segment was computed using water-quality sample data collected at point LR4. The average flow, calculated by the unit area flow method at the sampling point LR4 (677.05 MGD), is used for these computations. There currently is an entry for this segment on the Pa Section 303(d) list for impairment due to pH. Sample data at point LR4 shows pH ranging between 6.4 and 7.3; pH will be addressed in
35
this TMDL because of the mining impacts. The method and rationale for addressing pH is contained in Attachment B. Allocations were not calculated for aluminum, iron and manganese because WQS were met. TMDLs for aluminum, iron and manganese are not necessary. Although TMDLs are not necessary, the measured loads are considered at the next downstream point LR5.
Table C7. Load Allocations for Point LR4
Measured Sample
Data Allowable
Parameter Conc. (mg/l)
Load (lbs/day)
Conc. (mg/l)
Load (lbs/day)
Al 0.25 1411.7 NA NA Fe 0.15 847.0 NA NA Mn 0.07 378.3 NA NA
Acid 9.64 54433.2 2.02 11431.0 Alk 10.32 58272.9
The calculated load reductions for all the loads that enter point LR4 must be accounted for in the calculated reductions at sample point LR4 shown in Table C8. A comparison of measured loads between points LR3, BC3 and LR4 shows that there is no additional loading entering the segment for aluminum, iron, manganese and acidity. For aluminum, iron, manganese and acidity the percent decrease in existing loads are applied to the allowable upstream loads entering the segment.
Table C8. Calculation of Load Reduction at Point LR4 Al Fe Mn Acidity
Existing Load 1411.65 846.99 378.3 54433.2 Difference in Existing Load between LR3, BC3 & LR4 -652.23 -275.54 -103.49
-14490.16
Load tracked from LR3 & BC3 1504.77 717.01 481.81 15942.58 Percent loss due to instream process 32 25 21 21 Percent load tracked from LR3 & BC3 68 75 79 79 Total Load tracked from LR3 & BC3 1029.23 541.01 378.32 12590.88 Allowable Load at LR4 1411.65 846.99 378.32 11430.97 Load Reduction at LR4 0.0 0.0 0.0 1159.9 % Reduction required at LR4 0 0 0 9
A waste load allocation for future mining was included for this segment of the Lehigh River (LR5) allowing for five operations with two active pits (1500’ x 300’) to be permitted in the future on this segment (page 9 for the method used to quantify treatment pond load).
36
LR5 Lehigh River The TMDL for this sample point on Lehigh River consists of a load allocation to the segment between sample points LR4, NC6 and LR5. The load allocation for this segment was computed using water-quality sample data collected at point LR5. The average flow, measured at the sampling point LR5 (698.82 MGD), is used for these computations. There currently is an entry for this segment on the Pa Section 303(d) list for impairment due to pH. Sample data at point LR5 shows pH ranging between 6.6 and 7.4; pH will be addressed in this TMDL because of the mining impacts. The method and rationale for addressing pH is contained in Attachment B. Allocations were not calculated for aluminum, iron and manganese because WQS were met. TMDLs for aluminum, iron and manganese are not necessary. Although TMDLs are not necessary, the measured loads are considered at the next downstream point LR8.
Table C10. Load Allocations for Point LR5
Measured Sample
Data Allowable
Parameter Conc. (mg/l)
Load (lbs/day)
Conc. (mg/l)
Load (lbs/day)
Al 0.25 1457.0 NA NA Fe 0.15 874.2 NA NA Mn 0.08 461.9 NA NA
Acid 5.60 32637.6 2.74 15992.4 Alk 15.28 89054.0
The calculated load reductions for all the loads that enter point LR5 must be accounted for in the calculated reductions at sample point LR5 shown in Table C11. A comparison of measured loads between points LR4, NC6 and LR5 shows that there is no additional loading entering the segment for aluminum, iron, manganese and acidity. For aluminum, iron, manganese and acidity the percent decrease in existing loads are applied to the allowable upstream loads entering the segment.
Table C9. Waste Load Allocations for future mining operations
Average Flow
Allowable Load
Parameter Monthly Avg. Allowable
Conc. (mg/L) (MGD) (lbs/day) Future
Operation 1
Al 0.75 0.090 0.56 Fe 3.0 0.090 2.25 Mn 2.0 0.090 1.50
Future Operation 2
Al 0.75 0.090 0.56 Fe 3.0 0.090 2.25 Mn 2.0 0.090 1.50
Future Operation 3
Al 0.75 0.090 0.56 Fe 3.0 0.090 2.25 Mn 2.0 0.090 1.50
Future Operation 4
Al 0.75 0.090 0.56 Fe 3.0 0.090 2.25 Mn 2.0 0.090 1.50
Future Operation 5
Al 0.75 0.090 0.56 Fe 3.0 0.090 2.25 Mn 2.0 0.090 1.50
37
Table C11. Calculation of Load Reduction at Point LR5
Al Fe Mn Acidity Existing Load 1457.0 874.2 461.9 32637.6 Difference in Existing Load between LR4, NC6 & LR5 -53.5 -324.2 -122.6 -25574.1 Load tracked from LR4 & NC6 1510.6 959.5 467.0 12111.1 Percent loss due to instream process 4 27 21 44 Percent load tracked from LR4 & NC6 96 73 79 56 Total Load tracked from LR4 & NC6 1457.0 699.9 369.0 6790.32 Allowable Load at LR5 1457.0 874.2 461.98 15992.41 Load Reduction at LR5 0.0 0.0 0.0 0.0 % Reduction required at LR5 0 0 0 0
A waste load allocation for future mining was included for this segment of the Aquashicola Creek (LR7) allowing for five operations with two active pits (1500’ x 300’) to be permitted in the future on this segment (page 9 for the method used to quantify treatment pond load). LR7 Mouth of Aquashicola Creek Upstream of Confluence with Lehigh River The TMDL for this sample point on Aquashicola Creek consists of a load allocation to the segment upstream. The load allocation for this segment was computed using water-quality sample data collected at point LR7. The average calculated by the unit area flow method at the sampling point LR7 (82.50 MGD), is used for these computations. There currently is an entry for this segment on the Pa Section 303(d) list for impairment due to pH. Sample data at point LR7 shows pH ranging between 7.4 and 8.0; pH will be addressed in this TMDL because of the mining impacts. The method and rationale for addressing pH is contained in Attachment B. Allocations were not calculated for aluminum, iron, manganese and acidity because WQS were met and there was no acidity present. TMDLs for aluminum, manganese and acidity are not necessary. Although TMDLs are not necessary, the measured loads are considered at the next downstream point LR8.
Table C12. Waste Load Allocations for future mining operations
Average Flow
Allowable Load
Parameter Monthly Avg. Allowable
Conc. (mg/L) (MGD) (lbs/day) Future
Operation 1
Al 0.75 0.090 0.56 Fe 3.0 0.090 2.25 Mn 2.0 0.090 1.50
Future Operation 2
Al 0.75 0.090 0.56 Fe 3.0 0.090 2.25 Mn 2.0 0.090 1.50
Future Operation 3
Al 0.75 0.090 0.56 Fe 3.0 0.090 2.25 Mn 2.0 0.090 1.50
Future Operation 4
Al 0.75 0.090 0.56 Fe 3.0 0.090 2.25 Mn 2.0 0.090 1.50
Future Operation 5
Al 0.75 0.090 0.56 Fe 3.0 0.090 2.25 Mn 2.0 0.090 1.50
38
Table C13 Load Allocations for Point LR7
Measured Sample
Data Allowable
Parameter Conc. (mg/l)
Load (lbs/day)
Conc. (mg/l)
Load (lbs/day)
Al 0.25 172.0 NA NA Fe 0.15 103.2 NA NA Mn 0.07 49.9 NA NA
Acid 0.00 0.0 NA NA Alk 47.12 32422.2
Table C14. Calculation of Load Reductions Necessary at
Point LR7
Al
(lbs/day)Fe
(lbs/day)Mn
(lbs/day)Acidity
(lbs/day) Existing Load 172.0 103.2 49.9 0.0 Allowable Load = TMDL NA NA NA NA Load Reduction 0.0 0.0 0.0 0.0 % Reduction Segment 0% 0% 0% 0%
A waste load allocation for future mining was included for this segment of the Lehigh River (LR8) allowing for five operations with two active pits (1500’ x 300’) to be permitted in the future on this segment (page 9 for the method used to quantify treatment pond load).
39
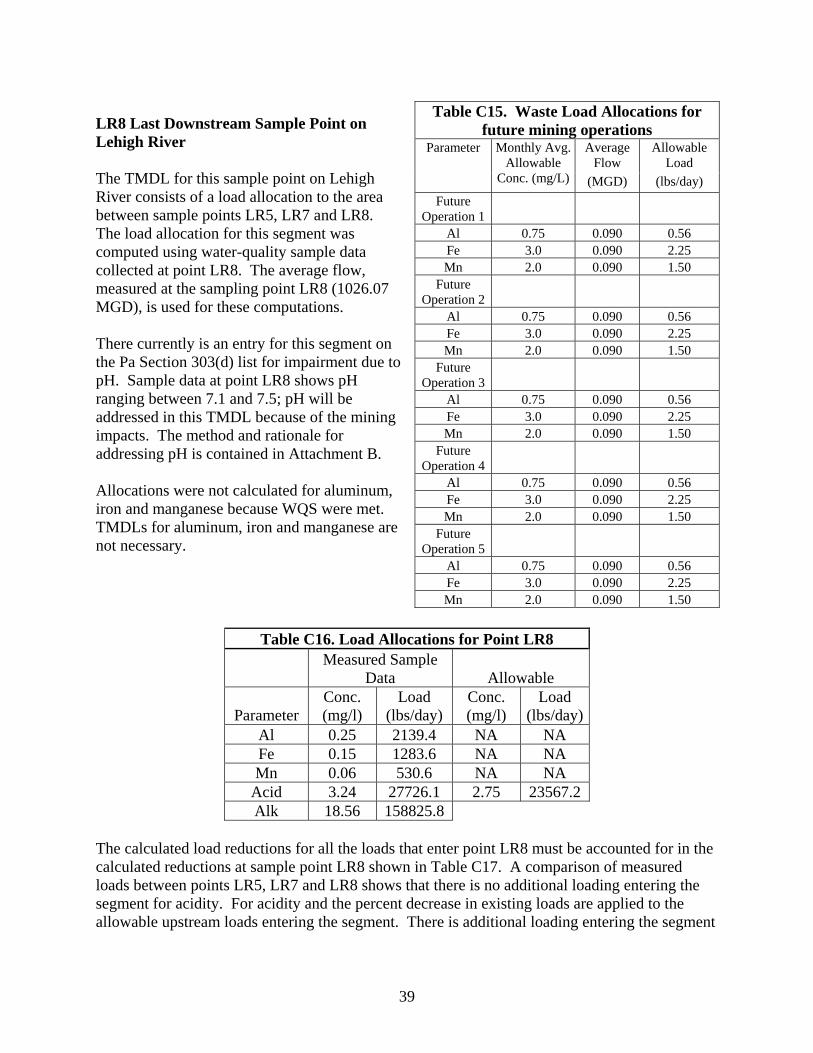
LR8 Last Downstream Sample Point on Lehigh River The TMDL for this sample point on Lehigh River consists of a load allocation to the area between sample points LR5, LR7 and LR8. The load allocation for this segment was computed using water-quality sample data collected at point LR8. The average flow, measured at the sampling point LR8 (1026.07 MGD), is used for these computations. There currently is an entry for this segment on the Pa Section 303(d) list for impairment due to pH. Sample data at point LR8 shows pH ranging between 7.1 and 7.5; pH will be addressed in this TMDL because of the mining impacts. The method and rationale for addressing pH is contained in Attachment B. Allocations were not calculated for aluminum, iron and manganese because WQS were met. TMDLs for aluminum, iron and manganese are not necessary.
Table C16. Load Allocations for Point LR8
Measured Sample
Data Allowable
Parameter Conc. (mg/l)
Load (lbs/day)
Conc. (mg/l)
Load (lbs/day)
Al 0.25 2139.4 NA NA Fe 0.15 1283.6 NA NA Mn 0.06 530.6 NA NA
Acid 3.24 27726.1 2.75 23567.2 Alk 18.56 158825.8
The calculated load reductions for all the loads that enter point LR8 must be accounted for in the calculated reductions at sample point LR8 shown in Table C17. A comparison of measured loads between points LR5, LR7 and LR8 shows that there is no additional loading entering the segment for acidity. For acidity and the percent decrease in existing loads are applied to the allowable upstream loads entering the segment. There is additional loading entering the segment
Table C15. Waste Load Allocations for future mining operations
Average Flow
Allowable Load
Parameter Monthly Avg. Allowable
Conc. (mg/L) (MGD) (lbs/day) Future
Operation 1
Al 0.75 0.090 0.56 Fe 3.0 0.090 2.25 Mn 2.0 0.090 1.50
Future Operation 2
Al 0.75 0.090 0.56 Fe 3.0 0.090 2.25 Mn 2.0 0.090 1.50
Future Operation 3
Al 0.75 0.090 0.56 Fe 3.0 0.090 2.25 Mn 2.0 0.090 1.50
Future Operation 4
Al 0.75 0.090 0.56 Fe 3.0 0.090 2.25 Mn 2.0 0.090 1.50
Future Operation 5
Al 0.75 0.090 0.56 Fe 3.0 0.090 2.25 Mn 2.0 0.090 1.50
40
for aluminum iron, and manganese. The total segment aluminum, iron manganese load is the sum of the upstream allocated load and any additional loading within the segment.
Table C17. Calculation of Load Reduction at Point LR8
Al Fe Mn Acidity Existing Load 2139.4 1283.6 530.6 27726.1 Difference in Existing Load between LR5, LR7 & LR8 510.3 306.2 18.7 -4911.5 Load tracked from LR5 & LR7 1629.1 977.4 511.8 15992.4 Percent loss due to instream process - - - 15 Percent load tracked from LR5 & LR7 - - - 85 Total Load tracked from LR5 & LR7 2139.4 1283.6 530.6 13585.8 Allowable Load at LR8 2139.4 1283.6 530.6 23567.2 Load Reduction at LR8 0.0 0.0 0.0 0.0 % Reduction required at LR8 0 0 0 0
Margin of Safety (MOS) PADEP used an implicit MOS in these TMDLs derived from the Monte Carlo statistical analysis. The Water-Quality standard states that water-quality criteria must be met at least 99% of the time. All of the @Risk analyses results surpass the minimum 99% level of protection. Another margin of safety used for this TMDL analysis results from: • Effluent variability plays a major role in determining the average value that will meet water-
quality criteria over the long-term. The value that provides this variability in our analysis is the standard deviation of the dataset. The simulation results are based on this variability and the existing stream conditions (an uncontrolled system). The general assumption can be made that a controlled system (one that is controlling and stabilizing the pollution load) would be less variable than an uncontrolled system. This implicitly builds in a margin of safety.
• A MOS is added when the calculations were performed with a daily iron average instead of
the 30-day average. Seasonal Variation Seasonal variation is implicitly accounted for in these TMDLs because the data used represent all seasons. Critical Conditions The reductions specified in this TMDL apply at all flow conditions. A critical flow condition could not be identified from the data used for this analysis.
41
Attachment D Use of reference stream for High Quality waters
42
Streams placed on the 1996 303(d) list with a designated use of High Quality (HQ) will be subject to Pennsylvania’s anti degradation policy. Therefore, DEP must establish instream goals for TMDLs that restore the waterbody to existing (pre-mining) quality. This is accomplished by sampling an unaffected stretch of stream to use as a reference. This stretch typically is the headwaters segment of the High Quality stream question. If an unaffected stretch isn’t available, a nearby unimpaired stream will function as a surrogate. The reference stream data will be selected from statewide ambient Water Quality Network (WQN) stations. To determine which WQN station represents existing water quality appropriate for use in developing TMDLs for HQ waters, alkalinity and drainage area are considered.
1. First step is to match alkalinities of TMDL stream and WQN reference stream. If alkalinities for candidate stream are not available, use ph as a surrogate. As a last resort, if neither pH or alkalinity are not available match geologies using current geological maps.
2. The second consideration is drainage area. 3. Finally, from the subset of stations with similar alkalinity and drainage area select the
station nearest the TMDL stream. Once a reference stream is selected, the 95th percentile confidence limit on the median for aluminum, iron and manganese is used as the applicable water quality criteria needed for the @Risk model.
43
Attachment E
Excerpts Justifying Changes Between the 1996, 1998, and 2002 Section 303(d) Lists and Integrated Report/List (2004, 2006)
44
The following are excerpts from the Pennsylvania DEP Section 303(d) narratives that justify changes in listings between the 1996, 1998, 2002, 2004 and 2006 303(d) Lists and Integrated Report/List (2006). The Section 303(d) listing process has undergone an evolution in Pennsylvania since the development of the 1996 list. In the 1996 Section 303(d) narrative, strategies were outlined for changes to the listing process. Suggestions included, but were not limited to, a migration to a Global Information System (GIS), improved monitoring and assessment, and greater public input. The migration to a GIS was implemented prior to the development of the 1998 Section 303(d) list. As a result of additional sampling and the migration to the GIS some of the information appearing on the 1996 list differed from the 1998 list. Most common changes included:
1. mileage differences due to recalculation of segment length by the GIS; 2. slight changes in source(s)/cause(s) due to new EPA codes; 3. changes to source(s)/cause(s), and/or miles due to revised assessments; 4. corrections of misnamed streams or streams placed in inappropriate SWP subbasins;
and 5. unnamed tributaries no longer identified as such and placed under the named
watershed listing. Prior to 1998, segment lengths were computed using a map wheel and calculator. The segment lengths listed on the 1998 Section 303(d) list were calculated automatically by the GIS (ArcInfo) using a constant projection and map units (meters) for each watershed. Segment lengths originally calculated by using a map wheel and those calculated by the GIS did not always match closely. This was the case even when physical identifiers (e.g., tributary confluence and road crossings) matching the original segment descriptions were used to define segments on digital quad maps. This occurred to some extent with all segments, but was most noticeable in segments with the greatest potential for human errors using a map wheel for calculating the original segment lengths (e.g., long stream segments or entire basins).
Migration to National Hydrography Data (NHD)
New to the 2006 report is use of the 1/24,000 National Hydrography Data (NHD) streams GIS layer. Up until 2006 the Department relied upon its own internally developed stream layer. Subsequently, the United States Geologic Survey (USGS) developed 1/24,000 NHD streams layer for the Commonwealth based upon national geodatabase standards. In 2005, DEP contracted with USGS to add missing streams and correct any errors in the NHD. A GIS contractor transferred the old DEP stream assessment information to the improved NHD and the old DEP streams layer was archived. Overall, this marked an improvement in the quality of the streams layer and made the stream assessment data compatible with national standards but it necessitated a change in the Integrated Listing format. The NHD is not attributed with the old DEP five digit stream codes so segments can no longer be listed by stream code but rather only by stream name or a fixed combination of NHD fields known as reachcode and ComID. The NHD is aggregated by Hydrologic Unit Code (HUC) watersheds so HUCs rather than the old State Water Plan (SWP) watersheds are now used to group streams together. The map in
45
Appendix E illustrates the relationship between the old SWP and new HUC watershed delineations. A more basic change was the shift in data management philosophy from one of “dynamic segmentation” to “fixed segments”. The dynamic segmentation records were proving too difficult to mange from an historical tracking perspective. The fixed segment methods will remedy that problem. The stream assessment data management has gone through many changes over the years as system requirements and software changed. It is hoped that with the shift to the NHD and OIT’s (Office of Information Technology) fulltime staff to manage and maintain SLIMS the systems and formats will now remain stable over many Integrated Listing cycles.
46
Attachment F Water Quality Data Used In TMDL Calculations
AVG 712,549 7.22 18.6 3.2 0.15 0.06 0.25 LR8 St Dev 4.7 0.00 0.02 0.00
50
Attachment G TMDLs and NPDES Permitting Coordination
51
NPDES permitting is unavoidably linked to TMDLs through waste load allocations and their translation, through the permitting program, to effluent limits. Primary responsibility for NPDES permitting rests with the District Mining Offices (for mining NPDES permits) and the Regional Offices (for industrial NPDES permits). Therefore, the DMOs and Regions will maintain tracking mechanisms of available waste load allocations, etc. in their respective offices. The TMDL program will assist in this effort. However, the primary role of the of the TMDL program is TMDL development and revision/amendment (the necessity for which is as defined in the Future Modifications section) at the request of the respective office. All efforts will be made to coordinate public notice periods for TMDL revisions and permit renewals/reissuances. Load Tracking Mechanisms The Department has developed tracking mechanisms that will allow for accounting of pollution loads in TMDL watersheds. This will allow permit writers to have information on how allocations have been distributed throughout the watershed in the watershed of interest while making permitting decisions. These tracking mechanisms will allow the Department to make minor changes in WLAs without the need for EPA to review and approve a revised TMDL. Tracking will also allow for the evaluation of loads at downstream points throughout a watershed to ensure no downstream impairments will result from the addition, modification or movement of a permit. Options for Permittees in TMDL Watersheds The Department is working to develop options for mining permits in watersheds with approved TMDLs.
Options identified
• Build excess WLA into the TMDL for anticipated future mining. This could then be used for a new permit. Permittee must show that there has been actual load reduction in the amount of the proposed permit or must include a schedule to guarantee the reductions using current data referenced to the TMDL prior to permit issuance.
• Use WLA that is freed up from another permit in the watershed when that site is reclaimed. If no permits have been recently reclaimed, it may be necessary to delay permit issuance until additional WLA becomes available.
• Re-allocate the WLA(s) of existing permits. WLAs could be reallocated based on actual flows (as opposed to design flows) or smaller than approved pit/spoil areas (as opposed to default areas). The "freed-up" WLA could be applied to the new permit. This option would require the simultaneous amendment of the permits involved in the reallocation.
• Non-discharge alternative. Other possible options
The following two options have also been identified for use in TMDL watersheds. However, before recommendation for use as viable implementation options, a thorough regulatory (both state and federal) review must be completed. These options should not be implemented until the
52
completion of the regulatory review and development of any applicable administrative mechanisms.
• Issue the permit with in-stream water quality criteria values as the effluent limits. The in-
stream criteria value would represent the monthly average, with the other limits adjusted accordingly (e.g., for Fe, the limits would be 1.5 mg/L monthly average, 3.0 mg/L daily average and 4.0 instantaneous max mg/L).
• The applicant would agree to treat an existing source (point or non-point) where there is
no responsible party and receive a WLA based on a portion of the load reduction to be achieved. The result of using these types of offsets in permitting is a net improvement in long-term water quality through the reclamation or treatment of an abandoned source.