33
1 rstuhl für Informatik 2 Gabriella Kókai: Maschine Learning Evaluating Hypotheses
| Date post: | 22-Dec-2015 |
| Category: |
Documents |
| View: | 214 times |
| Download: | 2 times |
1Lehrstuhl für Informatik 2
Gabriella Kókai: Maschine Learning
Evaluating Hypotheses

2Lehrstuhl für Informatik 2
Gabriella Kókai: Maschine Learning
Context
➔ Motivation Estimating Hypothesis Accuracy Basics of Sampling Theory Difference in Error of Two Hypotheses Comparing Learning Algorithms Summary

3Lehrstuhl für Informatik 2
Gabriella Kókai: Maschine Learning
Motivation
Goal: Introduction to statistical methods for estimating hypothesis accuracy, focusing on the followings: Given the observed accuracy of a hypothesis over a limited sample
of data, how well does this estimate its accuracy over additional examples?
Given that one hypothesis outperforms another over some sample of data, how probable is it that this hypothesis is more accurate in general?
When data is limited what is the best way to use this data to both learn a hypothesis and estimate its accuracy?

4Lehrstuhl für Informatik 2
Gabriella Kókai: Maschine Learning
Motivation 2
It is important to evaluate the performance of the learned hypotheses as precisely as possible: To understand whether to use the hypothesis
Example: Learning from limited-size database indicating the effectiveness of different medical treatments
Evaluating hypotheses is an integral component of many learning methods Example: in post-pruning decision trees to avoid overfiting
Methods for comparing the accuracy of two hypotheses Methods for comparing two learning algorithms when only limited
data is available

5Lehrstuhl für Informatik 2
Gabriella Kókai: Maschine Learning
Motivation 3
Estimating the accuracy of hypothesis is relatively straightforward when data is plentiful.
Given only a limited set of data, two key difficulties arise: Bias in the estimate:
Observed accuracy of the learned hypothesis over the training examples is often a poor estimator of its accuracy over future examples.
To obtain an unbiased estimate of future accuracy, we typically test the hypothesis on some set of test examples chosen independently of training examples and the hypothesis.
Variance in the estimate: The measured accuracy can still vary from the true accuracy, depending
on the makeup of the particular set of test examples.

6Lehrstuhl für Informatik 2
Gabriella Kókai: Maschine Learning
Context
Motivation➔ Estimating Hypothesis Accuracy
Sample Error and True Error Basics of Sampling Theory Difference in Error of Two Hypotheses Comparing Learning Algorithms Summary

7Lehrstuhl für Informatik 2
Gabriella Kókai: Maschine Learning
Estimating Hypothesis Accuracy Setting:
Some set of possible instances X over which various target functions may be defined
Different instances in X may be encountered with different frequencies: Unknown the probability distribution D that defines the probability of
encountering each instance in X D says nothing about whether x is a positive or a negative example
Learning task: Learn target concept or target function f by considering a space H of possible hypotheses Training examples are provided to the learner by a trainer
who gives each instance independently according to the distribution D, then forwards the instance x along with its correct target value f(x) to the learner
8Lehrstuhl für Informatik 2
Gabriella Kókai: Maschine Learning
Sample Error and True Error
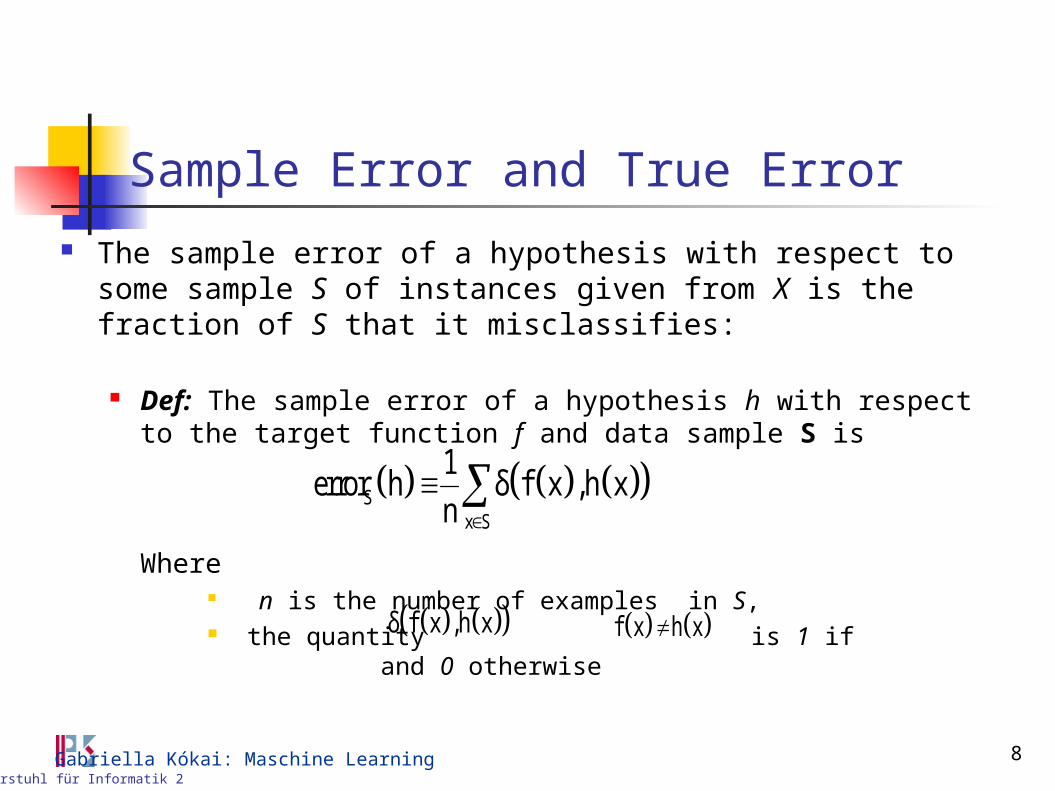
The sample error of a hypothesis with respect to some sample S of instances given from X is the fraction of S that it misclassifies:
Def: The sample error of a hypothesis h with respect to the target function f and data sample S is
Where n is the number of examples in S, the quantity is 1 if and 0 otherwise f x h x δ f x ,h x
Sx S
1error h δ f x ,h x
n

9Lehrstuhl für Informatik 2
Gabriella Kókai: Maschine Learning
Sample Error and True Error 2 The true error of a hypothesis is the probability that it will
misclassify a single randomly given instance from the distribution D. Def: The true error of hypothesis h with respect to target function f and
distribution D, is the probability that h will misclassify an instance drawn at random according to D
Here the notation denotes that the probability is taken over the instance distribution D.
To wish to know is the true error . Main question: How good is an estimate of provided
by ?
D x Derror h Pr f x h x
x DPr
Derror h Derror h
Serror h

10Lehrstuhl für Informatik 2
Gabriella Kókai: Maschine Learning
Context Motivation Estimating Hypothesis Accuracy➔ Basics of Sampling Theory
Error Estimation and Estimating Binomial Proportions The Binomial Distribution Mean and Variance Confidence Intervals Two-Sided and One-Sided Bounds
Difference in Error of Two Hypotheses Comparing Learning Algorithms Summary

11Lehrstuhl für Informatik 2
Gabriella Kókai: Maschine Learning
Basics of Sampling Theory Question: How does the derivation between sample error and true error
depend on the size of the data sample? Equal with the statistical problem: The problem of estimating the
proportion of a population that exhibits some property, given the observed proportion over some random sample of the population .
Here: The property of interest is that h misclassifies the example Answer:
When measuring the sample error we are performing an experiment with a random outcome.
Repeating this experiment many times, each time drawing a different random sample set of size n, we would expect to observe different values for the various depending on random differences in the makeup of the various
In such cases the outcome of the ith such experiment is arandom variable
Sierror h
iS
iS Sierror h
12Lehrstuhl für Informatik 2
Gabriella Kókai: Maschine Learning
Error Estimation and Estimating Binomial Proportions 2
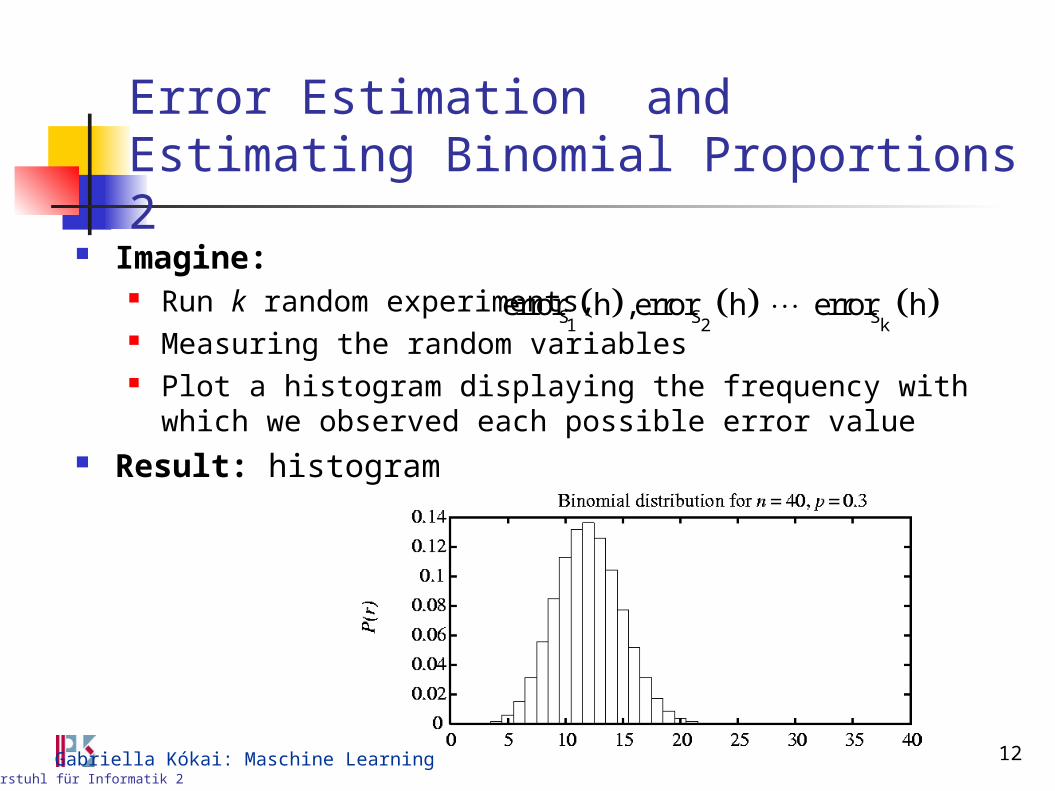
Imagine: Run k random experiments, Measuring the random variables Plot a histogram displaying the frequency with which we observed
each possible error value Result: histogram
S S S1 2 kerror h ,error h error h

13Lehrstuhl für Informatik 2
Gabriella Kókai: Maschine Learning
The Binomial Distribution General setting to which the Binomial distribution applies:
There is a base or underlying experiment whose outcome can be described by a random variable, say Y. It can take on two possible values.
The probability that Y=1 on any single trial of the underlying experiment is given by some constant p, independent of the outcome of any other experiment.The probability that Y=0 is therefore 1-p.Typically, p is not known in advance, and the problem is to estimate it.
A series of n independent trials of the underlying experiment is performed, producing the sequence of independent, identically distributed random variables .Let R denote the number of trials for which in this series of n experiments
The probability that R will take on a specific value r is given by the Binomial distribution:
1, 2 kY Y Y
iY = 1n
ii=1
R Y
n rrn!Pr R = r = p 1 p
r! n r !

14Lehrstuhl für Informatik 2
Gabriella Kókai: Maschine Learning
Mean and Variance Def: Consider The expected value of Y, E[Y], is
Example: If Y takes on the value 1 with probability 0.7 and the value 2 with probability 0.3 then its expected value is
In case of a random variable Y governed by a Binomial distribution the expected value is:
1 2 nY = y , y , y
n
ii=1
E Y Pr Y = y
1 0.7 + 2 0.3 = 1.3
E Y = n p

15Lehrstuhl für Informatik 2
Gabriella Kókai: Maschine Learning
Mean and Variance 2
Variance captures the „width“ or „spread“ of the probability distribution; that is it captures how far the random variable is expected to vary from its mean value
Def: The variance of Y, Var[Y], is
The square root of the variance is called the standard deviation of Y, denoted by
Def: The standard deviation of a random variable Y, is
In case of a random variable Y governed by Binomial distribution the variance and the standard deviation are defined as follows:
2Var Y E Y E Y
Yσ
2Yσ E Y E Y
Yσ
Var Y = n p 1 p
Yσ = n p 1 p

16Lehrstuhl für Informatik 2
Gabriella Kókai: Maschine Learning
Confidence Intervals
Describe: Give an interval within which the true value is expected to fall, along
with the probability with which it is expected to fall into this interval Def: An N% confidence interval for some parameters p is an interval
that is expected with probability N% to contain p. How confidence intervals for can be derived:
Binomial probability distribution governing the estimator The mean value of distribution is Standard deviation is
Goal: Derive a 95% confidence interval => find the interval centered around the mean value ,which is wide enough to contain 95% of total probability under this distribution
Derror h Serror h
Derror h
S S
errorS
error h 1 error hσ
h n
Derror h

17Lehrstuhl für Informatik 2
Gabriella Kókai: Maschine Learning
Confidence Intervals 2
Question: How can the size of interval that contains N% of the probability mass be found for given N ?
Problem: Unfortunately for the Binomial distribution this calculation can be quite tedious.
But: Binomial distribution can be closely approximated by Normal distribution

18Lehrstuhl für Informatik 2
Gabriella Kókai: Maschine Learning
Confidence Intervals 3
Normal or gaussian distribution is a bell-shaped distribution defined by the probability density function
If the random variable X follows a normal distribution then: The probability that X will fall into the interval (a,b) is given by
The expected, or mean value of X, E[X], is
The variance of X, Var(X) is
The standard deviation of X,
2
2
x μ1σ1 2
p x = e2πσ
Xσ = σ
2Var X = σ
E X = μ
p X dx
19Lehrstuhl für Informatik 2
Gabriella Kókai: Maschine Learning
Two-Sided and One-Sided Bounds
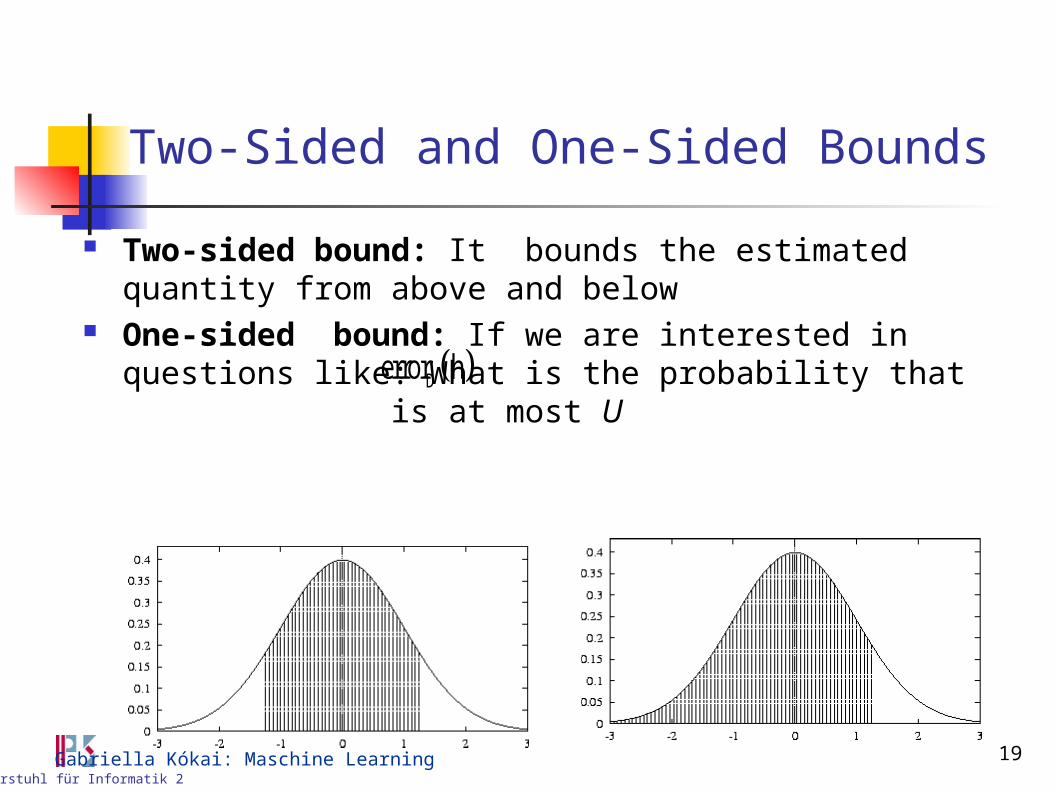
Two-sided bound: It bounds the estimated quantity from above and below
One-sided bound: If we are interested in questions like: What is the probability that is at most U Derror h

20Lehrstuhl für Informatik 2
Gabriella Kókai: Maschine Learning
Two-Sided and One-Sided Bounds 2 If the sample error is considered as normal distributed indicating
that: the couches with N% probability in the interval
where is a constant
Derror h
S SS n
error h 1 error herror h ± z
n
zN
Confidence level N% 50,00% 68,00% 80,00% 90,00% 95,00% 98,00%
Constant 0,67 1 1,28 1,64 1,96 2,33Table 1: Values of for two sided N% confidence intervalszN

21Lehrstuhl für Informatik 2
Gabriella Kókai: Maschine Learning
Two-Sided and One-Sided Bounds 3
Example: n =50 Hypothesis h makes r =16 errors => Using the values from Table 1
With 99% probability is in the interval
If the numbers of errors is 12 then is in the interval with 50% probability
S
16error h = = 0.32
50
Derror h
0.32 0.680.32 ± 2.58 0.32 ± 0.17
50
Derror h
0.24 0.760.24 ± 0.67 0.24 ± 0.04
50
22Lehrstuhl für Informatik 2
Gabriella Kókai: Maschine Learning
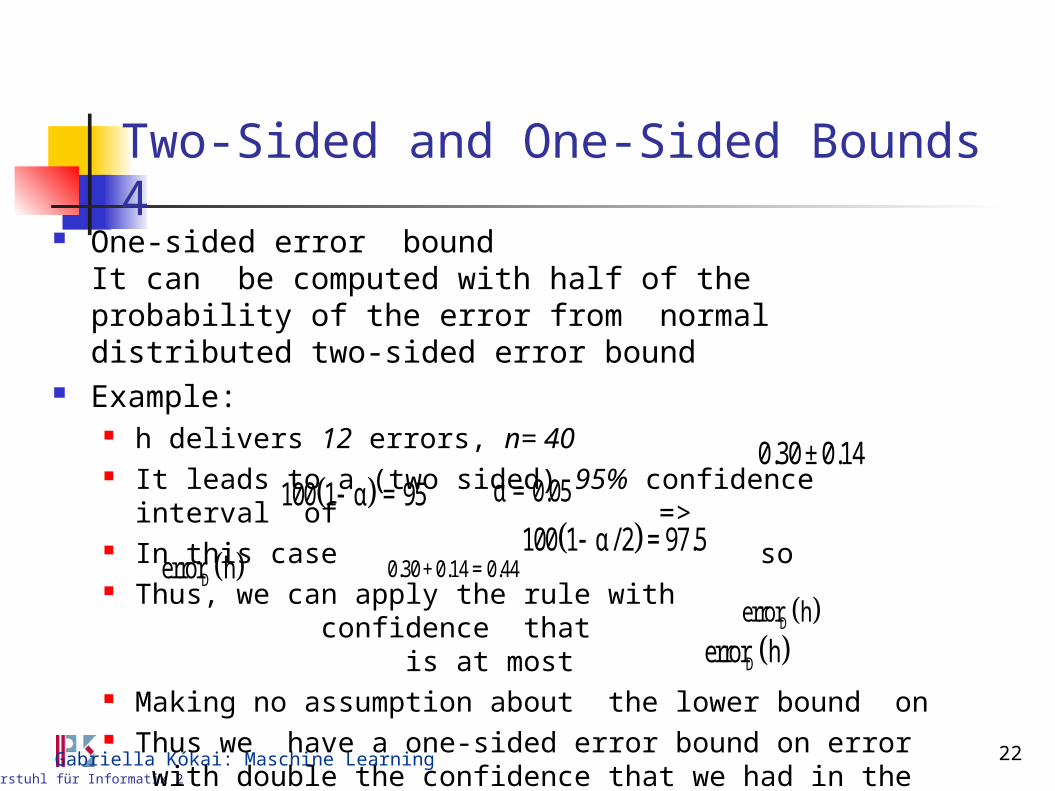
Two-Sided and One-Sided Bounds 4 One-sided error bound
It can be computed with half of the probability of the error from normal distributed two-sided error bound
Example: h delivers 12 errors, n= 40 It leads to a (two sided) 95% confidence interval of => In this case so Thus, we can apply the rule with confidence that
is at most Making no assumption about the lower bound on Thus we have a one-sided error bound on error
with double the confidence that we had in the corresponding two-sided bound
0.30 ± 0.14
100 1 α / 2 = 97.5
Derror h
0.30 + 0.14 = 0.44
100 1 α = 95 α = 0.05
Derror h
Derror h

23Lehrstuhl für Informatik 2
Gabriella Kókai: Maschine Learning
Context
Motivation Estimating Hypothesis Accuracy Basics of Sampling Theory➔ Difference in Error of Two Hypotheses
Hypothesis Testing Comparing Learning Algorithms Summary

24Lehrstuhl für Informatik 2
Gabriella Kókai: Maschine Learning
Difference in Errors of Two Hypotheses
Consider: two hypotheses and for some discrete-valued target function has been tested on a sample containing randomly drawn
examples has been tested on a sample containing randomly
drawn examples Suppose we wish to estimate the difference d between the true
errors of these two hypotheses
4-step procedure to derive confidence interval estimates for d Choose the estimator We do not prove but it can be shown that gives an unbiased
estimate of d; that is
h1
2h
1h
2S
1n1S
2n
D 1 D 2d error h error h
S 1 S 21 2d̂ error h error h
d̂
h2
ˆE d = d

25Lehrstuhl für Informatik 2
Gabriella Kókai: Maschine Learning
Hypothesis Testing Question: What is the probability distribution governing the
random variable ? Answer:
both errors and follow a distribution that is approximately normal
Difference of two normal distributions is also normal => is also approximately normal
The variance of this distribution is the sum of the variances of and
We have
For random variable obeying a normal distribution with mean d and variance the N% confidence interval estimate for d is
d̂
1 2n ,n 30 S 11error h S 22
error h
d
S 11error h S 22
error h
S 1 S 1 S 2 S 22 1 1 2 2
d̂1 2
error h 1 error h error h 1 error hσ +
n n
d̂2σ
Nd̂ ± z σ

26Lehrstuhl für Informatik 2
Gabriella Kókai: Maschine Learning
Hypothesis Testing 2
So
is the same constant as described in Table 1 Test over same data
and are tested on a single sample S (where S is still independent of and )
Redefine :
The variance in this new will usually be smaller than the variance of the original
Using a single sample S eliminates the variance due to random differences in the compositions of and
S 1 S 1 S 2 S 21 1 2 2N
1 2
error h 1 error h error h 1 error hd̂ ±z +
n n
Nz
1h 2hh1 h2
d̂
d̂
1S 2S
S 1 S 2d̂ error h error h
d̂

27Lehrstuhl für Informatik 2
Gabriella Kókai: Maschine Learning
Context Motivation Estimating Hypothesis Accuracy Basics of Sampling Theory Difference in Error of Two Hypotheses➔ Comparing Learning Algorithms Summary

28Lehrstuhl für Informatik 2
Gabriella Kókai: Maschine Learning
Comparing Learning Algorithms
Goal: Comparing the performance of two learning algorithm and Question:
What is an appropriate test for comparing learning algorithms? How can we determine whether an observed difference between the
algorithms is statistically significant? Active debate within the machine-learning research community regarding
the best method for comparison Task: Determine which of and is the better learning method on
average for learning some particular target function f „On average“ is to consider the relative performance of these two algorithms
averaged over all the training set of size n that might be drawn from the underlying instance distribution D
L A LB
AL BL
S D D A D BE error L S error L S

29Lehrstuhl für Informatik 2
Gabriella Kókai: Maschine Learning
Comparing Learning Algorithms 2
In practice: We have only a limited sample Divide into a training set and a disjoint test set The training data can be used to train both and Test set can be used to compare the accuracy of the two learned hypothesis
Improvement: Partition the available data into k disjoint subsets of equal size, where
this size is at least 30 For i from 1 to k, do use for the test and the remaining data for training set
Return the value , where
0D0D
0S 0T
AL BL
T A 0 T B 00 0error L S error L S
T i iS
D0 1 2 kT ,T , ,T
i 0 iS D T A A ih L S B B ih L S i T A T Bi i
δ error h error h δ
k
ii 1
ii=1k
1δ
k
δ1k
30Lehrstuhl für Informatik 2
Gabriella Kókai: Maschine Learning
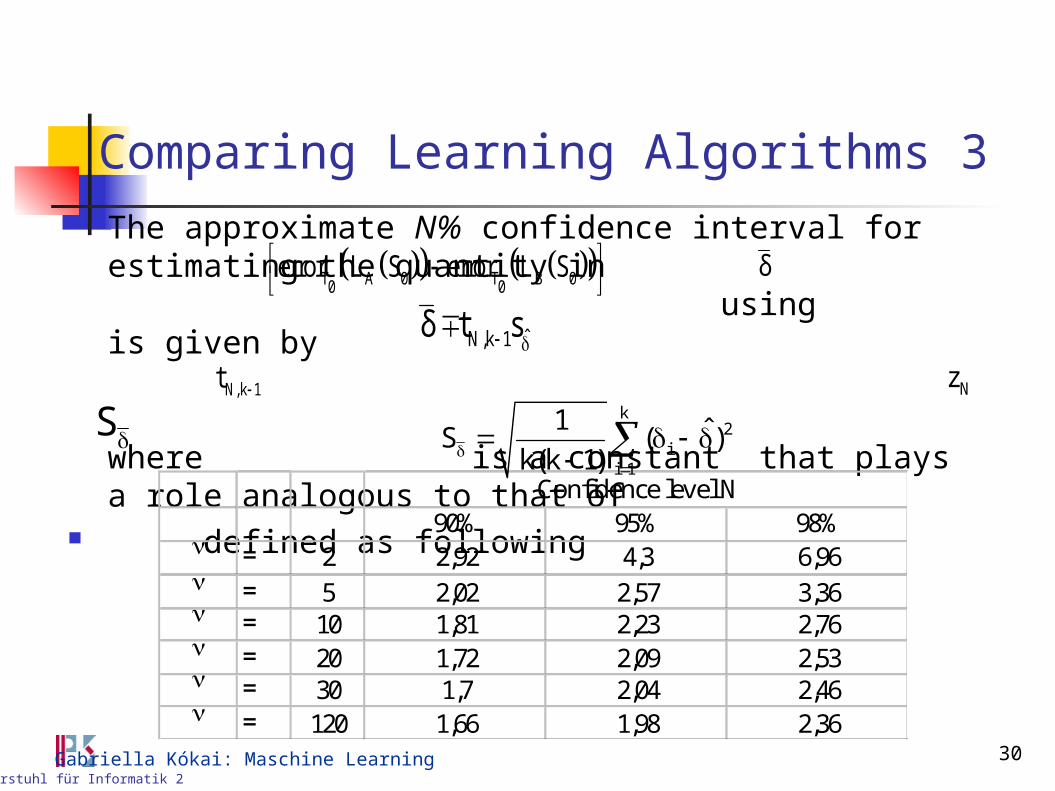
Comparing Learning Algorithms 3 The approximate N% confidence interval for estimating the
quantity in using is given by
where is a constant that plays a role analogous to that of defined as following
T A 0 T B 00 0error L S error L S δ
ˆN,k 1
1Nδ,k
δ t s
st
N,k 1t Nz
Confidence level N90% 95% 98%
= 2 2,92 4,3 6,96 = 5 2,02 2,57 3,36 = 10 1,81 2,23 2,76 = 20 1,72 2,09 2,53 = 30 1,7 2,04 2,46 = 120 1,66 1,98 2,36
k2
ii 1
1 ˆS ( )k(k 1)
S

31Lehrstuhl für Informatik 2
Gabriella Kókai: Maschine Learning
Context
Motivation Estimating Hypothesis Accuracy Basics of Sampling Theory Difference in Error of Two Hypotheses Comparing Learning Algorithms ➔ Summary

32Lehrstuhl für Informatik 2
Gabriella Kókai: Maschine Learning
Summary
Statistical theory provides a basis for estimating the true error ( ) of hypothesis h, based on its observed error ( )over a sample S of data.
In general, the problem of estimating confidence intervals is approached by identifying the parameter to be estimated ( ) and an estimator ( ) for this quantity.
Because the estimator is a random variable it can be characterised by the probability distribution that governs its value.
Confidence intervals can then be calculated by determining the interval that contains the desired probability mass under this distribution.
Derror h Serror h
Derror h Serror h

33Lehrstuhl für Informatik 2
Gabriella Kókai: Maschine Learning
Summary 2 A cause of estimation error is the variance in the estimate. Even with an
unbiased estimator, the observed value of the estimator is likely to vary from one experiment to another. The variance of the distribution governing the estimator characterises how widely this estimate is likely to vary from the correct value
Comparing the relative effectiveness of two learning algorithms is an estimation problem that is relatively easy when data and time are unlimited, but more difficult when these resources are limited.
One approach to run the learning algorithms on different subsets of available data, testing the learned hypotheses on the remaining data, then averaging the result of these experiments.
In most cases considered here, deriving confidence intervals involves making a number of assumptions and approximations.
2σ


