Late Quaternary glacial and vegetational sequence in Valle de Lagunillas, Sierra Nevada del Cocuy, Colombia BY Enrique Gonzalez Thomas van der Hammen AND Richard Foster Flint LEIDSE GEOLOGISCHE MEDEDELINGEN, deel 32, 1965 pp. 157—182, separate published 15 -10 1965 Contents Page Abstract 157 Introduction and acknowledgments 158 Physical description of the area 159 Regional glaciation 161 Glacial features of Valle de Lagunillas 161 Landslides 162 Valley-floor sediments 163 Sequence of drift bodies 164 Source and spatial relations of the drift 165 Reconstruction of glacial events 166 Existing vegetation and climate 167 Borings, sections, and radiocarbon dates 170 Northern part of Valle de Lagunillas 171 Valle de la Bocatoma 172 Southern part of Valle de Lagunillas 173 Discussion of the interpretation of the diagrams 173 Zoning and correlation of the diagrams 175 Dates and correlation of the glacial-drift bodies 179 References 182 Abstract In a high Andean valley (6°N. Lat., alt. 3800 to 4400 m) four bodies of glacial drift marked by many end moraines are recognized. Stratigraphically related to the drifts are small bodies of lake sediments, from which core- and outcrop samples were taken. The samples yielded a continuous pollen sequence from which climatic history was derived. The pollen sequence is calibrated by nine C 14 dates from organic material in the samples. The dated climatic history permits correlation of the sequence with both Colombian pollen zones and northern European zones. It also permits approximate dating of the drifts, which are in good chronologic agreement with those recognized in North America. The results therefore support the view that major climatic events in high-altitude, tropical South America during at least the last 12,000 years were synchronous with those in mid- and high-latitude North America and Europe. 1 Servicio Geológico Nacional, Bogota. 2 Geological Museum, University of Leiden. 3 Department of Geology, Yale University, New Haven, Connecticut.
Transcript
Late Quaternary glacial and vegetational sequencein Valle de Lagunillas, Sierra Nevada del Cocuy,Colombia
BY
Enrique Gonzalez Thomas van der Hammen AND
Richard Foster Flint
LEIDSE GEOLOGISCHE MEDEDELINGEN, deel 32, 1965 pp. 157—182, separate published 15 -10 - 1965
Contents
PageAbstract 157
Introduction and acknowledgments 158
Physical description of the area 159
Regional glaciation 161
Glacial features of Valle de Lagunillas 161
Landslides 162
Valley-floor sediments 163
Sequence of drift bodies 164
Source and spatial relations of the drift 165
Reconstruction of glacial events 166
Existing vegetation and climate 167
Borings, sections, and radiocarbon dates 170
Northern part of Valle de Lagunillas 171
Valle de la Bocatoma 172
Southern part of Valle de Lagunillas 173
Discussion of the interpretation of the diagrams 173
Zoning and correlation of the diagrams 175
Dates and correlation of the glacial-drift bodies 179
References 182
Abstract
In a high Andean valley (6°N. Lat., alt. 3800 to 4400 m) four bodies of glacial drift marked
by many end moraines are recognized. Stratigraphically related to the drifts are small bodies
of lake sediments, from which core- and outcrop samples were taken. The samples yielded a
continuous pollen sequence from which climatic history was derived. The pollen sequence is
calibrated by nine C14 dates from organic material in the samples. The dated climatichistorypermits correlation of the sequence with both Colombian pollen zones and northern Europeanzones. It also permits approximate datingofthe drifts, which are in goodchronologic agreementwith those recognized in North America. The results therefore support the view that majorclimatic events in high-altitude, tropical South America during at least the last 12,000 years
were synchronous with those in mid- and high-latitude North America and Europe.
1 Servicio Geológico Nacional, Bogota.2
Geological Museum, University of Leiden.
3Department of Geology, Yale University, New Haven, Connecticut.
E. Gonzalez, Th. v. d. Hammen and R. F. Flint158
INTRODUCTION AND ACKNOWLEDGMENTS
The Valle de Lagunillas was selected for the study of end moraines and for
their correlation by means of pollen analysis. This valley, containing a chain of
existing and former lakes, lies west of the main central ridge of the Sierra Nevada
del Cocuy.One of us (R.F.F.) made a field- and photogeologic study of the valley and
prepared a geologic map. The other members sampled lake sediments and peats,made a general survey of the existing vegetation, and collected plants and recent
pollen.A sketch map of the high part of the Sierra, showing the extent of the youngest
bodies of drift, was later prepared by Mrs. Anita van der Hammen-Malo. The
pollen diagrams, constructed by one of us (E.G.) and by Mrs. Riate van Mullem,took much time because many of the samples were extremely poor in pollen. Inter-
pretation of the diagrams presented serious problems, arising from the fact that the
altitudes represented are very high. Although we have confidence in our inter-
pretation and correlation, which are corroborated by a number of C 14 dates, we
fully realize that further study may bring new points of view to the interpretationof the diagrams.
A similar study of the Sierra Nevada de Santa Marta, on the north coast of
Colombia, is now being made in Leiden by Mrs. Joan Lucas-Rappard. Provisional
results appear to corroborate our conclusions from the Cocuy, in that they show a
similar succession of moraines, correlative in age with ours.
We wish to express our sincere thanks to the Colombian Commission of the
International Geophysical Year, especially its President, Father J. E. Ramirez, S. J.,for the funds for the expedition; to Dr. Jorge Rodriguez and his collaborators in the
Sección de Fotogrametria del Instituto Geografico "Agustin Codazzi", Bogota, who
developed a contour map of our area, from air photographs and altitudes from our
field data; to Mrs. Riatc van Mullem for the analysis of part of the pollen samples;and to Dr. J. C. Vogcl, Director of the C 14 dating laboratory in Groningen, for his
valued collaboration in providing C14 dates from our most critical samples. The
expense of this work was defrayed by the Netherlands Foundation of Pure Scientific
Research (Z.W.O.).
The present paper reports the results of field work done, and the subsequent studyofsamples collected, during a short expedition to the Sierra Nevada del Cocuy,
sponsored by the Colombian Committee of the International Geophysical Year.
The field study was made January 20 to 31, 1959; the participating members were,
besides the authors, Mr. Juan B. Perico and Mrs. Margaret Flint.
One purpose of the expedition was the marking of the termini of existing
glaciers, for comparison with measurements in future years. A short account of this
work was given in Kraus and van der Hammen, 1960. Theother purpose was to studythe glacial geology and pollen stratigraphy of the area.
159Late quaternary glacial and vegetational sequence in Valle de Lagunillas
PHYSICAL DESCRIPTION OF THE AREA
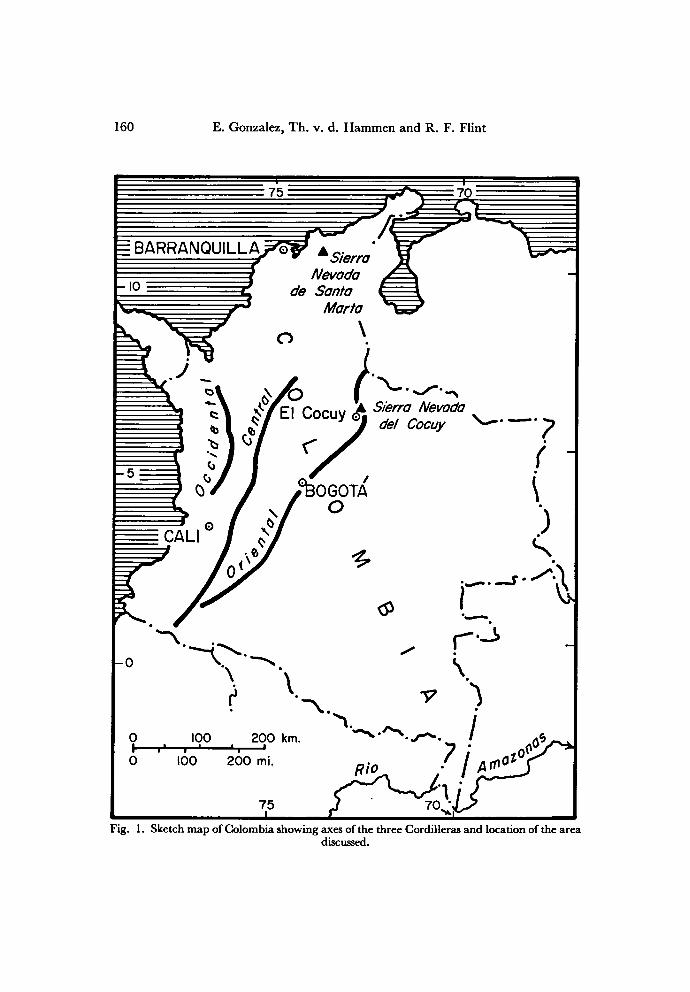
The Sierra Nevada del Cocuy lies in the eastern part of Colombia, between lats.
6°20' N. and 6°35' N. It forms the highest part of the ColombianCordillera Oriental
and trends nearly north-south (fig. 1). That part which stands above the snowline
(that is, above an altitude of about 4600 m measured on the western slope) has a
length of about 33 km and reaches an extreme altitude of about 5490 m in
the Alto Ritacuva, a peak near its nothern end. The highest peak near the
southern end is Pan de Azucar, with an altitude of about 5150 m. The area of the
divide is covered with a nearly continuous chain of ice caps, one to two kilometers
in width, and small outlying snowfields. As viewed from a distance and as they appear
on aerial photographs, the ice caps in the southern part of the Sierra overlie broad
dip slopes and appear to be thin. The one closest to the area mapped is more than
6 km long and 1 to 2 km wide (pi. 1).The glaciers are nourished by snowfall associated with northeast trade winds;
in consequence the eastern slope of the Sierra Nevada, which includes the area of
this study, is wetter than the western slope. Although there are no data on local
precipitation, probably the higher areas receive at least 1500 mm and perhaps more
than 2000 mm of water annually; the western slopes are drier. The climate is
seasonal, with a dry period November to March.
The southern part of the Sierra Nevada consists of coarse sandstone and
quartzitic sandstone, pale gray to white and many thousands of feet thick, the
Cocuy Quartzite of Hettner (1892, p. 15-16), of Cretaceous age. In the Cocuydistrict there are present two units of the sandstone, separated by shales and a
limestone. The upper unit, which forms the crest of the range here, correlates with
the Une Sandstone elsewhere in the Cordillera Oriental, according to H. Biirgl
(unpublished communication). The beds dip generally west and in places are
vertical, imparting a hackly appearance to the higher terrain and a north-south
lineation to the topography in general.A conspicuous valley, Quebrada la Cueva, follows the strike of the sandstone
along the western base ofthe Sierra Nevada, and drains north. Its headward,southern
segment is known as Valle de Lagunillas because it contains a chain of lakes. In this
segment, 6 km long, the valley floor has a width of 300 to 500 m and a gradient of
1 in 60 (about 87 ft/mi). The gradient is unusually small for a valley in the Colombian
Andes, where slopes five to ten times as steep are common. Because of the gentle
gradient, erosion thus far has modified very little the morphology of the glacial drift;end moraines, lake beds, and bogs still remain. For this reason Valle de Lagunillasis a favorable place for an attempt to reconstruct events of late Quaternary time
Within the area mapped the valley has only one tributary stream enteringfrom the west. On its higher, up-dip, eastern side it has seven tributaries. Of this total
of eight, five are short steep streams occupying ill-defined valleys. The other three
are related to a large, conspicuous valley, Valle de la Bocatoma, which today has
glacier ice at its head. Two of the three are lateral streams, following the distal bases
ofmassive end moraines more than 100 m high. The third is central, draining a chain
of lakes and bogs that occupy the valley axis. The topography suggests that in pre-
glacial time the major drainage of the area followed Valle de la Bocatoma and the
northern part of Valle de Lagunillas into Quebrada la Cueva (pi. 1).
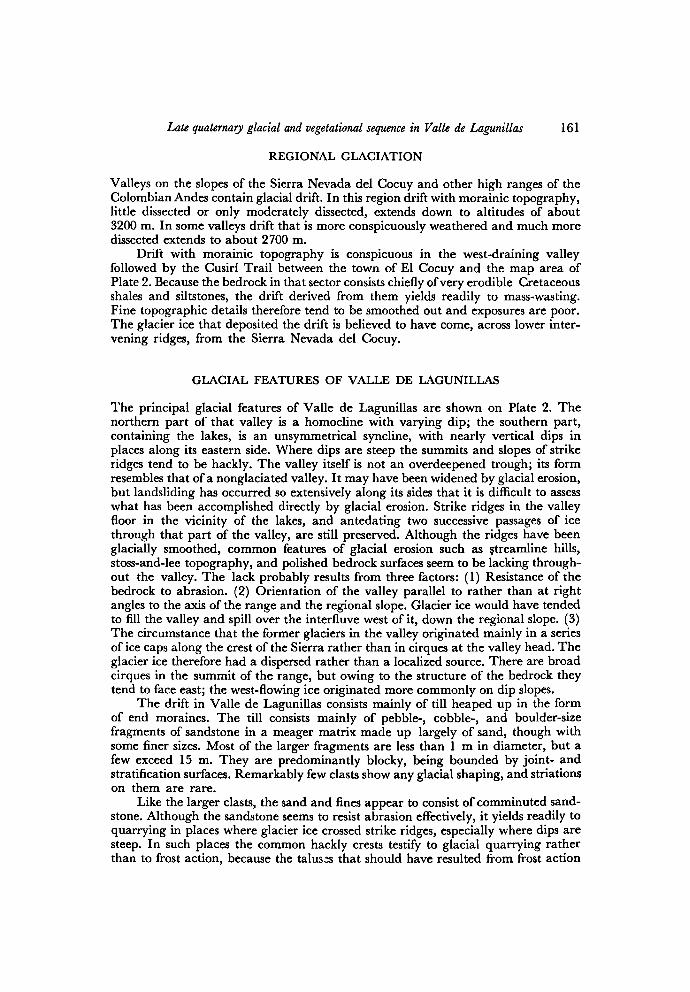
160 E. Gonzalez, Th. v. d. Hammen and R. F. Flint
Fig. 1. Sketchmap ofColombiashowing axes ofthe three Cordilleras and location of the area
discussed.
Late quaternary glacial and vegetational sequence in Valle de Lagunillas 161
REGIONAL GLACIATION
Valleys on the slopes of the Sierra Nevada del Cocuy and other high ranges of the
ColombianAndes contain glacial drift. In this region drift with morainic topography,little dissected or only moderately dissected, extends down to altitudes of about
3200 m. In some valleys drift that is more conspicuously weathered and much more
dissected extends to about 2700 m.
Drift with morainic topography is conspicuous in the west-draining valleyfollowed by the Cusiri Trail between the town of El Cocuy and the map area of
Plate 2. Because the bedrock in that sector consists chiefly ofvery erodible Cretaceous
shales and siltstones, the drift derived from them yields readily to mass-wasting.Fine topographic details therefore tend to be smoothed out and exposures are poor.
The glacier ice that deposited the drift is believed to have come, across lower inter-
vening ridges, from the Sierra Nevada del Cocuy.
GLACIAL FEATURES OF VALLE DE LAGUNILLAS
The principal glacial features of Valle de Lagunillas are shown on Plate 2. The
northern part of that valley is a homocline with varying dip; the southern part,
containing the lakes, is an unsymmetrical syncline, with nearly vertical dips in
places along its eastern side. Where dips are steep the summits and slopes of strike
ridges tend to be hackly. The valley itself is not an overdeepened trough; its form
resembles that ofa nonglaciated valley. It may have been widened by glacial erosion,but landsliding has occurred so extensively along its sides that it is difficult to assess
what has been accomplished directly by glacial erosion. Strike ridges in the valleyfloor in the vicinity of the lakes, and antedating two successive passages of ice
through that part of the valley, are still preserved. Although the ridges have been
glacially smoothed, common features of glacial erosion such as streamline hills,stoss-and-lee topography, and polished bedrock surfaces seem to be lacking through-out the valley. The lack probably results from three factors: (1) Resistance of the
bedrock to abrasion. (2) Orientation of the valley parallel to rather than at right
angles to the axis ofthe range and the regional slope. Glacier ice would have tended
to fill the valley and spill over the interfluve west of it, down the regional slope. (3)The circumstance that the former glaciers in the valley originated mainly in a series
ofice caps along the crest of the Sierra rather than in cirques at the valley head.The
glacier ice therefore had a dispersed rather than a localized source. There are broad
cirques in the summit of the range, but owing to the structure of the bedrock theytend to face east; the west-flowing ice originated more commonly on dip slopes.
The drift in Valle de Lagunillas consists mainly of till heaped up in the form
of end moraines. The till consists mainly of pebble-, cobble-, and boulder-size
fragments of sandstone in a meager matrix made up largely of sand, though with
some finer sizes. Most of the larger fragments are less than 1 m in diameter, but a
few exceed 15 m. They are predominantly blocky, being bounded by joint- and
stratificationsurfaces. Remarkably few clasts show any glacial shaping, and striations
on them are rare.
Like the larger clasts, the sand and fines appear to consist of comminuted sand-
stone. Although the sandstone seems to resist abrasion effectively, it yields readily to
quarrying in places where glacier ice crossed strike ridges, especially where dips are
steep. In such places the common hackly crests testify to glacial quarrying rather
than to frost action, because the talusjs that should have resulted from frost action
E. Gonzalez, Th. v. d. Hammen and R. F. Flint162
are lacking. The till is therefore attributed to glacial quarrying, mainly of ridge
summits, and to crushing of the quarried debris.
End moraines are the dominant feature of the floor and lower sideslopes of the
valley. The map (pi. 2) shows the axes of many of the moraines, but to show them
all would require more detailed mapping than we could do. In one place as many
as eight nested moraines were counted across a distance of 200 meters. Individual
moraines range in height from two or three up to ten or more meters. They have
sharp crests and are convex in the downstream direction. Fragments larger than sand
size appear to be more concentrated on the surfaces than in the interiors of the
moraines. Probably concentration has resulted from removal ofsurface fines by sheet
runoff.
Outwash sediments are conspicuous by the rarity of their occurrence. In some
sections, such as that shown in Figure 4, thin layers of gravel and sand probably
represent outwash, but in Section V, the longest one, such sediments are very scarce
(pi. 4), and in Sections XI (pi. 9) and IX (pi. 7) there are none at all. The small
stream that today carries meltwater from the glacier terminus down Valle de la
Bocatoma contains very little sediment, and is not depositing outwash. Apparentlythe hard, non-erodible character ofthe bedrock is chiefly responsible for the scarcityof outwash.
Where till overlies gentle slopes of bedrock, minute topographic details of the
end moraines are preserved. On steep slopes, however, slumping and landslidinghave occurred on a large scale. These mass movements have distorted moraines,reduced their initialaltitude, or destroyed their constructional form altogether. This
fact makes mapping difficult, as all gradations exist between unaltered moraines and
clear-cut landslides in which no trace of morainic form remains. On Plate 2 surficial
sediments are mapped as drift if they retain any recognizable morainic topography,
even though it has been distorted by downslope movement. More thoroughlyreworked sediments are mapped as landslides. Much of the drift along the western
slope of Valle de Lagunillas, and some drift on the eastern slope as well, has slid
downslope, so that the altitudes of its present upper limit are not necessarily the
altitudes of the limit at the time of glacial deposition.
LANDSLIDES
The effects of small-scale slumping of the drift are visible in many places. Land-
sliding on a larger scale has distorted the form and lowered the positions of entire
end moraines in the sector of the Valle de Lagunillas that extends northward from
the lakes. In four areas sliding has been so effective that the materials moved are
mapped as landslides. Three of these are on the east sideslope of the valley, respect-
ively 0.3 km, 1.7 km, and 2.4 km downstream from the mouth of the central stream
that drainsValle de la Bocatoma. The fourth is on the west sideslope opposite LagunaTravesada and Laguna Parada. As three of the slides are in contact with glacial
drift, the times of their movement or latest movement, relative to the adjacent drift,
can be inferred, as is evident from the map. The slide farthest north postdatesthe drift lying higher than about 3900 m, but antedates the drift lying below that
altitude. This slide therefore occurred during aninterval between a local deglaciationand a local readvance. The next slide to the south postdates even the drift lyingbelow 3900 m, and is therefore later than its neighbor by one glacial readvance. The
slide southwestofLaguna Travesada and Laguna Paradaappears to have experienced
repeated movement. Some movement antedates the moraines immediately north of
Late quaternary glacial and uegeiational sequence in Valle de Lagunillas 163
Laguna Travesada. Another movement postdates that drift but antedates the
moraines immediately north of Laguna Parada. Still later and more localized
movement postdates the latter moraines. Fresh slump scarpsat and near the head of
this composite slide indicate movement now or very recently active. The contortion
of fine sediments beneath the valley floor, described in the following section, is
reasonably explained as a result of similar slides.
VALLEY-FLOOR SEDIMENTS
The segment of Valle de Lagunillas that extends through about 1.7 km down-
stream from the mouth of the central stream that drains Valle de la Bocatoma, and
2.0 km from the outlet ofLaguna Pintada, contains distinctive valley-floor sediments.
The principal unit consists of a body of compact pale-gray silt, silty clay, sand, and
fine pebble gravel, in places containing concretions. Within the sequence are dark
organic-rich layers and, at one locality, peat. Lamination is distinctly parallel. The
body is at least 12 m thick. Its base is concealed; and its top, wherever exposed, is in
some places not the original top of the body, as it is overlain with sharp contact by
pebble gravel, till, or boulders. Section VL-V, described in a subsequent part of this
paper, was sampled from the fine sediments of this sequence.
The sediment constitutes a dissected low, terracelike erosion remnant, standingabove an alluvial valley floor. Along part of its extent it is banked against the valley-
facing side of a group of low bouldery ridges, separated by basins, that have the
appearance of end moraines but that may consist, in part, of landslide debris.
Elsewhere along the sides of Valle de Lagunillas the stratigraphic relations of the
body of fine sediment to drift and landslide debris with which it is in contact are not
known, because the bouldery characterofthe debris defies investigation withordinaryfield tools.
Through the southernmost 600 m of its known extent the body of fine sediments
is overlain by end moraine, till, or boulders. Intervening between the fine sediments
and the overlying deposit is a thin zone of pebble gravel, reasonably interpreted as
outwash. In exposures within the southern part oftheir extent the fine sediments are
contorted, with axes of small folds roughly paralleling the axis of the valley and
suggesting overthrust toward the west. It is unlikely that the contortion resulted
from drag by an overriding glacier as it emerged from Valle de la Bocatoma, as in
that case the fold axes should form a wide angle with the valley axis. Furthermore,
a thin layer of bedded gravel, not contorted, intervenes between the deformed
sediments and the overlying boulders. We suggest that the deformation was caused
by a landslide similar to those now visible along the valley sides (pi. 2).North of the small lake at the western margin of the valley floor the body of
fine sediment is cut out by the alluvial floor, which there extends from side to side
ofthe valley. Hence the original northwardextent of the body remains undetermined.
However, down the valley, in the east bank of the river, immediately downstream
from a looped end moraine and midway between the mouths of two tributaries,are exposed similar sediments in which layers of silt, clayey silt, and gyttja are
conspicuous; the fines are interbedded with boulder gravel. Because the coarse-
bouldery texture ofthe adjacent end moraine made it impossible to expose the contact
between till and fines, it was not determined whether the fines lie against or passbeneath the moraine. It seems likely, however, that this body of fines is not a partof the extensive body exposed farther upstream. Although both are primarily fine
grained and primarily lacustrine, the organic sediments of the more extensive body
164 E . Gonzalez, Th. v. d. Hammen and R. F. Flint
are much more compact than those farther north. In both bodies the presence of
organic matter and the absence oferratic coarse fragments suggest nonglacial rather
than glacial conditions of sedimentation. The inferred lake or lakes could have
resulted from damming of the valley by moraines or landslide debris, both of which
are present in the critical sector.
In summary, in the absence ofstratigraphic evidence adequate to fix definitelythe position of the body of lake sediments in the sequence, the body probably post-dates the moraines near its northern end, and certainly antedates the drift that over-
lies its southern part. If the lacustrine body antedated the moraines near its northern
end, it would have had to be glacially overridden throughout its exposed length;but the absence of overlying coarse debris throughout most of that distance makes
overriding very unlikely.
SEQUENCE OF DRIFT BODIES
Some notion of sequence can be gained from data on the apparent relative ages of
various sedimentary bodies in the area, and from this an attempt can be made to
reconstruct events in their proper order. First the drift can be subdivided tentativelyinto four age groups, here designated I, II, III, and IV. These units of drift are
numbered rather than named, because named localities or natural features are
too few to permit unambiguous naming of the drifts.
Drift IV, the youngest, is almost white, indicating little ifany weathering since
deposition. It has almost no cover of vegetation, and it extends eastward to the
existing ice cap. These observations indicate that the drift is very recent. On the map
area Drift IV occupies the upstream half of Valle de la Bocatoma, forming in it a
lobe with a terminus at altitude about 4100 m. Also it includes, immediately north
of that valley, the patch of drift occupying a broad dip slope and measuring 900 m
in length along the eastern edge of the map area.
In the Valle de la Bocatoma Drift IV includes two conspicuous end moraines,
one (moraine no. 3, fig. 6) at the outer limitof that drift, and the other (no. 4, fig. 6)
nearly 1 km farther up the valley. Moraine no. 3 is a product of glacial readvance,
as is indicated by the sharply defined weathering difference between Drift IV and
Drift III, described in the following paragraph. Moraineno. 4 could be the producteither of readvance or of a protracted equilibrium state during general recession.
Drift III is pale gray in hue, is only very sparsely covered with vegetation, and
in Valle de la Bocatoma is characterized by massive lateral moraines, far larger than
others in the map area. It is present in the downstream halfofValle de la Bocatoma,
extending past the mouth of that valley, across to the western side of Valle de
Lagunillas, and down the axis of that valley through a few hundred meters. It is
judged from air photographs that the drift in the basin area along the northeastern
edge ofthe map, including Laguna Seca, is also part of Drift III. The characteristics
ofDrift III imply that it is older than Drift IV.
Like Drift IV, Drift III is characterized by two conspicuous end moraines,shown in Figure 6. Moraine no. 1 is close to the outer limit of that drift, whereas
no. 2 lies about 500 m farther up Valle de la Bocatoma. The physical evidence
observed does not indicate whether moraineno. 2 is the product of a readvance or
ofan episode ofstability during glacial recession. Ineither case the timelapse between
the episodes of construction of no. 1 and no. 2 was not great enough to result in a
noticeable difference in intensity of weathering between the two moraines.
Drift II has a gray hue that is only very slightly darker than that of Drift III,but the drift is more extensively covered with vegetation, and is expressed topogra-
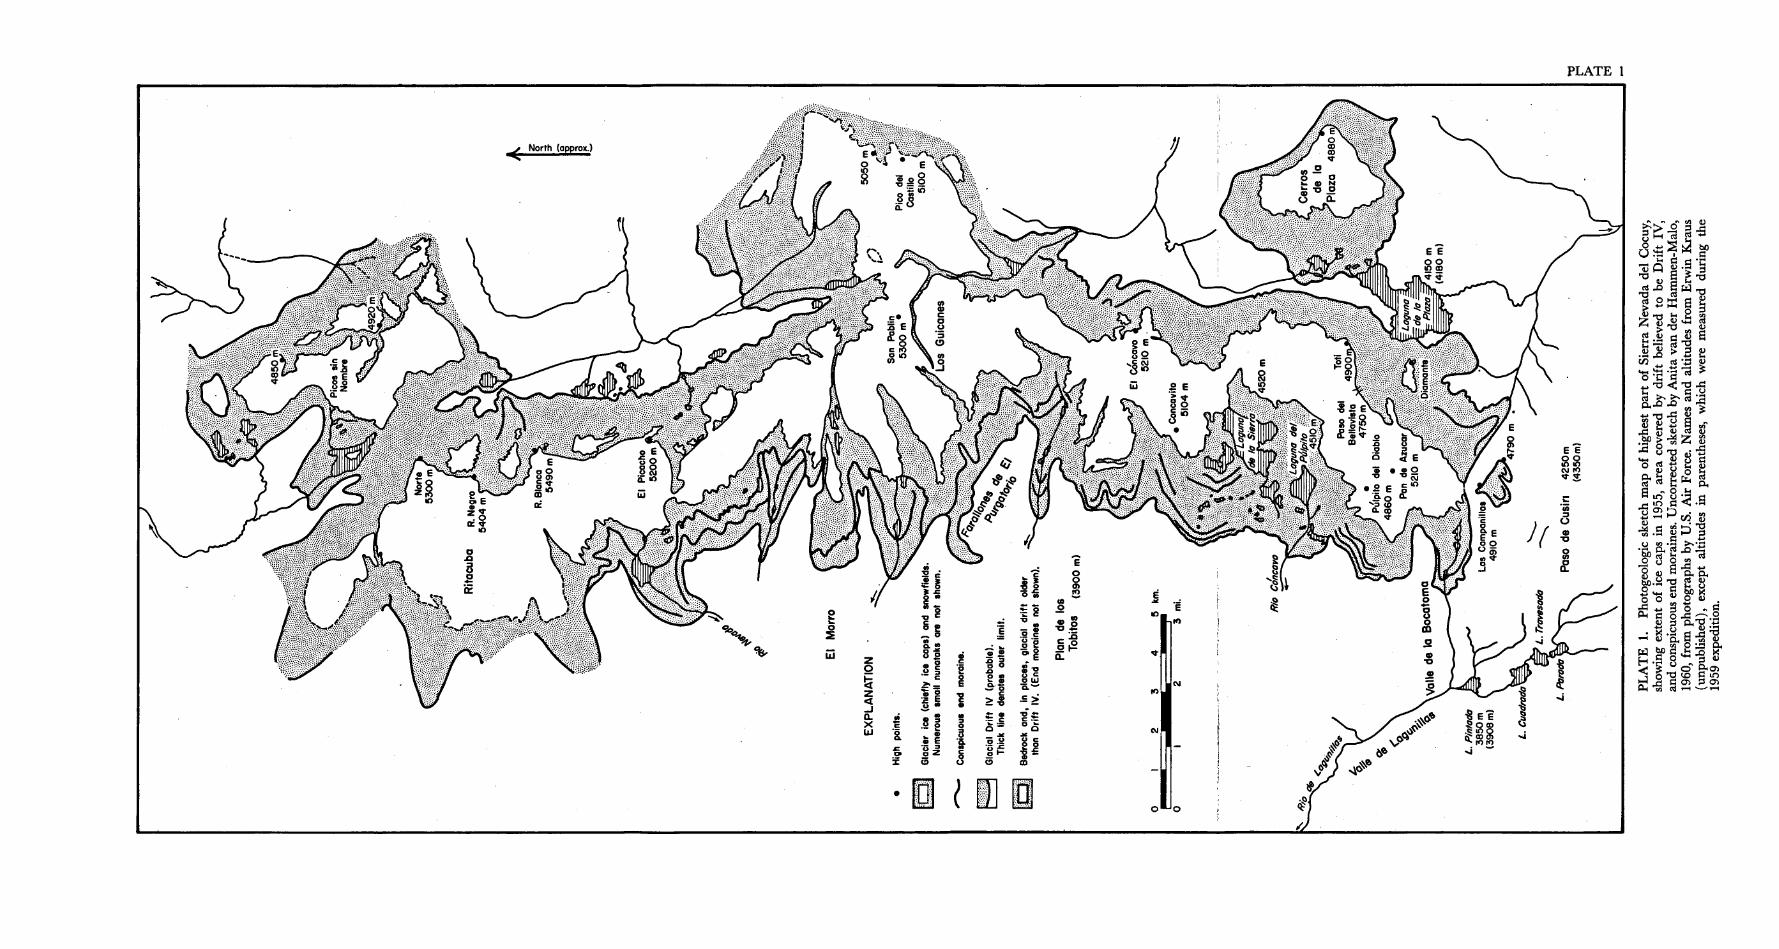
PLATE 1
PLATE1.
Photogeologicsketch
mapof
highestpartof
Sierra
Nevadadel
Cocuy,
showingextentof
ice
capsin
1955,
area
coveredby
drift
believedto
be
Drift
IV,
and
conspicuousend
moraines.
Uncorrectedsketchby
Anitavan
der
Hammen-Malo,
1960,
from
photographsby
U.S.
Air
Force.
Namesand
altitudesfrom
Erwin
Kraus
(unpublished),except
altitudesin
parentheses,which
were
measured
duringthe
1959
expedition.
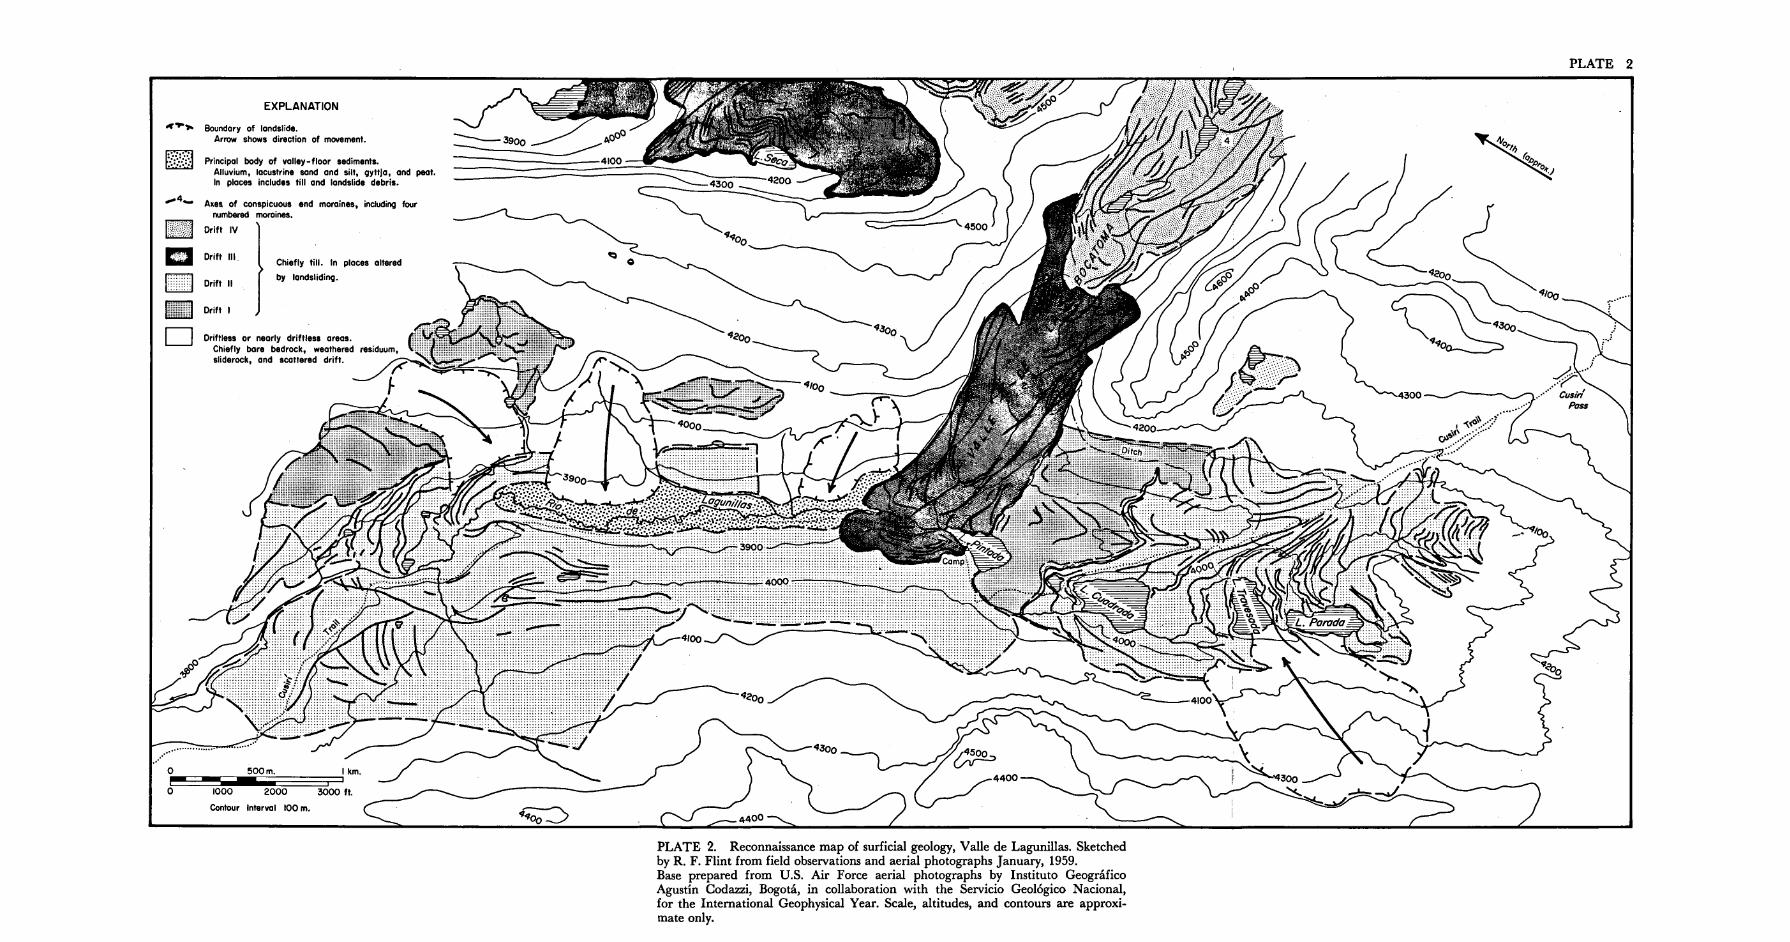
PLATE 2
PLATE 2. Reconnaissance map of surficial geology, Valle de Lagunillas. Sketched
by R. F. Flint from field observations and aerial photographs January, 1959.
Base prepared from U.S. Air Force aerial photographs by Instituto Geogràfico
Agustín Codazzi, Bogotá, in collaboration with the Servicio Geológico Nacional,for the International Geophysical Year. Scale, altitudes, and contours are approxi-
mate only.
Late quaternary glacial and vegetational sequence in Valle de Lagunillas 165
phically in smaller and more numerous end moraines, although they are about as
sharp and distinct as those ofDrift III. These observations suggest that the age differ-
ence between the two drifts is small. Drift II forms a lobe in the area of Lagunas
Parada, Travesada, and Cuadrada; the lobe terminates south and southeast of
Laguna Pintada. Likewise Drift II forms the low-altitude drift in the northern partof Valle de Lagunillas, that is, the drift at altitudes less than about4000 m. Its upperlimit is uncertain because of discontinuities in its areal distribution and because of
landsliding.Drift I is present in the small area south and southeast of Laguna Pintada,
where it can be readily compared with the adjacent terminus ofthe overlying Drift II.
Unlike Drift II it is not a continuous sheet, but consists ofisolated end moraines and
boulders scattered sparsely over glacially smoothed bedrock. Its moraines are lower
and smoother and have fewer surface boulders than the moraines of Drift II. The
bedrock surface in the area ofDrift I is somewhat roughened by weathering, and the
edges and corners formed by joints and stratification planes are slightly rounded.
The rock, however, is hardly any darker in hue than that in the area of Drift II.
These observations are consistent with the fact that Drift I is overlain by Drift II.
It is not known whether the drift on the higher sideslopes in the northern part of
Valle de Lagunillas is entirely Drift I or in part Drift II as well, because much of it
has been deformed by slumping and very littleof the bedrock beneath it is exposed.The scheme suggested above is very tentative and subject to revision, because it
is based on tenuous evidence, consisting chiefly of slight differences in hue of the
rocks, vegetation cover, and areal position of drift bodies. Quartzitic sandstone is
unpromising material for recording small weathering differences, and the short time
available in the field precluded a program of repeated detailedcomparisons. As the
smallest difference among the drifts tentatively recognized is that between Drifts II
and III, it could be argued that these two bodies are correlative. However, consider-
ation ofthe source and spatial relations of the two drifts does not favor that argument,
as shown in the discussion that follows.
The differences among the drift bodies do not afford a basis for evaluating the
absolute length of the intervals between glaciations. But the inconspicuousness of
the differences suggests that the span of time represented by the entire sequence of
drift bodies was not large.
SOURCE AND SPATIAL RELATIONS OF THE DRIFT
The drift lithology, consisting essentially of a single rock type, indicates that the
glaciers responsible for all the drift shown on the map originated within the outcrop
area of Cretaceous sandstones, an area which in this sector extends eastward across
the crest of the Sierra Nevada. The directions of convexity of end moraines show
that glacier ice came not only down Valle de la Bocatoma into Valle de Lagunillas,but also from the sharpcrested, hogback-like ridge of bedrock that bounds the latter
valley on the east. Although conceivably a thin local sheet-like glacier could have
formed on the upper slopes of the ridge itself, the narrow top and steep sideslopeswould not have favored the accumulation of much ice. Furthermore there are, on
the eastern slope of the ridge, no end moraines such as would be expected if a glacierhad been centered on the ridge itself. It is likely, therefore, that the ice entered Valle
de Lagunillas not from the ridge but over it.
If ice entered Valle de Lagunillas over the ridge, it must first have filled the
basins between the ridge and the crest of the Sierra Nevada farther east, where the
E. Gonzales, Th. v. d. Hammen and R. F. Flint166
existing ice cap lies. Indeed it is evident from the air photographs that those basins
formerly contained ice. When the basins were thus filled the ice in them must have
been more than 600m thick in order to overtop the inclosing ridge and flow west into
Valle de Lagunillas, although over the heights it could have been relatively thin.
A very moderate expansion of the existing ice cap, with moderate increase in
its thickness, would suffice to bring a tongueof ice down Valle de la Bocotoma again.
However, a much greater increase in thickness would be needed to get ice into Valle
de Lagunillas by overtopping the ridge. The theoretical difference in ice thickness
is reflected in the distributionofDrift IV. Although that drift body extends more than
halfway down the length of Valle de la Bocatoma, it is not present at all in Valle
de Lagunillas, whose southern end is at least as close to the ice cap as is the terminus
of Drift IV in Valle de la Bocatoma. Evidently, at the recent time when Drift IV
was being deposited, the ice cap was too thin to overtop the ridge.If it were assumed that Drift III is correlative with the lobe of Drift II that
terminates north of Laguna Cuadrada, this question would be unanswered: Whydid the ice of the latter lobe, so thick that it could overtop the ridge along a wide
front and continue northwest for 2.5 km, stop short of the mouth of Valle de la
Bocatoma? Or conversely, why did the ice lobe in Valle de la Bocatoma, with no
barriers to surmount, not extend far down Valle de Lagunillas instead of terminating
near Laguna Pintada? These questions constitute an argument for a time difference
between the two drifts. It appears probable that when Drift III was emplaced, the
area of the lakes containedno glacier ice at all.
Considerationofthe effects oftheridge as a barrier to relatively thin ice leads to
the opinion that major thinning ofthe ice-cap source must have intervened between
the time of Drift II and that of Drift III, even though weathering differences and
apparent elapsed time were small. In contrast, thinning between the times of
Drifts III and IV could have been much less.
The direction of convexity of the higher end moraines along the north-eastern
and northern side of Valle de Lagunillas suggests that during the deglaciation in
which the moraines were built, very thin lobes of glacier ice were draped along the
valley side with sources in the sharp ridge crest to the east. This could have happenedwhile the basin east ofthe crest was still filled with ice. Similarbroad, thin "spillovers"
are represented likewise in Drift IV, on air photographs of the region east of the
map area.
RECONSTRUCTION OF GLACIAL EVENTS
The foregoing interpretation ofthe sequence and spatial relations of the drift bodies
suggests the following reconstruction of events, listed in chronologic order:
1. Glaciation (Drift I), with ice occupying valleys very nearly throughout the
map area. Whether this was an independent glaciation, or a readvance in a later
part of a more extensive glaciation, is not known.
2. Deglaciation, at least as far up Valle de Lagunillas as the position of
Laguna Cuadrada. Interval of weathering and mass-wasting.
3. Glaciation (Drift II), in which ice, thinner than the ice of Drift I, occupied
Vallede la Bocatoma, and Valle de Lagunillas nearly as far north as did the preceding
glaciation. The lobe that entered the areaof the lakes from over the ridge southeast
of them failed to coalesce with the lobe descending Valle de la Bocatoma. Failure of
the latter lobe to form a sublobe projecting southward toward Laguna Cuadrada
probably resulted from the presence of a very steep, north-facing bedrock slope in
the area immediately south of Laguna Pintada.
167Late quaternary glacial and vegetational sequence in Valle de Lagunillas
4. Deglaciation, accompanied by landsliding on the north side of Valle de
Lagunillas and in the area west of Lagunas Travesada and Parada. Formation of a
lake in the northern half of Valle de Lagunillas.5. Nonglacial interval, with probably complete deglaciation of the area shown
in Plate 2. Lacustrine sedimentation in Valle de Lagunillas; the lake later drained.
Local deformationof lake sediments, probably by landsliding.6. Glaciation (Drift III) by much thinner ice, which partly filled the basin
northeast of Valle de la Bocatoma; also a lobe flowed down that valley and abutted
against the western side ofValle de Lagunillas. Meltwater from the northern sector
of its terminus deposited local thin gravel outwash on the lake sediments. The area
of the present lakes remained ice free.
7. Deglaciation of Valle de la Bocatoma to some altitude above 4100 m;
including a recessional pause at, or readvance to, moraine no. 2. Slight weathering.8. Renewed glacial invasion (Drift IV) down Valle de la Bocatoma, about as
far as altitude 4100. Expansion of the ice cap down a dip slope on to the map area
north of that valley.9. Deglaciation, including a recessional pause at, or readvance to, moraine
no. 4; evacuation of Valle de la Bocatoma up to the position of the existing glacier.
The climatic snowline on the western side of the Sierra Nevada lies today in the
neighborhood of 4600 m. There is little information from which to judge its positionwhen the glacier in Valle de Lagunillas stood at the outer limit ofDrift I, other than
the altitude of the up-valley ends of lateral moraines. On the assumption that those
features mark the snowline of that time, the critical altitude would have been a
little less than 4100 m, about 500 m below that of today. When glaciers had their
greatest recognized extent, reaching down to about 2700 m, the snowline must have
been depressed more — perhaps much more — than 1000 m below its present
position.Absolute dates of the bodies of glacial drift were determined by reference to
C 14-dated organic materials having known stratigraphic relations to the drift bodies.
Study of the pollen stratigraphy yielded a record of climatic changes, which was
consistent with the sequence derived from the drift.
The foregoing interpretation of the glacial stratigraphy was made in 1959; the
paleobotanic interpretation was completed in 1964. The agreement between the
two records developed independently, and between them and the C 14 dates, leads
us to have confidence in the validity of our results.
EXISTING VEGETATION AND CLIMATE
Andean Forest
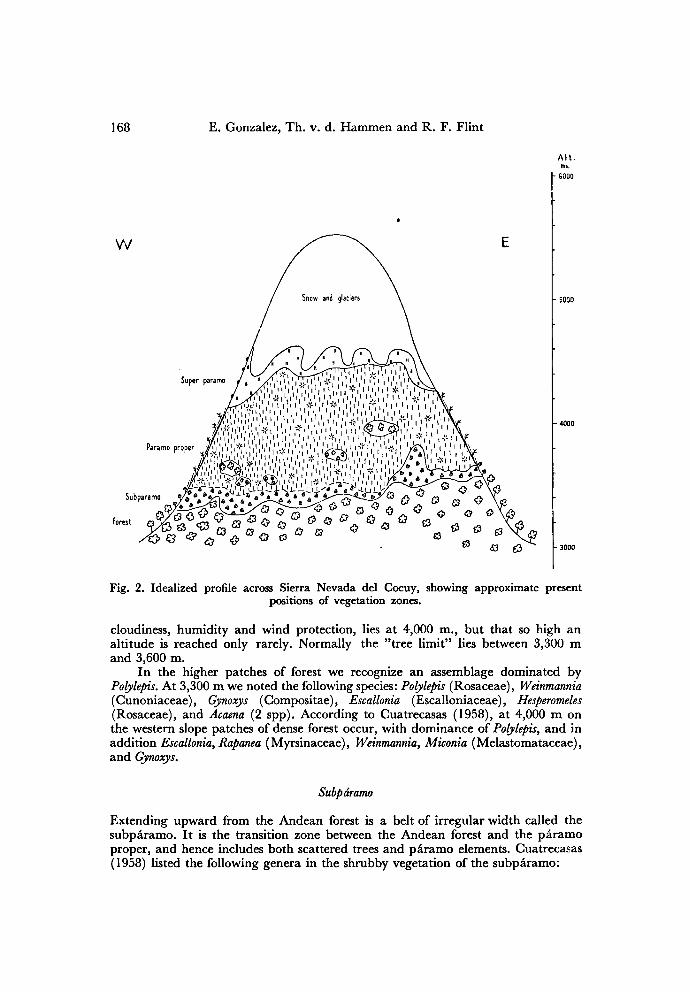
Four successive vegetation belts exist in the Sierra (fig.2). On the western flank the
upper limit of forest today lies at approximately 3,300 m.; on the eastern flank
(Cuatrecasas, 1934) it lies as high as 4,000 m., probably because precipitation is
greater on the eastern flank. Abnormally high patches noted by us in the Valle de
Lagunillas, on the drier western flank, at 4,000 m., probably owe their presenceto
local factors such as protection from the wind. Before human influence the tree limit
probably stood higher, because patches offorest are present at much higher altitudes.
We conclude that the maximum potential forest limit, under optimal conditions of
E. Gonzalez, Th. v. d. Hammen and R. F. Flint168
cloudiness, humidity and wind protection, lies at 4,000 m., but that so high an
altitude is reached only rarely. Normally the "tree limit" lies between 3,300 m
and 3,600 m.
In the higher patches of forest we recognize an assemblage dominated by
Polylepis At 3,300 m we noted the following species: Polylepis (Rosaceae), Weinmannia
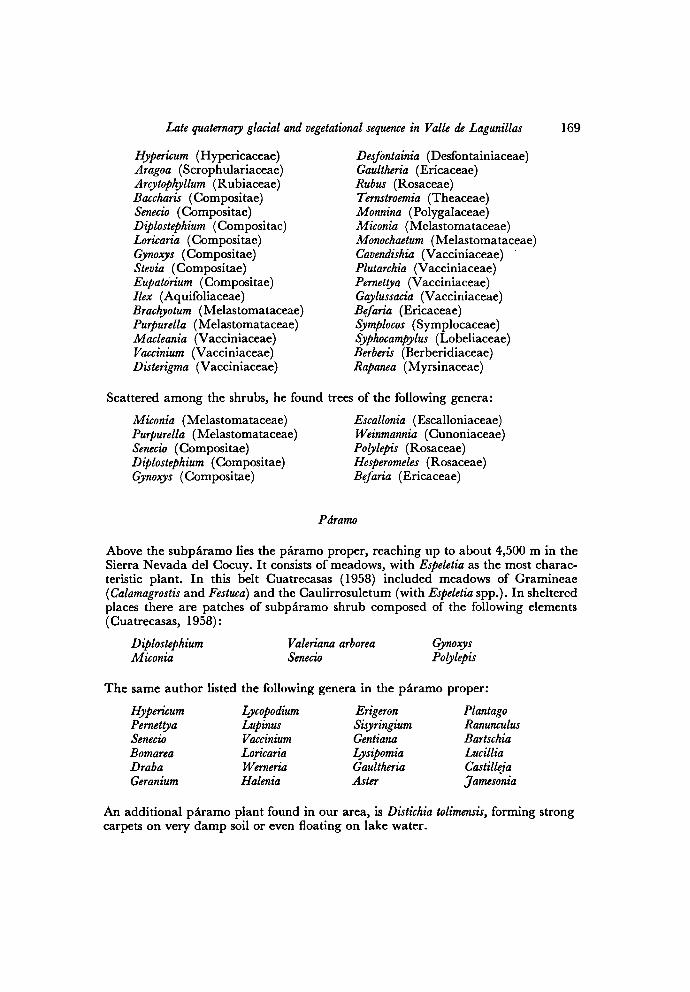
Above the subparamo lies the paramo proper, reaching up to about 4,500 m in the
Sierra Nevada del Cocuy. It consists of meadows, with Espeletia as the most charac-
teristic plant. In this belt Cuatrecasas (1958) included meadows of Gramineae
(Calamagrostis and Festuca) and the Caulirrosuletum (with Espeletia spp.). In sheltered
places there are patches of subparamo shrub composed of the following elements
(Cuatrecasas, 1958):
DiplostephiumMiconia
Valeriana arborea
Senecio
Gynoxys
Polylepis
The same author listed the following genera in the paramo proper:
Hypericum
PernettyaSenecio
Bomarea
Draba
Geranium
Lycopodium
LupinusVaccinium
Loricaria
Werneria
Halenia
Erigeron
SisyringiumGentiana
LysipomiaGaultheria
Aster
PlantagoRanunculus
Bartschia
Lucillia
Castilleja
Jamesonia
An additional paramo plant found in our area, is Distichia tolimensis forming strong
carpets on very damp soil or even floating on lake water.
E. Gonzalez, Th. v. d. Hammen and R. F. Flint170
Superpáramo
Lying between the paramoand the snowline is the superparamo belt, in a landscapeofbare bedrock, moraines, and stony ground. Vegetation is very sparse and irregular,and does not include the Espeletias. Within this belt the most characteristic species
belong to the genera Senecio (many species), Cerastium, Draba, Agrostis, Bromus, Poa
and Luzula (Cuatrecasas, 1958). In our area vegetation of this type, although
generally confined to altitudes above 4,500 m, occurs as low as 4,100 m on young
moraines. In the area of Laguna de la Plaza at 4,350 m, we made the following list
of genera growing at the transition zone between paramo and supsrparamo:
Gentiana
Paepalanthus
RhizocephalumAzorella
Senecio
Agrostis
PlantagoBartschia
Werneria
Jamesonia
Luzula
Carex
Cerastium
Lachemilla
Elaphoglossum
Espeletia
Halenia
Ranunculus
LupinusLoricaria
Draba
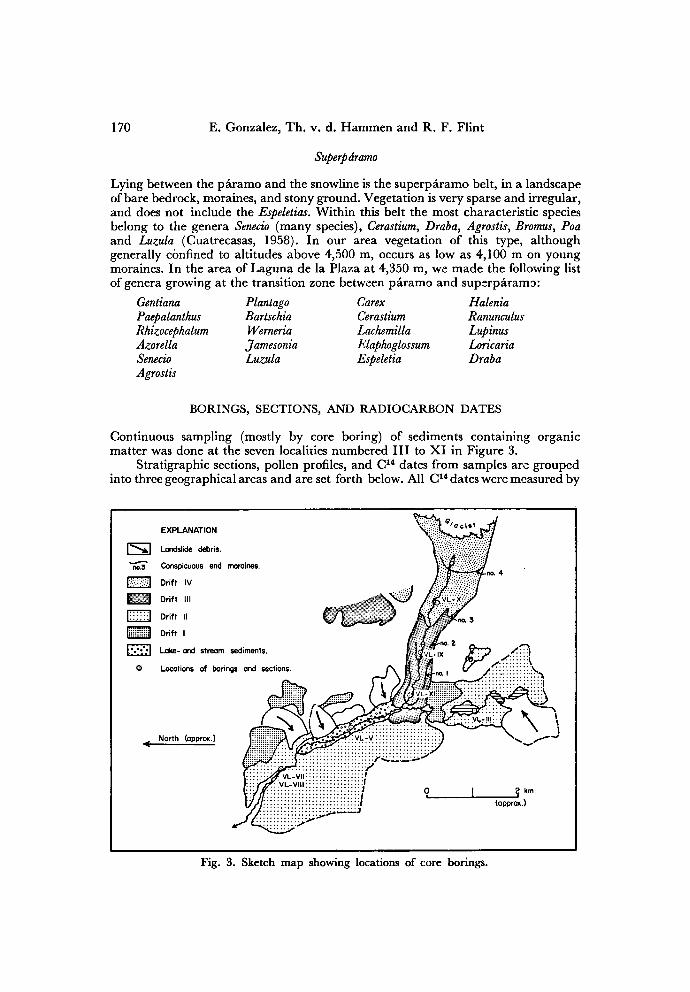
BORINGS, SECTIONS, AND RADIOCARBON DATES
Continuous sampling (mostly by core boring) of sediments containing organicmatter was done at the seven localities numbered III to XI in Figure 3.
Stratigraphic sections, pollen profiles, and C 14 dates from samples are groupedinto three geographical areas and are set forth below. All C 14 dates were measuredby
Fig. 3. Sketch map showing locations of core borings.
Late quaternary glacial and vegetational sequence in Valle de Lagunillas 171
Dr. J. C. Vogel in the Groningen C14 Laboratory, with the financial support of the
Netherlands Foundation for Pure Scientific Research (Z.W.O.). Material suitable
for dating was found only in section V and in the small basin represented by sections
VII and VIII.
Northern part of Valle de Lagunillas
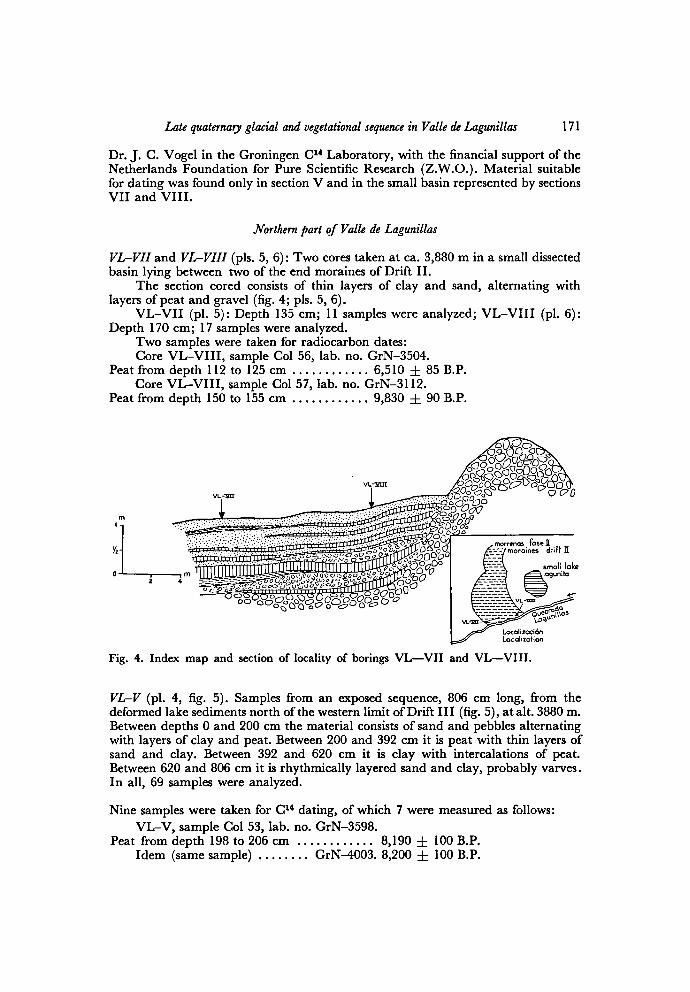
VL-VI1 and VL-VIII (pis. 5, 6): Two cores taken at ca. 3,880 m in a small dissected
basin lying between two of the end moraines of Drift II.
The section cored consists of thin layers of clay and sand, alternating with
Depth 170 cm; 17 samples were analyzed.Two samples were taken for radiocarbon dates:
Core VL-VIII, sample Col 56, lab. no. GrN-3504.
Peat from depth 112 to 125 cm 6,510 ± 85 B.P.
Core VL-VIII, sample Col 57, lab. no. GrN-3112.
Peat from depth 150 to 155 cm 9,830 ± 90 B.P.
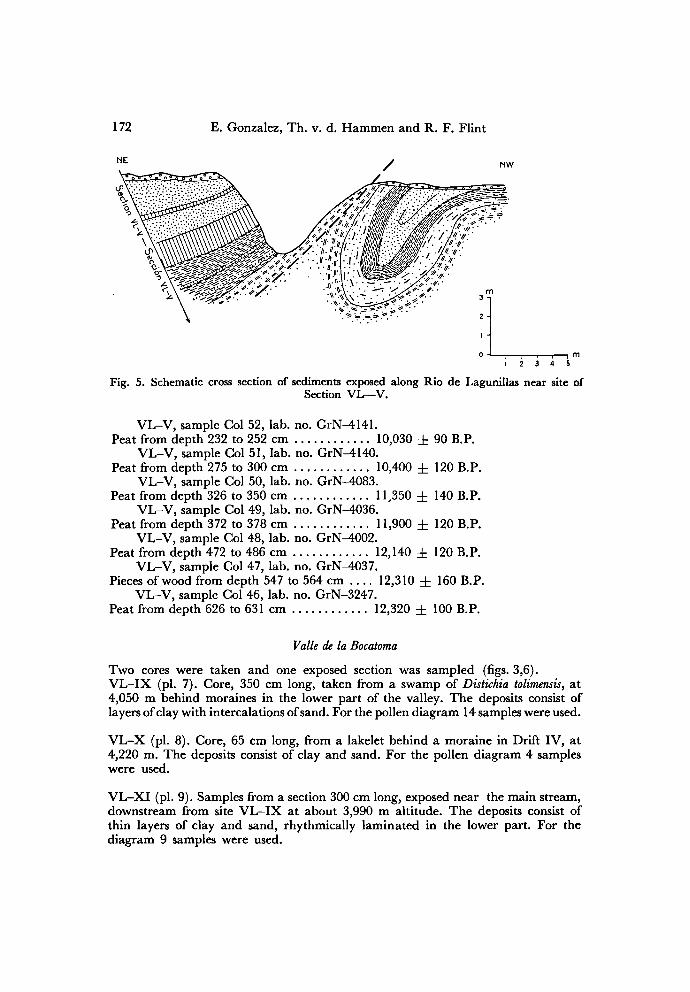
VL-V (pi. 4, fig. 5). Samples from an exposed sequence, 806 cm long, from the
deformedlake sediments north of the western limitofDrift III (fig. 5), at alt. 3880 m.
Between depths 0 and 200 cm the material consists of sand and pebbles alternatingwith layers of clay and peat. Between 200 and 392 cm it is peat with thin layers of
sand and clay. Between 392 and 620 cm it is clay with intercalations of peat.
Between 620 and 806 cm it is rhythmically layered sand and clay, probably varves.
In all, 69 samples were analyzed.
Nine samples were taken for C 14 dating, of which 7 were measured as follows:
VL-V, sample Col 53, lab. no. GrN-3598.
Peat from depth 198 to 206 cm 8,190 ± 100 B.P.
Idem (same sample) GrN-4003. 8,200 ± 100 B.P.
Fig. 4. Indexmap
and section of locality of borings VL—VII and VL—VIII.
172 E. Gonzalez, Th. v. d. Hammen and R. F. Flint
VL-V, sample Col 52, lab. no. GrN-4141.
Peat from depth 232 to 252 cm 10,030 ± 90 B.P.
VL-V, sample Col 51, lab. no. GrN-4140.
Peat from depth 275 to 300 cm 10,400 ± 120 B.P.
VL-V, sample Col 50, lab. no. GrN-4083.
Peat from depth 326 to 350 cm 11,350 ± 140 B.P.
VL-V, sample Col 49, lab. no. GrN-4036.
Peat from depth 372 to 378 cm 11,900 ± 120 B.P.
VL-V, sample Col 48, lab. no. GrN-4002.
Peat from depth 472 to 486 cm 12,140 ± 120 B.P.
VL-V, sample Col 47, lab. no. GrN-4037.
Pieces of wood from depth 547 to 564 cm.... 12,310 ± 160 B.P.
VL-V, sample Col 46, lab. no. GrN-3247.
Peat from depth 626 to 631 cm 12,320 ± 100 B.P.
Valle de la Bocatoma
Two cores were taken and one exposed section was sampled (figs. 3,6).VL-IX (pi. 7). Core, 350 cm long, taken from a swamp of Distichia tolimensis at
4,050 m behind moraines in the lower part of the valley. The deposits consist of
layers ofclay with intercalationsof sand. For the pollen diagram 14 samples were used.
VL-X (pi. 8). Core, 65 cm long, from a lakelet behind a moraine in Drift IV, at
4,220 m. The deposits consist of clay and sand. For the pollen diagram 4 samples
were used.
VL-XI (pi. 9). Samples from a section 300 cm long, exposed near the main stream,
downstream from site VL-IX at about 3,990 m altitude. The deposits consist of
thin layers of clay and sand, rhythmically laminated in the lower part. For the
diagram 9 samples were used.
Fig. 5. Schematic cross section of sediments exposed along Rio de Lagunillas near site of
Section VL—V.
Late quaternary glacial and vegetational sequence in Valle de Lagunillas 173
Southern part of Valle de Lagunillas
VL-III (pi. 3). Core from beneath Laguna Cuadrada, altitude 4,003 m. The upper
pari of the section, 120 cm long, could not be sampled, as it consisted of a carpet of
Sphagnum, 40 cm thick, floating on 80 cm of water. The rest of the sediments consist
of clay with fine sand. For the pollen diagram 28 samples were analyzed.
DISCUSSION OF THE INTERPRETATION OF THE DIAGRAMS
In the construction and interpretation of the diagrams the same methods and
principles were followed as those used for the Quaternary pollen analytical work
donï earlier in Colombia, (van der Hammen and Gonzalez, 1960a; 1960b). In most
cases 150 to 200 grains, of the types included in the pollen sum, were counted per
sample. These types are:
Gramineae
Acaena
Alnus
Podocarpus
Quercus
Hedyosmum
Myrica
StylocerasBocconia
Juglans
Weinmannia
Rapanea
Symplocos
DrymisIlex
Miconia
Urticaceae
Vallea
Dodonaea
The percentage of other plants was calculated on the basis of the sum alreadymentioned. The width of the diagram represents 100 percent of the species included
in the pollen sum. On the left are the trees (Quercus, Alnus, Podocarpus and the total
ofother forest elements )and on the right the elements ofopen vegetation (Gramineae,
Acaena).Some diagrams show excessively high percentages of Gramineae, due to
generally local factors, (as in the case ofsamples from peat bogs). As this makes inter-
pretation difficult, the zoning was achieved principally on the basis of the curves
of various elements not included in the pollen sum, rather than on the basis of the
diagram as a whole.
The results of our earlier investigations on Quaternary palynology in Colombia
were of course most useful for the present study. The zoning given here for the
Holocene is tentative in some diagrams. Due to many local factors such as those
observed in Diagrams VL-V, VL-VII and VL-VIII, in which Gramineae are
completely dominant because of local influences, such zoning is difficult, and inter-
pretation can only be achieved on the basis of the fluctuations in the rest of the curves
in relation to the other diagrams. This difficulty does not apply to the diagramsworked out on the basis of samples of lake sediments, and in this report we have
based the zoning for the the Holocene principally on these. The Late-Glacial presentsno great difficulties, e cept perhaps with Diagram VL-XI, which shows in its lower
part sediments very poor in pollen.In several of the diagrams of the higher sites, and in the lower (Late-Glacial)
parts of the others, the samples were so poor in pollen that, even after countingseveral slides, it was impossible to reach a statistically desirable minimum number
of grains. We have, nevertheless, put these spectra into the diagrams because in
general they fitted very well into the trends of the main general diagram.The number of grains included in the pollen sum is always mentioned with
each spectrum; this makes it possible to evaluate each of these spectra in the dia-
grams. For a correct interpretation of the pollen diagrams, some knowledge of the
present local pollen rain is of course most important. The only knowledge we have,
174 E. Gonzalez, Th. v. d. Hammen and R. F. Flint
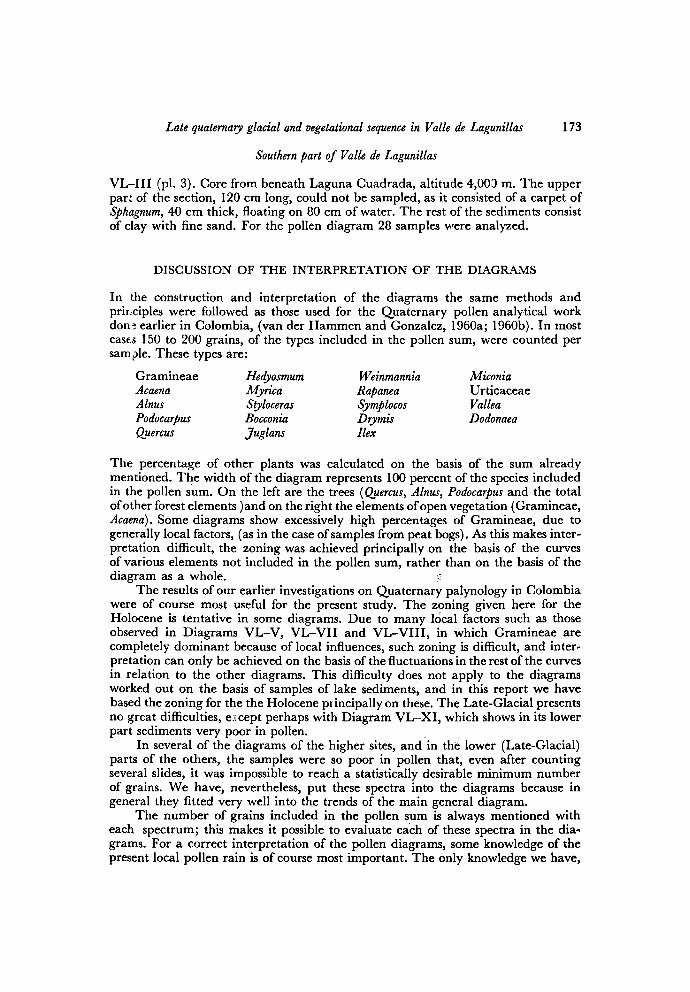
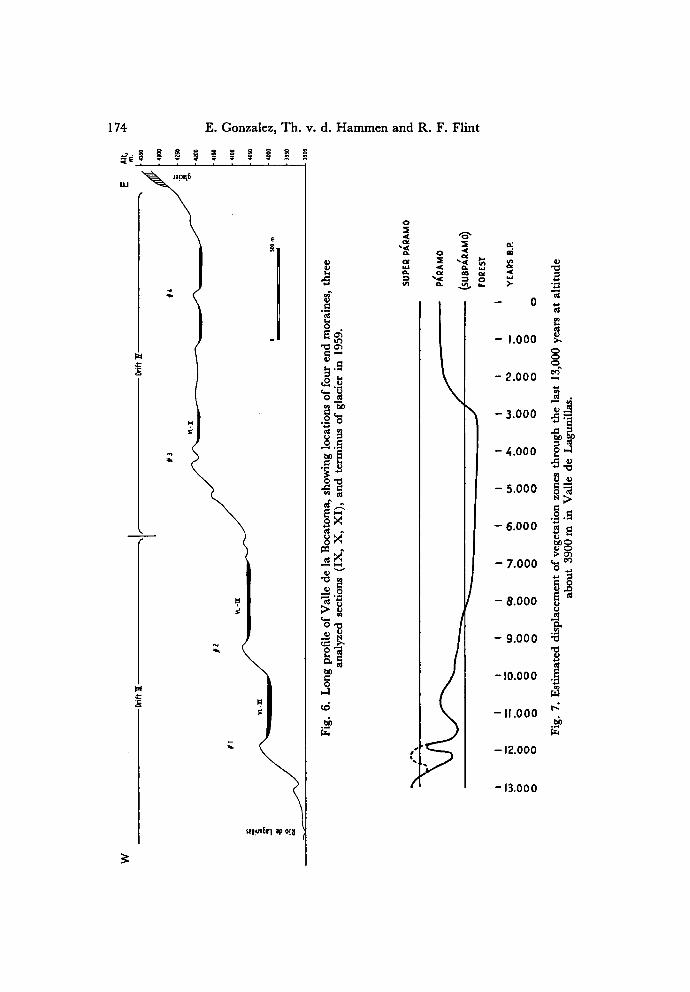
Fig.
6.
Long
profileof
Vallede
la
Bocatoma,showing
locationsof
four
end
moraines,three
analyzed
sections(IX,
X,
XI),
and
terminusof
glacierin
1959.
Fig.
7.
Estimated
displacementof
vegetationzones
throughthe
last
13,000
yearsat
altitude
about
3900m
in
Valle
de
Lagunillas.
175Late quaternary glacial and vegetational sequence in Valle de Lagunillas
has been derived from the uppermost spectra of the sediments of existing lakes.
In the paramo-zone proper, we have the uppermost spectra of Diagram VL-III
(alt. 4000 m), which shows a proportion ofabout 75 percent grass pollen to 25 percent
tree pollen. This seems to be quite normal in comparison with data from other
paramos (van der Hammen & Gonzalez, 1960 a, b; van der Hammen 1960, 1962),where the usual relation was 50 percent grass pollen to 50 percent tree pollen at sites
250 m above the upper limit of the forest.
Generally speaking we may say that within the paramo belt the percentage of
grass pollen increases and the percentage of tree pollen decreases, upward beyondthe upper limitof the forest. This tendency apparently no longer holds for the super-
paramo belt, including areas with very span e vegetation, on the youngest moraines.
We are forced to this conclusion by the uppermost spectra of Diagram X, from a
site at 4220 m within the area of Drift IV, which is almost devoid of vegetation. In
these spectra, the percentage of tree pollen (from lower altitudes) is as high as
75 percent, and the grass pollen as low as 25 percent, whereas pollen density is
very low.
This phenomenon, known also from other high mountain areas, such as the
Alps, may be explained in the following way. In the regions above the upper forest
limit the pollen rain contains a "background" of blown up or air-lifted tree pollenfrom lower levels. The absolute quantity of this pollen decreases with the altitude.
In the pollen spectra the percentage of this tree pollen is diminished by the great
quantity of locally produced herb pollen. But when the local herb-vegetation is
lacking, at greater altitudes and on very young moraines, and the local herb pollen
production is very low, the "background" of tree pollen dominates in the pollen
rain, and the pollen spectra show a high tree pollen percentage combined with low
pollen densities. Similar spectra are found in the lowermost part of Diagram VL-V
and Diagram VL-III, representing the earlier Late-Glacial. It will be clear that these
parts of the diagrams reflect the most unfavourable climatic conditions and that a
successive rise of the Gramineae pollen percentage indicates an amelioration of the
climate. Hence the interpretation of the Late-Glacial diagrams from altitudes
around 4000 m is complicated, as for instance a rise of the Gramineae curve mayhave been caused by either an amelioration or a deteriorationof climate.
It is clear then that for the Holocene our interpretation of the diagrams is
"normal" (because we know the vegetation belts were formerly much higher than
now), with the exception of the diagram for the highest site (VL-X). The inter-
pretation given above is illustrated by Figure 7, a curve showing fluctuations of the
vegetation belts at an altitude of 3900 m, based on Diagrams VL-III and VL-V.
Because of the difficulties mentioned above, two slightly different interpretationsare possible for the time prior to 11,800 B.P. Before about 11,800 B.P. resp. 12,300,fluctuation was between superparamo and paramo; after that time it was between
paramo and forest. The two interpretations are indicated by the continuous and
the broken lines in fig. 7.
ZONING AND CORRELATION OF THE DIAGRAMS
General remarks
In this paper the pollen-stratigraphic zones and zone numbers (I to VIII) are the
same as those already established for the Late-Glacial and Holocene ofthe Cordillera
Oriental (van der Hammen and Gonzalez, 1960b). Difficulties were encountered
because our localities lie between the very high altitudes of 3900 and 4200 m. The
E. Gonzalez, Th. v. d. Hammen and R. F. Flint176
area has a poor vegetation cover, the number ofpollen grains in many ofthe samplesis very low, and in the spectra from very high localities the percentage oftree pollenblown up complicates the picture. In the peat deposits there is also the problem of
overrepresentation of local pollen (Gramineae, etc.). Because of these difficulties,determination of zone boundaries is not in all cases precise. Nevertheless we think
our interpretation has a good degree of probability.Table 1 shows the local zones into which we have classified the pollen sequence.
The depths at which the zone boundaries occur in each section analyzed are also
shown.
Correlation of the Cocuy diagrams with those from the Bogota area was
accomplished principally by comparison of the main diagrams and separate curves
from Laguna de la America (Paramo de Palacio; van der Hammen and Gonzalez,
1960b) with Diagram VL-III from Laguna Quadrada in Valle de Lagunillas. The
latter diagram then became the main reference diagram for the other diagrams of
the Cocuy area; the principal reference diagram for Zone I is of course our well-
dated Diagram VI-V.
Zone I
Zone I is especially well developed in the diagram of section VL-V. That diagrammakes possible a clear subdivision of Zone I into three subzones (la, lb, Ic). As
mentioned earlier, Zone I shows partly reversal of the visual diagram picture as
related to climate: during Zone-I time the changes of vegetation that occurred in
our area apparently involved only the openparamo belt and the superparamo, where
the pollen rain is greatly influenced by the airlift ofpollen grains from anemophilous
trees of the Andean forest belt below.
Zone I is characterized, at 4000 m or lower, by high percentages of Acaena (at
higher altitudes high percentages of Acaena may be present also in younger zones).
Zone la shows superparamo conditions, Zone lb and Ic paramo conditions. The
second part of zone lb could eventually be interpreted as representing superparamo
conditions, but this seems less probable to us. The two possibilities of interpretation
are shown in fig. 7. It is not easy to establish exactly the upper limit of Zone I in
Diagram VL-V. This is due to the fact that sedimentation was rapid, so that the
diagram is much longer than normal. (Similar conditions are shown, for Zone I,
in the very long section of Gulickshof, Netherlands; van der Hammen, 1951). The
boundary between I and II should be placed somewhere between 390 and 365 cm.
Comparison of the various curves with those ofthe diagram from Paramo de Palacio
(Compositae, Acaena, Alnus, ”Valeriana” stenophylla, etc.) strongly suggests that it may
be at 365 cm. We know from other diagrams (Paramo de Palacio etc.) that amelior-
ation ofclimate was considerablein I/II time(compare also the complete deglaciation
inferred from physical evidence, p. 167, item 5). In Diagram VL-V the position of
boundary I/II is visually obscured, because lake sediments were replaced by peat,
formed from a vegetation with abundant local production of Gramineae pollen that
soon reached values of nearly 100 percent. From the C14 dates it is clear that Sub-
zone lb corresponds with the Boiling Interstadial and Subzone Ic with the Earlier
Dryas Zone in Europe. Zone I as a wholecorresponds then to the Older Dryas of
Europe.in Diagram VL-III the picture is much less clear, because of the small pollen
content of the samples and the relatively long stratigraphic distance between them.
Nevertheless, by comparison of the curves, it is possible to recognize Zone I as a
whole, and probably also Subzones la, lb, and Ic.
Late quaternary glacial and vegetational sequence in Valle de Lagunillas 177
Zone II
The interval 540 to 460 cm in diagram VL-III can be correlated, on the basis of
the various curves, with the interval 326 to 365 (-390?) cm in Diagram VL-V. The
two intervals correlate in the same way with Zone II of the Paramo de Palacio
sequence ( van der Hammen and Gonzalez, 1960a). There is a relative minimum
in the Compositae curve (and a high top of Compositae just before or at the base of
the zone), a rise of the Isoetes curve at the beginning, and a rise of the curves of
Hedyosmum and Urticaceae.
Typical for the Cocuy area is apparently a decline of the Podocarpus curve at
the boundary between Zones II and III; the same may prove to be the case for the
rise of the Caryophyllaceae curve at that boundary.The C14 dates from Zone II (VL-V), combinedwith calculations based on rate
of sedimentation, show that that zone should correspond in age with the Alleröd
interstadial in Europe. We arrived at the same conclusion for Zone II in Paramo
de Palacio (van der Hammen and Gonzalez, 1961b), where, also, the vegetation
changes closely parallel those in Europe.
Zone III
The interval 460 to 425 cm in Diagram VL-III corresponds approximately to the
interval 326 to 258 cm in Diagram VL-V, and with Zone III from Paramo de
Palacio. The general picture of the main diagram (VL-III) is not so clear as in the
diagram from Paramo de Palacio, but several curves show very good correspondence.At the upper limitofthe zone the Hedyosmum curve decreases, and there is a maximum
ofthe Urticaceae curve. In the Cocuy area this upper limit also marks the beginningof the continuous Plantago curve, and a considerable rise of the Cyperaceae curve.
There is also a marked isolated maximum of Cyperaceae in the middleof Zone III.
There is little doubt that the lowermost part of Diagram VL-XI corresponds with
the end of Zone III. One C 14 date in the middle of this zone (from section VL-V)confirms the correspondence ofZone III with the Younger Dryas unit ofthe European
sequence. A similar correspondence was suggested for the diagram from Paramo de
Palacio (van der Hammen and Gonzalez, 1961b).
Zone IV
The interval 425 to 390 (-370) cm in Diagram VL-III corresponds with the interval
258 (-267) to 222 cm in VL-V. It seems also to correspond with the interval 155
to about 140 cm in VL-VIII. Near the top there is a maximumof Plantago, followed
by a rise of Umbelliferae and Lycopodium. There is also a small minimum of Alnus.
Although it is not possible to correlate directly with the diagram from Paramo de
Palacio, it is probable that the interval corresponds with Zone IV in that diagram.The C 14 dates from 232-252 cm in SectionVL-V and from 150-155 cm in Section
VL-VIII seem to confirm this opinion. The uppermost 110 cm of the diagram for
VL-XI correspond probably to Zone IV. This interpretation of the diagram is
confirmed by the relatively high Hedyosmum percentage, a rising curve of the Com-
positae, and tops of the curves of several spores (compare Jamesonia and Monolete
psil. in VL-V).
E. Gonzalez,Th. v. d. Hammen and R. F. Flint178
Zones V and VI
The interval 390 (-370) to 300 cm in Section VL-111, and the corresponding inter-
vals in the other diagrams (tab. 1), are characterized at the top by decline of the
Urticaceaeand rise ofHedyosmum. The top of the interval, therefore, corresponds with
the boundary between Zones VI and VII in the diagram of Paramo de Palacio.
Accordingly it is likely that the interval as a whole corresponds with Zones V and VI.
One can not indicate with certainty the boundary between the two zones in the
Cocuy diagrams. The boundary could be represented by the local rise of Lycopodiumin the middleofour interval. At the boundary VI /VII there is also locally a minimum
of Compositae, a maximum ofLycopodium and of several types of Trilete spores, and
a rise of Cyperaceae.Within the interval there are two C 14 dates, which confirm its interpretation as
including Zones V and VI. They are, respectively, sample Col. 56 (GrN-3504) from
Section VL-VIII, and sample Col. 53 (GrN-3598 and GrN-4003) from Section
VL-V. The lowermost part of Diagram VL-IX (330 to 270 cm) also belongs to the
upper part of the interval that includes Zones V and VI.
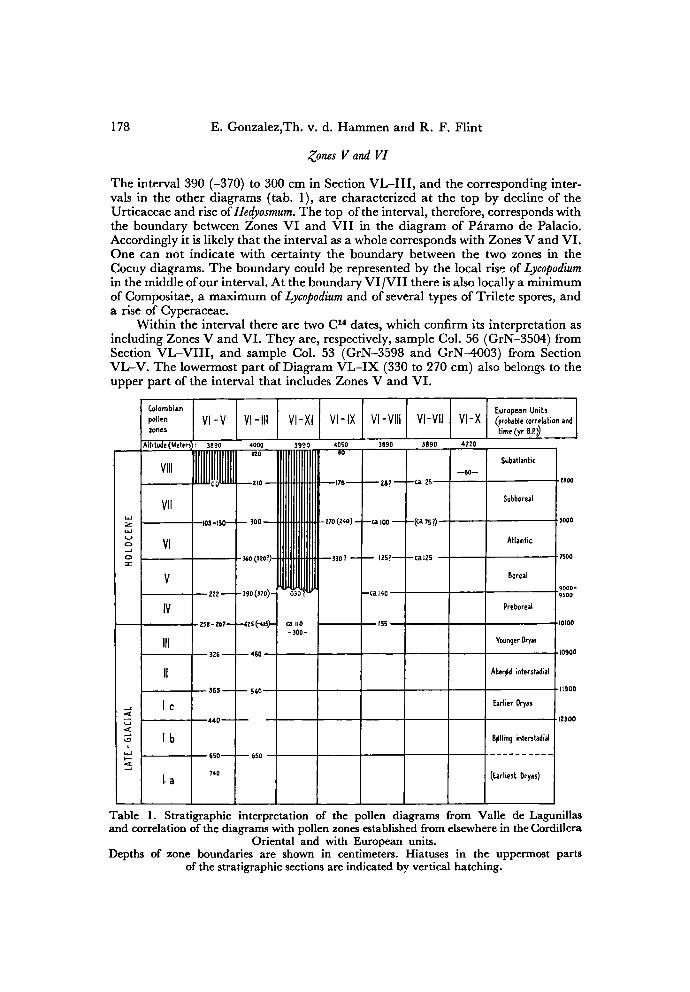
Table 1. Stratigraphic interpretation of the pollen diagrams from Valle de Lagunillasand correlation of the diagrams with pollen zones established from elsewhere in the Cordillera
Oriental and with European units.
Depths of zone boundaries are shown in centimeters. Hiatuses in the uppermost parts
of the stratigraphic sections are indicated by vertical hatching.
Colombian
pollen
zones
vi-v VI-III VI-XI VI-IX VI-VIII VI -VII vi-xEuropean Units
Late quaternary glacial and vegetational sequence in Valle de Lagunillas 179
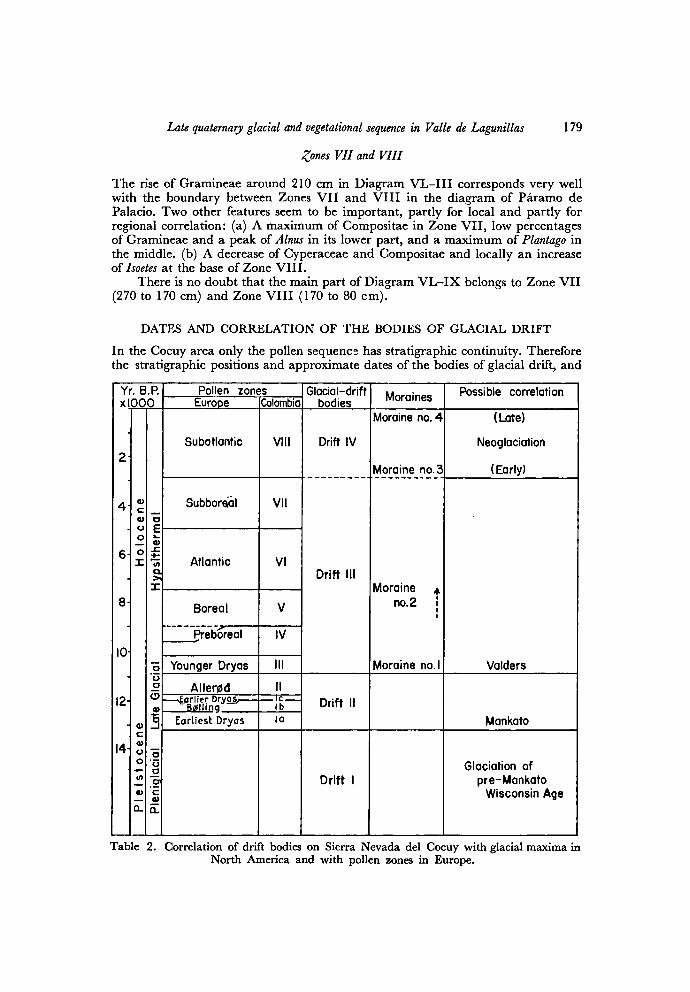
Zones VII and VIII
The rise of Gramineae around 210 cm in Diagram VL-III corresponds very well
with the boundary between Zones VII and VIII in the diagram of Paramo de
Palacio. Two other features seem to be important, partly for local and partly for
regional correlation: (a) A maximum of Compositae in Zone VII, low percentages
of Gramineae and a peak of Alnus in its lower part, and a maximum of Plantago in
the middle, (b) A decrease of Cyperaceae and Compositae and locally an increase
of Isoetes at the base of Zone VIII.
There is no doubt that the main part of Diagram VL-IX belongs to Zone VII
(270 to 170 cm) and Zone VIII (170 to 80 cm).
DATES AND CORRELATION OF THE BODIES OF GLACIAL DRIFT
In the Cocuy area only the pollen sequenc; has stratigraphic continuity. Therefore
the stratigraphic positions and approximate dates of the bodies of glacial drift, and
Table 2. Correlation of drift bodies on Sierra Nevada del Cocuy with glacial maxima in
North America and with pollen zones in Europe.
Y '. B.P. Pollen zones Glacial-drift
bodiesMoraines
Possible correlation
xlOC Europe Colombia
2
4-
6-
8-
10
12-
14
0)
c
<u
o
o
o
X
Q)
C
0>
o
o
w
»i
CL
O
Ek_
<u
-C
�;
Q.
>.
X
o
o
D
O
V
o
o
o
er
a>
CL
Subatlontic VIII Drift IV
Moraine no. 4
Moraine no. 3
(Late)
Neoglaciation
(Early)
Subboraial VII
Drift III
Moraine a
no.2i
i
Moraine no. 1 Valders
Atlantic VI
Boreal V
Preboreal IV
Younger Dryas III
Allerizid II
Drift II
Mankato
K
Bóllinq lb
Earliest Dryas la
Drift 1
Glaciation of
pre-MankatoWisconsin Age
E. Gonzalez, Th. v. d. Hammen and R. F. Flint180
certain end moraines, are known only in relation to the dated pollen sequence. With
the proposed interpretations of the pollen diagrams and with the C 14 dates, it is
possible to approximate the ages of the drift bodies and of some end moraines, and
to correlate therelated glaciations with North American or European glaciations
(tab. 2). There is striking climatic similarity and contemporaneity between the Late-
Glacial succession in the Cocuy area and that of Europe. The contemporaneity of
the Boiling Interstadial and the Earlier Dryas unit with our Subzones lb and Ic
seems, for instance, to be proved by Diagram VL-V and by the series of C 14 dates.
Sections III and V both start around the transitionof Subzone la into Subzone
lb (tab. 1). The base of Section III directly overlies glacial boulders, and the base
of Section V consists of sandy "varves", which become coarser downward. These
facts make it probable that sedimentation in the two lakes represented by these
sections started immediately after retreat of the glacier that deposited Drift II. The
dateofretreat was shortly before 12,320 ± 100 B.P. (GrN-3247). Hence we conclude
that Drift II was formed shortly before the Boiling Interstadial in the narrow sense
— that is, during Earliest Dryas time. Drift II seems to correspond in age with the
Mankato Drift in the United States, the data of the maximum ofwhich is believed
to be around 12,500 to 13,000 B.P.
Sections XI and IX immediately overlie Drift III. Section XI, situated upstreamfrom end moraine no. 1 (fig. 3), starts apparently at the very end of Zone III with
"varves", whereas the upper part of the section corresponds to Zone IV. These facts
strongly suggest that the glacier responsible for building end moraine no. 1, a part
of Drift III, retired from the downstream part of Valle de la Bocatoma at the end
of Younger Dryas time, close to the beginning of the Holocene. Hence probably at
least the outer part of Drift III was deposited during Younger Dryas time, and if
so it probably corresponds to the Valders Drift in central United States.
Section IX, situated immediately upstream from end moraine no. 2 (fig. 3),has its base somewhere below the boundary between Pollen Zones VI and VII,most likely near the base of Zone VI. Therefore, using the dates in Table 1, we can
assign end moraine no. 2, somewhat older than the base of the section, a minimum
date of around 7500 years B.P. That minimum date would not bar correlation of
the moraine with the Cochrane readvance (8000 years B.P. or older, presumably a
Boreal event) in the eastern part of North America, and its correlatives, with various
local names, in the North American Cordillera. But it does not exclude other possibil-
ities, such as the Larstig moraine in the Alps (Mayr, 1964). There is not enoughevidence to enable us to correlate moraine no. 2 with any feature elsewehere.
The locality of Section X is about 1500 meters downstream from the 1959
position of the glacier terminus. The section, only 65 cm thick, directly overlies
Drift IV, and probably began to accumulate soon after deglaciation had uncovered
the locality. We can reasonably compare its thickness with the thicknesses of the
other sections, especially VL-IX, the nearest one. In the latter section, as also in
Sections VL-III and the one at Paramo de Palacio, the thickness of the sediments
within Pollen Zone VIII is 90 cm. We know that the sedimentationof Zone VIII
began about 2800 years ago (tab. 1; van der Hammen & Gonzalez, 1960b, 1962).
Ninety centimeters of sediment deposited in 2800 years implies an average rate of
accumulationof 1 cm/31 yr. Ifwe reasonably assume a similar rate for Section VL-X,the age of the base of that section would be 2015 years. On this basis one can infer
that Drift IV as a whole correlates with part or all of the drift of the (post-Hypsi-thermal) Neoglaciation in Cordilleran North America. One could suggest, further,that end moraine no. 3 (fig. 3) might correspond to the glacier maxima dated in the
Alps as 900 to 300 BC (Mayr, 1964). End moraine no. 4 might then correlate with
Late quaternary glacial and vegetational sequence in Valle de Lagunillas 181
the widely recognized maximum dated at about 150 to about 300 B.P. These
suggestions as to possible correlationofmoraines 3 and 4 are no more than reasonable
guesses, controlled only within wide limits. The suggested correlations of Drifts II
and III are more closely controlled and seem to us to be very probable.
Although the sequence of climatic changes indicated both by the pollen record
and by the glacial drifts agrees very well with the northern European sequence,
nothing in our area, not even end moraine no. 2, clearly matches the Cochrane
Glaciation. A Cochrane correlative could be buried beneath Drift IV, as is possiblealso at localities in Alaska (Heusser and Marcus, 1964, p. 77; fig. 1) and Yukon
Territory (George Denton, oral communication, 1965).On the other hand the pollen diagram ofZone V reveals no evidenceof climatic
cooling, as is likewise the case with Zone V in the published diagrams from other
localities in Colombia and from Europe. The absence of indications of cooling is
remarkable in view ofgeologic evidence of the Cochrane glacial readvance in North
America, an event whose C 14 dates imply correlation with the Boreal.
End moraines in the Valle de Lagunillas are so abundant and so well defined
that those pertaining to Drift II were compared with the end moraines pertainingto the Mankato Drift in southeastern South Dakota (Flint, 1955, p.l 1; fig. 31). In
general pattern the two series are similar, consisting of lobate end moraines having
conspicuous lateral elements, each with several subsidiary terminal elements. In the
absence of close control by C 14 dates, however, it was not found possible to make
more detailed comparison than that between Drift II as a whole and the Mankato
Drift as a whole.
The dates ofthe drift bodies imply that rates ofweathering and rates of develop-ment ofa vegetation cover have been very slow since the area began to be deglaciated.In the 12,000 years since the Drift II glaciation and even in the 18,000 years, more
or less, since Drift I time (if Drift I is assumed to be equivalent to the classical
Wisconsin maximum in North America), very little weathering has occurred and
vegetation has formed only a very discontinuous ground cover.
However, these slow rates of development have been influenced strongly by (1)
prevailing low temperatures and (2) relative stability, both physical and chemical,
of quartz, the nearly unique constituentof the bedrock and the drift. In consequence
these rates can not properly be compared with those in other areas in which the
relevant conditions have been different.
E. Gonzalez, Th. v. d. Hammen and R. F. Flint182
REFERENCES
Cuatrecasas, José, 1943. Observaciones geobotanicas en Colombia: Madrid, Museo
Nacional de Ciencias Naturales, Trabajos, Serie Botanica, v. 27, p. 1-144.
1958. Aspectos de la vegetación natural de Colombia: Acad. Colombiana de Ciencias
Exactas, Fisicas y Naturales, Revista, v. 10, p. 221-264.
Flint, R. F., 1955. Pleistocene geology of eastern South Dakota: U.S. Geol. Survey Prof.
Paper 262, 173 p.
Hammen, Thomas van der, 1957. A new interpretation of the Pleniglacial stratigraphical
sequencein Middle and Western Europe: Geologie en Mijnbouw, n.s., v. 19, p.
493-498.
Hammen, Thomas van der, 1960. Deposición reciente de polen atmosférico en la Sabana de
Bogota y alrededores: Bogota, Boletin Geológico, v. 7, p. 183-194.
1960. Deposición reciente de polen atmosférico en la Sabana de Bogota y alrededores:
Bogota, Boletin Geológico, v. 7, p. 183-194.
and Gonzalez, Enrique, 1960. Upper Pleistocene and Holocene climate and vegeta-
ation of the "Sabana de Bogota" (Colombia, South America): Leidse Geol. Mededel.,
v. 25, p. 261-315.
1960b. Holocene and Late Glacial climate and vegetation of Paramo de Palacio
(Eastern Cordillera, Colombia, South America): Geologie en Mijnbouw, n.s.,
v. 22, p. 737-745.
1962. Palinologia de la region de "Laguna de los Bobos". Historia de su clima, vegeta-
ción y agricultura durante los ültimos 5.000 afios: Acad. Colombiana de Ciencias
Exactas, Fisicas y Naturales, Revista, v. 11, p. 359-361.
Heusser, C. J., and Marcus, M. G., 1964. Historical variations of Lemon Creek Glacier,
Alaska, and their relationship to the climatic record: Journ. Glaciology, v. 5, no. 37,
p. 77-86.
Kraus, Erwin, and Hammen, Thomas van der, 1960. Las expediciones de glaciologia del
A.G.I, a las Sierras Nevadas de Santa Marta y El Cocuy: Comité Nac. del Aflo
Geofisico, Instituto Geografico Agustin Codazzi, Colombia, Sud America, 9p.
Mayr, Franz, 1964. Untersuchungen und Folgen der Klima- und Gletscherschwankungenseit dem Beginn der postglazialen Warmezeit. Zeitschrift für Geomorphologie, Neue