1 Leisure Shopping Behavior and Recreational Retailing: A Symbiotic Analysis of Marketplace Strategy and Consumer Response (Keywords: Recreational retailing, shopping behavior, store loyalty, customer value, production attractiveness, brand variability) Rajagopal Working Paper 06/2006 JEL Codes: C51, C91, D12, M31 Department of Marketing, Business Division Monterrey Institute of Technology and Higher Education (ITESM) Mexico City Campus, Mexico DF 14380 July 2006
Transcript
1
Leisure Shopping Behavior and Recreational Retailing:
A Symbiotic Analysis of Marketplace Strategy and Consumer Response
(Keywords: Recreational retailing, shopping behavior, store loyalty, customer value, production attractiveness, brand variability)
Rajagopal
Working Paper 06/2006
JEL Codes: C51, C91, D12, M31
Department of Marketing, Business Division
Monterrey Institute of Technology and Higher Education (ITESM)
Mexico City Campus, Mexico DF 14380
July 2006
2
Contact:
Rajagopal, Ph.D.
Professor, Department of Marketing Business Division, Monterrey Institute of Technology and Higher Education, ITESM Mexico City Campus, 222, Calle del Puente, Tlalpan Mexico DF 14380 E-mail: [email protected] , [email protected] Homepage: http://www.geocities.com/prof_rajagopal/homepage.html
Acknowledgement
Author acknowledges the support provided by Ananya Rajagopal, student of Industrial and Systems Engineering of ITESM, Mexico City Campus in data collection, translation of questionnaires in Spanish language, computing the data and developing Tables in this study.
location, promotional activities and merchandising policy are associated during the leisure
shopping. The consumer shopping behavior during leisure is largely driven by the recreational
infrastructure as a competitive strategy of retailers. This also helps developing store loyalty,
innovative concern and the high perceived customer values whereby individuals experience
enjoyment from shopping. This paper aims to analyze through an empirical investigation in
Mexico, drivers which influence consumers’ leisure shopping behavior and measure customer
value in terms of levels of satisfaction. The study also focuses on the role of in-store recreational
infrastructure and retail selling strategies in swaying the leisure shopping and driving store
loyalty.
4
Leisure Shopping Behavior and Recreational Retailing:
A Symbiotic Analysis of Marketplace Strategy and Consumer Response
Practically consumers react favorably to leisure sales campaigns of goods and services. However,
customer value plays a decisive role in the shopping process. It may be argued that individual
consumer behavior to a buying option is a function of preference for the option, whether it is a
considered option or any choice constraint is personally directed. The consumer response is also
affected by search associated with making a decision on leisure shopping in reference to the
innovative products, retailers’ sales campaign creating the recreational impulse etc. The retail
self-service stores which largely operate in chain are based on the rationale of touch, feel and pick
which provides consumers a wide range of options to make buying decisions. The in-stores
promotions and do it yourself (DIY) opportunities constitute the major motivation for the buyers
and also support their decision making process. Motivational forces are commonly accepted to
have a key influencing role in the explanation of shopping behavior. Personal shopping motives,
values and perceived shopping alternatives are often considered independent inputs into a choice
model, it is argued that shopping motives influence the perception of retail store attributes as well
as the attitude towards retail stores (Morschett et.al, 2005). In the process of making buying
decisions in the leisure shopping, the purchase acceleration and product trial are found to be the
two most influential variables.
This paper attempts to analyze behavioral drivers which influence consumers’ leisure shopping
behavior and measure customers’ value through empirical investigation in Mexico. The role of
in-store recreational infrastructure and retail selling strategies in swaying the leisure shopping
and driving store loyalty are also discussed in the paper. The discussion in the paper also
5
demonstrates as how self-service stores internalize externalities through both an efficient
allocation and pricing of space and an efficient allocation of incentives across stores.
Recreational Shopping
The recreational shopping is a recent strategy of retailers and innovative concern, the course of
action whereby individuals experience enjoyment from shopping. It is argued that recreational
shopping needs to be acknowledged as a multifaceted activity that may be performed in various
ways and embody different types of consumer meanings. It is also argued that there is a need to
focus more on the influence of retail environments on individuals engaged in recreational
shopping (Backstrom, 2006). It has been observed in some studies that consumers who intend to
do shopping in short notice, generally lean towards impulsive or compulsive buying behavior.
Consumer compulsive buying is an important area of inquiry in consumer behavior research. The
importance of studying compulsive buying stems, in part, from its nature as a negative aspect of
consumer behavior. Specifically, exploring negative consumption phenomena could provide
modified or new perspectives for the study of positive consumption behaviors. Moreover,
research on negative facets of consumption is useful because it can potentially contribute to
society's wellbeing, an important criterion for usefulness of any research. Gender, consumers'
tendency to make unplanned purchases, and their tendency to buy products not on shopping lists,
serve to predict compulsive tendencies (Shoham and Brencic, 2003). There is an increasing
importance of planned, centrally managed and enclosed shopping centers in the retailing sector
with focus on eight underlying factors of varying character are important to customer satisfaction.
These are selection, atmosphere, convenience, sales people, refreshments, location, promotional
activities and merchandising policy. Furthermore, this study investigates whether sources of
6
satisfaction differ in importance with respect to gender and age, generally two important
variables for retail segmentation (Anselmsson, 2006).
It has been observed that retailers often do not recognize that what influences customer
satisfaction is not the same as what engenders store loyalty, and consequently do not allocate
scarce resources systematically among tactics influencing one or the other. Unless they are
vigilant to changing consumer behavior patterns, they will not be able to isolate in their strategy
the elements of the retail mix that could insulate their loyal customers from responding to
competitors' special offers (Miranda et al, 2005). Another study confirms that there exist
significant differences in consumer perceptions of hedonic shopping value across several retail
brands. Therefore, customers appear to recognize the uniqueness among the in-store experience
that retailers are working hard to achieve. This delivery of value, then, seems to be an effective
source of differentiation. The results of this study indicate that retailers using a "store as the
brand" strategy should continue to invest in creating a specific, unique shopping experience for
their target customer. However, retailers should always be mindful that regardless of the
excitement and fun delivered in the shopping experience, consumers appear to expect utility
including the right merchandise, in the right place, at the right time, and at the right price
(Carpenter et al, 2005). Another study while discussing potential difficulties in implementing a
relationship marketing strategy within a retail context observed that the factors including
hairdressers, opticians, and recreation centers are more likely to operate in conditions that give
greater support to the development of relationship marketing in the supermarkets (Pressey and
Mathews, 2000).
7
Retail Locations and Shopping Preferences
The location preferences often dominate the consumer decision making in retail buying in general
and leisure buying during the vacations. Retailers in both urban and suburban locations attempt
to both attract out shoppers and retain their hold on shoppers in their immediate trade areas. To
this end, it is incumbent on retailers to understand the dynamics underlying consumers’ decisions
to shop in urban versus suburban retailing settings. This is especially important for consumer
shopping behavior during the December holiday selling season which accounts for a
disproportionate share of many retailers’ yearly revenues and profits (Smith, 1999). Lack of
appropriate location is a major source of dissatisfaction. This creates negative emotions in terms
of: merchandise choice, visual merchandising, store environment, sales personnel attitude,
pricing policies and promotional activities. These factors are the very foundations of consumer
satisfaction and the evidence of consumer dissatisfaction resulting in avoidance behavior should
be particularly worrying for retailers, given that they are operating in an increasingly competitive
and saturated fashion environment (Otieno et al, 2005). The leisure shopping behavior for the
foreign and domestic consumers is also associated with tourist locations in the region. Some
theoretical frameworks state that domestic tourists can be segmented, as a result of different
demographic/social characteristics, into groups with different requirements for product attributes
and services. These groups can have different levels of satisfaction/dissatisfaction with the retail
product and retailing servicing provision, resulting in separate dimensions of retailing
satisfaction. These dimensions of satisfaction effectively become a measure of retailing
performance, as perceived by domestic tourists, which can indicate directions for change in the
retailing provision, so as to increase satisfaction, and ultimately, domestic tourist visitation
( Turner and Reisinger, 2001).
8
Another study discusses a perceived shopping utility framework for analyzing the impact of retail
price format on store choice. It has been observed that retail price format, in turn, determines
three key performances measure including number of shoppers, number of trips, and average
spending per trip. When choosing a store, consumers evaluate both the fixed and variable utilities
of shopping, however, the fixed utility does not vary from trip to trip whereas the variable utility
depends on the size and composition of the shopping list (Tang et al, 2001). The retail point of
purchase (PoP) is the time and place at which all the elements of a sale, the consumer, the money,
and the product converge. Marketers must make the most of the communications possibilities at
this point to increase their sales. The retailers may address the various interests of the consumers
through effective displays, designing appropriate retail ergonomics, easily identifiable packaging,
making shopping exciting, and focusing in-store advertising media on the PoP (Quelch and
Cannon-Bonventre, 1983). The leisure shopping behavior is also influenced significantly by the
cross cultural factors in reference to location of the retail stores, PoP displays and customer
psychodynamics. A Six Typology Model of Cultural Fracture identified six cluster groups using
combinations of three types of cultural fracture experience: symbolic fracture, emotional fracture
and functional fracture. The six clusters vary by consumer behaviour and possession use. The
ethno-consumerist study illustrates that consumer-related activities and possession used together
provide an important resource that visitors can use to make sense of crossing-culture experiences.
Product categories, retail formats and shopping conventions are also implicated in experiences of
cultural fracture to varying degrees (Davies and Fitchett, 2004).
9
Store Loyalty and Shopping Behavior
It has been observed that the store loyalty and private label shopping are closely associated.
While the marketing phenomenon of the private-label grocery brand has been studied in
considerable depth in Western countries, particularly in Britain and major parts of Europe, this
has not been the case in developing Far Eastern markets, perhaps in part because the established
retail formats have not been conducive to their growth (Shannon and Mandhachitara, 2005).
Hence, it has been argued that supermarket managers should develop strategies to ensure that
staff are recruited and trained in such a fashion as to enable them to engage in satisfying
interactions with older customers. Other areas requiring attention include thorough product
stocking to prevent over-reaching and the provision of well-designed and functioning shopping
aids in the form of trolleys and baskets. Also the issues of concern to supermarket managers and
other retailers include merchandise quality, adequate access to and within the store, in-store
amenities, home delivery options, seniors' discounts, and avoiding extended queuing. These
service aspects appear to be of particular importance to older shoppers (Pettigrew et al, 2005).
In retail self-service store where consumer exercises in-store brand options, both service and
merchandise quality exert significant influence on store performance, measured by sales growth
and customer growth, and their impact is mediated by customer satisfaction. The liberal
environment of the self-service stores for merchandise decisions, service quality and learning
about competitive brands are the major attributes of retail self-service stores (Babakus et.al,
2004). The retail self-service stores offer an environment of three distinct dimensions of emotions
e.g. pleasantness, arousal and dominance. The retail self-service stores operate on a market size
effect and a price cutting effect (Konishi, 1999). Duncan and Moriarty (1998) point out that each
10
of the new generation marketing approaches includes customer focused, market-driven, outside-
in, one-to-one marketing, data-driven marketing, relationship marketing, integrated marketing,
and integrated marketing communications that emphasize two-way communication through better
listening to customers and the idea that communication before, during and after transactions can
build or destroy important brand relationships. Research on deferred decision making presents an
interesting counter to studies investigating response to the removal of an option to choose. Works
by both Tversky and Shafir (1992) and Dhar (1997) describes situations in which people may
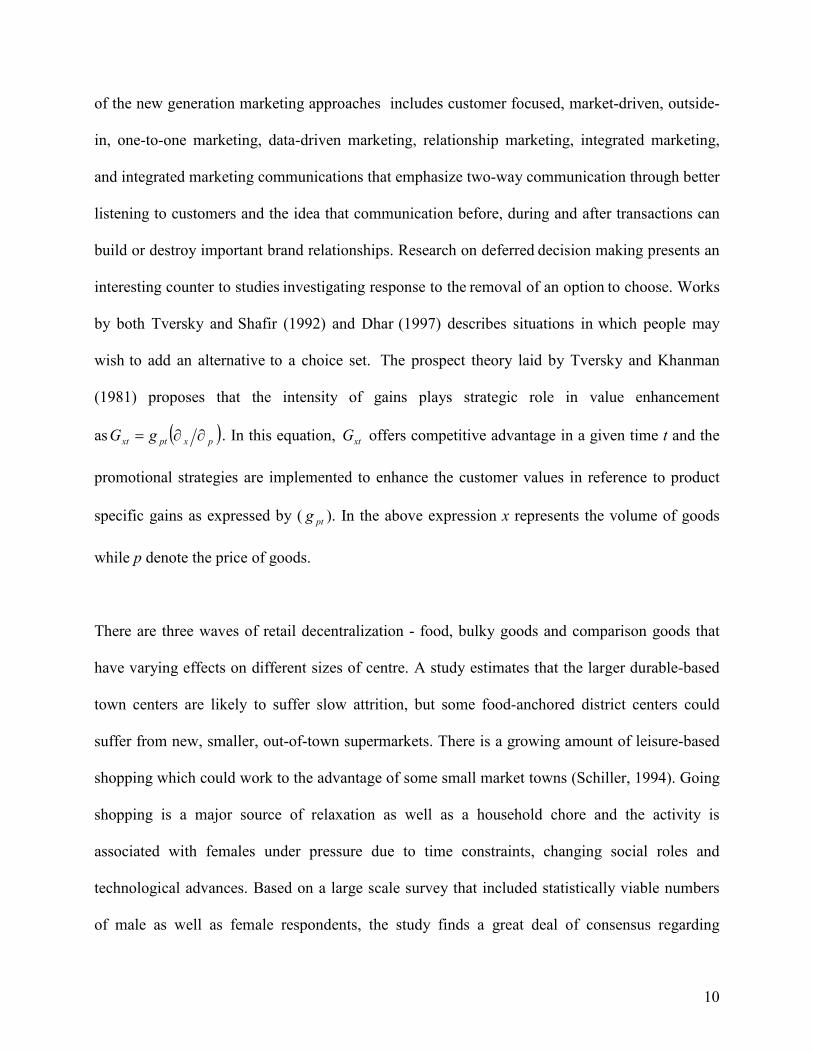
wish to add an alternative to a choice set. The prospect theory laid by Tversky and Khanman
(1981) proposes that the intensity of gains plays strategic role in value enhancement
as ( )pxptxt gG ∂∂= . In this equation, xtG offers competitive advantage in a given time t and the
promotional strategies are implemented to enhance the customer values in reference to product
specific gains as expressed by ( ptg ). In the above expression x represents the volume of goods
while p denote the price of goods.
There are three waves of retail decentralization - food, bulky goods and comparison goods that
have varying effects on different sizes of centre. A study estimates that the larger durable-based
town centers are likely to suffer slow attrition, but some food-anchored district centers could
suffer from new, smaller, out-of-town supermarkets. There is a growing amount of leisure-based
shopping which could work to the advantage of some small market towns (Schiller, 1994). Going
shopping is a major source of relaxation as well as a household chore and the activity is
associated with females under pressure due to time constraints, changing social roles and
technological advances. Based on a large scale survey that included statistically viable numbers
of male as well as female respondents, the study finds a great deal of consensus regarding
11
shopping responsibility among the sampled households. Although men are playing a significant
role in shopping activities, particularly shopping for household groceries, shopping remains a
gender sensitive activity but it is not considered to be an unpleasure activity. It has been
observed that the supermarket is likely to be the retail setting where the changing roles will make
the greatest impact (Dholakia, 1999).
Theoretical Construct
Ofek Elie (2002) discussed that the values of product and service are not always the same and are
subject to value life cycle that governs the customer preferences in the long-run. If customers
prefer the product and service for N periods with Q as value perceived by the customer, the value
may be determined as Q>N, where Q and N both are exogenous variables. If every customer
receives higher perceived values for each of his buying, the value added product q ≥ Q, where ‘q’
refers to the change in the quality brought by innovation or up-graded technology. The customer
may refrain from buying the products if q ≤ Q, that does not influence his buying decisions.
However, a strong referral ‘R’ may lead to influence the customer values, with an advantage
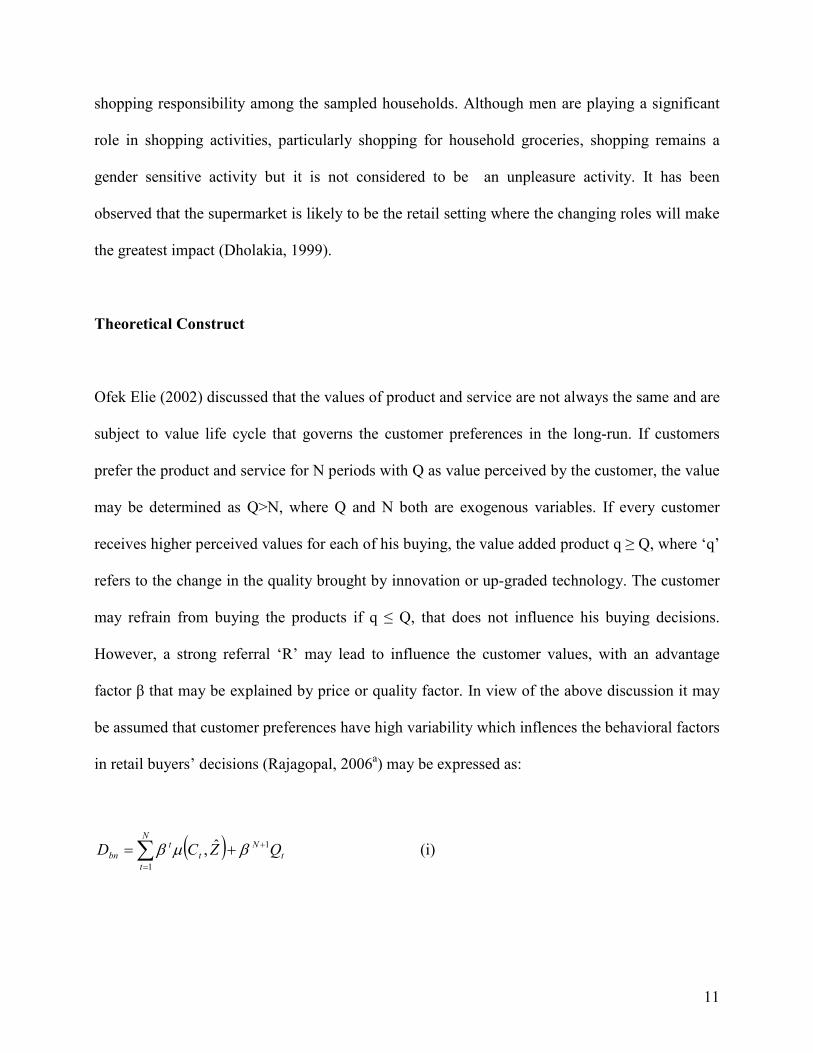
factor β that may be explained by price or quality factor. In view of the above discussion it may
be assumed that customer preferences have high variability which inflences the behavioral factors
in retail buyers’ decisions (Rajagopal, 2006a) may be expressed as:
( )∑=
++=N
t
t
N
t
t
bn QZCD1
1ˆ, βµβ (i)
12
Where, bnD is expressed as initial buying decision of the customers, Ct represents consumption,
Z is a vector of customer attributes (viz. preferential variables) and Qt is the value perceived by
the customer.
A customer behavior is largely derived from the customer value and it has a dynamic attribute
that plays a key role in buying and is an intangible factor to be considered in all marketing and
selling functions. The value equation for customer satisfaction may be expressed as a function of
all value drivers wherein each driver contains the parameters that directly or indirectly offer
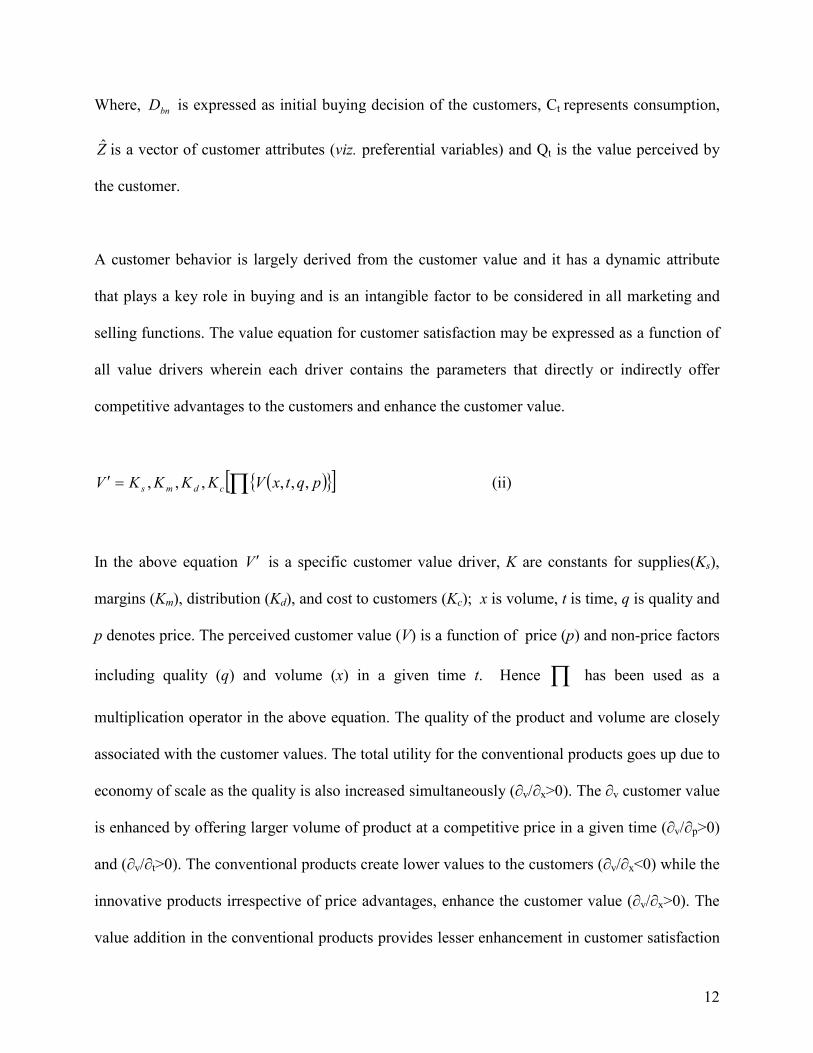
competitive advantages to the customers and enhance the customer value.
( ){ }[ ]∏=′ pqtxVKKKKV cdms ,,,,,, (ii)
In the above equation V ′ is a specific customer value driver, K are constants for supplies(Ks),
margins (Km), distribution (Kd), and cost to customers (Kc); x is volume, t is time, q is quality and
p denotes price. The perceived customer value (V) is a function of price (p) and non-price factors
including quality (q) and volume (x) in a given time t. Hence ∏ has been used as a
multiplication operator in the above equation. The quality of the product and volume are closely
associated with the customer values. The total utility for the conventional products goes up due to
economy of scale as the quality is also increased simultaneously (∂v/∂x>0). The ∂v customer value
is enhanced by offering larger volume of product at a competitive price in a given time (∂v/∂p>0)
and (∂v/∂t>0). The conventional products create lower values to the customers (∂v/∂x<0) while the
innovative products irrespective of price advantages, enhance the customer value (∂v/∂x>0). The
value addition in the conventional products provides lesser enhancement in customer satisfaction
13
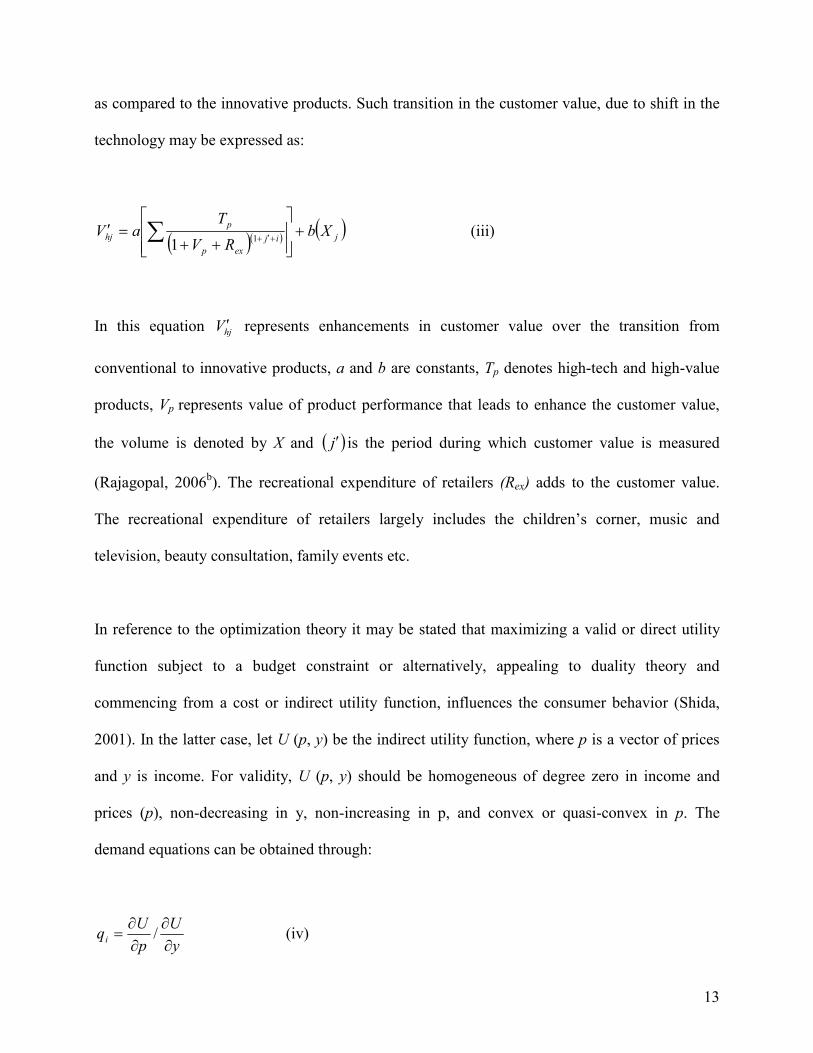
as compared to the innovative products. Such transition in the customer value, due to shift in the
technology may be expressed as:
( )( ) ( )jij
exp
p
hj XbRV
TaV +
++=′ ∑ +′+1
1 (iii)
In this equation hjV ′ represents enhancements in customer value over the transition from
conventional to innovative products, a and b are constants, Tp denotes high-tech and high-value
products, Vp represents value of product performance that leads to enhance the customer value,
the volume is denoted by X and ( )j′ is the period during which customer value is measured
(Rajagopal, 2006b). The recreational expenditure of retailers (Rex) adds to the customer value.
The recreational expenditure of retailers largely includes the children’s corner, music and
television, beauty consultation, family events etc.
In reference to the optimization theory it may be stated that maximizing a valid or direct utility
function subject to a budget constraint or alternatively, appealing to duality theory and
commencing from a cost or indirect utility function, influences the consumer behavior (Shida,
2001). In the latter case, let U (p, y) be the indirect utility function, where p is a vector of prices
and y is income. For validity, U (p, y) should be homogeneous of degree zero in income and
prices (p), non-decreasing in y, non-increasing in p, and convex or quasi-convex in p. The
demand equations can be obtained through:
y
U
p
Uqi ∂
∂∂∂
= / (iv)
14
In the above equation ( )iq is denoted as demand for the product. The simple utility function
derived by generic consumer behavior may be understood as
=P
yU wherein P may be
expressed as geometric mean of prices which derives dynamic consumer behavior with the
variability factor of competitive advantage ( )jα over the products in a given retail environment
and ( )vr is the vector adding to unity over the n commodities. Such condition of consumer
behavior may be explained as:
( )∑= vj pP rloglog α (v)
The above equation helps in deriving the demand equation as below:
vii
iy
qpw rα=
= (vi)
Wherein, ( )iw represents the individual expenditure limits or disposable income for buying the
products. However, these equations limit consumer responses to changes in prices, competitive
advantages or disposable income to maintaining consistency in buying behavior due to change in
the elasticity of aforesaid variables. While such a consumption pattern might sometimes be
plausible, it adds to the asymmetric behavior of consumers in retail buying.
15
The propensity of consumption during the leisure season may be largely determined as a driver of
retail attractions in terms of appealing sales promotions and availability of innovative products.
The choice of the consumers thus is established by the propensity of consumption in the array of
innovative products in the retail stores. The propensity of consumption of buyers may be denoted
by [ ]∞−= 0lim
...njtθθ , which is measured in reference to frequency of buying ( )∞−0limθ from a jth store
in a given time t. The choice pattern of buyers in shopping during holiday season may be derived
as:
{ }
{ }∑=
=n
j
j
i
i
t
ttx
1
)(exp
)(exp)(
βθ
βθ (vii)
In the above equation{ })(txi is the probability of buying strategy i at time t. In the exponential
expression β represents the degree of value optimization on buying. At higher levels of β
consumer will have higher probabilities of buying with increased propensity. In view of the
above attributes of the customers towards making decision on buying during leisure, additional
sales during the leisures (September-December) over other months has been derived as:
( ) ( )nn
ztzt mmnvsmmmmvsLSe ...14321 +−+++= (viii)
Wherein, LSe represents leisure sales excess, vs and nvs denote leisure sales and non-leisure sales
respectively. The period in months are indicated by m while product categories frequently bought
by the customers is denoted by z in the above equation in reference to the time t. The sales
16
volume is considered as real per-capita retail sales. The purpose of non-leisure sales (nvs) for the
lean months other than September-December in a year to deflate leisure sales is to control for the
overall size of the market potential in the study region. Hence, the leisure sales effect has been
derived using the equation as expressed below:
ztn
ztztm
nvsvsvs
−= (ix)
Further, to measure the effect of the length of the shopping season on holiday sales, substituting
with equation (viii), the following equation has been derived.
( ){ } zttz
n
ztzzzt XmmmmvsyLSe εβα ++++++= 4321 (x)
Study Design
Framework of Hypothesis
Consumption has often been dichotomized in terms of its functional-hedonic nature and has been
closely associated with the level of satisfaction leading to determine the customer value influence
(Wakefield and Inman, 2003). As the new products are introduced, a firm may routinely pass
these costs on to consumers resulting into high prices. As discussed above, clearance sales act as
stimulus to consumers who are likely to elicit a positive response. Further, it is predicted that the
17
magnitude of this positive response will be proportional to the value of an option to select the
discount sales alternative. Hence, it may be hypothesized as:
H1: Consumers in their leisure shopping behavior are influenced by the product
attractiveness and higher store-loyalty, irrespective of higher prices than normal
shopping conditions.
Shugan (1980) argues that the attribute rating covariance between two alternatives-low price
brand switching and high price branded products without discounts-leads to differences in the
difficulty to choose. However, the difficulty in buying decisions increases during the leisure
shopping overruling the brand loyalty, which may pose a threat on customer satisfaction in the
long run. Sometimes a negative response to the leisure time sale is expected, independent of any
short-run price advantages at the retail outlets. In view of such intrinsic consumer behavior in
retail buying during the leisure, the hypothesis may be delineated as:
H2: Sales offered to the consumers during leisure increase the difficulty of making a
product selection due to the randomness of variety-seeking behavior which leads
to lower levels of customer satisfaction.
In the most optimistic settings, such value creation is observed to generate new customers for
new products in view of the customer relationship and value management strategies of the firm
(Ganesh, et.al., 2000). Epstein (1998) analyzes the case of clearance sales in a store selling more
than selling one commodity at discounted price. Conditions and rules of thumb are shown in
which it is optimal to increase the price of one product while decreasing the price of another. A
18
linear demand model and a numerical example are presented, showing that the price of one
product decreases while the price of the other product may increase or decrease in different
periods. The following hypothesis is therefore framed:
H3: The intention of the consumers towards buying the products during leisure
shopping depends on the attractiveness of the offer and the level of perceived
conflicts in decision process.
The magnitude of consumer response to clearance sales is weighed in two ways- evaluative and
behavioral. Firstly, consumer satisfaction with the decision process leading to the expected level
of satisfaction is measured, which may be expressed as one of a number of cognitive and affective
responses that may result from a clearance sale. The retail sales performance and the customer
value approach are conceptually and methodically analogous. The satisfaction is the customer's
perception of the value received in a transaction or relationship and it helps in making re-
patronage decisions on the basis of their predictions concerning the value of a future product.
Sampling
In order to measure the consumer behavior on leisure shopping through the model discussed in
the paper a preliminary investigation has been conducted in 11 retail self-service stores in the
Mexico City including 4 departmental stores and 2 self service stores on construction material
spread over 3 retails locations. The September- December has been identified as leisure period as
the early sales for the Christmas in from September in Mexico. The data was collected on 64
variables closely related towards influencing the customer values. These variables include
19
various perspectives of customer satisfaction and corporate strategies applied in positioning the
new products for gaining optimal market share and aggregate returns on consumptions. The
information pertaining to the broad frame of 64 variables were subjected to decision filters at
various levels of customers’ decision making process and major variables were chosen for data
analysis. The data sets were categorized into the relational and economic variables selected for
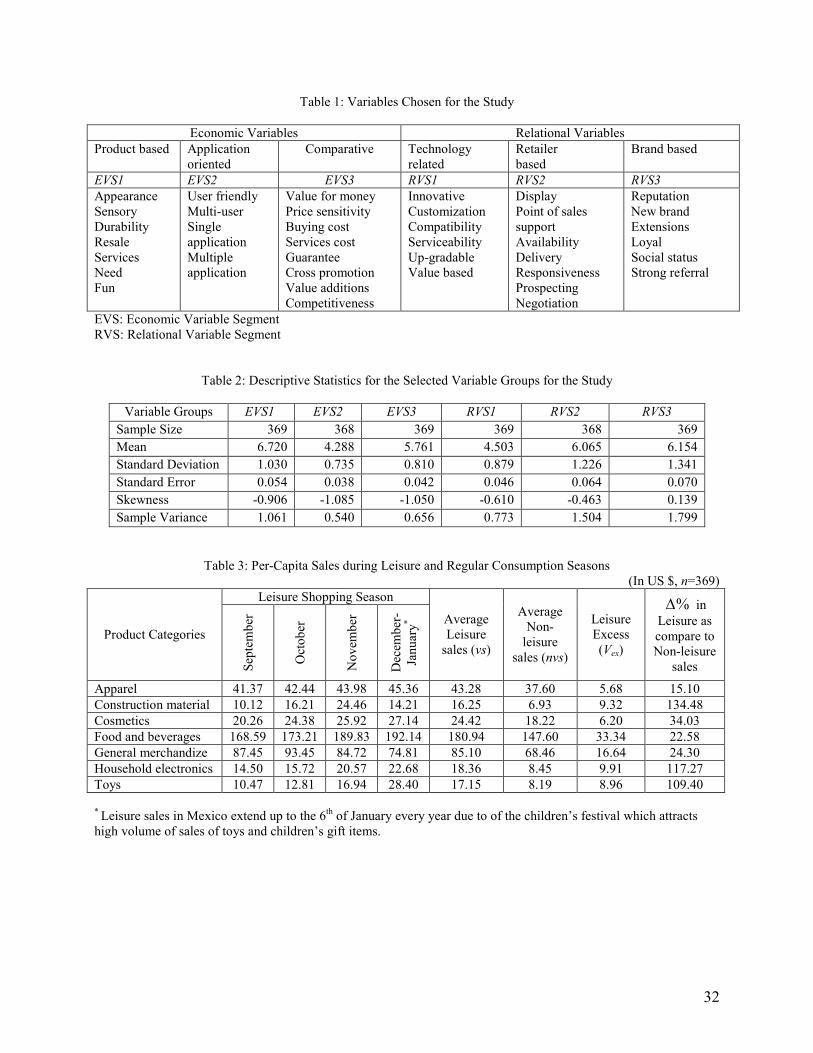
the study as illustrated in Table 1
//Table 1 about here//
Data has been collected from 400 respondents purposively selected, who were involved in
shopping at chosen retail self-service stores in Mexico City, administering a semi-structured
questionnaire. The data of 31 respondents were omitted from the data analysis due to paucity of
information. The respondents were involved in buying the new products introduced in food and
beverages, apparel, cosmetics, toys, general merchandize, construction material and household
electronics. In all, the data of 369 observations were analyzed in the study.
Variables of the Study and Data Analysis
The data was collected on the variables closely related towards influencing the customer values.
These variables include various perspectives of customer satisfaction and marketing strategies
applied in reference to the positioning, attaining high brand value and improving the market share
of the innovative and attractive products displayed during leisure season for gaining optimal
market share and aggregate returns on consumptions. The results on the analysis of the selected
20
variables refer to the short term customer values associated with the new products introduced in
the retail market by the firms for competitive gains. The descriptive statistics of the data sets for
the variable segments used in the analysis of the study is exhibited in Table 2.
//Table 2 about here//
Results and Discussion
The festive shopping seasons in Mexico have fixed dates. Of these Christmas is the major leisure
shopping season which attracts voluminous buying as compared to the shopping on the Mother’s
and Father’s days. The leisure shopping attractions begin in September and rise to peak during
November-December, augmenting the consumer’s opportunities to make impulsive purchases for
both gifts and items for personal use. The Christmas shopping season is slightly extended till the
first week of January as the January 6th every year is the ‘Twelfth night’ or ‘Epiphany’ when
children receive gifts from three wise men or magic kings as observed in the social customs in
Mexico. The analysis of the data shows that the leisure shopping typically varies from 25 to 32
days in Mexico, which tends to increase about 4.5 percent of leisure-related sales per person for
each additional day of shopping. The implied difference between the leisure-led shopping and
non-leisure based shopping (regular) is 22.4 percent additional spending over regular spending on
an average. The product categories that are largely affected by the leisure consumption are food
and beverages, apparel, cosmetics, toys, general merchandize, construction material and
household electronics. Since the festive dates are fixed, there is a ‘habit formation’ element in the
leisure shopping behavior. The longer the consumers are attracted by the advertisement,
innovation, technology, perception drives through ‘do it yourself’ (DIY) tools and store
21
attractions, the more spendthrift they become. Under such conditions it has been observed that
during leisure an additional shopping expenditure of 5.4 percent per capita is made over the
regular shopping. The categorical expenditure on shopping during the leisure period observed
during the study is exhibited in Table 3.
//Table 3 about here//
It may be observed from the above Table that the per capita sales tend to increase in all product
categories, though marginal in case of apparel as compared to other products, during the leisure
shopping season. The sales during this season are stimulated by the store attractions through
recreations as well as economic and relational advantages on products and services. Such
consumption behavior is consistent with the Laibson’s cue theory which explains pairings of a
cue and a consumption good eventually create cue-based complementarities as the presence of
the cue raises the marginal utility derived from consumption (Laibson, 2001). Behavior that
arises from this model is characterized by endogenous cue sensitivities, costly cue-management,
commitment, and cue-based spikes in impatience. The model is used to understand
addictive/habit-forming behaviors and marketing.
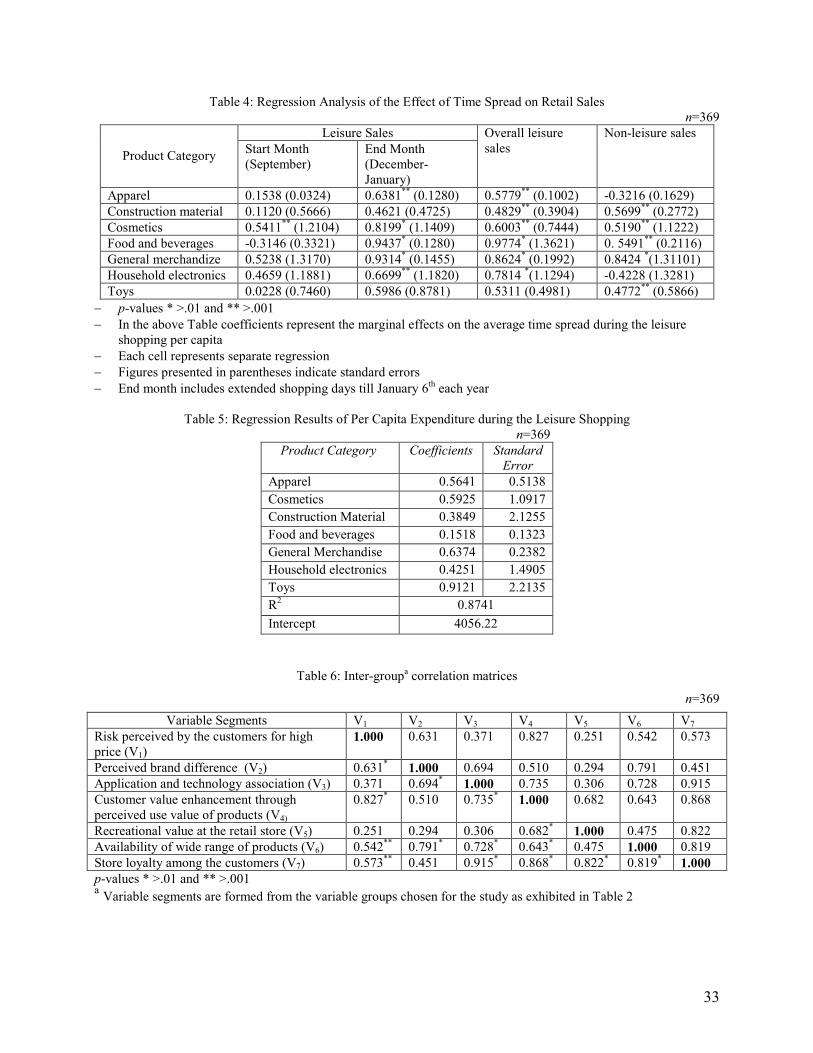
The leisure sales excess (LSex) has been derived using the regression model as explained in
equation (x). As anticipated, in December sales are the highest in all the product categories. It
may be seen from the Table 4 that each day of the shopping in the leisure period in Mexico adds
0.97 percent of sales in food and beverages, 0.60 percent in cosmetics and 0.53 percent in the
sales of toys. However, sales of apparel have been found slightly at a decline as compared to
other product categories.
22
//Table 4 and 5 about here//
In the above Table Col. 1 shows the effect of average shopping per day in the beginning month of
the leisure and Col 2 reveals the closing period of the leisure. These two columns have no control
variables while regressions in the Col 3 showing the average effect of sales in the leisure period
has the variable that include recreational expenditure of retail stores as a control variable. It has
also been observed during the study that the consumers operate within budget constraints and
often subtle their shopping agenda and keep their decisions in abeyance. While analyzing
respondents' views during the study, at times it appeared contradictory to the previously accepted
wisdom of buying behavior towards apparel which was largely leisure and pleasure orientated.
There have been many negative experiences observed during the study which left customers
unhappy and indecisive. However, the notable increase in sales has been found on food and
beverages during the leisure shopping as compared to regular buying pattern of the consumers. It
may be observed from the results exhibited in the Tables 3, 4 and 5 support the hypothesis H1.
//Table 6 about here//
The results of the correlation matrices indicate that there exists a lower degree correlation
between the risk perceived by the customers for high price and perceived brand difference
(V1,V2), application and technology association and perceived brand difference (V3,V2) and
perceived risk and company name (V1,V3). Similarly the variable of recreational value and
customer value (V5,V4), recreational value and store loyalty (V5,V7) and store loyalty and
availability of wide range of products (V7,V6) are also observed to have correlation of higher
23
degree. It may be observed from the above matrix that the coefficient has a maximum value of
0.915 which showed significant concern on multi-collinearity. The Eigen values have been
computed to estimate the shared variance between the respective optimally weighted canonical
variates of dependent and independent variables. The canonical correlations analysis has been
derived considering the set of dependent and independent variables representing the canonical
functions. The analysis of the data indicates that the first function (F1) has the highest Eigenvalue
(0.539) which accounts for 89.36 percent while the second function (F2) has shown relatively
smaller Eigenvalue (0.152) with 11.64 percent of the explained variance. The analysis reveals
that the canonical correlations for F1 and F2 are 0.637 and 0.174 respectively. Accordingly, it may
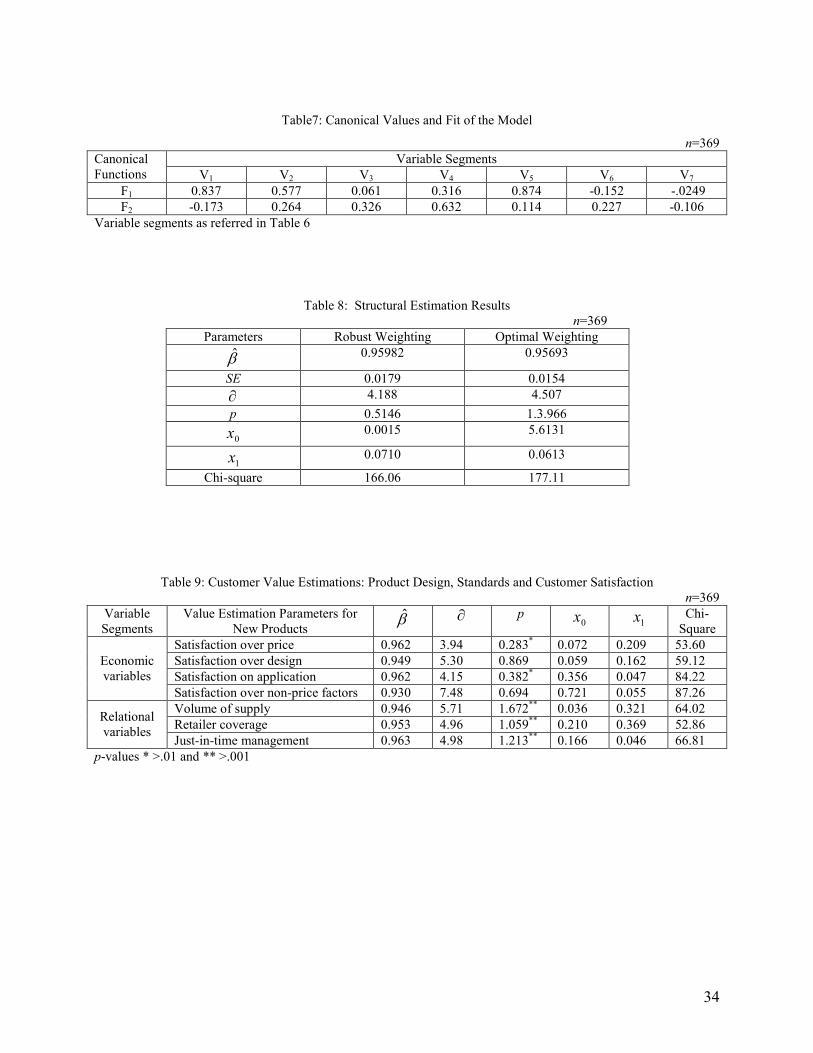
be stated that F1 is superior to F2. The Table 7 exhibits the standardized canonical coefficients of
discriminant functions and functions at group centroids.
//Table 7 about here//
The results show that the value of coefficients among the variable segments V1 and V2 are of
higher degree for canonical function F1 which describes that perceived risk and perceived brand
difference of these two variables are basically associated with the function. Similarly, the
company name and customer value variables are associated with the function F2 as the
coefficients show relatively higher values. In reference to the clusters of respondents, the segment
C1 which represents positive influence of brand name in consumers’ behavior of respondents
shows the highest value on function F1 while C2 represents the lowest value as the function F1 is
associated with perceived risk and perceived brand difference variables. Such results indicate that
higher perceived brand risk and brand difference may provide more confidence on the company
24
name while making decisions towards buying the products of an unfamiliar brand. Hence, the
results discussed in Tables 6 and 7 support the Hypothesis H2.
The perceived customer value ( )hjV ′ in reference to the product attractiveness and recreational
expenditure has been estimated as discussed in the theoretical construct referring equation (iii).
The result has been exhibited in Table 8. The estimations represent for all the observations of the
study and standard error has been calculated accordingly.
//Table 8 about here//
Data has been input to the linear equations of the model discussed in the paper. The analysis of
the empirical data is exhibited in the following Tables, wherein β represents the coefficient of
relative satisfaction of the customers, ∂ denotes the variability between the leisure- and non-
leisure sales, 0x represents the initial satisfaction delivered by the product in terms of economic
variables and 1x shows the customer satisfaction derived through the relational factors. In the
above Table the first column displays the results when the initial robust weighting matrix is
employed and the second column presents the results from optimal weighting matrix. The
standard error (SE) has been estimated with the adjusting parameters pp TV , and X as discussed
in the paper. The results showed that SE typically increases once the adjusted and calibrated
parameters 0x and 1x have accounted for symbiotic relationship between retailers and
consumers in reference to a given product and market conditions.
25
It has been observed during the study that initial consumption of the new product introduced in
the market remains high. However, the long term customer value is influenced by the price and
non- price factors associated with the product. The performances of the company in retailing
management of the product in terms of just-in-time supplies, display, point of sales approaches
and customer services also help in building the customer values for the product in a given market.
Table gap between the offering strategies of the new product in terms of product design and
standards and the customer expectation on economic and relational variables is exhibited in Table
9.
//Table 9 about here//
It may be observed from the analysis that the difference among the β , constant of relative
satisfaction for various customer and company related variables have been marginal in the study.
The p-values are also significant for most of the critical variables. This may indicate that the
perceived values acquired by the customers and corporate values associated with product
offerings match closely. The relational variables stand close to the economic variables, which
enhance the aggregate customer value for the product offered. Hence, it may be seen that the
results analyzed in Tables 5 and 6 are consistent with the hypothesis H3.
Managerial Implications
Consumer perceptions play a key role in the life cycle of a brand. The role varies according to the
stage in the life cycle, market situation and competitive scenario. It may be required for a
company to invest on appealing communication strategies for creating awareness on the
unfamiliar brands to influence the decision of consumers towards buying these brands they have
26
not tested before. The company may also need to consider emphasizing an integrated promotion
strategy for new brands in reference to attributes, awareness, trial, availability and repeat
(AATAR) principle. One of the challenges for the marketing manager of a firm is to incorporate
the preferences of the customer into the design of new products and services in order to maximize
the customer value. An augmented and sustainable customer value builds loyalty towards the
product and the brand. Systematically explored concepts in the field of customer value and
market driven approach towards new products would be beneficial for a company to derive long
term profit optimization strategy over the period. This needs careful attention and the application
of managerial judgment and experience to measure the value driven performance of the product
of the firm. The analysis of the variables analyzed in the study would help the managers develop
appropriate strategies to enhance the customer value for the new products and optimize the profit
of the firm. Appropriate promotional strategies considering the economic and relational variables
discussed in the study may be developed by the managers upon measuring the intensity of leisure
shopping and the scope of expanding the tenure of leisure shopping in view of optimizing
customer values and profit of the firm.
Managers of the retailing firms should link the leisure sales plans with the affordable fashions
and emerging solutions to common consumers. In fact the leisure sales are a mass marketing
arena with less focus on premium consumer segments. Under such conditions, lack of appropriate
merchandise is a major source of dissatisfaction. This creates negative emotions in terms of
merchandise choice, visual merchandising, store environment, sales personnel attitude, pricing
policies and promotional activities and these factors are the very foundations of consumer
satisfaction. On a tactical level, managers need to consider the optimum spread of customers on a
matrix of product attractiveness and market coverage. This needs careful attention and
27
application of managerial judgment and experience to measure the customer-value driven
performance of the retail stores considering the innovative recreational sales approaches, store
layouts, location issues of retail stores, shopping behavior and loyalty parameters of the
consumers. Managers of a firm may consider promoting the leisure shopping with the advent of
one-to-one marketing media, e.g. targeted direct mail or internet marketing; the opportunities to
develop customer relationship management campaigns are enhanced in such a way that it is now
both organizationally and economically feasible to support a substantially larger number of
marketing segments in a profitable manner.
Conclusion
In order to gain the returns in the long run on the leisure sales, firms may need to methodically
estimate the profitability associated thereof in terms of product attractiveness, volume of buying
and market share thereof while introducing the new products in a competitive market
environment. The dimensions of customer value and satisfaction effectively become a measure
of retailing performance, as perceived by leisure time shoppers, which can indicate directions for
change in the retailing strategy by offering more recreational infrastructure, extended working
hours, place for demonstrations and consumer education on the innovative and high technology
products and services. The paper discusses major factors affecting leisure shopping in reference
to recreational facilities, location of the store; shopping behavior and store loyalty are product
attributes and services, brand value, perceived values and price. It has been observed in the study
that the perceptions on price and brand differences have been the prime factors in making buying
decision for new brands among the consumers over the hidden factor of perceived risk. Since the
leisure shopping behavior is largely driven by store attractions, inter-personal influences and
28
comparative gains, consumers feel high risk averse and entangle in decision making in reference
to their perceived use values. The framework for measuring the customer values discussed in this
paper provides analytical dimensions for establishing the customer relationship by the firm and to
optimize its profit levels by gaining the competitive advantage in the short run.
Limitations of the Study
Like many other empirical studies this research might also have some limitations in reference to
sampling, data collection and generalization of the findings. The samples drawn for the study
may not be enough to generalize the study results. The questionnaires were translated in Spanish
for the respondents in Mexico which might have conveyed varied conceptual sense to some
extent. The open ended questions were answered by the Mexican respondents in Spanish and
sometimes transcription of the audio might have overlooked some issues. The study does not
indicate as how behavior control, price differentiation, and promotion design efficiency cause
changes in the consequences leading to leisure shopping behavior among the customers. However
to ensure that the data cover a wider spatial and temporal dimensions in the study region, data
should be cleansed and filtered with many variability factors affecting the consumer behavior
and retailer performance.
29
References
Anselmsson Johan (2006), Sources of Customer Satisfaction with Shopping Malls: A
Comprehensive Study of Different Customer Segments, The International Review of Retail, Distribution and Consumer Research, 16 (1), 115-138
Babakus Emin, Bienstock Carol C and Van Scotter James R (2004), “Linking Perceived Quality
and Customer Satisfaction to Store Traffic and Revenue Growth”, Decision Sciences, 35 (4), 713-737
Backstrom Kristina (2006), Understanding Recreational Shopping, The International Review of
Retail, Distribution and Consumer Research, 16 (2), 143-158 Carpenter Jason M, Moore Marguerite and Fairhurst Ann E (2005), Consumer Shopping Value
for Retail Brands, Journal of Fashion Marketing and Management, 9 (1), 45-53 Davies Andrea and Fitchett James A (2004), ‘Crossing culture’: A multi-method enquiry into
consumer behavior and the experience of cultural transition, Journal of Consumer Behavior, 3 (4), 315-330
Dhar, Ravi (1997), "Consumer Preference for a No-Choice Option," Journal of Consumer
Research, 24, 215-231. Dholakia R R (1999), Going shopping: key determinants of shopping behaviors and motivations,
International Journal of Retail & Distribution Management, 27 (4), 154-165 Duncan T and Moriarty S E (1998), “A Communication Based Marketing Model for Managing
Relationships”, Journal of Marketing, 62, 1-13 Epstein G S (1998), “Retail Pricing and Clearance Sales: The Multiple Product Case”, Journal of
Economics and Business, 50 (6), 551-563 Ganesh J, Arnold MJ and Reynolds KE (2000), “Understanding the Customer Base of Service
Providers: An Examination of the Difference between Switchers and Stayers”, Journal of Marketing, 64, 65-87
Konishi Hideo (1999), Concentration of Competing Retail Stores, Boston College, Working
Papers in Economics, No 447 Laibson David Issac (2001), A Cue Theory of Consumption, The Quarterly Journal of
Economics, 116 (1), 81-119 Miranda Mario, Konya Laszlo and Havira Inka (2005), Shopper’s Satisfaction Levels are not
only the Key to Store Loyalty, Marketing Intelligence and Planning, 23 (2), 220-232
30
Morschett, Dirk; Swoboda, Bernhard and Foscht, Thomas (2005), “Perception of Store Attributes and Overall Attitude towards Grocery Retailers: The Role of Shopping Motives”, The International Review of Retail, Distribution and Consumer Research, 15 (4), 423-447
Ofek Elie (2002), Customer Profitability and Lifetime Value, Harvard Business School, Note,
August, 1-9 (Publication reference 9-503-019) Otieno Rose, Harrow Chris and Lea-Greenwood Gaynor (2005), The unhappy shopper, a retail
experience: exploring fashion, fit and affordability, International Journal of Retail & Distribution Management, 33 (4), 298-309
Pettigrew Simone, Mizerski Katherine and Donovan Rober (2005), The Three Big Issues for
Older Super Market Shoppers, Journal of Consumer Marketing, 22 (6), 303-312 Pressey A D and Mathews B P (2000), Barriers to relationship marketing in consumer retailing,
Journal of Services Marketing, 14 (3), 272-285 Quelch John A, Cannon-Bonventre Kristina (1983), Better Marketing at the Point of Purchase,
Harvard Business Review, 162-169 Rajagopal (2006a), Measuring Customer Value Gaps: An Empirical Study in Mexican Retail
Markets, Economic Issues, 11(1), 19-40 Rajagopal (2006b), Measuring Customer Value and Market Dynamics for New Products of a
Firm: An Analytical Construct for Gaining Competitive Advantage, Global Business and Economics Review, 8 (3-4), 187-204
Schiller R (1994), Vitality and Viability: Challenge to the Town Centre, International Journal of
Retail & Distribution Management, 22 (6), 46-50 Shannon Randall and Mandhchitara Rujirutana (2005), Private Label Grocery Shopping Attitude
and Behavior: A Cross Cultural Study, Journal of Brand Management, 12 (6), 461-474 Shida M (2000), Fundamental Theorems of Morse Theory for Optimization on Manifolds with
Corners, Journal of Optimization Theory and Applications, 106 (3), 683-688 Shoham A and Brencis M M (2003), Compulsive Buying Behavior, Journal of Consumer
Marketing, 20 (2), 127-138 Shugan, Steven M. (1980), “The Cost of Thinking,” Journal of Consumer Research, 7,
September, 99-111 Smith M F (1999), Urban versus suburban consumers: a contrast in holiday shopping purchase
intentions and outshopping behavior, Journal of Consumer Marketing, 16(1), 58-73 Tang, Christopher S, David R. Bell and Teck-Hua Ho (2001), Store choice and shopping
behavior: How price format works, California Management Review, 43 (2), 57-74
31
Turner Lindsay W and Reisinger Yvette (2001), Shopping satisfaction for domestic tourists,
Journal of Retailing and Consumer Services, 8 (1), 15-27
Tversky, Amos and Eldar Shafir (1992), “Choice under Conflict: The Dynamics of Deferred Decision,” Psychological Science, 3, 358-361
Wakefield Kirk L and Inman Jeffrey J (2003), “Situational Price Sensitivity: The Role of
Consumption Occasion, Social Context and Income”, Journal of Retailing, 79 (4), 199-212
32
Table 1: Variables Chosen for the Study
Economic Variables Relational Variables
Product based Application oriented
Comparative
Technology related
Retailer based
Brand based
EVS1 EVS2 EVS3 RVS1 RVS2 RVS3
Appearance Sensory Durability Resale Services Need Fun
User friendly Multi-user Single application Multiple application
Value for money Price sensitivity Buying cost Services cost Guarantee Cross promotion Value additions Competitiveness
Innovative Customization Compatibility Serviceability Up-gradable Value based
Display Point of sales support Availability Delivery Responsiveness Prospecting Negotiation
Reputation New brand Extensions Loyal Social status Strong referral
* Leisure sales in Mexico extend up to the 6th of January every year due to of the children’s festival which attracts high volume of sales of toys and children’s gift items.
33
Table 4: Regression Analysis of the Effect of Time Spread on Retail Sales n=369