Number 325 + April 7, 2002 Leisure-Time Physical Activity Among Adults: United States, 1997–98 Charlotte A. Schoenborn, M.P.H., and Patricia M. Barnes, M.A., Division of Health Interview Statistics Abstract Objective—This report presents selected prevalence estimates for leisure-time physical activity among U.S. adults, using data from the 1997–98 National Health Interview Survey (NHIS). Methods—Data for the U.S. civilian noninstitutionalized population were collected using computer-assisted personal interviews (CAPI). A total of 68,556 interviews were completed by a sample of adults aged 18 years and over, with an overall response rate of 77.2%. NHIS questions on leisure-time physical activity, first asked in 1997, consisted of frequency and duration of light-moderate activity, frequency and duration of vigorous activity, and frequency of strengthening activity. Statistics shown in this report were age adjusted to the 2000 projected U.S. population. Results—About 6 in 10 adults (61.7%) engaged in at least some leisure-time physical activity, about 3 in 10 adults (30.6%) engaged in regular leisure-time physical activity, and about 2 in 10 adults (22.9%) engaged in any strengthening activities. Prevalence of leisure-time physical activity was higher for men than for women, declined with age, increased with education and income, and was lower for widowed adults than for adults in other marital status groups. White non-Hispanic adults (65.5%) and Asian/Pacific Islander non-Hispanic adults (61.8%) were more likely than black non-Hispanic adults (49.8%) and Hispanic adults (46.8%) to engage in at least some leisure-time physical activity. Adults living in the West and adults living in a metropolitan statistical area (MSA), but not in a central city, were more likely than their counterparts in other geographic locations to engage in at least some leisure-time physical activity. Keywords: leisure-time physical activity c exercise c strengthening c vigorous activity c moderate activity c National Health Interview Survey Introduction Leisure-time physical activity among adults has been the focus of public health efforts for many years. In the United States, cross-sectional studies of the association between physical activity and health date back to the 1960s (1), and longitudinal analyses have confirmed earlier findings of the health benefits of exercise (2–5). Canadian and European studies also have found evidence of an association between leisure-time physical activity and mortality and morbidity risk (6–8). Increasing overall participation and reducing sociodemographic disparities in leisure-time physical activity have been among the Nation’s health objectives since 1980 when the U.S. Department of Health and Human Services began tracking such health objectives (9–11). The first Surgeon General’s report on physical activity and health, issued in 1996, provided a comprehensive overview of issues related to the study of physical activity and health, including historical background, measurement issues, physiology of exercise, health consequences, and prevalence (12). Potential health consequences of physical inactivity cited in the report include hypertension, coronary heart disease, diabetes, obesity, osteoporosis, colon cancer, breast cancer, and depression. The National Health Interview Survey (NHIS), one of the major data collection systems of the National Center for Health Statistics of the Centers for Disease Control and Prevention, is a large population-based survey of the U.S. civilian noninstitutionalized population. Information on leisure-time physical activity among adults has been collected in the NHIS periodically since 1975 (13–23). When the National Health Interview Survey was redesigned in 1997, questions related to leisure-time physical activity were included in the basic annual core questionnaire for one randomly selected adult per family. The current NHIS questions about physical
Transcript
Number 325 + April 7, 2002
Leisure-Time Physical Activity Among Adults: United States, 1997–98
Charlotte A. Schoenborn, M.P.H., and Patricia M. Barnes, M.A., Division of Health Interview Statistics
Abstract
Objective—This report presents selected prevalence estimates for leisure-time physical activity among U.S. adults, using data from the 1997–98 National Health Interview Survey (NHIS).
Methods—Data for the U.S. civilian noninstitutionalized population were collected using computer-assisted personal interviews (CAPI). A total of 68,556 interviews were completed by a sample of adults aged 18 years and over, with an overall response rate of 77.2%. NHIS questions on leisure-time physical activity, first asked in 1997, consisted of frequency and duration of light-moderate activity, frequency and duration of vigorous activity, and frequency of strengthening activity. Statistics shown in this report were age adjusted to the 2000 projected U.S. population.
Results—About 6 in 10 adults (61.7%) engaged in at least some leisure-time physical activity, about 3 in 10 adults (30.6%) engaged in regular leisure-time physical activity, and about 2 in 10 adults (22.9%) engaged in any strengthening activities. Prevalence of leisure-time physical activity was higher for men than for women, declined with age, increased with education and income, and was lower for widowed adults than for adults in other marital status groups. White non-Hispanic adults (65.5%) and Asian/Pacific Islander non-Hispanic adults (61.8%) were more likely than black non-Hispanic adults (49.8%) and Hispanic adults (46.8%) to engage in at least some leisure-time physical activity. Adults living in the West and adults living in a metropolitan statistical area (MSA), but not in a central city, were more likely than their counterparts in other geographic locations to engage in at least some leisure-time physical activity.
Keywords: leisure-time physical activity c exercise c strengthening c vigorous activity c moderate activity c National Health Interview Survey
Introduction
Leisure-time physical activity among adults has been the focus of public health efforts for many years. In the United States, cross-sectional studies of the association between physical activity and health date back to the 1960s (1), and longitudinal analyses
have confirmed earlier findings of the health benefits of exercise (2–5). Canadian and European studies also have found evidence of an association between leisure-time physical activity and mortality and morbidity risk (6–8). Increasing overall participation and reducing sociodemographic disparities in leisure-time physical activity have been
among the Nation’s health objectives since 1980 when the U.S. Department of Health and Human Services began tracking such health objectives (9–11). The first Surgeon General’s report on physical activity and health, issued in 1996, provided a comprehensive overview of issues related to the study of physical activity and health, including historical background, measurement issues, physiology of exercise, health consequences, and prevalence (12). Potential health consequences of physical inactivity cited in the report include hypertension, coronary heart disease, diabetes, obesity, osteoporosis, colon cancer, breast cancer, and depression.
The National Health Interview Survey (NHIS), one of the major data collection systems of the National Center for Health Statistics of the Centers for Disease Control and Prevention, is a large population-based survey of the U.S. civilian noninstitutionalized population. Information on leisure-time physical activity among adults has been collected in the NHIS periodically since 1975 (13–23).
When the National Health Interview Survey was redesigned in 1997, questions related to leisure-time physical activity were included in the basic annual core questionnaire for one randomly selected adult per family. The current NHIS questions about physical
2 Advance Data No. 325 + April 7, 2002
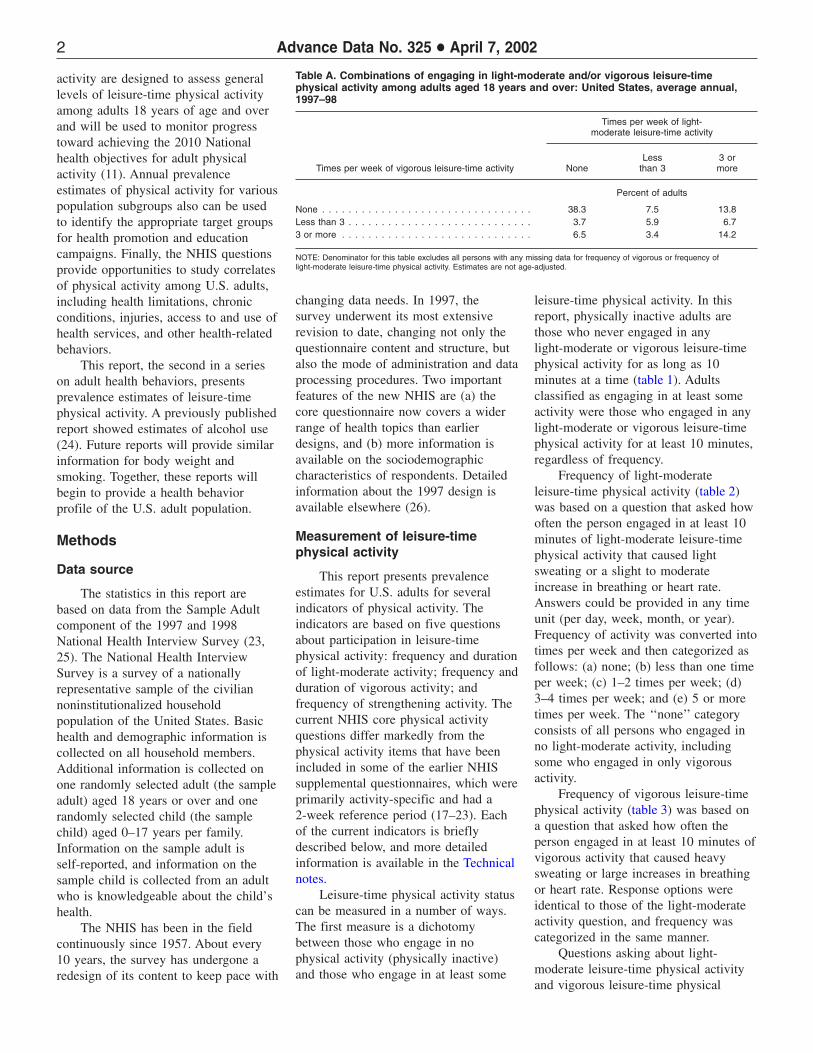
Table A. Combinations of engaging in light-moderate and/or vigorous leisure-time physical activity among adults aged 18 years and over: United States, average annual, 1997–98
Times per week of light-moderate leisure-time activity
Less 3 or Times per week of vigorous leisure-time activity None than 3 more
NOTE: Denominator for this table excludes all persons with any missing data for frequency of vigorous or frequency of light-moderate leisure-time physical activity. Estimates are not age-adjusted.
activity are designed to assess general levels of leisure-time physical activity among adults 18 years of age and over and will be used to monitor progress toward achieving the 2010 National health objectives for adult physical activity (11). Annual prevalence estimates of physical activity for various population subgroups also can be used to identify the appropriate target groups for health promotion and education campaigns. Finally, the NHIS questions provide opportunities to study correlates of physical activity among U.S. adults, including health limitations, chronic conditions, injuries, access to and use of health services, and other health-related behaviors.
This report, the second in a series on adult health behaviors, presents prevalence estimates of leisure-time physical activity. A previously published report showed estimates of alcohol use (24). Future reports will provide similar information for body weight and smoking. Together, these reports will begin to provide a health behavior profile of the U.S. adult population.
Methods
Data source
The statistics in this report are based on data from the Sample Adult component of the 1997 and 1998 National Health Interview Survey (23, 25). The National Health Interview Survey is a survey of a nationally representative sample of the civilian noninstitutionalized household population of the United States. Basic health and demographic information is collected on all household members. Additional information is collected on one randomly selected adult (the sample adult) aged 18 years or over and one randomly selected child (the sample child) aged 0–17 years per family. Information on the sample adult is self-reported, and information on the sample child is collected from an adult who is knowledgeable about the child’s health.
The NHIS has been in the field continuously since 1957. About every 10 years, the survey has undergone a redesign of its content to keep pace with
changing data needs. In 1997, the survey underwent its most extensive revision to date, changing not only the questionnaire content and structure, but also the mode of administration and data processing procedures. Two important features of the new NHIS are (a) the core questionnaire now covers a wider range of health topics than earlier designs, and (b) more information is available on the sociodemographic characteristics of respondents. Detailed information about the 1997 design is available elsewhere (26).
Measurement of leisure-time physical activity
This report presents prevalence estimates for U.S. adults for several indicators of physical activity. The indicators are based on five questions about participation in leisure-time physical activity: frequency and duration of light-moderate activity; frequency and duration of vigorous activity; and frequency of strengthening activity. The current NHIS core physical activity questions differ markedly from the physical activity items that have been included in some of the earlier NHIS supplemental questionnaires, which were primarily activity-specific and had a 2-week reference period (17–23). Each of the current indicators is briefly described below, and more detailed information is available in the Technical notes.
Leisure-time physical activity status can be measured in a number of ways. The first measure is a dichotomy between those who engage in no physical activity (physically inactive) and those who engage in at least some
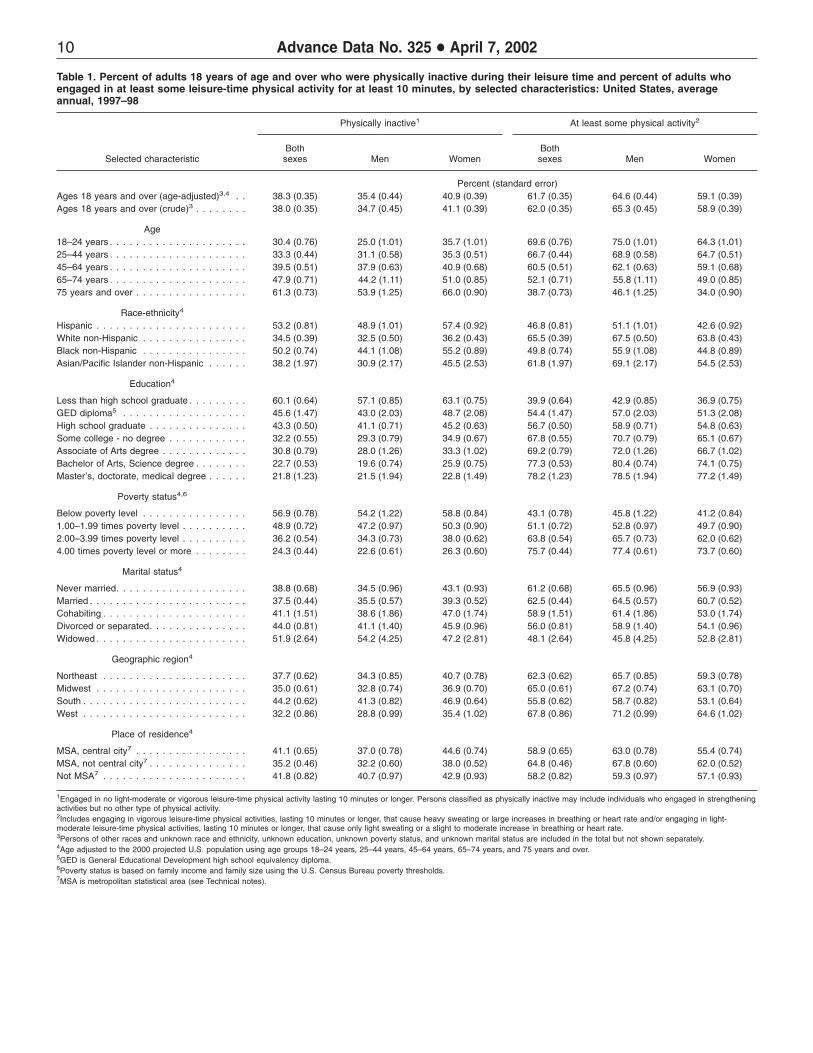
leisure-time physical activity. In this report, physically inactive adults are those who never engaged in any light-moderate or vigorous leisure-time physical activity for as long as 10 minutes at a time (table 1). Adults classified as engaging in at least some activity were those who engaged in any light-moderate or vigorous leisure-time physical activity for at least 10 minutes, regardless of frequency.
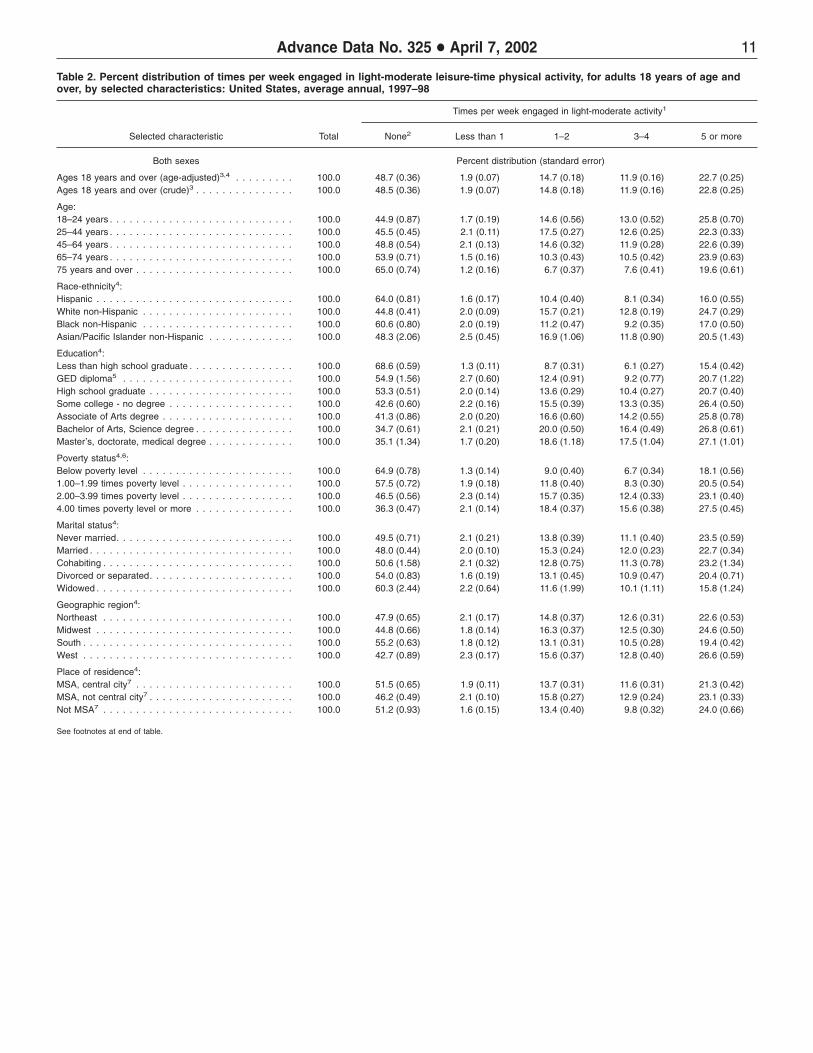
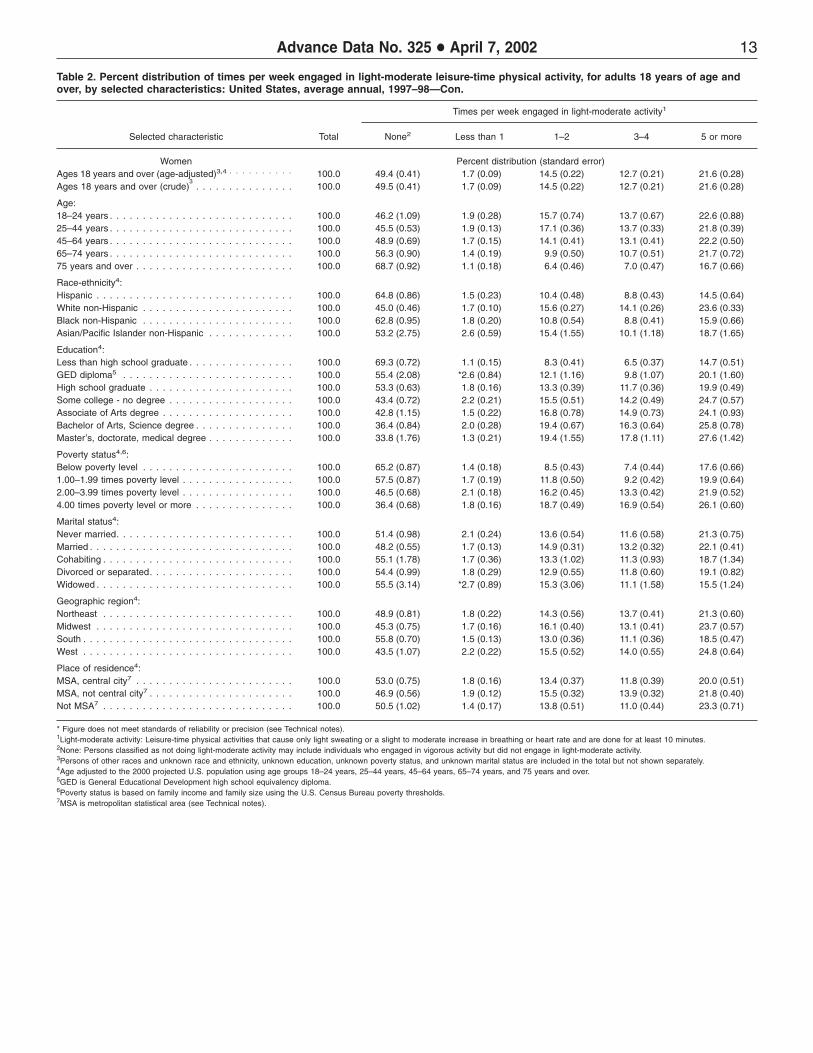
Frequency of light-moderate leisure-time physical activity (table 2) was based on a question that asked how often the person engaged in at least 10 minutes of light-moderate leisure-time physical activity that caused light sweating or a slight to moderate increase in breathing or heart rate. Answers could be provided in any time unit (per day, week, month, or year). Frequency of activity was converted into times per week and then categorized as follows: (a) none; (b) less than one time per week; (c) 1–2 times per week; (d) 3–4 times per week; and (e) 5 or more times per week. The ‘‘none’’ category consists of all persons who engaged in no light-moderate activity, including some who engaged in only vigorous activity.
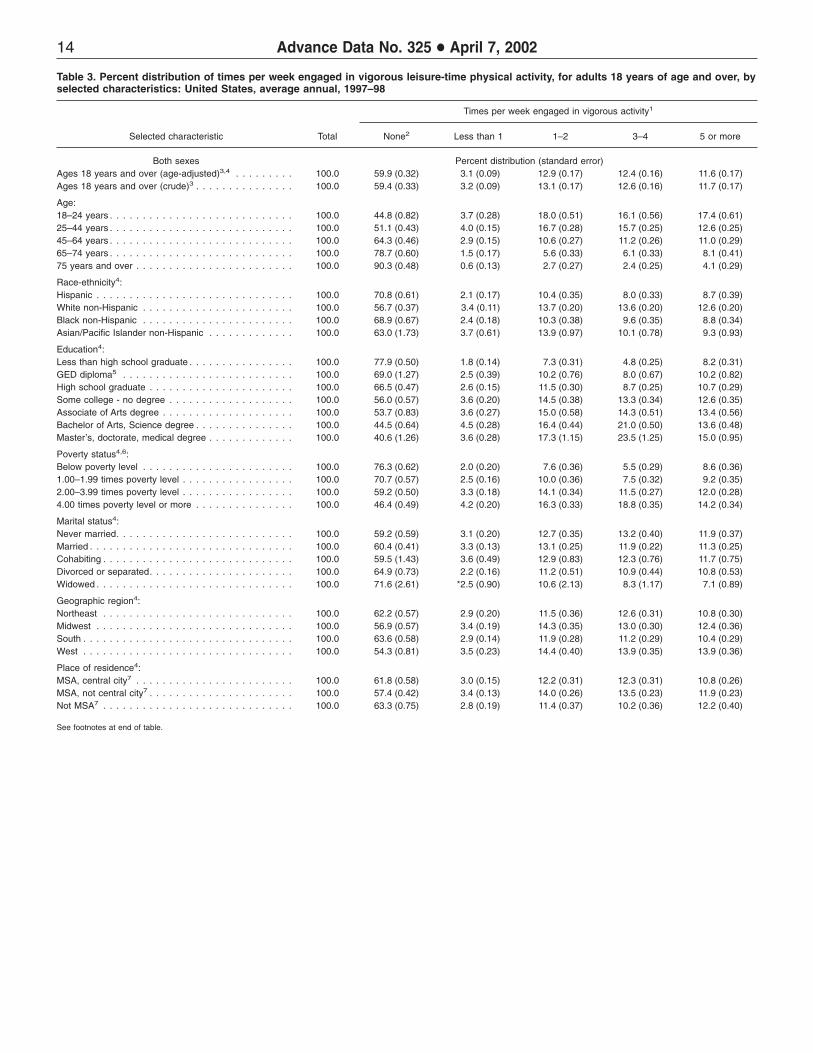
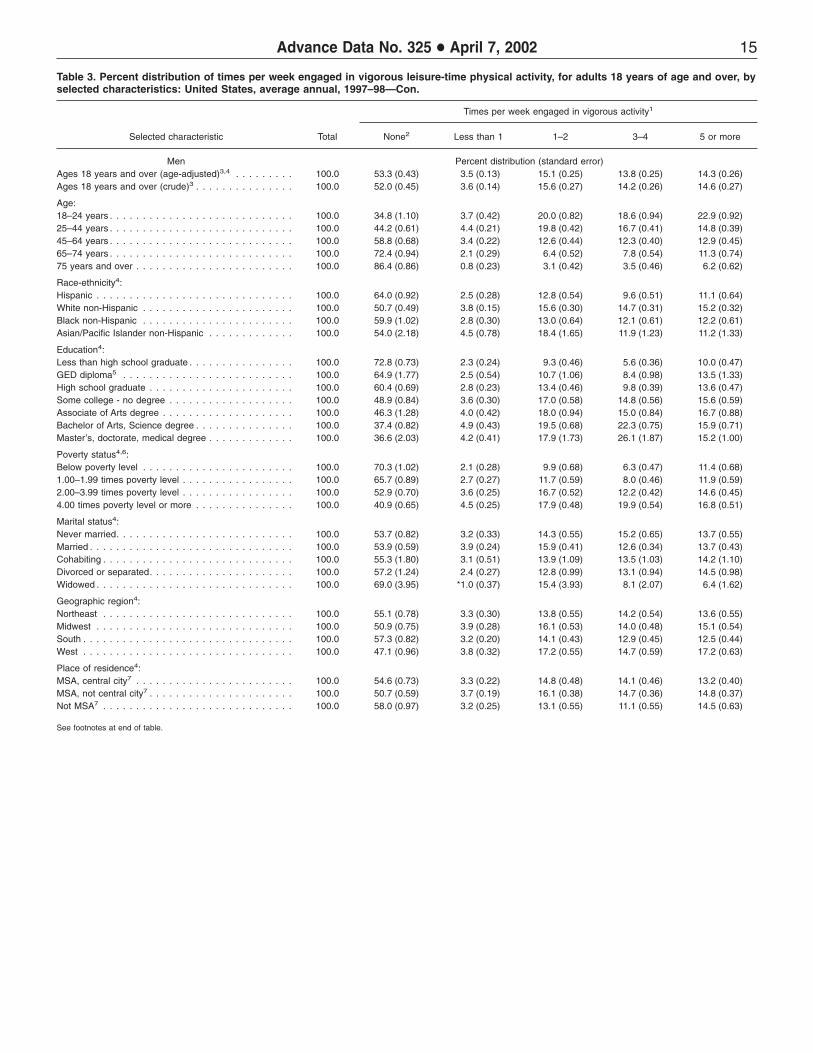
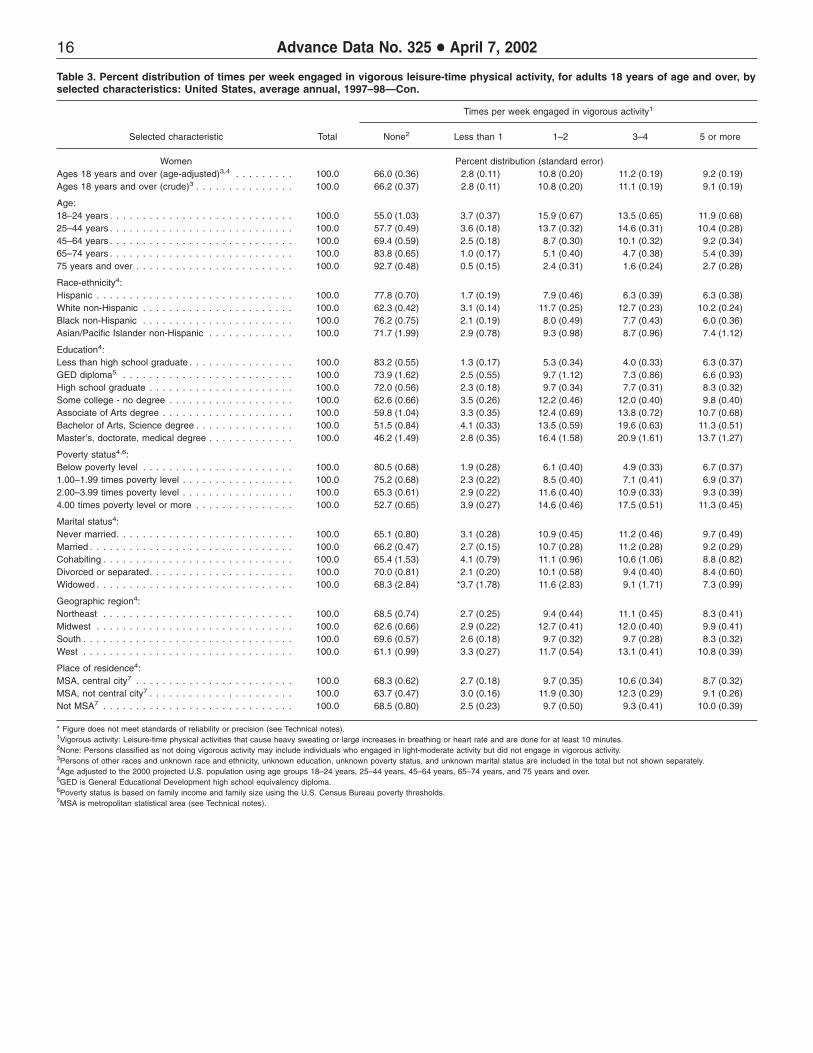
Frequency of vigorous leisure-time physical activity (table 3) was based on a question that asked how often the person engaged in at least 10 minutes of vigorous activity that caused heavy sweating or large increases in breathing or heart rate. Response options were identical to those of the light-moderate activity question, and frequency was categorized in the same manner.
Questions asking about light-moderate leisure-time physical activity and vigorous leisure-time physical
Advance Data No. 325 + April 7, 2002 3
activity were independent, with the question about vigorous activity asked first. Respondents could have reported engaging in only light-moderate activity, only vigorous activity, both types of activity, or neither one. Table A illustrates the extent of the overlap between light-moderate and vigorous leisure-time physical activity. Table 1 presents data for the two types of activity combined, showing the percent of persons who never engaged in either type of activity and the percent of persons who ever engaged in either or both types of activity. Tables 2 and 3, as well as the first two columns of table 4, present data for frequency of engaging in each type of activity separately. The last column of table 4 again combines data for the two types of activity, showing the percent of persons who engaged regularly in either or both types of activity.
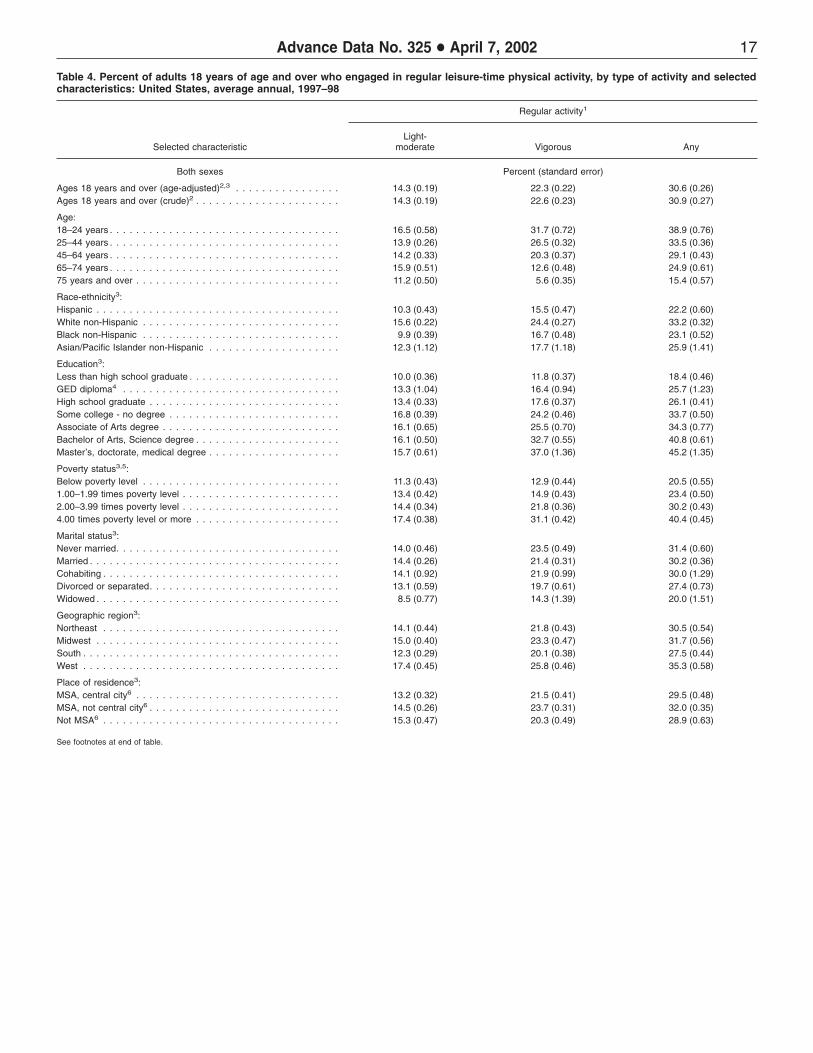
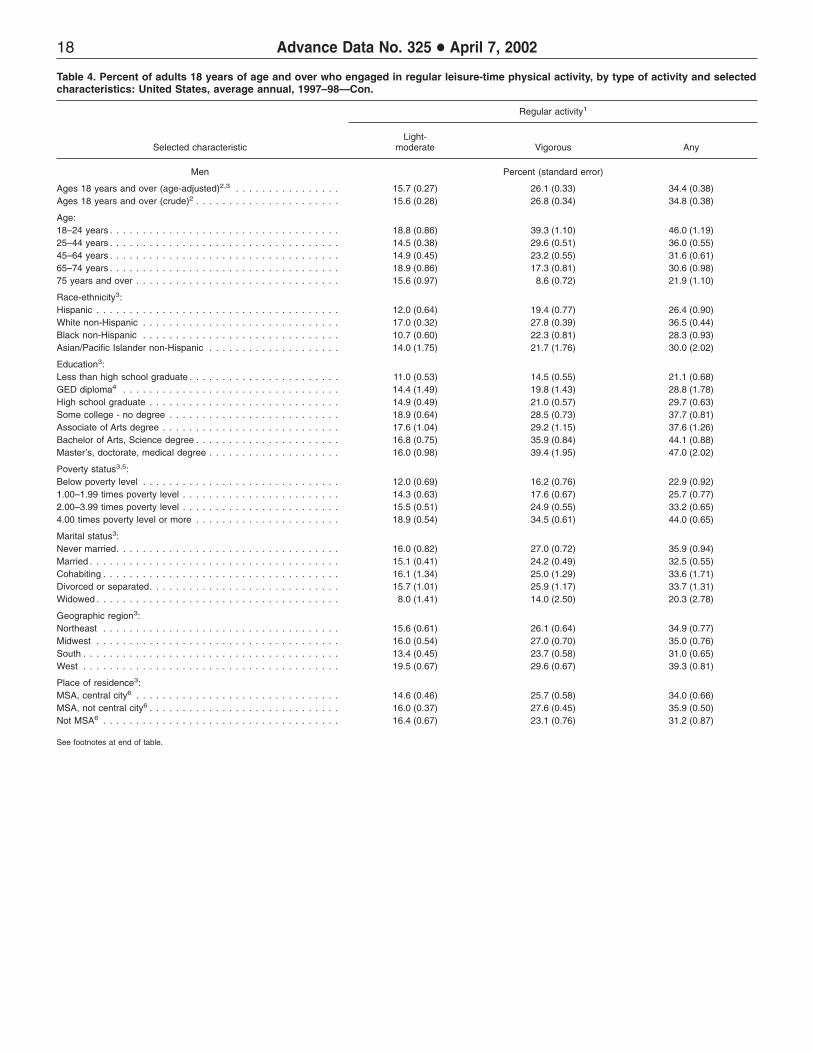
Regular leisure-time physical activity (table 4) combines frequency and duration for light-moderate activity and for vigorous activity. Each type of activity is classified separately and criteria for ‘‘regular’’ differ. Regular light-moderate activity is defined as engaging in light-moderate activity 5 times or more per week for 30 minutes or more each time. Regular vigorous activity is defined as engaging in vigorous activity 3 times or more per week for 20 minutes or more each time. Any regular activity is defined as meeting either or both criteria.
Strengthening activity (table 5) includes any leisure-time activities designed to strengthen muscles, such as weight lifting or calisthenics. Unlike light-moderate activity or vigorous activity, there was no minimum duration identified in the question, and duration of activity was not asked.
For all questions related to physical activity, respondents were given the opportunity to volunteer that they were ‘‘unable to engage in the activity.’’ In this report, individuals who said they were unable to engage in the activity were combined with persons who said they never engaged in the activity.
Mid-year 1997 questionnaire change
When a new NHIS questionnaire was introduced in January 1997, the
leisure-time physical activity questions specified a criterion of 20 minutes for a minimum duration of each activity episode. To allow assessment of activity levels for persons who engaged in shorter bouts of activity, the minimum duration for reportable activities was changed in July 1997 from 20 minutes to 10 minutes and has remained 10 minutes. For the first half of 1997, respondents who engaged in physical activity for at least 10 minutes but less than 20 minutes would have responded ‘‘never’’ to the questions that asked how often they engaged in activity ‘‘for at least 20 minutes.’’ Because of the wording of the question, there is no way to determine how many individuals were affected. Analysis of the impact of the wording change on prevalence of ‘‘any leisure-time physical activity’’ (not shown) revealed that estimates were essentially the same in the first half of 1997 (63.2%) as in the second half (64.0%), despite the difference in question wording. This finding suggests that NHIS respondents may not have paid attention to specific requirements for minimum duration and may simply have reported any physical activity. The absence of any significant difference in the estimates between the first and last half of 1997 suggests that it was reasonable to combine all four quarters of 1997 with annual data for 1998 to obtain a 2-year annual average for leisure-time physical activity. It is possible, though unlikely, that this could have resulted in a very slight overestimate of leisure-time physical inactivity.
Item nonresponse in classification of activity levels
Calculated estimates shown in this report generally excluded unknowns (i.e., refused, not ascertained, or don’t know). The exclusion of missing data from the analysis was straightforward in tables showing a single type of activity—light-moderate (table 2), vigorous (table 3), and strengthening (table 5). Responses of refused, not ascertained, and don’t know were excluded from the denominators used to calculate frequency of activity. However, classification of ‘‘inactive’’ versus ‘‘active’’ (table 1) and classification of
‘‘regular physical activity’’ (table 4) required decisions concerning treatment of missing data when partial data were available.
The following two options were available for handling missing data under these circumstances: (1) exclude all respondents who were missing any of the relevant information, or (2) classify respondents based on sufficient information. The second option was selected. It should be noted that the criteria for sufficient differed according to the variable of interest.
To classify a person as ‘‘active,’’ it was deemed sufficient to know that the person engaged in either light-moderate or vigorous activity; the absence of information concerning the other activity could reasonably be ignored. However, the same was not true for classifying a person as inactive. If a person did not engage in one type of activity (light-moderate or vigorous) and his/her participation in the other activity was unknown, this was not considered sufficient information to classify the individual as ‘‘physically inactive’’ because it was possible that the missing information could have led to classifying the person as ‘‘active.’’ Such individuals were excluded from the analysis. This approach resulted in a conservative estimate of inactivity.
The criteria for sufficient information was also applied when classifying ‘‘any regular activity’’ (table 4). Persons who engaged in light-moderate or vigorous leisure-time activity on a regular basis were included in the denominator for calculating rates of ‘‘any regular activity,’’ even if information about the other type of activity was missing. Respondents who had missing information about both light-moderate and vigorous activity and those who responded ‘‘never’’ or ‘‘unable to do’’ to one of the activities and provided no information about the other were excluded from the analysis.
Multiple episodes of activity per day
Classification of respondents in terms of regular leisure-time physical activity (table 4) involved estimates of frequency and duration of activity. The criterion for duration of activity was
4 Advance Data No. 325 + April 7, 2002
restricted to usual duration when the respondent engaged in a single episode of activity. Duration of the activity was not summed for persons who engaged in multiple episodes of leisure-time activity within a day. Thus, persons who engaged in an activity episode for less than the specified number of minutes were not included in a category even if, when summed, their total daily activity would have met or exceeded the duration criterion for that category. Less than 1 percent of the sample (673 of 68,556 respondents) reported multiple episodes of leisure-time activity per day that did not meet the duration criterion. Estimates of activity would have been essentially unaffected by inclusion of these 673 individuals.
Strengths and limitations of the data
The new physical activity questions have several strengths. They can be used as an indicator of overall levels of leisure-time physical activity among U.S. adults and are less affected by seasonality than activity-specific indicators. Their inclusion in the survey every year makes it possible to: (a) produce annual estimates for leisure-time physical activity; (b) combine data years to make reliable estimates for some smaller population subgroups; and (c) track changes in leisure-time physical activity levels of adults.
The new physical activity questions have at least three limitations: First, although they are preceded by an introductory phrase that explains that the questions refer to leisure-time activity, this phrase is not repeated in the questions. Some respondents may have failed to pay attention to the limited scope of the questions and included nonleisure-time physical activities when responding. A second limitation is that the questions require respondents to mentally and quickly calculate average frequency and duration as well as to assess their level of intensity for all of their leisure-time physical activities. For example, a person who plays golf for 4 hours once a week and walks for 30 minutes every day must first classify these activities as either light-moderate or vigorous and then average the
frequency and duration of all of the activities in each category. Finally, no questions were asked about physical activity related to occupation, transportation, or household chores. The importance of such indicators is recognized, but time constraints of the survey preclude collecting such information annually. Interpretation of differentials in physical activity levels must be tempered with an understanding that only leisure-time physical activity is being reported, not total activity level, and self-reported levels of activity may be overestimates or underestimates compared with observed activity levels. Selected measures of nonleisure-time physical activities were included in the NHIS Cancer module in 2000 and will provide an opportunity for future studies of the status of physical activity among U.S. adults.
Statistical analysis
This report is based on data from 68,556 completed interviews in 1997 and 1998 of sample adults aged 18 years and over. The overall sample adult response rate was 77.2%. Two years of data were combined to obtain reliable estimates for some of the smaller population subgroups.
All estimates and associated standard errors in this report were generated using SUDAAN, a software package designed to handle the complex sample design used by the NHIS (27). All estimates were weighted to reflect the U.S. civilian noninstitutionalized population aged 18 years and over. Despite combining 2 years of data, the standard errors for some subgroups are quite large. In tables 1–5, estimates with a relative standard error of more than 30% are identified with an asterisk. The reader should exercise caution when interpreting these statistics.
Most estimates presented in tables 1–5 were age-adjusted to the 2000 projected U.S. population aged 18 years and over, using SUDAAN’s PROC DESCRIPT procedure (27–29).
Age adjustment was used to allow comparison among various sociodemographic subgroups that have different age structures. (See Technical notes for details.) The age-adjusted and
unadjusted estimates were similar for the population totals as well as for many of the sociodemographic subgroups. Tables showing unadjusted estimates by race-ethnicity, education, poverty status, marital status, geographic region, and location of residence are available on the NCHS Web site (30).
Age-adjusted estimates were compared using two-tailed t-tests at the 0.05 level. No adjustments were made for multiple comparisons. Terms such as ‘‘greater than’’ and ‘‘less than’’ indicate a statistically significant difference. Terms such as ‘‘similar’’ or ‘‘no difference’’ indicate that the statistics being compared were not significantly different. Lack of comment regarding the difference between any two statistics does not mean that the difference was tested and found to be not significant.
With the exception of information on place of residence (MSA versus non-MSA), which is not available to the public for reasons of confidentiality, all statistics presented in this report can be replicated using NHIS public use data files and accompanying documentation available for downloading from the NCHS website at http://www.cdc.gov/ nchs/nhis.htm.
Results
Findings from tables 1–5 are summarized below in bulleted highlights and organized according to population characteristics. The number of the table in which the data are presented is shown at the end of each bulleted item. Statistics are cited in the bullets whenever their mention will enhance understanding. In some instances, especially when more general interpretations of the findings are presented, the reader will need to refer to the table for the exact estimates. With the exception of the section describing findings by age, all descriptions refer to age-adjusted estimates.
The race-ethnicity categories shown in tables 1–5 identify persons of Hispanic ethnicity separately from persons not of Hispanic ethnicity. Persons of Hispanic ethnicity can be of any race. Thus, each of the race categories other than ‘‘Hispanic’’ contains the qualifier ‘‘non-Hispanic.’’
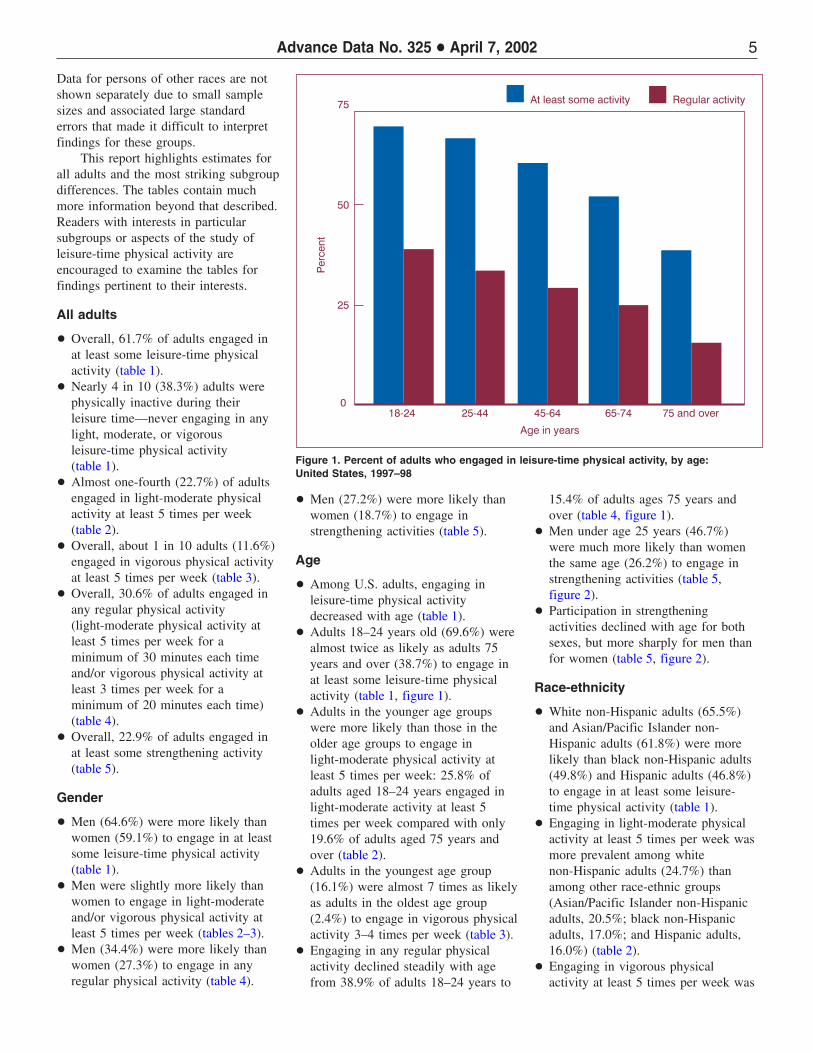
Figure 1. Percent of adults who engaged in leisure-time physical activity, by age: United States, 1997–98
Data for persons of other races are not shown separately due to small sample sizes and associated large standard errors that made it difficult to interpret findings for these groups.
This report highlights estimates for all adults and the most striking subgroup differences. The tables contain much more information beyond that described. Readers with interests in particular subgroups or aspects of the study of leisure-time physical activity are encouraged to examine the tables for findings pertinent to their interests.
All adults
+ Overall, 61.7% of adults engaged in at least some leisure-time physical activity (table 1).
+ Nearly 4 in 10 (38.3%) adults were physically inactive during their leisure time—never engaging in any light, moderate, or vigorous leisure-time physical activity (table 1).
+ Almost one-fourth (22.7%) of adults engaged in light-moderate physical activity at least 5 times per week (table 2).
+ Overall, about 1 in 10 adults (11.6%) engaged in vigorous physical activity at least 5 times per week (table 3).
+ Overall, 30.6% of adults engaged in any regular physical activity (light-moderate physical activity at least 5 times per week for a minimum of 30 minutes each time and/or vigorous physical activity at least 3 times per week for a minimum of 20 minutes each time) (table 4).
+ Overall, 22.9% of adults engaged in at least some strengthening activity (table 5).
Gender
+ Men (64.6%) were more likely than women (59.1%) to engage in at least some leisure-time physical activity (table 1).
+ Men were slightly more likely than women to engage in light-moderate and/or vigorous physical activity at least 5 times per week (tables 2–3).
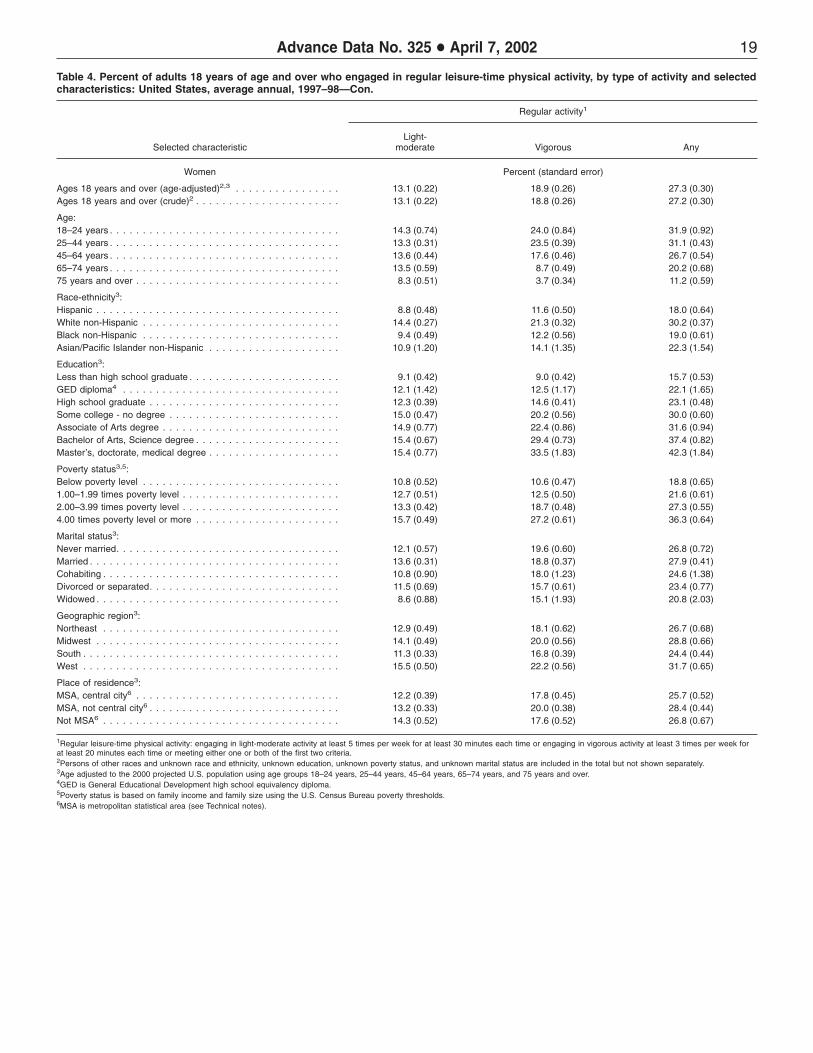
+ Men (34.4%) were more likely than women (27.3%) to engage in any regular physical activity (table 4).
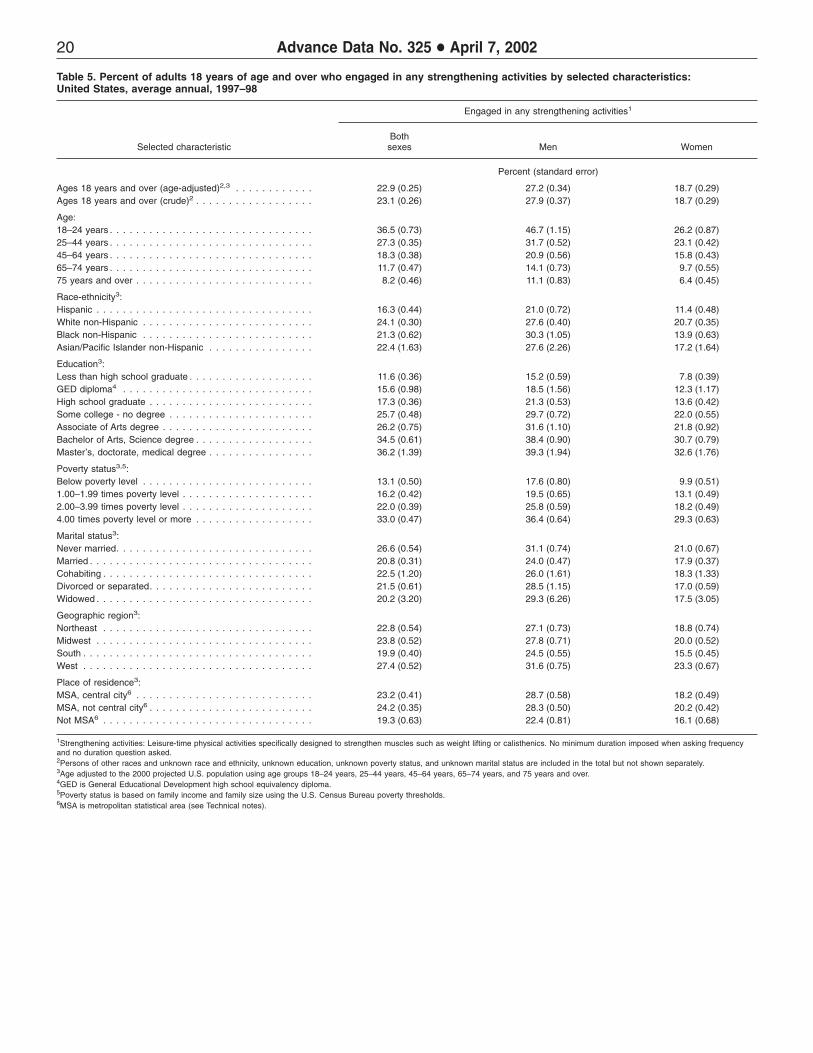
+ Men (27.2%) were more likely than women (18.7%) to engage in strengthening activities (table 5).
Age
+ Among U.S. adults, engaging in leisure-time physical activity decreased with age (table 1).
+ Adults 18–24 years old (69.6%) were almost twice as likely as adults 75 years and over (38.7%) to engage in at least some leisure-time physical activity (table 1, figure 1).
+ Adults in the younger age groups were more likely than those in the older age groups to engage in light-moderate physical activity at least 5 times per week: 25.8% of adults aged 18–24 years engaged in light-moderate activity at least 5 times per week compared with only 19.6% of adults aged 75 years and over (table 2).
+ Adults in the youngest age group (16.1%) were almost 7 times as likely as adults in the oldest age group (2.4%) to engage in vigorous physical activity 3–4 times per week (table 3).
+ Engaging in any regular physical activity declined steadily with age from 38.9% of adults 18–24 years to
15.4% of adults ages 75 years and over (table 4, figure 1).
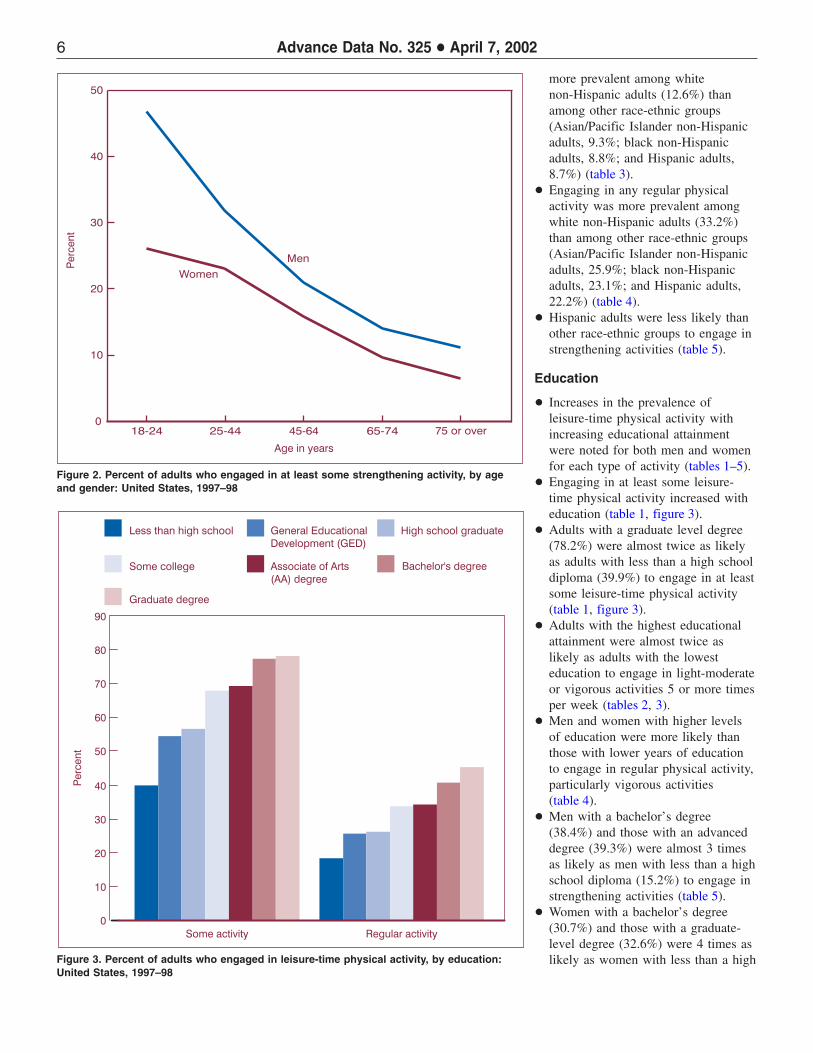
+ Men under age 25 years (46.7%) were much more likely than women the same age (26.2%) to engage in strengthening activities (table 5, figure 2).
+ Participation in strengthening activities declined with age for both sexes, but more sharply for men than for women (table 5, figure 2).
Race-ethnicity
+ White non-Hispanic adults (65.5%) and Asian/Pacific Islander non-Hispanic adults (61.8%) were more likely than black non-Hispanic adults (49.8%) and Hispanic adults (46.8%) to engage in at least some leisure-time physical activity (table 1).
+ Engaging in light-moderate physical activity at least 5 times per week was more prevalent among white non-Hispanic adults (24.7%) than among other race-ethnic groups (Asian/Pacific Islander non-Hispanic adults, 20.5%; black non-Hispanic adults, 17.0%; and Hispanic adults, 16.0%) (table 2).
+ Engaging in vigorous physical activity at least 5 times per week was
6 Advance Data No. 325 + April 7, 2002
0
10
20
30
40
50
18-24 25-44 45-64 65-74 75 or over
Men
Women
Age in years
Perc
en
t
Figure 2. Percent of adults who engaged in at least some strengthening activity, by age and gender: United States, 1997–98
0
10
20
30
40
50
60
70
80
90
Some activity Regular activity
Associate of Arts
(AA) degree
Bachelor's degree
Graduate degree
Perc
en
t
Less than high school High school graduateGeneral Educational
Development (GED)
Some college
Figure 3. Percent of adults who engaged in leisure-time physical activity, by education: United States, 1997–98
more prevalent among white non-Hispanic adults (12.6%) than among other race-ethnic groups (Asian/Pacific Islander non-Hispanic adults, 9.3%; black non-Hispanic adults, 8.8%; and Hispanic adults, 8.7%) (table 3).
+ Engaging in any regular physical activity was more prevalent among white non-Hispanic adults (33.2%) than among other race-ethnic groups (Asian/Pacific Islander non-Hispanic adults, 25.9%; black non-Hispanic adults, 23.1%; and Hispanic adults, 22.2%) (table 4).
+ Hispanic adults were less likely than other race-ethnic groups to engage in strengthening activities (table 5).
Education
+ Increases in the prevalence of leisure-time physical activity with increasing educational attainment were noted for both men and women for each type of activity (tables 1–5).
+ Engaging in at least some leisure-time physical activity increased with education (table 1, figure 3).
+ Adults with a graduate level degree (78.2%) were almost twice as likely as adults with less than a high school diploma (39.9%) to engage in at least some leisure-time physical activity (table 1, figure 3).
+ Adults with the highest educational attainment were almost twice as likely as adults with the lowest education to engage in light-moderate or vigorous activities 5 or more times per week (tables 2, 3).
+ Men and women with higher levels of education were more likely than those with lower years of education to engage in regular physical activity, particularly vigorous activities (table 4).
+ Men with a bachelor’s degree (38.4%) and those with an advanced degree (39.3%) were almost 3 times as likely as men with less than a high school diploma (15.2%) to engage in strengthening activities (table 5).
+ Women with a bachelor’s degree (30.7%) and those with a graduate-level degree (32.6%) were 4 times as likely as women with less than a high
Advance Data No. 325 + April 7, 2002 7
0
10
20
30
40
50
60
70
80
Below 1.00-1.99
times
Poverty level
2.00-3.99
times
4.00 or more
times
At least some activity Regular activity
Perc
en
t
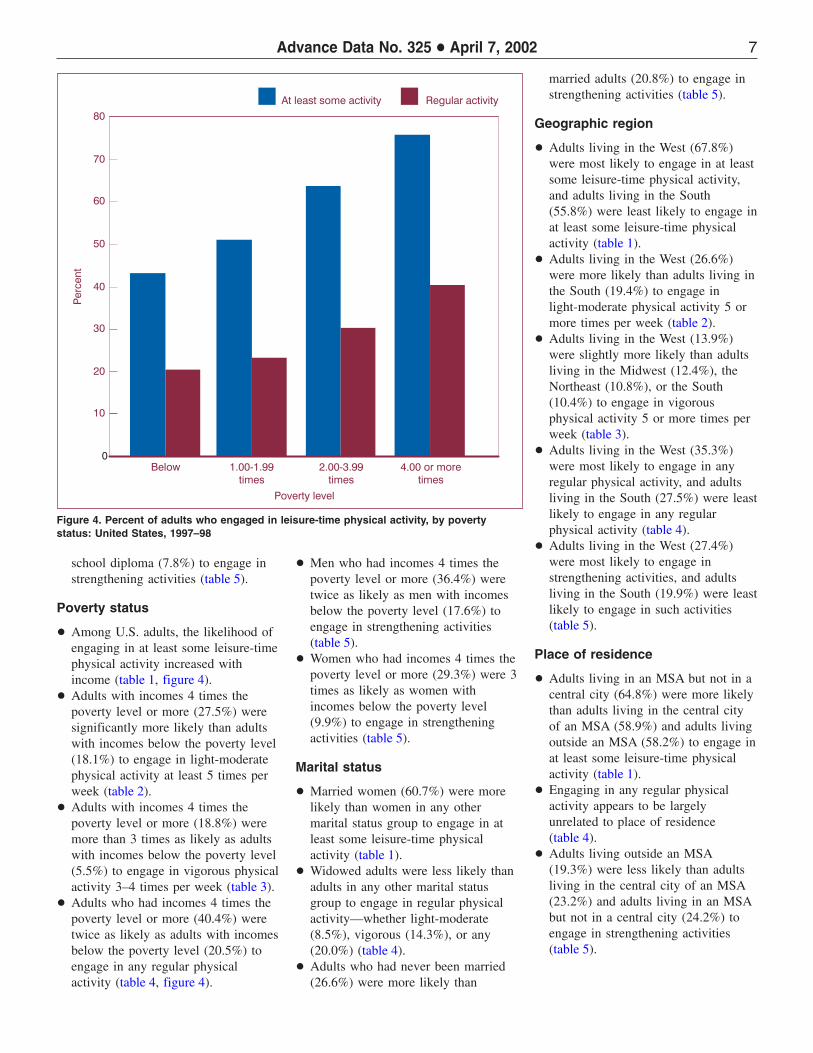
Figure 4. Percent of adults who engaged in leisure-time physical activity, by poverty status: United States, 1997–98
school diploma (7.8%) to engage in strengthening activities (table 5).
Poverty status
+ Among U.S. adults, the likelihood of engaging in at least some leisure-time physical activity increased with income (table 1, figure 4).
+ Adults with incomes 4 times the poverty level or more (27.5%) were significantly more likely than adults with incomes below the poverty level (18.1%) to engage in light-moderate physical activity at least 5 times per week (table 2).
+ Adults with incomes 4 times the poverty level or more (18.8%) were more than 3 times as likely as adults with incomes below the poverty level (5.5%) to engage in vigorous physical activity 3–4 times per week (table 3).
+ Adults who had incomes 4 times the poverty level or more (40.4%) were twice as likely as adults with incomes below the poverty level (20.5%) to engage in any regular physical activity (table 4, figure 4).
+ Men who had incomes 4 times the poverty level or more (36.4%) were twice as likely as men with incomes below the poverty level (17.6%) to engage in strengthening activities (table 5).
+ Women who had incomes 4 times the poverty level or more (29.3%) were 3 times as likely as women with incomes below the poverty level (9.9%) to engage in strengthening activities (table 5).
Marital status
+ Married women (60.7%) were more likely than women in any other marital status group to engage in at least some leisure-time physical activity (table 1).
+ Widowed adults were less likely than adults in any other marital status group to engage in regular physical activity—whether light-moderate (8.5%), vigorous (14.3%), or any (20.0%) (table 4).
+ Adults who had never been married (26.6%) were more likely than
married adults (20.8%) to engage in strengthening activities (table 5).
Geographic region
+ Adults living in the West (67.8%) were most likely to engage in at least some leisure-time physical activity, and adults living in the South (55.8%) were least likely to engage in at least some leisure-time physical activity (table 1).
+ Adults living in the West (26.6%) were more likely than adults living in the South (19.4%) to engage in light-moderate physical activity 5 or more times per week (table 2).
+ Adults living in the West (13.9%) were slightly more likely than adults living in the Midwest (12.4%), the Northeast (10.8%), or the South (10.4%) to engage in vigorous physical activity 5 or more times per week (table 3).
+ Adults living in the West (35.3%) were most likely to engage in any regular physical activity, and adults living in the South (27.5%) were least likely to engage in any regular physical activity (table 4).
+ Adults living in the West (27.4%) were most likely to engage in strengthening activities, and adults living in the South (19.9%) were least likely to engage in such activities (table 5).
Place of residence
+ Adults living in an MSA but not in a central city (64.8%) were more likely than adults living in the central city of an MSA (58.9%) and adults living outside an MSA (58.2%) to engage in at least some leisure-time physical activity (table 1).
+ Engaging in any regular physical activity appears to be largely unrelated to place of residence (table 4).
+ Adults living outside an MSA (19.3%) were less likely than adults living in the central city of an MSA (23.2%) and adults living in an MSA but not in a central city (24.2%) to engage in strengthening activities (table 5).
8 Advance Data No. 325 + April 7, 2002
Discussion
Overall in 1997–98, leisure-time physical activity was more prevalent among men than women; among white non-Hispanic adults than black non-Hispanic, Asian/Pacific Islander non-Hispanic, or Hispanic subgroups; among adults living in the West than adults living in the Northeast, Midwest, or South; and among those living in an MSA but outside the central city (the suburbs) than adults living either in the central city of an MSA or outside an MSA. Rates of leisure-time physical activity decreased dramatically with age and increased with levels of education and income. Widowed adults were less likely than adults in any other marital status group to engage in leisure-time physical activity even after adjusting for age differences in the marital status groups.
This report provides important benchmark information for studying trends in leisure-time physical activity among U.S. adults as well as studying the relationships between such activity and other health indicators. Combining 2 years of data allowed analysis of physical activity practices in some population subgroups that would otherwise be too small for meaningful analysis. For smaller subgroups, additional years of data will be required before reliable estimates can be produced.
The sociodemographic differentials in leisure-time physical activity levels found among adults in the 1997–98 National Health Interview Survey Sample Adult Core are generally consistent with those found in earlier NHIS special topic supplements in which respondents were asked about their participation in more than 20 specific sports, exercises, or physically active hobbies (19,21). In early NHIS questionnaires, respondents were asked to report frequency and duration of their participation in each specific activity during the past 2 weeks and any associated changes in their breathing or heart rate. Because these questions took considerable interview time, they were not suitable for the annual core NHIS questionnaire. The simultaneous inclusion of both sets of questions in the
1998 NHIS Sample Adult and Sample Adult Prevention modules provides an opportunity to explore the impact, if any, of the change in the content and context of the questions on annual prevalence estimates for leisure-time physical activity (23).
Conclusions
Prevalence of leisure-time physical activity varies among subgroups of the adult U.S. population. Careful attention to sociodemographic patterns in leisure-time physical activity will assist in appropriately targeting programs to encourage increased participation in leisure-time physical activity. The descriptive statistics and highlights presented in this report are a foundation for future studies of health behavior profiles as they relate to health and disease among various population subgroups.
References 1. Belloc NB, Breslow L. Relationship
of physical health status and health practices. Prev Med 1(3): 409–21. 1972.
2. Breslow L, Enstrom JE. Persistence of health habits and their relationship to mortality. Prev Med 9: 469–83. 1980.
3. Wingard DL, Berkman LF, Brand RJ. A multivariate analysis of health-related practices. Am J Epidemiol 116(5):765–75. 1982.
4. Wiley JA, Camacho TC. Lifestyle and future health: Evidence from the Alameda County Study. Prev Med 9:1–21. 1980.
5. Kaplan GA, Strawbridge WJ, Cohen RD, Hungerford LR. Natural history of leisure-time physical activity and its correlates: Associations with mortality from all causes and cardiovascular disease over 28 years. Am J Epidemiol 144(8):793–7. 1996.
6. Chen J, Millar WJ. Health effects of physical activity. Health Reports 11(1). Catalogue 82–003. Statistics Canada. Summer 1999.
7. Kujala UM, Kaprio J, Sarna S, Koskenvuo M. Relationship of leisure-time physical activity and mortality. The Finnish cohort study. JAMA 279(6):440–4. 1998.
activity on the cardiovascular risk profile at older age. Int J Epidemiol 28:659–66. 1999.
9. U.S. Department of Health and Human Services. Promoting health, preventing disease: objectives for the Nation. DHHS. Public Health Service. U.S. Government Printing Office. Washington. 1980.
10. U.S. Department of Health and Human Services. Healthy people 2000. National Health Promotion and Disease Prevention Objectives DHHS Publication No. (PHS) 91–50212. U.S. Government Printing Office. Washington. 1991.
11. U.S. Department of Health and Human Services. Healthy people 2010. 2nd ed. With understanding and improving health and objectives for improving health. 2 vols. U.S. Government Printing Office. Washington. 2000.
12. U.S. Department of Health and Human Services. Physical activity and health: A report of the Surgeon General. Atlanta, GA: U.S. Department of Health and Human Services, Centers for Disease Control and Prevention. National Center for Chronic Disease Prevention and Health Promotion. 1996.
13. Howie LJ, Drury, TF. Current estimates from the Health Interview Survey: United States, 1977. National Center for Health Statistics. Vital Health Stat 10(126). 1978.
14. Schoenborn CA, Danchik KM. Health practices among adults: United States, 1977. Advance data from vital and health statistics; no. 64. Hyattsville, Maryland: 1980.
15. National Center for Health Statistics. Current estimates from the National Health Interview Survey: United States, 1983. National Vital Health Stat 10(154). 1986.
16. Schoenborn CA, Cohen BH. Trends in smoking, alcohol consumption, and other health practices among U.S. adults, 1977 and 1983. Advance data from vital and health statistics; no. 118. Hyattsville, Maryland. 1986.
17. National Center for Health Statistics. Current estimates from the National Health Interview Survey, United States, 1985. Vital Health Stat 10(160). DHHS Pub. No. (PHS) 86–1588. Sept. 1986.
18. Schoenborn CA. Health habits of U.S. adults, 1985: The ‘‘Alameda 7’’ revisited. Public Health Reports 101(6):571–80. 1986.
Advance Data No. 325 + April 7, 2002 9
19. Schoenborn CA. Health promotion and disease prevention: United States, 1985. National Center Health Statistics Vital Health Stat 10(163). DHHS Pub. No. (PHS) 88–1591. 1988.
20. Adams PF, Benson V. Current estimates from the National Health Interview Survey, 1990. National Center for Health Statistics. Vital Health Stat 10(181). 1991.
21. Piani A, Schoenborn CA. Health promotion and disease prevention: United States, 1990. National Center for Health Statistics. Vital Health Stat 10(185). 1993.
22. Adams PF, Benson V. Current estimates from the National Health Interview Survey, 1991. National Center for Health Statistics. Vital Health Stat 10(184). 1992.
23. National Center for Health Statistics. 1998 National Health Interview Survey (NHIS). Public Use Data Release. NHIS Survey Description. ftp://ftp.cdc.gov/pub/ Health_Statistics/NCHS/ Dataset_Documentation/NHIS/1998/ srvydesc.pdf.
24. Schoenborn CA, Adams PF. Alcohol use among adults: United States, 1997–98. Advance data from vital health statistics; no. 324. Hyattsville, Maryland: National Center for Health Statistics. 2001.
25. National Center for Health Statistics. 1997 National Health Interview Survey (NHIS). Public Use Data Release. NHIS Survey Description. ftp://ftp.cdc.gov/pub/ Health_Statistics/NCHS/ Dataset_Documentation/NHIS/1997/ srvydesc.pdf.
26. National Center for Health Statistics. National Health Interview Survey. http://www.cdc.gov/nchs/nhis.htm.
27. Shah BV, Barnwell BG, Bieler GS. SUDAAN, Software for the statistical analysis of correlated data. SUDAAN User’s Manual, Release 7.5. Research Triangle Park, NC. Research Triangle Institute. 1997. Additional information available at: http://www.rti.org/patents/sudaan/ sudaan.html.
28. Day, JC. Population projections of the United States by age, sex, race, and Hispanic origin: 1995 to 2050, U.S. Bureau of the Census, Current Population Reports, P25–1130, U.S. Government Printing Office, Washington. 1996. (http://
www.census.gov/prod/1/pop/p25– 1130/).
29. Klein RJ, Schoenborn CA. Age adjustment using the 2000 projected U.S. population. Healthy People Statistical Notes, no. 20. Hyattsville, Maryland. National Center for Health Statistics. 2001.
30. National Center for Health Statistics. http://www.cdc.gov/nchs/.
31. Department of Commerce, U.S. Bureau of the Census. Poverty in the United States, 1996. Washington. U.S. Department of Commerce. U.S. Bureau of the Census. 1997.
32. U.S. Census Bureau. http:// www.census.gov/population/www/ estimates/aboutmetro.html.
Table 1. Percent of adults 18 years of age and over who were physically inactive during their leisure time and percent of adults who engaged in at least some leisure-time physical activity for at least 10 minutes, by selected characteristics: United States, average annual, 1997–98
Physically inactive1 At least some physical activity2
Both Both Selected characteristic sexes Men Women sexes Men Women
Percent (standard error) Ages 18 years and over (age-adjusted)3,4 . . 38.3 (0.35) 35.4 (0.44) 40.9 (0.39) 61.7 (0.35) 64.6 (0.44) 59.1 (0.39) Ages 18 years and over (crude)3 . . . . . . . . 38.0 (0.35) 34.7 (0.45) 41.1 (0.39) 62.0 (0.35) 65.3 (0.45) 58.9 (0.39)
1Engaged in no light-moderate or vigorous leisure-time physical activity lasting 10 minutes or longer. Persons classified as physically inactive may include individuals who engaged in strengthening activities but no other type of physical activity. 2Includes engaging in vigorous leisure-time physical activities, lasting 10 minutes or longer, that cause heavy sweating or large increases in breathing or heart rate and/or engaging in light-moderate leisure-time physical activities, lasting 10 minutes or longer, that cause only light sweating or a slight to moderate increase in breathing or heart rate. 3Persons of other races and unknown race and ethnicity, unknown education, unknown poverty status, and unknown marital status are included in the total but not shown separately. 4Age adjusted to the 2000 projected U.S. population using age groups 18–24 years, 25–44 years, 45–64 years, 65–74 years, and 75 years and over. 5GED is General Educational Development high school equivalency diploma. 6Poverty status is based on family income and family size using the U.S. Census Bureau poverty thresholds. 7MSA is metropolitan statistical area (see Technical notes).
Advance Data No. 325 + April 7, 2002 11
Table 2. Percent distribution of times per week engaged in light-moderate leisure-time physical activity, for adults 18 years of age and over, by selected characteristics: United States, average annual, 1997–98
Times per week engaged in light-moderate activity1
Selected characteristic Total None2 Less than 1 1–2 3–4 5 or more
Both sexes Percent distribution (standard error)
Ages 18 years and over (age-adjusted)3,4 . . . . . . . . . 100.0 48.7 (0.36) 1.9 (0.07) 14.7 (0.18) 11.9 (0.16) 22.7 (0.25) Ages 18 years and over (crude)3 . . . . . . . . . . . . . . . 100.0 48.5 (0.36) 1.9 (0.07) 14.8 (0.18) 11.9 (0.16) 22.8 (0.25)
Table 2. Percent distribution of times per week engaged in light-moderate leisure-time physical activity, for adults 18 years of age and over, by selected characteristics: United States, average annual, 1997–98—Con.
Times per week engaged in light-moderate activity1
Selected characteristic Total None2 Less than 1 1–2 3–4 5 or more
Men Percent distribution (standard error)
Ages 18 years and over (age-adjusted)3,4 . . . . . . . . . 100.0 47.8 (0.45) 2.1 (0.10) 14.9 (0.25) 11.0 (0.21) 24.1 (0.35) Ages 18 years and over (crude)3 . . . . . . . . . . . . . . . 100.0 47.4 (0.45) 2.1 (0.10) 15.2 (0.26) 11.1 (0.21) 24.1 (0.35)
Table 2. Percent distribution of times per week engaged in light-moderate leisure-time physical activity, for adults 18 years of age and over, by selected characteristics: United States, average annual, 1997–98—Con.
Times per week engaged in light-moderate activity1
Selected characteristic Total None2 Less than 1 1–2 3–4 5 or more
Women Percent distribution (standard error) Ages 18 years and over (age-adjusted)3,4 . . . . . . . . . . 100.0 49.4 (0.41) 1.7 (0.09) 14.5 (0.22) 12.7 (0.21) 21.6 (0.28) Ages 18 years and over (crude)
* Figure does not meet standards of reliability or precision (see Technical notes). Light-moderate activity: Leisure-time physical activities that cause only light sweating or a slight to moderate increase in breathing or heart rate and are done for at least 10 minutes. None: Persons classified as not doing light-moderate activity may include individuals who engaged in vigorous activity but did not engage in light-moderate activity. Persons of other races and unknown race and ethnicity, unknown education, unknown poverty status, and unknown marital status are included in the total but not shown separately. Age adjusted to the 2000 projected U.S. population using age groups 18–24 years, 25–44 years, 45–64 years, 65–74 years, and 75 years and over. GED is General Educational Development high school equivalency diploma. Poverty status is based on family income and family size using the U.S. Census Bureau poverty thresholds. MSA is metropolitan statistical area (see Technical notes).
14 Advance Data No. 325 + April 7, 2002
Table 3. Percent distribution of times per week engaged in vigorous leisure-time physical activity, for adults 18 years of age and over, by selected characteristics: United States, average annual, 1997–98
Times per week engaged in vigorous activity1
Selected characteristic Total None2 Less than 1 1–2 3–4 5 or more
Both sexes Percent distribution (standard error) Ages 18 years and over (age-adjusted)3,4 . . . . . . . . . 100.0 59.9 (0.32) 3.1 (0.09) 12.9 (0.17) 12.4 (0.16) 11.6 (0.17) Ages 18 years and over (crude)3 . . . . . . . . . . . . . . . 100.0 59.4 (0.33) 3.2 (0.09) 13.1 (0.17) 12.6 (0.16) 11.7 (0.17)
Table 3. Percent distribution of times per week engaged in vigorous leisure-time physical activity, for adults 18 years of age and over, by selected characteristics: United States, average annual, 1997–98—Con.
Times per week engaged in vigorous activity1
Selected characteristic Total None2 Less than 1 1–2 3–4 5 or more
Men Percent distribution (standard error) Ages 18 years and over (age-adjusted)3,4 . . . . . . . . . 100.0 53.3 (0.43) 3.5 (0.13) 15.1 (0.25) 13.8 (0.25) 14.3 (0.26) Ages 18 years and over (crude)3 . . . . . . . . . . . . . . . 100.0 52.0 (0.45) 3.6 (0.14) 15.6 (0.27) 14.2 (0.26) 14.6 (0.27)
Table 3. Percent distribution of times per week engaged in vigorous leisure-time physical activity, for adults 18 years of age and over, by selected characteristics: United States, average annual, 1997–98—Con.
Times per week engaged in vigorous activity1
Selected characteristic Total None2 Less than 1 1–2 3–4 5 or more
Women Percent distribution (standard error) Ages 18 years and over (age-adjusted)3,4 . . . . . . . . . 100.0 66.0 (0.36) 2.8 (0.11) 10.8 (0.20) 11.2 (0.19) 9.2 (0.19) Ages 18 years and over (crude)3 . . . . . . . . . . . . . . . 100.0 66.2 (0.37) 2.8 (0.11) 10.8 (0.20) 11.1 (0.19) 9.1 (0.19)
* Figure does not meet standards of reliability or precision (see Technical notes). Vigorous activity: Leisure-time physical activities that cause heavy sweating or large increases in breathing or heart rate and are done for at least 10 minutes. None: Persons classified as not doing vigorous activity may include individuals who engaged in light-moderate activity but did not engage in vigorous activity. Persons of other races and unknown race and ethnicity, unknown education, unknown poverty status, and unknown marital status are included in the total but not shown separately. Age adjusted to the 2000 projected U.S. population using age groups 18–24 years, 25–44 years, 45–64 years, 65–74 years, and 75 years and over. GED is General Educational Development high school equivalency diploma. Poverty status is based on family income and family size using the U.S. Census Bureau poverty thresholds. MSA is metropolitan statistical area (see Technical notes).
Advance Data No. 325 + April 7, 2002 17
Table 4. Percent of adults 18 years of age and over who engaged in regular leisure-time physical activity, by type of activity and selected characteristics: United States, average annual, 1997–98
Regular activity1
Light-Selected characteristic moderate Vigorous Any
Table 4. Percent of adults 18 years of age and over who engaged in regular leisure-time physical activity, by type of activity and selected characteristics: United States, average annual, 1997–98—Con.
Regular activity1
Light-Selected characteristic moderate Vigorous Any
Table 4. Percent of adults 18 years of age and over who engaged in regular leisure-time physical activity, by type of activity and selected characteristics: United States, average annual, 1997–98—Con.
Regular activity1
Light-Selected characteristic moderate Vigorous Any
1Regular leisure-time physical activity: engaging in light-moderate activity at least 5 times per week for at least 30 minutes each time or engaging in vigorous activity at least 3 times per week for at least 20 minutes each time or meeting either one or both of the first two criteria. 2Persons of other races and unknown race and ethnicity, unknown education, unknown poverty status, and unknown marital status are included in the total but not shown separately. 3Age adjusted to the 2000 projected U.S. population using age groups 18–24 years, 25–44 years, 45–64 years, 65–74 years, and 75 years and over. 4GED is General Educational Development high school equivalency diploma. 5Poverty status is based on family income and family size using the U.S. Census Bureau poverty thresholds. 6MSA is metropolitan statistical area (see Technical notes).
20 Advance Data No. 325 + April 7, 2002
Table 5. Percent of adults 18 years of age and over who engaged in any strengthening activities by selected characteristics: United States, average annual, 1997–98
Engaged in any strengthening activities1
Both Selected characteristic sexes Men Women
Percent (standard error)
Ages 18 years and over (age-adjusted)2,3 . . . . . . . . . . . . 22.9 (0.25) 27.2 (0.34) 18.7 (0.29) Ages 18 years and over (crude)2 . . . . . . . . . . . . . . . . . . 23.1 (0.26) 27.9 (0.37) 18.7 (0.29)
1Strengthening activities: Leisure-time physical activities specifically designed to strengthen muscles such as weight lifting or calisthenics. No minimum duration imposed when asking frequency and no duration question asked. 2Persons of other races and unknown race and ethnicity, unknown education, unknown poverty status, and unknown marital status are included in the total but not shown separately. 3Age adjusted to the 2000 projected U.S. population using age groups 18–24 years, 25–44 years, 45–64 years, 65–74 years, and 75 years and over. 4GED is General Educational Development high school equivalency diploma. 5Poverty status is based on family income and family size using the U.S. Census Bureau poverty thresholds. 6MSA is metropolitan statistical area (see Technical notes).
Advance Data No. 325 + April 7, 2002 21
Table I. Age distribution and age-adjustment weights used in age adjusting data shown in tables 1–5 and figures 3–4
Standard population
Age in thousands
18 years and over . . . . . . . 203,851 18–24 years . . . . . . . . . 26,258 25–44 years . . . . . . . . . 81,892 45–64 years . . . . . . . . . 60,991 65–74 years . . . . . . . . . 18,136 75 years and over . . . . . . 16,574
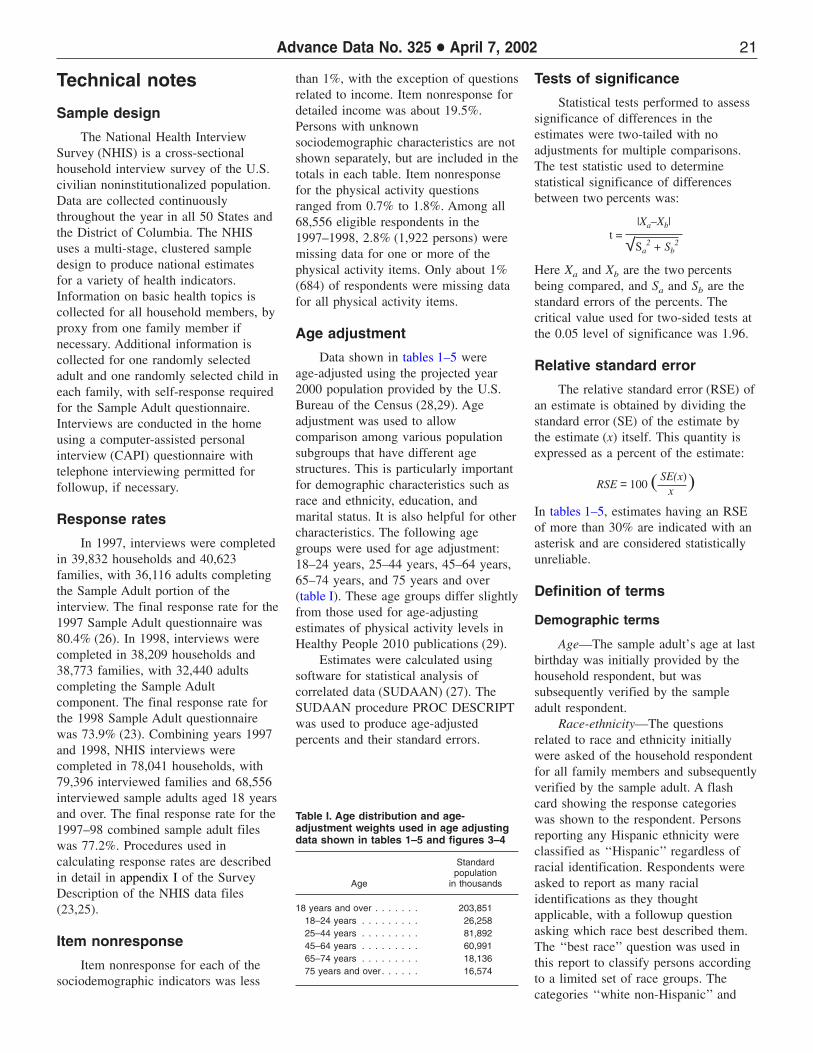
Technical notes
Sample design
The National Health Interview Survey (NHIS) is a cross-sectional household interview survey of the U.S. civilian noninstitutionalized population. Data are collected continuously throughout the year in all 50 States and the District of Columbia. The NHIS uses a multi-stage, clustered sample design to produce national estimates for a variety of health indicators. Information on basic health topics is collected for all household members, by proxy from one family member if necessary. Additional information is collected for one randomly selected adult and one randomly selected child in each family, with self-response required for the Sample Adult questionnaire. Interviews are conducted in the home using a computer-assisted personal interview (CAPI) questionnaire with telephone interviewing permitted for followup, if necessary.
Response rates
In 1997, interviews were completed in 39,832 households and 40,623 families, with 36,116 adults completing the Sample Adult portion of the interview. The final response rate for the 1997 Sample Adult questionnaire was 80.4% (26). In 1998, interviews were completed in 38,209 households and 38,773 families, with 32,440 adults completing the Sample Adult component. The final response rate for the 1998 Sample Adult questionnaire was 73.9% (23). Combining years 1997 and 1998, NHIS interviews were completed in 78,041 households, with 79,396 interviewed families and 68,556 interviewed sample adults aged 18 years and over. The final response rate for the 1997–98 combined sample adult files was 77.2%. Procedures used in calculating response rates are described in detail in appendix I of the Survey Description of the NHIS data files (23,25).
Item nonresponse
Item nonresponse for each of the sociodemographic indicators was less
than 1%, with the exception of questions related to income. Item nonresponse for detailed income was about 19.5%. Persons with unknown sociodemographic characteristics are not shown separately, but are included in the totals in each table. Item nonresponse for the physical activity questions ranged from 0.7% to 1.8%. Among all 68,556 eligible respondents in the 1997–1998, 2.8% (1,922 persons) were missing data for one or more of the physical activity items. Only about 1% (684) of respondents were missing data for all physical activity items.
Age adjustment
Data shown in tables 1–5 were age-adjusted using the projected year 2000 population provided by the U.S. Bureau of the Census (28,29). Age adjustment was used to allow comparison among various population subgroups that have different age structures. This is particularly important for demographic characteristics such as race and ethnicity, education, and marital status. It is also helpful for other characteristics. The following age groups were used for age adjustment: 18–24 years, 25–44 years, 45–64 years, 65–74 years, and 75 years and over (table I). These age groups differ slightly from those used for age-adjusting estimates of physical activity levels in Healthy People 2010 publications (29).
Estimates were calculated using software for statistical analysis of correlated data (SUDAAN) (27). The SUDAAN procedure PROC DESCRIPT was used to produce age-adjusted percents and their standard errors.
Tests of significance
Statistical tests performed to assess significance of differences in the estimates were two-tailed with no adjustments for multiple comparisons. The test statistic used to determine statistical significance of differences between two percents was:
|Xa –Xb| t =
√Sa2 + Sb
2
Here Xa and Xb are the two percents being compared, and Sa and Sb are the standard errors of the percents. The critical value used for two-sided tests at the 0.05 level of significance was 1.96.
Relative standard error
The relative standard error (RSE) of an estimate is obtained by dividing the standard error (SE) of the estimate by the estimate (x) itself. This quantity is expressed as a percent of the estimate:
RSE = 100 ( SE(x))x
In tables 1–5, estimates having an RSE of more than 30% are indicated with an asterisk and are considered statistically unreliable.
Definition of terms
Demographic terms
Age—The sample adult’s age at last birthday was initially provided by the household respondent, but was subsequently verified by the sample adult respondent.
Race-ethnicity—The questions related to race and ethnicity initially were asked of the household respondent for all family members and subsequently verified by the sample adult. A flash card showing the response categories was shown to the respondent. Persons reporting any Hispanic ethnicity were classified as ‘‘Hispanic’’ regardless of racial identification. Respondents were asked to report as many racial identifications as they thought applicable, with a followup question asking which race best described them. The ‘‘best race’’ question was used in this report to classify persons according to a limited set of race groups. The categories ‘‘white non-Hispanic’’ and
22 Advance Data No. 325 + April 7, 2002
‘‘black non-Hispanic’’ are single race categories. The category ‘‘Asian/Pacific Islander non-Hispanic’’ includes Chinese, Filipino, Hawaiian, Vietnamese, Japanese, Korean, Samoan, Guamanian, Asian Indian, and any other Asian/Pacific Islander group. Several race-ethnic groups identified in the NHIS were not shown separately in this report due to small sample sizes and large standard errors associated with most statistics for these groups. These include American Indian, Aleut, Eskimo, multiple races with no main race specified, and other unspecified races. These groups are included in the totals in each table.
Education—This question was asked of the household respondent, but not verified with the sample adult. The question asks for the highest level of school attended or highest degree received. Respondents were shown a flash card to choose an appropriate category. Greater detail is available on the data file; categories were combined due to small sample size in some groups.
Poverty status—Poverty status is based on family income and family size using the U.S. Census Bureau’s poverty thresholds (31). Each adult’s poverty status is expressed in terms of a ratio of family income to the poverty threshold. The lowest income group consists of persons living below the poverty level (less than 1.00). The highest income group consists of persons whose family incomes were at least 4 times the poverty level (4.00 or more).
Marital status—Respondents were asked to choose a marital status category and beginning in 1997, one of the choices was ‘‘living with partner,’’ which is also termed ‘‘cohabiting.’’ Adults could select the category they felt most appropriate for their marital situation. The major differences in the 1997 NHIS design is that persons who were ‘‘living with partner’’ were considered members of the same family, whereas in the pre-1997 NHIS, they were considered separate families.
Geographic region—The four major regions of the United States are defined by the U.S. Bureau of the Census.
MSA—MSA or metropolitan statistical area, a term first used in 1983,
was defined by the U.S. Office of Management and Budget and is used by the U.S. Bureau of the Census to classify geographic areas (32). The categories shown in this report are: (a) ‘‘MSA, central city,’’ which generally refers to cities with populations of 50,000 or more; (b) ‘‘MSA, not central city,’’ which refers to communities adjacent to the central city of an MSA that have a high degree of economic and social integration with the central city; and (c) ‘‘Not MSA,’’ which refers to more rural areas of the country. The classification of areas in the 1997–98 NHIS is based on data from the 1990 decennial census.
Leisure-time physical activity terms
All questions related to leisure-time physical activity were phrased in terms of current behavior and lack a specific reference period. An introductory phrase explained to respondents that they were being asked about leisure-time physical activities only. In this report, persons who volunteered a response indicating that they were ‘‘unable to do the activity’’ were combined with those saying they ‘‘never’’ engaged in the activity.
Physically inactive—Engaged in no light, moderate, or vigorous leisure-time physical activity lasting 10 minutes or longer. Persons classified as physically inactive may include individuals who engaged in strengthening activities but no other type of physical activity.
At least some activity—Engaged in at least some light, moderate, or vigorous leisure-time physical activity lasting 10 minutes or longer. Includes all persons who did any leisure-time activity lasting at least 10 minutes, regardless of frequency.
Light-moderate activity—Activity lasting at least 10 minutes that caused light sweating and slight-moderate increase in breathing or heart rate.
Vigorous activity—Activity lasting at least 10 minutes that caused heavy sweating and large increases in breathing or heart rate.
Regular activity— Regular light-moderate activity is
light-moderate activity that occurs 5 or
more times per week for at least 30 minutes each time.
Regular vigorous activity is vigorous activity that occurs 3 or more times per week for at least 20 minutes each time.
Any regular activity is either regular light-moderate, regular vigorous, or both. It does not include other combinations of activity levels (e.g., vigorous activity twice a week combined with light-moderate activity 3 times a week). The number of individuals with such combinations of activity is small.
Strengthening activity—Any physical activity designed specifically to strengthen muscles, including, but not limited to, weight lifting or calisthenics. The reference period was unspecified and no information on duration was collected. Strengthening activities may overlap with light, moderate, or vigorous activities because respondents were told to report such activities even if they had included them in their previous responses to light-moderate or vigorous activities.
Physical activity questions
The 1997 and 1998 National Health Interview Survey Sample Adult questionnaires contained the five questions on physical activity shown below. Each question is preceded by its question number, beginning with AHB. AHB is the acronym for the Adult Health Behavior section of the Sample Adult questionnaire. The complete NHIS Sample Adult questionnaire as well as information about other components of the NHIS are available at: http:// www.cdc.gov/nchs/nhis.htm.
The following introductory phrase was read to the respondent by the interviewer immediately before asking the physical activity questions:
The next questions are about physical activities (exercise, sports, physically active hobbies...) that you may do in your LEISURE time.
AHB.090 How often do you do VIGOROUS activities for AT LEAST 10 MINUTES that cause HEAVY sweating
AHB.100 About how long do you do these vigorous activities each time?
AHB.110 How often do you do LIGHT OR MODERATE activities for AT LEAST 10 MINUTES that cause ONLY LIGHT sweating or a SLIGHT TO MODERATE increase in breathing or heart rate?
AHB.120 About how long do you do these light or moderate activities each time?
AHB.130 How often do you do physical activities specifically designed to STRENGTHEN your muscles such as lifting weights or doing calisthenics? (Include all such activities even if you mentioned them before.)
24 Advance Data No. 325 + April 7, 2002
Suggested citation Copyright information National Center for Health Statistics
Schoenborn CA, Barnes PM. Leisure-Time All material appearing in this report is in the Director Physical Activity Among Adults: United States, public domain and may be reproduced or Edward J. Sondik, Ph.D. 1977–98. Advance data from vital and health statistics; no. 325. Hyattsville, Maryland: National Center for Health Statistics. 2002.
copied without permission; citation as to source, however, is appreciated.
Deputy Director Jack R. Anderson
DEPARTMENT OFHEALTH & HUMAN SERVICES
Centers for Disease Control and PreventionNational Center for Health Statistics6525 Belcrest RoadHyattsville, Maryland 20782-2003
OFFICIAL BUSINESSPENALTY FOR PRIVATE USE, $300
To receive this publication regularly, contactthe National Center for Health Statistics bycalling 301-458-4636E-mail: [email protected]: www.cdc.gov/nchs