Working Papers R & D * Faculty of Commerce and Economics, University of New South Wales, Sydney, Australia 2052. ** Australian Graduate School of Management, University of New South Wales, Sydney, Australia 2052. † Professor of Marketing, INSEAD, Boulevard de Constance, 77305, Fontainebleau Cedex, France. A working paper in the INSEAD Working Paper Series is intended as a means whereby a faculty researcher's thoughts and findings may be communicated to interested readers. The paper should be considered preliminary in nature and may require revision. Printed at INSEAD, Fontainebleau, France. Kindly do not reproduce or circulate without permission. THE NATURE OF LEAD USERS AND MEASUREMENT OF LEADING EDGE STATUS by P. MORRISON* J. ROBERTS** and D. MIDGLEY† 2002/110/MKT (Revised Version of 2002/91/MKT)
Transcript
Working Papers
R & D
* Faculty of Commerce and Economics, University of New South Wales, Sydney, Australia2052.
** Australian Graduate School of Management, University of New South Wales, Sydney,
Australia 2052. † Professor of Marketing, INSEAD, Boulevard de Constance, 77305, Fontainebleau Cedex,
France. A working paper in the INSEAD Working Paper Series is intended as a means whereby a facultyresearcher's thoughts and findings may be communicated to interested readers. The paper should beconsidered preliminary in nature and may require revision. Printed at INSEAD, Fontainebleau, France. Kindly do not reproduce or circulate without permission.
THE NATURE OF LEAD USERS AND MEASUREMENT OF LEADING EDGE STATUS
by
P. MORRISON* J. ROBERTS**
and D. MIDGLEY†
2002/110/MKT (Revised Version of 2002/91/MKT)
1
The Nature of Lead Users and Measurement of Leading Edge StatusPamela D. Morrison
Faculty of Commerce and Economics,University of New South Wales,
Sydney, Australia 2052
John H. RobertsAustralian Graduate School of Management,
University of New South Wales,Sydney, Australia 2052
David F. MidgleyINSEAD,
Fontainebleau, France
(October 2002)Abstract“Lead users” are defined as being at the leading edge of markets, and as having a high incentive toinnovate. Empirical research has shown the value of lead user need and solution data to new productdevelopment processes. However, the nature of the lead user construct itself has not been studied todate. In this paper we fill this significant gap by proposing and evaluating a continuous analog to thelead user construct, which we call leading edge status (LES). We establish the validity and reliability ofLES and examine the characteristics of users having high levels of this variable. We also offer a firstexploration of how LES is related to traditional measures in diffusion theory such as innateinnovativeness and time of adoption. We find a strong relationship and explain how users with high LEScan offer a contribution to both predicting and accelerating early product adoption.Key words: lead users, adoption, innovation.
2
1.0: Introduction and OverviewLead users display two characteristics with respect to a given novel product or service: (1) they face
needs that will be general in a marketplace--but face them months or years before the bulk of thatmarketplace encounters them and, (2) they are positioned to benefit significantly by obtaining a solutionto those needs. It has also been argued that lead users were more likely than other users to innovatewhen the product or service they needed was not yet available in the marketplace (von Hippel 1986).This proposition has since been documented in several empirical studies (e.g., Urban and von Hippel1988, Morrison et al 2000, Franke and Shah 2001).
The three variables used by von Hippel, being “ahead of the market,” “level of expected benefit”and “level of innovation,” can in principle be treated as continuous variables. However, empiricalresearch conducted on lead users to date has only segmented user samples into dichotomous lead uservs. non-lead user clusters (e.g., Urban and von Hippel 1988, Herstatt and von Hippel 1992). Thus, theactual nature of the construct – binary or continuous – has not yet been explored.
To enable a finer and more flexible definition of lead users, we introduce the construct of LeadingEdge Status (LES), a continuous variable. We define LES to be “the degree to which organizations useand apply technology innovations in new and different ways to solve problems faced by theorganization, and the degree to which they perceive the benefits of new products earlier than the rest ofthe marketplace”. We define lead users to be those organizations exhibiting high levels of LES. If thedistribution of LES proves to be bipolar then the assumption of a dichotomous classification of thepopulation, as previously used in the literature, will be a good one. If it is unimodal then anyclassification into two discrete groups will tend to be somewhat arbitrary and throw away usefulinformation.
In addition, the correlation of the three variables throughout user populations has not beenpreviously explored. To the extent that these elements are perfectly correlated throughout thepopulation we have a single-faceted construct. To the extent that they are not, we would have someorganizations which are primarily classified as leading edge because of their early novel applications oftechnology, while others would fall into that category primarily due to their early recognition of needs.That is, there is no guarantee that these two elements of the lead user definition are indeed correlatedand that we have a single construct.
In this paper we explore the continuous analog to the lead user construct, LES, and test it’s validityand reliability in a sample of innovating and non-innovating users of information technology drawn fromthe population of Australian libraries. We find that LES is indeed distributed in a continuous, unimodalmanner in our sample of innovating and non-innovating users. We also find that the three componentvariables in LES, being ahead of the trend, having high levels of need, and actual development ofinnovations, are indeed highly correlated throughout our sample.
Urban and von Hippel (1988) suggested that lead users, in addition to their role as innovators, mightserve as opinion leaders to speed the diffusion of new commercial products that are related to theirneeds. That is, lead users may play an important role in the diffusion of many innovations. However,there has as yet been no empirical work linking the idea of lead users to the diffusion paradigm. Webegin this work by exploring the relationship of LES to two other constructs that have been used toaddress the diffusion of innovation: the innate innovativeness of adopters (Midgley and Dowling 1978),and the characteristics of adopters as a function of time of adoption (Rogers 1962, 1995). We find thatLES is strongly related to these other measures of innovation adoption, and that the lead user measure is
3
in some ways complementary to the other two - providing additional information that they do notprovide.
In section 2 of this paper we provide a review of relevant literature. In section 3 we discussour empirical sample and methods. In section 4 we report our findings on the nature of the leaduser construct and LES. In section 5 we report our findings on the relationship between LES andvariables traditionally used in diffusion studies. In section 6 we discuss the implications of ourfindings for an expanded use of the lead user construct in both innovation-related and diffusion-related applications in the marketing research field.
2.0: Literature ReviewResearch on lead users emerged from research into sources of innovation. It was first found
that users rather than manufacturers are often the initial developers of what later becomecommercially significant new products and processes (Enos 1962, Knight 1963, Freeman 1968,Shaw 1985, von Hippel 1988, Shah 1999). Next, it was found that innovation by users tendedto be concentrated among “lead users” of those products and processes (von Hippel 1986,Urban and von Hippel 1988, Morrison, Roberts and von Hippel 2000, Shah 1999, Luthje 2000).That is, users who experienced needs for a given innovation earlier than the majority of the targetmarket (von Hippel 1986).)
Research on innovation-related incentives and capabilities provides a theoretical basis for theempirical observation of innovation by users, and innovation by lead users as well. From the perspectiveof innovation as an economically motivated activity (Mansfield 1968), those users expecting significantlyhigher economic or personal benefit from developing an innovation – one of the two characteristics oflead users – have a higher incentive and are more likely to innovate. Also, given that lead usersexperience needs in advance of the bulk of a target market, the nature, risks, and eventual size of thattarget market are often not clear to manufacturers. This lack of clarity can reduce manufacturers’incentives to innovate, and increase the likelihood that lead users will be the first to develop their owninnovative solutions for leading-edge needs – including those that later prove to represent mainstreammarket demand.
To this point, empirical research on the relationship among the two characteristics of lead users andtheir likelihood of innovating has involved only observations that the three variables just mentioned dostrongly cluster. Thus, Urban and von Hippel (1988) studied the characteristics of a sample of 136users of PC-CAD, a type of software used in the design of printed circuit boards. They found that 24%of these users had innovated by either modifying commercial software or developing their own PC-CAD software. A two-cluster solution explained 24% of the variation in their data. One clustercontained 28% of the respondents. The members of this cluster clearly displayed all the characteristicspostulated for lead users. They were significantly ahead of users in the second cluster with respect totechnical trends in that field. They also had higher needs, as shown by their significantly higher level ofdissatisfaction with commercially-available PC-CAD systems. In addition, many more respondents inthe lead user cluster reported building their own PC-CAD system (87% versus only 1% in the non-leadcluster). Franke and Shah (2001) studied the innovating behavior of 197 members of four sportscommunities. They found that almost one third of the respondents had innovated, with one in seveninnovations considered to be a completely new product by their innovator. They compared theinnovators in their sample with the non-innovators on a number of characteristics and found that the
4
innovators displayed the characteristics of lead users in that they received high benefit from innovatingand were ahead of the trend. On each of these items the innovators were significantly different from thenon-innovators.
Empirical lead user studies, such as those just reviewed, tend to also find that lead users are earlyadopters of new products and services. Thus, Urban and von Hippel (1988) found that users in theirlead user cluster adopted technologies an average of 7 years before users in their non-lead user cluster.Similarly, Franke and Shah (2001) find that innovating users – who tend to be lead users – aresignificantly more in agreement (p<.01) with the statement that: “I have benefited significantly by theearly adoption and use of new products.” These studies simply use this finding as additional support forthe finding that lead users are “ahead of the field” relative to non-lead users. To us, however, thisfinding suggested that it would be useful to explore the relationship of the lead users to other measuresof early adoption of innovation.
In this regard, Urban and von Hippel (1988) have suggested that lead users can fulfill an importantfunction after the launch of new products as opinion leaders, fueling the diffusion process. However,there has as yet been no empirical research on this possibility. Also, Gatignon & Robertson (1985,p863) argue that: "The key to diffusion of technological innovation may be in building the consumerknowledge and experience base for that type of technology". If so, lead users, as early experiencers ofnew technologies may be an important part of the diffusion process. Foxall (1989) supports this idea,arguing that for discontinuous innovations, lead users are crucial in providing detailed implementationexperience to later adopters and play a valuable function in supporting the communication network.Morrison et al (2000) report a significant overlap of organizations that are lead users and opinionleaders. Trondsen (1996) claims that early adoption makes lead users particularly valuable in increasingthe effectiveness of database marketing and magnifying the innovating supplier’s pioneering advantage.
We explore the relationship of the lead user construct to two other important constructs indifferentiating between the adoption patterns of users: Rogers’ (1995) time of adoption and Midgleyand Dowling’s (1978) innate innovativeness. Rogers (1995, and in earlier editions of his book goingback to 1962) defines innovators as those individuals or units of adoption possessing a high level ofinnovativeness, where innovativeness is the “degree to which an individual or other unit of adoption isrelatively earlier in adopting new ideas than other members of the social system”. Rogers (1995)proposes a unimodal distribution of the population along the adoption time dimension, and there isstrong empirical evidence that the distribution of adoption times is bell-shaped rather than bimodal (seeMahajan, Muller and Bass 1993 for a review of models and fits).
While Rogers’ innovativeness (time of adoption) measures a behavior, Midgley and Dowling’s(1978) innate innovativeness measures an inherent characteristic or trait of a population member. Theydefine innate innovativeness as an inherent desire to experiment with the novel rather than a situationalresponse: the extent to which consumers make the adoption decision independently of thecommunicated experience of others.
5
3.0: Method and Sample
3.1 The LES Construct Definedvon Hippel’s definition of lead user, the discrete precursor to our leading edge status, is defined on
the basis of two elements; the recognition of benefits from an innovation early in the process and thepotential for accruing large benefits (von Hippel 1978 p796). In addition, he argues that users withthose characteristics will tend to innovate in order to solve their needs (ibid, p. 798). Thus, lead usersare defined to have two distinguishing features and hypothesized to possess a third, the generation ofnew applications and solutions. To date there has been no empirical study to test the validity of thisconstruct. Clearly, it is an empirical question as to whether these three elements move together andform part of the same construct. Confirmatory factor analysis (CFA) provides an excellent techniquewith which to test this assertion. CFA tests whether hypothesized variables all load on the same factor,leading to an internally consistent construct. See Hair et al (1998) for a detailed description of theapproach.
To operationalize LES four types of measure may be used; the two elements of von Hippel’sdefinition (“benefits recognized early” and “high benefits expected”), his method of identifying lead users(applications generation), and direct elicitation of the construct from respondents (both self reports andfrom third parties). These four groups of variables allow us to examine the internal consistency of thetwo components of von Hippel’s definition and the method that he proposes to use to identify it. If LESdoes represent a single, valid construct we can contrast it to related constructs and test the hypothesisthat lead users form a discrete group identifiable by their score on the resultant LES scale. Once wehave tested the validity of the construct we can study its distribution and the background characteristicsof members with high LES.
3.2 Hypothesized Relationships between LES and Related ConstructsAfter validating the construct of leading edge status the next challenge is to determine how it relates totraditionally used constructs such as innate innovativeness and time of adoption. The construct of LESis expected to be closely related to the construct of Organization Dispositional Innovativeness (ODI),the analog of Midgley and Dowling’s (1978) innate innovativeness in organizations and to Rogers’(1995) behavior measure of Time of Adoption (TOA). Both LES and ODI refer to a cross-categorypredisposition to innovate. Because LES is more contextually dependent than ODI we expect ODI tobe a determinant of LES.
3.3 Experimental SettingTo test the model we needed an industry that exhibited homogeneity of product interest among
respondents; heterogeneity with respect to size, adoption rate, market sector and adoption timing; andthe capability and motivation for good recall. Based on these requirements, libraries were selected asthe organizations to be studied. Technologies in libraries tend to be reasonably homogeneous althoughthe rate of adoption of these technologies is not. There is considerable heterogeneity in the size andtype of information used in each library. Finally, because librarians are in the profession of storing,accessing and retrieving information we expect them to have good capability and motivation for recall.
6
Within each library the primary respondent was the principal librarian or the librarian responsible forinformation processing technology.
The population consisted of 13,000 libraries employing almost 20,000 people. Of theseapproximately 10,000 were school libraries, the majority staffed only part-time. The surveyquestionnaire was sent to 747 libraries, comprising all identified libraries with five or more professionalstaff (i.e. a census of large libraries), and to a stratified sample of the remaining small and mediumlibraries (stratified by library type: Business, Public, Government, Academic, and Tertiary). Within eachtype of library, the final sample was selected by systematic sampling from available lists. The responserate of 62% (n = 463 organizations) showed no obvious bias, with all types and sizes of libraries beingwell represented in relation to their sampling proportion. The libraries in the final sample account for56.5% of people employed by libraries in the population and 50% of the total library spend.
The empirical testing of the model involved a cross-sectional survey of organizations within oneindustry. Restricting the study to one industry may restrict the generalizability of the results, but as thegoal of this research is not primarily external validity, but rather to understand the internal validity of theconcept of lead users, it is necessary to trade off generalizability for a more in-depth study of constructelements (Calder, Phillips & Tybout 1981).
Multi-item scales were used to measure LES and Organizational Dispositional Innovativeness(ODI). Sufficient redundancy was also built into the measurement to provide estimates of convergentvalidity. The behavioral variable Time of Adoption (TOA) was measured for four innovations: OnlinePublic Access Catalogues, Online Database Systems, Searchable Compact Disk Databases, andElectronic Data Interchange. We also suggest the use of and test a more general measure of innovativebehavior, the actual number of innovations adopted by an organization.
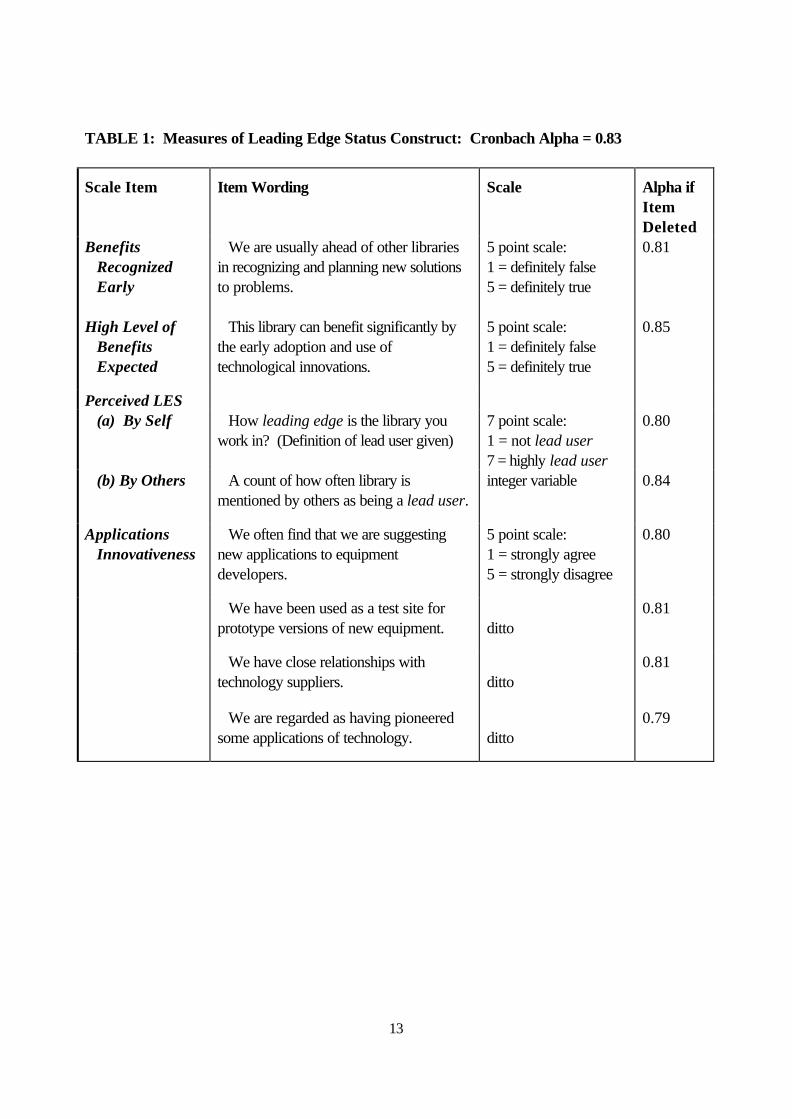
3.4 Measures Used to Calibrate LES and Related VariablesMulti-item measures of LES were developed based on previous lead user literature. Table 1 containsdetails of the measures used.
Insert Table 1 about here
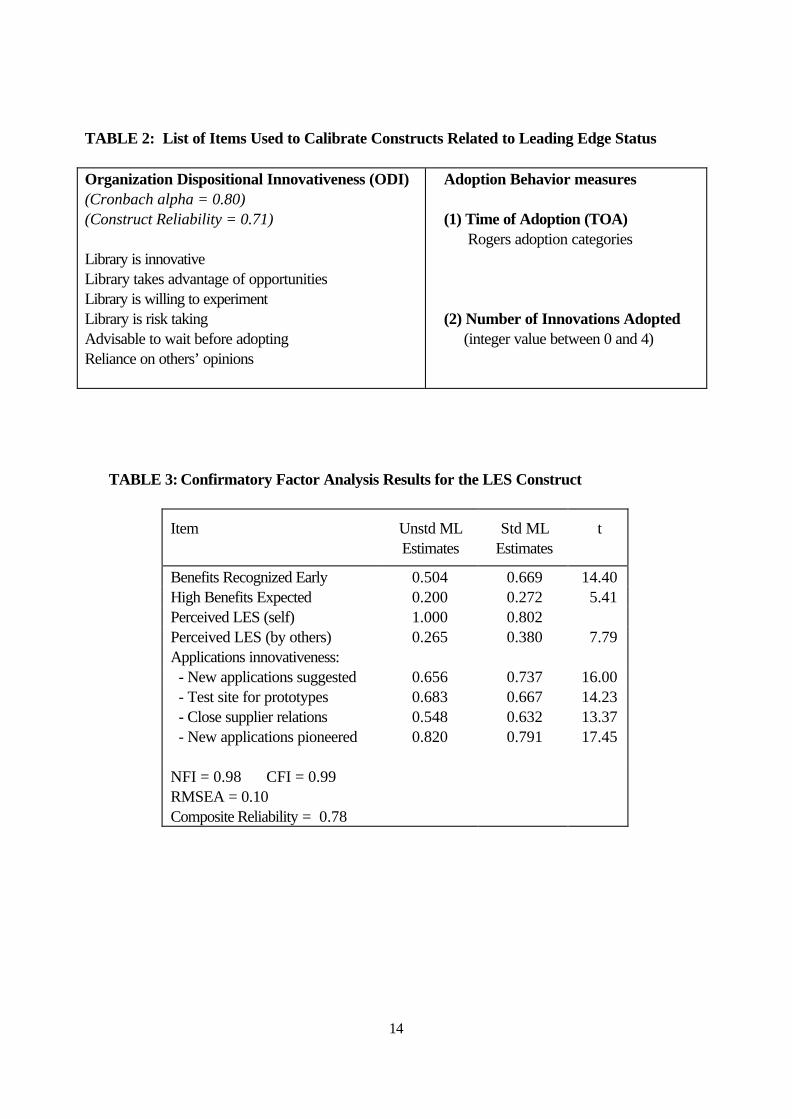
The eight measures of the elements of LES in Table 1 enable us to examine the construct validity of theconcept. To relate it to the traditional constructs of adoption traits and behavior we also need measuresof these variables. The adoption trait, ODI, is measured by six items, reflecting the Midgley andDowling (1978) definition of dispositional innovativeness. Confirmatory factor analysis techniques areused to estimate the measurement model using maximum-likelihood in AMOS. The ODI construct hasa Cronbach alpha of 0.80 and construct reliability of 0.71. Behavior is measured in two ways, firstly byRogers “time of adoption” and secondly by the “number of innovations adopted”. This second behaviormeasure captures a more general innovative behavior by the organization, with the more innovativeorganizations expected to have adopted a greater number of recent innovations. A list of these variablesis included in Table 2.
Insert Table 2 about here
7
4.0: Findings on the Nature of the Lead User Construct and LES
The analysis has two objectives. These are to:(1) Test and refine the construct. To clarify what LES is and whether its elements hold together,
leading to an increased understanding of the appropriateness of the construct and its definition.(2)Study the distribution of LES.
We address each of these objectives in turn.
4.1 Testing the Construct of Leading Edge Status.We constructed measures of LES (see Table 1) in accordance with current lead user literature and
our definition of the continuous analog. Initially we need to see how reliable these measures are inrepresenting the LES construct.
The reliability of the construct as measured by Coefficient Alpha is α = 0 .83 with 430 observations(where the unit of analysis is the organization). Given this high level of reliability we estimate the LESmeasurement model using confirmatory factor analysis (using the software package AMOS) to test theunidimensionality of the LES construct. There are no offending estimates and all the parameterestimates are highly significant (see Table 3). The composite reliability measure is 0.78, providingsupport for the reliability of the Leading Edge Status measurement model. Given these results themeasurement model for the Leading Edge Status construct was regarded as highly reliable. The factthat von Hippel’s two definitions of lead user and the third he advances to identify them do form part ofthe same construct, at least in this application, is an important finding.
Insert Table 3 about here
(2) Distribution of LESAs discussed earlier, the assumption and use of a dichotomous distribution of lead users in the
population, as suggested in the literature, has not been empirically tested. By examining the distributionof the continuous analog, LES from the measurement model in Table 3 we can examine that assumption.Figure 3 provides the distribution of LES which demonstrates that it is a unimodal construct, leading tothe recommendation that a lead user dichotomy should not be used as it is not a good representation ofthe population mix and its use throws away useful information.
This distribution of LES is consistent with Rogers’ (1995) assertion of the bell-shaped distribution ofthe related construct, Time of Adoption (TOA) and the diffusion of innovation literature on the timetrajectory of the population adopting an innovation. Because we know of no research which hasstudied the empirical distribution of Midgley and Dowling’s (1978) innate innovativeness construct in theadopting population, in Figure 1 we also show the distributions of ODI and TOA. All are bell-shaped,leading to an interesting conclusion. The diffusion of innovation literature suggests that S-shapeddiffusion patterns occur (leading to bell-shaped distributions of time of adoption) as a result of anincreasing contagion effect followed by the limiting influence of saturation. These results suggest that it isnot just the nature of communications that is causing a bell-shaped curve but also the distribution of
8
population heterogeneity with respect to propensity to adopt innovations (ODI and LES). This isconsistent with the view of the diffusion process advanced by Russell (1980) and Horsky (1990).
Insert Figure 1 about here
5.0: The relationship between LES and traditional diffusion study constructs
The analysis has the following objectives. To:(1) Test the hypothesized relationship between LES and traditional diffusion study
constructs. To learn how LES fits in with previously developed constructs, clarifying the rolelead users might play in the adoption of new technology.
(2) Contrast LES to other measures of innovativeness. To compare and contrast thecharacteristics of “lead users” (i.e. those with high LES) with the characteristics of “innovators”and “early adopters”.
We address each of these objectives in turn.
5.1 The relation of LES to other measures of innovativenessTo examine how LES fits with the adoption literature it is useful to make a direct comparison of
LES to the traditional definitions of innovativeness: innate innovativeness (ODI) and time of adoption(TOA). We also compare LES with the more general behavior measure “number of innovationsadopted”. Pairwise correlations between the constructs, illustrated in Table 4, are all highly significant(p = 0.000). It is not surprising given we are estimating across respondents where there are manyextraneous sources of variation (e.g. people use scales differently) that ρ is much smaller than one. Wecan see from the correlations (ρ (LES, ODI), ρ (LES, TOA) and ρ (LES, no. innov adopted)) that LES is moreclosely related to the trait (ODI) than to the behavior (TOA and Number Innovations Adopted).
Insert Table 4 about here
We test the hypothesized relationship that the more contextually dependent construct, LES, is amediator between the trait measure Organization Dispositional Innovativeness (ODI) and behavior. Wetest two sets of models, one using Rogers behavior measure Time of Adoption (TOA) and the secondusing the more general behavior measure “number innovations adopted”. As per Barron and Kenny(1986) we run a series of regression models to test whether LES is a mediating variable between ODIand TOA. The results of the regression analyses are summarized in Table 5.
Insert Table 5 about here
To establish that LES mediates the relationship between the trait ODI and adoption behavior, thepath in Model 1 should be significant, the path in Model 2 should be significant, and the path from themediator to the dependent variable in Model 3 should be significant. Each of these requirements issatisfied. Ideally, and for the complete mediation, the coefficient of ODI in Model 3 should be zero.This requirement is satisfied with TOA as the dependent. With the number of innovations as the
9
dependent the magnitude of the coefficient is also markedly reduced compared with Model 2 (althoughit remains significant). LES can thus be said to substantially mediate the relationship between ODI andadoption behavior. Hence, even after controlling for the organization’s innate innovativeness, LES stillcaptures a significant amount of the variation in adoption times.
5.2 Contrasting LES to other measures of innovativenessHaving examined the interrelation of these three constructs we proceed to investigate how each is
related to other characteristics of the organization. These results are presented in Table 6. All pairwisecorrelations are significant. While Table 4 illustrated that there is substantial overlap between the threeconstructs, Table 6 shows that there are also considerable differences between them. High LESorganizations are generally larger in size than organizations with high ODI or those that adopt early. Thisis consistent with the opportunity to reap greater benefits. The level of respondent knowledge aboutspecific innovations is more highly correlated with the contextual LES measure and behavior TOA thanwith the trait ODI. Organizations with high ODI and high LES are more likely to perform better andhave a wider range of services than libraries of a similar type and size, to enjoy a higher level ofautonomy in new technology decisions, and have higher levels of financial resources than organizationswith just early Time of Adoption. Respondents were asked to name organizations they communicatedwith on a regular basis as well as those they might approach for information about technologicalinnovations. We find in our sample that lead users are more likely to be sought out for information onboth general and specific innovation matters. This is an important finding highlighting the potential role oflead users in seeding the diffusion process.
Insert Table 6 about here
6.0: DiscussionIn this research we have validated the lead user construct. The correlation between early benefits
expected and large benefits was 0.295 (highly significant with p = 0.000 and reasonably largeconsidering the other sources of variation between respondents). All four measures of applicationsinnovativeness were consistent with the lead user construct, suggesting high construct validity betweenthe construct and the measures von Hippel earlier proposed for its identification.
We addressed the previously held assumption that lead users were dichotomous by examining theempirical distribution of Leading Edge Status (LES), the continuous analog of lead user. LES wasfound to have a unimodal distribution making any dissection of it arbitrary and meaning that talking oflead users/others throws away valuable information. Thus, for this population at least, the continuousvariable LES appears to be a more useful and more informative measure, particularly when trying tounderstand the continuous behavioral variable, time of adoption (TOA) in terms of the continuous trait,innate innovativeness (ODI).
We have also related lead users to other constructs in the adoption of innovations literature. Ourdata supported the hypothesized role of LES as an intermediate construct mediating the link betweenthe trait, ODI, and adoption behavior. LES adds significantly in explaining organizations’ times ofadoption, even after accounting for their dispositional innovativeness. Finally, it is more highly correlatedwith the majority of respondents background characteristics than either ODI or TOA suggesting that itmay be more easily identified by these surrogates than other measures of innovativeness.
10
Our findings suggest expanded use of the lead user construct in both innovation-related anddiffusion-related applications in the marketing research field. Lead users, being “advanced” relative toan adopting population, can be harnessed for forecasting purposes and to generate new products basedon their advanced application status. We also explore and suggest the value of the role they play in thecontagion process (assisting others in the adoption process). This is a function of their early adoption ofnew products for which they are lead users, combined with their importance as communication sources.
Further research will clearly be useful to test the results of this study in a number of differentindustries. Although there seems little reason why our results would not carry over to other adoptingpopulations, their external validity needs to be established. Also, we have looked solely at the role ofleading edge status in the adoption decisions of individual’s own organizations. It would be valuable tonow relate this to their role in the adoption decisions of others, as well as relate it to the level ofinnovation that they undertake internally.
In conclusion, the study of lead users is attracting increasing attention because of their value as earlyadopters, sources of new product ideas, market research potential, and their role in fueling the diffusionprocess. In this paper, we have attempted to consolidate the measurement basis on which the lead userconcept is founded and relate it to other approaches studying differences between adoption behavior inthe population.
11
ReferencesBaron, Reuben M., and David A. Kenny, 1986, “The Moderator-Mediator Variable Distinction in
Social Psychological Research: Conceptual, Strategic, and Statistical Considerations,” Journal ofPersonality and Social Psychology, Vol. 51, No. 6, 1173-1182.
Calder, Bobby J., Lynn W. Phillips and Alice M. Tybout, 1981, “Designing Research for Application,”Journal of Consumer Research, Vol. 8, No. 2, 197-207.
Day, George, 1993, “New Directions for Corporations: Conditions for Successful Renewal,”European Management Journal, 11, No. 2 (June), 229-237
Enos, J. L., 1962, Petroleum Progress and Profits: A History of Process Innovation, Cambridge,MA: MIT Press
Foxall, Gordon R., 1989, "User Initiated Product Innovations," Industrial Marketing Management,18, 95-104.
Franke, Nikolaus, and Sonali Shah, 2001, "How Communities Support Innovative Activities: anExploration of Assistance and Sharing Among End-Users," MIT Sloan School of ManagementWorking Paper #4164 (August). Research Policy forthcoming (2003).
Freeman, C., 1968, "Chemical Process Plant: Innovation and the World Market," National InstituteEconomic Review 45 (August), 29-57.
Gatignon, Hubert and Thomas S. Robertson, 1985, "A Propositional Inventory for New DiffusionResearch," Journal of Consumer Research, Vol. 11, March, 849-867.
Hair, Joseph F., Jr, Rolph R. Anderson, Ronald L. Tatham and William C. Black, 1998, MultivariateData Analysis; with Readings, Fifth Edition, NY Macmillan Publishing Company.
Herstatt, Cornelius and Eric von Hippel, 1992, “From Experience: Developing New Product Conceptsvia the Lead User Method - A Case Study in a “Low Tech” Field,” Journal of ProductInnovation Management 9, No. 3 (September), 213-221.
Horsky, Dan, 1990, “A Diffusion Model Incorporating Product Benefits, Price, Income andInformation,” Marketing Science 9, No. 4 (Fall), 342-365.
Knight, K. E., 1963, “A Study of Technological Innovation: The Evolution of Digital Computers,”Unpublished Ph.D. Dissertation, Carnegie Institute of Technology, Pittsburgh, PA.
Lilien, Gary L., Pamela D. Morrison, Kathleen Searls, Mary Sonnack, and Eric von Hippel,(forthcoming), “Performance Assessment of the Lead User Idea Generation Process”,Management Science.
Luthje, Christian, 2000, "Characteristics of Innovating Users in a Consumer Goods Field," : Anempirical study of sport-related product consumers," MIT Sloan School of Management workingpaper.
Mahajan, Vijay, Eitan Muller and Frank M. Bass, 1993, “New Product Growth Models,” inMarketing, Eliashberg Jehoshua and Gary Lilien, eds., Amsterdam: North Holland, 349-408.
Mansfield, Edwin, 1968, The Economics of Technological Change, New York: W. W. Norton &Company.
Midgley, David F. and Grahame R. Dowling, 1978, "Innovativeness: The Concept and ItsMeasurement," Journal of Consumer Research, Vol.4, March, 229-42.
Morrison, Pamela D., John H. Roberts, and David F. Midgley, 2000, “Opinion Leadership AmongstLeading Edge Users,” Australasian Marketing Journal, Vol. 8, No. 1, 5-14.
12
Morrison, Pamela D., John H. Roberts and Eric von Hippel, 2000, “Determinants of UserInnovation and Innovation Sharing in a Local Market,” Management Science, 46, 12(December), 1513-1527.
Morrison, Pamela D., John H. Roberts, and David F. Midgley, 1999, “Towards a Finer Understandingof Lead Users,” ISBM Report 15-1999, Institute for the Study of Business Markets, Penn StateUniversity.
Rogers, Everett M., 1962, 1995, Diffusion of Innovations: 3rd Ed., The Free Press: New York.Russell, T., 1980, “Comments on the Relationship between Diffusion Rates, Experience Curves and
Demand Elasticities for Consumer Durable Technological Innovations,” Journal of Business ,3,No. 3, 569-578.
Shah, Sonali, 1999, "Sources and Patterns of Innovation in a Consumer Products Field: Innovations inSporting Equipment," MIT Sloan School of Management Working Paper #410 (May).
Shaw, B., 1985, "The Role of the Interaction Between the User and the Manufacturer in MedicalEquipment Innovation," R&D Management 15, 4 (October), 283-92.
Trondsen, Tor Jarl, 1996, “Some Characteristics of Adopters of a Major Innovation in the ComputerField and of Potential Use in Marketing,” Industrial Marketing Management, 25, No. 6(November), 567-576.
Urban, Glen L. and Eric von Hippel, 1988, "Lead User Analyses For The Development of NewIndustrial Products," Management Science, Vol. 34, No. 5, May, 569-582.
von Hippel, Eric, 1978, "Successful Industrial Products From Customer Ideas," Journal of Marketing,January, 39-49.
von Hippel, Eric, 1986, "Lead Users: A Source of Novel Product Concepts," Management Science,Vol. 32, No. 7, July, 791-805.
von Hippel, Eric (1988), The Sources of Innovation, New York: Oxford University Press.Wagner, Christian and Albert Hayashi, 1994, “A New Way to Create Winning Product Ideas,”
Journal of Product Innovation Management, 11, No. 2 (March), 146-155.
13
TABLE 1: Measures of Leading Edge Status Construct: Cronbach Alpha = 0.83
Scale Item Item Wording Scale Alpha ifItemDeleted
BenefitsRecognizedEarly
We are usually ahead of other librariesin recognizing and planning new solutionsto problems.
5 point scale:1 = definitely false5 = definitely true
0.81
High Level ofBenefitsExpected
This library can benefit significantly bythe early adoption and use oftechnological innovations.
5 point scale:1 = definitely false5 = definitely true
0.85
Perceived LES (a) By Self How leading edge is the library you
work in? (Definition of lead user given)7 point scale:1 = not lead user7 = highly lead user
0.80
(b) By Others A count of how often library ismentioned by others as being a lead user.
integer variable 0.84
ApplicationsInnovativeness
We often find that we are suggestingnew applications to equipmentdevelopers.
5 point scale:1 = strongly agree5 = strongly disagree
0.80
We have been used as a test site forprototype versions of new equipment. ditto
0.81
We have close relationships withtechnology suppliers. ditto
0.81
We are regarded as having pioneeredsome applications of technology. ditto
0.79
14
TABLE 2: List of Items Used to Calibrate Constructs Related to Leading Edge Status
Library is innovativeLibrary takes advantage of opportunitiesLibrary is willing to experimentLibrary is risk takingAdvisable to wait before adoptingReliance on others’ opinions
Adoption Behavior measures
(1) Time of Adoption (TOA) Rogers adoption categories
(2) Number of Innovations Adopted (integer value between 0 and 4)
TABLE 3: Confirmatory Factor Analysis Results for the LES Construct
Item Unstd MLEstimates
Std MLEstimates
t
Benefits Recognized Early 0.504 0.669 14.40High Benefits Expected 0.200 0.272 5.41Perceived LES (self) 1.000 0.802Perceived LES (by others) 0.265 0.380 7.79Applications innovativeness: - New applications suggested 0.656 0.737 16.00 - Test site for prototypes 0.683 0.667 14.23 - Close supplier relations 0.548 0.632 13.37- New applications pioneered 0.820 0.791 17.45