+ All Categories
Home > Documents > Lesson 1: Inequalities on the number line

Lesson 1: Inequalities on the number line

Date post: 14-Nov-2021
Category:
Upload: others
View: 0 times
Download: 0 times
Share this document with a friend
44
Topic 18: Solving linear inequalities 77 Copyright © 2017 Charles A. Dana Center at the University of Texas at Austin, Learning Sciences Research Institute at the University of Illinois at Chicago, and Agile Mind, Inc. SOLVING LINEAR INEQUALITIES Lesson 1: Inequalities on the number line LESSON 1: OPENER Consider the inequality x > 7. 1. List five numbers that make the inequality true. 8, 10, 11, 13, 15 2. Plot your five numbers on the number line. 3. Does an x value of 7.25 make the inequality true? Yes 4. Does an x value of 6 1 2 make the inequality true? No 5. Write a sentence that describes all of the numbers that make this inequality true. All numbers that make x > 7 true are greater than 7 or are to the right of 7 on the number line. LESSON 1: CORE ACTIVITY 1. Graph the solutions for the following mathematical statements: a. x = 2.25 b. x < 4 c. x >0 d. x > 7 e. x < 4 2 5 f. x ≠5 5 10 15 7
Transcript

Topic  18:  Solving  linear  inequalities   77  

Copyright  ©  2017  Charles  A.  Dana  Center  at  the  University  of  Texas  at  Austin,  Learning  Sciences  Research  Institute  at  the  University  of  Illinois  at  Chicago,  and  Agile  Mind,  Inc.  

SOLVING LINEAR INEQUALITIES Lesson 1: Inequalities on the number line

LESSON 1: OPENER

Consider  the  inequality  x  >  7.  

1. List  five  numbers  that  make  the  inequality  true.  

8, 10, 11, 13, 15

2. Plot  your  five  numbers  on  the  number  line.  


3. Does  an  x  value  of  7.25  make  the  inequality  true?    

Yes

4. Does  an  x  value  of   6 12  make  the  inequality  true?  

No

5. Write  a  sentence  that  describes  all  of  the  numbers  that  make  this  inequality  true.  

All numbers that make x > 7 true are greater than 7 or are to the right of 7 on the number line.  

LESSON 1: CORE ACTIVITY

1. Graph  the  solutions  for  the  following  mathematical  statements:  

a.          x  =  -­‐2.25  


b.          x  <  -­‐4  


c.          x  >  0  


d.          x  >  -­‐7  


e.          x  <   4 25  


f.          x  ≠  5  


5 10 15 7

78   Topic  18:  Solving  linear  inequalities  

Copyright  ©  2017  Charles  A.  Dana  Center  at  the  University  of  Texas  at  Austin,  Learning  Sciences  Research  Institute  at  the  University  of  Illinois  at  Chicago,  and  Agile  Mind,  Inc.  

2. Consider  this  compound  inequality:    

x  <  –1  or  x  >  4  

a. Complete  the  table  by  determining  whether  the  values  for  x  make  the  statement  true.    

Value  for  x   Makes  the  statement  true  Yes/No  

-­‐4   Yes

-­‐2   Yes

0   No

π   No

7   Yes

12   Yes

b. List  five  additional  numbers  that  make  this  compound  inequality  true.    Student responses will vary  


3.   a.            Construct  a  graph  on  the  number  line  to  represent  the  inequality  x  <  –1.  


b.            Construct  a  graph  on  the  number  line  to  represent  the  inequality  x  >  4.  


c.          Construct  a  graph  on  the  number  line  to  show  ALL  the  numbers  that  make  the  compound  inequality                      x  <  –1  or  x  >  4  true.    Use  the  graphs  you  sketched  in  3a  and  3b  to  help  you.  


4.   On  a  number  line,  show  all  of  the  numbers,  x,  such  that  x  >    -­‐2  or  x  <  7.  


Topic  18:  Solving  linear  inequalities   79  

Copyright  ©  2017  Charles  A.  Dana  Center  at  the  University  of  Texas  at  Austin,  Learning  Sciences  Research  Institute  at  the  University  of  Illinois  at  Chicago,  and  Agile  Mind,  Inc.  

5.   Consider  the  following  compound  inequality:      

x  >  –2  and  x  <  7  

a. Complete  the  table  by  determining  whether  the  values  for  x  make  the  statement  true.  

Value  for  x   Makes  the  statement  true  Yes/No  

-­‐4   No

-­‐2   No

0   Yes

π   Yes

7   No

12   No

b. List  five  additional  numbers  that  make  this  statement  true.  Student responses will vary    

6.    a.        Construct  a  graph  on  the  number  line  to  represent  the  inequality  x  >  –2.  


b.        Construct  a  graph  on  the  number  line  to  represent  the  inequality  x  <  7.  


c.          Construct  a  graph  on  the  number  line  to  show  ALL  the  numbers  that  make  the  statement  in  question  5  true.                      To  help  you  construct  the  final  graph,  consider  your  work  from  questions  5a  and  5b.  


7. On  a  number  line,  show  all  of  the  numbers,  x,  such  that  x  <  -­‐3  and  x  ≥  2.    


No Solution Empty Set

There are no values that make both inequalities true.

80   Topic  18:  Solving  linear  inequalities  

Copyright  ©  2017  Charles  A.  Dana  Center  at  the  University  of  Texas  at  Austin,  Learning  Sciences  Research  Institute  at  the  University  of  Illinois  at  Chicago,  and  Agile  Mind,  Inc.  

8. Construct  a  graph  on  each  number  line  to  show  the  solution  set  for  each  compound  inequality.  Then,  describe  the            solution  set  for  each  compound  inequality  using  one  of  these  four  descriptions:    (1)  some  but  not  all  real  numbers,            (2)  an  empty  set,  (3)  all  real  numbers,  or  (4)  exactly  one  number.  

Graph   Solution  set  

a.   x  <  4  and  x  >  6    


Empty set

b.   x  <  6  or  x  >  4    


All real numbers

c.   x  <  6  and  x  >  4    


Some but not all real

numbers

d.   x  <  4  or  x  >  6    


Some but not all real

numbers

e.   x  ≤  5  or  x  ≥  5    


All real numbers

f.   x  ≤  5  and  x  ≥  5    


Exactly one number

LESSON 1: CONSOLIDATION ACTIVITY

1. For  each  card  numbered  1  through  10,  work  with  your  partner  to  find  a  match  using  the  lettered  cards.  Then,  write  the  letter  of  the  matching  card  in  the  table.  

Inequality  card  number   1   2   3   4   5   6   7   8   9   10  

Number  line  card  letter   D J B F I H A G E C

2. Write  an  equation  or  inequality  that  would  produce  the  same  number  line  graph  as  x  ≤  4  and  x  ≥  4  x = 4

3. Write  an  equation  or  inequality  that  would  produce  the  same  number  line  graph  as  x  <  5  or  x  ≤  4.  x < 5  

4. Write  an  equation  or  inequality  that  would  produce  the  same  number  line  graph  as  x  <  4  or  x  >  4.  x ≠ 4  


Topic  18:  Solving  linear  inequalities   81  

Copyright  ©  2017  Charles  A.  Dana  Center  at  the  University  of  Texas  at  Austin,  Learning  Sciences  Research  Institute  at  the  University  of  Illinois  at  Chicago,  and  Agile  Mind,  Inc.  

LESSON 1: HOMEWORK

Notes  or  additional  instructions  based  on  whole-­‐class  discussion  of  homework  assignment:  


1. Match  the  inequality  to  its  representation  on  a  number  line.  

a. x  <  -­‐4.5   _____   i.    

b. x  ≠  -­‐4.5   _____   ii.    

c. x  >  -­‐4.5   _____   iii.    

d. x  =  -­‐4.5   _____   iv.    

e. x  <  -­‐4.5   _____   v.    

f. x  >  -­‐4.5   _____   vi.    


2.   Write  an  inequality  statement  whose  solution  is  an  empty  set.  

Student responses will vary

 3.      Write  an  inequality  statement  whose  solution  is  some  but  not  all  real  numbers.    Graph  the  solution  on  a  number  line.  

Student responses will vary

4.     Write  an  inequality  statement  whose  solution  is  all  real  numbers.  Graph  the  solution  on  a  number  line.  

Student responses will vary  

5.   Write  an  inequality  statement  whose  solution  is  exactly  one  number.  Graph  the  solution  on  a  number  line.  

Student responses will vary

6.   Write  an  inequality  statement  to  represent  the  graph  shown.  x < -5 or x > 2  


7. Write  an  inequality  statement  to  represent  the  graph  shown.  x < 2 and x > -5  


iii

vi

i

v

iv

ii

82   Topic  18:  Solving  linear  inequalities  

Copyright  ©  2017  Charles  A.  Dana  Center  at  the  University  of  Texas  at  Austin,  Learning  Sciences  Research  Institute  at  the  University  of  Illinois  at  Chicago,  and  Agile  Mind,  Inc.  

LESSON 1: STAYING SHARP Practic

ing  skills  &  con

cepts  

1. Select  the  appropriate  symbol  (<,  >,  or  =)  to  describe  the  relationship  between  each  pair  of  numbers.  


a.   1.09   < 1.1  


b.   87   >   1.1  


c.   –1.09   >   –1.1  


d.   – 87   <   –1.1  


2. List  the  lines  according  to  the  value  of  their  slopes.  List  them  in  order  from  the  smallest  slope  value  to  the  largest  slope  value.  


   Answer:  D, A = C, B  

Prep

aring  for  u

pcom

ing  lesson

s  

3. Which  pair  of  x-­‐  and  y-­‐coordinates  appears  in  the  tables  for  both  functions?       y  =  2x  –  7     y  =  –3x  +  8       –4   –15     –4   20       –3   –13     –3   17       –2   –11     –2   14       –1   –9     –1   11       0   –7     0   8       1   –5     1   5       2   –3     2   2       3   –1     3   –1       4   1     4   –4    

Answer:  (3,-1)    

4. What  are  the  coordinates  of  the  point  of  intersection  of  the  two  lines  in  the  graph?    


Answer:  (3,-1)  

Review

ing  ideas  from

 earlier  g

rade

s  

5. What  is  the  slope  of  the  line?  A  slope  triangle  is  drawn  for  you.    


Answer:  ¼    

6. Write  an  equation  for  the  line  in  Question  5.    Answer  with  supporting  work:  


y-intercept = 0

slope = ¼

y = ¼ x + 0

y = ¼ x


Topic  18:  Solving  linear  inequalities   83  

Copyright  ©  2017  Charles  A.  Dana  Center  at  the  University  of  Texas  at  Austin,  Learning  Sciences  Research  Institute  at  the  University  of  Illinois  at  Chicago,  and  Agile  Mind,  Inc.  

Lesson 2: Introduction to solving linear inequalities

LESSON 2: OPENER A  car  rental  company  charges  $29.95  plus  16  cents  per  mile  for  each  mile  driven.    

1. Write  a  function  rule  to  describe  the  relationship  between  the  cost  of  the  rental,  r,  and  the  number  of  miles  you  drove,  m.     r = 29.95 + 0.16m

2. What  input  value  would  result  in  an  output  value  of  $75?  

75 = 29.95 + 0.16m 281.5625 miles

LESSON 2: CORE ACTIVITY 1. Write  an  inequality  to  represent  the  situation  below.  

A  car  rental  company  charges  $29.95  plus  16  cents  per  mile  for  each  mile  driven.  Your  boss  is  very  careful  with  the  company's  money.  She  wants  you  to  plan  your  business  trips  so  you  will  not  spend  more  than  $75  for  car  rental  fees.    

75 ≥ 29.95 + 0.16m, which can also be written as 29.95 + 0.16m ≤ 75

2. Solve  the  inequality  you  wrote  in  question  1  to  determine  how  many  miles  you  could  drive  and  spend  $75  or  less  for  the  trip.  Your  teacher  will  assign  you  and  your  partner  a  particular  method  for  solving  the  inequality.  Create  a  poster  presenting  your  solution.    m ≤ 281.5625 (In reality, since many rental companies round to the whole mile, m ≤ 281.)                          

3. List  the  four  methods  you  will  be  using  in  this  topic  to  solve  linear  inequalities.    

Tables, Graphs, Variables, and Words

4. Complete  a  journal  entry.    

Vocabulary  term   My  understanding  of    what  the  term  means  

An  example  that  shows  the    meaning  of  the  term  

 Linear  inequality  


Student responses will vary

Student responses will vary

84   Topic  18:  Solving  linear  inequalities  

Copyright  ©  2017  Charles  A.  Dana  Center  at  the  University  of  Texas  at  Austin,  Learning  Sciences  Research  Institute  at  the  University  of  Illinois  at  Chicago,  and  Agile  Mind,  Inc.  

LESSON 2: CONSOLIDATION ACTIVITY

Your  boss  is  still  trying  to  save  money  on  car  rentals.  You  compare  Omega  Car  Rental,  which  charges  $72.00  per  day  with  unlimited  free  mileage,  and  Optimal  Car  Rental,  which  charges  $22.90  plus  30  cents per  mile.  

1.     Some  days  you  drive  many  miles,  and  some  days  you  drive  fewer  miles.  Determine  the  range  of  daily  mileage  for  which  each  company  is  the  less  expensive  choice.  

Omega: r = $72

Optimal: r = 22.90 + .30m

To find when the two companies charge the same: 72 = 22.90 + .30m

If you travel 163 2/3 miles, the two companies will charge the same for rental.

If you travel less than 1632/3 miles per day, Optimal Car Rental is the cheapest. If you travel more than 163 2/3 miles per day, Omega Car Rental is cheaper.


2.     Write  a  report  to  your  boss  that  includes  your  recommendations  about  which  car-­‐rental  company  to  use  depending  on  the  number  of  miles  you  plan  to  drive.  Explain  how  you  arrived  at  your  recommendation.  Use  computations,  graphs,  or  tables  to  provide  support  for  your  conclusions.      Responses will use the answers found in question 1. Reports will be different for each student.  


Topic  18:  Solving  linear  inequalities   85  

Copyright  ©  2017  Charles  A.  Dana  Center  at  the  University  of  Texas  at  Austin,  Learning  Sciences  Research  Institute  at  the  University  of  Illinois  at  Chicago,  and  Agile  Mind,  Inc.  

LESSON 2: HOMEWORK

Notes  or  additional  instructions  based  on  whole-­‐class  discussion  of  homework  assignment:  


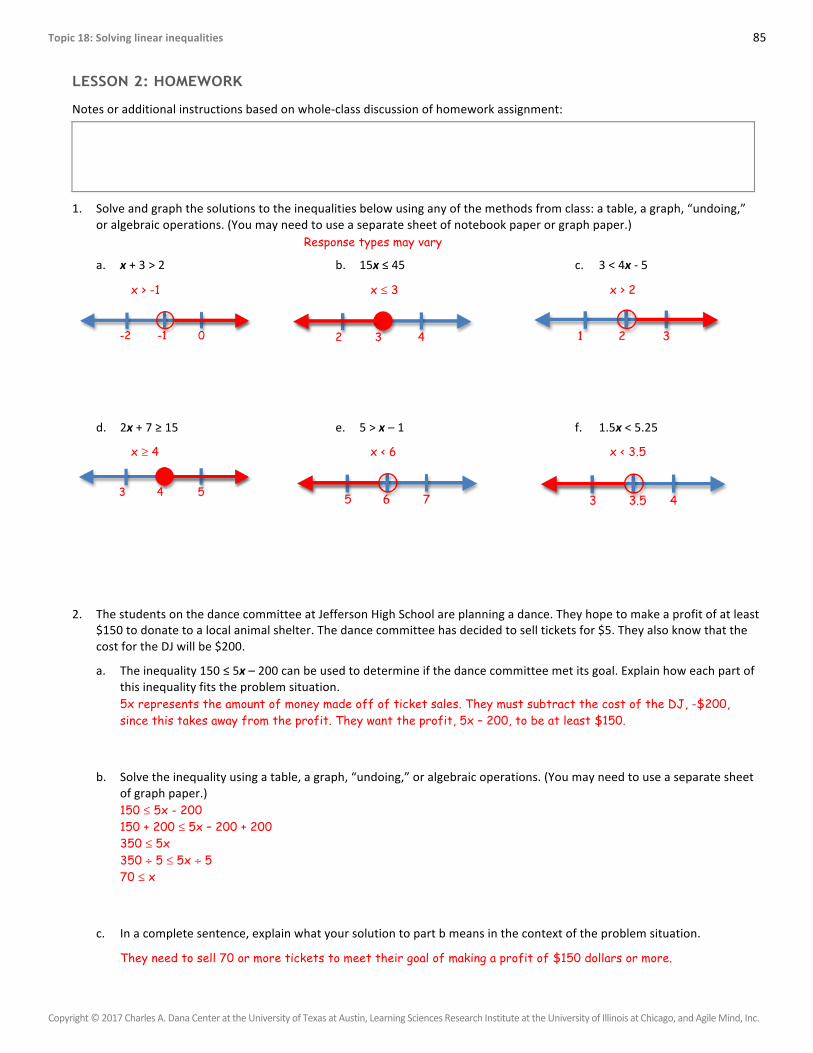
1. Solve  and  graph  the  solutions  to  the  inequalities  below  using  any  of  the  methods  from  class:  a  table,  a  graph,  “undoing,”  or  algebraic  operations.  (You  may  need  to  use  a  separate  sheet  of  notebook  paper  or  graph  paper.)    

 a.   x  +  3  >  2   b.   15x  ≤  45   c.   3  <  4x  -­‐  5                    d.   2x  +  7  ≥  15   e.   5  >  x  –  1   f.   1.5x  <  5.25                      

2. The  students  on  the  dance  committee  at  Jefferson  High  School  are  planning  a  dance.  They  hope  to  make  a  profit  of  at  least  $150  to  donate  to  a  local  animal  shelter.  The  dance  committee  has  decided  to  sell  tickets  for  $5.  They  also  know  that  the  cost  for  the  DJ  will  be  $200.  

a. The  inequality  150  ≤  5x  –  200  can  be  used  to  determine  if  the  dance  committee  met  its  goal.  Explain  how  each  part  of  this  inequality  fits  the  problem  situation.  5x represents the amount of money made off of ticket sales. They must subtract the cost of the DJ, -$200, since this takes away from the profit. They want the profit, 5x – 200, to be at least $150.    

b. Solve  the  inequality  using  a  table,  a  graph,  “undoing,”  or  algebraic  operations.  (You  may  need  to  use  a  separate  sheet  of  graph  paper.)  150 ≤ 5x - 200 150 + 200 ≤ 5x – 200 + 200 350 ≤ 5x 350 ÷ 5 ≤ 5x ÷ 5 70 ≤ x    

c. In  a  complete  sentence,  explain  what  your  solution  to  part  b  means  in  the  context  of  the  problem  situation.  

They need to sell 70 or more tickets to meet their goal of making a profit of $150 dollars or more.  

Response types may vary  

x > -1   x ≤ 3   x > 2  

x ≥ 4   x < 6   x < 3.5  

86   Topic  18:  Solving  linear  inequalities  

Copyright  ©  2017  Charles  A.  Dana  Center  at  the  University  of  Texas  at  Austin,  Learning  Sciences  Research  Institute  at  the  University  of  Illinois  at  Chicago,  and  Agile  Mind,  Inc.  

LESSON 2: STAYING SHARP Practic

ing  skills  &  con

cepts  

1. Select  the  appropriate  symbol  (<,  >,  or  =)  to  describe  the  relationship  between  each  pair  of  numbers.  


a.   21   > 12  


b.   22   = 22  


c.   23   < 32  


d.   24   = 42  


e.   25   > 52    

2. On  the  coordinate  plane,  sketch  a  line  that  has  an  x-­‐intercept  of  (–2,0)  and  a  y-­‐intercept  of  (0,6).  Then,  calculate  the  slope  of  the  line.  

                 Slope  of  line:  6/2 = 3  

Prep

aring  for  u

pcom

ing  lesson

s  

Complete  these  tables  to  answer  questions  3  and  4.       Table  A     Table  B     y  =  –x  +  4     y  =  0.5x  +  –5     –4   8   –4   -7   –3   7   –3   -6.5   –2   6   –2   -6   –1   5   –1   -5.5   0   4   0   -5   1   3   1   -4.5   2   2   2   -4   3   1   3   -3.5   4   0   4   -3


3.  a.   As  x  increases  by  1,  by  how  much  does  y  change  

in  Table  A?  -1

b.   As  x  increases  by  1,  by  how  much  does  y  change  in  Table  B?  

½  

 4. Will  there  be  a  common  (x,y)  pair  in  the  two  tables  if  

the  tables  are  continued?  Explain.  Yes, the lines have different slopes so they are not parallel. They are approaching each other as x increases.

Review

ing  ideas  from

 earlier  g

rade

s  

Use  the  two  slope  triangles  to  answer  Questions  5  and  6.    


5. a.  Calculate  the  slope  of  the  line  using  the  smaller  slope  triangle.  2/3

   b.  Calculate  the  slope  of  the  line  using  the  larger  slope  triangle.  4/6 = 2/3

     6. Explain  why  the  two  slopes  you  calculated  are  equal.  

Student responses will vary  

Topic  18:  Solving  linear  inequalities   87  

Copyright  ©  2017  Charles  A.  Dana  Center  at  the  University  of  Texas  at  Austin,  Learning  Sciences  Research  Institute  at  the  University  of  Illinois  at  Chicago,  and  Agile  Mind,  Inc.  

Lesson 3: Solving inequalities with algebraic operations

LESSON 3: OPENER

1. Complete  each  inequality  statement  with  the  correct  symbol,  either  <  or  >.    

  2  <  8    

2  +  1  <  8  +  1     2  −  1  <  8  –  1  2  +  2  <  8  +  2     2  −  2  <  8  –  2  2  +  3  <  8  +  3     2  −  3  <  8  –  3  2  +  4  <  8  +  4     2  −  4  <  8  –  4  

2. What  do  you  notice  about  the  relationship  between  the  answers  you  get  when  you  add  the  same  number  to  2  and  to  8?  The relationship does not change      

3. What  do  you  notice  about  the  relationship  between  the  answers  you  get  when  you  subtract  the  same  number  from  2  and  from  8?  

The relationship does not change

LESSON 3: CORE ACTIVITY

1. Complete  each  inequality  statement  with  the  correct  symbol,  either  <  or  >.    

      2  <  8        

2  �  1  <  8  �  1     2  �  -­‐1  >  8  �  -­‐1     2  ÷  1  <  8  ÷  1     2  ÷  -­‐1  >  8  ÷  -­‐1  

2  �  2  < 8  �  2     2  �  -­‐2  >  8  �  -­‐2     2  ÷  2  <  8  ÷  2     2  ÷  -­‐2  > 8  ÷  -­‐2  

2  �  3  <  8  �  3     2  �  -­‐3  >  8  �  -­‐3     2  ÷  3  <  8  ÷  3     2  ÷  -­‐3  >  8  ÷  -­‐3  

2. Study  the  pattern  in  question  1.  When  do  you  need  to  reverse  the  inequality  sign?  When you multiply or divide each side by a negative number

3. Solve  the  equation  2x  +  5  =  11  using  algebraic  operations.  2x + 5 – 5 = 11 – 5 2x = 6 2x ÷ 2 = 6 ÷ 2 x = 3

4. Using  the  balance  scale  as  a  model  and  the  fact  that  2x  +  5  weighs  less  than  11,  explain  why  each  of  the  following  statements  is  true.  

a. 2x  will  weigh  less  than  6.  5 was taken off both sides so the inequality relationship did not change.

b. x  will  weigh  less  than  3.  Each side was divided by a positive 2, so the original inequality relationship was maintained.

88   Topic  18:  Solving  linear  inequalities  

Copyright  ©  2017  Charles  A.  Dana  Center  at  the  University  of  Texas  at  Austin,  Learning  Sciences  Research  Institute  at  the  University  of  Illinois  at  Chicago,  and  Agile  Mind,  Inc.  

5. Solve  8  –  2x  ≥  14  by  first  subtracting  8  from  both  sides.  Then  complete  solving  the  inequality.  


6. This  time,  solve  the  inequality  8  –  2x  ≥  14  by  first  adding  2x  to  both  sides.  


7.   What  do  you  notice  about  the  processes  you  used  to  answer  questions  5  and  6?  They both yield the same solution. The process for question 5 required changing the direction of the sign, but the process for question 6 did not.  


8.   Use  inverse  operations  and  algebraic  properties  to  solve  the  following  inequalities.  Use  substitution  to  check  your  solutions.  

  a.   8a  –  5  ≤  1   b.   6b  –  1  >  3b  +  8   c.   0.25(16  –  12c)  ≤  31  


  d.  12e  +  3  ≤  4  +  e   e.   3  <  3(-­‐5d  +  16)   f.   5f  +  4(f  –  1)  ≥  2  +  5(2  +  f)  


8 – 2x ≥ 14 -2x ÷ -2 ≥ 6 ÷ -2 8 – 8 – 2x ≥ 14 – 8 x ≤ -3 -2x ≥ 6


8 – 2x ≥ 14 8 – 14 ≥ 14 – 14 + 2x 8 – 2x + 2x ≥ 14 + 2x -6 ≥ 2x 8 ≥ 14 + 2x -6 ÷ 2 ≥ 2x ÷ 2 -3 ≥ x


8a – 5 + 5 ≤ 1 + 5 8a ≤ 6 8a ÷ 8 ≤ 6 ÷ 8 a ≤ 6/8 a ≤ 3/4

6b – 1 + 1 > 3b + 8 + 1 6b > 3b + 9 6b – 3b > 3b – 3b + 9 3b > 9 b > 3

16 – 12c ≤ 124 -12c ≤ 108 c ≥ -9

3 < -15d + 48 -45 < -15d 3 > d

½e ≤ 1 + e -½e ≤ 1 e ≥ -2

OR

-1 ≤ ½e -2 ≤ e

5f + 4f – 4 ≥ 2 + 10 + 5f 9f – 4 ≥ 12 + 5f 4f – 4 ≥ 12 4f ≥ 16 f ≥ 4

Topic  18:  Solving  linear  inequalities   89  

Copyright  ©  2017  Charles  A.  Dana  Center  at  the  University  of  Texas  at  Austin,  Learning  Sciences  Research  Institute  at  the  University  of  Illinois  at  Chicago,  and  Agile  Mind,  Inc.  

LESSON 3: CONSOLIDATION ACTIVITY

1. Jacob  solved  four  different  inequalities,  but  he  is  not  sure  whether  he  solved  them  correctly.  In  fact,  sometimes  he  makes  more  than  one  mistake  when  solving!  Jacob’s  work  is  shown  below.  Decide  whether  Jacob  solved  each  inequality  correctly.  If  not,  find  the  mistake(s)  and  explain  what  Jacob  did  wrong.  Then,  solve  the  inequality  correctly.    

Jacob’s  solution:   Did  Jacob  solve  correctly?  If  not,  describe  his  mistake(s):  

Show  the  correct  solution  (if  needed):  

a.  3x  +  6  >  8  

3x + 6 + (–6) > 8 + (–6) 3x < 2 3x ÷ 3 < 2 ÷ 3

x < 2/3  

Jacob did not solve correctly.

When he added -6 to both sides of the equation, he incorrectly reversed the direction of the inequality sign. The direction of the sign should only be reversed when multiplying or dividing both sides by a negative number, not when adding a negative number to both sides.

3x + 6 + (–6) > 8 + (–6) 3x > 2 3x ÷ 3 > 2 ÷ 3

x > 2/3

b.  2x  +  1  ≥  x  –  2  

2x – x + 1 ≥ x – x – 2 1x + 1 ≥ -2 x + 1 – 1 ≥ -2 – 1

x ≥ -3  

Jacob solved correctly. Not needed

c.    4(x  +  2)  >  5x  +  1  

4x + 2 > 5x + 1

4x > 5x – 1

x > -1  

Jacob did not solve correctly. His first mistake is that he distributed 4 incorrectly.

His second mistake is that when he multiplied each side by-1, he did not change the direction of the inequality.

4(x + 2) > 5x + 1

4x + 8 > 5x + 1

4x > 5x - 7

-1x > -7

x < 7


d.    5x  +  5  >  10x  +  30  


Jacob did not solve correctly. His first mistake is that when he divided the expressions on both sides of the > sign by 5, he did not divide all of the terms in each expression. He should have divided the 5 and the 30 by 5 as well.

He also incorrectly reversed the > sign when subtracting x from both sides of the inequality.

2. On  your  whiteboard,  create  your  own  inequality.    Exchange  your  whiteboard  with  your  partner  and  solve  the  problem  your  partner  created.  When  both  you  and  your  partner  are  finished,  discuss  your  solutions.  

5x + 5 > 10x + 305x − 5x + 5 > 10x − 5x + 30

5 > 5x + 305 − 30 > 5x + 30 − 30

−25 > 5x−255

>5x5

−5 > x !

5x5

+ 5 >10x5

+ 30

x + 5 > 2x + 30x + 5 + (−5) > 2x + 30 + (−5)

x > 2x + 25x − x < 2x − x + 25

0 < x + 250 − 25 < x + 25 − 25

−25 < x

90   Topic  18:  Solving  linear  inequalities  

Copyright  ©  2017  Charles  A.  Dana  Center  at  the  University  of  Texas  at  Austin,  Learning  Sciences  Research  Institute  at  the  University  of  Illinois  at  Chicago,  and  Agile  Mind,  Inc.  

LESSON 3: HOMEWORK  

Notes  or  additional  instructions  based  on  whole-­‐class  discussion  of  homework  assignment:  


1. Solve  each  of  the  following  inequalities.  Use  substitution  to  check  your  solutions.  

a.   4  –  2x  ≤  5  –  x  +  1   b.   43x +7> 3   c.   2x  –  3(x  +  3)  <  14  

           d.     9x  –  24x  +  45  >  0   e.   3.1x  –  1.4  ≤  1.3x  +  6.7   f.   3x  +  2(4x  +  2)  ≥  2(6x  +  1)                  

2. Suppose  your  friend  is  having  trouble  solving  the  inequality  –2(3x  –  8)  <  5(4  –  x).  Show  each  step  you  would  take  to  solve  the  inequality,  and  write  an  explanation  of  why  you  are  taking  that  step.    -6x + 16 < 20 – 5x -x < 4 x > -4 Student work will vary  

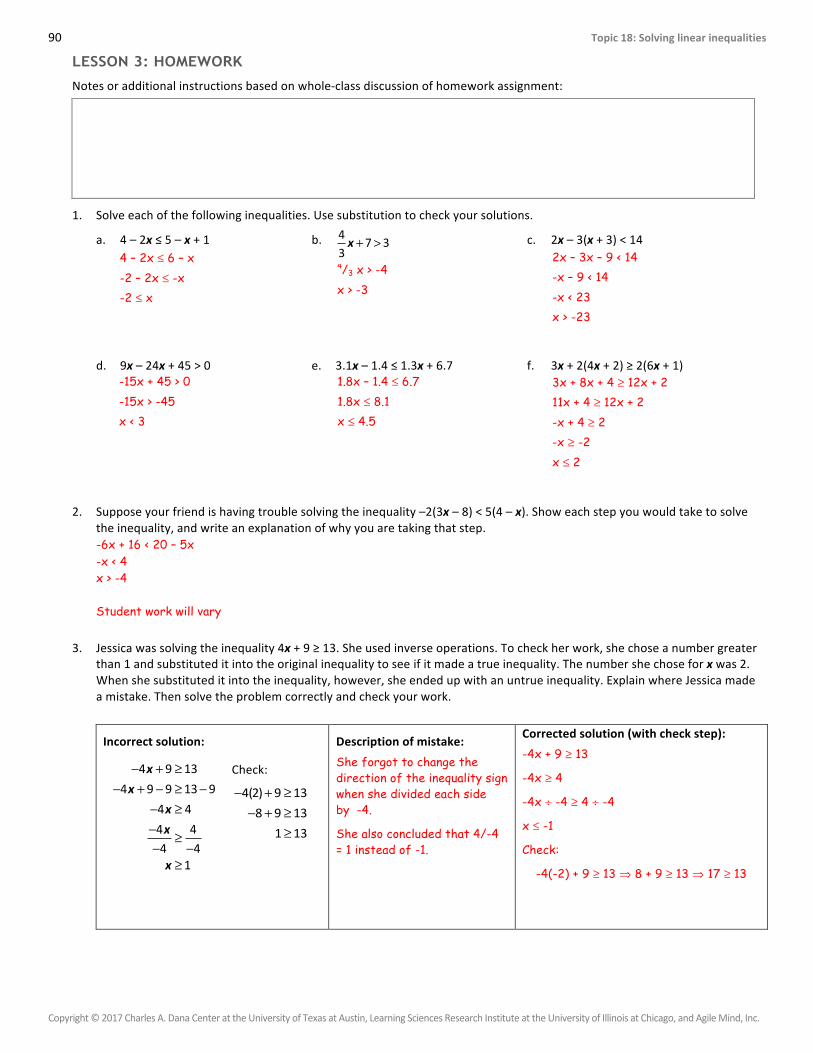
3. Jessica  was  solving  the  inequality  4x  +  9  ≥  13.  She  used  inverse  operations.  To  check  her  work,  she  chose  a  number  greater  than  1  and  substituted  it  into  the  original  inequality  to  see  if  it  made  a  true  inequality.  The  number  she  chose  for  x  was  2.  When  she  substituted  it  into  the  inequality,  however,  she  ended  up  with  an  untrue  inequality.  Explain  where  Jessica  made  a  mistake.  Then  solve  the  problem  correctly  and  check  your  work.    

Incorrect  solution:  

− + ≥− + − ≥ −

− ≥− ≥− −

4 9 134 9 9 13 9

4 44 44 4

1

xx

xx

x


Check:  

4(2) 9 138 9 13

1 13

− + ≥− + ≥

≥  


Description  of  mistake:  She forgot to change the direction of the inequality sign when she divided each side by -4.

She also concluded that 4/-4 = 1 instead of -1.

Corrected  solution  (with  check  step):  -4x + 9 ≥ 13

-4x ≥ 4

-4x ÷ -4 ≥ 4 ÷ -4

x ≤ -1

Check:

-4(-2) + 9 ≥ 13 ⇒ 8 + 9 ≥ 13 ⇒ 17 ≥ 13


4 – 2x ≤ 6 – x -2 – 2x ≤ -x -2 ≤ x

4/3 x > -4 x > -3

2x – 3x – 9 < 14 -x – 9 < 14 -x < 23 x > -23

-15x + 45 > 0 -15x > -45 x < 3

1.8x – 1.4 ≤ 6.7 1.8x ≤ 8.1 x ≤ 4.5

3x + 8x + 4 ≥ 12x + 2 11x + 4 ≥ 12x + 2 -x + 4 ≥ 2 -x ≥ -2 x ≤ 2

Topic  18:  Solving  linear  inequalities   91  

Copyright  ©  2017  Charles  A.  Dana  Center  at  the  University  of  Texas  at  Austin,  Learning  Sciences  Research  Institute  at  the  University  of  Illinois  at  Chicago,  and  Agile  Mind,  Inc.  

LESSON 3: STAYING SHARP Practic

ing  skills  &  con

cepts  

1. Consider  this  inequality:  2x  >  5x  

 a. List  three  values  you  can  substitute  for  x  to  make  

the  inequality  statement  true.                    x = -1 ⇒ -2 > -5 x = -4 ⇒ -8 > -20 x = -10 ⇒ -20 > -50

 b. List  three  values  you  can  substitute  for  x  to  make  

the  inequality  statement  false.   x = 3 ⇒ 6 > 15 x = 10 ⇒ 20 > 50 x = 100 ⇒ 200 > 500     (These are examples only. Answers will vary.)  

2. List  the  lines  according  to  the  value  of  their  slopes.  List  them  in  order  from  the  smallest  slope  value  to  the  largest  slope  value.    

 Answer:  D, C, A, B  

Prep

aring  for  u

pcom

ing  lesson

s  

Consider  the  function  rules  y  =  3x  +  1  and  y  =  6x  –  8.  3. Graph  both  functions  on  the  coordinate  plane.  

Label  each  line  with  its  algebraic  rule.    4. Substitute  the  x  and  y  values  of  the  intersection  point  

into  both  function  rules  to  verify  that  the  coordinates  make  both  rules  true.  

 Intersection point = (3,10)

First equation: 10 = 3(3) + 1 ⇒ 10 = 10

Second equation: 10 = 6(3) – 8 ⇒ 10 = 10

The coordinates make both rules true.  


Review

ing  ideas  from

 earlier  g

rade

s  

A  lattice  point  has  x-­‐  and  y-­‐coordinates  that  are  both  integers.  5. Mark  two  lattice  points  that  are  on  the  line.  6. Draw  a  slope  triangle  between  the  points  you  marked,  and  use  the  slope  triangle  to  calculate  the  slope  of  the  line.  


Slope  of  line:    

m = -5/2


y = 3x + 1

y = 6x - 8

92   Topic  18:  Solving  linear  inequalities  

Copyright  ©  2017  Charles  A.  Dana  Center  at  the  University  of  Texas  at  Austin,  Learning  Sciences  Research  Institute  at  the  University  of  Illinois  at  Chicago,  and  Agile  Mind,  Inc.  

Topic  18:  Solving  linear  inequalities   93  

Copyright  ©  2017  Charles  A.  Dana  Center  at  the  University  of  Texas  at  Austin,  Learning  Sciences  Research  Institute  at  the  University  of  Illinois  at  Chicago,  and  Agile  Mind,  Inc.  

Lesson 4: Solving absolute value inequalities

LESSON 4: OPENER Earlier  in  the  course,  you  created  an  absolute  value  function  to  model  one  of  Terrence’s  skates.  The  function  you  created  for  this  graph  was  

!!y = x −3 .  

1. Write  an  inequality  that  gives  the  times  when  Terrence  is  more  than  2  meters  from  the  cone.  

x −3 > 2  


2. Write  another  inequality  that  gives  the  times  when  Terrence  was  within  2  meters  of  the  cone.  

x −3 ≤ 2

LESSON 4: CORE ACTIVITY

1. The  inequality  that  represents  the  times  that  Terrence's  distance  from  the  cone  was  less  than  or  equal  to  2  meters  is  

!!x −3 ≤2 .  What  does  this  inequality  mean?  Can  you  break  this  inequality  into  two  pieces  that  mean  the  same  thing  as  

the  single  inequality?  

This inequality represents the time when Terrence was less than 2 meters from the cone or when Terrence was

exactly 2 meters from the cone. You can present each part of the absolute value inequality in two pieces: !!x −3 <2

and

!!x −3 = 2  

2. On  the  graph  of  !!x −3 ≤2 ,  where  does  

!!x −3 =2 ?  Where  is  

!!x −3 <2 ?  How  do  you  write  the  solution  to  

!!x −3 ≤2 ?  

x −3 = 2 at x = 1 and x = 5.

x −3 < 2

when 1 < x < 5. The solution to the inequality

x −3 ≤ 2 is 1 ≤ x ≤ 5.

94   Topic  18:  Solving  linear  inequalities  

Copyright  ©  2017  Charles  A.  Dana  Center  at  the  University  of  Texas  at  Austin,  Learning  Sciences  Research  Institute  at  the  University  of  Illinois  at  Chicago,  and  Agile  Mind,  Inc.  

3. For  what  values  of  x  is  !!x −3 >2 ?  

x −3 > 2when x is less than 1 or greater than 5: x < 1 or x > 5.

4. Three  graphs  are  shown.  Label  each  graph  with  an  absolute  value  inequality  or  equation.  Use  the  given  inequalities  and  equation.  

!!5x −10 <15  

!!5x −10 =15  

!!5x −10 ≥15  


___ 5x − 10 = 15 ___   ____

5x − 10 ≥ 15 _____   ____

5x − 10 < 15 _____  

5. Now  solve  the  equation  !!5x −10 ≥15  analytically.  Start  by  using  the  definition  of  absolute  value  to  create  two  

inequalities.    Complete  the  sentences  to  create  these  inequalities.    

–5x  +  10   –5x  +  10  ≥  15  

5x  –  10   5x  –  10  ≥  15  


a.  If  5x  –  10  <  0,  then !!5x −10 = –5x + 10.  Therefore,  the  first  inequality  is –5x + 10 ≥ 15.

b.  If  5x  –  10  ≥  0,  then  !!5x −10  =  5x – 10.    Therefore,  the  second  inequality  is  5x – 10 ≥ 15.  


6. Solve  the  two  inequalities  you  wrote  in  question  5.    

When 5x – 10 < 0, –5x + 10 ≥ 15.  –5x + 10 ≥ 15 –5x ≥ 5 x ≤ –1

(Remember to change the direction of the inequality when you multiply or divide by a negative number.)

When 5x – 10 ≥ 0,  5x – 10 ≥ 15. 5x – 10 ≥ 15 5x ≥ 25 x ≥ 5


Therefore, the solution set consists of all numbers that are less than or equal to –1 or greater than or equal to 5. That is, x ≤ –1 or x ≥ 5. Graphically, when x ≤ –1 or x ≥ 5 the graph of the absolute value function lies above the line y = 15.  


Topic  18:  Solving  linear  inequalities   95  

Copyright  ©  2017  Charles  A.  Dana  Center  at  the  University  of  Texas  at  Austin,  Learning  Sciences  Research  Institute  at  the  University  of  Illinois  at  Chicago,  and  Agile  Mind,  Inc.  

 7. Solve  the  inequality  

!!2x −6 <10 .  

a.   First,  use  the  definition  of  absolute  value  to  create  two  separate  inequalities.  


When 2x – 6 < 0, 2x −6 = −2x +6 . Therefore, one inequality is –2x + 6 < 10.

When 2x – 6 ≥ 0, 2x −6 = 2x −6 . The second inequality is therefore 2x – 6 < 10.

b.   Now  solve  these  two  inequalities  algebraically.  

–2x + 6 < 10

–2x < 4

x > –2

2x – 6 < 10

2x < 16

x < 8

The solution set is all numbers x such that x > –2 and x < 8. Another way to say this is –2 < x < 8.

96   Topic  18:  Solving  linear  inequalities  

Copyright  ©  2017  Charles  A.  Dana  Center  at  the  University  of  Texas  at  Austin,  Learning  Sciences  Research  Institute  at  the  University  of  Illinois  at  Chicago,  and  Agile  Mind,  Inc.  

7.  

LESSON 4: CONSOLIDATION ACTIVITY 1. Consider  the  functions  

!!y = x + 4  and  y  =  5.  

a. Create  a  table  of  values  for  these  functions.  

   x   !!x + 4

 5  

–10   6   5  

–9   5   5  

–8   4   5  

–7   3   5  

–6   2   5  

–5   1   5  

–4   0   5  

–3   1   5  

–2   2   5  

–1   3   5  

0   4   5  

1   5   5  

2   6   5  


b. Use  the  table  to  solve  the  absolute  value  inequality  !!x + 4 < 5 .  What  is  the  solution  to  this  inequality?  Explain.  

The values of x + 4

are less than 5 when x is between –9 and 1, not including –9 and 1. This is written as –9 < x < 1.

c. Use  the  table  to  solve  the  absolute  value  inequality  !!x + 4 ≥ 5 .  Explain.  

The values of x + 4

are greater than or equal to 5 when x is less than or equal to –9 or x is greater than or equal to 1. This is written as x ≤ –9 or x ≥ 1.

d. Use  the  table  to  create  a  graph  of  the  two  functions.    Use  your  graph  to  justify  the  solutions  you  found.    


The graph of the absolute value function lies below the line y = 5 between –9 and 1. Therefore, the solution to the inequality

x + 4 < 5 is –9 < x < 1.

The graph of the absolute value function is above or equal to the line y = 5 when x is less than or equal to –9 or x is greater than or equal to 1. Therefore, the solution to the inequality

x + 4 ≥ 5 is x ≤ –9 or x ≥ 1.


Topic  18:  Solving  linear  inequalities   97  

Copyright  ©  2017  Charles  A.  Dana  Center  at  the  University  of  Texas  at  Austin,  Learning  Sciences  Research  Institute  at  the  University  of  Illinois  at  Chicago,  and  Agile  Mind,  Inc.  

   2. Consider  the  absolute  value  inequality  

!!2x +1 ≤ 3 .  

a. Solve  the  inequality  analytically,  using  the  “two-­‐for-­‐one  trade.”    

When 2x + 1 ≥ 0, 2x + 1

= 2x + 1. Therefore one inequality is 2x + 1 ≤ 3. When 2x + 1 < 0,

2x + 1 = –2x – 1. The

second inequality is –2x – 1 ≤ 3. Solving these two inequalities gives: 2x + 1 ≤ 3 2x ≤ 2 x ≤ 1 and –2x – 1 ≤ 3 –2x ≤ 4 x ≥ –2

The solutions to the inequality 2x + 1 ≤ 3 are x ≤ 1 and x ≥ –2.

b. Verify  your  solutions  using  either  a  graph  or  a  table.  A graph is shown here.

98   Topic  18:  Solving  linear  inequalities  

Copyright  ©  2017  Charles  A.  Dana  Center  at  the  University  of  Texas  at  Austin,  Learning  Sciences  Research  Institute  at  the  University  of  Illinois  at  Chicago,  and  Agile  Mind,  Inc.  

 3. You  have  used  graphs  to  solve  absolute  value  equations  and  inequalities  by  graphing  both  sides  of  the  equation  or  inequality  

on  the  same  axes.    

a. To  solve  an  absolute  value  equation  by  graphing,  what  do  you  look  for  on  the  graph?  The x-coordinate(s) of the point(s) of intersection are the solution(s) to the equation.


b. To  solve  absolute  value  inequalities  such  as  !!x + 4 > 5  or  

!!x + 4 < 5  by  graphing,  what  do  you  look  for  on  the  graph?  

Look for the values of the independent variable for which the larger side's graph lies above the smaller side's graph.


4. You  have  also  used  tables  to  solve  absolute  value  equations  and  inequalities.  These  tables  have  one  column  for  the  left  side  of  the  equation  or  inequality  and  another  column  for  the  right  side.      

a. What  do  you  look  for  in  a  table  when  solving  an  absolute  value  equation?  Look for the same value on the left side and right side. The x-value for this line is the solution. Remember there may be more than one place where this happens.

b. What  do  you  look  for  in  a  table  when  solving  an  absolute  value  inequality?  Look for the places where the values in the column for the larger side are larger than the values in the column for the smaller side. The corresponding x-values are the solution.


5. You  have  solved  absolute  equations  and  inequalities  analytically,  by  graphing,  and  by  using  tables.  Which  method  do  you  prefer?  Why?  

Answers will vary.

Topic  18:  Solving  linear  inequalities   99  

Copyright  ©  2017  Charles  A.  Dana  Center  at  the  University  of  Texas  at  Austin,  Learning  Sciences  Research  Institute  at  the  University  of  Illinois  at  Chicago,  and  Agile  Mind,  Inc.  


LESSON 4: HOMEWORK  

Notes  or  additional  instructions  based  on  whole-­‐class  discussion  of  homework  assignment:  


1. Solve   x + 5 > 3  analytically.    

First, solve the inequality when x + 5 ≥ 0. If x + 5 ≥ 0, then

x +5 =  x + 5. So the equation

becomes: x + 5 > 3 x > -2

Next, solve the inequality when x + 5 < 0. If x + 5 < 0, then

x +5 =  -x – 5. So the equation

becomes: -x - 5 > 3 -x > 8 x < -8

The solution set is all real numbers x such that x < -8 or x > -2

2. Solve   4 − 2x ≤ 2  analytically.    

First, solve the inequality when 4 – 2x > 0. If 4 - 2x > 0, then

4 −2x = 4 – 2x. So the equation

becomes: 4 – 2x ≤ 2 -2x ≤ -2 x ≥ 1

Next, solve the inequality when 4 – 2x < 0. If 4 - 2x < 0, then

4 −2x

= -4 + 2x. So the equation

becomes: -4 + 2x ≤ 2 2x ≤ 6 x ≤ 3

The solution set is all real numbers x such that x ≥ 1 and x ≤ 3, or 1 ≤ x ≤ 3.

3. Solve   3x + 1 < 4  analytically.  Confirm  your  solution  with  either  a  table  or  a  graph.  

First, solve the inequality when 3x + 1 > 0.

If 3x + 1 > 0, then 3x + 1  =  3x + 1. So the equation

becomes: 3x + 1 < 4 3x < 3 x < 1

Next, solve the inequality when 3x + 1 < 0.

If 3x + 1 < 0, then 3x + 1  =  -3x – 1. So the equation

becomes: -3x - 1 < 4 -3x < 5

x > − 5

3

The solution set is all numbers x such that x < 1 and x > − 5

3, or

− 5

3 ≤ x ≤ 1.

Students may confirm with either a table or a graph.

100   Topic  18:  Solving  linear  inequalities  

Copyright  ©  2017  Charles  A.  Dana  Center  at  the  University  of  Texas  at  Austin,  Learning  Sciences  Research  Institute  at  the  University  of  Illinois  at  Chicago,  and  Agile  Mind,  Inc.  

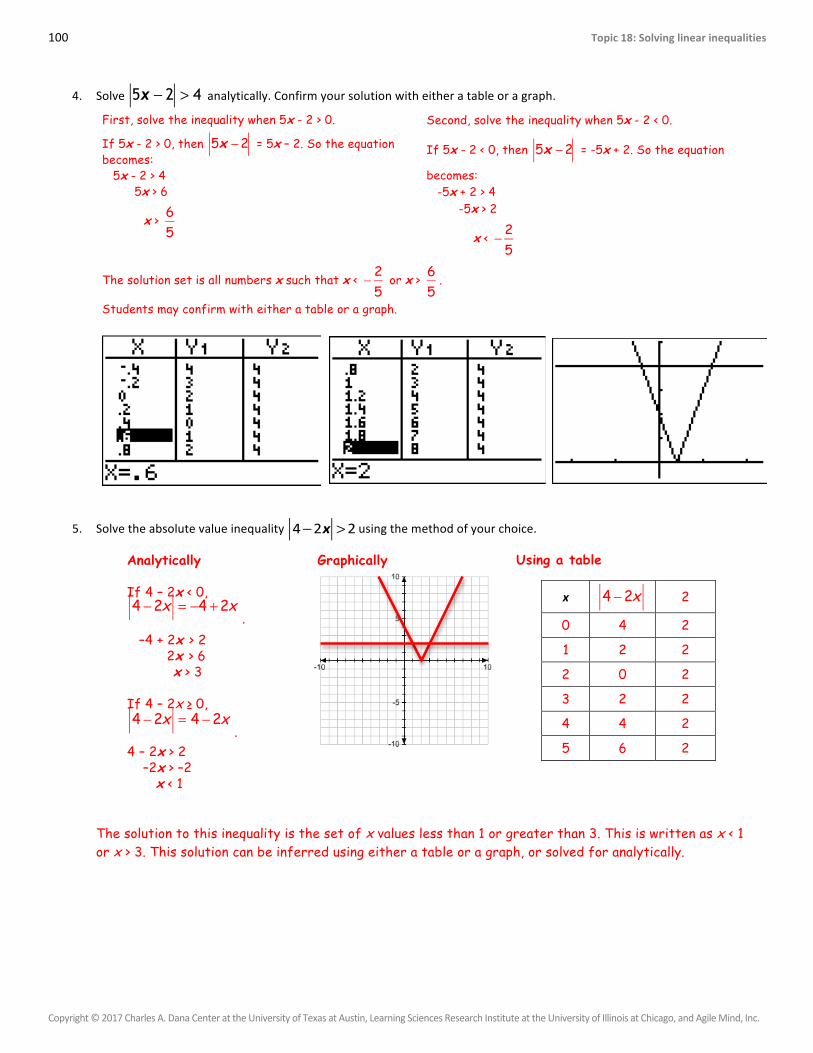
4. Solve   5x − 2 > 4  analytically.  Confirm  your  solution  with  either  a  table  or  a  graph.  

First, solve the inequality when 5x - 2 > 0.

If 5x - 2 > 0, then 5x −2 = 5x – 2. So the equation

becomes: 5x - 2 > 4 5x > 6

x >

65

Second, solve the inequality when 5x - 2 < 0.

If 5x - 2 < 0, then 5x −2 = -5x + 2. So the equation

becomes: -5x + 2 > 4 -5x > 2

x < − 2

5

The solution set is all numbers x such that x < − 2

5 or x >

65

.

Students may confirm with either a table or a graph.

5. Solve  the  absolute  value  inequality  !!4−2x >2 using  the  method  of  your  choice.    

Analytically If 4 – 2x < 0,

4 −2x = −4 +2x

. –4 + 2x > 2 2x > 6 x > 3 If 4 – 2x ≥ 0,

4 −2x = 4 −2x

. 4 – 2x > 2 –2x > –2 x < 1

Graphically


Using a table

x   4 −2x   2

0 4 2

1 2 2

2 0 2

3 2 2

4 4 2

5 6 2

The solution to this inequality is the set of x values less than 1 or greater than 3. This is written as x < 1 or x > 3. This solution can be inferred using either a table or a graph, or solved for analytically.

Topic  18:  Solving  linear  inequalities   101  

Copyright  ©  2017  Charles  A.  Dana  Center  at  the  University  of  Texas  at  Austin,  Learning  Sciences  Research  Institute  at  the  University  of  Illinois  at  Chicago,  and  Agile  Mind,  Inc.  

LESSON 4: STAYING SHARP Practic

ing  skills  &  con

cepts  

1. On  the  coordinate  plane,  sketch  a  line  that  has  a  slope  of  zero  and  that  passes  through  the  point  (-­‐3,5).  Then,  write  an  equation  for  the  line.  


Equation  of  line:  y = 0x + 5 or y = 5  

2. On  the  coordinate  plane,  sketch  a  line  that  passes  through  the  points  (3,–5)  and  (3,3).  Then  write  an  equation  for  the  line.  


                 Equation  of  line:  x = 3    

Prep

aring  for  u

pcom

ing  lesson

s  

Complete  these  tables  to  answer  questions  3  and  4.       Table  A     Table  B     y  =  –2  +  3x     y  =  4  +  3x     –4   -14   –4   -8   –3   -11   –3   -5   –2   -8   –2   -2   –1   -5   –1   1

  0   -2   0   4

  1   1   1   7

  2   4   2   10   3   7   3   13   4   10   4   16


3.  a.   As  x  increases  by  1,  by  how  much  does  y  

increase  in  Table  A?  3

b.   As  x  increases  by  1,  by  how  much  does  y  increase  in  Table  B?  

3  

4. Will  there  be  a  common  (x,y)  pair  in  the  two  tables  if  the  tables  are  extended?  Explain.  No, there will not. Each function is increasing at the same rate but have different y-intercepts. They are parallel.

Review

ing  ideas  from

 earlier  g

rade

s  

Use  this  graph  to  help  you  answer  questions  5  and  6.    


5. Write  an  equation  of  the  line  in  slope-­‐intercept  form.  y = 2x – 2

   6. On  the  line,  there  is  a  point  with  an  x-­‐coordinate  of  7.  

Find  that  point’s  y-­‐coordinate.  Explain  how  you  found  the  answer.  

y = 2(7) – 2

y = 14 – 2

y = 12  

102   Topic  18:  Solving  linear  inequalities  

Copyright  ©  2017  Charles  A.  Dana  Center  at  the  University  of  Texas  at  Austin,  Learning  Sciences  Research  Institute  at  the  University  of  Illinois  at  Chicago,  and  Agile  Mind,  Inc.  


Topic  18:  Solving  linear  inequalities   103  

Copyright  ©  2017  Charles  A.  Dana  Center  at  the  University  of  Texas  at  Austin,  Learning  Sciences  Research  Institute  at  the  University  of  Illinois  at  Chicago,  and  Agile  Mind,  Inc.  

Lesson 5: Inequalities in the plane

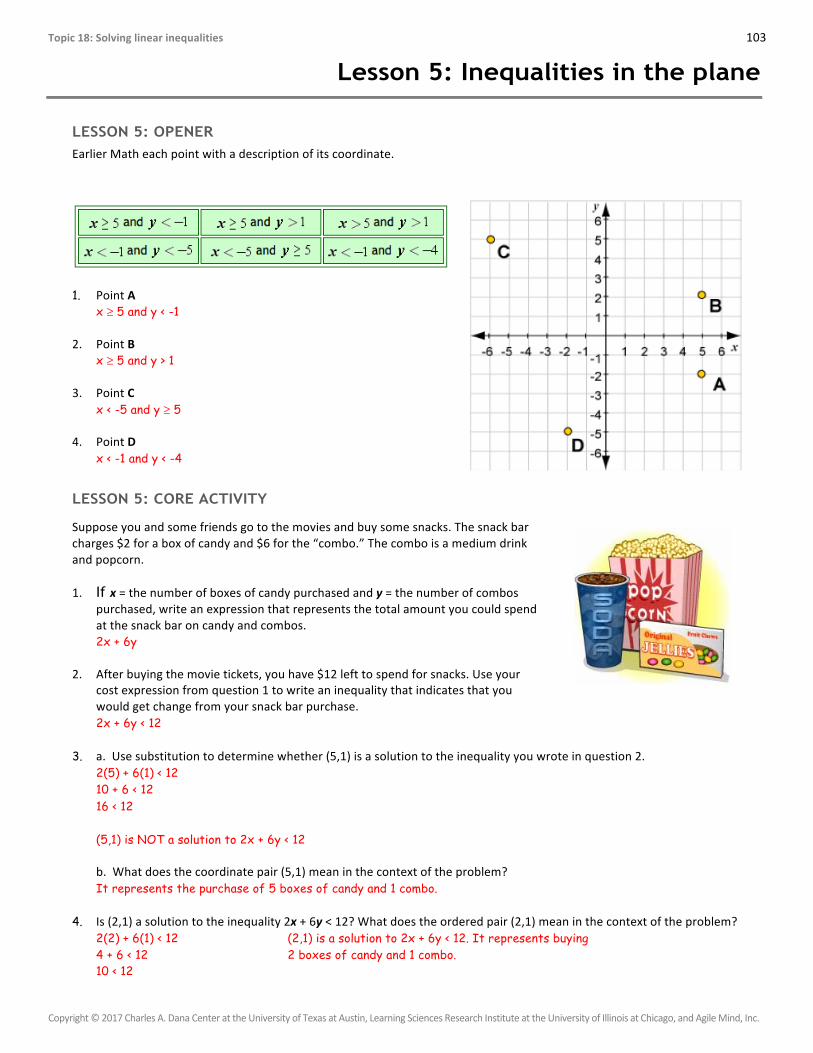
LESSON 5: OPENER Earlier  Math  each  point  with  a  description  of  its  coordinate.  

1. Point  A  x ≥ 5 and y < -1

2. Point  B  x ≥ 5 and y > 1  

3. Point  C  x < -5 and y ≥ 5  

4. Point  D  x < -1 and y < -4  

LESSON 5: CORE ACTIVITY

Suppose  you  and  some  friends  go  to  the  movies  and  buy  some  snacks.  The  snack  bar  charges  $2  for  a  box  of  candy  and  $6  for  the  “combo.”  The  combo  is  a  medium  drink  and  popcorn.  

1. If x  =  the  number  of  boxes  of  candy  purchased  and  y  =  the  number  of  combos  purchased,  write  an  expression  that  represents  the  total  amount  you  could  spend  at  the  snack  bar  on  candy  and  combos.    2x + 6y  

2. After  buying  the  movie  tickets,  you  have  $12  left  to  spend  for  snacks.  Use  your  cost  expression  from  question  1  to  write  an  inequality  that  indicates  that  you  would  get  change  from  your  snack  bar  purchase.  2x + 6y < 12  

3. a.    Use  substitution  to  determine  whether  (5,1)  is  a  solution  to  the  inequality  you  wrote  in  question  2.    2(5) + 6(1) < 12 10 + 6 < 12 16 < 12 (5,1) is NOT a solution to 2x + 6y < 12  b.    What  does  the  coordinate  pair  (5,1)  mean  in  the  context  of  the  problem?  It represents the purchase of 5 boxes of candy and 1 combo.

4. Is  (2,1)  a  solution  to  the  inequality  2x  +  6y  <  12?  What  does  the  ordered  pair  (2,1)  mean  in  the  context  of  the  problem?    2(2) + 6(1) < 12 (2,1) is a solution to 2x + 6y < 12. It represents buying 4 + 6 < 12 2 boxes of candy and 1 combo. 10 < 12

104   Topic  18:  Solving  linear  inequalities  

Copyright  ©  2017  Charles  A.  Dana  Center  at  the  University  of  Texas  at  Austin,  Learning  Sciences  Research  Institute  at  the  University  of  Illinois  at  Chicago,  and  Agile  Mind,  Inc.  

5. a.    Which  of  the  given  ordered  pairs  are  solutions  to  the  inequality  you  wrote  in  question  2?    Explain  how  you  know.  

 (3,2)        (0,1)          (9,-­‐1)        (6,-­‐2)        (-­‐4,2)        (5,0)    

(0,1) (6,-2) (-4,2) and (5,0) are solutions to the inequality. When you substitute their x and y values into the inequality they yield true inequalities.  

 b.    What  do  the  solutions  mean  in  the  context  of  the  problem?  

They represent amounts of candies and combos you can buy together, and still get change back when paying $12.00 (however, you can not buy negative amounts of candies or combos).

6. Graph  the  line  2x  +  6y  =  12  and  plot  all  of  the  points  listed  in  question  5.  Label  points  that  are  solutions  to  the  inequality    2x  +  6y  <  12  with  the  letter  “T”  and  the  non-­‐solutions  with  the  letter  “F.”  Where  do  all  the  solutions  lie?    


7. How  would  you  shade  your  graph  to  show  ALL  the  ordered  pairs  that  make  the  inequality  true?  

Shade the region that is under the line. However, in the context of the snack bar problem, shading below the line, but on and above the x-axis and on and to the right of the y-axis, is all that makes sense since it does not make sense to have a negative number of combos or a negative number of boxes of candy.


T T

T

T

F

F

Topic  18:  Solving  linear  inequalities   105  

Copyright  ©  2017  Charles  A.  Dana  Center  at  the  University  of  Texas  at  Austin,  Learning  Sciences  Research  Institute  at  the  University  of  Illinois  at  Chicago,  and  Agile  Mind,  Inc.  


8. Match  each  of  the  inequalities  with  its  corresponding  graph.  Write  the  inequality  in  the  blank  space  beneath  the  graph  it  represents.  

y  >  -­‐5   5x  –  4y  >  20   x  <  y  

x  <  -­‐5   5x  –  4y  ≤  20   5x  –  4y  <  20  


 Inequality:  _____________________________________  

 Inequality:  _____________________________________  


Inequality:  _____________________________________  


Inequality:  _____________________________________  

 Inequality:  _____________________________________  

 Inequality:  _____________________________________  


LESSON 5: ONLINE ASSESSMENT

Today  you  will  take  an  online  assessment.  

x < y 5x – 4y < 20 y > -5 x < -5 5x – 4y > 20 5x – 4y ≤ 20

106   Topic  18:  Solving  linear  inequalities  

Copyright  ©  2017  Charles  A.  Dana  Center  at  the  University  of  Texas  at  Austin,  Learning  Sciences  Research  Institute  at  the  University  of  Illinois  at  Chicago,  and  Agile  Mind,  Inc.  

LESSON 5: HOMEWORK

Notes  or  additional  instructions  based  on  whole-­‐class  discussion  of  homework  assignment:  


A  snack  bar  charges  $3  for  a  box  of  candy  and  $5  for  the  “combo.”  The  combo  is  a  medium  drink  and  popcorn.  

1. Write  an  expression  that  represents  the  total  amount  you  could  spend  at  the  snack  bar  on  candy  and  combos.    x = # boxes of candy, y = # combos 3x + 5y

2. Suppose  you  can  spend  at  most  $12.  Create  an  inequality  that  represents  this  restraint.  Then  find  at  least  three  ordered-­‐pair  solutions  representing  the  number  of  boxes  of  candy  and  combos  you  can  buy.  3x +5y ≤ 12  

Ordered pairs will vary.  

3. Suppose  you  want  to  spend  at  least  $12.  Create  an  inequality  that  represents  this  restraint.  Then  find  at  least  three  ordered-­‐pair  solutions  representing  the  number  of  boxes  of  candy  and  combos  you  can  buy.  3x +5y ≥ 12  Ordered pairs will vary.    

4. Suppose  you  want  to  spend  exactly  $12.  Find  an  ordered  pair  solution  representing  the  number  of  boxes  of  candy  and  combos  you  can  buy.  The only solution (that makes sense in the context) is buying 4 boxes of candy and no combos; (4,0).  


5. Using  the  expression  you  wrote  in  question  1,  write  an  equation  to  represent  the  situation  in  question  4,  in  which  you  spend  exactly  $12.  Graph  the  equation.  Then  plot  all  seven  ordered-­‐pair  solutions  to  questions  2-­‐4  on  the  graph.    

a. Describe  the  region  of  the  graph  where  you  find  the  solutions  to  question  2.  These fall in the area bounded by the x-axis, the y-axis, and 3x + 5y = 12.  

b. Describe  the  region  of  the  graph  where  you  find  the  solutions  to  question  3.  These fall anywhere in the first quadrant except the area described in part a.  

c. Describe  the  region  of  the  graph  where  you  find  the  solution  to  question  4.  These fall on the line itself.    

3x + 5y = 12

Topic  18:  Solving  linear  inequalities   107  

Copyright  ©  2017  Charles  A.  Dana  Center  at  the  University  of  Texas  at  Austin,  Learning  Sciences  Research  Institute  at  the  University  of  Illinois  at  Chicago,  and  Agile  Mind,  Inc.  


6. Tanya’s  mother  will  pay  for  Tanya’s  entire  cell  phone  bill  as  long  as  the  usage  charge  is  less  than  $35  for  the  month.  On  Tanya’s  cell  phone  plan,  the  usage  charge  is  $0.15  per  text  message  and  $0.10  per  minute  for  calls.  a. Write  an  inequality  that  expresses  the  number  of  text  messages  Tanya  may  send,  t,  and  the  number  of  minutes  Tanya  

may  talk,  m,  so  that  her  mother  will  pay  the  entire  cell  phone  bill  for  the  month.    

(0.15)t + (0.10)m < 35    


b. Create  a  graph  showing  all  of  the  possible  combinations  of  texts  and  minutes  so  that  Tanya’s  mother  will  pay  the  entire  bill.                      


c. Use  the  graph  you  constructed  to  find  five  possible  combinations  of  texts  and  minutes  that  would  keep  Tanya’s  usage  charge  under  $35.      Answers will vary. Some possible ordered pairs: (0, 349), (233, 0), (0, 0), (80, 200), (200,20), (120, 120)  

t  

m  

108   Topic  18:  Solving  linear  inequalities  

Copyright  ©  2017  Charles  A.  Dana  Center  at  the  University  of  Texas  at  Austin,  Learning  Sciences  Research  Institute  at  the  University  of  Illinois  at  Chicago,  and  Agile  Mind,  Inc.  


7. For  each  inequality,  create  a  graph  showing  all  of  the  coordinate  pairs  that  make  the  inequality  true.  

a.   y ≥ 12x −3   b.   5x  –  6y  <  30   c.   x  >  -­‐3  


Topic  18:  Solving  linear  inequalities   109  

Copyright  ©  2017  Charles  A.  Dana  Center  at  the  University  of  Texas  at  Austin,  Learning  Sciences  Research  Institute  at  the  University  of  Illinois  at  Chicago,  and  Agile  Mind,  Inc.  

LESSON 5: STAYING SHARP Practic

ing  skills  &  con

cepts  

1. Solve  the  following  inequality  for  x:    

8x  +  7  ≥  11    

Answer  with  supporting  work:  8x + 7 ≥ 11

8x + 7 – 7 ≥ 11 – 7

8x ≥ 4

8x ÷ 8 ≥ 4 ÷ 8

x ≥ ½    

2. Write  an  equation  for  a  line  that  has  a  slope  of  4  and  passes  through  the  point  (1,6).  Then,  name  the  coordinates  of  one  other  point  that  the  line  passes  through.    Answer  with  supporting  work:  


y = 4x + b

6 = 4(1) + b

6 – 4 = b

2 = b ⇒ y = 4x + 2

Another point on the line is (3,14) (responses will vary).    

Prep

aring  for  u

pcom

ing  lesson

s  

3. Report  the  point  of  intersection  for  the  graph.  Include  the  context  of  the  situation  represented  in  the  graph.    


Intersection  point:  

The intersection point is (20,40). This represents 20 regular sodas and 40 diet sodas..


4. The  functions  y  =  2x  +  4  and  y  =  2x  +  1  are  graphed  here.  How  can  you  tell  from  their  equations  that  the  two  lines  will  never  intersect  each  other?  


Answer:  They both have the same slope (m=2), so they are parallel.    

Review

ing  ideas  from

 earlier  g

rade

s  

5. Graph  the  line  with  a  y-­‐intercept  of  (0,−2)  and  a  slope  of  43  on  the  coordinate  plane.  (Consider  using  slope  

triangles  to  graph  efficiently.)  


6. Write  an  equation  of  the  line  you  graphed  in    question  5.  


y-intercept: y = -2

slope: m = 4/3

y = 4/3 x - 2  

110   Topic  18:  Solving  linear  inequalities  

Copyright  ©  2017  Charles  A.  Dana  Center  at  the  University  of  Texas  at  Austin,  Learning  Sciences  Research  Institute  at  the  University  of  Illinois  at  Chicago,  and  Agile  Mind,  Inc.  

Topic  18:  Solving  linear  inequalities   111  

Copyright  ©  2017  Charles  A.  Dana  Center  at  the  University  of  Texas  at  Austin,  Learning  Sciences  Research  Institute  at  the  University  of  Illinois  at  Chicago,  and  Agile  Mind,  Inc.  

Lesson 6: Compound inequalities in the plane

LESSON 6: OPENER

1. Graph  the  following  compound  inequality  on  a  number  line:  

x  <  -­‐1  or  x  >  4  


2. Graph  the  following  inequalities  on  the  plane:  a.   x  <  -­‐1   b.   x  >  4  


3. Using  the  graphs  you  constructed  in  questions  1  and  2,  predict  what  the  graph  of  x  <  -­‐1  or  x  >  4  would  look  like  in  the  plane.  Sketch  your  prediction.  Explain  why  you  think  your  graph  is  correct.    


112   Topic  18:  Solving  linear  inequalities  

Copyright  ©  2017  Charles  A.  Dana  Center  at  the  University  of  Texas  at  Austin,  Learning  Sciences  Research  Institute  at  the  University  of  Illinois  at  Chicago,  and  Agile  Mind,  Inc.  

LESSON 6: CORE ACTIVITY

1. How  close  was  your  prediction  of  the  graph  of  x  <  -­‐1  or  x  >  4  in  the  plane  to  the  correct  graph?  Explain.  Student responses will vary      

2. Graph  the  inequality  x  >  -­‐2  and  x  <  7  on  the  number  line.    


3. Graph  the  inequality  x  >  -­‐2  and  x  <  7  on  the  plane.  How  is  the  graph  related  to  the  graph  you  constructed  in  question  2?  


4. For  each  inequality,  create  a  graph  showing  all  of  the  coordinate  pairs  that  make  the  inequality  true.  a.   y  ≥  -­‐4   b.   x  ≥  -­‐2    

                       5. Graph  the  following  compound  inequalities  in  the  plane:    

a.   y  ≥  -­‐4  or  x  ≥  -­‐2   b.   y  ≥  -­‐4  and  x  ≥  -­‐2    


Neither include x = -2 or x = 7. Both include all the numbers between x = -2 and x = 7.

Student responses may vary

Topic  18:  Solving  linear  inequalities   113  

Copyright  ©  2017  Charles  A.  Dana  Center  at  the  University  of  Texas  at  Austin,  Learning  Sciences  Research  Institute  at  the  University  of  Illinois  at  Chicago,  and  Agile  Mind,  Inc.  

LESSON 6: REVIEW ONLINE ASSESSMENT You  will  work  with  your  class  to  review  the  online  assessment  questions.  


Problems  we  did  well  on:   Skills  and/or  concepts  that  are  addressed  in  these  problems:  


Problems  we  did  not  do  well  on:   Skills  and/or  concepts  that  are  addressed  in  these  problems:  


Addressing  areas  of  incomplete  understanding  

Use  this  page  and  notebook  paper  to  take  notes  and  re-­‐work  particular  online  assessment  problems  that  your  class  identifies.  

Problem  #_____   Work  for  problem:  


Problem  #_____   Work  for  problem:  


Problem  #_____   Work  for  problem:  


114   Topic  18:  Solving  linear  inequalities  

Copyright  ©  2017  Charles  A.  Dana  Center  at  the  University  of  Texas  at  Austin,  Learning  Sciences  Research  Institute  at  the  University  of  Illinois  at  Chicago,  and  Agile  Mind,  Inc.  

LESSON 6: HOMEWORK

Notes  or  additional  instructions  based  on  whole-­‐class  discussion  of  homework  assignment:  


Next  class  period,  you  will  take  an  end-­‐of-­‐unit  assessment.  One  good  study  skill  to  prepare  for  tests  is  to  review  the  important  skills  and  ideas  you  have  learned.  Use  this  list  to  help  you  review  these  skills  and  concepts,  especially  by  reviewing  related  course  materials.    

Important  skills  and  ideas  you  have  learned  in  the  unit  Linear  equations  and  inequalities:    

• Analyze  situations  involving  linear  functions  and  formulate  linear  equations  and  inequalities  to  solve  problems  

• Use  various  methods  to  solve  linear  equations  and  inequalities:  inspection,  tables,  graphs,  and  use  of  algebraic  operations  in  connection  with  the  properties  of  equality  

• Interpret  and  determine  the  reasonableness  of  solutions  to  linear  equations  for  given  contexts    

• Apply  techniques  for  solving  equations  in  one  variable  to  solve  literal  equations  

• Graph  solutions  to  linear  inequalities  in  one  variable  on  a  number  line  

• Graph  solutions  to  linear  inequalities  in  two  variables  on  a  coordinate  plane  

• Graph  solutions  of  compound  linear  inequalities  in  two  variables  on  a  coordinate  plane    


Homework  Assignment  

Part  I:   Study  for  the  end-­‐of-­‐unit  assessment  by  reviewing  the  key  ideas  listed  above.  

Part  II:   Complete  the  online  More  practice  in  the  topic  Solving  linear  inequalities.  Note  the  skills  and  ideas  for  which  you  need  more  review,  and  refer  back  to  related  activities  and  animations  from  this  topic  to  help  you  study.    

Part  III: Complete Lesson  6:  Staying  Sharp.


Topic  18:  Solving  linear  inequalities   115  

Copyright  ©  2017  Charles  A.  Dana  Center  at  the  University  of  Texas  at  Austin,  Learning  Sciences  Research  Institute  at  the  University  of  Illinois  at  Chicago,  and  Agile  Mind,  Inc.  

LESSON 6: STAYING SHARP Practic

ing  skills  &  con

cepts  

1. a.     Find  a  number  that  satisfies  the  inequality  x  <  –3.  -10 = x ⇒ -10 < -3

     b.     Check  if  the  number  you  found  in  part  a  also  

satisfies  the  inequality  –3x  <  9.  -3(-10) < 9

30 < 9 No, it does not satisfy the inequality.

 c.     Will  any  number  that  satisfies  x  <  –3  also  satisfy  

 –3x  <  9?  Explain.  No. Student Reasoning will vary


2. Write  an  equation  for  a  line  that  passes  through  the  points  (3,5)  and  (6,3).    Answer  with  supporting  work:    

Slope = 3 – 5/6 – 3 = -2/3

y = -2/3 x + b

5 = -2/3 (3) + b

5 = -2 + b

7 = b

y = -2/3 x + 7  

Prep

aring  for  u

pcom

ing  lesson

s  

3. Complete  this  input-­‐output  table  for  both  function  rules.    

x   y  =  4x  +  18   y  =  –2x  +  6  

-­‐3   6 12

-­‐2   10 10

-­‐1   14 8

0   18 6

1   22 4

2   26 2

3   30 0  

4. A  classmate  has  been  away  and  missed  several  lessons.  Explain  to  that  classmate  how  to  use  the  table  you  created  in  question  3  to  find  the  intersection  point  of  the  two  function  rules,  and  how  to  check  that  the  coordinates  of  that  intersection  point  are  correct.  


Look for the same y-value in each table at one chosen x-value ((-2,10) in this case). To check if it’s correct, substitute the x-value into each equation and check if it yields the y-value in each case.

Review

ing  ideas  from

 earlier  g

rade

s  

5. A  line  passes  through  the  point  (2,3)  and  has  a  slope  of  −2.  Graph  the  line  on  the  coordinate  grid.  (Consider  using  slope  triangles  to  graph  efficiently.)    


6. Write  an  equation  of  the  line  you  graphed  in  question  5.    

Slope: m = -2

y-intercept: y = 7

y = -2x + 7  

116   Topic  18:  Solving  linear  inequalities  

Copyright  ©  2017  Charles  A.  Dana  Center  at  the  University  of  Texas  at  Austin,  Learning  Sciences  Research  Institute  at  the  University  of  Illinois  at  Chicago,  and  Agile  Mind,  Inc.  

Topic  18:  Solving  linear  inequalities   117  

Copyright  ©  2017  Charles  A.  Dana  Center  at  the  University  of  Texas  at  Austin,  Learning  Sciences  Research  Institute  at  the  University  of  Illinois  at  Chicago,  and  Agile  Mind,  Inc.  

Lesson 7: Checking for understanding

LESSON 7: OPENER

Bianca  and  Joe  are  starting  their  own  pet  grooming  business  called  House  of  Groom.  They  figure  that  they  can  spend  no  more  than  $50  a  month  on  pet  shampoo.  A  local  dealer  of  pet  shampoo,  The  Pet  Pantry,  sells  quart  bottles  of  shampoo  for  $4.00  a  bottle  plus  a  $5.00  handling  fee  per  order.    

1. Write  an  expression  that  represents  the  amount  of  money  charged  by  The  Pet  Pantry  for  an  order  of  shampoo.  4x + 5  


2. Write  an  inequality  that  represents  the  amount  House  of  Groom  is  willing  to  pay  per  month  for  The  Pet  Pantry's  shampoo.  50 ≥ 4x + 5

3. Solve  the  inequality  you  wrote  in  question  2  using  any  method.  

50 ≥ 4x + 5 Since you can only buy whole bottles of shampoo, 45 ≥ 4x 11 bottles is the maximum that can be purchased 11.25 ≥ x per month.  

LESSON 7: END-OF-UNIT ASSESSMENT

Today  you  will  take  the  end-­‐of-­‐unit  assessment.  

118   Topic  18:  Solving  linear  inequalities  

Copyright  ©  2017  Charles  A.  Dana  Center  at  the  University  of  Texas  at  Austin,  Learning  Sciences  Research  Institute  at  the  University  of  Illinois  at  Chicago,  and  Agile  Mind,  Inc.  

LESSON 7: CONSOLIDATION ACTIVITY

1. For  each  numbered  card,  find  a  match  using  the  lettered  cards.    Record  the  matches  here.      


1 – C; 2 – F, 3 – D, 4 – A, 5 – H, 6 – G, 7 – B, 8 – E

2. Answer  the  following  questions  to  reflect  on  your  performance  and  effort  this  unit.        

a. Summarize  your  thoughts  on  your  performance  and  effort  in  math  class  over  the  course  of  this  unit  of  study.    Which  areas  were  strong?  Which  areas  need  improvement?    What  are  the  reasons  that  you  did  well  or  did  not  do  as  well  as  you  would  have  liked?  


b. Set  a  new  goal  for  the  next  unit  of  instruction.    Make  your  goal  SMART.    

• Description  of  goal:  


• Description  of  enabling  goals  that  will  help  you  achieve  your  goal:    


Topic  18:  Solving  linear  inequalities   119  

Copyright  ©  2017  Charles  A.  Dana  Center  at  the  University  of  Texas  at  Austin,  Learning  Sciences  Research  Institute  at  the  University  of  Illinois  at  Chicago,  and  Agile  Mind,  Inc.  

LESSON 7: HOMEWORK

Notes  or  additional  instructions  based  on  whole-­‐class  discussion  of  homework  assignment:    


1.   Explain  the  phrase  “compound  inequality  in  the  plane”  in  your  own  words.  

  A compound inequality in the plane is when you have two (or more) inequalities in two variables that you are looking for solutions to.

  Student responses will vary


2.       Graph  each  compound  inequality  on  the  coordinate  plane  provided.    a.   x  <  5  and  x  >  -­‐3   b.   y  <  4  and  y  ≥  0   c.   x  ≥  -­‐2  and  y  <  3  

                         d.   y  <  -­‐5  or    y  >  5   e.   x  ≤  7  or  x  >2   f.   y  ≤  -­‐3  or    x  ≥  -­‐1  

120   Topic  18:  Solving  linear  inequalities  

Copyright  ©  2017  Charles  A.  Dana  Center  at  the  University  of  Texas  at  Austin,  Learning  Sciences  Research  Institute  at  the  University  of  Illinois  at  Chicago,  and  Agile  Mind,  Inc.  

LESSON 7: STAYING SHARP Practic

ing  skills  &  con

cepts  

1. A  line  with  a  slope  of   13  passes  through  the  point  (3,6).  

Write  an  equation  for  this  line.    Answer  with  supporting  work:  y = 1/3x + 5 Since the slope is 1/3, as y increases by one, x increases by 3. Also, as y decreases by one, x decreases by 3. To find the y-intercept, we need a coordinate pair with an x-value of 0. If use the point (3,6), we can decrease the x value by three, which means we have to decrease the y value by one. So, (0,5) is another point on the graph of the line. So, the y-intercept is b = 5. (Student reasoning may vary.)

2. Which  of  the  following  points  are  on  the  line  with  

equation  y  =   12x  +  7?  

 (4,5)   No: ½(4) + 7 = 2 + 7 = 9 ≠ 5      (–4,3)   No: ½(-4) + 7 = -2 + 7 = 5 ≠ 3        (4,3)   No: ½(4) + 7 = 2 + 7 = 9 ≠ 3      (–4,5)   Yes: ½(-4) + 7 = -2 + 7 = 5    

Prep

aring  for  u

pcom

ing  lesson

s  

3. Graph  the  function  rules  y  =  4x  –  3  and  y  =  –2x  +  9  on  the  coordinate  plane.  Then  write  the  coordinates  of  their  point  of  intersection.  


Intersection  point:    (2,5)  

4. Complete  this  input-­‐output  table  for  the  function  rules.    

x   y  =  4x  –  3   y  =  –2x  +  9  0   -3 9 1   1 7 2   5 5 3   9 3 4   13 1

a. For  what  x  value  are  the  y-­‐values  of  the  two  functions  equal?  x = 2

b. How  does  your  answer  to  question  4a  relate  to  your  answer  to  question  3?  It is the x-value of the point where the two graphs intersect. It is also the solution to the equation 4x – 3 = -2x + 9.  

Review

ing  ideas  from

 earlier  g

rade

s  

5. Use  slope  triangles  to  graph  each  function  rule  on  the  coordinate  grid.  

a. y  =   12x  +  2  

b. y  =  – 23x  +  9  

 6. In  which  quadrant  do  the  two  lines  intersect?  

Quadrant I  


Recommended