A CAPSULE SUMMARY OF THE WAVE PRINCIPLE The Wave Principle is Ralph Nelson Elliott's discovery that social, or crowd, behavior trends and reverses in recognizable patterns. Using stock market data as his main research tool, Elliott isolated thirteen patterns of movement, or "waves," that recur in market price data. He named, defined and illustrated those patterns. He then described how these structures link together to form larger versions of those same patterns, how those in turn link to form identical patterns of the next larger size, and so on. In a nutshell, then, the Wave Principle is a catalog of price patterns and an explanation of where these forms are likely to occur in the overall path of market development. Pattern Analysis Until a few years ago, the idea that market movements are patterned was highly controversial, but recent scientific discoveries have established that pattern formation is a fundamental characteristic of complex systems, which include financial markets. Some such systems undergo "punctuated growth," that is, periods of growth alternating with phases of non-growth or decline, building fractally into similar patterns of increasing size. This is precisely the type of pattern identified in market movements by R.N. Elliott some sixty years ago. The basic pattern Elliott described consists of impulsive waves (denoted by numbers) and corrective waves (denoted by letters). An impulsive wave is composed of five subwaves and moves in the same direction as the trend of the next larger size. A corrective wave is composed of three subwaves and moves against the trend of the next larger size. As Figure 1 shows, these basic patterns link to form five- and three-wave structures of increasingly larger size (larger "degree" in Elliott terminology). In Figure 1, the first small sequence is an impulsive wave ending at the peak labeled 1. This pattern signals that the movement of one larger degree is also upward. It also signals the start of a three-wave corrective sequence, labeled wave 2. 1
Transcript
A CAPSULE SUMMARY OF THE WAVE PRINCIPLE
The Wave Principle is Ralph Nelson Elliott's discovery that social, or crowd, behavior trends and reverses in recognizable patterns. Using stock market data as his main research tool, Elliott isolated thirteen patterns of movement, or "waves," that recur in market price data. He named, defined and illustrated those patterns. He then described how these structures link together to form larger versions of those same patterns, how those in turn link to form identical patterns of the next larger size, and so on. In a nutshell, then, the Wave Principle is a catalog of price patterns and an explanation of where these forms are likely to occur in the overall path of market development.
Pattern Analysis Until a few years ago, the idea that market movements are patterned was highly controversial, but recent scientific discoveries have established that pattern formation is a fundamental characteristic of complex systems, which include financial markets. Some such systems undergo "punctuated growth," that is, periods of growth alternating with phases of non-growth or decline, building fractally into similar patterns of increasing size. This is precisely the type of pattern identified in market movements by R.N. Elliott some sixty years ago.
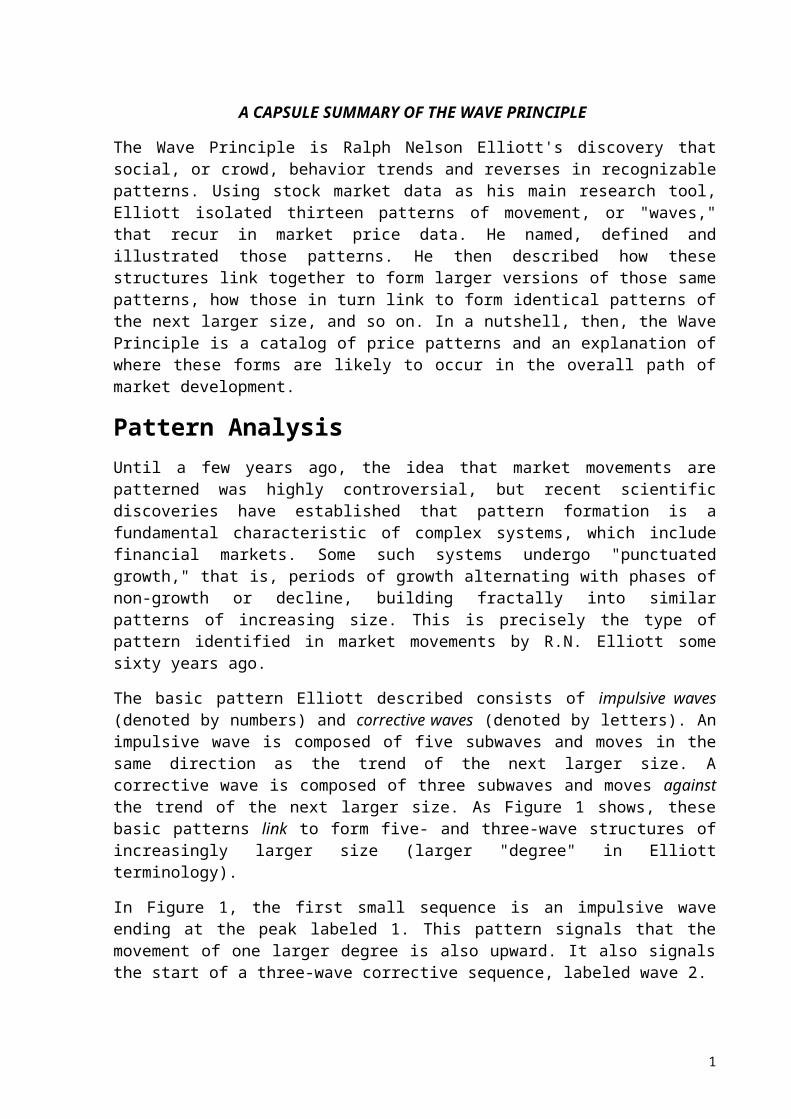
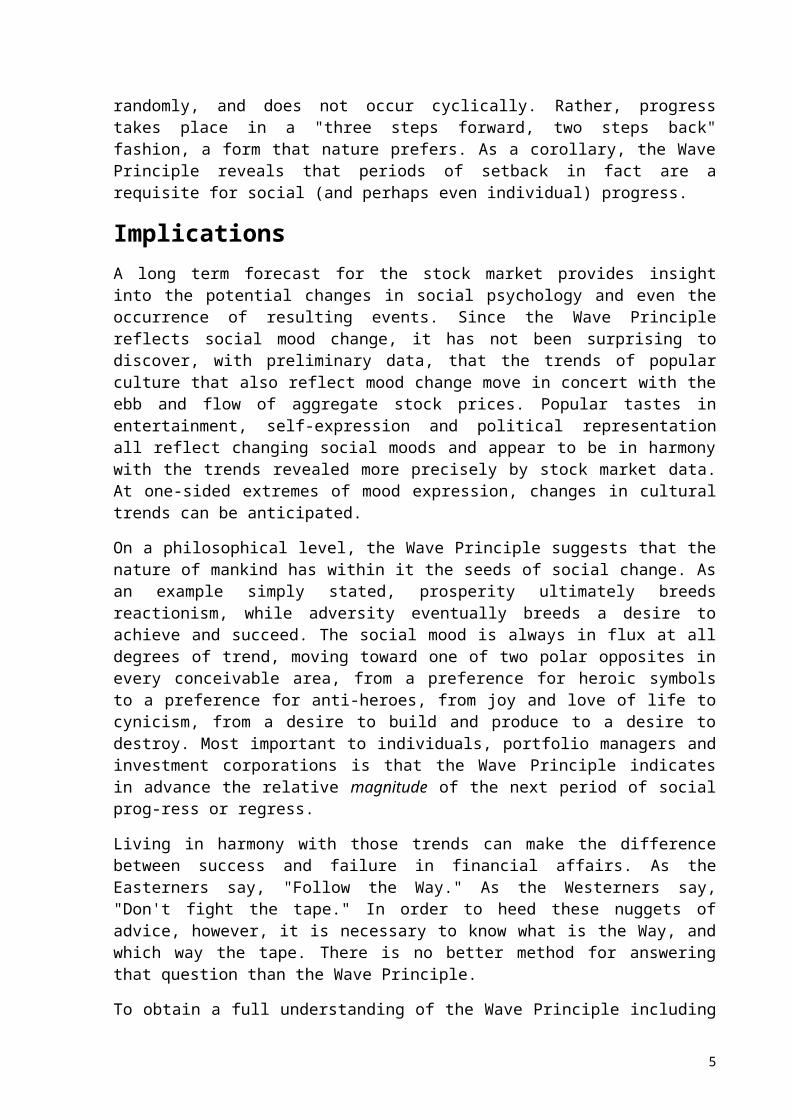
The basic pattern Elliott described consists of impulsive waves (denoted by numbers) and corrective waves (denoted by letters). An impulsive wave is composed of five subwaves and moves in the same direction as the trend of the next larger size. A corrective wave is composed of three subwaves and moves against the trend of the next larger size. As Figure 1 shows, these basic patterns link to form five- and three-wave structures of increasingly larger size (larger "degree" in Elliott terminology).
In Figure 1, the first small sequence is an impulsive wave ending at the peak labeled 1. This pattern signals that the movement of one larger degree is also upward. It also signals the start of a three-wave corrective sequence, labeled wave 2.
Figure 1
1
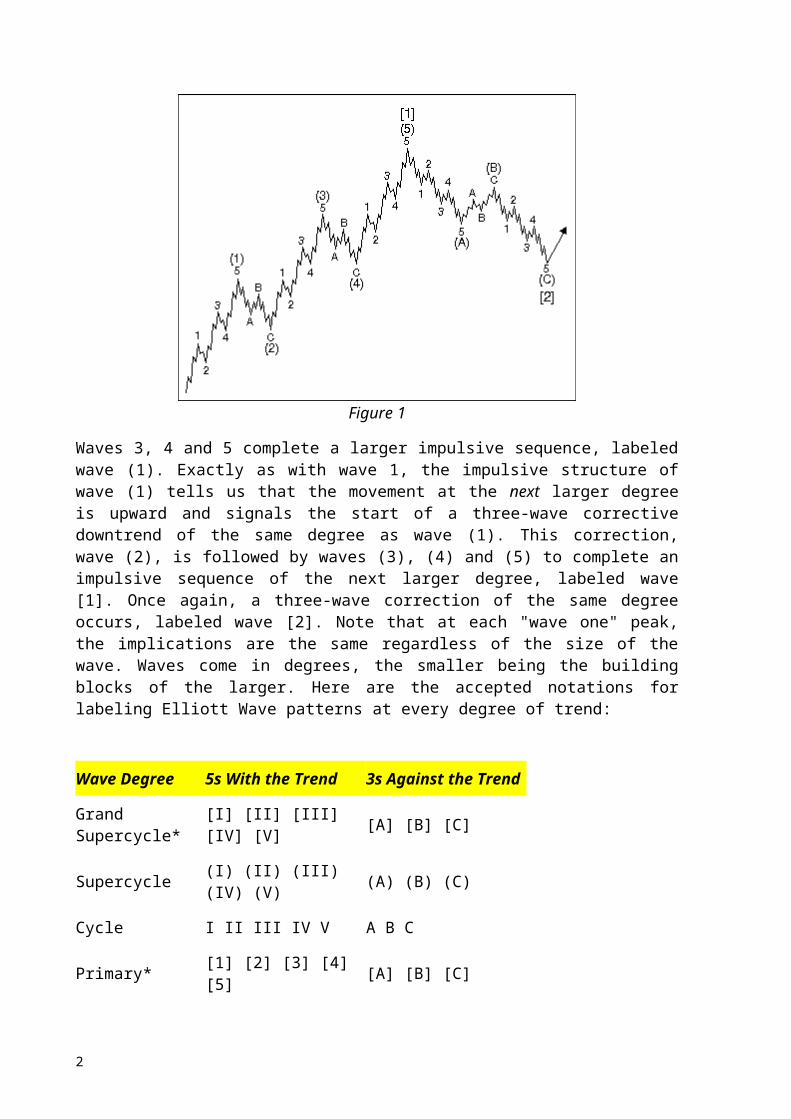
Waves 3, 4 and 5 complete a larger impulsive sequence, labeled wave (1). Exactly as with wave 1, the impulsive structure of wave (1) tells us that the movement at the next larger degree is upward and signals the start of a three-wave corrective downtrend of the same degree as wave (1). This correction, wave (2), is followed by waves (3), (4) and (5) to complete an impulsive sequence of the next larger degree, labeled wave [1]. Once again, a three-wave correction of the same degree occurs, labeled wave [2]. Note that at each "wave one" peak, the implications are the same regardless of the size of the wave. Waves come in degrees, the smaller being the building blocks of the larger. Here are the accepted notations for labeling Elliott Wave patterns at every degree of trend:
Wave Degree 5s With the Trend 3s Against the Trend
Grand Supercycle* [I] [II] [III] [IV] [V] [A] [B] [C]
Supercycle (I) (II) (III) (IV) (V) (A) (B) (C)
Cycle I II III IV V A B C
Primary* [1] [2] [3] [4] [5] [A] [B] [C]
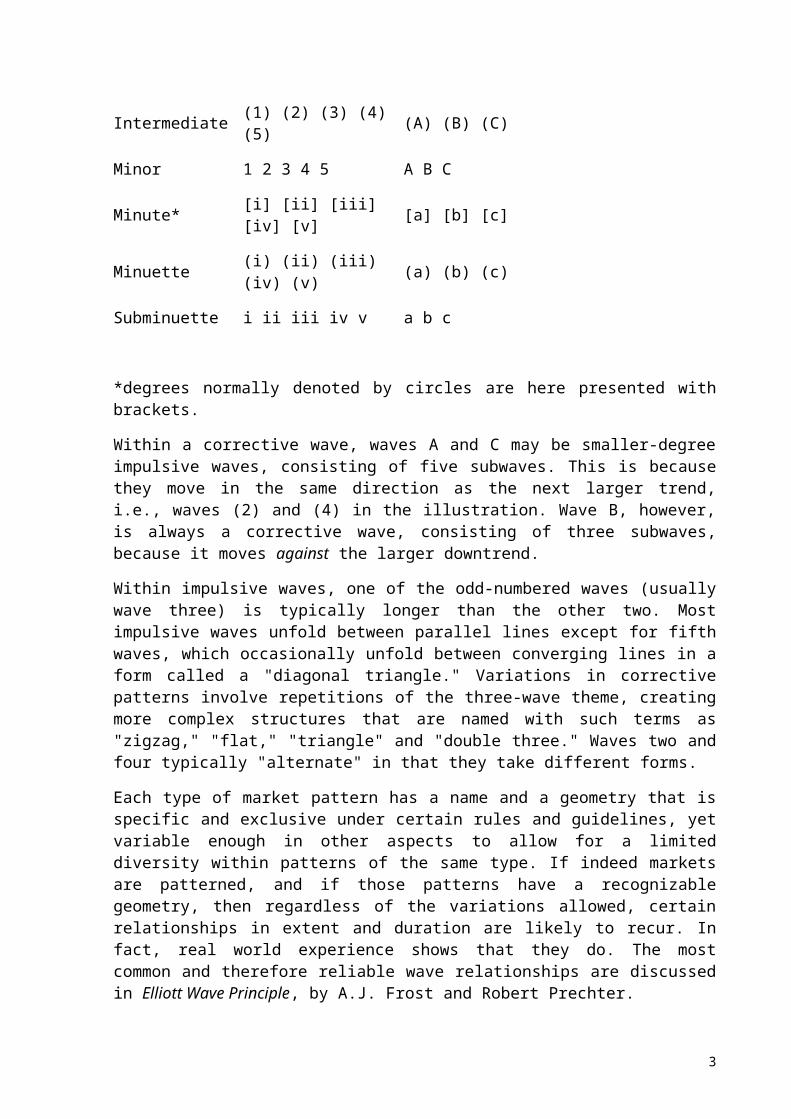
Intermediate (1) (2) (3) (4) (5) (A) (B) (C)
Minor 1 2 3 4 5 A B C
Minute* [i] [ii] [iii] [iv] [v] [a] [b] [c]
Minuette (i) (ii) (iii) (iv) (v) (a) (b) (c)
Subminuette i ii iii iv v a b c
*degrees normally denoted by circles are here presented with brackets.
Within a corrective wave, waves A and C may be smaller-degree impulsive waves, consisting of five subwaves. This is because they move in the same direction as the next larger trend, i.e., waves (2) and (4) in the illustration. Wave B, however, is always a corrective wave, consisting of three subwaves, because it moves against the larger downtrend.
Within impulsive waves, one of the odd-numbered waves (usually wave three) is typically longer than the other two. Most impulsive waves unfold between parallel lines except for fifth waves, which occasionally unfold between converging lines in a form called a "diagonal triangle." Variations in corrective patterns involve repetitions of the three-wave theme, creating more complex structures that are named with such terms as "zigzag," "flat," "triangle" and "double three." Waves two and four typically "alternate" in that they take different forms.
Each type of market pattern has a name and a geometry that is specific and exclusive under certain rules and guidelines, yet variable enough in other aspects to allow for a limited diversity within patterns of the same type. If indeed markets are patterned, and if those patterns have a recognizable geometry, then regardless of the variations allowed, certain relationships in extent and duration are likely to recur. In fact, real world experience shows
2
that they do. The most common and therefore reliable wave relationships are discussed in Elliott Wave Principle, by A.J. Frost and Robert Prechter.
Applying the Wave Principle The practical goal of any analytical method is to identify market lows suitable for buying (or covering shorts), and market highs suitable for selling (or selling short). The Elliott Wave Principle is especially well suited to these functions. Nevertheless, the Wave Principle does not provide certainty about any one market outcome; rather, it provides an objective means of assessing the relative probabilities of possible future paths for the market. At any time, two or more valid wave interpretations are usually acceptable by the rules of the Wave Principle. The rules are highly specific and keep the number of valid alternatives to a minimum. Among the valid alternatives, the analyst will generally regard as preferred the interpretation that satisfies the largest number of guidelines and will accord top alternate status to the interpretation satisfying the next largest number of guidelines, and so on.
Alternate interpretations are extremely important. They are not "bad" or rejected wave interpretations. Rather, they are valid interpretations that are accorded a lower probability than the preferred count. They are an essential aspect of investing with the Wave Principle, because in the event that the market fails to follow the preferred scenario, the top alternate count becomes the investor's backup plan.
Fibonacci Relationships One of Elliott's most significant discoveries is that because markets unfold in sequences of five and three waves, the number of waves that exist in the stock market's patterns reflects the Fibonacci sequence of numbers (1, 1, 2, 3, 5, 8, 13, 21, 34, etc.), an additive sequence that nature employs in many processes of growth and decay, expansion and contraction, progress and regress. Because this sequence is governed by the ratio, it appears throughout the price and time structure of the stock market, apparently governing its progress.
What the Wave Principle says, then, is that mankind's progress (of which the stock market is a popularly determined valuation) does not occur in a straight line, does not occur randomly, and does not occur cyclically. Rather, progress takes place in a "three steps forward, two steps back" fashion, a form that nature prefers. As a corollary, the Wave Principle reveals that periods of setback in fact are a requisite for social (and perhaps even individual) progress.
Implications A long term forecast for the stock market provides insight into the potential changes in social psychology and even the occurrence of resulting events. Since the Wave Principle reflects social mood change, it has not been surprising to discover, with preliminary data, that the trends of popular culture that also reflect mood change move in concert with the ebb and flow of aggregate stock prices. Popular tastes in entertainment, self-expression and political representation all reflect changing social moods and appear to be in harmony with the trends revealed more precisely by stock market data. At one-sided extremes of mood expression, changes in cultural trends can be anticipated.
On a philosophical level, the Wave Principle suggests that the nature of mankind has within it
3
the seeds of social change. As an example simply stated, prosperity ultimately breeds reactionism, while adversity eventually breeds a desire to achieve and succeed. The social mood is always in flux at all degrees of trend, moving toward one of two polar opposites in every conceivable area, from a preference for heroic symbols to a preference for anti-heroes, from joy and love of life to cynicism, from a desire to build and produce to a desire to destroy. Most important to individuals, portfolio managers and investment corporations is that the Wave Principle indicates in advance the relative magnitude of the next period of social prog-ress or regress.
Living in harmony with those trends can make the difference between success and failure in financial affairs. As the Easterners say, "Follow the Way." As the Westerners say, "Don't fight the tape." In order to heed these nuggets of advice, however, it is necessary to know what is the Way, and which way the tape. There is no better method for answering that question than the Wave Principle.
To obtain a full understanding of the Wave Principle including the terms and patterns, please read Elliott Wave Principle by A.J. Frost and Robert Prechter, or take the free Comprehensive Course on the Wave Principle on this website.
GLOSSARY
Alternation (guideline of) - If wave two is a sharp correction, wave four will usually be a sideways correction, and vice versa.
Apex - Intersection of the two boundary lines of a contracting triangle.
Corrective wave - A three wave pattern, or combination of three wave patterns, that moves in the opposite direction of the trend of one larger degree.
Diagonal Triangle (Ending) - A wedge shaped pattern containing overlap that occurs only in fifth or C waves. Subdivides 3-3-3-3-3.
Diagonal Triangle (Leading) - A wedge shaped pattern containing overlap that occurs only in first or A waves. Subdivides 5-3-5-3-5.
Double Three - Combination of two simple sideways corrective patterns, labeled W and Y, separated by a corrective wave labeled X.
Double Zigzag - Combination of two zigzags, labeled W and Y, separated by a corrective wave labeled X.
Equality (guideline of) - In a five-wave sequence, when wave three is the longest, waves five and one tend to be equal in price length.
Expanded Flat - Flat correction in which wave B enters new price territory relative to the preceding impulse wave.
Impulse Wave - A five wave pattern that subdivides 5-3-5-3-5 and contains no overlap.
Impulsive Wave - A five wave pattern that makes progress, i.e., any impulse or diagonal triangle.
Irregular Flat - See Expanded Flat.
One-two, one-two - The initial development in a five wave pattern, just prior to acceleration at the center of wave three.
Overlap - The entrance by wave four into the price territory of wave one. Not permitted in impulse waves.
Previous Fourth Wave - The fourth wave within the preceding impulse wave of the same degree. Corrective patterns typically terminate in this area.
Sharp Correction - Any corrective pattern that does not contain a price extreme meeting or exceeding that of the ending level of the prior impulse wave; alternates with sideways correction.
Sideways Correction - Any corrective pattern that contains a price extreme meeting or exceeding that of the prior impulse wave; alternates with sharp correction.
Third of a Third - Powerful middle section within an impulse wave.
Thrust - Impulsive wave following completion of a triangle.
Triangle (contracting, ascending or descending) - Corrective pattern, subdividing 3-3-3-3-3 and labeled a-b-c-d-e. Occurs as a fourth, B, X (in sharp correction only) or Y wave. Trendlines converge as pattern progresses.
Triangle (expanding) - Same as other triangles but trendlines diverge as pattern progresses.
Triple Three - Combination of three simple sideways corrective patterns labeled W, Y and Z, each separated by a corrective wave labeled X.
Triple Zigzag - Combination of three zigzags, labeled W, Y and Z, each separated by a corrective wave labeled X.
Truncated Fifth - The fifth wave in an impulsive pattern that fails to exceed the price extreme of the third wave.
In The Elliott Wave Principle — A Critical Appraisal, Hamilton Bolton made this opening statement:
As we have advanced through some of the most unpredictable economic climate imaginable, covering depression, major war, and postwar reconstruction and boom, I have noted how well Elliott's Wave Principle has fitted into the facts of life as they have developed, and have accordingly gained more confidence that this Principle has a good quotient of basic value.
"The Wave Principle" is Ralph Nelson Elliott's discovery that social, or crowd, behavior trends and reverses in recognizable patterns. Using stock market data as his main research tool, Elliott discovered that the ever-changing path of stock market prices reveals a structural design that in turn reflects a basic harmony found in nature. From this discovery, he developed a rational system of market analysis. Elliott isolated thirteen patterns of movement, or "waves," that recur in market price data and are repetitive in form, but are not necessarily repetitive in time or amplitude. He named, defined and illustrated the patterns. He then described how these structures link together to form larger versions of those same patterns, how they in turn link to form identical patterns of the next larger size, and so on. In a nutshell, then, the Wave Principle is a catalog of price patterns and an explanation of where these forms are likely to occur in the overall path of market development. Elliott's descriptions constitute a set of empirically derived rules and guidelines for interpreting market action. Elliott claimed predictive value for The Wave Principle, which now bears the name, "The Elliott Wave Principle."
Although it is the best forecasting tool in existence, the Wave Principle is not primarily a forecasting tool; it is a detailed description of how markets behave. Nevertheless, that description does impart an immense amount of knowledge about the market's position within the behavioral continuum and therefore about its probable ensuing path. The primary value of the Wave Principle is that it provides a context for market analysis. This context provides both a basis for disciplined thinking and a perspective on the market's general position and outlook. At times, its accuracy in identifying, and even anticipating, changes in direction is almost unbelievable. Many areas of mass human activity follow the Wave Principle, but the stock market is where it is most popularly applied. Indeed, the stock market considered alone is far more important than it seems to casual observers. The level of aggregate stock prices is a direct and immediate measure of the popular valuation of man's total productive capability. That this valuation has form is a fact of profound implications that will ultimately revolutionize the social sciences. That, however, is a discussion for another time.
R.N. Elliott's genius consisted of a wonderfully disciplined mental process, suited to studying charts of the Dow Jones Industrial Average and its predecessors with such thoroughness and precision that he could construct a network of principles that covered all market action known to him up to the mid-1940s. At that time, with the Dow in the 100s, Elliott predicted a great bull market for the next several decades that would exceed all expectations at a time when most investors felt it impossible that the Dow could even better its 1929 peak. As we shall see, phenomenal stock market forecasts, some of pinpoint accuracy years in advance, have accompanied the history of the application of the Elliott Wave approach.
Elliott had theories regarding the origin and meaning of the patterns he discovered, which we will present and expand upon in Lessons 16-19. Until then, suffice it to say that the patterns described in Lessons 1-15 have stood the test of time.
Often one will hear several different interpretations of the market's Elliott Wave status, especially when cursory, off-the-cuff studies of the averages are made by latter day experts.
However, most uncertainties can be avoided by keeping charts on both arithmetic and semilogarithmic scale and by taking care to follow the rules and guidelines as laid down in this course. Welcome to the world of Elliott.
BASIC TENETS
Under the Wave Principle, every market decision is both produced by meaningful information and produces meaningful information. Each transaction, while at once an effect, enters the fabric of the market and, by communicating transactional data to investors, joins the chain of causes of others' behavior. This feedback loop is governed by man's social nature, and since he has such a nature, the process generates forms. As the forms are repetitive, they have predictive value.
6
Sometimes the market appears to reflect outside conditions and events, but at other times it is entirely detached from what most people assume are causal conditions. The reason is that the market has a law of its own. It is not propelled by the linear causality to which one becomes accustomed in the everyday experiences of life. Nor is the market the cyclically rhythmic machine that some declare it to be. Nevertheless, its movement reflects a structured formal progression.
That progression unfolds in waves. Waves are patterns of directional movement. More specifically, a wave is any one of the patterns that naturally occur under the Wave Principle, as described in Lessons 1-9 of this course.
The Five Wave Pattern
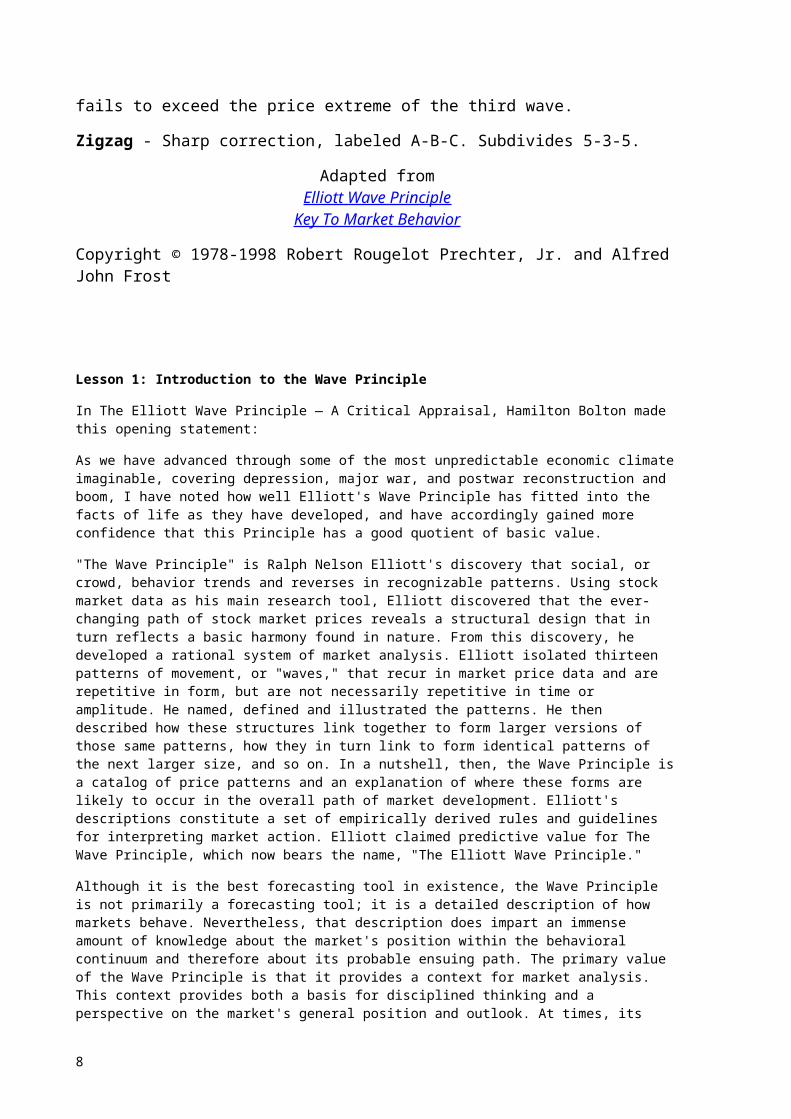
In markets, progress ultimately takes the form of five waves of a specific structure. Three of these waves, which are labeled 1, 3 and 5, actually effect the directional movement. They are separated by two countertrend interruptions, which are labeled 2 and 4, as shown in Figure 1-1. The two interruptions are apparently a requisite for overall directional movement to occur.
Figure 1-1
R.N. Elliott did not specifically state that there is only one overriding form, the "five wave" pattern, but that is undeniably the case. At any time, the market may be identified as being somewhere in the basic five wave pattern at the largest degree of trend. Because the five wave pattern is the overriding form of market progress, all other patterns are subsumed by it.
Wave Mode
There are two modes of wave development: motive and corrective. Motive waves have a five wave structure, while corrective waves have a three wave structure or a variation thereof. Motive mode is employed by both the five wave pattern of Figure 1-1 and its same-directional components, i.e., waves 1, 3 and 5. Their structures are called "motive" because they powerfully impel the market. Corrective mode is employed by all countertrend interruptions, which include waves 2 and 4 in Figure 1-1. Their structures are called "corrective" because they can accomplish only a partial retracement, or "correction," of the progress achieved by any preceding motive wave. Thus, the two modes are fundamentally different, both in their roles and in their construction, as will be detailed throughout this course.
7
Next Lesson: Details of the Complete Cycle
Lesson 2: Details of the Complete Cycle
In his 1938 book, The Wave Principle, and again in a series of articles published in 1939 by Financial World magazine, R.N. Elliott pointed out that the stock market unfolds according to a basic rhythm or pattern of five waves up and three waves down to form a complete cycle of eight waves. The pattern of five waves up followed by three waves down is depicted in Figure 1-2.
Figure 1-2
One complete cycle consisting of eight waves, then, is made up of two distinct phases, the motive phase (also called a "five"), whose subwaves are denoted by numbers, and the corrective phase (also called a "three"), whose subwaves are denoted by letters. The sequence a, b, c corrects the sequence 1, 2, 3, 4, 5 in Figure 1-2.
At the terminus of the eight-wave cycle shown in Figure 1-2 begins a second similar cycle of five upward waves followed by three downward waves. A third advance then develops, also consisting of five waves up. This third advance completes a five wave movement of one degree larger than the waves of which it is composed. The result is as shown in Figure 1-3 up to the peak labeled (5).
8
Figure 1-3
At the peak of wave (5) begins a down movement of correspondingly larger degree, composed once again of three waves. These three larger waves down "correct" the entire movement of five larger waves up. The result is another complete, yet larger, cycle, as shown in Figure 1-3. As Figure 1-3 illustrates, then, each same-direction component of a motive wave, and each full-cycle component (i.e., waves 1 + 2, or waves 3 + 4) of a cycle, is a smaller version of itself.
It is crucial to understand an essential point: Figure 1-3 not only illustrates a larger version of Figure 1-2, it also illustrates Figure 1-2 itself, in greater detail. In Figure 1-2, each subwave 1, 3 and 5 is a motive wave that will subdivide into a "five," and
each subwave 2 and 4 is a corrective wave that will subdivide into an a, b, c. Waves (1) and (2) in Figure 1-3, if examined under a "microscope," would take the same form as waves [1]* and [2]. All these figures illustrate the phenomenon of constant form within ever-changing degree.
The market's compound construction is such that two waves of a particular degree subdivide into eight waves of the next lower degree, and those eight waves subdivide in exactly the same manner into thirty-four waves of the next lower degree. The Wave Principle, then, reflects the fact that waves of any degree in any series always subdivide and re-subdivide into waves of lesser degree and simultaneously are components of waves of higher degree. Thus, we can use Figure 1-3 to illustrate two waves, eight waves or thirty-four waves, depending upon the degree to which we are referring.
The Essential Design
Now observe that within the corrective pattern illustrated as wave [2] in Figure 1-3, waves (a) and (c), which point downward, are composed of five waves: 1, 2, 3, 4 and 5. Similarly, wave (b), which points upward, is composed of three waves: a, b and c. This construction discloses a crucial point: that motive waves do not always point upward, and corrective waves do not always point downward. The mode of a wave is determined not by its absolute direction but primarily by its relative direction. Aside from four specific exceptions, which will be discussed later in this course, waves divide in motive mode (five waves) when trending in the same direction as the wave of one larger degree of which it is a part, and in corrective mode (three waves or a variation) when trending in the opposite direction. Waves (a) and (c) are motive, trending in the same direction as wave [2]. Wave (b) is corrective because it corrects wave (a) and is countertrend to wave [2]. In summary, the essential underlying tendency of the Wave Principle is that action in the same direction as the one larger trend develops in five waves, while reaction against the one larger trend develops in three waves, at all degrees of trend.
*Note: For this course, all Primary degree numbers and letters normally denoted by circles are shown with brackets.
Next Lesson: Essential Concepts
Lesson 3: Essential Concepts
9
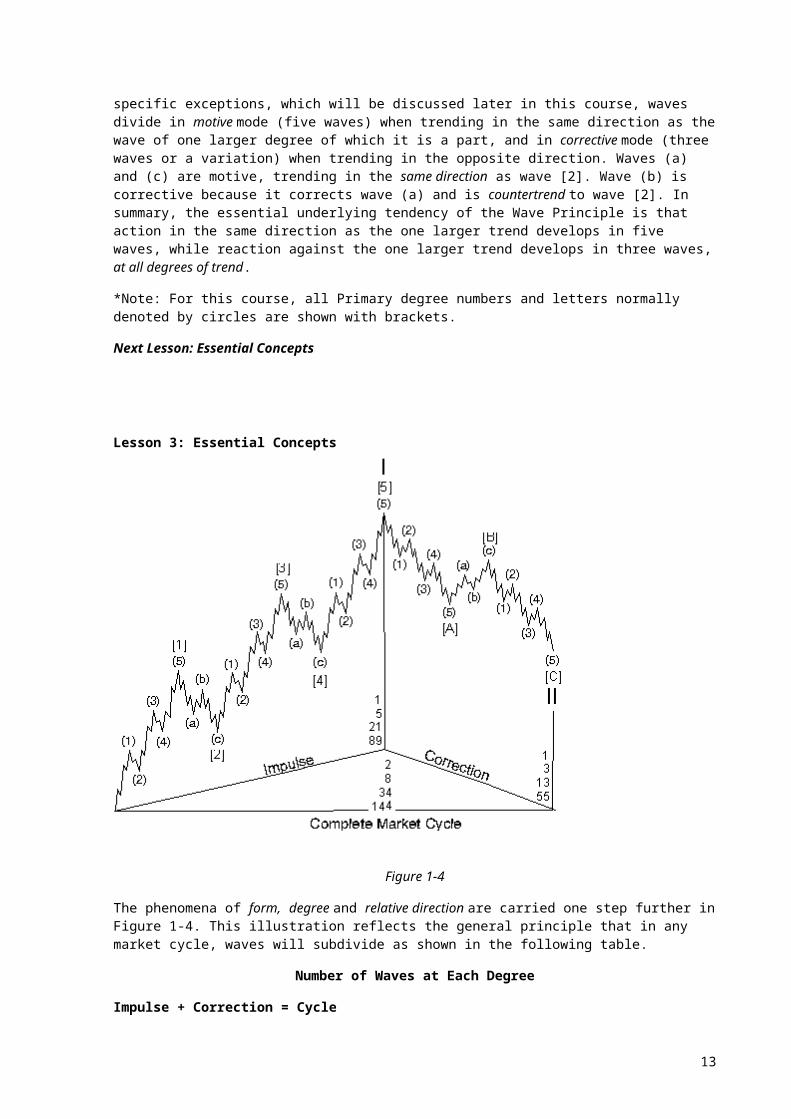
Figure 1-4
The phenomena of form, degree and relative direction are carried one step further in Figure 1-4. This illustration reflects the general principle that in any market cycle, waves will subdivide as shown in the following table.
Number of Waves at Each Degree
Impulse + Correction = Cycle
Largest waves 1+1=2
Largest subdivisions 5+3=8
Next subdivisions 21+13=34
Next subdivisions 89+55=144
As with Figures 1-2 and 1-3 in Lesson 2, neither does Figure 1-4 imply finality. As before, the termination of yet another eight wave movement (five up and three down) completes a cycle that automatically becomes two subdivisions of the wave of next higher degree. As long as progress continues, the process of building to greater degrees continues. The reverse process of subdividing into lesser degrees apparently continues indefinitely as well. As far as we can determine, then, all waves both have and are component waves.
Elliott himself never speculated on why the market's essential form was five waves to progress and three waves to regress. He simply noted that that was what was happening. Does the essential form have to be five waves and three waves? Think about it and you will realize that this is the minimum requirement for, and therefore the most efficient method of, achieving both fluctuation and progress in linear movement. One wave does not allow fluctuation. The fewest subdivisions to create fluctuation is three waves. Three waves in both directions does not allow progress. To progress in one direction despite periods of regress, movements in the main trend must be at least five waves, simply to cover more ground than the three waves and still contain fluctuation. While there could be more waves than that, the most efficient form of punctuated progress is 5-3, and nature typically follows the most efficient path.
10
Variations on the Basic Theme
The Wave Principle would be simple to apply if the basic theme described above were the complete description of market behavior. However, the real world, fortunately or unfortunately, is not so simple. From here through Lesson 15, we will fill out the description of how the market behaves in reality. That's what Elliott set out to describe, and he succeeded in doing so.
DETAILED ANALYTICS
WAVE DEGREE
All waves may be categorized by relative size, or degree. Elliott discerned nine degrees of waves, from the smallest wiggle on an hourly chart to the largest wave he could assume existed from the data then available. He chose the names listed below to label these degrees, from largest to smallest:
Grand SupercycleSupercycle
CyclePrimary
IntermediateMinorMinute
MinuetteSubminuette
It is important to understand that these labels refer to specifically identifiable degrees of waves. For instance, whenwe refer to the U.S. stock market's rise from 1932, we speak of it as a Supercycle with subdivisions as follows:
1932-1937 the first wave of Cycle degree
1937-1942 the second wave of Cycle degree
1942-1966 the third wave of Cycle degree
1966-1974 the fourth wave of Cycle degree
1974-19?? the fifth wave of Cycle degree
Cycle waves subdivide into Primary waves that subdivide into Intermediate waves that in turn subdivide into Minor and sub-Minor waves. By using this nomenclature, the analyst can identify precisely the position of a wave in the overall progression of the market, much as longitude and latitude are used to identify a geographical location. To say, "the Dow Jones Industrial Average is in Minute wave v of Minor wave 1 of Intermediate wave (3) of Primary wave [5] of Cycle wave I of Supercycle wave (V) of the current Grand Supercycle" is to identify a specific point along the progression of market history.
Wave Degree 5s With the Trend 3s Against the Trend
Supercycle (I) (II) (III) (IV) (V) (A) (B) (C)
Cycle I II III IV V A B C
Primary [1] [2] [3] [4] [5] [A] [B] [C]
Intermediate (1) (2) (3) (4) (5) (a) (b) (c)
Minor 1 2 3 4 5 A B C
Minute i ii iii iv v a b c
11
Minuette 1 2 3 4 5 a b c
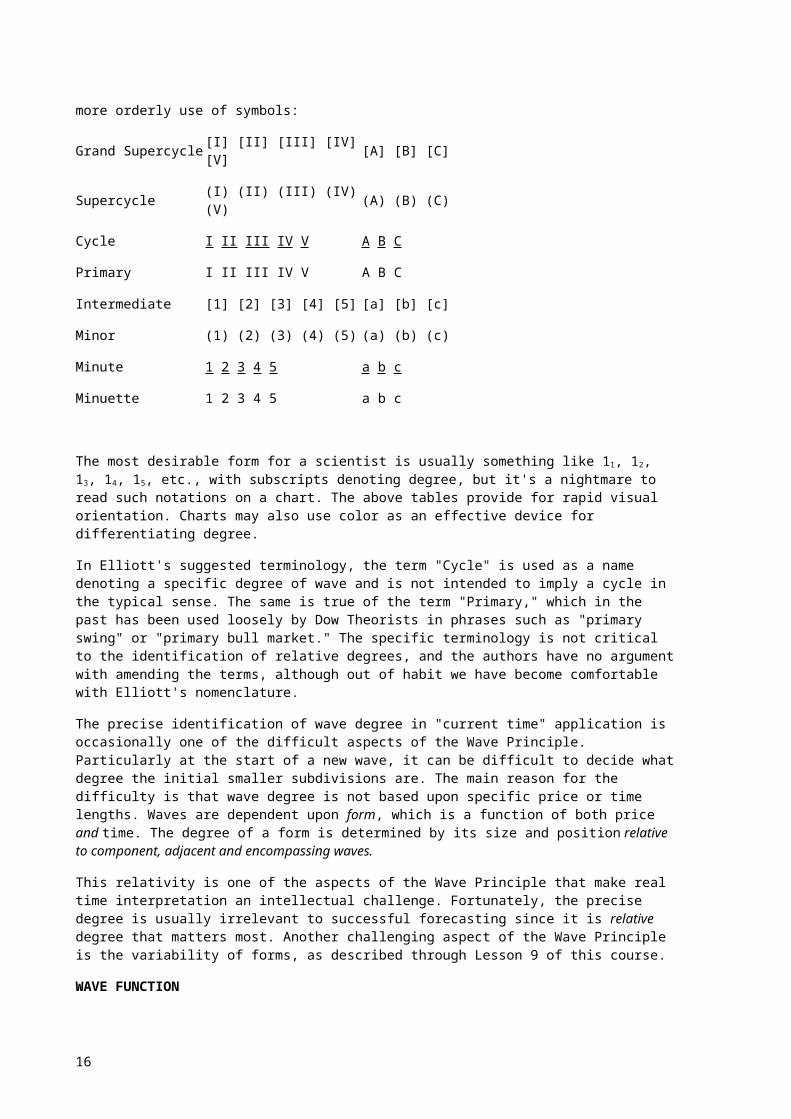
The above labels preserve most closely Elliott's notations and are traditional, but a list such as that shown below provides a more orderly use of symbols:
Grand Supercycle [I] [II] [III] [IV] [V] [A] [B] [C]
Supercycle (I) (II) (III) (IV) (V) (A) (B) (C)
Cycle I II III IV V A B C
Primary I II III IV V A B C
Intermediate [1] [2] [3] [4] [5] [a] [b] [c]
Minor (1) (2) (3) (4) (5) (a) (b) (c)
Minute 1 2 3 4 5 a b c
Minuette 1 2 3 4 5 a b c
The most desirable form for a scientist is usually something like 11, 12, 13, 14, 15, etc., with subscripts denoting degree, but it's a nightmare to read such notations on a chart. The above tables provide for rapid visual orientation. Charts may also use color as an effective device for differentiating degree.
In Elliott's suggested terminology, the term "Cycle" is used as a name denoting a specific degree of wave and is not intended to imply a cycle in the typical sense. The same is true of the term "Primary," which in the past has been used loosely by Dow Theorists in phrases such as "primary swing" or "primary bull market." The specific terminology is not critical to the identification of relative degrees, and the authors have no argument with amending the terms, although out of habit we have become comfortable with Elliott's nomenclature.
The precise identification of wave degree in "current time" application is occasionally one of the difficult aspects of the Wave Principle. Particularly at the start of a new wave, it can be difficult to decide what degree the initial smaller subdivisions are. The main reason for the difficulty is that wave degree is not based upon specific price or time lengths. Waves are dependent upon form, which is a function of both price and time. The degree of a form is determined by its size and position relative to component, adjacent and encompassing waves.
This relativity is one of the aspects of the Wave Principle that make real time interpretation an intellectual challenge. Fortunately, the precise degree is usually irrelevant to successful forecasting since it is relative degree that matters most. Another challenging aspect of the Wave Principle is the variability of forms, as described through Lesson 9 of this course.
WAVE FUNCTION
Every wave serves one of two functions: action or reaction. Specifically, a wave may either advance the cause of the wave of one larger degree or interrupt it. The function of a wave is determined by its relative direction. An actionary or trend wave is any wave that trends in the same direction as the wave of one larger degree of which it is a part. A reactionary or countertrend wave is any wave that trends in the direction opposite to that of the wave of one larger degree of which it is part. Actionary waves are labeled with odd numbers and letters. Reactionary waves are labeled with even numbers and letters.
All reactionary waves develop in corrective mode. If all actionary waves developed in motive mode, then there would be no need for different terms. Indeed, most actionary waves do subdivide into five waves. However, as the following sections reveal, a few actionary waves develop in corrective mode, i.e., they subdivide into three waves or a variation thereof. A detailed knowledge of pattern construction is required before one can draw the distinction between actionary function and motive mode, which in the underlying model introduced so far are indistinct. A thorough understanding of the forms detailed in the next five lessons will clarify why we have introduced these terms to the Elliott
12
Wave lexicon.
Next Lesson: Impulse Waves
Lesson 4: Motive Waves
Motive waves subdivide into five waves with certain characteristics and always move in the same direction as the trend of one larger degree. They are straightforward and relatively easy to recognize and interpret.
Within motive waves, wave 2 never retraces more than 100% of wave 1, and wave 4 never retraces more than 100% of wave 3. Wave 3, moreover, always travels beyond the end of wave 1. The goal of a motive wave is to make progress, and these rules of formation assure that it will.
Elliott further discovered that in price terms, wave 3 is often the longest and never the shortest among the three actionary waves (1, 3 and 5) of a motive wave. As long as wave 3 undergoes a greater percentage movement than either wave 1 or 5, this rule is satisfied. It almost always holds on an arithmetic basis as well. There are two types of motive waves: impulses and diagonal triangles.
Impulse
The most common motive wave is an impulse. In an impulse, wave 4 does not enter the territory of (i.e., "overlap") wave 1. This rule holds for all non-leveraged "cash" markets. Futures markets, with their extreme leverage, can induce short term price extremes that would not occur in cash markets. Even so, overlapping is usually confined to daily and intraday price fluctuations and even then is extremely rare. In addition, the actionary subwaves (1, 3 and 5) of an impulse are themselves motive, and subwave 3 is specifically an impulse. Figures 1-2 and 1-3 in Lesson 2 and 1-4 in Lesson 3 all depict impulses in the 1, 3, 5, A and C wave positions.
As detailed in the preceding three paragraphs, there are only a few simple rules for interpreting impulses properly. A rule is so called because it governs all waves to which it applies. Typical, yet not inevitable, characteristics of waves are called guidelines. Guidelines of impulse formation, including extension, truncation, alternation, equality, channeling, personality and ratio relationships are discussed below and through Lesson 24 of this course. A rule should never be disregarded. In many years of practice with countless patterns, the authors have found but one instance above Subminuette degree when all other rules and guidelines combined to suggest that a rule was broken. Analysts who routinely break any of the rules detailed in this section are practicing some form of analysis other than that guided by the Wave Principle. These rules have great practical utility in correct counting, which we will explore further in discussing extensions.
Extension
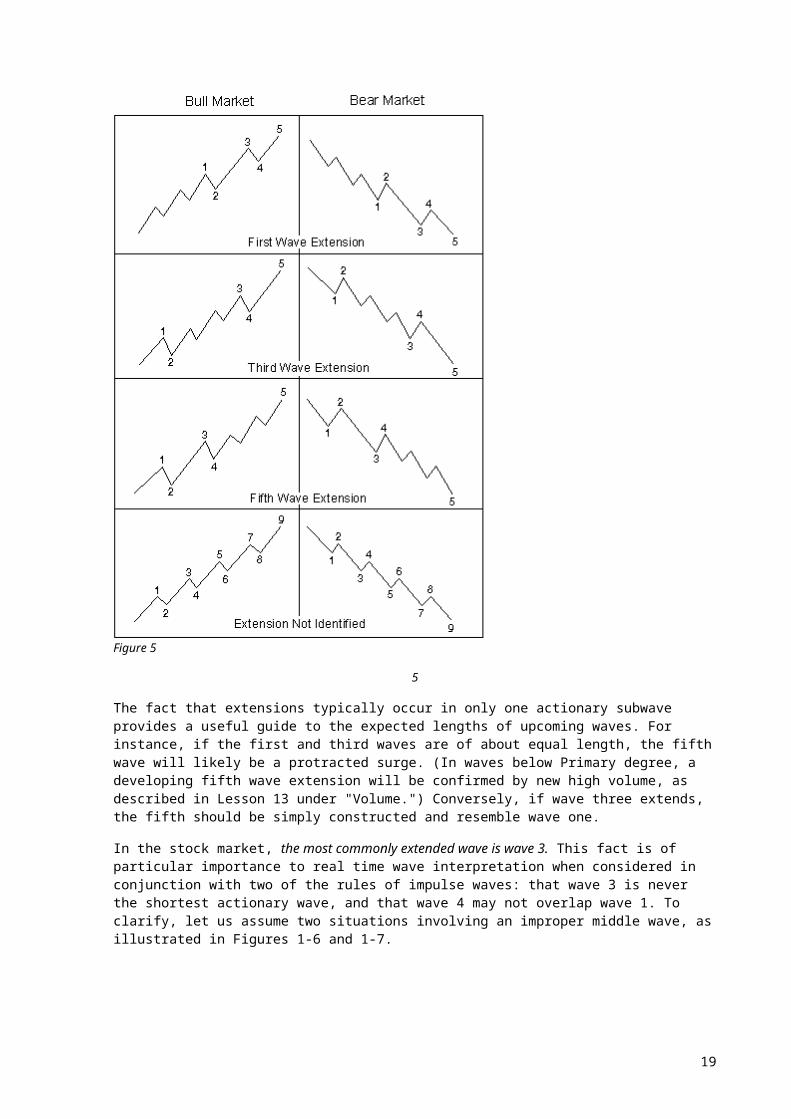
Most impulses contain what Elliott called an extension. Extensions are elongated impulses with exaggerated subdivisions. The vast majority of impulse waves do contain an extension in one and only one of their three actionary subwaves. At times, the subdivisions of an extended wave are nearly the same amplitude and duration as the other four waves of the larger impulse, giving a total count of nine waves of similar size rather than the normal count of "five" for the sequence. In a nine-wave sequence, it is occasionally difficult to say which wave extended. However, it is usually irrelevant anyway, since under the Elliott system, a count of nine and a count of five have the same technical significance. The diagrams in Figure 1-5, illustrating extensions, will clarify this point.
13
Figure 5
5
The fact that extensions typically occur in only one actionary subwave provides a useful guide to the expected lengths of upcoming waves. For instance, if the first and third waves are of about equal length, the fifth wave will likely be a protracted surge. (In waves below Primary degree, a developing fifth wave extension will be confirmed by new high volume, as described in Lesson 13 under "Volume.") Conversely, if wave three extends, the fifth should be simply constructed and resemble wave one.
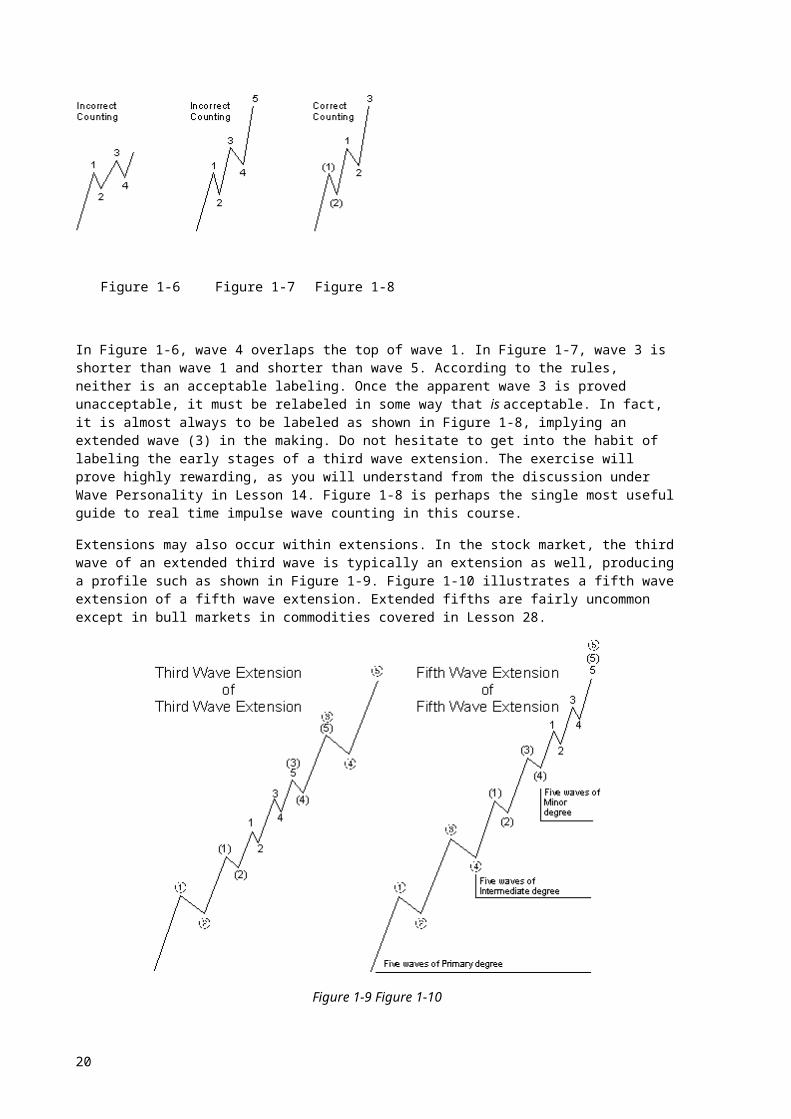
In the stock market, the most commonly extended wave is wave 3. This fact is of particular importance to real time wave interpretation when considered in conjunction with two of the rules of impulse waves: that wave 3 is never the shortest actionary wave, and that wave 4 may not overlap wave 1. To clarify, let us assume two situations involving an improper middle wave, as illustrated in Figures 1-6 and 1-7.
14
Figure 1-6 Figure 1-7 Figure 1-8
In Figure 1-6, wave 4 overlaps the top of wave 1. In Figure 1-7, wave 3 is shorter than wave 1 and shorter than wave 5. According to the rules, neither is an acceptable labeling. Once the apparent wave 3 is proved unacceptable, it must be relabeled in some way that is acceptable. In fact, it is almost always to be labeled as shown in Figure 1-8, implying an extended wave (3) in the making. Do not hesitate to get into the habit of labeling the early stages of a third wave extension. The exercise will prove highly rewarding, as you will understand from the discussion under Wave Personality in Lesson 14. Figure 1-8 is perhaps the single most useful guide to real time impulse wave counting in this course.
Extensions may also occur within extensions. In the stock market, the third wave of an extended third wave is typically an extension as well, producing a profile such as shown in Figure 1-9. Figure 1-10 illustrates a fifth wave extension of a fifth wave extension. Extended fifths are fairly uncommon except in bull markets in commodities covered in Lesson 28.
Figure 1-9 Figure 1-10
Truncation
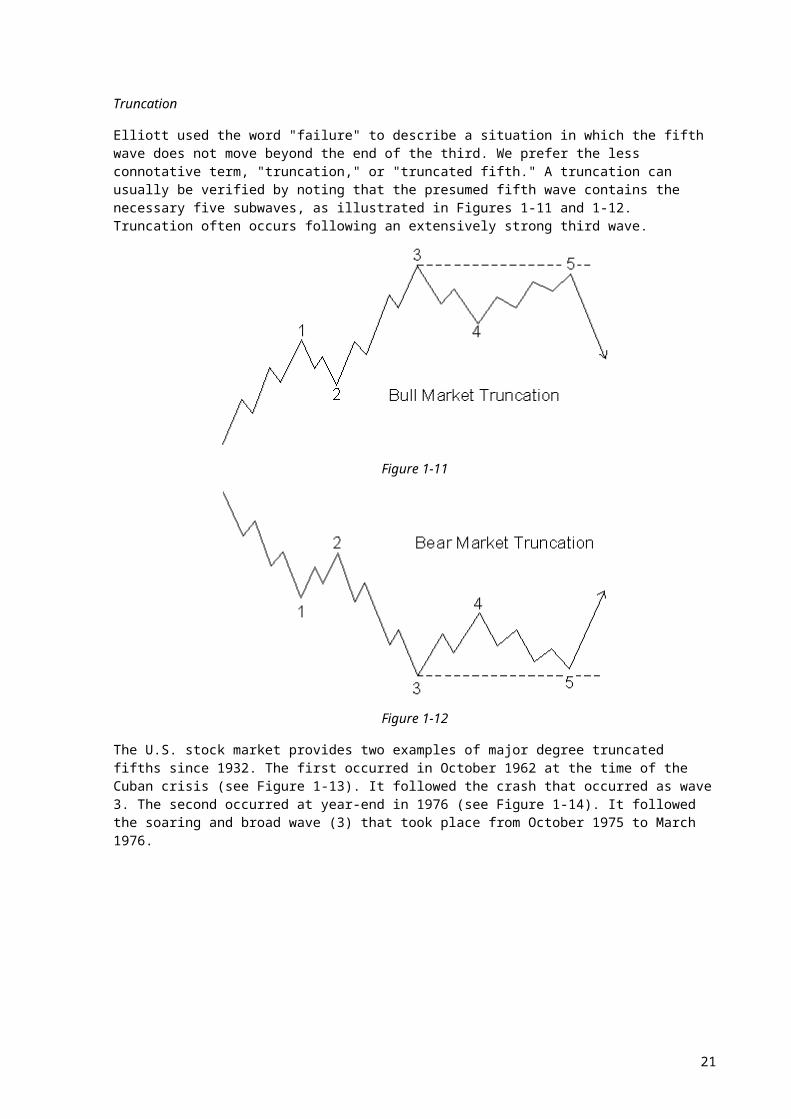
Elliott used the word "failure" to describe a situation in which the fifth wave does not move beyond the end of the third. We prefer the less connotative term, "truncation," or "truncated fifth." A truncation can usually be verified by noting that the presumed fifth wave contains the necessary five subwaves, as illustrated in Figures 1-11 and 1-12. Truncation often occurs following an extensively strong third
15
wave.
Figure 1-11
Figure 1-12
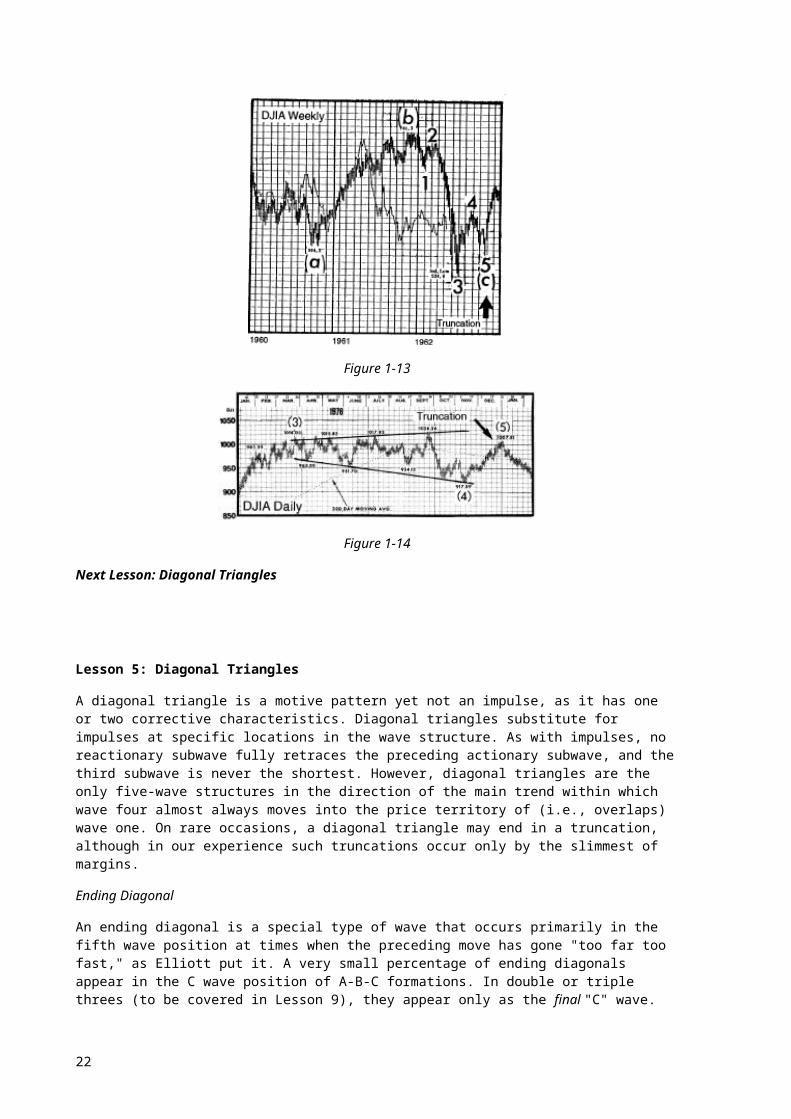
The U.S. stock market provides two examples of major degree truncated fifths since 1932. The first occurred in October 1962 at the time of the Cuban crisis (see Figure 1-13). It followed the crash that occurred as wave 3. The second occurred at year-end in 1976 (see Figure 1-14). It followed the soaring and broad wave (3) that took place from October 1975 to March 1976.
Figure 1-13
16
Figure 1-14
Next Lesson: Diagonal Triangles
Lesson 5: Diagonal Triangles
A diagonal triangle is a motive pattern yet not an impulse, as it has one or two corrective characteristics. Diagonal triangles substitute for impulses at specific locations in the wave structure. As with impulses, no reactionary subwave fully retraces the preceding actionary subwave, and the third subwave is never the shortest. However, diagonal triangles are the only five-wave structures in the direction of the main trend within which wave four almost always moves into the price territory of (i.e., overlaps) wave one. On rare occasions, a diagonal triangle may end in a truncation, although in our experience such truncations occur only by the slimmest of margins.
Ending Diagonal
An ending diagonal is a special type of wave that occurs primarily in the fifth wave position at times when the preceding move has gone "too far too fast," as Elliott put it. A very small percentage of ending diagonals appear in the C wave position of A-B-C formations. In double or triple threes (to be covered in Lesson 9), they appear only as the final "C" wave. In all cases, they are found at the termination points of larger patterns, indicating exhaustion of the larger movement.
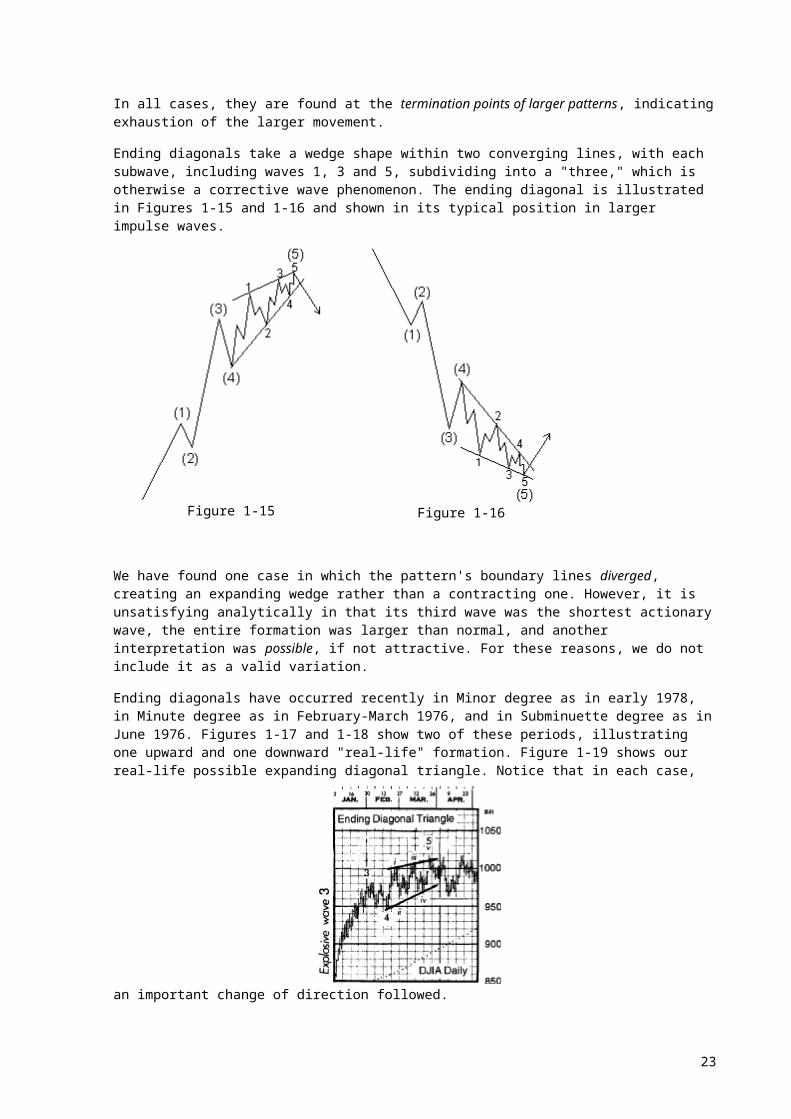
Ending diagonals take a wedge shape within two converging lines, with each subwave, including waves 1, 3 and 5, subdividing into a "three," which is otherwise a corrective wave phenomenon. The ending diagonal is illustrated in Figures 1-15 and 1-16 and shown in its typical position in larger impulse waves.
Figure 1-15 Figure 1-16
We have found one case in which the pattern's boundary lines diverged, creating an expanding wedge
17
rather than a contracting one. However, it is unsatisfying analytically in that its third wave was the shortest actionary wave, the entire formation was larger than normal, and another interpretation was possible, if not attractive. For these reasons, we do not include it as a valid variation.
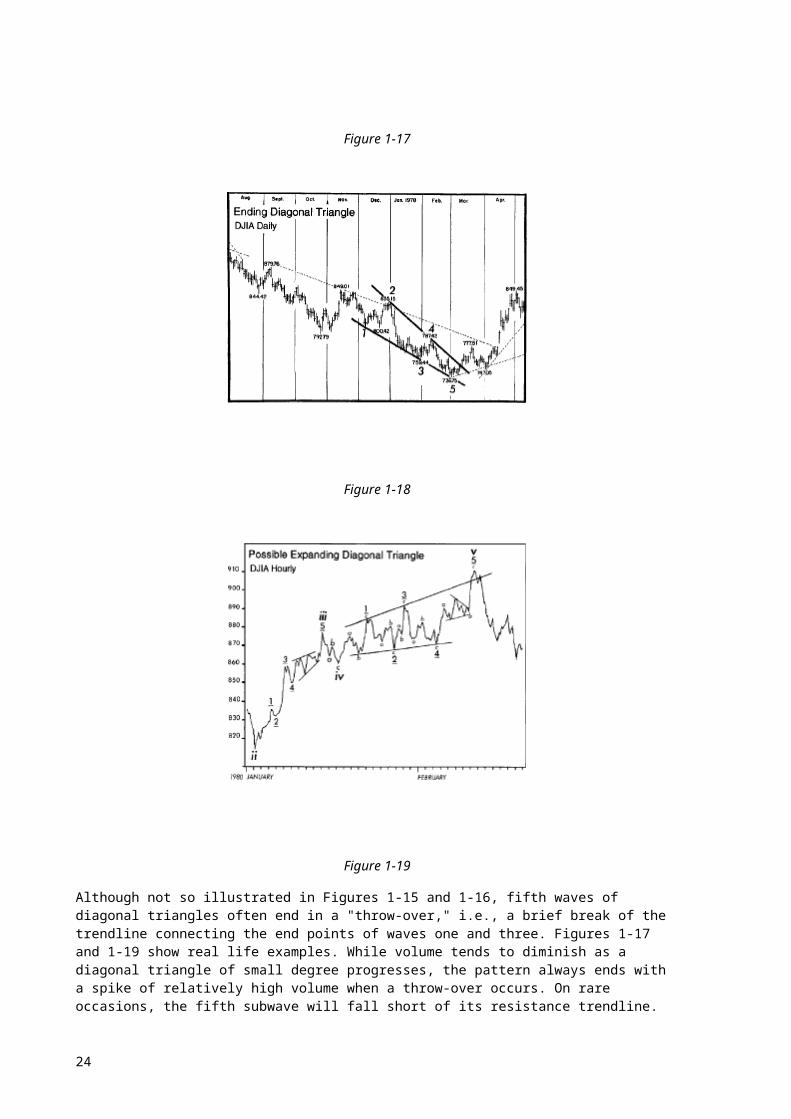
Ending diagonals have occurred recently in Minor degree as in early 1978, in Minute degree as in February-March 1976, and in Subminuette degree as in June 1976. Figures 1-17 and 1-18 show two of these periods, illustrating one upward and one downward "real-life" formation. Figure 1-19 shows our real-life possible expanding diagonal triangle. Notice that in each case, an important change of direction followed.
Figure 1-17
Figure 1-18
18
Figure 1-19
Although not so illustrated in Figures 1-15 and 1-16, fifth waves of diagonal triangles often end in a "throw-over," i.e., a brief break of the trendline connecting the end points of waves one and three. Figures 1-17 and 1-19 show real life examples. While volume tends to diminish as a diagonal triangle of small degree progresses, the pattern always ends with a spike of relatively high volume when a throw-over occurs. On rare occasions, the fifth subwave will fall short of its resistance trendline.
A rising diagonal is bearish and is usually followed by a sharp decline retracing at least back to the level where it began. A falling diagonal by the same token is bullish, usually giving rise to an upward thrust.
Fifth wave extensions, truncated fifths and ending diagonal triangles all imply the same thing: dramatic reversal ahead. At some turning points, two of these phenomena have occurred together at different degrees, compounding the violence of the next move in the opposite direction.
Leading Diagonal
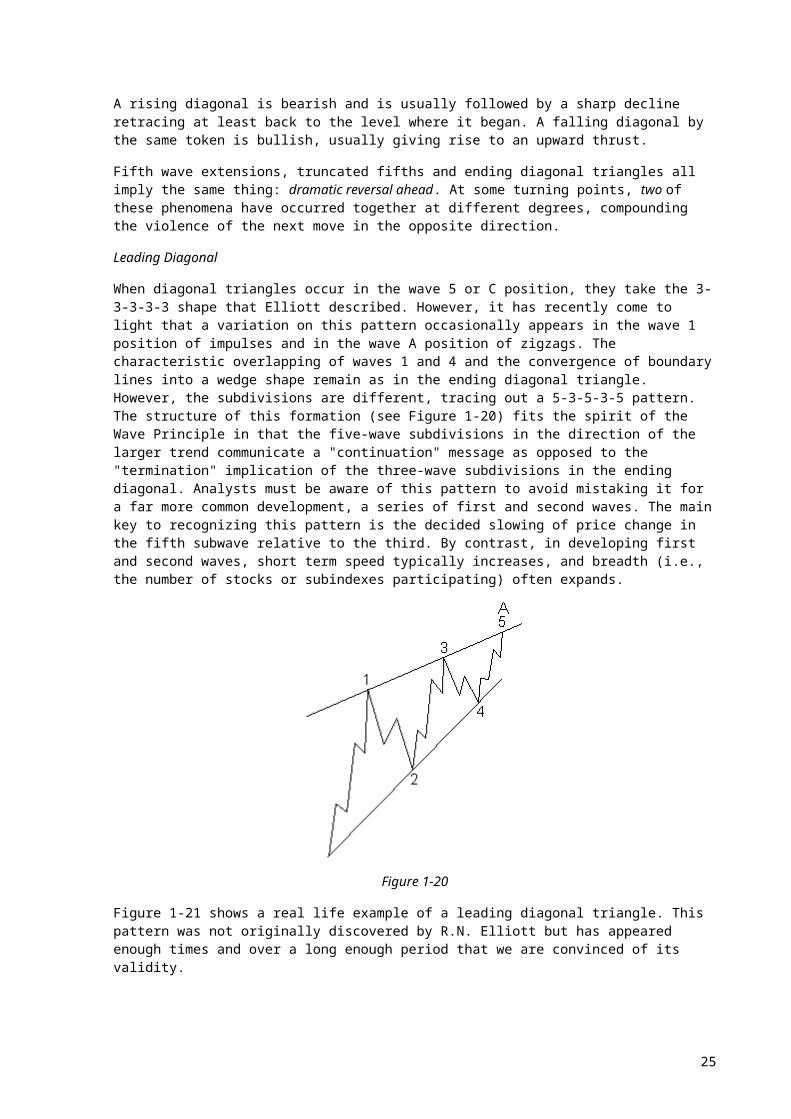
When diagonal triangles occur in the wave 5 or C position, they take the 3-3-3-3-3 shape that Elliott described. However, it has recently come to light that a variation on this pattern occasionally appears in the wave 1 position of impulses and in the wave A position of zigzags. The characteristic overlapping of waves 1 and 4 and the convergence of boundary lines into a wedge shape remain as in the ending diagonal triangle. However, the subdivisions are different, tracing out a 5-3-5-3-5 pattern. The structure of this formation (see Figure 1-20) fits the spirit of the Wave Principle in that the five-wave subdivisions in the direction of the larger trend communicate a "continuation" message as opposed to the "termination" implication of the three-wave subdivisions in the ending diagonal. Analysts must be aware of this pattern to avoid mistaking it for a far more common development, a series of first and second waves. The main key to recognizing this pattern is the decided slowing of price change in the fifth subwave relative to the third. By contrast, in developing first and second waves, short term speed typically increases, and breadth (i.e., the number of stocks or subindexes participating) often expands.
19
Figure 1-20
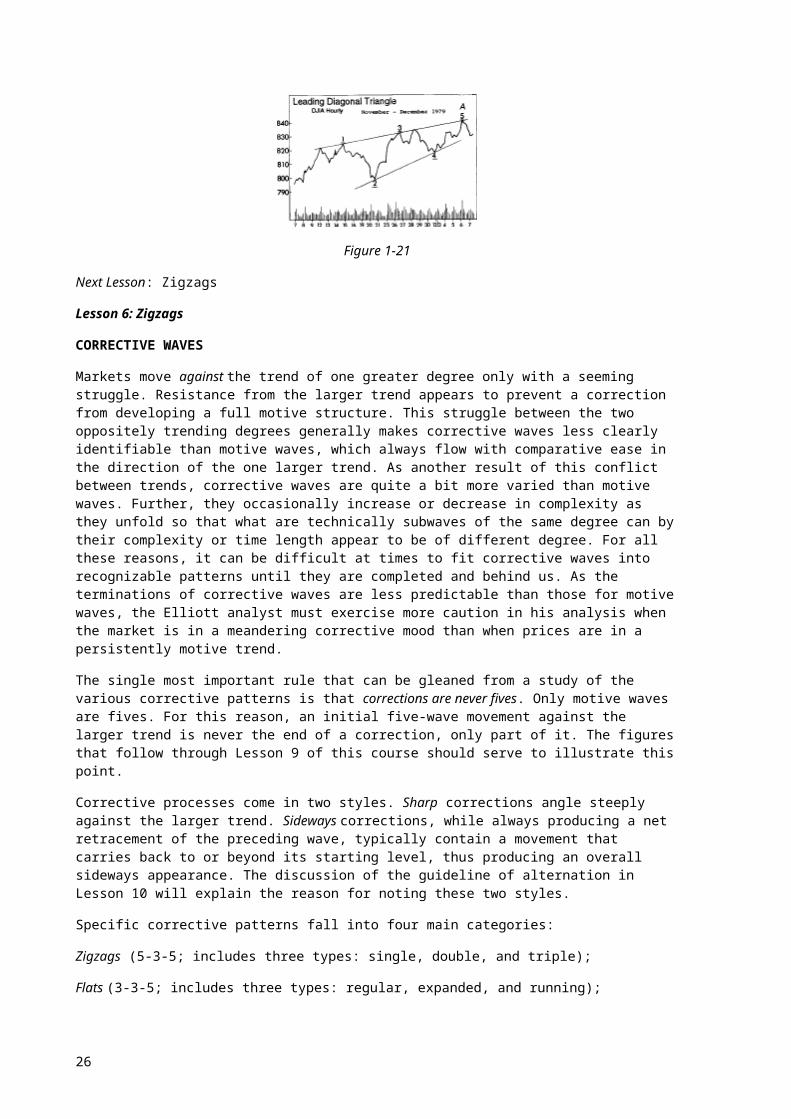
Figure 1-21 shows a real life example of a leading diagonal triangle. This pattern was not originally discovered by R.N. Elliott but has appeared enough times and over a long enough period that we are convinced of its validity.
Figure 1-21
Next Lesson: Zigzags
Lesson 6: Zigzags
CORRECTIVE WAVES
Markets move against the trend of one greater degree only with a seeming struggle. Resistance from the larger trend appears to prevent a correction from developing a full motive structure. This struggle between the two oppositely trending degrees generally makes corrective waves less clearly identifiable than motive waves, which always flow with comparative ease in the direction of the one larger trend. As another result of this conflict between trends, corrective waves are quite a bit more varied than motive waves. Further, they occasionally increase or decrease in complexity as they unfold so that what are technically subwaves of the same degree can by their complexity or time length appear to be of different degree. For all these reasons, it can be difficult at times to fit corrective waves into recognizable patterns until they are completed and behind us. As the terminations of corrective waves are less predictable than those for motive waves, the Elliott analyst must exercise more caution in his analysis when the market is in a meandering corrective mood than when prices are in a persistently motive trend.
The single most important rule that can be gleaned from a study of the various corrective patterns is that corrections are never fives. Only motive waves are fives. For this reason, an initial five-wave movement against the larger trend is never the end of a correction, only part of it. The figures that follow through Lesson 9 of this course should serve to illustrate this point.
Corrective processes come in two styles. Sharp corrections angle steeply against the larger trend. Sideways corrections, while always producing a net retracement of the preceding wave, typically
20
contain a movement that carries back to or beyond its starting level, thus producing an overall sideways appearance. The discussion of the guideline of alternation in Lesson 10 will explain the reason for noting these two styles.
Specific corrective patterns fall into four main categories:
Zigzags (5-3-5; includes three types: single, double, and triple);
Flats (3-3-5; includes three types: regular, expanded, and running);
Triangles (3-3-3-3-3; four types: three of the contracting variety (ascending, descending, and symmetrical) and one of the expanding variety (reverse symmetrical);
Double threes and triple threes (combined structures).
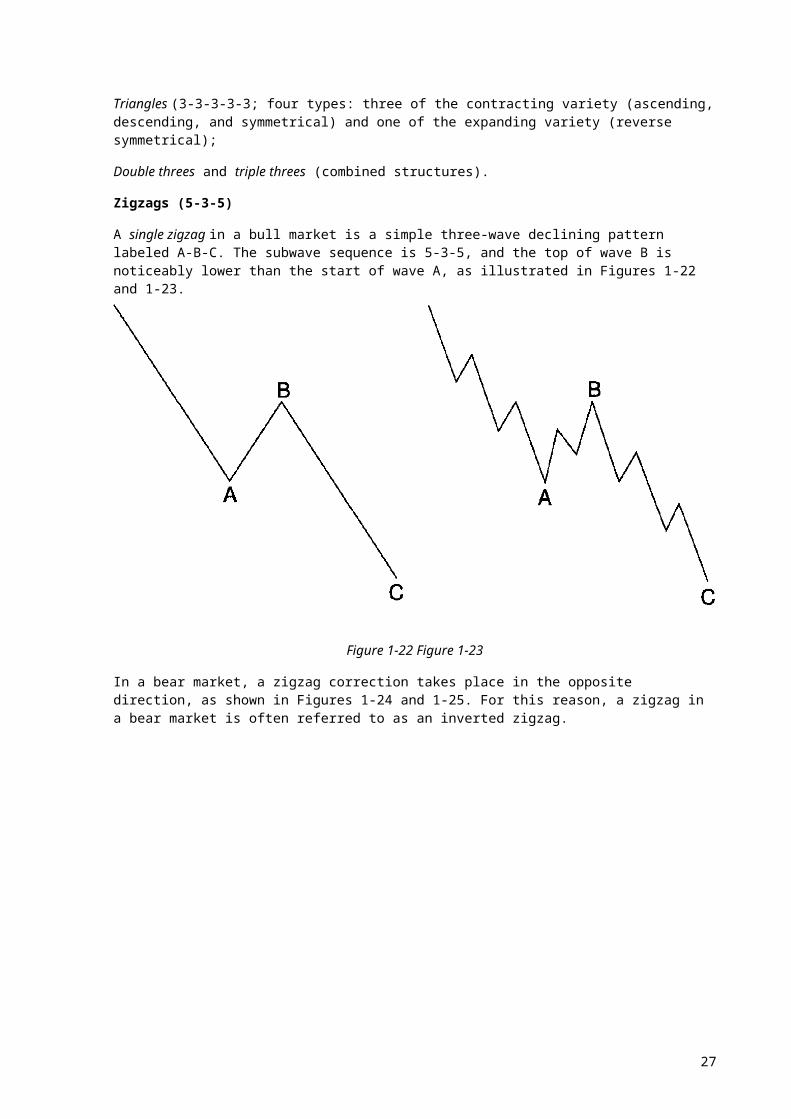
Zigzags (5-3-5)
A single zigzag in a bull market is a simple three-wave declining pattern labeled A-B-C. The subwave sequence is 5-3-5, and the top of wave B is noticeably lower than the start of wave A, as illustrated in Figures 1-22 and 1-23.
Figure 1-22 Figure 1-23
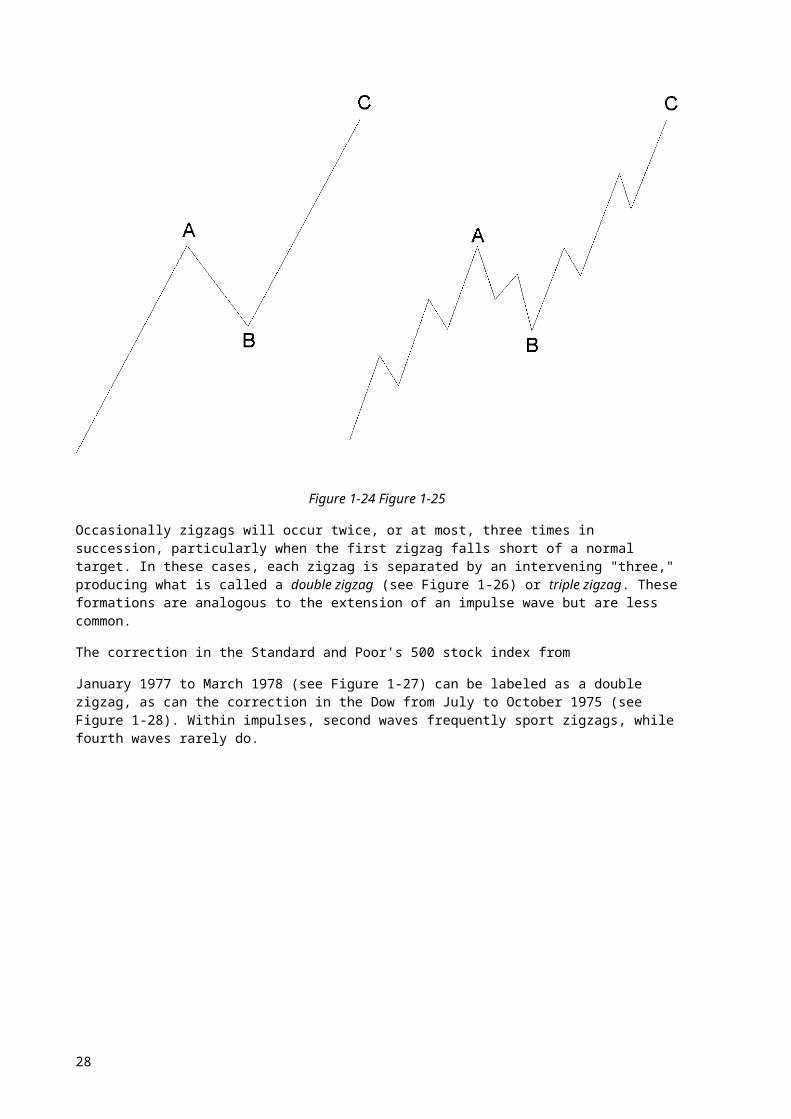
In a bear market, a zigzag correction takes place in the opposite direction, as shown in Figures 1-24 and 1-25. For this reason, a zigzag in a bear market is often referred to as an inverted zigzag.
21
Figure 1-24 Figure 1-25
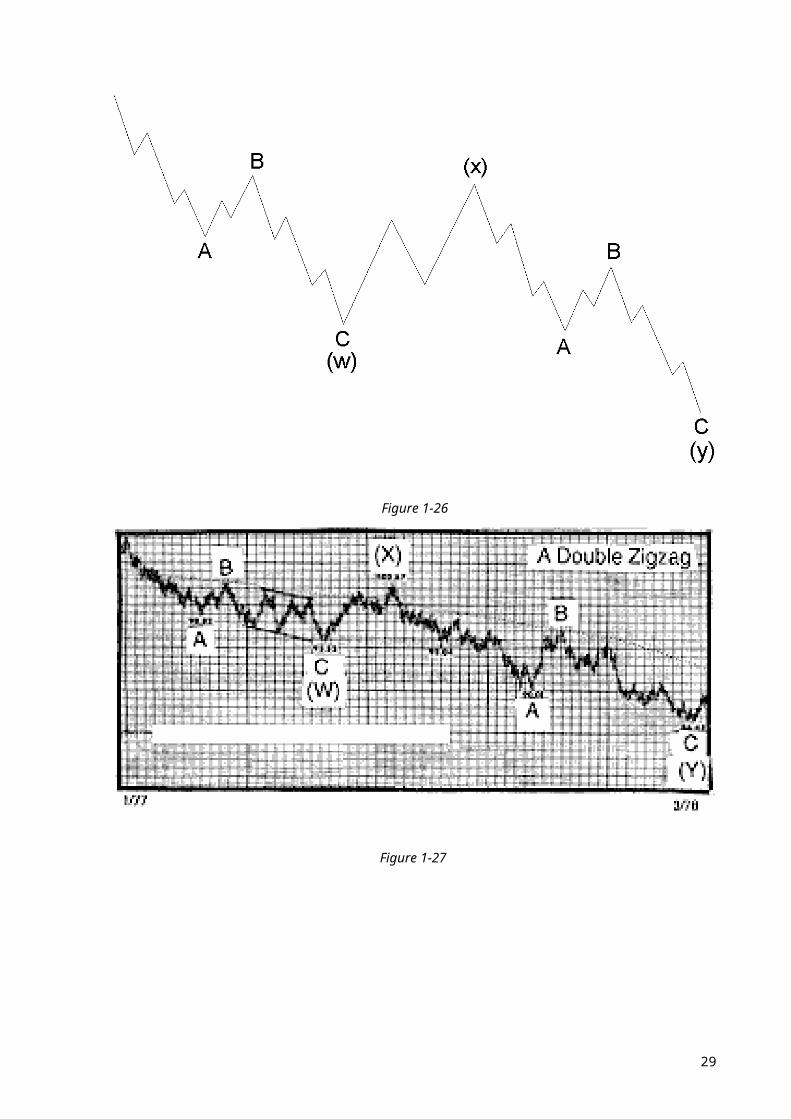
Occasionally zigzags will occur twice, or at most, three times in succession, particularly when the first zigzag falls short of a normal target. In these cases, each zigzag is separated by an intervening "three," producing what is called a double zigzag (see Figure 1-26) or triple zigzag. These formations are analogous to the extension of an impulse wave but are less common.
The correction in the Standard and Poor's 500 stock index from
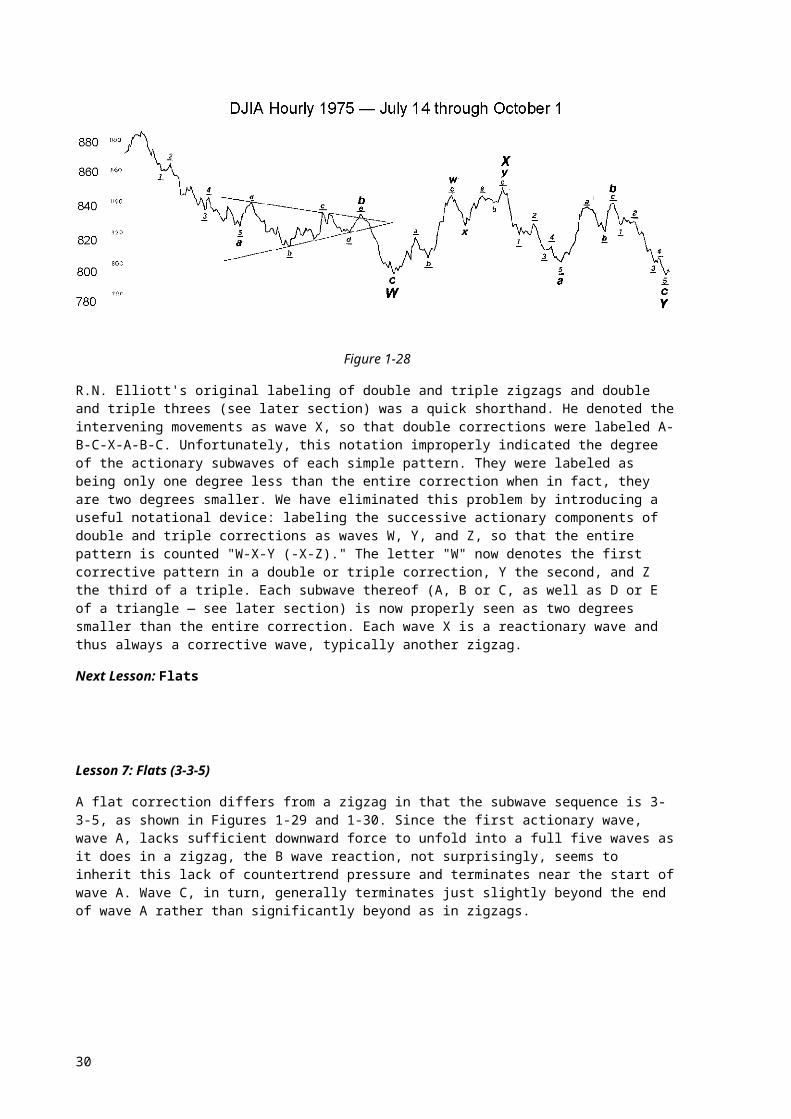
January 1977 to March 1978 (see Figure 1-27) can be labeled as a double zigzag, as can the correction in the Dow from July to October 1975 (see Figure 1-28). Within impulses, second waves frequently sport zigzags, while fourth waves rarely do.
22
Figure 1-26
Figure 1-27
23
Figure 1-28
R.N. Elliott's original labeling of double and triple zigzags and double and triple threes (see later section) was a quick shorthand. He denoted the intervening movements as wave X, so that double corrections were labeled A-B-C-X-A-B-C. Unfortunately, this notation improperly indicated the degree of the actionary subwaves of each simple pattern. They were labeled as being only one degree less than the entire correction when in fact, they are two degrees smaller. We have eliminated this problem by introducing a useful notational device: labeling the successive actionary components of double and triple corrections as waves W, Y, and Z, so that the entire pattern is counted "W-X-Y (-X-Z)." The letter "W" now denotes the first corrective pattern in a double or triple correction, Y the second, and Z the third of a triple. Each subwave thereof (A, B or C, as well as D or E of a triangle — see later section) is now properly seen as two degrees smaller than the entire correction. Each wave X is a reactionary wave and thus always a corrective wave, typically another zigzag.
Next Lesson: Flats
Lesson 7: Flats (3-3-5)
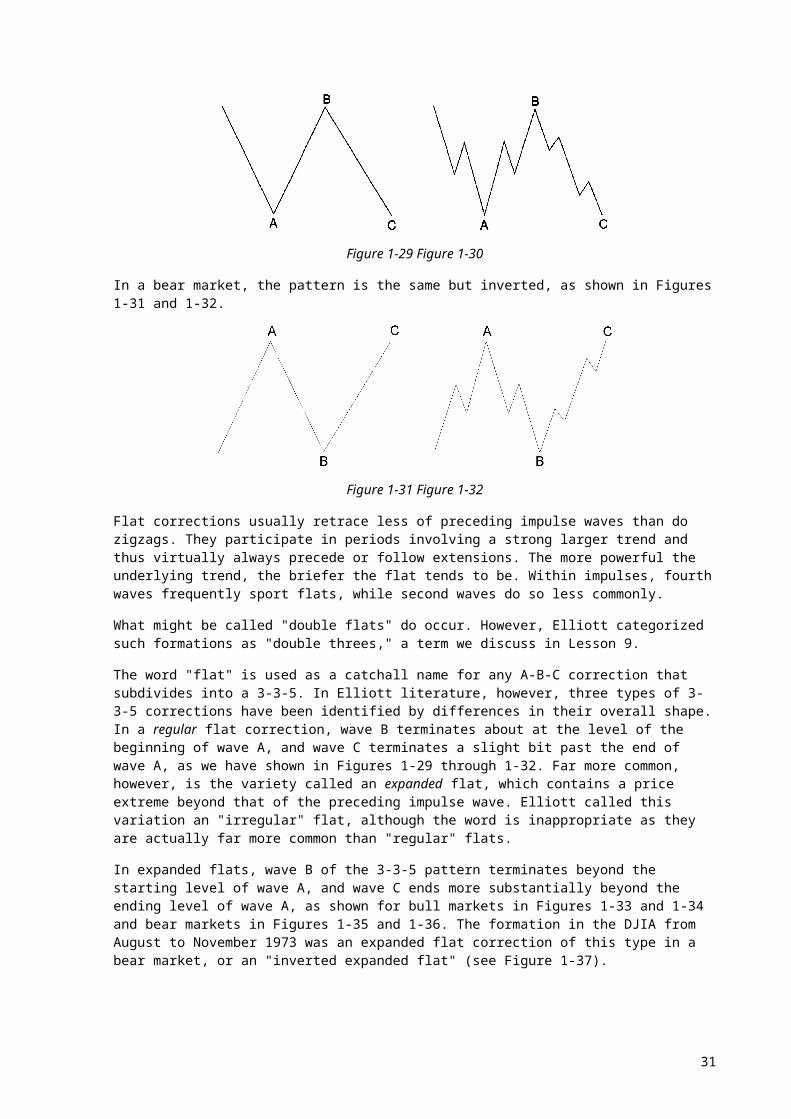
A flat correction differs from a zigzag in that the subwave sequence is 3-3-5, as shown in Figures 1-29 and 1-30. Since the first actionary wave, wave A, lacks sufficient downward force to unfold into a full five waves as it does in a zigzag, the B wave reaction, not surprisingly, seems to inherit this lack of countertrend pressure and terminates near the start of wave A. Wave C, in turn, generally terminates just slightly beyond the end of wave A rather than significantly beyond as in zigzags.
Figure 1-29 Figure 1-30
In a bear market, the pattern is the same but inverted, as shown in Figures 1-31 and 1-32.
24
Figure 1-31 Figure 1-32
Flat corrections usually retrace less of preceding impulse waves than do zigzags. They participate in periods involving a strong larger trend and thus virtually always precede or follow extensions. The more powerful the underlying trend, the briefer the flat tends to be. Within impulses, fourth waves frequently sport flats, while second waves do so less commonly.
What might be called "double flats" do occur. However, Elliott categorized such formations as "double threes," a term we discuss in Lesson 9.
The word "flat" is used as a catchall name for any A-B-C correction that subdivides into a 3-3-5. In Elliott literature, however, three types of 3-3-5 corrections have been identified by differences in their overall shape. In a regular flat correction, wave B terminates about at the level of the beginning of wave A, and wave C terminates a slight bit past the end of wave A, as we have shown in Figures 1-29 through 1-32. Far more common, however, is the variety called an expanded flat, which contains a price extreme beyond that of the preceding impulse wave. Elliott called this variation an "irregular" flat, although the word is inappropriate as they are actually far more common than "regular" flats.
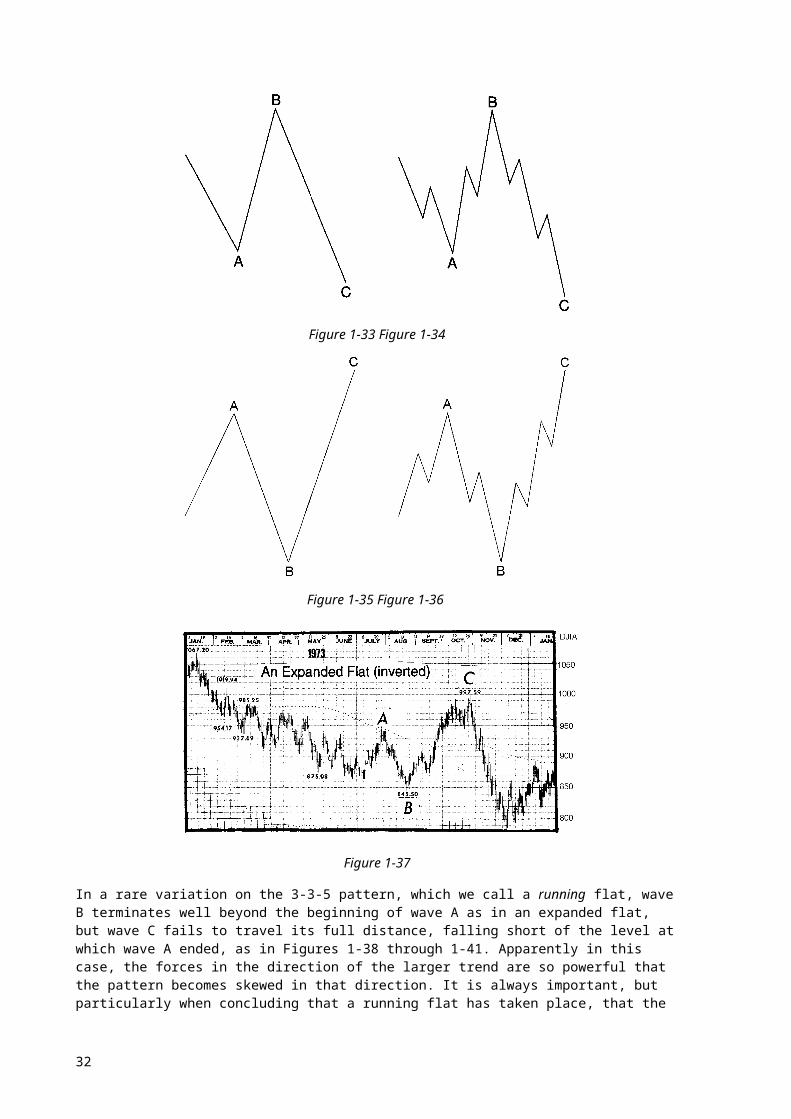
In expanded flats, wave B of the 3-3-5 pattern terminates beyond the starting level of wave A, and wave C ends more substantially beyond the ending level of wave A, as shown for bull markets in Figures 1-33 and 1-34 and bear markets in Figures 1-35 and 1-36. The formation in the DJIA from August to November 1973 was an expanded flat correction of this type in a bear market, or an "inverted expanded flat" (see Figure 1-37).
Figure 1-33 Figure 1-34
25
Figure 1-35 Figure 1-36
Figure 1-37
In a rare variation on the 3-3-5 pattern, which we call a running flat, wave B terminates well beyond the beginning of wave A as in an expanded flat, but wave C fails to travel its full distance, falling short of the level at which wave A ended, as in Figures 1-38 through 1-41. Apparently in this case, the forces in the direction of the larger trend are so powerful that the pattern becomes skewed in that direction. It is always important, but particularly when concluding that a running flat has taken place, that the internal subdivisions adhere to Elliott's rules. If the supposed B wave, for instance, breaks down into five waves rather than three, it is more likely the first wave up of the impulse of next higher degree. The power of adjacent impulse waves is important in recognizing running corrections, which tend to occur only in strong and fast markets. We must issue a warning, however. There are hardly any examples of this type of correction in the price record. Never label a correction prematurely this way, or you'll find yourself wrong nine times out of ten. Running triangles, in contrast, are much more common, as we'll see in Lesson 8.
26
Figure 1-38 Figure 1-39
Figure 1-40 Figure 1-41
Next Lesson: Triangles
Lesson 8: Triangles
Triangles appear to reflect a balance of forces, causing a sideways movement that is usually associated with decreasing volume and volatility. Triangles contain five overlapping waves that subdivide 3-3-3-3-3 and are labeled a-b-c-d-e. A triangle is delineated by connecting the termination points of waves a and c, and b and d. Wave e can undershoot or overshoot the a-c line, and in fact, our experience tells us that it happens more often than not.
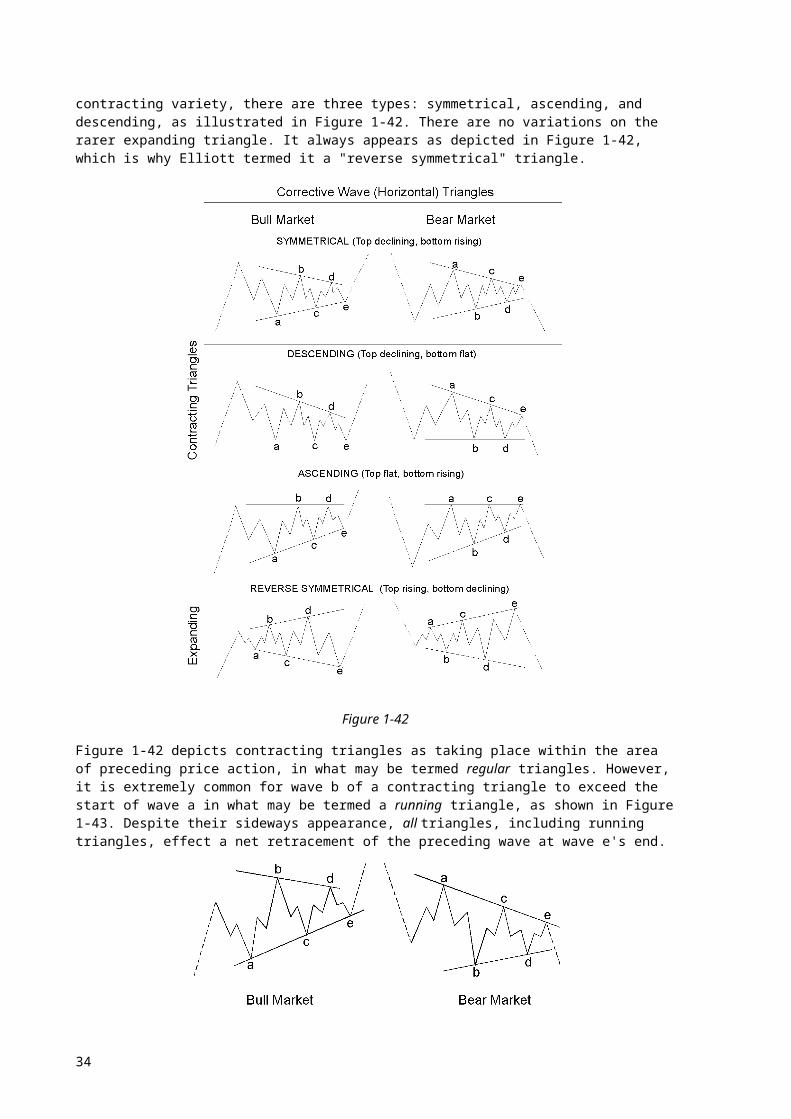
There are two varieties of triangles: contracting and expanding. Within the contracting variety, there are three types: symmetrical, ascending, and descending, as illustrated in Figure 1-42. There are no variations on the rarer expanding triangle. It always appears as depicted in Figure 1-42, which is why Elliott termed it a "reverse symmetrical" triangle.
27
Figure 1-42
Figure 1-42 depicts contracting triangles as taking place within the area of preceding price action, in what may be termed regular triangles. However, it is extremely common for wave b of a contracting triangle to exceed the start of wave a in what may be termed a running triangle, as shown in Figure 1-43. Despite their sideways appearance, all triangles, including running triangles, effect a net retracement of the preceding wave at wave e's end.
Figure 1-43
There are several real life examples of triangles in the charts in this course. As you will notice, most of the subwaves in a triangle are zigzags, but sometimes one of the subwaves (usually wave c) is more complex than the others and can take the shape of a regular or expanded flat or multiple zigzag. In rare cases, one of the sub-waves (usually wave e) is itself a triangle, so that the entire pattern protracts into nine waves. Thus, triangles, like zigzags, occasionally display a development that is analogous to an extension. One example occurred in silver from 1973 through 1977 (see Figure 1-44).
28
Figure 1-44
Although upon extremely rare occasions a second wave in an impulse appears to take the form of a triangle, triangles nearly always occur in positions prior to the final actionary wave in the pattern of one larger degree, i.e., as wave four in an impulse, wave B in an A-B-C, or the final wave X in a double or triple zig-zag or combination (to be shown in Lesson 9). A triangle may also occur as the final actionary pattern in a corrective combination, as discussed in Lesson 9, although even then it always precedes the final actionary wave in the pattern of one larger degree than the corrective combination.
In the stock market, when a triangle occurs in the fourth wave position, wave five is sometimes swift and travels approximately the distance of the widest part of the triangle. Elliott used the word "thrust" in referring to this swift, short motive wave following a triangle. The thrust is usually an impulse but can be an ending diagonal. In powerful markets, there is no thrust, but instead a prolonged fifth wave. So if a fifth wave following a triangle pushes past a normal thrust measurement, it is signaling a likely protracted wave. Post-triangle advancing impulses in commodities at degrees above Intermediate are usually the longest wave in the sequence, as explained in Lesson 29.
On the basis of our experience with triangles, as the example in Figure 3-15 illustrates, we propose that often the time at which the boundary lines of a contracting triangle reach an apex coincides exactly with a turning point in the market. Perhaps the frequency of this occurrence would justify its inclusion among the guidelines associated with the Wave Principle.
The term "horizontal" as applied to triangles refers to these corrective triangles in general, as opposed to the term "diagonal," which refers to those motive triangular formations discussed in Lesson 5. Thus, the terms "horizontal triangle" and "diagonal triangle" denote these specific forms under the Wave Principle. The simpler terms "triangle" and "wedge" may be substituted, but keep in mind that technical chart readers have long used these terms to communicate less specifically subdivided forms defined only by overall shape. Having separate terms can be useful.
Next Lesson: Corrective Combinations
29
Lesson 9: Corrective Combinations
Double and Triple Threes
Elliott called sideways combinations of corrective patterns "double threes" and "triple threes." While a single three is any zigzag or flat, a triangle is an allowable final component of such combinations and in this context is called a "three." A double or triple three, then, is a combination of simpler types of corrections, including the various types of zigzags, flats and triangles. Their occurrence appears to be the flat correction's way of extending sideways action. As with double and triple zigzags, each simple corrective pattern is labeled W, Y and Z. The reactionary waves, labeled X, can take the shape of any corrective pattern but are most commonly zigzags.
Combinations of threes were labeled differently by Elliott at different times, although the illustrative pattern always took the shape of two or three juxtaposed flats, as shown in Figures 1-45 and 1-46. However, the component patterns more commonly alternate in form. For example, a flat followed by a triangle is a more typical type of double three, as illustrated in Figure 1-47.
Figure 1-45 Figure 1-46
Figure 1-47
A flat followed by a zigzag is another example, as shown in Figure 1-48. Naturally, since the figures in this section depict corrections in bull markets, they need only be inverted to observe them as upward corrections in bear markets.
Figure 1-48
For the most part, double threes and triple threes are horizontal in character. Elliott indicated that the entire formations could slant against the larger trend, although we have never found this to be the case. One reason is that there never appears to be more than one zigzag in a combination. Neither is there more than one triangle. Recall that triangles occurring alone precede the final movement of a larger trend. Combinations appear to recognize this character and sport triangles only as the final
30
wave in a double or triple three.
Although different in that their angle of trend is sharper than the sideways trend of combinations, double and triple zigzags can be characterized as non-horizontal combinations, as Elliott seemed to suggest in Nature's Law. However, double and triple threes are different from double and triple zigzags, not only in their angle but in their goal. In a double or triple zigzag, the first zigzag is rarely large enough to constitute an adequate price correction of the preceding wave. The doubling or tripling of the initial form is typically necessary to create an adequately sized price retracement. In a combination, however, the first simple pattern often constitutes an adequate price correction. The doubling or tripling appears to occur mainly to extend the duration of the corrective process after price targets have been substantially met. Sometimes additional time is needed to reach a channel line or achieve a stronger kinship with the other correction in an impulse wave. As the consolidation continues, the attendant psychology and fundamentals extend their trends accordingly.
As this section makes clear, there is a qualitative difference between the number series 3 + 4 + 4 + 4, etc., and the series 5 + 4 + 4 + 4, etc. Notice that while impulse waves have a total count of 5, with extensions leading to 9, 13 or 17 waves, and so on, corrective waves have a count of 3, with combinations leading to 7 or 11 waves, and so on. Triangles appear to be an exception, although they can be counted as one would a triple three, totaling 11 waves. Thus, if an internal count is unclear, the analyst can sometimes reach a reasonable conclusion merely by counting waves. A count of 9, 13 or 17 with few overlaps, for instance, is likely motive, while a count of 7, 11 or 15 with numerous overlaps is likely corrective. The main exceptions are diagonal triangles of both types, which are hybrids of motive and corrective forces.
Orthodox Tops and Bottoms
Sometimes a pattern's end differs from the associated price extreme. In such cases, the end of the pattern is called the "orthodox" top or bottom in order to differentiate it from the actual price high or low that occurs intra-pattern. For example, in Figure 1-11, the end of wave 5 is the orthodox top despite the fact that wave 3 registered a higher price. In Figure 1-12, the end of wave 5 is the orthodox bottom. In Figures 1-33 and 1-34, the starting point of wave A is the orthodox top of the preceding bull market despite the higher high of wave B. In Figure 1-47, the end of wave Y is the orthodox bottom of the bear market even though the price low occurs at the end of wave W.
This concept is important primarily because a successful analysis always depends upon a proper labeling of the patterns. Assuming falsely that a particular price extreme is the correct starting point for wave labeling can throw analysis off for some time, while being aware of the requirements of wave form will keep you on track. Further, when applying the forecasting concepts that will be introduced in Lessons 20 through 25, the length and duration of a wave are typically determined by measuring from and projecting orthodox ending points.
Reconciling Function and Mode
In Lessons 3 and 4, we described the two functions waves may perform (action and reaction), as well as the two modes of structural development (motive and corrective) that they undergo. Now that we have reviewed all types of waves, we can summarize their labels as follows:
— The labels for actionary waves are 1, 3, 5, A, C, E, W, Y and Z.
— The labels for reactionary waves are 2, 4, B, D and X.
As stated earlier, all reactionary waves develop in corrective mode, and most actionary waves develop in motive mode. The preceding sections have described which actionary waves develop in corrective mode. They are:
— waves 1, 3 and 5 in an ending diagonal,
— wave A in a flat correction,
— waves A, C and E in a triangle,
31
— waves W and Y in double zigzags and double corrections,
— wave Z in triple zigzags and triple corrections.
Because the waves listed above are actionary in relative direction yet develop in corrective mode, we term them "actionary corrective" waves.
As far as we know, we have listed all wave formations that can occur in the price movement of the broad stock market averages. Under the Wave Principle, no other formations than those listed here will occur. Indeed, since the hourly readings are a nearly perfectly matched filter for detailing waves of Subminuette degree, the authors can find no examples of waves above the Subminuette degree that cannot be counted satisfactorily by the Elliott method. In fact, Elliott Waves of much smaller degree than Subminuette are revealed by computer generated charts of minute-by-minute transactions. Even the few data points (transactions) per unit of time at this low a degree are enough to reflect accurately the Wave Principle of human behavior by recording the rapid shifts in psychology occurring in the "pits" and on the exchange floor. All rules (which were covered in Lessons 1 through 9) and guidelines (which are covered in Lessons 1 through 15) fundamentally apply to actual market mood, not its recording per se or lack thereof. Its clear manifestation requires free market pricing. When prices are fixed by government edict, such as those for gold and silver for half of the twentieth century, waves restricted by the edict are not allowed to register. When the available price record differs from what might have existed in a free market, rules and guidelines must be considered in that light. In the long run, of course, markets always win out over edicts, and edict enforcement is only possible if the mood of the market allows it. All rules and guidelines presented in this course presume that your price record is accurate. Now that we have presented the rules and rudiments of wave formation, we can move on to some of the guidelines for successful analysis under the Wave Principle.
Next Lesson: The Guideline of Alternation
Lesson 10: The guideline of alternation
The guidelines presented in Lessons 10-15 are discussed and illustrated in the context of a bull market. Except where specifically excluded, they apply equally in bear markets, in which context the illustrations and implications would be inverted.
Alternation
The guideline of alternation is very broad in its application and warns the analyst always to expect a difference in the next expression of a similar wave. Hamilton Bolton said,
The writer is not convinced that alternation is inevitable in types of waves in larger formations, but there are frequent enough cases to suggest that one should look for it rather than the contrary.
Although alternation does not say precisely what is going to happen, it gives valuable notice of what not to expect and is therefore useful to keep in mind when analyzing wave formations and assessing future possibilities. It primarily instructs the analyst not to assume, as most people tend to do, that because the last market cycle behaved in a certain manner, this one is sure to be the same. As "contrarians" never cease to point out, the day that most investors "catch on" to an apparent habit of the market is the day it will change to one completely different. However, Elliott went further in stating that, in fact, alternation was virtually a law of markets.
Alternation Within Impulses
If wave two of an impulse is a sharp correction, expect wave four to be a sideways correction, and vice versa. Figure 2-1 shows the most characteristic breakdowns of impulse waves, both up and down, as suggested by the guideline of alternation. Sharp corrections never include a new price extreme, i.e., one that lies beyond the orthodox end of the preceding impulse wave. They are almost always zigzags (single, double or triple); occasionally they are double threes that begin with a zigzag. Sideways corrections include flats, triangles, and double and triple corrections. They usually include a new price extreme, i.e., one that lies beyond the orthodox end of the preceding impulse wave. In rare cases, a regular triangle (one that does not include a new price extreme) in the fourth wave position
32
will take the place of a sharp correction and alternate with another type of sideways pattern in the second wave position. The idea of alternation within impulses can be summarized by saying that one of the two corrective processes will contain a move back to or beyond the end of the preceding impulse, and the other will not.
Figure 2-1
Diagonal triangles do not display alternation between subwaves 2 and 4. Typically they are both zigzags. Extensions are an expression of alternation, as the motive waves alternate their lengths. Typically the first is short, the third is extended, and the fifth is short again. Extensions, which normally occur in wave 3, sometimes occur in wave 1 or 5, another manifestation of alternation.
Alternation Within Corrective Waves
If a large correction begins with a flat a-b-c construction for wave A, expect a zigzag a-b-c formation for wave B (see Figure 2-2), and vice versa (see Figure 2-3). With a moment's thought, it is obvious that this occurrence is sensible, since the first illustration reflects an upward bias in both subwaves while the second reflects a downward bias.
Figure 2-2
33
Figure 2-3
Quite often, if a large correction begins with a simple a-b-c zigzag for wave A, wave B will stretch out into a more intricately subdivided a-b-c zigzag to achieve a type of alternation, as in Figure 2-4. Sometimes wave C will be yet more complex, as in Figure 2-5. The reverse order of complexity is somewhat less common.