26
Lesson 3- 2 Polynomial Inequalities in One Variable http://www.mathsisfun.com/algebra/inequality-quadratic-solving.htm
| Date post: | 26-Dec-2015 |
| Category: |
Documents |
| Upload: | darrell-bailey |
| View: | 223 times |
| Download: | 0 times |

Lesson 3-2
Polynomial Inequalities in One Variable
http://www.mathsisfun.com/algebra/inequality-quadratic-solving.html

Objective:Objective:
Objective:Objective:
To solve and graph polynomial To solve and graph polynomial inequalities in one variable.inequalities in one variable.

Polynomial Inequalities:

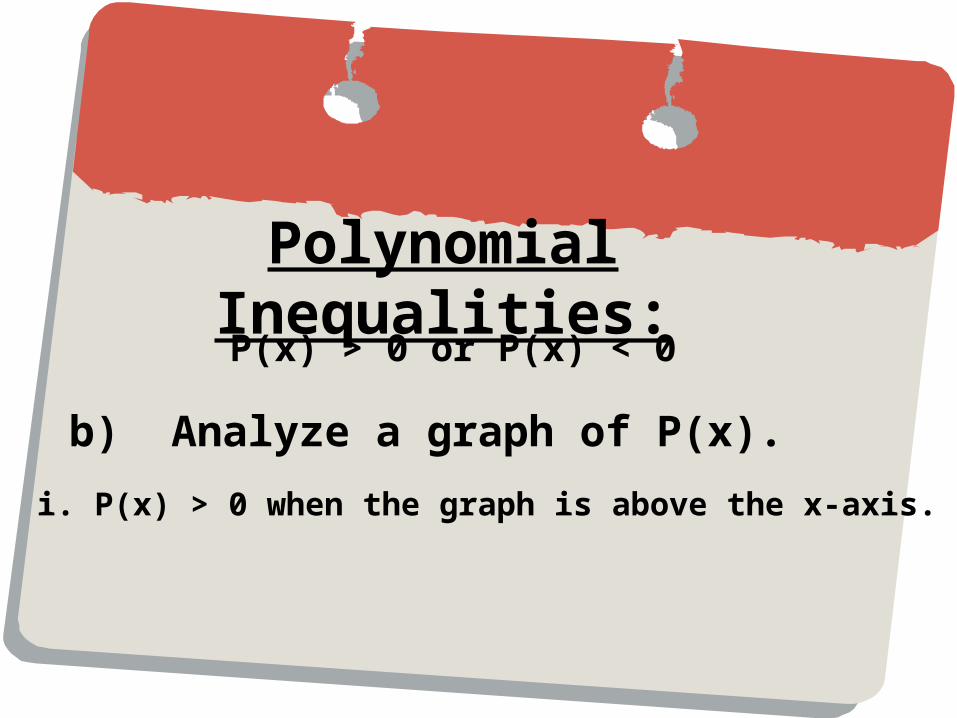
Polynomial Inequalities:P(x) > 0 or P(x) < 0

Polynomial Inequalities:P(x) > 0 or P(x) < 0
a) Use a sign graph of P(x).

Polynomial Inequalities:P(x) > 0 or P(x) < 0
b) Analyze a graph of P(x).
Polynomial Inequalities:P(x) > 0 or P(x) < 0
b) Analyze a graph of P(x).
i. P(x) > 0 when the graph is above the x-axis.

Polynomial Inequalities:P(x) > 0 or P(x) < 0
b) Analyze a graph of P(x).
i. P(x) > 0 when the graph is above the x-axis.
ii. P(x) < 0 when the graph is below the x-axis.

Example:Example:

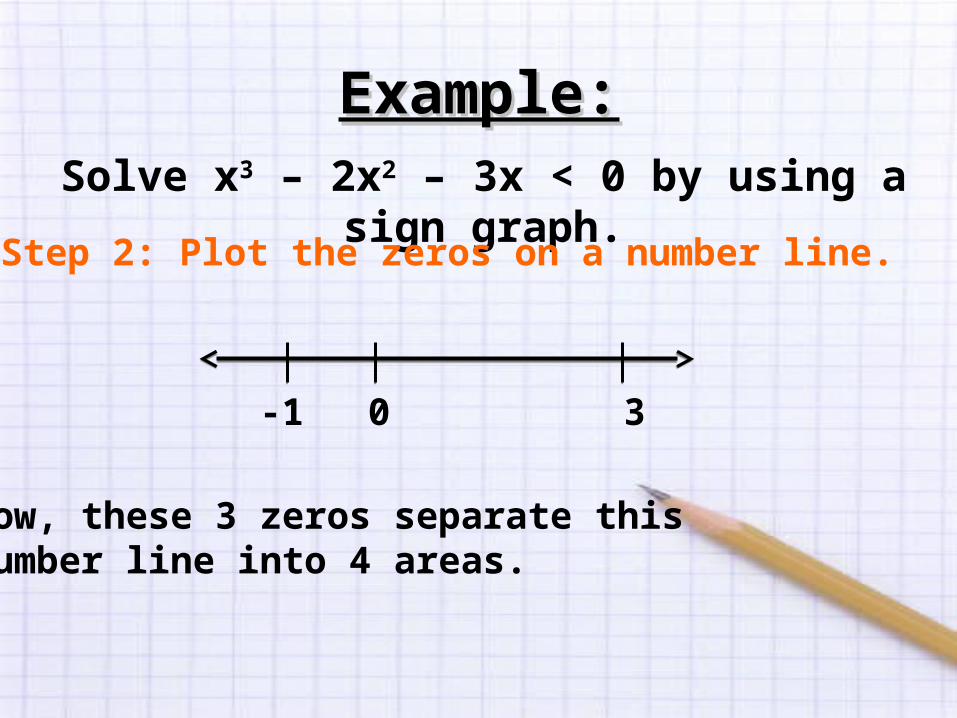
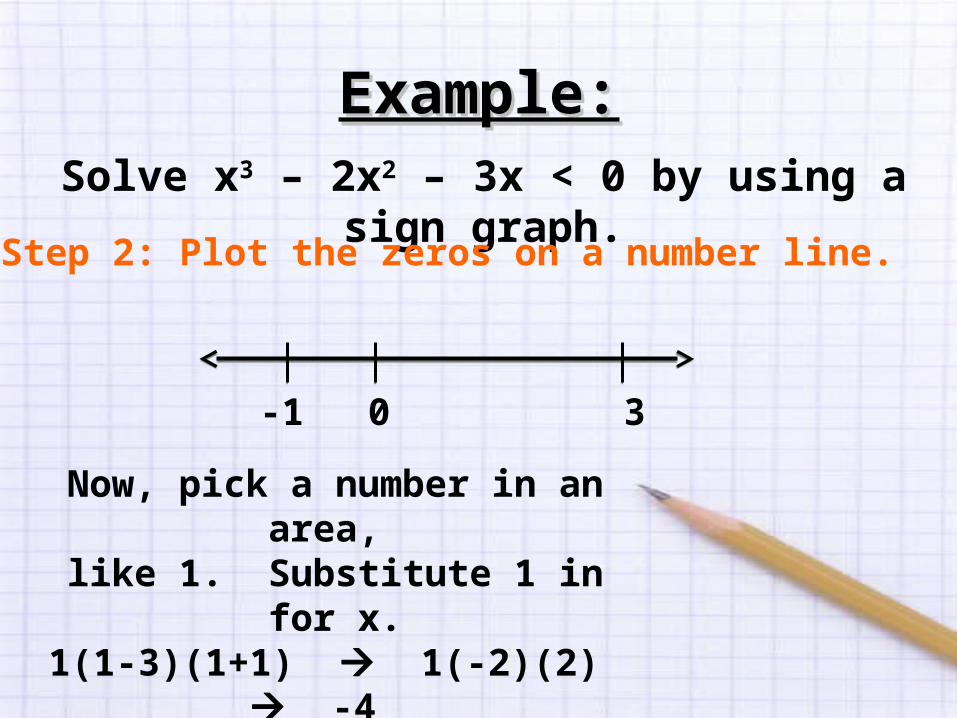
Example:Example:Solve x3 – 2x2 – 3x < 0 by using a sign graph.

Example:Example:Solve x3 – 2x2 – 3x < 0 by using a sign graph.
Step 1: Find the zeros of the polynomial.

Example:Example:Solve x3 – 2x2 – 3x < 0 by using a sign graph.
Step 1: Find the zeros of the polynomial.
P(x) = x3 – 2x2 – 3xP(x) = x(x2 – 2x – 3)P(x) = x(x – 3)(x + 1)Zeros: x = 0, x = 3, x = - 1

Example:Example:Solve x3 – 2x2 – 3x < 0 by using a sign graph.
Step 2: Plot the zeros on a number line.

Example:Example:Solve x3 – 2x2 – 3x < 0 by using a sign graph.
Step 2: Plot the zeros on a number line.
0 3-1
Example:Example:Solve x3 – 2x2 – 3x < 0 by using a sign graph.
Step 2: Plot the zeros on a number line.
0 3-1
Now, these 3 zeros separate this number line into 4 areas.

Example:Example:Solve x3 – 2x2 – 3x < 0 by using a sign graph.
Step 2: Plot the zeros on a number line.
0 3-1
All the values less than -1, all the values between -1 and 0, all the values between 0 and 3, and all the values greater than 3.

Example:Example:Solve x3 – 2x2 – 3x < 0 by using a sign graph.
Step 2: Plot the zeros on a number line.
0 3-1
Now, pick a number in an area, like 1. Substitute 1 in for x.
1(1-3)(1+1) 1(-2)(2) -4
Example:Example:Solve x3 – 2x2 – 3x < 0 by using a sign graph.
Step 2: Plot the zeros on a number line.
0 3-1
Now, pick a number in an area, like 1. Substitute 1 in for x.
1(1-3)(1+1) 1(-2)(2) -4

Example:Example:Solve x3 – 2x2 – 3x < 0 by using a sign graph.
Step 2: Plot the zeros on a number line.
0 3-1
So, that means when x = 1, P(x), which is y, is negative.

Example:Example:Solve x3 – 2x2 – 3x < 0 by using a sign graph.
Step 2: Plot the zeros on a number line.
0 3-1
Now, using our rule for roots we discovered a chapter ago, the
graph of P(x) will change signs after it goes through each root, since they are all single roots.
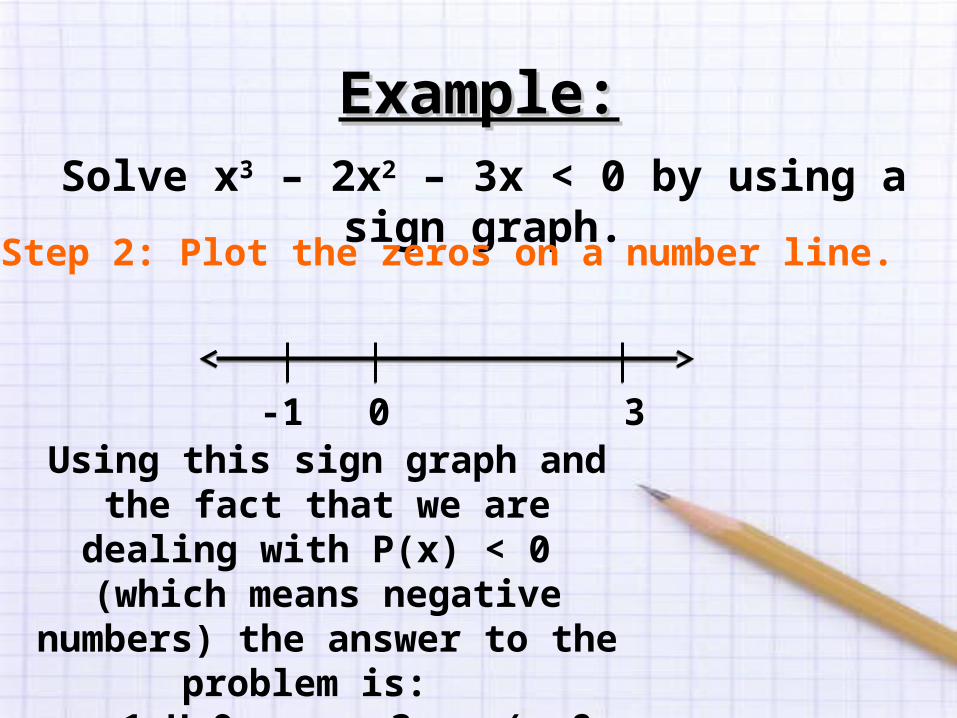
Example:Example:Solve x3 – 2x2 – 3x < 0 by using a sign graph.
Step 2: Plot the zeros on a number line.
0 3-1Using this sign graph and the fact that we are dealing with P(x) < 0 (which means negative numbers)
the answer to the problem is: x< -1 U 0 < x < 3 or (- 8, -1) U (0,3)
Example:Example:Solve (x2 – 1)(x – 4)2 > 0.
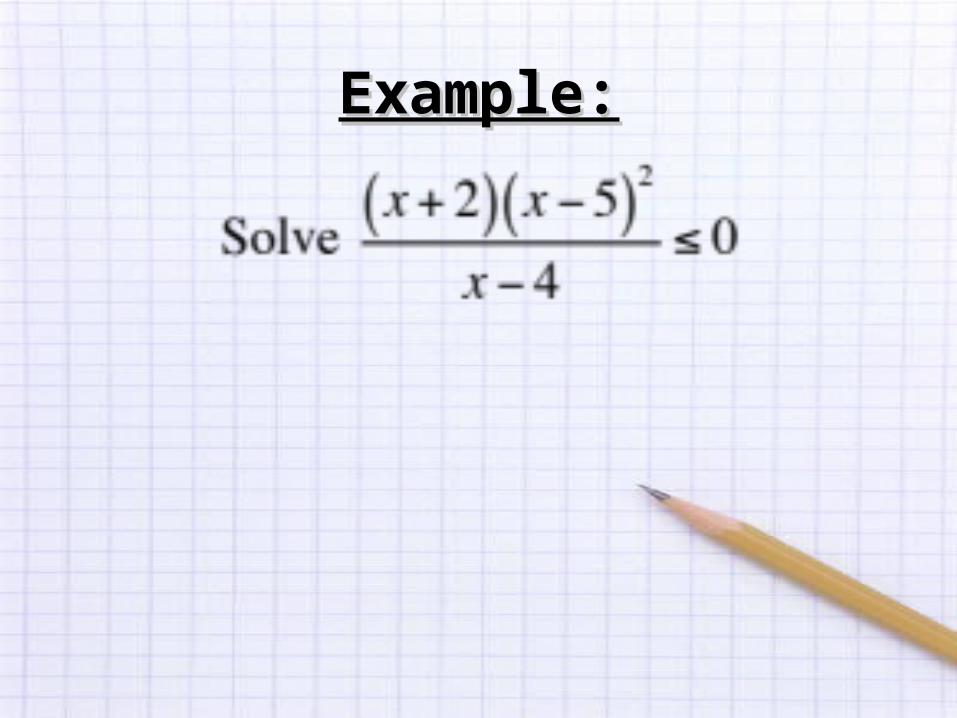
Example:Example:

Example:Example:

Assignment:Assignment:
Pg. 103C.E. 1-6 all
W.E. 1-19 odd


