Lesson FA-20-170-03G-Workbook.doc Copyright 2014 by Rocky Spears Enterprises LLC, All Rights Reserved Page 1 of 35 videos for this lesson are available at evideolearner.com Revised: 2014-04-01 - - - - - - Cover Page - - - - - - Lesson FA-20-170-xx Capital Budgeting Part 3G These notes and worksheets accompany the corresponding video lesson available online at: Permission is granted for educators and students to make copies and redistribute this document without fee provided the copyright notice and page footer is retained.
Transcript
Lesson FA-20-170-03G-Workbook.doc
Copyright 2014 by Rocky Spears Enterprises LLC, All Rights Reserved Page 1 of 35 videos for this lesson are available at evideolearner.com Revised: 2014-04-01
- - - - - - Cover Page - - - - - -
Lesson FA-20-170-xx
Capital Budgeting
Part 3G
These notes and worksheets
accompany the corresponding video lesson
available online at:
Permission is granted for educators and students to
make copies and redistribute this document without fee
provided the copyright notice and page footer is retained.
Lesson FA-20-170-03G-Workbook.doc
Copyright 2014 by Rocky Spears Enterprises LLC, All Rights Reserved Page 2 of 35 videos for this lesson are available at evideolearner.com Revised: 2014-04-01
Capital Budgeting - Part 3G
[Clip 31a] Problem 7 – Equal Cash Flows with Ranking of Mutually Exclusive
Projects - Payback period – undiscounted cash flow
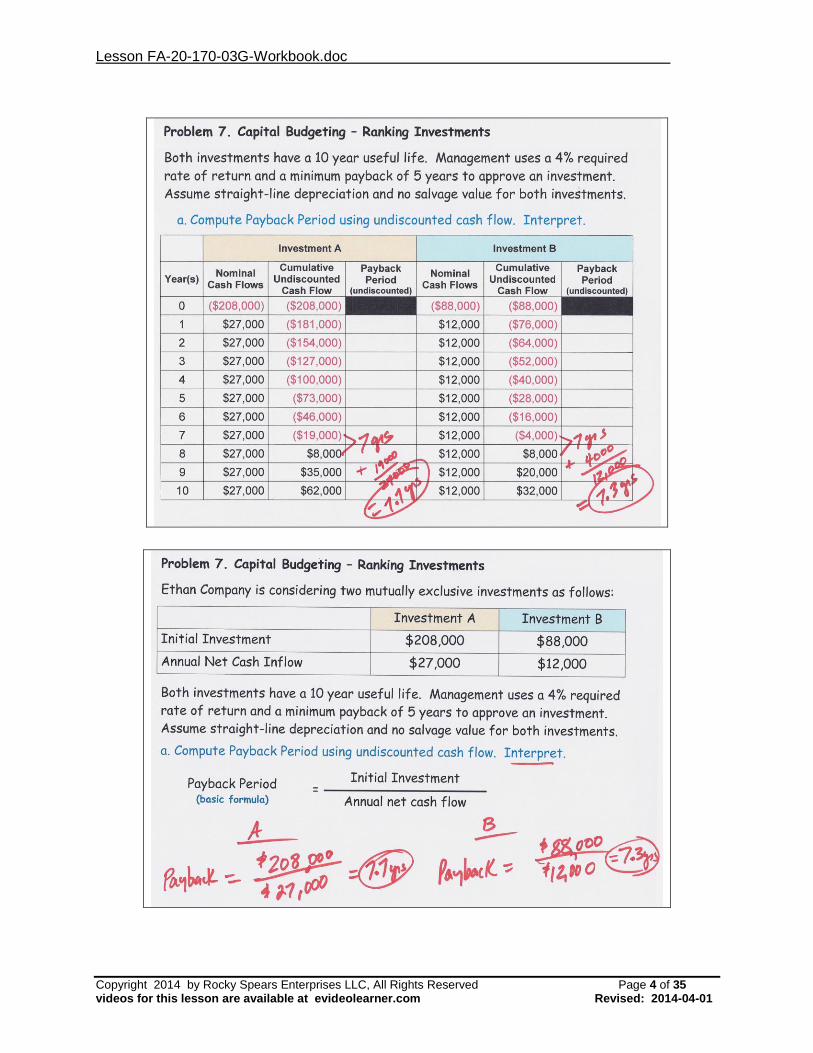
Problem 7. Capital Budgeting – Ranking Investments
Ethan Company is considering two mutually exclusive investments as follows:
Investment A Investment B
Initial Investment $208,000 $88,000
Annual Net Cash Inflow $27,000 $12,000
Both investments have a 10 year useful life. Management uses a 4% required rate
of return and a minimum payback of 5 years to approve an investment. Assume
straight-line depreciation and no salvage value for both investments.
a. Compute Payback Period using undiscounted cash flow. Interpret.
Payback Period (basic formula)
= Initial Investment
Annual net cash flow
Lesson FA-20-170-03G-Workbook.doc
Copyright 2014 by Rocky Spears Enterprises LLC, All Rights Reserved Page 3 of 35 videos for this lesson are available at evideolearner.com Revised: 2014-04-01
Problem 7. Capital Budgeting – Ranking Investments
Both investments have a 10 year useful life. Management uses a 4% required rate
of return and a minimum payback of 5 years to approve an investment. Assume
straight-line depreciation and no salvage value for both investments.
a. Compute Payback Period using undiscounted cash flow. Interpret.
Investment A Investment B
Year(s)
Nominal Cash Flows
Cumulative Undiscounted
Cash Flow
Payback Period
(undiscounted)
Nominal Cash Flows
Cumulative Undiscounted
Cash Flow
Payback Period
(undiscounted)
0
1
2
3
4
5
6
7
8
9
10
Lesson FA-20-170-03G-Workbook.doc
Copyright 2014 by Rocky Spears Enterprises LLC, All Rights Reserved Page 4 of 35 videos for this lesson are available at evideolearner.com Revised: 2014-04-01
Lesson FA-20-170-03G-Workbook.doc
Copyright 2014 by Rocky Spears Enterprises LLC, All Rights Reserved Page 5 of 35 videos for this lesson are available at evideolearner.com Revised: 2014-04-01
Problem 7. Capital Budgeting – Ranking Investments
Both investments have a 10 year useful life. Management uses a 4% required rate
of return and a minimum payback of 5 years to approve an investment. Assume
straight-line depreciation and no salvage value for both investments.
a. Compute Payback Period using undiscounted cash flow. Interpret.
Copyright 2014 by Rocky Spears Enterprises LLC, All Rights Reserved Page 6 of 35 videos for this lesson are available at evideolearner.com Revised: 2014-04-01
[Clip 31b] Problem 7 – Equal Cash Flows with Ranking of Mutually Exclusive
Projects - Payback period – discounted cash flow
Problem 7. Capital Budgeting – Ranking Investments
Ethan Company is considering two mutually exclusive investments as follows:
Investment A Investment B
Initial Investment $208,000 $88,000
Annual Net Cash Inflow $27,000 $12,000
Both investments have a 10 year useful life. Management uses a 4% required rate
of return and a minimum payback of 5 years to approve an investment. Assume
straight-line depreciation and no salvage value for both investments.
b. Compute Payback Period using discounted cash flow. Interpret.
Lesson FA-20-170-03G-Workbook.doc
Copyright 2014 by Rocky Spears Enterprises LLC, All Rights Reserved Page 7 of 35 videos for this lesson are available at evideolearner.com Revised: 2014-04-01
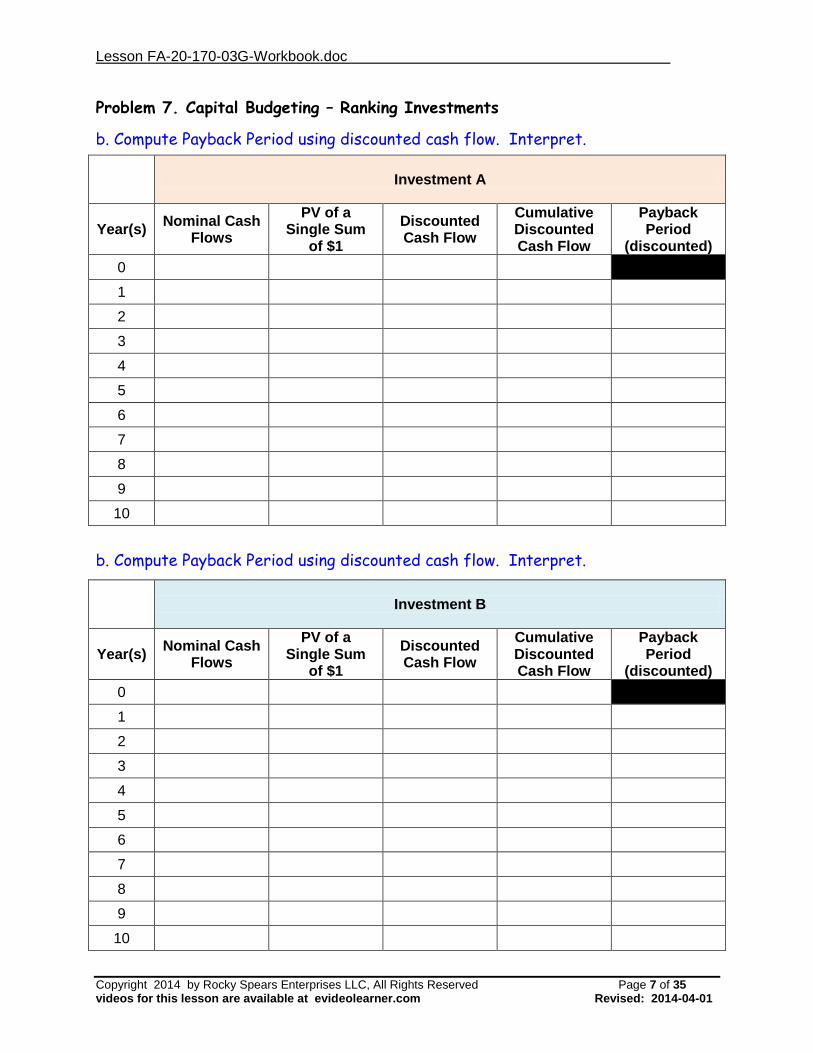
Problem 7. Capital Budgeting – Ranking Investments
b. Compute Payback Period using discounted cash flow. Interpret.
Investment A
Year(s) Nominal Cash
Flows
PV of a Single Sum
of $1
Discounted Cash Flow
Cumulative Discounted Cash Flow
Payback Period
(discounted)
0
1
2
3
4
5
6
7
8
9
10
b. Compute Payback Period using discounted cash flow. Interpret.
Investment B
Year(s) Nominal Cash
Flows
PV of a Single Sum
of $1
Discounted Cash Flow
Cumulative Discounted Cash Flow
Payback Period
(discounted)
0
1
2
3
4
5
6
7
8
9
10
Lesson FA-20-170-03G-Workbook.doc
Copyright 2014 by Rocky Spears Enterprises LLC, All Rights Reserved Page 8 of 35 videos for this lesson are available at evideolearner.com Revised: 2014-04-01
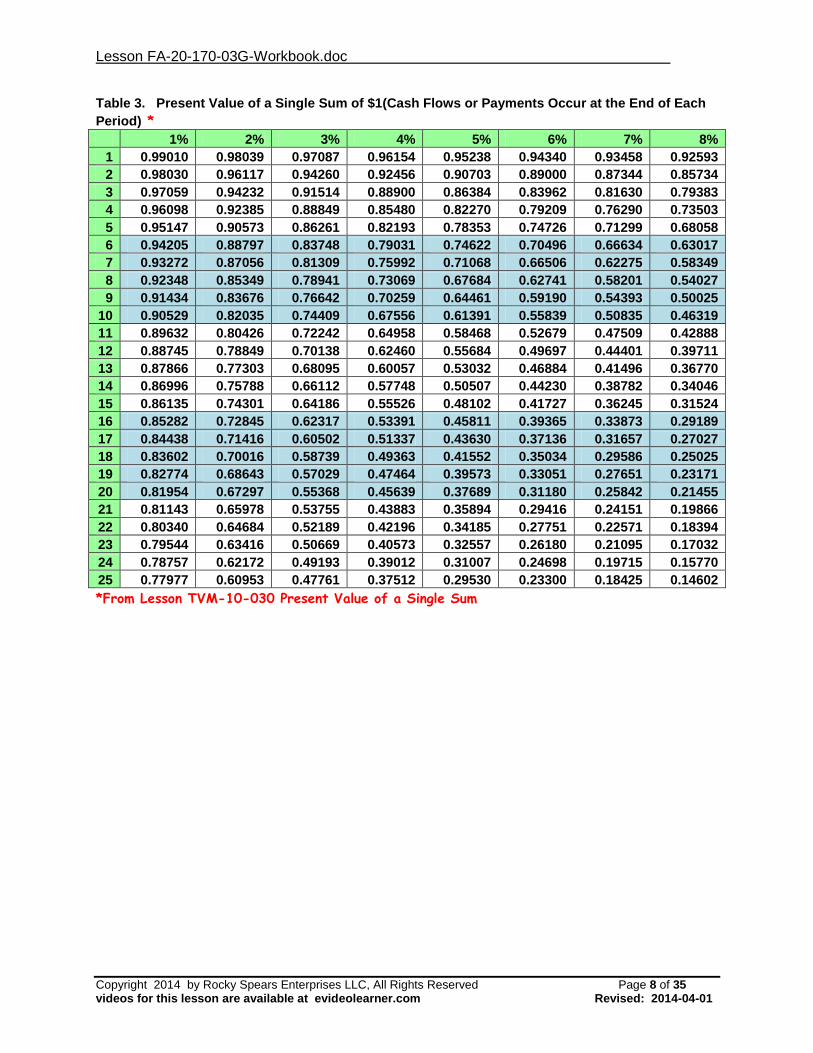
Table 3. Present Value of a Single Sum of $1(Cash Flows or Payments Occur at the End of Each
*From Lesson TVM-10-030 Present Value of a Single Sum
Lesson FA-20-170-03G-Workbook.doc
Copyright 2014 by Rocky Spears Enterprises LLC, All Rights Reserved Page 9 of 35 videos for this lesson are available at evideolearner.com Revised: 2014-04-01
Lesson FA-20-170-03G-Workbook.doc
Copyright 2014 by Rocky Spears Enterprises LLC, All Rights Reserved Page 10 of 35 videos for this lesson are available at evideolearner.com Revised: 2014-04-01
Lesson FA-20-170-03G-Workbook.doc
Copyright 2014 by Rocky Spears Enterprises LLC, All Rights Reserved Page 11 of 35 videos for this lesson are available at evideolearner.com Revised: 2014-04-01
Lesson FA-20-170-03G-Workbook.doc
Copyright 2014 by Rocky Spears Enterprises LLC, All Rights Reserved Page 12 of 35 videos for this lesson are available at evideolearner.com Revised: 2014-04-01
[Clip 31c] Problem 7 – Equal Cash Flows with Ranking of Mutually Exclusive
Projects - Net Present Value and Profitability Index
Problem 7. Capital Budgeting – Ranking Investments
Ethan Company is considering two mutually exclusive investments as follows:
Investment A Investment B
Initial Investment $208,000 $88,000
Annual Net Cash Inflow $27,000 $12,000
Both investments have a 10 year useful life. Management uses a 4% required rate
of return and a minimum payback of 5 years to approve an investment. Assume
straight-line depreciation and no salvage value for both investments.
c. Compute Net Present Value and Profitability Index. Interpret.
NPV = PV of future cash flows - Initial Investment
PI = PV of future cash flows
Initial Investment
Lesson FA-20-170-03G-Workbook.doc
Copyright 2014 by Rocky Spears Enterprises LLC, All Rights Reserved Page 13 of 35 videos for this lesson are available at evideolearner.com Revised: 2014-04-01
Problem 7. Capital Budgeting – Ranking Investments
Ethan Company is considering two mutually exclusive investments as follows:
Investment A Investment B
Initial Investment $208,000 $88,000
Annual Net Cash Inflow $27,000 $12,000
Both investments have a 10 year useful life. Management uses a 4% required rate
of return and a minimum payback of 5 years to approve an investment. Assume
straight-line depreciation and no salvage value for both investments.
c. Compute Net Present Value and Profitability Index. Interpret.
Investment A
r = 4%
0 1 2 3 … … 10
($208,000) $27,000
Investment B
r = 4%
0 1 2 3 … … 10
($88,000) $12,000
Lesson FA-20-170-03G-Workbook.doc
Copyright 2014 by Rocky Spears Enterprises LLC, All Rights Reserved Page 14 of 35 videos for this lesson are available at evideolearner.com Revised: 2014-04-01
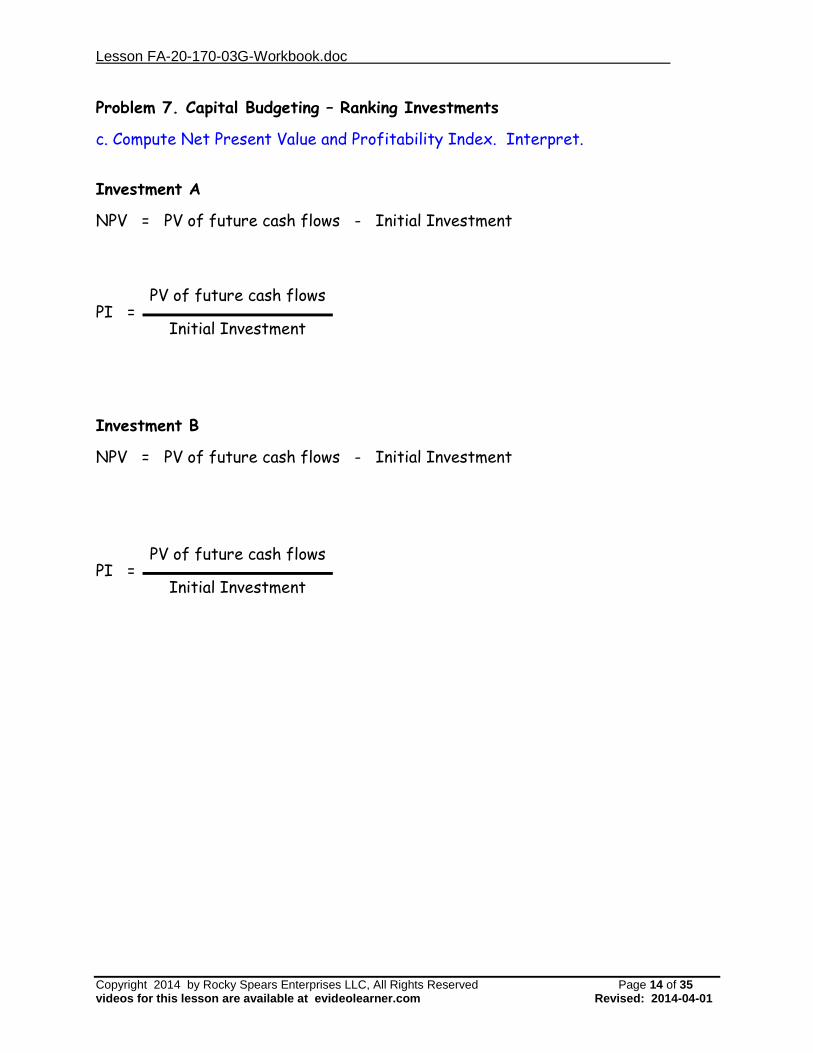
Problem 7. Capital Budgeting – Ranking Investments
c. Compute Net Present Value and Profitability Index. Interpret.
Investment A
NPV = PV of future cash flows - Initial Investment
PI = PV of future cash flows
Initial Investment
Investment B
NPV = PV of future cash flows - Initial Investment
PI = PV of future cash flows
Initial Investment
Lesson FA-20-170-03G-Workbook.doc
Copyright 2014 by Rocky Spears Enterprises LLC, All Rights Reserved Page 15 of 35 videos for this lesson are available at evideolearner.com Revised: 2014-04-01
Table 4. Present Value of an Ordinary Annuity of $1 (Cash Flows or Payments Occur at the End of
*From Lesson TVM-10-040 Present Value of Ordinary Annuity
Lesson FA-20-170-03G-Workbook.doc
Copyright 2014 by Rocky Spears Enterprises LLC, All Rights Reserved Page 16 of 35 videos for this lesson are available at evideolearner.com Revised: 2014-04-01
Lesson FA-20-170-03G-Workbook.doc
Copyright 2014 by Rocky Spears Enterprises LLC, All Rights Reserved Page 17 of 35 videos for this lesson are available at evideolearner.com Revised: 2014-04-01
Lesson FA-20-170-03G-Workbook.doc
Copyright 2014 by Rocky Spears Enterprises LLC, All Rights Reserved Page 18 of 35 videos for this lesson are available at evideolearner.com Revised: 2014-04-01
Problem 7. Capital Budgeting – Ranking Investments
c. Compute Net Present Value and Profitability Index. Interpret.
Investment A
r = 4%
0 1 2 3 … … 10
($208,000) $27,000
Investment B
r = 4%
0 1 2 3 … … 10
($88,000) $12,000
Lesson FA-20-170-03G-Workbook.doc
Copyright 2014 by Rocky Spears Enterprises LLC, All Rights Reserved Page 19 of 35 videos for this lesson are available at evideolearner.com Revised: 2014-04-01
Problem 7. Capital Budgeting – Ranking Investments
c. Compute Net Present Value and Profitability Index. Interpret.
Using the Texas Instruments BA II Financial Calculator
Copyright 2014 by Rocky Spears Enterprises LLC, All Rights Reserved Page 20 of 35 videos for this lesson are available at evideolearner.com Revised: 2014-04-01
[Clip 31d] Problem 7 – Equal Cash Flows with Ranking of Mutually Exclusive
Projects - Internal Rate of Return
Problem 7. Capital Budgeting – Ranking Investments
Ethan Company is considering two mutually exclusive investments as follows:
Investment A Investment B
Initial Investment $208,000 $88,000
Annual Net Cash Inflow $27,000 $12,000
Both investments have a 10 year useful life. Management uses a 4% required rate
of return and a minimum payback of 5 years to approve an investment. Assume
straight-line depreciation and no salvage value for both investments.
d. Determine the Internal Rate of Return. Interpret.
Investment A
r = 4%
0 1 2 3 … … 10
($208,000) $27,000
Investment B
r = 4%
0 1 2 3 … … 10
($88,000) $12,000
Lesson FA-20-170-03G-Workbook.doc
Copyright 2014 by Rocky Spears Enterprises LLC, All Rights Reserved Page 21 of 35 videos for this lesson are available at evideolearner.com Revised: 2014-04-01
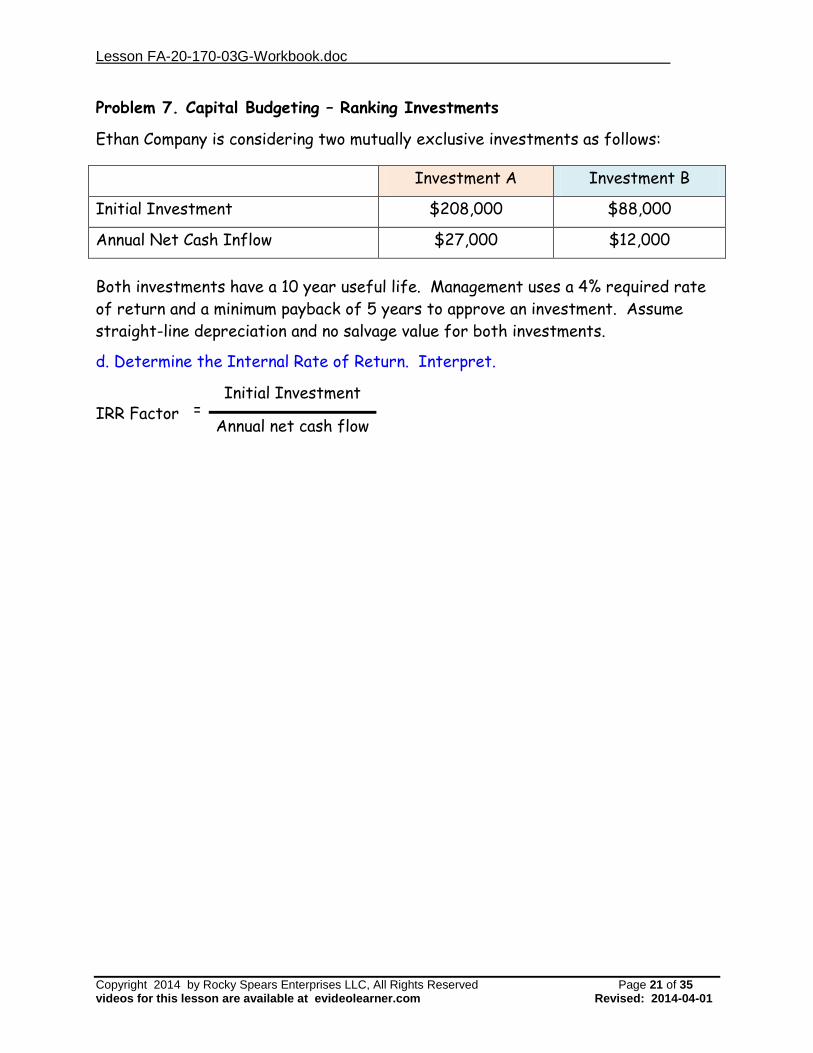
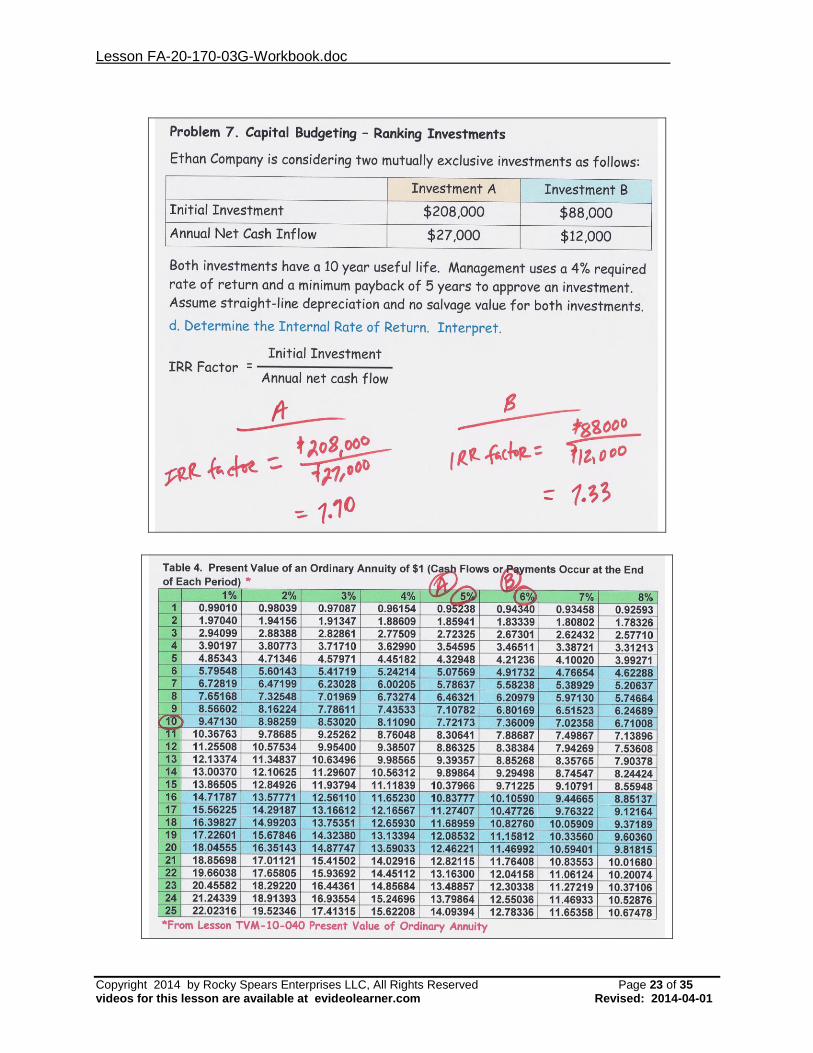
Problem 7. Capital Budgeting – Ranking Investments
Ethan Company is considering two mutually exclusive investments as follows:
Investment A Investment B
Initial Investment $208,000 $88,000
Annual Net Cash Inflow $27,000 $12,000
Both investments have a 10 year useful life. Management uses a 4% required rate
of return and a minimum payback of 5 years to approve an investment. Assume
straight-line depreciation and no salvage value for both investments.
d. Determine the Internal Rate of Return. Interpret.
IRR Factor = Initial Investment
Annual net cash flow
Lesson FA-20-170-03G-Workbook.doc
Copyright 2014 by Rocky Spears Enterprises LLC, All Rights Reserved Page 22 of 35 videos for this lesson are available at evideolearner.com Revised: 2014-04-01
Table 4. Present Value of an Ordinary Annuity of $1 (Cash Flows or Payments Occur at the End of
*From Lesson TVM-10-040 Present Value of Ordinary Annuity
Lesson FA-20-170-03G-Workbook.doc
Copyright 2014 by Rocky Spears Enterprises LLC, All Rights Reserved Page 23 of 35 videos for this lesson are available at evideolearner.com Revised: 2014-04-01
Lesson FA-20-170-03G-Workbook.doc
Copyright 2014 by Rocky Spears Enterprises LLC, All Rights Reserved Page 24 of 35 videos for this lesson are available at evideolearner.com Revised: 2014-04-01
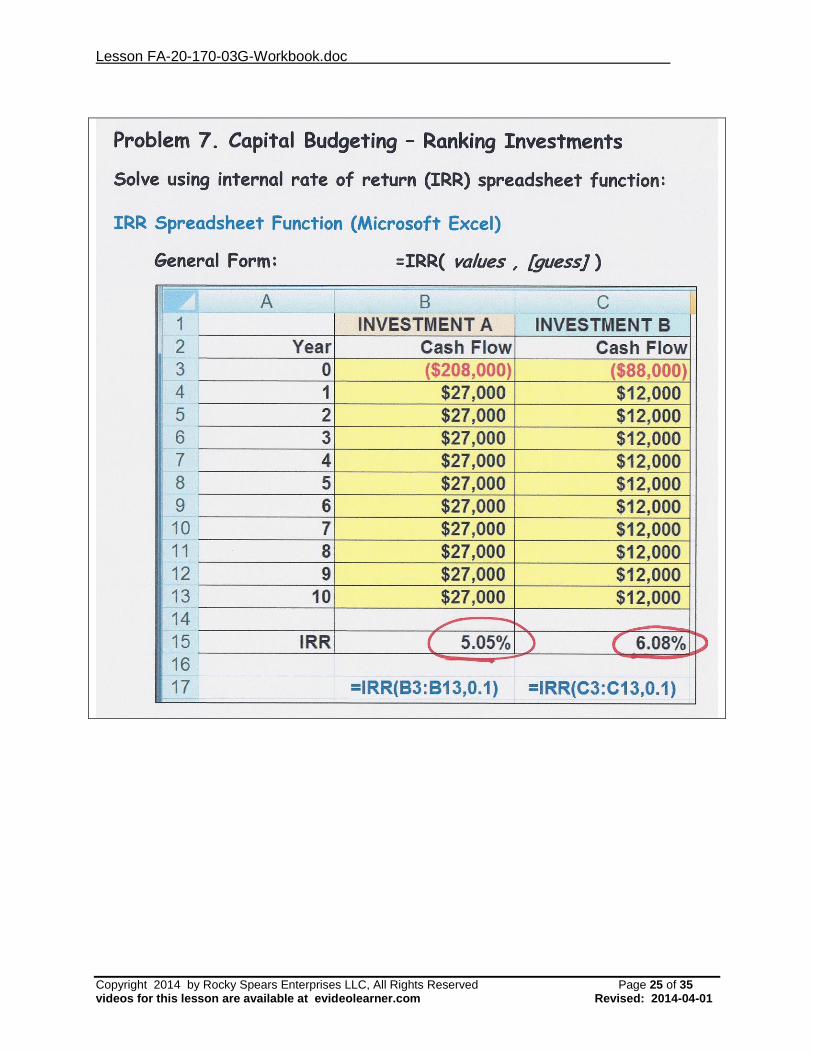
Problem 7. Capital Budgeting – Ranking Investments
Solve using internal rate of return (IRR) spreadsheet function:
IRR Spreadsheet Function (Microsoft Excel)
General Form: =IRR( values , [guess] )
Lesson FA-20-170-03G-Workbook.doc
Copyright 2014 by Rocky Spears Enterprises LLC, All Rights Reserved Page 25 of 35 videos for this lesson are available at evideolearner.com Revised: 2014-04-01
Lesson FA-20-170-03G-Workbook.doc
Copyright 2014 by Rocky Spears Enterprises LLC, All Rights Reserved Page 26 of 35 videos for this lesson are available at evideolearner.com Revised: 2014-04-01
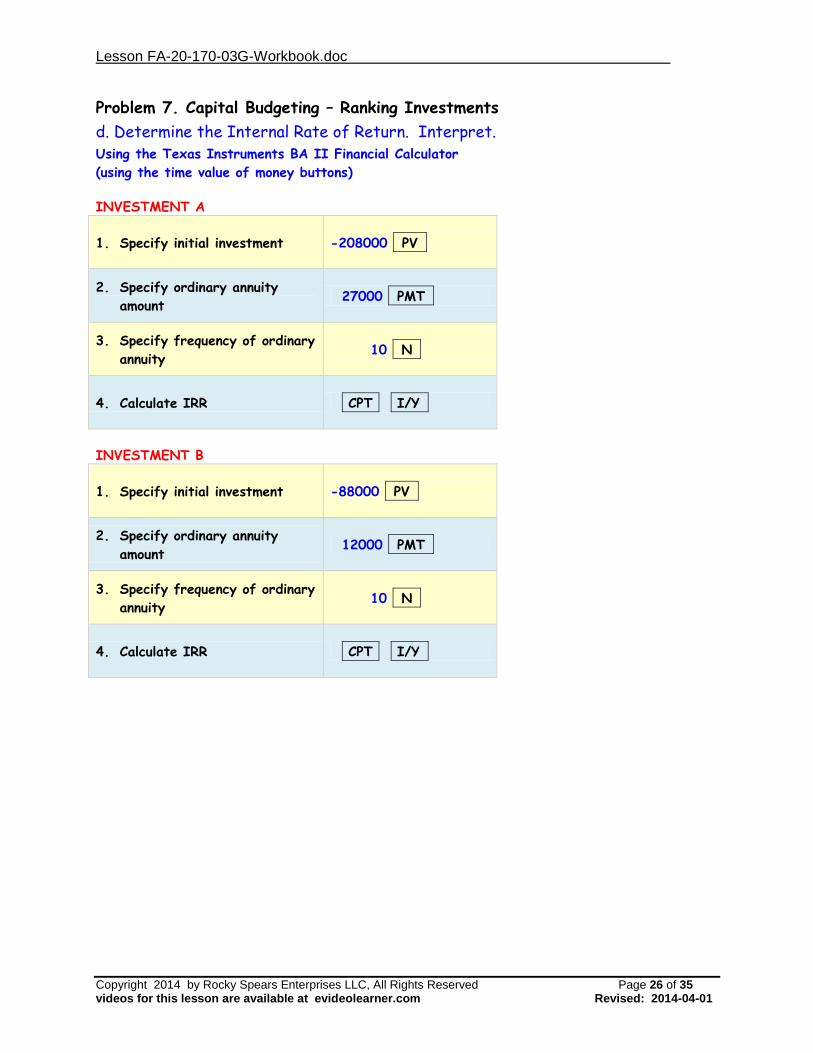
Problem 7. Capital Budgeting – Ranking Investments
d. Determine the Internal Rate of Return. Interpret.
Using the Texas Instruments BA II Financial Calculator
(using the time value of money buttons)
INVESTMENT A
1. Specify initial investment -208000 -PV-
2. Specify ordinary annuity
amount 27000 -PMT-
3. Specify frequency of ordinary
annuity 10 -N-
4. Calculate IRR CPT I/Y-
INVESTMENT B
1. Specify initial investment -88000 -PV-
2. Specify ordinary annuity
amount 12000 -PMT-
3. Specify frequency of ordinary
annuity 10 -N-
4. Calculate IRR CPT I/Y-
Lesson FA-20-170-03G-Workbook.doc
Copyright 2014 by Rocky Spears Enterprises LLC, All Rights Reserved Page 27 of 35 videos for this lesson are available at evideolearner.com Revised: 2014-04-01
Problem 7. Capital Budgeting – Ranking Investments
d. Determine the Internal Rate of Return. Interpret.
Using the Texas Instruments BA II Financial Calculator
Copyright 2014 by Rocky Spears Enterprises LLC, All Rights Reserved Page 28 of 35 videos for this lesson are available at evideolearner.com Revised: 2014-04-01
[Clip 31e] Problem 7 – Equal Cash Flows with Ranking of Mutually Exclusive
Projects - Accounting Rate of Return (ROI)
Problem 7. Capital Budgeting – Ranking Investments
Ethan Company is considering two mutually exclusive investments as follows:
Investment A Investment B
Initial Investment $208,000 $88,000
Annual Net Cash Inflow $27,000 $12,000
Both investments have a 10 year useful life. Management uses a 4% required rate
of return and a minimum payback of 5 years to approve an investment. Assume
straight-line depreciation and no salvage value for both investments.
e. Compute the Accounting Rate of Return. Interpret.
Accounting Rate of Return (ARR)
or Return on Investment (ROI) =
Average Net Income
Average Investment
where:
Average Net Income = Sum of Net Income Over All Investment Years
Estimated Life of Investment
Average Investment
=
Initial Investment + Salvage Value
2
Straight-Line Depreciation = Initial Investment – Salvage value
Useful Life
Net Income/Year = Operating Cash Flow/Year - Depreciation/Year
Lesson FA-20-170-03G-Workbook.doc
Copyright 2014 by Rocky Spears Enterprises LLC, All Rights Reserved Page 29 of 35 videos for this lesson are available at evideolearner.com Revised: 2014-04-01
Problem 7. Capital Budgeting – Ranking Investments
e. Compute the Accounting Rate of Return. Interpret. SOLUTION
Investment A Investment B
Initial Investment $208,000 $88,000
Annual Net Cash Inflow $27,000 $12,000
Straight-Line Depreciation $20,800 $8,800
Net Income/Year $6,200 $3,200
Average Net Income $6,200 $3,200
Average Investment $104,000 $44,000
Accounting Rate of Return 5.96% 7.27%
Straight-Line Depreciation = Initial Investment – Salvage value
Useful Life
Net Income/Year = Operating Cash Flow/Year - Depreciation/Year
Average Net Income = Sum of Net Income Over All Investment Years
Estimated Life of Investment
Average Investment = Initial Investment + Salvage Value
2
Accounting Rate of Return (ARR)
or Return on Investment (ROI) =
Average Net Income
Average Investment
Lesson FA-20-170-03G-Workbook.doc
Copyright 2014 by Rocky Spears Enterprises LLC, All Rights Reserved Page 30 of 35 videos for this lesson are available at evideolearner.com Revised: 2014-04-01
Lesson FA-20-170-03G-Workbook.doc
Copyright 2014 by Rocky Spears Enterprises LLC, All Rights Reserved Page 31 of 35 videos for this lesson are available at evideolearner.com Revised: 2014-04-01
Lesson FA-20-170-03G-Workbook.doc
Copyright 2014 by Rocky Spears Enterprises LLC, All Rights Reserved Page 32 of 35 videos for this lesson are available at evideolearner.com Revised: 2014-04-01
[Clip 31f] Problem 7 – Equal Cash Flows with Ranking of Mutually Exclusive
Projects - Summary Analysis
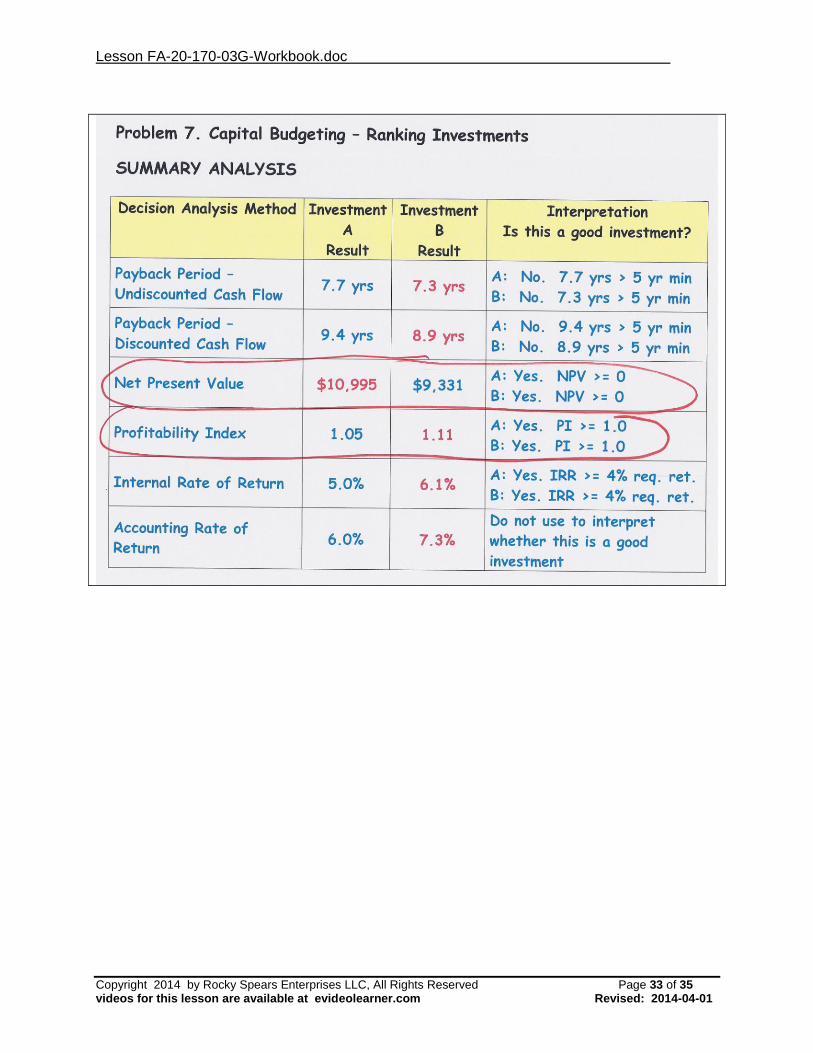
Problem 7. Capital Budgeting – Ranking Investments
SUMMARY ANALYSIS
Decision Analysis
Method
Investment
A
Result
Investment
B
Result
Interpretation
Is this a good investment?
Payback Period –
Undiscounted Cash Flow 7.7 yrs 7.3 yrs
A: No. 7.7 yrs > 5 yr min
B: No. 7.3 yrs > 5 yr min
Payback Period –
Discounted Cash Flow 9.4 yrs 8.9 yrs
A: No. 9.4 yrs > 5 yr min
B: No. 8.9 yrs > 5 yr min
Net Present Value $10,995 $9,331 A: Yes. NPV >= 0
B: Yes. NPV >= 0
Profitability Index 1.05 1.11 A: Yes. PI >= 1.0
B: Yes. PI >= 1.0
Internal Rate of Return 5.0% 6.1%
A: Yes. IRR >= 4% req.
ret.
B: Yes. IRR >= 4% req.
ret.
Accounting Rate of
Return 6.0% 7.3%
Do not use to interpret
whether this is a good
investment
Lesson FA-20-170-03G-Workbook.doc
Copyright 2014 by Rocky Spears Enterprises LLC, All Rights Reserved Page 33 of 35 videos for this lesson are available at evideolearner.com Revised: 2014-04-01
Lesson FA-20-170-03G-Workbook.doc
Copyright 2014 by Rocky Spears Enterprises LLC, All Rights Reserved Page 34 of 35 videos for this lesson are available at evideolearner.com Revised: 2014-04-01
Problem 7. Capital Budgeting – Ranking Investments
SUMMARY ANALYSIS – Which Investment Should be Chosen?
Decision Analysis
Method
Investment
A
Result
Investment
B
Result
Interpretation
Which is better?
Payback Period –
Undiscounted Cash Flow 7.7 yrs 7.3 yrs
B is Better. Faster
payback.
Payback Period –
Discounted Cash Flow 9.4 yrs 8.9 yrs
B is Better. Faster
payback.
Net Present Value $10,995 $9,331 A is Better. Higher NPV
Profitability Index 1.05 1.11 B is Better. Higher PI
Internal Rate of Return 5.0% 6.1% B is Better. Higher IRR
Accounting Rate of
Return 6.0% 7.3% B is Better. Higher ARR
Lesson FA-20-170-03G-Workbook.doc
Copyright 2014 by Rocky Spears Enterprises LLC, All Rights Reserved Page 35 of 35 videos for this lesson are available at evideolearner.com Revised: 2014-04-01