24
e-Governance in Property Tax Lessons from Andhra Pradesh

e-Governance in Property Tax
Lessons from Andhra Pradesh

About The Authors
Aditya Batra is an Associate with the Policy Initiatives team at eGov Foundation and has a deep interest in the intersection of technology and public policy challenges. He actively works with eGov's civil society and non-profit ecosystem to build new partnerships and manage such co-partnered projects. Currently, he is focused on building a coalition of partners for expanding adoption of online municipal services across the digital divide. To bide his time, Aditya likes to watch and play sports, read and quiz. He is based out of New Delhi.
Ajit Kumar is an entrepreneur and product manager with a keen interest in social entrepreneurship and technology. He actively works with the government and citizens to understand and solve local problems. Currently, he is solving the product adoption of the online service offered by the urban local bodies in India. Apart from that, Ajit loves Volleyball, travelling and is an active reader of social and political issues.
Anuroop Bisaria is a data scientist with over five years of experience working with behavioral analytics and human systems. Previously having worked with consumer robotics, he is constantly working on new ways to integrate AI into day to day life. He is most known for his revolutionary techniques of image normalization to improve machine understanding of sign language. Anuroop enjoys chess and lives in Bengaluru, India. Anuroop worked with eGov Foundation from September 2019 to October 2020.
The authors would also like to acknowledge the contribution of Aniket Verma, who supported the writing team with his research and inputs.
About eGovernments Foundation
eGovernments Foundation is a non-profit, mission-driven organisation, founded in 2003, as a collective of world-class technologists, strategists, and policy professionals with an enduring commitment to solve India’s societal challenges. eGov catalyses an ecosystem to co-create and deploy locally-relevant solutions that enhance quality of life and ease of doing business in India’s towns and cities.

Contents
Introduction
Why is Property Tax Important for ULBs?
In Times of Covid-19
Research Methodology
Desk Research
Data Modeling
Data Analytics
Literature Review
Modelling Property Tax Revenue: Policy and Administration
Policy Reforms
Administrative Reforms
The Case of Andhra Pradesh
Data Modelling
Estimating Potential Property Tax Collection
Best Practices and Recommendations
From Literature Review
Lessons from Andhra Pradesh: Linking Efforts to the Data Model
Conclusion
1
2
3
4
4
4
4
5
6
7
7
10
11
13
15
15
19
20

Introduction
Property Tax (PT) is the principal source of revenue for local governments in many developed and developing countries. The interest in property tax reforms shown by many international donors and national governments is reflective of its importance in enabling effective and capable local administration. Despite many studies and attempts to reform it, the property tax system in India continues to function at low levels of effectiveness. India’s property tax-to-GDP ratio, at 0.48%, is one of the lowest amongst G-20 countries2.
In India, PT is levied on ownership of any tangible real estate within the municipal area by the Urban Local Body (ULB)3. This system faces both top-down and bottom-up challenges.
On the one hand, some states have reduced the authority of ULBs on PT-related matters; in any event, both local and state governments tend to implement only marginal and sporadic reforms (rather than rigorous, data-driven interventions) to improve their PT systems. On the other hand, low PT collections can be attributed to on-ground gaps such as low coverage, low tax rates, low collection efficiency, lack of indexation of property values (i.e. to actual market value, including poor enforcement of legal provisions around periodic increases), loss on account of exemptions, and challenges with enforcement.
The state of Andhra Pradesh is an exception to this trend. Between 2015 and 2019, Andhra Pradesh has increased its annual Property Tax collections by over 100%. This was achieved by introducing multiple measures to increase the tax base, consolidate billing, and standardize assessments, leading to a sustainable revenue stream being established over this 4-year period.
This whitepaper studies the efforts of the state governments in e-Governance and Property Taxes in India, The authors also present a data model for measuring the state’s performance various Policy and Administrative variables of Property Tax and make recommendations from lessons and best practices implemented in Andhra Pradesh.
3 Urban Local Bodies (ULBs) are institutions of the local self governance, which look after the administration of an area or small community such as towns or cities. There are 8 recognised types of ULBs in India, but for simplification and purpose of this paper, we’ll refer to the following three types - Municipal Corporation, Municipal Council and Nagar Panchayat.
- Tier I ULBs have populations above 10 lakh (1 million), and are usually designated municipal corporations. - Tier II ULBs have populations between 1 and 10 lakh, and are usually designated municipal councils (as a result of which these cities are sometimes known as “council towns”). - Tier III ULBs have populations below 1 lakh, and are usually designated Nagar Panchayats. The smallest Nagar Panchayats may have as few as 10,000 residents.
2 http://www.idfcinstitute.org/site/assets/files/15116/reforming_urban_india_idfc_institute.pdf
1

Why is Property Tax Important for ULBs?
According to the 2011 High-Powered Expert Committee’s (HPEC) Report, India’s urban population will expand from 377 million to 600 million by 20314 - i.e. about 40% of India’s population will live and work in cities and towns. Given the increasing concentration of economic activity in urban centers, the fiscal capacity and management of ULBs becomes an important component of India’s growth trajectory.
The 74th Constitutional Amendment Act (1992)5 provided recognition and protection to urban local self-governments in the country and each state was required to enact/amend their respective municipal acts. The Act also created the 12th Schedule of the Constitution6, which lists 18 functions - spanning urban planning, promotion of education, and provision of public amenities - to be devolved to these local governments.
Against these expenditures, there are sources of revenue (both tax and non-tax) that a ULB can access, which include Property Tax, Advertisement Tax, User Charges, and Lease Amounts. Across all categories of revenue sources, PT is the only major source of inflow that can be controlled by the ULB itself. This has been the case especially since Octroi (local customs and transit taxes), traditionally a major revenue source for local governments, has been abolished by most states. ULBs are otherwise dependent on grants from central and state governments for resources to manage their expenses
The 14th Finance Commission (XIVFC) introduced a performance-linked component to these grants, proposing that 20% of the grant amount be disbursed only after audited accounts are prepared and presented by the ULB. The 15th Finance Commission (XVFC) furthers this effort to encourage ULB performance: their report recommends that states notify floor rates for property tax, and then show improvement in collections consistent with the state's own GSDP growth rate, as a condition for ULBs to be eligible for any grants from 2021-22.
With India’s PT-to-GDP ratio at 0.48%, on average only 37% of the tax demanded is collected. Even in a major city like Mumbai, with relatively high administrative capacity, this figure remains as low as 55%7. Even a moderate increment to these numbers will be sufficient to support ULBs to expand developmental activities, and meet the performance conditions proposed by the XVFC.
4 https://icrier.org/pdf/FinalReport-hpec.pdf5 http://mohua.gov.in/upload/uploadfiles/files/74th_CAA13.pdf6 https://www.india.gov.in/sites/upload_files/npi/files/coi-eng-schedules_1-12.pdf7 https://www.nipfp.org.in/media/medialibrary/2013/04/wp06_nipfp_041.pdf
2

200
0.4
1.3
1.4
1.7
2.3
3.4
4.1
4.4
4.7
5.2
8.9
10.3
11.6
11.8
14.4
16.2
16.6
18.1
IndiaTurkeyMexico
JapanItaly
GermanyRussiaBrazil
South AfricaIndonesiaAustralia
ChinaArgentina
CanadaKorea
USFrance
UK
5 10 15
Property Tax Structure and Progressivity in 620 countries
Property Taxes Revenue as Percent of Total Taxes Revenues
Source - Centre for Budget and Governance Accountability (CBGA)
All levels of government are now facing financial stress, as revenue streams have shrunk amid the COVID-19 pandemic. The Union Government is struggling to fulfill its GST commitments to the states, a significant share of State income, which has led to tight control on liquidity management and enhanced reliance on other sources of income. ULBs should prepare for disruptions in grant revenues; given that property taxes are the primary source of ULB’s self-raised revenues (“own revenue”), reforms and best practices should take priority. This will also be the most direct way for ULBs to respond to the Prime Minister’s message of self-reliance, and raise resources to drive local economic recovery.
In Times of Covid-19
Currently, the central government has allowed states to bear an additional fiscal deficit of 2% of GSDP, by increasing borrowing limits of states from 3% to 5% during 2020-21. To avail of these relaxations, States must undertake reforms across 4 areas, one of which is ULB own revenue. This places state governments in a position where their immediate needs and interest align with making important decisions on long-term reforms that can generate independent and predictable streams of revenue in the future.
3
We conducted a broad review of literature on PT systems and reforms. Key insights from existing research on this topic are presented in the Literature Review section below, and incorporated into the Recommendations section.
Research Methodology
Desk Research
Drawing on the structure suggested from the literature review, we attempted to mathematically model property tax as a polylectic domain, with core, secondary, and tertiary factors integrated with coefficients that best represent the behavior of the system as observed and hypothesized. The first step was to create a mathematical definition of PT, including the factors involved in its calculation. Secondary factors that will act as modifiers and coefficients to the core factors defined previously would be used to add further granularity and complexity, as seen in the data and other research. This data model can then be used to run simulation studies, where modification of one or more factors is used to test hypothetical solutions for maximizing PT efficiency/revenue.
Data Modeling
Research work would be focused on studying collated data from specific states, in order to find correlations and trends between some of the variables indicated by the data model. In particular, we wanted to test this for ULBs filtered by population range and employees per capita. These analytics would feed back into the model, expanding on the initial mathematical analysis with domain expertise, as well as through combining datasets from housing valuation as well as from property usage databases, assigning value coefficients, and modifying them until the model represents observed trends in the existing data.
Data Analytics
This whitepaper adopts three methods to assess PT systems in India, including specifically reforms carried out in the state of Andhra Pradesh, and to make recommendations on how state governments and ULBs can improve their PT revenues. These three methods are desk research, data modeling, and data analytics.
4

Property Tax is considered one of the most appropriate sources of local revenues, as there is a direct connection between the services financed by the tax and the benefit to property values. This makes PT an ideal tax for financing local governments. It has several advantages (Fischel 2001)8:
Reformers must understand the economical, policy, and administrative components of PT to design and implement appropriate, effective, and suitable interventions. Both policy and administrative determinants play vital roles in overhauling the current state of PT collection in India. (Linn, 1980; Kelly, 2000; UN-HABITAT, 2011)9. Tax reforms require good leadership and strong institutions for successful implementation. Any reform strategy must recognize areas of resistance and support for possible changes. Stakeholders must be educated about costs and benefits, and consensus needs to be developed. These efforts must be sustained, as PT reform is a long-term process.
Reform implementation may face three main challenges -
Rapidly urbanizing population, leading to increased revenues over time
Immobile tax base implies easy identification and natural collateral
A progressive form of taxation (in theory, since it is linked to property values).
Literature Review
Political: Tax reforms may create winners and losers. Some pressure groups may try to
push reforms that are in their favor while others try to oppose them
Technical: Reforms may fail due to incomplete information, incorrect forecasting or other
such technical issues
Tactical: The timing and sequencing of tax reforms are crucial for their success.
8 https://icrier.org/pdf/FinalReport-hpec.pdf9 https://journals.sagepub.com/doi/abs/10.1177/109114218000800405https://onlinelibrary.wiley.com/doi/abs/10.1111/0275-1100.00028http://www.ipti.org/wp-content/uploads/2017/06/United-Nations-Land-and-Property-Tax-A-Policy-Guide-2011.pdf
Rosengard 10 suggests four principles to keep in mind while proposing property tax reforms :
Optimal tax systems may work in theory; in practice, simple systems are better.
PT must be seen as a tool for generating revenue only; not a means to achieve social goals (reducing property speculation, recovering infrastructure costs etc.)
The political and economic benefits of PT converge in the long run; hence, aim for a large base and low rates. Minimise exemptions or concessional rates.
Inducing behavioral changes is more effective than enforcing government fiat. A proper incentive structure must be created, to ensure individual interests and societal interests converge.
5
The idea of a simple and practical PT system means, in practice, an unbundling of functions and responsibilities. PT administration is neither a mapping agency nor a valuation agency; mapping and valuation are intermediate steps, needed to enable tax departments to collect revenue. For effective PT reform, these can be separated and given to specialised entities, while the focus for the PT agency itself should be on demand generation and collection efficiency.
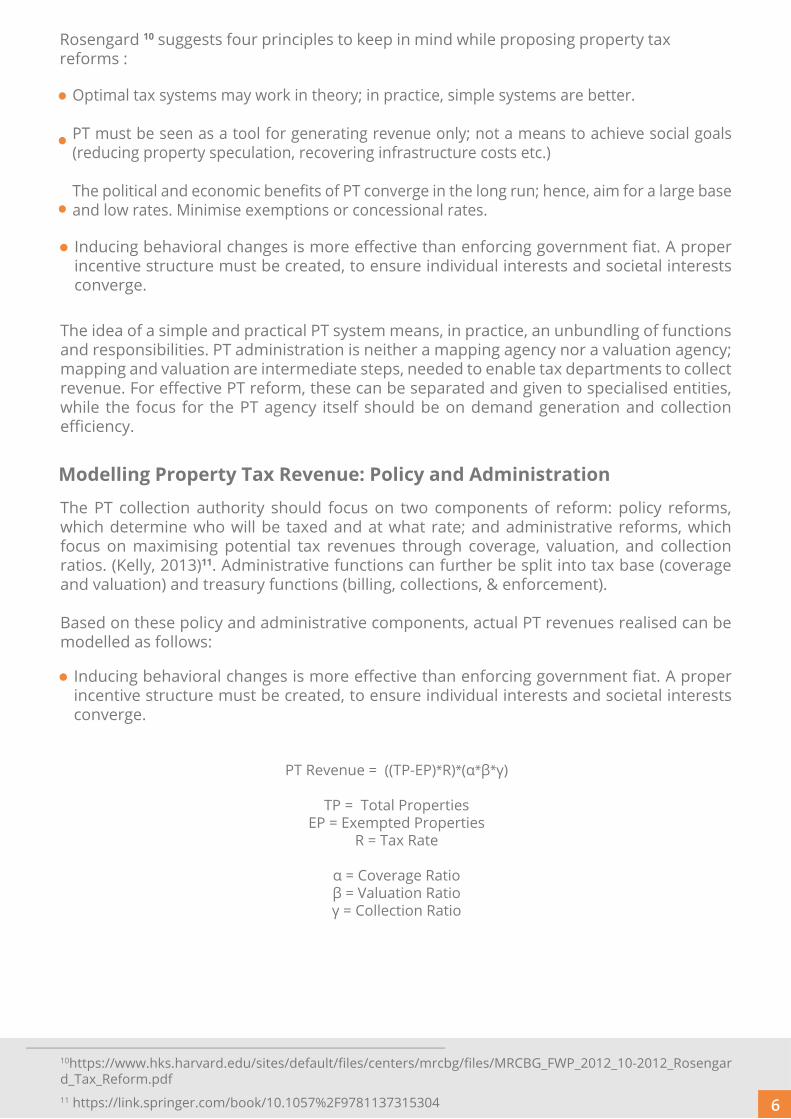
The PT collection authority should focus on two components of reform: policy reforms, which determine who will be taxed and at what rate; and administrative reforms, which focus on maximising potential tax revenues through coverage, valuation, and collection ratios. (Kelly, 2013)11. Administrative functions can further be split into tax base (coverage and valuation) and treasury functions (billing, collections, & enforcement).
Based on these policy and administrative components, actual PT revenues realised can be modelled as follows:
Modelling Property Tax Revenue: Policy and Administration
11 https://link.springer.com/book/10.1057%2F9781137315304
PT Revenue = ((TP-EP)*R)*(α*β*γ)
TP = Total PropertiesEP = Exempted Properties
R = Tax Rate
α = Coverage Ratioβ = Valuation Ratioγ = Collection Ratio
Rosengard 10 suggests four principles to keep in mind while proposing property tax reforms :
Optimal tax systems may work in theory; in practice, simple systems are better.
PT must be seen as a tool for generating revenue only; not a means to achieve social goals (reducing property speculation, recovering infrastructure costs etc.)
The political and economic benefits of PT converge in the long run; hence, aim for a large base and low rates. Minimise exemptions or concessional rates.
Inducing behavioral changes is more effective than enforcing government fiat. A proper incentive structure must be created, to ensure individual interests and societal interests converge.
Inducing behavioral changes is more effective than enforcing government fiat. A proper incentive structure must be created, to ensure individual interests and societal interests converge.
10https://www.hks.harvard.edu/sites/default/files/centers/mrcbg/files/MRCBG_FWP_2012_10-2012_Rosengard_Tax_Reform.pdf
6

From the above formula, the two policy variables in PT revenue are the total tax base and the tax rate.
Total tax base = Total immovable properties - Exempted properties
Ideally, all the immovable properties under ULB jurisdiction should be taxed, irrespective of age, usage, location, and ownership of the property. In practice, governments often exempt properties from paying PT for various reasons. Rationalizing such exemptions is very important: these should be targeted and limited only to properties for which they are justified on efficiency and equity grounds (Kelly 2013, Norregaard 2013, Rao 2011)12.
Tax rate is the amount levied on per unit area of the property. When tax rates are defined by local governments, it leads to diversity in the taxation system. While some ULBs opt for a uniform tax rate (per unit area, or % of property value), most ULBs have a differential approach, with different rates for properties based on location, usage, occupancy etc.
Policy Reforms
“Tax Administration is Tax Policy” is now a well-recognized statement emphasizing the importance of tax administration in realizing tax policy objectives (Casanegra de Jantscher, 1990)13.
While social and political constraints may make policy reforms difficult to enact, the actual implementation and enforcement of these policies on the ground is tougher still, given administrative capacity and constrained resources. This is a vicious cycle: low capacity constraints PT collection/enforcement measures, and low collections mean inadequate resources to spend on enhancing capacity. Administrative reforms are necessary to break this deadlock.
Another factor for administrative inefficiencies is the unclear distribution of responsibility between different local and state government agencies. A clear distinction between responsibilities will prevent all conflicts of interest and reduce the potential for collusion or tax avoidance. It will also bring efficiency by allowing ULBs to hire specialized resources and track their performance against clear and quantifiable metrics.
Administrative Reforms
12 https://link.springer.com/book/10.1057%2F9781137315304
13 https://www.imf.org/external/pubs/ft/wp/2013/wp13129.pdf; https://ideas.repec.org/p/mfg/wpaper/04.html
14 http://documents1.worldbank.org/curated/en/107821468764724876/pdf/multi-page.pdf
7

The three Administrative variables that can be used to model property tax flows are:
Coverage ratio is defined as the number of properties taxed in the system divided by the total number of taxable properties available in the system. As this ratio approaches 1, it indicates that most potentially taxable properties are being taxed. ULBs face challenges in ensuring a high coverage ratio due to gaps in accurate property information, recording of new properties, and updating changes in property (e.g. usage, ownership etc.) in the system.
Coverage ratio
Valuation ratio is defined as the ratio of the value of property in municipal records to the value of the property in the real estate market. This parameter is only applicable to the system where property tax is calculated using the value of the property. (Area-based valuation only requires correct information about the area of the property.) As this ratio approaches 1, it indicates that PT is being assessed on an accurate representation of the market value of each property. ULBs face challenges with knowing what the market value of properties is - what indicator or data source is to be used to determine this? - and with the capacity to conduct a value-revision exercise, even where there are rules that require such revisions / updates to be carried out periodically.
Valuation Ratio
Coverage Ratio (CVR) is defined as the amount of taxable property captured in the tax registry, divided by the total taxable property in a jurisdiction.
The Valuation Ratio (VR) is defined as the value on the valuation rolls divided by the real market value of properties on the valuation roll.
The Collection Ratio (CLR) is defined as the annual tax revenue collected over total tax liability billed.
8

Collection Ratio
14https://openlibrary.org/books/OL24525912M/Best_practices_on_property_tax_reforms_in_India ;https://www.lincolninst.edu/publications/books/international-survey-taxes-land-buildings
Property tax collection for India’s tier-1 cities and towns is ~60% at best; in tier 2 towns it is as low as 40% on average, and can be even lower as one goes to smaller and lower-capacity ULBs. ULBs face challenges with collection because this is traditionally a resource-intensive process, with multiple bills and reminders sent over post, telephone, or by hand. Authorities to impose sanctions - e.g. cut off some municipal services - in case of non-payment may not be specified; even where they are, political constraints may prevent their use.
Collection ratio is defined as the ratio of the amount of tax collected to the total demand of PT identified. Property tax collection levels vary considerably across countries. Collection rates in most OECD countries are close to 100 percent; while in most non-OECD countries collection ratios only range from an estimated 30-60 percent (Bird and Slack, 2004; Kelly 2000, 2013; NIUA, 2010; Youngman and Malme, 1994, 2002).14
9

The Case of Andhra PradeshThe Property Tax system in Andhra Pradesh was similar to most other states in the country, with respect to the policy and administrative variables discussed above. Coverage and collection efficiencies were moderate at best, and the citizen experience was broken and incoherent. ULBs in the state faced a multitude of challenges with existing operations:
The Government of Andhra Pradesh (GoAP) initiative in 2015 to reform the existing institutional practices and develop core capabilities supported by digitization led to a series of changes that both established a robust e-Governance system and improved the PT system. With a strong focus on problem-solving and transparency, the state has been able to increase registered properties (coverage) by 30% (from 28 lakhs to 36.5 lakhs) and collection efficiency by 12% (from 36% to 48%) in four years.
All ULBs, and many other government departments, have started using the integrated property register as a single data source, reducing the instances of inconsistent or redundant data; this has also brought the number of bills generated annually for different services down (from 7 bills annually, to a single bill for property, water, and sewerage charges). Together with online self-assessment and
Ad-hoc processes, sometimes not even compliant with existing laws and rules
Inconsistently applied penalties, leading to both gaps and disputest
Cumbersome and long billing processts
Processes and tax rates that had not been revised for 15 yearst
Unreliable data, and difficulties in collating data stored with different agencies
No involvement from the PT Board in operational duties, leaving collection largely to ULBs
Registered Properties Increased by
30%
12%
Collection Efficiency
Increased by
10

PT collection data from Andhra Pradesh for the years 2017-2019 helps us to standardize the equation for total revenue collection as described above:
Preliminary research into the data collected on deploying a digital urban governance system in Andhra Pradesh allowed for an assessment of property density. Assuming consistent property density across urban population centers in India (based on available information, as well as mathematical approximation based on the scale of the numbers involved), we calculated the average properties per thousand population. This figure was used as a baseline metric to calculate projected tax bases for other ULBs.
Using the coefficient value of 0.248 (weighted average, based on population and number of ULBs in each category) for properties per thousand population, we extrapolated the potential tax base. This was compared with the tax base captured in the current systems to derive coverage ratios.
Large variance is seen in the observed coverage ratios, attributed to administrative efficiency or by extension the degree of effort exerted towards actively increasing tax base coverage. Digitization is also seen as an improving factor, however, the relatively small size of the non-digitized data corpus means that this hypothesis may be better tested in a state with relatively low levels of digitisation at baseline.
Table 1: Properties per 1000 population in ULBs, sorted by ULB population range/size.
Table 2: Projected Tax Base vs Captured Tax Base and Coverage Ratio
Property Tax Revenue = ((Total Properties - Exempted Properties)* Tax Rate) * (Coverage Ratio * Valuation ratio * Collection Ratio)
Data Modelling
State
Andhra Pradesh 1,38,80,975 34,42,481
34,35,760 0.998
Total Urban Population
Projected Tax Base (Properties)
Captured Tax Base (Properties)
Coverage Ratio
ULB Population Range Properties per 1000
11
Under 50k
50k to 1L
1L to 2L
2L to 3L
3L to 5L
280.97
312.29
256.03
226.97
237.67

Calculating or estimating valuation ratios was not possible due to two primary issues:
Tax collection rates across the data surveyed are shown to be highly variant, with median values (as measured in table 5, below) appearing higher up on the theoretically predicted range.
Relative unavailability of raw data, or sufficient raw data to calculate the required base values. Data collection systems as employed in their current configuration do not gather these values directly, and in many cases do not record raw values with enough direct mathematical relation to the coefficients required to calculate the ratios.
Sheer mathematical difference between the values being compared in the valuation ratio. A valuation ratio calculated in this current methodology will return theoretically accurate values; however, its use relative to the expected result in optimizing government operations is questionable, given the difference in the scale of the numbers is one of orders of magnitude. If applied directly, this ratio would suggest absurd levels of inefficiency or potential for improvement in revenues.
State Tax Rate for Residential per sq ft Housing Price Rate per sq ft
Andhra Pradesh Data Unavailable 4596.08
Table 3: Tax Rates vs Housing Prices per sq ft
State Net Property Value Tax Assessed Valuation Ratio
Andhra Pradesh Data Unavailable Data Unavailable10,72,70,66,194
Table 4: Calculating Valuation Ratio as a function of Net Residential Property Value
Table 5: Property Tax Collection Ratio within a 12 month period
State
Andhra Pradesh 23,98,08,12,802 11,53,29,56,013 0.481 0.647
Tax assessed Tax collectedTotal Collection
RatioMedian Collection
Ratio
12

Property Tax Revenue = ((Total Properties - Exempted Properties)* tax rate) * (Coverage ratio * valuation ratio * collection ratio)
Using the values calculated above, we can estimate the size of potential of property tax revenue for Andhra Pradesh, and then extrapolate further for an all-India figure:
As per the Data model -
In other words, Andhra Pradesh, which ranks first in the national EoDB rankings, has an estimated PT ceiling almost three times its current collections. The state has made several efforts and interventions (discussed further below) to improve the PT collections, which can be emulated in other states to enhance PT revenues there as well.
Estimating Potential Property Tax Collection
Andhra Pradesh
Current Tax Collected for the State (for the FY 2018-19) = Rs. 846 Crores
Projected Tax Base = (Captured Tax Base)/(Coverage Ratio) =
34,35,760/0.998 = 34,42,481
Avg Tax Assessed per Property = (Tax Assessed)/(Captured Tax Base) =
23,98,08,12,802/ 34,35,760 = Rs. 6979.77
Property Tax Ceiling (Maximum Possible Projected Tax Revenue) = Projected Tax Base * Average Tax Assessed per Property
= Rs. 24,02,77,23,832.70Approximately Rs. 2400 Crores
13

IndiaWhile we cannot independently determine values for the factors/variables in our formula at an all-India level, we can use estimated values of the variables from previous research. The data being used here is mostly from the 2015-2020 period, so we assume that the values have not changed significantly.
The estimated potential value of PT collections is approximately three times the current collections, given current values of coverage, valuation, and collection ratios. This converts to approximately 0.5% nominal GDP for 2019-20. As these values improve, we will be able to see an increase in actual collections.
Collection Ratio = 0.6 (Non-OECD Countries have an average collection ratio of 30-60%)Coverage Ratio = 0. 9 ( Replicating the coverage ratio of AP, which is very high)Valuation Ratio = 0.10 (On average, assessed value of properties is 8-10% of market values 16)
Potential tax revenue (Estimated Tax Base * Tax Rate) = Current property tax revenue collection/ (Coverage Ratio* Valuation Ratio* Collection
Ratio) = Rs. 40,000 crore /(0.37*0.90*0.10)
= Rs. 120,120 crores
Total property tax collection in India ( FY 2019-2020) = INR ~ 40,000 Cr 15
15 Estimated as 0.2% of Nominal GDP of India (2019)16https://www.ideasforindia.in/topics/governance/tapping-the-revenue-potential-of-property-tax-in-india.htm
14

Best Practices and RecommendationsWe studied a number of approaches to improve the magnitude of variables in the data model equation. We follow this with specific recommendations based on the experience of Andhra Pradesh, where we discuss the state’s approach to strengthening the PT collection process and improving the efficiency of the variables.
It is widely accepted that exemptions and subsidies reduce the efficiency and equity of the system. As mentioned before, larger tax coverage has both economic and political benefits; however, reforming them becomes a challenge due to political, economical, and legal considerations. In particular, once exemptions and concessional rates are put in place, they can be difficult to reverse.
A uniform tax rate has the advantage of being easily implementable and reducing discretion during the assessment. This is particularly useful for developing countries. With uniform tax rates on all properties, the tax will only vary because of the area of the property or net value of the property. This method of taxing properties simplifies administration and brings transparency to the system. It is also helpful in countries where the zoning areas are not standardized and local governments have constrained resources.
In the differential tax rate approach, the tax rate varies based on the parameters like location, usage, age, and occupancy of the property. Although it seems logical to have higher tax rates for commercial properties than residential properties because of high capital value generated by the former, it appears it is adopted mainly due to political reasons. For instance, local leaders would like to ease the tax levy on farmers to win their vote bank. Other views, some countries rationalize this move as a way of shifting the tax burden to people who earn more.
Shifting away from a progressive rate structure can have a number of advantages:
17 https://ideas.repec.org/p/ays/ispwps/paper0426.html
Policy Variables (Tax Base and Tax Rates)
It can reduce the incentive to subdivide property for purely tax purposes.
It can lower the tax burden on high-value properties, which may encourage greater levels of tax compliance.
It can eliminate the problem with bracket creep, where properties can naturally fall into the higher tax brackets as property values naturally increase unless the brackets are indexed to the general property value increases.
It can make it easier to adjust the rate over time (Sjoquist, 2004) 17.
15

Coverage Ratio
Case studies in developing countries suggest that the coverage ratio for PT may range from 40 to 80 percent (Bird and Slack 2004, Kelly 2000, De Cesare 2012, UN-HABITAT 2011) 18. While the aim is to get the coverage ratio as close to 100% as possible, there are three conventional approaches to improving Coverage Ratio
Valuation Ratio
Case studies, especially in developing countries, suggest that the valuation ratio for properties may be no more than 30–40 percent, with large variations in the accuracy of the relative valuations (Bird and Slack 2004, Kelly 2000, De Cesare 2012, UN-HABITAT, 2011).
At the time of covering property in the system, it can be assumed that valuation is captured correctly; valuation accuracy erodes over time, and periodic updating of rolls is required to keep it current. Correct valuation of the properties is required to bring equity in the system. Properties with the same valuation should be paying the same tax.
Partnering with taxpayers and private entities to gather information on properties, which solves the problem of manpower constraints associated with local bodies. Building capacity in local bodies is required to increase the coverage ratio. Specialization must be developed by separating valuation and data collection functions.
Allowing citizens to self-declare cadastral information 19 about their properties and local governments can conduct random field inspections. The process of self-declaring the property information should be simple, with minimal information asked for, in order to increase citizen engagement. Additional fields can be added to this data later on by 3rd-party surveyors or ULB employees, enabling better valuation as well.
Decentralizing the data collection process by creating a property registry. The property registry allows creating and updating property cadastral information in a decentralized manner. The property registry owner can enable all stakeholders in the system to create and update the property in a trusted and verifiable manner. For example, a counter employee in the Water & Sewerage department can initiate a property registry application along with a new water connection application, and field inspectors can inspect and approve details for both applications. This increases collaboration between departments, decreasing workload on scarce human resources in the ULB.
18https://www.lincolninst.edu/sites/default/files/pubfiles/improving-performance-property-tax-latin-america-full_0.pdf
19A cadastral map (also spelled cadaster) is a comprehensive land recording of the real estate or real property's metes-and-bounds of a country; or property-related information.
16

There are various systems adopted for valuation from the simple market value of land in Latin America to statistical estimation in North America. A variant of the market value approach is the ‘banding’ system in England, which roughly classifies all residential properties, based on their estimated capital value, into eight intervals (‘bands’) of value (Plimmer et al., 2002) 20. What all these systems have in common is the requirement for up-to-date information on market prices.
Potential solutions include:
Incorrect valuation can also result from collusion between surveyors and taxpayers. An integrated digital property registry can help prevent such issues, by ensuring data provenance and non-repudiability (i.e. the source of data or any changes to data will always be known). ULB or department employees and citizens can be held accountable for their actions and declarations in case of any inaccuracies. Another institutional check can be to have valuation handled separately from enumeration; given that it is a more technical task, it may be assigned to specialized resources.
Using inflation indexing of properties and increasing frequency of revaluation in areas with dramatic changes in property market rates.
Collecting and analysing data across different departments (land registry, electricity, water and sewerage), as well as from relevant private entities such as banks, to understand the usage of the property. This information can be used to create valuation bands as in the UK.
20https://www.fig.net/resources/proceedings/fig_proceedings/fig2010/papers/ts01f/ts01f_plimmer_mccluskey_4174.pdf
Collection Ratio
Collection ratio in urban India is low because of the following factors -
Information gaps: people are not aware that they have to pay tax, or how much tax to pay, or how to ascertain the amount and where to make payments, etc.
ULB capacity constraints: these can limit the ability to perform treasury functions such as bill distribution, collection, and enforcement.
Unreliable data: there can be disputes regarding the property information in the system, as well as legal disputes regarding ownership, area, usage etc.
All of the above can be further complicated by political pressure on local authorities, e.g. to not sanction those who have overdue payments.
17

To improve the collection ratio, governments can:
Focus on enhancing voluntary compliance, by simplifying the process and providing incentives to taxpayers to pay in time. Linking PT revenue collection to a general improvement in public services is very important. Taxpayer education programs can provide information on PT structure, payment procedures, appeals / dispute mechanisms, and enforcement provisions.
Targeted sanctions: Apart from voluntary compliance, sanctions and penalties can be used, such as withholding of location-specific public services. Tax clearance certificates could also be required for private sector services, e.g. financial services. As noted above, however, these can be difficult to enforce given local political circumstances.
Some countries have effectively used social pressure techniques, like publishing names of top defaulted in the public domain, recognizing top taxpayers as role models, etc. to motivate people and pay their taxes. Countries have also provided direct monetary incentives to encourage compliance, by giving a discount for those paying in a timely and complete manner (Kelly, 2013). Variants of the incentive-based approach can include forms of amnesty or discount specifically for settling disputes, especially disputes that may be pending before a judicial authority.
Some countries have used the private sector to assist in the tax collection process (UN-HABITAT, 2011). Such engagement must be structured carefully to avoid conflicts of interest, and must be in keeping with the country’s legal provisions on delegation of official functions to private entities.
Promote collaboration between departments by generating consolidated bills. This can be achieved by sharing data across departments (e.g. through open APIs in an e-Governance system). This has the added benefit of simplifying the process of bill payment for citizens; as the consolidated amount will be larger than the individual bills, it has more psychological weight for citizens, who may feel paying minor amounts is too much of a hassle.
18

Lessons from Andhra Pradesh:
Linking Efforts to the Data Model
Creation of a single property registry as a single trusted repository of data from multiple sources enhances the tax base and coverage. Andhra Pradesh created a common property registry using legacy data, new (manually-entered) data, and citizen request data, integrated with field survey records and GIS survey records. The new data registry is being used for Building Plan Approvals, Property Registration, GIS Surveys, and Water and Sewerage Charges. The exercise resulted in a 30% increase in coverage and consolidation of the bill generated for Property Tax and Water and Sewerage charges for the citizen.
Streamlining of tax assessments leads to efficiency in collection of taxes. Andhra Pradesh induced several changes in the system - full automation of all assessments, automatic computation of penalty charges in case of default, audit trails to track history and make updates and tracking service delivery against Service Level Agreement (SLA) to track performance.
Andhra Pradesh integrated multiple bills generated for the same property - taxes, water and sewerage connection - into one. This simplified the process and the effort involved in bill generation and collection. The bills clearly show the separate components and break-up of due payments. The citizen is notified through email and SMS to pay his bill annually. The bill is generated in the first week of every year or as soon as a property is identified and added into the registry. The simplification has savings in time, effort and money for the government which can be utilized elsewhere, while also improving the collection efficiency.
The citizens should have convenience of accessing the government through multiple channels. Andhra Pradesh has provided multiple access points to citizens to request service, report grievances and update information such as website, application and Citizen Service Centres (CSC). This allows for both vaster coverage and collection. These efforts are supported by regular notifications to citizens on billing period, rebate period expiry, penalty kick-ins and extensions. Some reform interventions are also made to allow partial payments, advance payments and collection of dues.
The efforts of the AP government can be mapped to the variables in our data model - Tax Base, Tax Rate, and the Coverage, Collection and Valuation ratios - to understand their impact on the overall property tax collection.
19

ConclusionAs India is expected to continue to rapidly urbanise in the coming decade, the strain on urban local bodies (ULBs) to provide utilities and services to the citizens will continue to grow. Becoming financially sustainable is thus a key priority for ULBs in India, especially if they do not want to remain reliant on (increasingly conditional) grants for money to run their daily operations.
The idea of municipal bonds has long been discussed in India; if these are to be implemented, a robust PT system is once again a necessity, as it is PT revenue flows that are the most reliable recurring income of a ULB, which might lead to a credit rating agency giving a city a high rating, and which might lead an investor to see the bond as an attractive and reliable prospect.
The experience of reforms in India is that they have a long gestation period from theory to implementation. The ‘long tail of small cities’ - which accounts for close to 4000 ULBs, nearly 90% of all such bodies in India - can’t wait for structural changes to play out in this gradual manner. Even as debates on undervaluation of properties, unnecessary exemptions, and under-capacity at ULBs continues, there are steps which can be taken up to improve PT collections with a more immediate effect.
This whitepaper demonstrated 2 important variables - coverage and collection - which ULBs can improve without state or union intervention. Andhra Pradesh shows how a determined administration has taken various measures, underpinned by a common digital spine that enables e-Governance, to expand net coverage of properties in the system and simplify the process of payments for citizens.
Other states and cities should also begin by identifying practices which can enhance run-time efficiency of the ULB operations and are independent of any reforms in the pipeline. eGov Foundation has shared these learnings as recommendations with the Ministry of Housing and Urban Affairs (MoHUA) and Janaagraha Centre for Citizenship and Democracy (JCCD) 21; the latter organisation has also prepared ‘A Toolkit for Property Tax Reforms’ for states to organize their reform agendas.
We believe the time is right for states and ULBs across India to take up the issue of PT reform, and to leverage technology to power this transformation.
21https://cityfinance.in/resource/Property_Tax_Reforms_Toolkit.pdf
20


