Lessons Learned from the 2004 Sumatra-Andaman Megathrust Rupture Peter Shearer 1 and Roland B ¨ urgmann 2 1 Institute of Geophysics and Planetary Physics, University of California, San Diego, La Jolla, California 92093; email: [email protected]2 Department of Earth and Planetary Science, University of California, Berkeley, California 94720; email: [email protected]Annu. Rev. Earth Planet. Sci. 2010. 38:103–31 First published online as a Review in Advance on January 6, 2010 The Annual Review of Earth and Planetary Sciences is online at earth.annualreviews.org This article’s doi: 10.1146/annurev-earth-040809-152537 Copyright c 2010 by Annual Reviews. All rights reserved 0084-6597/10/0530-0103$20.00 Key Words subduction earthquakes, finite-slip inversion, tsunami warning Abstract The 2004 Sumatra-Andaman earthquake has been extensively studied be- cause of its great size and devastating consequences. Large amounts of high- quality seismic, geodetic, and geologic data have led to a number of proposed models for its length, duration, fault geometry, rupture velocity, and slip his- tory. The latest of these models vary in their details but now largely agree in their large-scale features, which include significant coseismic slip along the entire 1300- to 1500-km rupture, the bulk of which occurred fast enough to radiate seismic waves. The earthquake’s enormous size has challenged conventional processing approaches and stimulated the development of new analysis and inversion methods, including multiple-source inversions, high- frequency body-wave imaging, and satellite observations of tsunami heights and gravity changes. The Sumatra megathrust earthquake was the largest in 40 years and is by far the best documented, but it does not seem fundamen- tally different in its properties from other large subduction-zone earthquakes. 103 Annu. Rev. Earth Planet. Sci. 2010.38:103-131. Downloaded from arjournals.annualreviews.org by University of California - San Diego on 05/06/10. For personal use only.
Transcript
EA38CH05-Shearer ARI 23 March 2010 21:46
Lessons Learned fromthe 2004 Sumatra-AndamanMegathrust RupturePeter Shearer1 and Roland Burgmann2
1Institute of Geophysics and Planetary Physics, University of California, San Diego, La Jolla,California 92093; email: [email protected] of Earth and Planetary Science, University of California, Berkeley,California 94720; email: [email protected]
Annu. Rev. Earth Planet. Sci. 2010. 38:103–31
First published online as a Review in Advance onJanuary 6, 2010
The Annual Review of Earth and Planetary Sciences isonline at earth.annualreviews.org
This article’s doi:10.1146/annurev-earth-040809-152537
The 2004 Sumatra-Andaman earthquake has been extensively studied be-cause of its great size and devastating consequences. Large amounts of high-quality seismic, geodetic, and geologic data have led to a number of proposedmodels for its length, duration, fault geometry, rupture velocity, and slip his-tory. The latest of these models vary in their details but now largely agree intheir large-scale features, which include significant coseismic slip along theentire 1300- to 1500-km rupture, the bulk of which occurred fast enoughto radiate seismic waves. The earthquake’s enormous size has challengedconventional processing approaches and stimulated the development of newanalysis and inversion methods, including multiple-source inversions, high-frequency body-wave imaging, and satellite observations of tsunami heightsand gravity changes. The Sumatra megathrust earthquake was the largest in40 years and is by far the best documented, but it does not seem fundamen-tally different in its properties from other large subduction-zone earthquakes.
103
Ann
u. R
ev. E
arth
Pla
net.
Sci.
2010
.38:
103-
131.
Dow
nloa
ded
from
arj
ourn
als.
annu
alre
view
s.or
gby
Uni
vers
ity o
f C
alif
orni
a -
San
Die
go o
n 05
/06/
10. F
or p
erso
nal u
se o
nly.
EA38CH05-Shearer ARI 23 March 2010 21:46
INTRODUCTION
More than five years have passed since the devastating 2004 Sumatra-Andaman megathrust earth-quake and tsunami. The size and importance of this earthquake, together with the many high-quality geophysical data sets that constrain its properties, have led to a large number of studiesconcerning various aspects of the event and its tectonic context. Many uncertainties regarding thenature of this earthquake that prevailed in the first few months have been resolved, such as the fullsize and extent of the rupture, which lasted 8 to 10 min and extended for 1300 to 1500 km, with amoment magnitude of 9.1 to 9.3. This makes it one of the largest earthquakes of the past century,smaller in moment only than the 1960 Chile and 1964 Alaska earthquakes, and the first greatmegathrust rupture to be recorded by modern broadband seismometers and global positioningsystem (GPS) equipment. However, issues remain concerning the exact geometry of the fault,including its depth and dip angle, and why such a large earthquake occurred along a section ofplate boundary that was not widely thought to be at high risk for a M 9+ event.
Megathrust faults occur at locations where subducting oceanic lithosphere is thrust belowcontinental margins and island arcs. The bulk of the world’s seismicity occurs in these subductionzones, where, following the Gutenberg-Richter magnitude-frequency relationship, there are manymore small earthquakes than large earthquakes, and few exceed moment magnitude (MW) 8. Onrare occasions, however, these events approach or exceed MW 9. Because such great megathrustearthquakes involve slip over large fault widths (150 to 300 km) and lengths (500 to 1500 km),they are much larger than any earthquakes in the continental crust, and they release the bulk ofthe relative plate motion in subduction zones. Because they produce vertical seafloor motion overlarge areas, they often generate huge tsunamis, which greatly magnify their destructive potential.Prior to 2004, great megathrust earthquakes were thought most likely to occur in regions withrelatively young oceanic crust subducting at high convergence rates (Ruff & Kanamori 1980); thisoccurred both for the 1960 MW ∼ 9.5 Chile and 1964 MW ∼ 9.2 Alaska earthquakes. However,the Sumatra-Andaman earthquake has forced a reevaluation of these theories (Kanamori 2006a,McCaffrey 2008, Satake & Atwater 2007), as it occurred in a region with older oceanic crust andrelatively slow convergence rates, particularly within the northern part of its rupture zone.
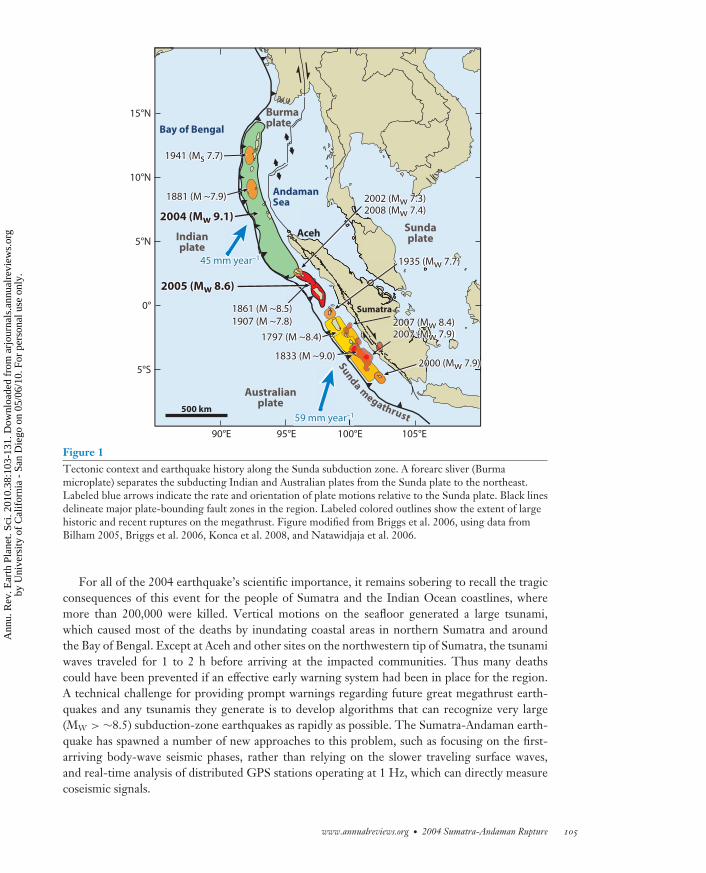
The 2004 earthquake struck at the northern edge of the Sunda megathrust, where the Indianand Australian plates are subducting beneath the Sunda shelf (McCaffrey 2009) (see Figure 1). Therelative plate motion near the epicenter is approximately 50 mm year−1 but is not perpendicular tothe trench. Additional complexity of the plate tectonic setting comes from the broadly distributednature of the India-Australia plate-boundary deformation zone between ∼10◦S and ∼5◦N latitudealong the Sunda thrust (e.g., Delescluse & Chamot-Rooke 2006). The motion can be partitionedinto two parts: a trench normal component associated with pure reverse faulting and a trenchparallel component associated with strike-slip faulting. The Sumatra subduction zone is considereda classic example of such slip partitioning, with much of the strike-slip motion occurring on theonshore Sumatran fault, continuing its northern extension into the West Andaman fault, andconnecting with the Sagaing fault in Burma via several stepped mid-ocean-ridge segments (e.g.,Curray 2005). The small Burma plate in the forearc between the subduction trench and the strike-slip fault is termed a sliver plate. Motion and deformation within the sliver plate control therelative amounts of reverse and strike-slip faulting along the subduction thrust fault and thus theslip vector directions of its earthquakes. As the Andaman-Nicobar section of the trench curvesnorthward, it becomes nearly parallel to the relative plate motion (see Figure 1), reducing theconvergence rate to less than approximately 20 mm year−1, although this number is poorly knownbecause of uncertainties in the amount of deformation within the Burma forearc sliver plate (e.g.,McCaffrey 2009).
104 Shearer · Burgmann
Ann
u. R
ev. E
arth
Pla
net.
Sci.
2010
.38:
103-
131.
Dow
nloa
ded
from
arj
ourn
als.
annu
alre
view
s.or
gby
Uni
vers
ity o
f C
alif
orni
a -
San
Die
go o
n 05
/06/
10. F
or p
erso
nal u
se o
nly.
EA38CH05-Shearer ARI 23 March 2010 21:46
Australianplate
59 mm year–1
Andaman Sea
Indianplate
45 mm year–1
Bay of Bengal
Aceh
500 km
Sundaplate
Burmaplate
2000 (Mw 7.9)
1935 (Mw 7.7)
2002 (Mw 7.3)2008 (Mw 7.4)
2007 (Mw 8.4)2007 (Mw 7.9)
1861 (M ~8.5)1907 (M ~7.8)
2005 (Mw 8.6)
Sumatra
1881 (M ~7.9)
1941 (Ms 7.7)
1797 (M ~8.4)
1833 (M ~9.0)
2004 (Mw 9.1)
Sun
da megathrust
90°E 95°E 100°E 105°E
15°N
10°N
5°N
0°
5°S
Figure 1Tectonic context and earthquake history along the Sunda subduction zone. A forearc sliver (Burmamicroplate) separates the subducting Indian and Australian plates from the Sunda plate to the northeast.Labeled blue arrows indicate the rate and orientation of plate motions relative to the Sunda plate. Black linesdelineate major plate-bounding fault zones in the region. Labeled colored outlines show the extent of largehistoric and recent ruptures on the megathrust. Figure modified from Briggs et al. 2006, using data fromBilham 2005, Briggs et al. 2006, Konca et al. 2008, and Natawidjaja et al. 2006.
For all of the 2004 earthquake’s scientific importance, it remains sobering to recall the tragicconsequences of this event for the people of Sumatra and the Indian Ocean coastlines, wheremore than 200,000 were killed. Vertical motions on the seafloor generated a large tsunami,which caused most of the deaths by inundating coastal areas in northern Sumatra and aroundthe Bay of Bengal. Except at Aceh and other sites on the northwestern tip of Sumatra, the tsunamiwaves traveled for 1 to 2 h before arriving at the impacted communities. Thus many deathscould have been prevented if an effective early warning system had been in place for the region.A technical challenge for providing prompt warnings regarding future great megathrust earth-quakes and any tsunamis they generate is to develop algorithms that can recognize very large(MW > ∼8.5) subduction-zone earthquakes as rapidly as possible. The Sumatra-Andaman earth-quake has spawned a number of new approaches to this problem, such as focusing on the first-arriving body-wave seismic phases, rather than relying on the slower traveling surface waves,and real-time analysis of distributed GPS stations operating at 1 Hz, which can directly measurecoseismic signals.
Seismic moment(M0): a fundamentalmeasure of earthquakesize, defined as M0 =μ A D, where μ is theshear modulus of therock in the sourceregion, A is the faultarea, and D is theaverage offset (slip)across the fault
Moment magnitude(MW): a logarithmicmeasure of moment,commonly definedas MW =2/3 (log10 M0 – 9.1),where M0 is inNewton meters
A GIANT EARTHQUAKE
By any measure, the 2004 Sumatra-Andaman earthquake was one of the largest ever observed.Seismologists have many ways to characterize earthquakes, but the most important parameter formeasuring earthquake size is the seismic moment, M0, often expressed as the moment magni-tude, MW. Only rarely can the surface area and displacement of the fault be observed directly,so moment is typically estimated from records of radiated seismic waves or geodetic observa-tions of permanent displacements caused by the fault movement. In both cases, instrumentaladvances over the past 20 years greatly improved our ability to study the Sumatra earthquakecompared with previous great megathrust events. Seismic estimates of moment for large earth-quakes require accurate measurements at very long periods (i.e., comparable to the rupture du-ration time), which are now provided by the broadband instruments of the global seismic net-works, and geodetic moment estimates can now be made using GPS measurements, which arecheaper and more accurate than traditional surveying methods. Estimates of MW for the Sumatra-Andaman earthquake range from approximately 9.1 to 9.3, with the limits corresponding to anuncertainty in moment of approximately a factor of two. This relatively large uncertainty arisesfrom tradeoffs between the computed moment and the assumed fault dip and other near-sourceproperties.
It is difficult to compare the properties of older great earthquakes in detail with the much morecomplete picture that we have of the Sumatra earthquake. However, their fault geometries canbe roughly estimated from aftershock locations, which generally are observed to outline large-earthquake rupture zones. Figure 2 compares the first month of aftershocks for the Sumatraearthquake with the 1957 MW ∼ 9.0 Aleutian, the 1960 MW ∼ 9.5 Chile, and the 1964 MW ∼ 9.2Alaska earthquakes. The 2004 Sumatra-Andaman event has the longest aftershock zone—morethan 1300 km—and an implied slip area that exceeds that of the Aleutian and Alaskan events andapproaches that of the Chile event. The Chile earthquake appears to have had a larger fault widthand a significantly larger moment.
175°
50
°
50°
–175°
–180°
–170°
–165°
–160°
A l e
u t i a n
I s .
1957
–80° –75° –70°
–80° –75° –70°
S o
u t h
A m
e r i c a
1960
–170°
–165°
–160°
–140° –135°
50°
55°
60°
65°
A l
a s k
a
1964
90°
90°
95°
95°
100°
100°
0°
5°
10°
15°
500 km
Sumatra
2004
–50°
–45°
–40°
–35°
55
°
Epicenter Aftershock
Figure 2The first month of catalogued aftershocks for four great megathrust earthquakes. Red stars show the main-shock epicenters. All mapsare plotted at the same scale. Figure modified from Ishii et al. (2005).
106 Shearer · Burgmann
Ann
u. R
ev. E
arth
Pla
net.
Sci.
2010
.38:
103-
131.
Dow
nloa
ded
from
arj
ourn
als.
annu
alre
view
s.or
gby
Uni
vers
ity o
f C
alif
orni
a -
San
Die
go o
n 05
/06/
10. F
or p
erso
nal u
se o
nly.
EA38CH05-Shearer ARI 23 March 2010 21:46
Table 1 Properties of great megathrust earthquakes
Earthquake MW Mt Length (km) Duration Vr (km s−1)1957 Aleutian 8.5–9.0 9.0 ∼1200 – –1960 Chile ∼9.5 9.4 800–1000 250–340 s ∼3.51964 Alaska ∼9.2 9.1 500–700 250–340 s ∼3.02004 Sumatra 9.1–9.3 9.1 1300–1500 500–600 s 2.0–2.8
Data taken from Abe 1979, Houston & Kanamori 1986, Ishii et al. 2005, and Kanamori 2006b.
PKP: a compressionalwave that travelsthrough Earth’s coreand arrives at distancesbeyond 100◦
SS: a shear waveconsisting of twosurface-to-surface raypaths, connected by anunderside reflectionoff the surface
P and S: directcompressional andshear arrivals,respectively, observedto source-receiverdistances of up to 100◦
Directivity: thesensitivity of seismicobservations to thedirection of faultrupture, in particularthe dependence of theapparent eventduration on theposition of therecording station
Table 1 compares the basic properties of the four best-recorded great megathrust earthquakesof the past century. The Sumatra event stands out for its exceptionally long rupture length andduration and a relatively slow average rupture velocity. All these earthquakes generated majortsunamis, as indicated by their tsunami magnitude, Mt, a simple measure of tsunami size definedby Abe (1979). The size of the Sumatra tsunami is roughly that expected for an earthquake of itsmoment; its huge death toll resulted from the proximity and vulnerability of coastal populationsrather than anything unusual about the tsunami itself.
DATA SOURCES
Study of the 2004 Sumatra-Andaman earthquake is greatly facilitated by advances in geophysicalinstrumentation since the last great megathrust event, the 1964 Alaska earthquake. These includeupgrades to the seismic networks, as well as new technologies, such as GPS and satellite gravity.
Seismic and Hydroacoustic Data
The quantity, quality, and availability of seismic data have improved dramatically in the past40 years. Older seismographs produced analog records, which would often clip on large earth-quakes and had limited frequency response that prevented recording very long periods and normalmodes. Modern stations in the global seismic networks produce digital, broadband, and high–dynamic range records, which are ideally suited to capturing the seismic radiation of M 9+ events.Figure 3 shows the locations of the more than 400 global seismic stations that recorded theSumatra earthquake. There are many more stations available from local and regional seismicnetworks.
Seismograms of the Sumatra earthquake vary greatly in appearance depending on their distancefrom the source, their displacement component, and the way in which they are filtered, as illustratedby the example traces in Figure 3. At 138◦ distance, the broadband vertical-component record fromstation CBN (Virginia, United States) is dominated by the PKP wave train (starting at ∼20 min)and overtones (high-order surface-reflected body waves, starting at approximately 70 min). Thishigh-frequency energy decays relatively rapidly with time, and little remains after several hours.However, if the record is filtered to 100 s and longer periods, then the SS and Rayleigh wavearrivals are most prominent. The Sumatra earthquake excited very long period energy (>1000-speriod) that remained observable for many weeks as Earth’s normal modes (free vibration periods)gradually decayed. The corresponding north-component record from the same station has moreprominent SS and Love wave arrivals. At 70◦ distance, the broadband vertical-component recordfrom station CASY (Antarctica) shows clear P, S, and Rayleigh wave arrivals. Filtering this recordto frequencies above 0.5 Hz focuses on the P wave train because attenuation removes the shearand surface-wave arrivals. Because the earthquake ruptured northward and away from this station,a seismic directivity effect causes the apparent 12-min event duration in the seismogram to besomewhat longer than its true duration of 8–10 min. When a fault ruptures away from a seismic
station, the seismic waves from the ending point of the rupture have a longer distance to traveland an increased travel time compared with those that originate at the rupture starting point(the earthquake hypocenter). This increases the apparent duration of the event at the recordingstation. The opposite occurs when the earthquake ruptures toward a station—the apparent rupture
Station CBN (138˚ distance)
Station CASY (70˚ distance)
Verticalcomponent
North component
Filtered to< 0.01 Hz
SSPKP
Verticalcomponent
Filtered to< 0.01 Hz
Filtered to> 0.5 Hz
P S
CBN
20 40 60 80 100 120
10 15 20 25 30 35
Time (min)
Time (min)
CASY
G1 R1 G2 R2
R1
Global seismic stations Hydroacoustic data
Epicenter
a
b
108 Shearer · Burgmann
Ann
u. R
ev. E
arth
Pla
net.
Sci.
2010
.38:
103-
131.
Dow
nloa
ded
from
arj
ourn
als.
annu
alre
view
s.or
gby
Uni
vers
ity o
f C
alif
orni
a -
San
Die
go o
n 05
/06/
10. F
or p
erso
nal u
se o
nly.
EA38CH05-Shearer ARI 23 March 2010 21:46
duration decreases. Analysis of seismic waves as a function of azimuth is one of the simplest waysto estimate the duration and rupture length of great earthquakes.
Geodetic Observations of Deformation and Gravity Changes
In recent decades, great advances have been made in efforts to observe and explain crustal defor-mation associated with earthquakes owing to improved space-geodetic measurements and defor-mation modeling programs. Advances in geodetic techniques, especially the increased precisionand spatial and temporal coverage of GPS measurements (Segall & Davis 1997), have led to vastimprovements in our ability to detect surface displacements associated with earthquakes. Theexistence of global networks of continuously operating GPS stations allows for the rapid char-acterization of large earthquakes from the measured surface motions. Complementing the GPSmeasurements of earthquake deformation for the 2004 Sumatra-Andaman earthquake are satellitemeasurements of gravity changes associated with the event, as well as field and remote sensingdata of relative sea-level changes along the coastlines of the epicentral region.
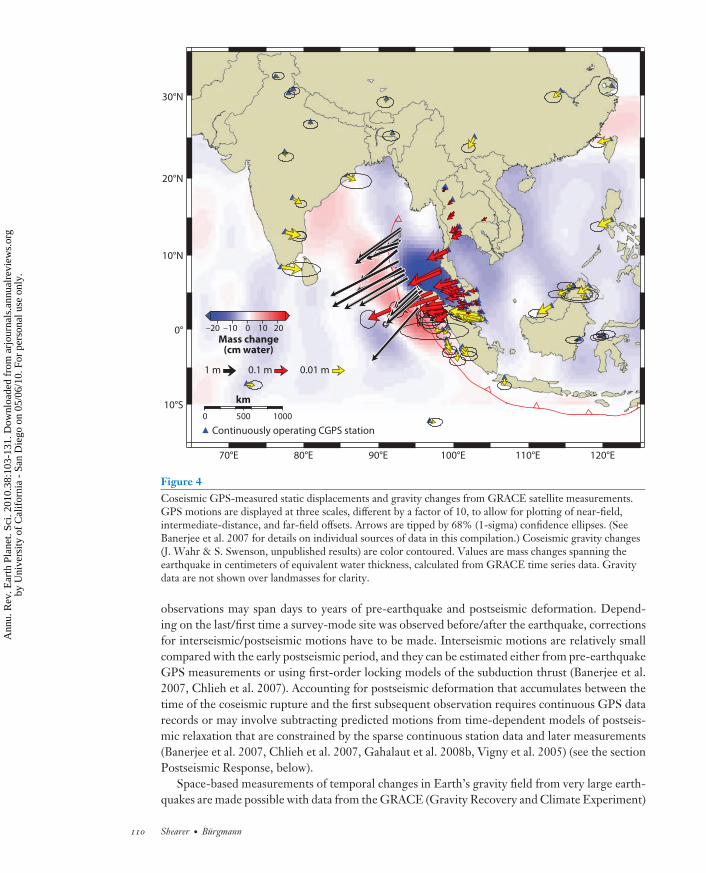
The Sumatra-Andaman earthquake produced unusually large and far-reaching static surfacedisplacements. Precise GPS measurements of coseismic monument motions come from continu-ously operating stations of regional and global (the International GNSS Service) networks, as wellas from repeated survey-mode observations in GPS campaigns by various groups in the affectedareas. Obtaining and combining the various data sets proved to be as challenging as the data andmodel analysis itself, given various limitations on data availability. A recent compilation of GPSoffsets (Banerjee et al. 2007) incorporated measurements from 108 continuously operating stations(Banerjee et al. 2005, Hashimoto et al. 2006, Subarya et al. 2006, Vigny et al. 2005), measurementsof 12 sites observed in survey mode before and after the event on the Andaman-Nicobar Islands(Banerjee et al. 2007, Gahalaut et al. 2006, Jade et al. 2005), 7 campaign-site offsets in Thailand(Vigny et al. 2005), and campaign measurements at 23 sites in northern Sumatra (Subarya et al.2006). The vertical component of displacement is less well constrained than horizontal motions,and the composite data set of Banerjee et al. (2007) has 143 horizontal displacement vectors and30 vertical offsets (Figure 4). Horizontal displacements from the earthquake exceeded 5 m atsites in northern Sumatra and the Nicobar Islands, located in the hanging wall of the coseismicrupture. Coseismic offsets were of order 1–2 cm in southern India, and still exceeded 5 mm at somestations located >3500 km from the rupture (Figure 4). The GPS data reveal a coherent surfacemotion roughly directed toward the earthquake rupture that can be detected out to distances of>5000 km from the epicenter (Banerjee et al. 2005, Kreemer et al. 2006).
Whereas continuous GPS measurements provide offset estimates for the day or even dur-ing the minutes of the earthquake (Blewitt et al. 2006, Vigny et al. 2005), survey-mode
←−−−−−−−−−−−−−−−−−−−−−−−−−−−−−−−−−−−−−−−−−−−−−−−−−−−−−−−−−−−−−−−−−−−−−−−Figure 3Seismic stations recording the Sumatra earthquake and examples of waveforms. (a) The blue triangles on themap plot global seismic stations with records available through the IRIS data center. The blue circles showlocations of hydroacoustic data. The red lines are at 30◦ intervals in distance from the main-shock epicenter.(b) Waveform examples from stations CBN and CASY are shown. Notice the changing character of thesevelocity records as a function of component and frequency. The body-wave phases P, PKP, S, and SS arelabeled, as well as the surface waves G1 and G2 (Love waves, minor and major arc, respectively) and R1 andR2 (Rayleigh waves, minor and major arc, respectively). Because the source lasted more than 8 min, theseseismic phases often appear as wave trains rather than distinct arrivals. For example, P begins atapproximately 11 min in the lowermost trace, but P-wave energy from the rupture continues arriving past20 min.
Figure 4Coseismic GPS-measured static displacements and gravity changes from GRACE satellite measurements.GPS motions are displayed at three scales, different by a factor of 10, to allow for plotting of near-field,intermediate-distance, and far-field offsets. Arrows are tipped by 68% (1-sigma) confidence ellipses. (SeeBanerjee et al. 2007 for details on individual sources of data in this compilation.) Coseismic gravity changes(J. Wahr & S. Swenson, unpublished results) are color contoured. Values are mass changes spanning theearthquake in centimeters of equivalent water thickness, calculated from GRACE time series data. Gravitydata are not shown over landmasses for clarity.
observations may span days to years of pre-earthquake and postseismic deformation. Depend-ing on the last/first time a survey-mode site was observed before/after the earthquake, correctionsfor interseismic/postseismic motions have to be made. Interseismic motions are relatively smallcompared with the early postseismic period, and they can be estimated either from pre-earthquakeGPS measurements or using first-order locking models of the subduction thrust (Banerjee et al.2007, Chlieh et al. 2007). Accounting for postseismic deformation that accumulates between thetime of the coseismic rupture and the first subsequent observation requires continuous GPS datarecords or may involve subtracting predicted motions from time-dependent models of postseis-mic relaxation that are constrained by the sparse continuous station data and later measurements(Banerjee et al. 2007, Chlieh et al. 2007, Gahalaut et al. 2008b, Vigny et al. 2005) (see the sectionPostseismic Response, below).
Space-based measurements of temporal changes in Earth’s gravity field from very large earth-quakes are made possible with data from the GRACE (Gravity Recovery and Climate Experiment)
110 Shearer · Burgmann
Ann
u. R
ev. E
arth
Pla
net.
Sci.
2010
.38:
103-
131.
Dow
nloa
ded
from
arj
ourn
als.
annu
alre
view
s.or
gby
Uni
vers
ity o
f C
alif
orni
a -
San
Die
go o
n 05
/06/
10. F
or p
erso
nal u
se o
nly.
EA38CH05-Shearer ARI 23 March 2010 21:46
satellite mission launched in 2002. Precise measurements of the distance between and position oftwo identical satellites separated by ∼220 km in 450-km-high orbits are used to determine Earth’sgravity field at approximately monthly intervals and to improve our knowledge of time-variablemass distributions on Earth. The Sumatra-Andaman earthquake was the first earthquake to haveits coseismic and postseismic gravity changes captured by the GRACE satellite (Chen et al. 2007,de Linage et al. 2009, Han et al. 2006, Ogawa & Heki 2007, Panet et al. 2007). The gravity-field disturbance from both the Sumatra-Andaman and subsequent March 2005 MW 8.6 Niasearthquakes extends for nearly 1800 km along the Sunda-Andaman subduction zone. The gravitychange includes a zone of gravity increase roughly west of the offshore trench and a zone of gravitydecrease to the northeast in the Andaman Sea (Figure 4). The coseismic gravity change shown inFigure 4 was computed using GRACE time series from April 2002 through February 2009 forwhich a trend, an annual cycle, a semiannual cycle, and the offset at the time of the earthquakewere estimated (J. Wahr & S. Swenson, personal communication). The map shows the amplitudeof the offset, expressed as a change in surface mass, in units of centimeters of water thickness.Gravity changes away from the earthquake zone primarily represent unrelated redistributions ofwater mass.
Both the amplitude and wavelength of the coseismic gravity-change signal are strongly depen-dent on the degree and nature of filtering algorithms used in the analysis, and thus the estimatesof the peak-to-peak gravity change range widely from ∼10 to 30 μGal (mass change equivalent of24–72 cm of water). The relatively coarse spatial resolution of the gravity-change measurements(>400 km) provides a highly smoothed image of the coseismic changes, which must be taken intoconsideration when making comparisons with other data sets or models. The coseismic changesin the gravity field have contributions from vertical displacements of Earth’s layered density struc-ture and from density changes due to elastic volume strain in the lithosphere (Han et al. 2006),but they are also affected by associated ocean mass redistribution (de Linage et al. 2009). GRACEalso detected significant postseismic gravity changes, consisting of a broad zone of gravity increaseflanked by two smaller negative anomalies to the west and east (Chen et al. 2007, de Linage et al.2009, Han et al. 2008, Ogawa & Heki 2007, Panet et al. 2007).
Additional information about static deformation from the earthquake comes from coastal ver-tical motions that can be determined by field studies of the response of corals to the change in localtide induced by coastal uplift/subsidence and by satellite imagery revealing changes in the coastalwater depths (Kayanne et al. 2007, Meltzner et al. 2006). Meltzner et al. (2006) found that thezone of coseismic uplift extends from the middle of Simeulue Island at 2.5◦N to Preparis Islandat 14.9◦N, suggesting an along-arc rupture length of as much as 1600 km. The pivot line dividingregions of uplift and subsidence is particularly useful to define the lateral extent and downdip limitof the rupture. Kayanne et al. (2007) use coral uplift data and changes in shoreline positions inthe Andaman Islands to show that here the coseismic rupture terminated as much as 80 km eastof the trench with its downdip limit 50 km further east, and that postseismic slip then propagatedupdip in subsequent months. The geologic uplift data proved valuable in inversions for coseismicslip models (Banerjee et al. 2007, Chlieh et al. 2007, Subarya et al. 2006).
Tsunami Observations
Within minutes after the earthquake, a powerful tsunami struck the coast near the northwesterntip of Sumatra. Wave heights reached 30–50 m along the western Aceh coast. The impact was mostsevere in Banda Aceh, the largest city in the region, where wave heights of 5 to 12 m were reportedand more than 100,000 people were killed. Wave heights diminished at points further south alongthe southwest coast, but they were still large enough to be devastating to coastal communities
Figure 5Summary of tsunami impact and data constraints. The Sumatra-Andaman earthquake epicenter andapproximate rupture zone are shown by the red star and dashed line, respectively. The black line withwedges shows the trench location. The numbers of deaths are shown in parentheses next to the countrynames. The red triangles are tide gauge records and are labeled with the tsunami arrival time (relative to theearthquake origin time) and peak amplitude. The red squares are selected tsunami runup amplitudes. Theapproximate range of runup values along various coastlines is also indicated. The blue lines show altimetrydata from the Jason-1 and TOPEX/Poseidon satellites, at a time approximately 2 h after the earthquake.Positive amplitudes (higher sea surface) are shaded; the maximum plotted amplitude, near the south end ofthe Jason-1 profile, is 53 cm. This profile contains another, higher-amplitude maximum of 66 cm, at alatitude of −4◦, south of the map window. The death numbers and other data are derived fromhttp://www.ngdc.noaa.gov/hazard/tsu.shtml and http://nctr.pmel.noaa.gov/indo_1204.html at theNOAA National Geophysical Data Center and the Center for Tsunami Research.
(e.g., 15-m runup at Meulaboh). Total deaths in Indonesia exceeded 165,000. Approximately 2to 3 h later, the tsunami arrived at the coast of Thailand, India, and Sri Lanka (see Figure 5),generating runups of 2 to 10 m and tens of thousands of additional deaths. As the tsunami spreadinto the Indian Ocean, its amplitude slowly diminished, but runups of 2 to 3 m killed more than100 in the Maldives Islands, and runups of 6 to 9 m killed almost 300 in Somalia.
Runup observations depend strongly on near-coastal bathymetry and local site conditions andthus are not ideal for quantitative modeling of tsunamis. Most analyses of the 2004 tsunamihave relied on tide gauge records, which provide a continuous measure of sea-surface height as
112 Shearer · Burgmann
Ann
u. R
ev. E
arth
Pla
net.
Sci.
2010
.38:
103-
131.
Dow
nloa
ded
from
arj
ourn
als.
annu
alre
view
s.or
gby
Uni
vers
ity o
f C
alif
orni
a -
San
Die
go o
n 05
/06/
10. F
or p
erso
nal u
se o
nly.
EA38CH05-Shearer ARI 23 March 2010 21:46
a function of time. Operating tide gauges near the Sumatra earthquake are plotted in Figure 5.Unfortunately, there were no gauges near Banda Aceh or in Burma, and a gauge at Port Blair in theAndaman Islands had timing problems (e.g., Neetu et al. 2005). These tide gauge records reportedmaximum amplitudes of 1 to 3 m, typically two to five times smaller than maximum tsunami runupsfrom the same areas (Titov et al. 2005). The tsunami eventually spread throughout the world’soceans (e.g., Titov et al. 2005) and arrived on both coasts of the United States in 30 to 35 h with tidegauge amplitudes of 6 to 31 cm (http://www.ngdc.noaa.gov/hazard/recenttsunamis.shtml).
The tsunami is the first for which there are satellite altimetry profiles of wave height in theopen ocean. The Jason-1 and TOPEX/Poseidon satellites crossed the region approximately 2 hafter the earthquake and returned sea-surface elevation measurements that captured the leadingedge of the tsunami wave as it exited the Bay of Bengal and entered the open Indian Ocean(see Figure 5). These data (corrected for tides, atmospheric pressure changes, and permanentoceanographic features such as eddies) provide first-order constraints on the tsunami waves.
KINEMATIC MODELS OF SLIP
Rapid slip on earthquake faults radiates seismic waves and results in permanent geodetic deforma-tion of Earth’s surface. Assuming models for Earth’s elastic properties, geophysicists can computeGreen’s functions that provide the predicted seismic or geodetic response as a function of the slipon individual fault elements. They can use these to set up the inverse problem to estimate the spa-tial and temporal distribution of fault slip from seismic and geodetic observations (e.g., the timingand amplitude of various seismic phases and GPS static offset data). These slip models are purelykinematic because they make no assumptions regarding the causes of the motions, although theywill often apply constraints to make the models more physically realistic (e.g., no backward slip).Seismic analyses can solve for the slip history, including parameters such as the rupture velocity,whereas GPS data generally constrain only the total slip from the entire earthquake. GPS data areideally suited to detect slip at longer timescales than the seismically observed rupture duration,including the postseismic motions that last for many years after large earthquakes.
Table 2 lists the moment, M0, and fault geometry for many studies of the Sumatra earthquake,and Figure 6 shows the slip distribution for some of these models, which is discussed in thesections that follow. The maximum slip in the different models ranges from 11 to 35 m. The slip islinked to the earthquake moment by the local shear modulus at the fault; thus different amounts ofmodel slip could result from different assumed values for the shear modulus, even if the momentremains constant. The models shown here use average shear modulus values that range fromapproximately 5 to 6.8 × 10¹⁰ Pa (often assumed to increase with depth), with the exception ofVigny et al. (2005), who use 4 × 10¹⁰ Pa. In addition to traditional seismic and geodetic analyses,the Sumatra earthquake slip is also constrained by satellite measurements of gravity changes (deLinage et al. 2009, Han et al. 2006, Panet et al. 2007), satellite and tide gauge measurements of thetsunami generated in the earthquake (Fujii & Satake 2007, Song et al. 2005), and observations ofhydroacoustic waves (de Groot-Hedlin 2005, Guilbert et al. 2005, Tolstoy & Bohnenstiehl 2005).
Seismic Models
Inversion of seismograms for fault models is a long-standing activity in seismology. Small earth-quakes are usually approximated as point sources because the available records are too far awayto resolve any more details. In this case, only the total moment and geometrical properties suchas the average fault orientation and slip direction can be resolved. These details are containedin centroid moment tensor (CMT) solutions for the source. However, for larger earthquakes,
Table 2 Moment estimates from seismic and geodetic studies
Study Data Fault dipMoment
(1022 N-m)Max. slip
(m)Rupture velocity
(km s−1)Ammon et al. 2005(model III)
20- to 500-s body andsurface waves
12◦/15◦/17.5◦
(S to N)6.5 11.4 ∼2
Stein & Okal 2005 Normal modes 8◦ 10 – –Tsai et al. 2005 Centroid moment tensor
analysis5.8–8.1◦ 11.7 – 4.1/3.0/3.3/2.2
(S to N)Vigny et al. 2005 GPS 13◦ 7 34.2 3.7 to 2.0 (S to N)Subarya et al. 2006 GPS + geologic 12◦/15◦/17.5◦
(S to N)8.8 – –
Pietrzak et al. 2007(model 3)
GPS Varies 5 33.9 –
Chlieh et al. 2007 GPS + geologic 12◦/15◦/17.5◦
(S to N)6.93 17.0 –
Banerjee et al. 2007 GPS + geologic 11–35◦ 7.62 19.4 –Rhie et al. 2007 Seismic + GPS 11–18◦ 7.152 35.3 1.8 to 2.6Vallee 2007 Rayleigh waves (empirical
Green’s function method)16◦ 5.6 – 2.5 to 2.0 (S to N)
additional parameters related to the finite size of the fault can be obtained, such as the rupturelength and duration and even the detailed time/space distribution of slip. These finite-slip modelscan be obtained from global earthquake records for events of M ∼ 7 or greater.
There are few on-scale records close to the Sumatra earthquake, but because of its immensesize, its rupture details can be readily resolved using data from the global networks (see Figure 3).The earthquake radiated seismic energy over a wide frequency band into a number of differentseismic phases, including body waves (e.g., P and S waves) and surface waves (Love and Rayleigh),which arrive at different times in the seismogram because of their different propagation pathsand velocities through Earth. Long-period (>20 s) body and surface waves are most useful forconstraining seismic moment and slip details. High-frequency body-wave data can provide higher-resolution imaging of the rupture initiation point (the hypocenter), sources of seismic radiationalong the rupture, and constraints on radiated energy, but they do not directly constrain themoment or the slip magnitude along the rupture. Thus the low-frequency seismic inversionsare more directly comparable with the geodetic inversions, so we begin with them and deferdiscussion of the high-frequency results to later. For clarity, we do not discuss models that werelater improved by the same group. For example, the multiple-CMT analysis of Tsai et al. (2005)is more accurate than the initial Harvard single-CMT solution.
Ammon et al. (2005) presented three different models based on inversions of long-periodseismic data. Of these, model III is now most cited because it includes more of the northern partof the rupture and agrees better with subsequent studies. This model is derived from both bodyand surface waves; assumes three fault segments with dips of 12◦, 15◦, and 17.5◦ (south to north);and obtains a moment of approximately MW 9.1. Several subsequent models have assumed thesame basic fault geometry. One of the first papers to show the true size of the Sumatra earthquakewas the normal-mode analysis of Stein & Okal (2005), who found that MW 9.3 was required toexplain the lowest-frequency normal modes. Tsai et al. (2005) showed that the large size andduration of the Sumatra earthquake could not be properly modeled with a single CMT, but thatthe seismic data are well explained by a series of five CMT solutions that mimic a northward
114 Shearer · Burgmann
Ann
u. R
ev. E
arth
Pla
net.
Sci.
2010
.38:
103-
131.
Dow
nloa
ded
from
arj
ourn
als.
annu
alre
view
s.or
gby
Uni
vers
ity o
f C
alif
orni
a -
San
Die
go o
n 05
/06/
10. F
or p
erso
nal u
se o
nly.
EA38CH05-Shearer ARI 23 March 2010 21:46
0
10
20
Rhie et al. (2007)
1-month aftershocks
3.18
3.87
2.75
1.05
0.81
Tsai et al. (2005) CMTs
0
10
Fa
ult
sli
p (m
) 20
Ammon et al. (2005), #3
5
10
15
20
Gahalaut et al. (2006)
0
10
20
Banerjee et al. (2007)
0
10
20
Pietrzak et al. (2007), #3
5
10
15
20
Chlieh et al. (2007)
90°
12°
94°
8°
98° 90° 94° 98° 90° 94° 98° 90° 94° 98°
90° 94° 98° 90° 94° 98° 90° 94° 98° 90° 94° 98°
4°
0°
12°
8°
4°
0°
Figure 6Published finite-slip models of the 2004 Sumatra-Andaman earthquake compared with the distribution of the first month of aftershocks(Engdahl et al. 2007) and the multiple–centroid moment tensor (CMT) solution of Tsai et al. (2005) (see Table 2 for details about themodels). The black star shows the location of the earthquake hypocenter, and the gray circle shows the original single CMT location.These plots and the compilation of slip models are courtesy of Martin Mai (http://www.seismo.ethz.ch/srcmod/).
propagating slip pulse and have a total moment of MW 9.3. Stein & Okal (2007) later showedthat this model also fits the normal modes quite accurately, with its time dependence explainingan apparent increase in moment with normal-mode period that had led Stein & Okal (2005)to speculate about possible slow slip in the northern part of the rupture (see discussion below).Lambotte et al. (2006, 2007) used normal-mode phase measurements to estimate the rupturelength and duration, obtaining ∼1250 km and ∼550 s. Braitenberg & Zadro (2007) found thatnormal modes recorded by a long-base tiltmeter in Italy at 0.3 to 3 mHz were 1.5 to 3 timesgreater for the 1960 Chile earthquake than for the Sumatra event. Vallee (2007) used an empiricalGreen’s function approach to model the Rayleigh waves from the Sumatra earthquake as a sumof waves from a MW 7.2 foreshock in the same region and obtained a MW of approximately 9.1.
Seismically derived moment estimates for the Sumatra earthquake range from 5.6 to 11.7 ×10²² N-m (see Table 2), corresponding to MW = 9.1 to 9.3. Much of this factor-of-two uncertaintycomes from differences in the assumed fault dip. Very shallow fault dips produce less seismic
Figure 7Cross sections of earthquake locations from Engdahl et al. (2007). Pre-Sumatra earthquake seismicity isshown in yellow, and aftershocks are plotted in red. The red star shows the hypocenter location. Forreference, the dashed line shows a hypothetical 10◦ dipping slap interface intersecting the surface at theapproximate trench location on the seafloor.
radiation for the same moment, and thus models with shallow fault dips (e.g., Tsai et al. 2005)tend to have higher moments than those with steeper dips (e.g., Ammon et al. 2005). Because it isdifficult to resolve the fault dip directly in these inversions, the fault geometry is often specifiedbased on other constraints, such as background seismicity and aftershock locations (e.g., Deweyet al. 2007, Hayes & Wald 2009). Unfortunately, despite efforts to improve these locations (e.g.,Araki et al. 2006, Engdahl et al. 2007), their depth uncertainties remain too large to definitivelyconstrain the geometry of the subduction interface (see Figure 7). It does appear likely, however,that the slab dip increases for the northward part of the rupture zone, as is included in most of themodels.
116 Shearer · Burgmann
Ann
u. R
ev. E
arth
Pla
net.
Sci.
2010
.38:
103-
131.
Dow
nloa
ded
from
arj
ourn
als.
annu
alre
view
s.or
gby
Uni
vers
ity o
f C
alif
orni
a -
San
Die
go o
n 05
/06/
10. F
or p
erso
nal u
se o
nly.
EA38CH05-Shearer ARI 23 March 2010 21:46
A related issue is whether secondary coseismic thrust faulting may have occurred near the trenchand if the subduction interface is currently below the oceanic crust, as some reflection seismic datasuggest (Singh et al. 2008). There is also some evidence that there may have been a secondarysource involving rupture of a splay thrust in the Aceh basin to account for the large tsunami runupsobserved in Aceh province (Banerjee et al. 2007, Plafker et al. 2006, Sibuet et al. 2007).
Inversions of Geodetically Measured Surface Displacementsand Gravity Changes
The elastic deformation of Earth from fault slip in an earthquake produces static surface displace-ments and changes in gravity. Geodetic measurements of these motions and gravity changes canbe used to calculate the size of the event and derive kinematic rupture models, independent ofthe seismic energy released by the earthquake. Obtaining quantitative information about the faultgeometry and the distribution of slip of an earthquake rupture from surface deformation or gravitychanges requires mechanical modeling.
Computer models are used to calculate the deformation of an idealized representation of Earth.Crustal deformation modeling benefits from ever-improving computational hardware and thedevelopment of advanced analytical and numerical model programs that allow for consideration ofincreasingly complex and realistic model geometry, boundary conditions, and material propertiesand for formal inversion of optimal rupture model parameters. In particular, for an event of thesize of the Sumatra-Andaman earthquake, it becomes important to take into account the change inelastic properties with depth, as well as the spherical shape of Earth. Banerjee et al. (2005) showedthat, because of an increase in rigidity with depth, predicted displacements from thrust faultingon a realistically layered sphere fall off with distance much more rapidly than those calculated on ahomogeneous sphere. For stations at a >1000-km distance from the rupture, model displacementson a sphere are several times larger than those for homogeneous flat-Earth models. There is alsoa strong tradeoff between fault dip and scalar moment of a geodetic megathrust slip model; thatis, estimates of seismic moment derived from fitting a given set of displacements are larger whenmore shallowly dipping planes are specified (Banerjee et al. 2005). Masterlark & Hughes (2008)argued that it is also important to account for the substantial three-dimensional heterogeneityof material properties across the subduction zone, which requires utilization of numerical finite-element-model techniques. Whereas some studies only compare forward predictions of existingslip models with observations, formal inversion methods are commonly used to find the optimalset of model parameters (i.e., the slip distribution) that best fits the observables. Similar to seismicinversions, additional constraints such as limits on the range of model-slip orientations, bounds onthe total moment or maximum slip amplitudes, and the roughness of the obtained slip distributionare sometimes imposed during the inversion.
The far-field (>∼400-km distance from the rupture) continuous GPS station offset data canbe fit well with simple models involving uniform slip on two to five dislocation planes (Banerjee2005, Hashimoto et al. 2006, Kreemer et al. 2006, Vigny et al. 2005). The near-field survey-mode GPS and geologic observations allow for more refined slip models (Figure 6) (Banerjeeet al. 2007, Chlieh et al. 2007, Gahalaut et al. 2006, Pietrzak et al. 2007, Subarya et al. 2006).Vigny et al. (2005) introduced a displacement field involving data from far-field continuous GPSsites and relied on uniform elastic half-space calculations to find that the peak slip zone on therupture is located approximately 200 km northwest of the epicenter, with a second area of high slipnear 9–12◦N. Their analysis of 30-s GPS time series showed that stations in northern Thailandreached their final positions less than 10 min after the earthquake, providing an argument againstthe hypothesis of a largely aseismic northern rupture continuation. Gahalaut et al. (2006) used the
horizontal and vertical coseismic offsets of 13 survey-mode sites on the Andaman and NicobarIslands to estimate (by trial and error) coseismic slip on 14 adjacent fault segments in an elastichalf-space. Subarya et al. (2006) examined both layered and homogeneous half-space models toinvert data from mostly near-field GPS stations, as well as field and remote sensing estimatesof vertical motions. They found slip exceeding 20 m offshore northern Sumatra, with additionalhigh-slip patches exceeding 10 m up to 14◦N and a rupture extent of at least 1400 km. Pietrzaket al. (2007) used elastic half-space models and inverted for several slip models using different faultgeometries and GPS and geologic uplift data subsets. The model shown in Figure 6 is based oninversion of the data of Vigny et al. (2005) plus near-field data from other studies (Bilham et al.2005, Gahalaut et al. 2006, Subarya et al. 2006) without correction for postseismic deformation.
Chlieh et al. (2007) used a model with a vertically layered elastic Earth structure to invert datafrom survey-mode and continuous GPS sites out to 1100 km from the rupture and near-fieldgeologic data. They compared inversions of only continuous GPS data (located >400 km fromthe rupture) with models derived from near-field survey-mode measurements that span 20 to40 days of postseismic motion to argue that afterslip of ∼30% of the coseismic moment addedto the near-field displacements. From a joint inversion of the far-field and uncorrected near-fielddata, Chlieh et al. (2007) obtained a relatively detailed slip distribution with multiple peak-slippatches (Figure 6). Banerjee et al. (2007) analyzed both near- and far-field GPS data, taking intoaccount both vertical rigidity layering and Earth sphericity, and corrected near-field GPS offsetsfor postseismic motions by subtracting predicted motions from a model of afterslip derived fromthe continuous data. They found that only ∼8% of survey-mode station offsets occurred in the first20–40 days of postseismic deformation and that adding model slip on steeper dipping segmentsat depth can improve the fit to the near-field GPS deformation data, especially in the verticalcomponent. The coarser, unsmoothed slip model of Banerjee et al. (2007) (Figure 6) has the samefirst-order features as models by Chlieh et al. (2007) and Ammon et al. (2005), including deep dipslip of ∼20 m near 4◦N, relatively deep dip slip on the Nicobar segment from 5◦N to 8◦N, and3–8 m of oblique slip along the Andaman Islands north of ∼9◦N.
Gravity-change measurements by the GRACE satellite reveal a notable signal associated withthe earthquake. Given the confounding factors of low spatial resolution and difficulties with re-moving contributions by nontectonic processes, the gravity data do not resolve any additionaldetails of the rupture kinematics in models of the coseismic rupture. However, model analyses ofthe data show contributions to coseismic gravity changes from not only vertical displacements ofthe layered Earth (primarily the surface but also of the Moho and other interfaces between layersof different densities), but also elastic density changes (Han et al. 2006) and lateral shifts of oceanwater mass (de Linage et al. 2009). To first order, the observed coseismic gravity changes areconsistent with models derived from seismic and/or geodetic model inversions (de Linage et al.2009, Han et al. 2006, Panet et al. 2007).
Tsunami Generation and Megathrust Slip
Great megathrust earthquakes produce vertical motions of the seafloor that can generate largetsunamis, which then propagate through the ocean in a complicated way that depends on detailsof the coastlines and the water depth. In principle, the bathymetry is known well enough thatnumerical modeling methods can accurately account for propagation effects, in which case thetsunami observations (e.g., tide gauge and satellite records) can be related directly to the model(the vertical motions of the seafloor, or often the slip model that causes these motions). For theSumatra earthquake, this modeling has taken two different forms: (a) testing seismic or geodeticmodels of the earthquake to see how well they predict the tsunami observations (Geist et al. 2007,
118 Shearer · Burgmann
Ann
u. R
ev. E
arth
Pla
net.
Sci.
2010
.38:
103-
131.
Dow
nloa
ded
from
arj
ourn
als.
annu
alre
view
s.or
gby
Uni
vers
ity o
f C
alif
orni
a -
San
Die
go o
n 05
/06/
10. F
or p
erso
nal u
se o
nly.
EA38CH05-Shearer ARI 23 March 2010 21:46
Pietrzak et al. 2007, Titov et al. 2005) or (b) attempting to invert the tsunami observations for afault slip model (Fujii & Satake 2007, Piatanesi & Lorito 2007, Song et al. 2005). Because of thelarge size of the Sumatra earthquake, point source models are not adequate, and the full lengthand duration of the event must be taken into account.
Some early tsunami modeling efforts were flawed by unrecognized timing errors at the PortBlair tide gauge. Neetu et al. (2005) pointed out this problem, using the timing of the tsunamiarrival at Indian tide gauge stations to argue that the tsunami source region must extend at leastto the Andaman Islands, 900 km north of the epicenter. Titov et al. (2005) and Geist et al.(2007) performed numerical simulations to show that models based on seismic and geodetic datathat included slip extending to the Andaman Islands could fit most of the tsunami observations.Geist et al. (2007) showed that the tsunami observations were generally better explained by a1600-km-long fault than a 900-km-long fault, assuming MW 9.14 in both cases, although themodel underpredicts the extreme runups at Banda Aceh. Fujii & Satake (2007) inverted tide gaugeand satellite altimetry data for a slip model. Their preferred model has a 900-km-long fault and anaverage rupture velocity of 1 km s−1, although a 1400-km-long source better fits the satellite dataalone. They argued that substantial slip near the Andaman Islands would overpredict amplitudesat Indian tide gauge stations. Piatanesi & Lorito (2007) found that Sumatra tsunami amplitudesare not accurately approximated as a linear function of slip amplitude and applied a nonlinearinversion method based on a hybrid L1/L2 norm (for robustness with respect to data outliers) totide gauge observations. Their best fitting model has three high-slip segments—one at the southend of the rupture, one at approximately 8◦N, and one at approximately 12◦N—and an averagerupture velocity of 2.0 km s−1. This model does, however, overpredict tide gauge amplitudes atthe Indian tide gauge station Chennai, one of the two stations cited by Fujii & Satake (2007) asarguing against slip in the northernmost part of the rupture.
The existing tsunami modeling studies are not in complete agreement regarding the lengthof the best-fitting source region and the rupture velocity. However, given the limited data, weshould not expect slip inversions based on tsunami data alone to have resolution comparable withthe seismic and geodetic inversions.
Integrated Analyses and Joint Inversions
The Sumatra earthquake is constrained by an unprecedented variety of geophysical data. However,it can be difficult to compare results of individual studies because of differences in their modelingassumptions (e.g., fault location and geometry, local shear modulus). Several studies have taken amore integrated approach, either by testing models derived from one type of data by calculatingpredicted results for other data types or by performing joint inversions of multiple data types.
Song et al. (2005) considered models from seismic waveforms and satellite altimetry data toargue that models based on the two data sets produce consistent descriptions of the source of theevent and resultant tsunami. Pietrzak et al. (2007) compared a suite of slip models derived fromGPS offsets and geologic uplift data (Subarya et al. 2006) with tide gauge arrival times and theJason-1 altimetry data of tsunami heights in the Indian Ocean (Figure 5). The temporal evolutionof the slip was constrained by the 30-s GPS time series of Vigny et al. (2005). Pietrzak et al.(2007) argued that the tsunami data favor models with slip maxima that are as high (∼20 m) inthe northern portion (near 8–10◦N) of the rupture as in the south (3–5◦N) and that constructiveinterference of waves from the southern and northern high-slip patches further strengthened thetsunami along the Indian and Sri Lankan coasts.
Chlieh et al. (2007) focused on inversions of GPS data but considered a number of other geo-physical constraints. They showed that their preferred coseismic slip model, which is grossly similar
to Ammon et al.’s (2005) model III, has three bursts of energy that agree with high-frequencyanalyses, predicts best-fitting double-couple moment tensors that agree with the multiple-CMTanalysis of Tsai et al. (2005), correctly predicts observed normal-mode amplitudes (if a rupturevelocity of 2.2 to 2.6 km s−1 is assumed), roughly matches observed long-period surface-waveamplitudes, and does a reasonable job of predicting the tsunami amplitudes seen in the satel-lite altimeter data. For the seismic comparisons, they found that fixed rupture velocities of 2 to2.6 km s−1 provide the best fits. They concluded that there is no need for aseismic slip in the An-daman Island region to reconcile the geodetic and tsunami results with seismic-wave modeling.
Rhie et al. (2007) considered a number of different models based on single and joint inversionsof long-period seismograms and GPS data. They obtained approximately 30% more moment forthe purely geodetic inversions than the purely seismic inversions, but they obtained a reasonablefit to both data types using a joint inversion approach and speculated that at least some of themismatch in the individual inversions may result from incomplete removal of postseismic signalfrom the near-field GPS data. They noted that their results are sensitive to the assumed faultgeometry and that the higher moment in Tsai et al.’s (2005) multiple-CMT analysis results froma shallow fault dip angle. Rhie et al. (2007) showed that the fault dip angle is not well resolvedin their inversions, but they prefer a steeper dip angle to be more compatible with the aftershockdata. They found that average rupture velocities between 1.8 and 2.6 km s−1 can fit the seismicdata.
SLOW SLIP ON NORTHERN SEGMENT?
Seismic and geodetic estimates of moment should agree, provided the slip is fast enough to be fullycaptured by seismic records and the geodetic estimates have the time resolution to capture onlythe coseismic slip and not any of the postseismic deformation that follows large ruptures. In theinitial months following the Sumatra-Andaman earthquake, there was speculation that much ofthe moment released in the northern part of the rupture occurred at an intermediate timescale—as slow slip that did not radiate observable seismic waves but was still rapid enough to appearas coseismic moment release in geodetic observations (Bilham 2005, Lay et al. 2005). This wassuggested by the initial Harvard CMT and some of the early finite-slip models from seismologythat did not have substantial moment release to the north, as well as a tide gauge record at PortBlair and some tsunami modeling that suggested delayed vertical movements near the AndamanIslands. The existence of slow slip, if it could be confirmed, would be an important result withprofound implications for other megathrust earthquakes. There is some evidence that the 1960Chile earthquake was preceded by a slow-slip event of comparable moment (Cifuentes & Silver1989), and slow earthquakes are now recognized as a common occurrence just below the lockedpart of subduction zones (Ito et al. 2007, Rogers & Dragert 2003).
However, initial seismic analyses of the Sumatra earthquake were based on algorithms thatwere not designed for an event of 500-s duration. The multiple CMT analysis of Tsai et al. (2005)and a number of other inversions later indicated substantial coseismic moment release along thenorthern segment. In addition, the Port Blair tide gauge record was found to have a timing errorthat accounted for its apparent delayed response to the earthquake (Neetu et al. 2005). Currentcoseismic slip models can largely explain both the geodetic and seismic observations (e.g., Chliehet al. 2007, Rhie et al. 2007), as well as tsunami observations (Chlieh et al. 2007). However, thereis a moment excess in some of the geodetic inversions compared with seismic inversions. It canbe problematic to perform such comparisons between different studies because they often assumedifferent fault geometries, which will yield different moment estimates even from the same setof observations. For their preferred fault geometry, Rhie et al. (2007) found that a GPS-only
120 Shearer · Burgmann
Ann
u. R
ev. E
arth
Pla
net.
Sci.
2010
.38:
103-
131.
Dow
nloa
ded
from
arj
ourn
als.
annu
alre
view
s.or
gby
Uni
vers
ity o
f C
alif
orni
a -
San
Die
go o
n 05
/06/
10. F
or p
erso
nal u
se o
nly.
EA38CH05-Shearer ARI 23 March 2010 21:46
inversion produced a 35% higher moment than a seismic-only inversion. On its face, this mightargue for a component of slow slip at timescales longer than 500 s (the longest surface-wave periodsused in the inversion), but this interpretation is not supported by evidence described in the nextparagraph.
Vigny et al. (2005) examined continuous GPS records for the first few hours following theearthquake and found no signal for slow slip following the coseismic offsets. High-frequency andhydroacoustic studies show continuous rupture and high-frequency radiation extending to thenorthern end of the rupture. In addition, both Rhie et al. (2007) and Chlieh et al. (2007) haveobtained models that fit both the geodetic and seismic data reasonably well, so the data do not ap-pear to strongly require a moment difference. To place the Sumatra results in perspective, it is notunusual for separate seismic and geodetic inversions to yield different moment estimates. Oftenthe geodetic inversions yield higher moments; this has been observed for the 1984 Northridge,the 1999 Chi-Chi, and the 2004 Parkfield earthquakes (Langbein et al. 2006). A possible expla-nation for these discrepancies is that the geodetically estimated moments may include significantpostseismic deformation occurring immediately after the main shocks (although the Sumatra stud-ies have attempted to correct for this effect). Of course, at some point this becomes a matter ofsemantics—we could term some of the rapid postseismic deformation immediately following amain shock to be a slow-slip event. But there is no evidence from the Sumatra earthquake thatthere was a distinct slow-slip event or that the rupture and postseismic response involved anyexotic behavior different from that commonly observed for other earthquakes.
HIGH-FREQUENCY SEISMIC AND HYDROACOUSTIC OBSERVATIONS
Seismic observations that contribute to moment estimates and finite-slip models are made atrelatively long periods (>20 s). Some of the finite-slip models discussed above included rupturevelocity estimates, which range from approximately 2 to 3 km s−1 averaged for the entire event,with some evidence for slightly slower rupture velocities for the northern part of the rupturecompared with the southern part. It is important to recognize that these long-period seismicestimates are often derived from time/space points that correspond to slip velocity maxima, andthey may not reflect the actual onset of slip at a given point on the fault.
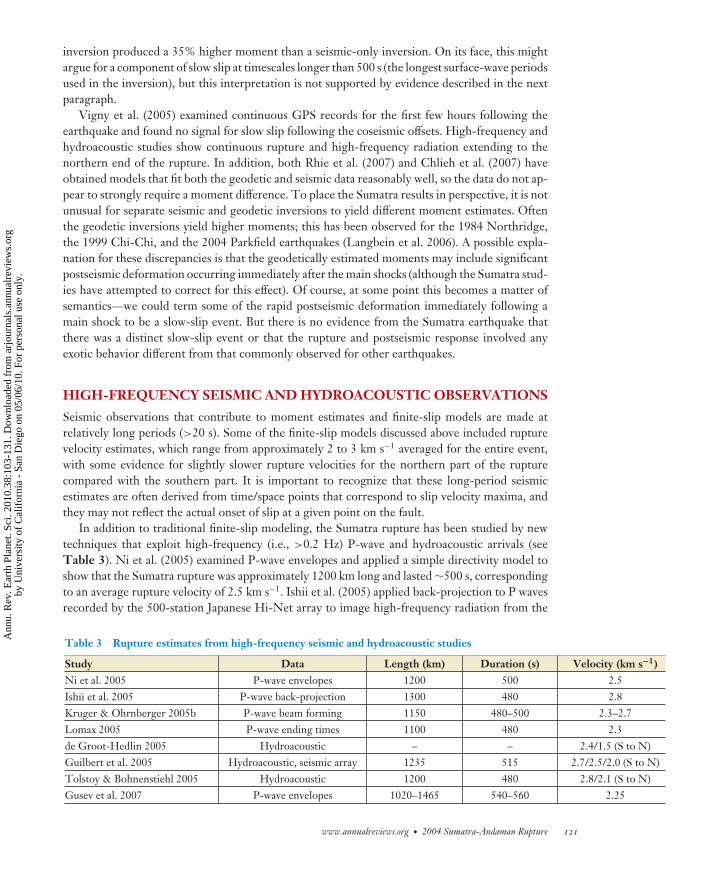
In addition to traditional finite-slip modeling, the Sumatra rupture has been studied by newtechniques that exploit high-frequency (i.e., >0.2 Hz) P-wave and hydroacoustic arrivals (seeTable 3). Ni et al. (2005) examined P-wave envelopes and applied a simple directivity model toshow that the Sumatra rupture was approximately 1200 km long and lasted ∼500 s, correspondingto an average rupture velocity of 2.5 km s−1. Ishii et al. (2005) applied back-projection to P wavesrecorded by the 500-station Japanese Hi-Net array to image high-frequency radiation from the
Table 3 Rupture estimates from high-frequency seismic and hydroacoustic studies
Study Data Length (km) Duration (s) Velocity (km s−1)Ni et al. 2005 P-wave envelopes 1200 500 2.5Ishii et al. 2005 P-wave back-projection 1300 480 2.8Kruger & Ohrnberger 2005b P-wave beam forming 1150 480–500 2.3–2.7Lomax 2005 P-wave ending times 1100 480 2.3de Groot-Hedlin 2005 Hydroacoustic – – 2.4/1.5 (S to N)Guilbert et al. 2005 Hydroacoustic, seismic array 1235 515 2.7/2.5/2.0 (S to N)Tolstoy & Bohnenstiehl 2005 Hydroacoustic 1200 480 2.8/2.1 (S to N)Gusev et al. 2007 P-wave envelopes 1020–1465 540–560 2.25
rupture as it propagated northward for 1300 km at an average rupture velocity of approximately2.8 km s−1. Kruger & Ohrnberger (2005b) used beam forming on P waves recorded by Germanstations to resolve a 1150-km-long rupture and an average rupture velocity of 2.3 to 2.7 km s−1.Lomax (2005) estimated the ending times of the P wave train and applied a location algorithm tofind the best-fitting rupture termination point and time, obtaining a fault length of 1100 ± 300 kmand a duration of approximately 8 min. Gusev et al. (2007) analyzed high-frequency P-wave powerrecorded by global seismic stations and used an aftershock as an empirical Green’s function toaccount for the expected shape of P-coda envelopes. They obtained a rupture length of 1241 ±224 km and an average rupture velocity of 2.25 km s−1. Many of these seismic studies indicate twoto three distinct bursts of high-frequency radiation from the Sumatra earthquake (Ammon et al.2005, Ishii et al. 2005, Kruger & Ohrnberger 2005a), at approximately 80, 320, and 480 s after theorigin time, which roughly correspond to peaks in the moment release observed in long-periodstudies (Ammon et al. 2005, Tsai et al. 2005).
P waves couple into acoustic waves in the ocean, which can become trapped in the marine low-velocity channel and propagate for long horizontal distances as tertiary (T) phases. Hydrophonearrays in the Indian Ocean recorded T phases from the Sumatra earthquake, which were analyzedby de Groot-Hedlin (2005), Guilbert et al. (2005), and Tolstoy & Bohnenstiehl (2005). Thesestudies indicated a rupture length exceeding 1200 km and rupture velocities of 2 to 2.7 km s−1,with lower values for the northern part of the fault. [Tolstoy & Bohnenstiehl (2006) argued thatthe somewhat slower velocities obtained by de Groot-Hedlin 2005 are likely an artifact caused inpart by neglecting azimuthal differences in the P-wave path compared with the T-phase path.]Seismic and acoustic studies that have attempted to solve for a variable rupture velocity generallyobtain somewhat lower velocities for the northern part of the rupture, although in most casesthe northern rupture velocity is still at least 2 km s−1. However, Bilek (2007) found no evidencethat smaller earthquakes in the northern fault portion have anomalously long durations, so thisdifference does not appear to reflect general variations in fault-zone character.
A fundamental constraint on rupture dynamics is provided by the total radiated seismic energy,ER. Unfortunately, accurately estimating the radiated energy for earthquakes is difficult becauseP and S waves must be well-sampled over all takeoff angles and frequencies, and corrections forattenuation are critical. Studies of the same earthquake often yield differing energy estimates,and the Sumatra earthquake is typical in this respect. Lay et al. (2005) obtained ER = 1.1 ×10¹⁷ J from teleseismic P waves. Kruger & Ohrnberger (2005a) obtained ER estimates of 5.5 and15.3 × 1017 J from German and Japanese network data, respectively. Kanamori (2006c) obtainedER = 3.0 × 10¹⁷ J using Ammon et al.’s (2005) model III for low frequencies and observations ofthe P wave train at higher frequencies (extended to S waves using an assumed S/P energy scalingrelationship). Choy & Boatwright (2007) analyzed the teleseismic P wave train, using referenceevents to correct for the amount of extra energy arriving in their 10-min window from otherseismic phases, and obtained ER = 1.4 × 10¹⁷ J. Both of these studies found that the second halfof the rupture radiated less seismic energy than the first half. Using ER = 3.0 × 10¹⁷ J and M0 =6.5 × 10²² N-m (Ammon et al.’s 2005 model III value), the energy moment ratio is 4.6 × 10⁻⁶,a value comparable with that of other subduction-zone earthquakes, although slightly on the lowside (Kanamori 2006c).
POSTSEISMIC RESPONSE
Continued GPS measurements following the Sumatra-Andaman earthquake showed stronglyperturbed motions, both in the near-field and at greater distances in Indonesia and Thailand(Figure 8). GPS sites on the Andaman-Nicobar Islands generally continued to move to the
122 Shearer · Burgmann
Ann
u. R
ev. E
arth
Pla
net.
Sci.
2010
.38:
103-
131.
Dow
nloa
ded
from
arj
ourn
als.
annu
alre
view
s.or
gby
Uni
vers
ity o
f C
alif
orni
a -
San
Die
go o
n 05
/06/
10. F
or p
erso
nal u
se o
nly.
EA38CH05-Shearer ARI 23 March 2010 21:46
Dis
pla
cem
en
t (m
)
0 20 40 60 80 100 120
Time since December 26, 2004 (days)
Horizontal toward 253°
Vertical
0.3
0.2
0.1
0
Dis
pla
cem
en
t (m
)
0 200 400 600 800 1000 1200
Time since December 26, 2004 (days)
Horizontal toward 253°
Vertical
0.3
0.2
0.1
0
-0.1
CARI CPN
CARI
CPN
50 km
100 km14°N
12°N
10°N
8°N
6°N
4°N
2°N88°E 90°E 92°E 94°E 96°E 98°E 100°E
Sunda trench
Depth contour of trench to top of downgoing slab
Fault
Aftershocks following 2004 earthquake, up to Nias earthquake
Aftershocks following Nias earthquake (March 28, 2005)
Postseismic horizontal displacement, January–November 2005, with 95% confidence ellipse
Vertical motion, January–November 2005
Ele
va
tion
(m)
a
b
–5000
–4000
–3000
–2000
–1000
0
1000
2000
3000
N88 E88°°E 90 E0°E9090
0 100 2001000 2
kmkkmm
0.2 m(horizontal)
0.2 m(vertical)
0.2 m(horizontal)
0.2(ve
Figure 8(a) Map of GPS-measured postseismic displacements from January to November of 2005. Contributions from interseismic deformationand coseismic offsets from the 2005 Nias earthquake have been removed. Depth contours are from Gudmundsson & Sambridge 1998.Faults are after Curray 2005. Arrows show the GPS-measured horizontal postseismic displacements from January to November of2005. Vertical bars represent the vertical motions during the same time. (b) Time series ( graphs) show postseismic motions of stationCPN in Chumphon, Thailand (data courtesy of NICT and M. Hashimoto) and CARI at Port Blair on south Andaman Island (datacourtesy of J. Paul, CERI) with interseismic trends removed from horizontal components.
west as in the earthquake, but partially reversed their coseismic subsidence (Banerjee et al. 2007,Gahalaut et al. 2008a, Paul et al. 2007). Continuous and survey-mode GPS data from the is-lands support the view that postseismic deformation in the first months following the earthquakeincluded a contribution from rapid afterslip downdip of the coseismic rupture (Banerjee et al.2007, Paul et al. 2007). A much more optimally distributed GPS network spanning the subse-quent rupture of the 2005 Nias earthquake also documents rapid deformation transients that arewell explained by postseismic afterslip both up- and downdip of the coseismic rupture (Hsu et al.2006).
Continuous GPS sites at greater distances in eastern Sumatra and Thailand also show a pro-nounced acceleration of motion toward the southwest following the 2004 earthquake, with ratesof up to ∼500 mm year−1 during the first three months (Hashimoto et al. 2006, Pollitz et al.2006a). Postseismic displacements at sites in western Thailand already exceed their coseismic off-sets. For example, station CPN in Chumphon, Thailand, displaced horizontally by 0.14 m duringthe earthquake and continued at a rapid pace for 0.24 m above and beyond expected interseismicmotions to the southwest by July 2009 (see Figure 8). The magnitude and direction of acceleratedmotion agree with the predictions of viscoelastic relaxation models (Pollitz et al. 2006a, 2008) butcan also be reproduced by kinematic models of substantial afterslip (Hashimoto et al. 2006).
In addition to other participating relaxation processes (afterslip and poroelastic rebound), eventsof this magnitude are followed by viscous relaxation of coseismic stress changes involving the crys-tal plastic deformation of rocks (Burgmann & Dresen 2008). Models of upper mantle relaxation ina spherical, stratified Earth predict substantial postseismic effects over a wide region surroundingthe eastern Indian Ocean (Pollitz et al. 2006a, 2008). Figure 9 shows the predicted displace-ments for a 60-year period following the 2004 Sumatra earthquake from viscoelastic relaxation inthe mantle using a model with a viscosity structure deduced from the observed GPS time seriesduring the first year of postseismic motion (Pollitz et al. 2006a). Whereas details of the ultimatepostseismic displacements in the region will depend on the nature and distribution of rheologicalproperties of both the plate interface and the underlying mantle, the eventual magnitude of tran-sient motions at far-field distances will be of the order shown in Figure 9. Owing to the depthextent of this relaxation, postseismic surface displacements in the far field will greatly exceed staticcoseismic displacements (compare Figures 3 and 9). Consideration of near- and far-field GPSdata, horizontal and vertical transient motions, and the postseismic gravity changes discussed be-low promises to resolve the contributions from the different postseismic relaxation processes tothe observed deformation transients.
The relaxation processes following the Sumatra earthquake also produced a notable time-varying gravity field that was captured by the GRACE satellite mission. Whereas the coarse spatialresolution and overlapping contributions from hydrological changes complicate the analysis, thespatial and temporal patterns captured by the gravity measurements may lend additional diagnos-tic power to efforts focused on separating contributions from afterslip, poroelastic rebound, andviscoelastic relaxation. The lateral extent of the postseismic signal is consistent with deformationprocesses acting quite deep in Earth. Ogawa & Heki (2007) suggested that poroelastic reboundassociated with fluid flow in the upper mantle can produce the postseismic gravity changes. Theyargued that sufficient amounts of water exist in the mantle and that permeabilities may be highenough to produce the observed signal. Panet et al. (2007) and Han et al. (2008) suggested thatthe broad postseismic gravity increase is consistent with rapid viscous relaxation such as that pro-duced by a biviscous Burgers body with a rapidly decaying low-viscosity element (∼1017 Pa s)and a higher (∼1019 Pa s) longer-term viscosity consistent with that found by Pollitz et al.(2006a).
124 Shearer · Burgmann
Ann
u. R
ev. E
arth
Pla
net.
Sci.
2010
.38:
103-
131.
Dow
nloa
ded
from
arj
ourn
als.
annu
alre
view
s.or
gby
Uni
vers
ity o
f C
alif
orni
a -
San
Die
go o
n 05
/06/
10. F
or p
erso
nal u
se o
nly.
EA38CH05-Shearer ARI 23 March 2010 21:46
Verticaldisplacement
(cm)
50
40
30
20
10
75 cm
2004 earthquake rupture
7.5 cm
km
0
–10
–20
–30
–40
–50
30°N
20°N
10°N
0°
10°S
70°E 80°E 90°E 100°E 110°E 120°E
0 500 1000
Figure 9Predicted horizontal and vertical motions from mantle relaxation following the 2004 earthquake. Cumulative transient motions60 years after the earthquakes will ultimately amount to more than 50 cm, up to distances of approximately 1000 km from the rupturein the southwest and northeast directions. This prediction is based on an optimal biviscous mantle rheology model derived from earlypostseismic GPS data (Pollitz et al. 2006a).
The extensive and far-reaching deformation transients from the 2004/2005 Sumatra-Andamanruptures will impact the loading and earthquake occurrence on many other faults, even at verylarge distances. Depending on the rheology of the asthenosphere, measurable deformation pulsesfrom megathrust earthquakes may travel thousands of kilometers and impact seismicity at greatdistances and for many decades (Pollitz et al. 1998). The occurrence of the March 28, 2005,MW 8.6 Nias earthquake likely was hastened by a combination of coseismic and postseismicstress transients from the December 26, 2004, event (Nalbant et al. 2005, Pollitz et al. 2006b),and stress changes from the 2004/2005 events may have significantly increased seismic activityalong the Sumatra-Andaman-Sagaing fault system (Cattin et al. 2009). Given that deformationlandward of the 1960 Chile and 1964 Alaska earthquakes is still dominated by postseismic transientmotions nearly 50 years after these megathrust events (Khazaradze et al. 2002, Zweck et al. 2002),the Sumatra-Andaman earthquake is likely to have modified crustal deformation patterns in theregion for decades to come. Space geodesy and advanced models of relevant deformation processesprovide a unique opportunity to monitor the perturbations to the regional strain field following
the Sumatra-Andaman earthquake and to quantitatively gauge stress changes on the adjacentsegments of the Sunda subduction system, on the Sumatra-Andaman-Sagaing fault system, alongthe Himalaya, and in the western Pacific subduction zones.
PAST MEGATHRUST EVENTS ON THE SUNDA-ANDAMANSUBDUCTION ZONE
The Indian Ocean tsunami of December 26, 2004, reached maximum wave heights of 30 to 50 min Aceh, and there are no historic records of similarly large tsunamis or earthquakes in the easternIndian Ocean. However, recent excavations of coastal deposits in Aceh province of northernSumatra reveal extensive sand sheets with similar sediment characteristics to those laid down in2004, deposited soon after AD 1290–1400 and AD 780–990, that likely resulted from earlier tsunamis(Monecke et al. 2008). Near Phuket, Thailand, Jankaew et al. (2008) also examined sedimentaryevidence for tsunamis and identified two probable precedents for the 2004 tsunami at a grassybeach-ridge plain 125 km north of Phuket, less than 2800 years old. The most recent full-sizepredecessor at this site to the 2004 tsunami occurred at approximately AD 1300–1450. Thus, itdoes appear that prior occurrences of 2004-sized events did occur, but these occurred too longago to have been noted in historic records.
MW 7.7 to 7.9 earthquakes occurred within the 2004 rupture zone in 1881 and 1941 (seeFigure 1), which generated small tsunamis (Bilham 2005). Further south along the Sunda arc, anumber of large earthquakes are known from historical accounts, including a MW ∼ 9 event in1833. Studies of sea-level changes recorded in corals can extend the record back much furtherand suggest that sequences of great earthquakes have occurred south of Aceh approximately everytwo centuries for at least the past 700 years (Sieh et al. 2008). The occurrence of the 2007 MW
7.9 and 8.4 earthquakes in the Mentawai patch, together with the 2005 MW 8.6 Nias earthquaketo the north, raises obvious concern that a larger earthquake on the Mentawai region may strikewithin the next few decades (Sieh et al. 2008). A tsunami from such an event could prove evenmore deadly than the 2004 tsunami, given the large population of Padang and other cities alongthe western coast of Sumatra.
Despite a prescient warning by Cummins (2004) about the tsunami hazard of the Sunda sub-duction zone, the occurrence of the 2004 Sumatra-Andaman earthquake came as a surprise tomany geophysicists because only MW < 8 earthquakes had been recorded in the region, and cat-alogued MW > 9 earthquakes had occurred in areas with young oceanic crust subducting at highrates (Ruff & Kanamori 1980). It appears that we simply have too few examples of great megath-rust earthquakes, particularly from regions with long repeat times, to make reliable generalizationsabout maximum expected earthquake size. In this respect, it is sobering that further southeast fromSumatra along the Sunda arc is the heavily populated island of Java. Like the Andaman section,the subduction rate here is slow, and it was not thought that the region was at large risk for a greatearthquake. Following the 2004 Sumatra-Andaman earthquake, however, it can now be arguedthat this section of the subduction zone is one of the world’s most hazardous, given the size ofits population exposure (McCaffrey 2008). Conversely, GPS-measured interseismic velocities ofthree sites in Java show little arc-normal motion (Socquet et al. 2006) and suggest a rather narrowlocked zone along this section of the megathrust. Another region with unknown but potentiallylarge risk is north of the Andaman Islands, along the Burma coast, where historical and geodeticevidence suggests megathrust earthquakes and tsunamis are possible (Cummins 2007). Under-standing the earthquake potential along the whole megathrust is important, which will requireboth improved characterization of the active elastic strain field and a more complete examinationof past earthquake behavior.
126 Shearer · Burgmann
Ann
u. R
ev. E
arth
Pla
net.
Sci.
2010
.38:
103-
131.
Dow
nloa
ded
from
arj
ourn
als.
annu
alre
view
s.or
gby
Uni
vers
ity o
f C
alif
orni
a -
San
Die
go o
n 05
/06/
10. F
or p
erso
nal u
se o
nly.
EA38CH05-Shearer ARI 23 March 2010 21:46
SUMMARY POINTS
1. The 2004 Sumatra-Andaman earthquake produced huge geophysical signals with world-wide impact, including seismic and tsunami waves, static displacements, and gravitychanges. These have triggered and will continue to trigger seismic and volcanic activity,as stress and geodetic changes will persist for many years from postseismic relaxationprocesses.
2. The earthquake rupture was complex in its details, and different studies have not reachedfull agreement regarding its total moment, rupture velocity, fault geometry, and slipdistribution. However, there is no convincing evidence that the event involved any ex-otic phenomena, such as slow slip, that are not commonly observed for other largeearthquakes.
3. The variability of slip in the event may reflect changes in convergence rate, the degreeof seismic coupling, and/or the slip history in previous events.
4. Simple relations between rate, slab age, or structure of a subduction zone and the max-imum size of events can be misleading. Only in hindsight have we found geologic andgeophysical evidence that shows that the Sumatra-Andaman subduction thrust is capableof generating M > 9 megathrust events. Thus all areas of active subduction should beconsidered at risk of great earthquakes.
FUTURE ISSUES
1. Coseismic slip may have occurred in part on secondary faults within the accretionarywedge, but it is difficult to resolve this from the available seismic and geodetic data.
2. Far-reaching postseismic deformation transients likely include contributions from bothafterslip and viscous relaxation. These transients will impact deformation and stress ratesand thus seismic hazard in the region for decades to come.
3. Improved methods to quickly estimate earthquake size and tsunami potential worldwideare needed to help provide better advance warning of the hazard from future megathrustearthquakes.
DISCLOSURE STATEMENT
The authors are not aware of any affiliations, memberships, funding, or financial holdings thatmight be perceived as affecting the objectivity of this review.
ACKNOWLEDGMENTS
We are very grateful to contributions from Martin Mai, who compiled and plotted the differentmodels shown in Figure 6. Kelly Grijalva created Figure 5, and the gravity data shown in Figure 3are courtesy of John Wahr and Sean Swenson. The Alexander von Humboldt Stiftung supporteda visit by R.B. at the University of Munchen during which the article was written.
Abe K. 1979. Size of great earthquakes of 1837–1974 inferred from tsunami data. J. Geophys. Res. 84:1561–68Ammon CJ, Ji C, Thio HK, Robinson D, Ni SD, et al. 2005. Rupture process of the 2004 Sumatra-Andaman
earthquake. Science 308:1133–39Araki E, Shinohara M, Obana K, Yamada T, Kaneda Y, et al. 2006. Aftershock distribution of the 26 December
Banerjee P. 2005. Interseismic geodetic motion and far-field coseismic surface displacements caused by the26 December 2004 Sumatra earthquake observed from GPS data. Curr. Sci. 88:1491–96
Banerjee P, Pollitz F, Burgmann R. 2005. The size and duration of the Sumatra-Andaman earthquake fromfar-field static offsets. Science 308:1769–72
Banerjee P, Pollitz FF, Nagarajan B, Burgmann R. 2007. Coseismic slip distributions of the 26 December2004 Sumatra-Andaman and 28 March 2005 Nias earthquakes from GPS static offsets. Bull. Seismol. Soc.Am. 97:S86–102
Bilek SL. 2007. Using earthquake source durations along the Sumatra-Andaman subduction system to examinefault-zone variations. Bull. Seismol. Soc. Am. 97:S62–70
Bilham R. 2005. A flying start, then a slow slip. Science 308:1126–27Bilham RG, Engdahl ER, Feldl N, Satyabala SP. 2005. Partial and complete rupture of the Indo-Andaman
plate boundary 1847–2004. Seismol. Res. Lett. 76:299–311Blewitt G, Kreemer C, Hammond WC, Plag HP, Stein S, Okal E. 2006. Rapid determination of earthquake
magnitude using GPS for tsunami warning systems. Geophys. Res. Lett. 33:L11309Braitenberg C, Zadro M. 2007. Comparative analysis of the free oscillations generated by the Sumatra-
Andaman Islands 2004 and the Chile 1960 earthquakes. Bull. Seismol. Soc. Am. 97:S6–17Briggs RW, Sieh K, Meltzner AJ, Natawidjaja D, Galetzka J, et al. 2006. Deformation and slip along the Sunda
Megathrust in the great 2005 Nias-Simeulue earthquake. Science 311:1897–901Burgmann R, Dresen G. 2008. Rheology of the lower crust and upper mantle: evidence from rock mechanics,
geodesy, and field observations. Annu. Rev. Earth Planet. Sci. 36:531–67Cattin R, Chamot-Rooke N, Pubellier M, Rabaute A, Delescluse M, et al. 2009. Stress change and effec-
tive friction coefficient along the Sumatra-Andaman-Sagaing fault system after the 26 December 2004(Mw = 9.2) and the 28 March 2005 (Mw = 8.7) earthquakes. Geochem. Geophys. Geosyst. 10:Q03011
Chen JL, Wilson CR, Tapley BD, Grand S. 2007. GRACE detects coseismic and postseismic deformationfrom the Sumatra-Andaman earthquake. Geophys. Res. Lett. 34:L13302
Chlieh M, Avouac J-P, Hjorleifsdottir V, Song T-R, Ji C, et al. 2007. Coseismic slip and afterslip of the great(Mw 9.15) Sumatra-Andaman earthquake of 2004. Bull. Seismol. Soc. Am. 97:S152–73
Choy GL, Boatwright J. 2007. The energy radiated by the 26 December 2004 Sumatra-Andaman earthquakeestimated from 10-minute P-wave windows. Bull. Seismol. Soc. Am. 97:S18–24
Cifuentes IL, Silver PG. 1989. Low-frequency source characteristics of the great 1960 Chilean earthquake.J. Geophys. Res. 94(B1):643–63
Cummins P. 2004. Small threat, but warning sounded for tsunami research. Aus. Geo. News 75:4–7Cummins PR. 2007. The potential for giant tsunamigenic earthquakes in the northern Bay of Bengal. Nature
449:75–78Curray JR. 2005. Tectonics and history of the Andaman Sea region. J. Asian Earth Sci. 25:187–232de Groot-Hedlin CD. 2005. Estimation of the rupture length and velocity of the Great Sumatra earthquake
of Dec 26, 2004 using hydroacoustic signals. Geophys. Res. Lett. 32:L11303de Linage C, Rivera L, Hinderer J, Boy JP, Rogister Y, et al. 2009. Separation of coseismic and postseismic
gravity changes for the 2004 Sumatra-Andaman earthquake from 4.6 yr of GRACE observations andmodelling of the coseismic change by normal-modes summation. Geophys. J. Int. 176:695–714
Delescluse M, Chamot-Rooke N. 2006. Instantaneous deformation and kinematics of the India-Australiaplate. Geophys. J. Int. 168:818–42
Dewey JW, Choy G, Presgrave B, Sipkin S, Tarr AC, et al. 2007. Seismicity associated with the Sumatra-Andaman Islands earthquake of 26 December 2004. Bull. Seismol. Soc. Am. 97:S25–42
128 Shearer · Burgmann
Ann
u. R
ev. E
arth
Pla
net.
Sci.
2010
.38:
103-
131.
Dow
nloa
ded
from
arj
ourn
als.
annu
alre
view
s.or
gby
Uni
vers
ity o
f C
alif
orni
a -
San
Die
go o
n 05
/06/
10. F
or p
erso
nal u
se o
nly.
EA38CH05-Shearer ARI 23 March 2010 21:46
Engdahl ER, Villasenor A, DeShon HR, Thurber CH. 2007. Teleseismic relocation and assessment of seis-micity (1918–2005) in the region of the 2004 Mw 9.0 Sumatra-Andaman and 2005 Mw 8.6 Nias Islandgreat earthquakes. Bull. Seismol. Soc. Am. 97:S43–61
Fujii Y, Satake K. 2007. Tsunami source of the 2004 Sumatra-Andaman earthquake inferred from tide gaugeand satellite data. Bull. Seismol. Soc. Am. 97:S192–207
Gahalaut VK, Catherine JK, Jade S, Gireesh R, Gupta DC, et al. 2008a. No evidence of unusually large post-seismic deformation in Andaman region immediately after 2004 Sumatra-Andaman earthquake. Geophys.Res. Lett. 35:L10307
Gahalaut VK, Jade S, Catherine JK, Gireesh R, Ananda MB, et al. 2008b. GPS measurements of postseismicdeformation in the Andaman-Nicobar region following the giant 2004 Sumatra-Andaman earthquake.J. Geophys. Res. 113:B08401
Gahalaut VK, Nagarajan B, Catherine JK, Kumar S. 2006. Constraints on 2004 Sumatra-Andaman earthquakerupture from GPS measurements in Andaman-Nicobar islands. Earth Planet. Sci. Lett. 242:365–74
Geist EL, Titov VV, Arcas D, Pollitz FF, Bilek SL. 2007. Implications of the 26 December 2004 Sumatra-Andaman earthquake on tsunami forecast and assessment models for great subduction-zone earthquakes.Bull. Seismol. Soc. Am. 97:S249–70
Gudmundsson O, Sambridge M. 1998. A regionalized upper mantle (RUM) model. J. Geophys. Res. 103:7121–36
Guilbert J, Vergoz J, Schissele E, Roueff A, Cansi Y. 2005. Use of hydroacoustic and seismic arrays to observerupture propagation and source extent of the Mw = 9.0 Sumatra earthquake. Geophys. Res. Lett. 32:L15310
Gusev AA, Guseva EM, Panza GF. 2007. Size and duration of the high-frequency radiator in the source ofthe 2004 December 26 Sumatra earthquake. Geophys. J. Int. 170:1119–28
Han SC, Sauber J, Luthcke SB, Ji C, Pollitz FF. 2008. Implications of postseismic gravity change following thegreat 2004 Sumatra-Andaman earthquake from the regional harmonic analysis of GRACE intersatellitetracking data. J. Geophys. Res. 113:B11413
Han SC, Shum CK, Bevis M, Ji C, Kuo CY. 2006. Crustal dilatation observed by GRACE after the 2004Sumatra-Andaman earthquake. Science 313:658–62
Hashimoto M, Choosakul N, Hashizume M, Takemoto S, Takigucki H, et al. 2006. Crustal deformationsassociated with the great Sumatra-Andaman earthquake deduced from continuous GPS observation.Earth Planet. Space 58:127–39
Hayes GP, Wald DJ. 2009. Developing framework to constrain the geometry of the seismic rupture plane onsubduction interfaces a priori: a probabilistic approach. Geophys. J. Int. 176:951–64
Houston H, Kanamori H. 1986. Source spectra of great earthquakes: teleseismic constraints on rupture processand strong motion. Bull. Seismol. Soc. Am. 76:19–42
Hsu YJ, Simons M, Avouac JP, Galetzka J, Sieh K, et al. 2006. Frictional afterslip following the 2005 Nias-Simeulue earthquake, Sumatra. Science 312:1921–26
Ishii M, Shearer PM, Houston H, Vidale JE. 2005. Extent, duration and speed of the 2004 Sumatra-Andamanearthquake imaged by the Hi-Net array. Nature 435:933–36
Ito Y, Obara K, Shiomi K, Sekine S, Hirose H. 2007. Slow earthquakes coincident with episodic tremors andslow slip events. Science 315:503–6
Jade S, Ananda M, Kumar P, Banerjee S. 2005. Co-seismic and post-seismic displacements in Andaman andNicobar islands from GPS measurements. Curr. Sci. 88:1980–84
Jankaew K, Atwater BF, Sawai Y, Choowong M, Charoentitirat T, et al. 2008. Medieval forewarning of the2004 Indian Ocean tsunami in Thailand. Nature 455:1228–31
Kanamori H. 2006a. Lessons from the 2004 Sumatra-Andaman earthquake. Philos. Trans. R. Soc. A 364:1927–45
Kanamori H. 2006b. Seismological aspects of the December 2004 great Sumatra-Andaman earthquake. Earthq.Spectra 22:S1–12
Kanamori H. 2006c. The radiated energy of the 2004 Sumatra-Andaman earthquake. In Earthquakes: RadiatedEnergy and the Physics of Faulting, ed. R Abercrombie, A McGarr, H Kanamori, G Di Toro, pp. 59–68.AGU Geophys. Monogr. Ser. 170. Washington, DC: AGU
Kayanne H, Ikeda Y, Echigo T, Shishikura M, Kamataki T, et al. 2007. Coseismic and postseismic creep in theAndaman Islands associated with the 2004 Sumatra-Andaman earthquake. Geophys. Res. Lett. 34:L01310
Khazaradze G, Wang K, Klotz J, Hu Y, He J. 2002. Prolonged post-seismic deformation of the 1960 greatChile earthquake and implications for mantle rheology. Geophys. Res. Lett. 29:2050
Konca AO, Avouac J-P, Sladen A, Meltzner AJ, Sieh K, et al. 2008. Partial rupture of a locked patch of theSumatra megathrust during the 2007 earthquake sequence. Nature 456:631–35
Kreemer C, Blewitt G, Hammond WC, Plag HP. 2006. Global deformation from the great 2004 Sumatra-Andaman Earthquake observed by GPS: implications for rupture process and global reference frame.Earth Planet. Space 58:141–48
Kruger F, Ohrnberger M. 2005a. Spatio-temporal source characteristics of the 26 December 2004 Sumatraearthquake as imaged by teleseismic broadband arrays. Geophys. Res. Lett. 32:L24312
Kruger F, Ohrnberger M. 2005b. Tracking the rupture of the Mw = 9.3 Sumatra earthquake over 1150 kmat teleseismic distance. Nature 435:937–39
Lambotte S, Rivera L, Hinderer J. 2006. Rupture length and duration of the 2004 Aceh-Sumatra earthquakefrom the phases of the Earth’s gravest free oscillations. Geophys. Res. Lett. 33:L03307
Lambotte S, Rivera L, Hinderer J. 2007. Constraining the overall kinematics of the 2004 Sumatra and the2005 Nias earthquakes using the Earth’s gravest free oscillations. Bull. Seismol. Soc. Am. 97:S128–38
Langbein J, Murray JR, Snyder HA. 2006. Coseismic and initial postseismic deformation from the 2004Parkfield, California, earthquake, observed by global positioning system, electronic distance meter, creep-meters, and borehole strainmeters. Bull. Seismol. Soc. Am. 96:S304–20
Lay T, Kanamori H, Ammon CJ, Nettles M, Ward SN, et al. 2005. The great Sumatra-Andaman earthquakeof December 26, 2004. Science 308:1127–33
Lomax A. 2005. Rapid estimation of rupture extent for large earthquakes: application to the 2004, M9 Sumatra-Andaman mega-thrust. Geophys. Res. Lett. 32:L10314
Masterlark T, Hughes KLH. 2008. Next generation of deformation models for the 2004 M9 Sumatra-Andaman earthquake. Geophys. Res. Lett. 35:L19310
McCaffrey R. 2008. Global frequency of magnitude 9 earthquakes. Geology 36:263–66McCaffrey R. 2009. The tectonic framework of the Sumatran subduction zone. Annu. Rev. Earth Planet. Sci.
37:345–66Meltzner A, Sieh K, Abrams M, Agnew DC, Hudnut KW, et al. 2006. Uplift and subsidence associated with
the great Aceh-Andaman earthquake of 2004. J. Geophys. Res. 111:B02407Monecke K, Finger W, Klarer D, Kongko W, McAdoo BG, et al. 2008. A 1000-year sediment record of
tsunami recurrence in northern Sumatra. Nature 455:1232–34Nalbant SS, Steacy S, Sieh K, Natawidjaja D, McCloskey J. 2005. Earthquake risk on the Sunda trench. Nature
435:756–57Natawidjaja DH, Sieh K, Chlieh M, Galetzka J, Suwargadi BW, et al. 2006. Source parameters of the great
Sumatran megathrust earthquakes of 1797 and 1833 inferred from coral microatolls. J. Geophys. Res.111:B06403
Neetu S, Suresh I, Shankar R, Shankar D, Shenoi SSC, et al. 2005. Comment on “The great Sumatra-Andamanearthquake of 26 December 2004.” Science 310:1431
Ni S, Kanamori H, Helmberger D. 2005. Seismology: energy radiation from the Sumatra earthquake. Nature434:582
Ogawa R, Heki K. 2007. Slow postseismic recovery of geoid depression formed by the 2004 Sumatra-Andamanearthquake by mantle water diffusion. Geophys. Res. Lett. 34:L06313
Panet I, Mikhailov V, Diament M, Pollitz F, King G, et al. 2007. Coseismic and post-seismic signatures ofthe Sumatra 2004 December and 2005 March earthquakes in GRACE satellite gravity. Geophys. J. Int.171:177–90
Paul J, Lowry AR, Bilham R, Sen S, Smalley R. 2007. Postseismic deformation of the Andaman Islandsfollowing the 26 December, 2004 Great Sumatra-Andaman earthquake. Geophys. Res. Lett. 34:L19309
Piatanesi A, Lorito S. 2007. Rupture process of the 2004 Sumatra-Andaman earthquake from tsunami wave-form inversion. Bull. Seismol. Soc. Am. 97:S223–31
Pietrzak J, Socquet A, Ham D, Simons W, Vigny C, et al. 2007. Defining the source region of the IndianOcean Tsunami from GPS, altimeters, tide gauges and tsunami models. Earth Planet. Sci. Lett. 261:49–64
Plafker G, Nishenko S, Cluff L, Syahrial M. 2006. The cataclysmic 2004 tsunami on NW Sumatra: preliminaryevidence for a near-field secondary source along the western Aceh basin. Seismol. Res. Lett. 77:231 (Abstr.)
130 Shearer · Burgmann
Ann
u. R
ev. E
arth
Pla
net.
Sci.
2010
.38:
103-
131.
Dow
nloa
ded
from
arj
ourn
als.
annu
alre
view
s.or
gby
Uni
vers
ity o
f C
alif
orni
a -
San
Die
go o
n 05
/06/
10. F
or p
erso
nal u
se o
nly.
EA38CH05-Shearer ARI 23 March 2010 21:46
Pollitz F, Banerjee P, Grijalva K, Nagarajan B, Burgmann R. 2008. Effect of 3-D viscoelastic structure onpost-seismic relaxation from the 2004 M = 9.2 Sumatra earthquake. Geophys. J. Int. 173:189–204
Pollitz F, Burgmann R, Banerjee P. 2006a. Postseismic relaxation following the great 2004 Sumatra-Andamanearthquake on a compressible self-gravitating Earth. Geophys. J. Int. 167:397–420
Pollitz F, Burgmann R, Romanowicz B. 1998. Viscosity of oceanic asthenosphere inferred from remote trig-gering of earthquakes. Science 280:1245–49
Pollitz FF, Banerjee P, Burgmann R, Hashimoto M, Chhoosakul N. 2006b. Stress changes along the Sundatrench following the 26 December 2004 Sumatra-Andaman and 28 March 2005 Nias earthquakes. Geophys.Res. Lett. 33:L06309
Rhie J, Dreger DS, Burgmann R, Romanowicz B. 2007. Slip of the 2004 Sumatra-Andaman earthquake fromjoint inversion of long period global seismic waveforms and GPS static offsets. Bull. Seismol. Soc. Am.97:S115–27
Rogers G, Dragert H. 2003. Episodic tremor and slip on the Cascadia subduction zone: the chatter of silentslip. Science 300:1942–43
Ruff L, Kanamori H. 1980. Seismicity and the subduction process. Phys. Earth Planet. Int. 23:240–52Satake K, Atwater BF. 2007. Long-term perspectives on giant earthquakes and tsunamis at subduction zones.
Annu. Rev. Earth Planet. Sci. 35:349–74Segall P, Davis JL. 1997. GPS applications for geodynamics and earthquake studies. Annu. Rev. Earth Planet.
Sci. 25:301–36Sibuet JC, Rangin C, Le Pichon X, Singh S, Cattaneo A, et al. 2007. 26th December 2004 great Sumatra-
Andaman earthquake: co-seismic and post-seismic motions in northern Sumatra. Earth Planet. Sci. Lett.263:88–103
Sieh K, Natawidjaja DH, Meltzner AJ, Shen C-C, Cheng H, et al. 2008. Earthquake supercycles inferred fromsea-level changes recorded in the corals of West Sumatra. Science 322:1674–78
Singh SC, Carton H, Tapponnier P, Hananto ND, Chauhan APS, et al. 2008. Seismic evidence for brokenoceanic crust in the 2004 Sumatra earthquake epicentral region. Nat. Geosci. 1:777–81
Socquet A, Vigny C, Chamot-Rooke N, Simons W, Rangin C, Ambrosius B. 2006. India and Sunda plates mo-tion and deformation along their boundary in Myanmar determined by GPS. J. Geophys. Res. 111:B05406
Song YT, Ji C, Fu L-L, Zlotnicki V, Shum CK, et al. 2005. The 26 December 2004 tsunami source estimatedfrom satellite radar altimetry and seismic waves. Geophys. Res. Lett. 32:L20601
Stein S, Okal EA. 2005. Speed and size of the Sumatra earthquake. Nature 434:581–82Stein S, Okal EA. 2007. Ultralong period seismic study of the December 2004 Indian Ocean earthquake and
implications for regional tectonics and the subduction process. Bull. Seismol. Soc. Am. 97:S279–95Subarya C, Chlieh M, Prawirodirdjo L, Avouac JP, Bock Y, et al. 2006. Plate-boundary deformation associated
with the great Sumatra-Andaman earthquake. Nature 440:46–51Titov V, Rabinovich AB, Mofjeld HO, Thomson RE, Gonzalez FI. 2005. The global reach of the 26 December
2004 Sumatra tsunami. Science 309:2045–48Tolstoy M, Bohnenstiehl DR. 2005. Hydroacoustic constraints on the rupture duration, length, and speed of
the great Sumatra-Andaman earthquake. Seismol. Res. Lett. 76:419–25Tolstoy M, Bohnenstiehl DR. 2006. Hydroacoustic contributions to understanding the December 26th 2004
great Sumatra-Andaman Earthquake. Surv. Geophys. 27:633–46Tsai VC, Nettles M, Ekstrom G, Dziewonski AM. 2005. Multiple CMT source analysis of the 2004 Sumatra
earthquake. Geophys. Res. Lett. 32:L17304Vallee M. 2007. Rupture properties of the giant Sumatra earthquake imaged by empirical Green’s function
analysis. Bull. Seismol. Soc. Am. 97:S103–14Vigny C, Simons WJF, Abu S, Bamphenyu R, Satirapod C, et al. 2005. Insight into the 2004 Sumatra-Andaman
earthquake from GPS measurements in southeast Asia. Nature 436:201–6Zweck C, Freymueller JT, Cohen SC. 2002. The 1964 great Alaska earthquake: present day and cumulative
postseismic deformation in the western Kenai Peninsula. Phys. Earth Planet. Int. 132:5–20
Length and Timescales of Rift Faulting and Magma Intrusion:The Afar Rifting Cycle from 2005 to PresentCynthia Ebinger, Atalay Ayele, Derek Keir, Julie Rowland, Gezahegn Yirgu,