194
LETTER TO SHAREHOLDERS LOEWS CORPORATION ANNUAL REPORT 2016

L E T T E R T O S H A R E H O L D E R S
LOEWS COR POR ATION
ANNUAL REPORT 2016

FINANCIAL HIGHLIGHTS 2016
WHERE YOU CAN FIND MORE INFORMATION: THIS ANNUAL REPORT 2016 LETTER TO SHAREHOLDERS SUMMARIZES CERTAIN INFORMATION ABOUT LOEWS AND ITS SUBSIDIARIES AND SHOULD BE READ IN CONJUNCTION WITH OUR ANNUAL REPORT ON FORM 10-K FOR THE YEAR ENDED DECEMBER 31, 2016 AND THE OTHER REPORTS WE REGULARLY FILE WITH THE SECURITIES AND EXCHANGE COMMISSION, ALL OF WHICH ARE AVAILABLE TO THE PUBLIC AT OUR WEBSITE (WWW.LOEWS.COM) OR AT THE SEC’S WEBSITE (WWW.SEC.GOV).
RESULTS OF OPERATIONS
Consolidated net income for 2016 was $654 million, or $1.93 per share, compared to $260 million, or $0.72 per share, in 2015. Net income for 2016 included asset impairment charges of $267 million (after tax and noncontrolling interests) at Diamond Offshore. Net income for 2015 included asset impairment charges of $341 million (after tax and noncontrolling interests) at Diamond Offshore and a reserve charge of $177 million (after tax and noncontrolling interests) related to the long term care business at CNA.
Net income attributable to Loews Corporation for 2016 increased compared to the prior year period primarily due to the impact of the reserve charge at CNA in 2015 and the asset impairment charges at Diamond Offshore, which were lower in 2016 compared to 2015. Absent these charges, net income increased $143 million due to higher earnings at CNA and Boardwalk Pipeline and improved results from the parent company investment portfolio. These increases were partially offset by lower earnings at Diamond Offshore.
Excluding the reserve charge in 2015, CNA’s earnings increased due to higher net investment income driven by limited partnership investments, higher favorable net prior year reserve development and realized investment gains in 2016 compared to losses in the prior year. These increases were partially offset by an increase in the current accident year loss ratio and higher underwriting expenses.
Excluding asset impairment charges in 2015 and 2016, Diamond Offshore’s year-over-year earnings decreased as a result of a substantial reduction in the number of operating rigs, partially offset by revenue earned by newbuild drillships and lower depreciation expense as a result of the asset impairment charges.
Boardwalk Pipeline’s earnings increased due to growth projects recently placed in service, new rates in effect following the Gulf South rate case, higher parking and lending and storage revenues and the return to service of the Evangeline pipeline.
Loews Hotels’ net income in 2016 was consistent with 2015 as increases in revenues were offset by higher expenses and an $8 million (after tax) impairment of an equity interest in a joint venture hotel property.
Income generated by the parent company investment portfolio improved due to higher income from fixed income and equity securities.
At December 31, 2016, excluding accumulated other comprehensive income, the book value per share of Loews common stock was $54.62 as compared to $52.72 at December 31, 2015.
At December 31, 2016, there were 336.6 million shares of Loews common stock outstanding. In 2016, the Company purchased 3.4 million shares of its common stock at an aggregate cost of $134 million.
YEAR ENDED DECEMBER 31 (In millions, except per share data) 2016 2015 2014 2013 2012
RESULTS OF OPERATIONS:
REVENUES $ 13,105 $ 13,415 $ 14,325 $ 14,613 $ 14,072
INCOME BEFORE INCOME TAX 936 244 1,810 2,277 2,022
INCOME FROM CONTINUING OPERATIONS 716 287 1,353 1,621 1,509
DISCONTINUED OPERATIONS, NET (391) (552) (399)
NET INCOME 716 287 962 1,069 1,110
AMOUNTS ATTRIBUTABLE TO NONCONTROLLING INTERESTS (62) (27) (371) (474) (542)
NET INCOME ATTRIBUTABLE TO LOEWS CORPORATION $ 654 $ 260 $ 591 $ 595 $ 568
NET INCOME ATTRIBUTABLE TO LOEWS CORPORATION:
INCOME FROM CONTINUING OPERATIONS $ 654 $ 260 $ 962 $ 1,149 $ 968
DISCONTINUED OPERATIONS, NET (371) (554) (400)
NET INCOME $ 654 $ 260 $ 591 $ 595 $ 568
DILUTED NET INCOME PER SHARE:
INCOME FROM CONTINUING OPERATIONS $ 1.93 $ 0.72 $ 2.52 $ 2.95 $ 2.44
DISCONTINUED OPERATIONS, NET (0.97) (1.42) (1.01)
NET INCOME $ 1.93 $ 0.72 $ 1.55 $ 1.53 $ 1.43
FINANCIAL POSITION:
INVESTMENTS $ 50,711 $ 49,400 $ 52,032 $ 52,945 $ 53,040
TOTAL ASSETS 76,594 76,006 78,342 79,913 79,997
DEBT
PARENT COMPANY 1,775 1,679 1,680 1,678 693
SUBSIDIARIES 9,003 8,881 8,963 8,640 7,783
SHAREHOLDERS’ EQUITY 18,163 17,561 19,280 19,458 19,459
CASH DIVIDENDS PER SHARE 0.25 0.25 0.25 0.25 0.25
BOOK VALUE PER SHARE 53.96 51.67 51.70 50.25 49.67
SHARES OUTSTANDING 336.62 339.90 372.93 387.21 391.81

OUR PORTFOLIO OF BUSINESSES
Loews’s assets currently consist of three publicly-traded subsidiaries: CNA Financial, Diamond Offshore Drilling, and Boardwalk Pipeline Partners; and Loews Hotels, a wholly owned subsidiary; as well as a large portfolio of cash and investments.
Our unique structure gives us the freedom to make investments and acquisitions across a broad spectrum of industries, wherever we see opportunity.
CNA FINANCIALNYSE Symbol – CNAOwned – 90%Industry – Commercial Property & Casualty InsuranceCEO – Dino E. Robusto
CNA Financial Corporation was founded in 1897 and has been headquartered in Chicago since 1900. In 2017, CNA is celebrating its 120th year in business. As one of the largest property and casualty insurance organizations in the United States, CNA provides business insurance protection to more than one million businesses and professionals in the U.S. and internationally. Today, CNA has more than 80 offices around the world. CNA’s insurance products include standard commercial lines, specialty lines, surety and other property and casualty coverage.
www.cna.com
DIAMOND OFFSHORE DRILLINGNYSE Symbol – DOOwned – 53%Industry – Offshore DrillingCEO – Marc Edwards
Diamond Offshore Drilling, Inc. provides contract drilling services to the global energy industry. Diamond is a leader in deepwater drilling and has a strong and liquid balance sheet. The company’s fleet consists of 24 offshore drilling rigs including 19 semisubmersibles, four dynamically positioned drillships and one jack-up.
www.diamondoffshore.com
BOARDWALK PIPELINE PARTNERSNYSE Symbol – BWPOwned – 51%Industry – Natural Gas & Liquids Pipelines & StorageCEO – Stanley C. Horton
Boardwalk Pipeline Partners L.P. is a midstream master limited partnership that primarily transports and stores natural gas and natural gas liquids for its customers. Boardwalk owns and operates approximately 14,365 miles of natural gas and liquids pipelines. Additionally, Boardwalk owns and operates natural gas and liquids underground storage facilities.
www.bwpmlp.com
LOEWS HOTELSOwned – 100%Industry – Luxury LodgingCEO – Jonathan M. Tisch
Loews Hotels owns and/or operates 24 hotels and resorts in the United States and Canada. Located in major city centers and resort destinations from coast to coast, the Loews portfolio features one-of-a-kind properties that go beyond Four Diamond standards to delight guests with exciting, approachable and local travel experiences.
www.loewshotels.com

$1,600 REVENUE
2,800 EMPLOYEES
24 RIG FLEET
$9,366 REVENUE
6,700 EMPLOYEES
4,900 WORLDWIDE AGENTS & BROKERS
80 WORLDWIDE FIELD OFFICES
$45,420 INVESTED ASSETS
$1,293 CHAIN-WIDE REVENUE
12,221 CHAIN-WIDE GUEST ROOMS
24 CHAIN-WIDE HOTELS WITH 2 UNDER DEVELOPMENT
9,800 CHAIN-WIDE EMPLOYEES
$1,307 REVENUE
6.3 Bcf AVERAGE DAILY THROUGHPUT
1,280 EMPLOYEES
14,365 TOTAL MILES OF PIPELINE
205 Bcf UNDERGROUND GAS STORAGE
BY THE NUMBERS(Year ended December 31, 2016, $ in millions)

JONATHAN M. TISCH
Co-Chairman of the Board of Loews, Chairman and Chief Executive Officer of Loews Hotels
JAMES S. TISCH
President and Chief Executive Officer of Loews
ANDREW H. TISCH
Co-Chairman of the Board of Loews, and Chairman of the Executive Committee of Loews
Let’s cut to the chase.
For this year’s letter, instead of comprehensively reviewing 2016, we thought we’d start by addressing the two questions we have heard most often from shareholders lately:
• Why did we purchase relatively few Loews shares in 2016?• Why hasn’t Loews made an acquisition recently?
The answers to these questions illustrate our fundamental approach to creating long-term shareholder value, and the ways in which we allocate capital to achieve that goal.
TO OUR SHAREHOLDERS
ANNUAL REPORT 2016 1

In 2016 we purchased 3.4 million shares of Loews stock, or about 1% of our outstanding shares, at an average price of just under $39 per share. About 2.6 million of those shares were repurchased during the first half of the year. As the equity markets climbed to record heights during the second half of 2016, and Loews’s common stock moved along with them, we chose to exercise caution. In hindsight, we could have repurchased more of our shares early in the year, when Loews stock was trading at lower prices and the S&P 500 was well below its recent levels. Alas, it must be time to get a new crystal ball!
Unlike some companies, we do not repurchase our stock robotically or set annual repurchase quotas. Rather, we seek to buy back our stock when it’s below our estimation of its intrinsic value and when prevailing market conditions seem conducive. While we remain positive on our shares and see great potential for our subsidiaries, we did not see the wisdom of buying back shares in an exuberant equity market. We are more comfortable buying back our shares when the market is not hitting new highs. Over the span of time, measured in years and decades, we are proud of our record and we feel that our share repurchases have created significant value for our shareholders.
As for the second question, we continue to kick tires on potential acquisitions, looking for the right acquisition at the right price. Valuations in the merger market have made our search difficult and frustrating. The merger market today is being driven by large numbers of corporate buyers, as well as by private equity funds which are under pressure to put their capital to work. The abundance of private capital combined with the amount of leverage available at remarkably low rates has enabled private equity firms to pay generous prices for companies that haven’t already been gobbled up by strategic buyers.
Our focus drives us to invest only when all the pieces of a transaction — from valuation, to potential cash flow, to future industry dynamics — add up to a solid investment. To date, we have not found a potential acquisition where all the pieces fit together the way we believe they should. It’s a tough market in which to be a disciplined buyer.
That said, our liquidity gives us tremendous strategic and financial flexibility. We will never stop using our best judgment to balance risk and reward to build value for all shareholders. And we are confident that, despite today’s market exuberance, we will find desirable opportunities in the future.
LOEWS CORPORATION2

ALLOCATING CAPITAL AND CREATING SHAREHOLDER VALUE
As we’ve often said, we are committed to our longstanding philosophy of creating value for all our shareholders. We view our primary job as being effective capital allocators — finding attractive investments with the potential to create value over the short, medium and long-term. We thought it would be useful to review the four ways we allocate our capital and manage Loews’s financial resources to drive shareholder value. We can:
• Return capital to shareholders, largely through share repurchases;
• Use holding company liquidity to invest in, or alongside, our existing subsidiaries;
• Acquire new businesses, though corporate acquisitions for us are admittedly rare; and
• Maintain holding company cash and investments. We are comfortable maintaining substantial holding company liquidity because it enables us to take advantage of opportunities as they arise, as well as to protect ourselves during turbulent times.
We focus on achieving attractive risk-adjusted returns when allocating our capital, essentially utilizing a hurdle rate of return for each specific potential use of parent company liquidity based on our perception of the risks and rewards of the investment. Given that share repurchases involve investing in something we know well — our existing businesses — they require a relatively low risk-adjusted return. The next rung on our investment ladder is investing in our subsidiaries. We know these businesses and their industries very well. In general, the required risk-adjusted return for these projects is slightly higher than share repurchases. Acquisitions at the holding company level compete for capital with share repurchases and with investing in our subsidiaries. In view of the greater risks of investing in a new business, the risk-adjusted hurdle rate is the highest of our capital allocation options, and underscores why acquisitions at the holding company level happen infrequently.
Let’s look at each potential use of capital in more detail.
SHARE BUYBACKS
We have a long history of share repurchases, having used this tool to create value long before it became popular. Over each of the last five decades, we have repurchased more than one-quarter of our outstanding shares. As we stated earlier, we aim to buy back our shares when the market is not reaching new highs. When we evaluate share repurchases, many factors go into the equation, including the price of Loews’s shares, the price of our subsidiaries’ shares, our assessment of our subsidiaries’ intrinsic value, the state of the equity markets, and the value we ascribe to our non-public businesses.
While our share repurchases were relatively modest in 2016, this came on the heels of the repurchase of 9% of our shares for $1.3 billion in 2015 — the highest number of shares we have ever repurchased in a single year. We believe our longstanding practice of buying back our shares has greatly enhanced the long-term outperformance of Loews’s share price relative to the S&P 500.
INVESTING IN OUR SUBSIDIARIES TO SUPPORT GROWTH
The second way we create value is by using holding company liquidity to help our subsidiaries grow. Since 2010, our subsidiaries and their partners have invested or committed more than $10 billion to capital projects and acquisitions. Such investments have enabled Boardwalk Pipeline Partners to launch a series of strategic capacity expansion projects; they have allowed Diamond Offshore Drilling to upgrade its fleet; and they have helped Loews Hotels develop, acquire and renovate numerous properties, extend its market presence and enhance its offerings to guests.
Over the years, we have deployed holding company cash to help our subsidiaries execute transactions when we considered it in the best interest of Loews’s shareholders. Most of our subsidiaries’ capital projects and acquisitions have been self-funded, but from time to time over the past few years, we have provided bridge financing or other funding, particularly to Boardwalk and Loews Hotels.
ANNUAL REPORT 2016 3

SHARES OUTSTANDING SINCE 2006 (adjusted for splits)
In every decade since 1970 we have repurchased more than one-quarter of our outstanding shares.
Since 2006 we have reduced our shares outstanding by
NEARLY 40%.
20162015201420132012201120102009200820072006
544 MILLION
530 MILLION
435 MILLION
425 MILLION
415 MILLION
397 MILLION
392 MILLION
387 MILLION
373 MILLION 340 MILLION
337 MILLION
250
300
350
400
450
500
550
Includes retirement of 93.5 million shares in connection with the separation of Lorillard in 2008.
LOEWS CORPORATION4

At Boardwalk, when attractive capital markets funding has not been available or when flexible forms of financing were required, Loews has stepped in and provided bridge financing. We work closely with Boardwalk’s management team to hone their financing plans, and our cash position enables us to utilize parent company capital in projects with attractive risk-adjusted returns for Loews and Boardwalk. We were able to do just that in 2012 when we helped Boardwalk purchase Louisiana Midstream. At the time, advantageous capital markets funding was not available to Boardwalk, so Loews jointly acquired the assets with Boardwalk. Shortly following the acquisition, Boardwalk obtained third-party financing in order to purchase Loews’s stake in Louisiana Midstream. This acquisition allowed Boardwalk to enter the natural gas liquids storage and distribution business. Today, Boardwalk is able to take advantage of the revival of the U.S. petrochemical industry due to this strategic acquisition made in 2012.
We have also provided equity capital to support Loews Hotels’ acquisition, development and renovation activities. Having access to our capital is a distinct advantage for Loews Hotels, because it enables the company to move quickly and decisively to secure properties. Since 2012 Loews Hotels has grown from a chain of 18 hotels to 24 hotels. And in that same period, the number of Loews Hotels rooms has increased 50%, from just over 8,000 to more than 12,000.
Included in this new group of properties is the company’s fifth hotel in Orlando, the 1,000-room Loews Sapphire Falls Resort. This project builds on our very successful 15-year partnership with Universal Studios.
POTENTIAL ACQUISITIONS: DISCIPLINED CAPITAL SEEKING OPPORTUNITY
While corporate level acquisitions by Loews are rare, that doesn’t mean we aren’t continually reviewing potential opportunities. Maintaining a substantial liquidity position allows us to move swiftly and decisively when considering an acquisition. Typically, we look to make an initial equity investment in the range of $500 million to $1.5 billion, with the ability to invest additional
equity once we have grown even more comfortable with the company and its risks and opportunities.
We use an extremely disciplined approach when we explore acquisitions. A potential “new leg to the stool” competes with other uses of our capital such as share repurchases — so we meticulously review all opportunities. In making an acquisition at the holding company level, we’re seeking the right deal at the right price — either a company with good cash-on-cash returns and strong secular growth trends, or undervalued assets at an attractive entry point in the cycle.
As we’ve said before, we are not seeking to add another insurance or energy business at the Loews corporate level. However, we would consider expanding our presence in those sectors through bolt-on acquisitions by our subsidiaries.
In simple terms, we’re looking for businesses that can stand the test of time and create value for us over the long term. We avoid businesses that are especially vulnerable to technological disruption or management miscalculations of consumer demand, such as retail, fashion or hi-tech. When we do stake out a presence in a new sector, we prefer to do so by establishing a platform upon which we can build, as we did with Diamond and Boardwalk, rather than make a large acquisition. We do look for businesses based in the United States, although it’s fine if they have significant global operations.
MAINTAINING LIQUIDITY
After looking at all of these alternatives, if we think there’s nothing to do with our cash, we are comfortable allowing cash and investments to accumulate. We’ve seen time and again that there is value in maintaining liquidity during both good and challenging times.
ANNUAL REPORT 2016 5

PRINCIPAL DEBT MATURITY PROFILELong-term debt maturities are staggered
TOTAL PARENT COMPANY DEBT AS OF DECEMBER 31, 2016: $1.8 BILLION
$0
$100
$200
$300
$400
$500
2043203520262023
$500
2.63%Senior Notes
3.75%Senior Notes
6.00%Senior Notes
4.13%Senior Notes
$500 $500
$300
($ m
illi
ons
)
DIVIDENDS PAID TO LOEWS AND NET INVESTMENT INCOME
20162015201420132012201120102009200820072006
CNA FINANCIAL DIAMOND OFFSHORE BOARDWALK PIPELINE2 CORPORATE3
Dividends1
1. Excludes dividends received from former subsidiaries.2. Includes Loews’s common units and GP interest in BWP. 3. Parent company pretax net investment income.
($ m
illi
ons
)
$0
$200
$400
$600
$800
$1,000 $926
$838$876$877
$744
$617
$823
$1,000
$665
$939
$608
LOEWS CORPORATION6

BALANCE SHEET STRENGTH
Our ability to execute any of these value-creation strategies is supported by a conservatively capitalized and highly liquid balance sheet. One source of cash flow for Loews is earnings on the holding company’s portfolio of cash and investments. However, the primary source of Loews’s cash flow is dividends received from our subsidiaries. Most recently, CNA Financial has been the main source of such dividends, which totaled $2.1 billion over the past four years. In February of 2017, CNA’s board of directors declared a special dividend of $2.00 per CNA share, for a payment of almost $485 million to Loews in the 2017 first quarter. This is on top of the $243 million we expect to receive from CNA in 2017 through its $0.25 per share quarterly dividend. Five years ago, however, it was Diamond and Boardwalk that contributed the majority of dividends to Loews. This evolution underscores the benefit to our shareholders of a portfolio of diverse businesses.
The cornerstone of our capacity to create value for Loews shareholders is our financial strength. While we never know when new opportunities will present themselves, we do know that strong companies are best positioned to withstand adversity and to capitalize on opportunities when they arise. For this reason, one of our basic principles in managing our capital is to maintain relatively low levels of holding company debt so that we can service all holding company obligations in any foreseeable financial environment without difficulty. In this regard, Loews had $1.8 billion in debt at the end of 2016, with the first maturity coming due in 2023, compared to Loews’s market capitalization of approximately $16 billion.
At the end of 2016, our portfolio of cash and investments totaled over $5 billion. Most of these funds are investments in high quality money market instruments, mainly U.S. Treasury bills. The remainder of the portfolio is largely made up of fixed income securities, public equities and a diverse set of alternative investments. The portfolio is overseen by our in-house investment department.
THE BENEFITS OF A DIVERSIFIED PORTFOLIO
Loews’s diversified holding company structure is a key factor in our ability to generate shareholder value. Our multi-industry structure is unique and does not fit neatly into today’s typical S&P 500 corporate model, which is dominated by pure play companies. Yet, as a diversified holding company, we have the freedom to make investments across a broad spectrum of industries wherever we perceive opportunity, along with the ability to balance industry cycles.
We also believe that the holders of Loews shares benefit from the fact that three of our subsidiaries — Boardwalk, CNA and Diamond — are publicly-traded companies. Our shareholders benefit from the public ownership of our subsidiaries in several important ways:
• Market Valuation — Third-party investors value our subsidiaries directly in the public equity markets, providing Loews shareholders with an objective measure of the value of our publicly-traded subsidiaries.
• Transparency — As public companies and SEC registrants, our subsidiaries provide financial disclosures that further enhance transparency for Loews shareholders.
• Self-financing — The subsidiaries can, with greater ease, directly access the capital markets to finance their operations and expansion plans, if needed.
• Recruiting top talent — The opportunity to hold a senior executive position in a publicly-traded company is very appealing to most candidates.
While we closely monitor the performance of our subsidiaries, one thing we do not do is micromanage them. We view the holding company’s role as providing counsel on significant capital and strategic initiatives, as well as CEO selection. We rely on the experienced subsidiary management teams to make fundamental decisions about operating issues, product and service offerings, and marketing plans.
ANNUAL REPORT 2016 7

A PORTFOLIO POSITIONED FOR LONG-TERM VALUE
Each of our businesses has significant strengths, along with talented management teams that are building on those strengths to create value for the long term.
CNA FINANCIAL
CNA is a property-casualty insurance company that has been in the Loews portfolio of businesses for over 40 years. The company operates a solid specialty business within the commercial insurance industry. Because of its deep expertise and long-established relationships with customers and producer partners, CNA enjoys a competitive edge in key areas of its specialty portfolio, such as professional services, healthcare, surety and warranty. CNA’s specialty business continues to produce excellent results. In addition, the commercial business has improved meaningfully and the international business is performing well. CNA’s strong balance sheet and capital position, well-respected brand, dedicated team, extensive branch footprint and strong local relationships with agents and brokers provide an excellent foundation upon which CNA can continue to build its business.
Under the leadership of CNA’s new CEO, Dino Robusto, who joined in November 2016, the company will focus on growing underwriting profits, in particular by expanding in segments where it has a decided competitive advantage. CNA will also continue to emphasize cost control in order to improve its expense ratio, while supporting investments in advanced technology, and digital and analytics capabilities to improve productivity and streamline operations.
DIAMOND OFFSHORE DRILLING
The offshore drilling market has continued to suffer through a tough, protracted downturn, reflected in a decline in the number of working rigs and lower revenues industry-wide. While Diamond has not been immune to market forces, it remains in a stable position relative to many others in the industry. Diamond did not over-expand during the industry’s boom years, instead using its strong balance sheet to strategically renew and upgrade its fleet. As a result, Diamond’s fleet is younger than the industry average, with a good backlog. On December 31, 2016, the total contracted backlog was $3.6 billion, and approximately 94% of Diamond’s available ultra-deepwater rig days for 2017 are contracted with top-tier customers.
The Diamond team, led by CEO Marc Edwards, has managed through this turbulent period by maintaining the company’s liquidity and balance sheet strength, continuing to control costs and improving rig efficiencies. We have every confidence that offshore drilling will rebound over the long term, as offshore oil production is a major source of the world’s oil supply. When prices recover, and customers again look offshore for new sources of oil and gas production, Diamond’s attractive fleet and sound financial footing should provide a foundation for performance and growth.
BOARDWALK PIPELINE PARTNERS
After nearly a decade of rapid supply growth from unconventional supply sources, natural gas supply and demand has begun to come into balance and natural gas prices have started to recover. In the U.S., increased demand for natural gas is being driven by four market dynamics:
• A rapid increase in exports to Mexico;
• An increase of exports through the liquefied natural gas (LNG) facilities that have started to come online along the Gulf Coast;
• An increase in the use of natural gas as a fuel; and
• Higher industrial usage by petrochemical, steel and agricultural chemicals businesses due to lower natural gas prices and the abundant long-term supply of this commodity.
LOEWS CORPORATION8
These market dynamics have created both opportunities and challenges for Boardwalk. Over the past three years, Boardwalk announced $1.6 billion of growth projects primarily to meet natural gas demand by end-users, such as LNG export, power generation and industrial facilities. During 2016, Boardwalk placed four of these projects into service. These projects, which cost approximately $320 million, were collectively under budget and on time. The company has been using internally-generated cash to help fund growth projects and has decreased its balance sheet leverage. Under the leadership of CEO Stan Horton, the Boardwalk team is continuing to strategically build out its transportation system, pursue new revenue opportunities, and strengthen its balance sheet.
LOEWS HOTELS
Loews Hotels, with a network of 24 properties, can move nimbly to capitalize on trends in an industry that is increasingly dominated by behemoth chains. The company’s focus is on highly profitable, distinguished hotels in the upper upscale market that can accommodate group business. Additionally, Loews Hotels continues to look for opportunities with unique, built-in demand generators and seeks to cultivate successful long-term partnerships, as it has done with Universal Studios in Orlando.
Strategic partnerships allow Loews Hotels to accelerate growth while improving its return on invested capital. In 2016, Loews Hotels opened its fifth hotel in Orlando — the 1,000-room Loews Sapphire Falls Resort — and announced the expansion of its extremely successful Cabana Bay Beach Resort, which will add another 400 rooms in the summer of 2017. These two additions bring Loews Hotels’ room count in Orlando up to 5,600 keys. In the summer of 2018, the joint venture is scheduled to open its sixth property, the 600-room Aventura Hotel.
Over the coming years, Loews Hotels will continue to look to invest in properties and leverage new and existing partnerships. Additionally, Loews Hotels will stay focused on commercial and operational excellence while pursuing smart growth.
COMMITTED TO BUILDING VALUE
As significant shareholders of Loews, we come into the office every day with one goal: to create value. “How can we best deploy our capital to create significant value?” is the question that guides our decision making.
We rely on our subsidiaries and their executive teams to make wise choices and generate strong financial results. We seek to ensure that our subsidiaries are led by executives with extensive industry experience and that the companies have the financial firepower to compete effectively and grow their businesses.
As we strive each day to build long-term value for our shareholders, we know this would not be possible without the talent, commitment and professionalism of our employees, both at Loews and our subsidiaries. We thank our team members and associates for their hard work, excellence and integrity, as well as our board of directors for their commitment, guidance and sage counsel. We also want to thank you, our shareholders, for entrusting us with your investment. We will always work to earn your trust by managing Loews for long-term value creation.
Sincerely,
JAMES S. TISCH
ANDREW H. TISCH
JONATHAN M. TISCH
Office of the President February 16, 2017
ANNUAL REPORT 2016 9

BOARD OF DIRECTORS
LAWRENCE S. BACOW
Fellow, Harvard College
ANN E. BERMAN
Retired Senior Advisor to the President, Harvard University
JOSEPH L. BOWER
Donald K. David Professor Emeritus, Harvard Business School
CHARLES D. DAVIDSON
Venture Partner, Quantum Energy Partners
CHARLES M. DIKER
Managing Partner, Diker Management, LLC, Chairman of the Board, Cantel Medical Corp.
JACOB A. FRENKEL
Chairman, JPMorgan Chase International Chairman of the Board of Trustees, the Group of Thirty
PAUL J. FRIBOURG
Chairman of the Board, President and Chief Executive Officer, Continental Grain Company
WALTER L. HARRIS
President and Chief Executive Officer, FOJP Service Corporation and Hospitals Insurance Company
PHILIP A. LASKAWY
Retired Chairman and Chief Executive Officer, Ernst & Young LLP
KEN MILLER
President and Chief Executive Officer, Ken Miller Capital, LLC
ANDREW H. TISCH
Office of the President, Co-Chairman of the Board, and Chairman of the Executive Committee
JAMES S. TISCH
Office of the President, President and Chief Executive Officer
JONATHAN M. TISCH
Office of the President, Co-Chairman of the Board, Chairman and Chief Executive Officer, Loews Hotels
ANTHONY WELTERS
Executive Chairman, Black Ivy Group, LLC
KEY
MEMBER OF AUDIT
COMMITTEE
MEMBER OF
EXECUTIVE
COMMITTEE
MEMBER OF
COMPENSATION
COMMITTEE
MEMBER OF
NOMINATING AND
GOVERNANCE
COMMITTEE
LOEWS CORPORATION10

OFFICERS
JAMES S. TISCH
Office of the President, President and Chief Executive Officer
ANDREW H. TISCH
Office of the President, Co-Chairman of the Board, and Chairman of the Executive Committee
JONATHAN M. TISCH
Office of the President, Co-Chairman of the Board, and Chairman and Chief Executive Officer, Loews Hotels
MARC A. ALPERT
Senior Vice President, General Counsel and Secretary
DAVID B. EDELSON
Senior Vice President and Chief Financial Officer
RICHARD W. SCOTT
Senior Vice President and Chief Investment Officer
KENNETH I. SIEGEL
Senior Vice President
SUSAN BECKER
Vice President, Tax
ROBERT F. CROOK
Vice President, Internal Audit
LAURA K. CUSHING
Vice President, Human Resources
HERB E. HOFMANN
Vice President, Information Technology
JONATHAN KOPLOVITZ
Vice President, Corporate Development
AUDREY A. RAMPINELLI
Vice President, Risk Management
MARK S. SCHWARTZ
Vice President, Chief Accounting Officer
MARY SKAFIDAS
Vice President, Investor Relations, Corporate Communications
ALEXANDER H. TISCH
Vice President
BENJAMIN J. TISCH
Vice President
EDMUND UNNELAND
Treasurer
JANE J. WANG
Vice President
PRINCIPAL SUBSIDIARIES
CNA FINANCIAL CORPORATION
DINO E. ROBUSTO
Chairman and Chief Executive Officer
333 South Wabash Avenue Chicago, IL 60604-4107
www.cna.com
DIAMOND OFFSHORE DRILLING, INC.
MARC EDWARDS
President and Chief Executive Officer
15415 Katy Freeway Houston, TX 77094-1810
www.diamondoffshore.com
BOARDWALK PIPELINE PARTNERS L.P.
STANLEY C. HORTON
President and Chief Executive Officer
9 Greenway Plaza, Suite 2800 Houston, TX 77046-0946
www.bwpmlp.com
LOEWS HOTELS
JONATHAN M. TISCH
Chairman and Chief Executive Officer
667 Madison Avenue New York, NY 10065-8087
www.loewshotels.com
CORPORATE OFFICE
667 Madison Avenue New York, NY 10065-8087
www.loews.com
ANNUAL REPORT 2016 11
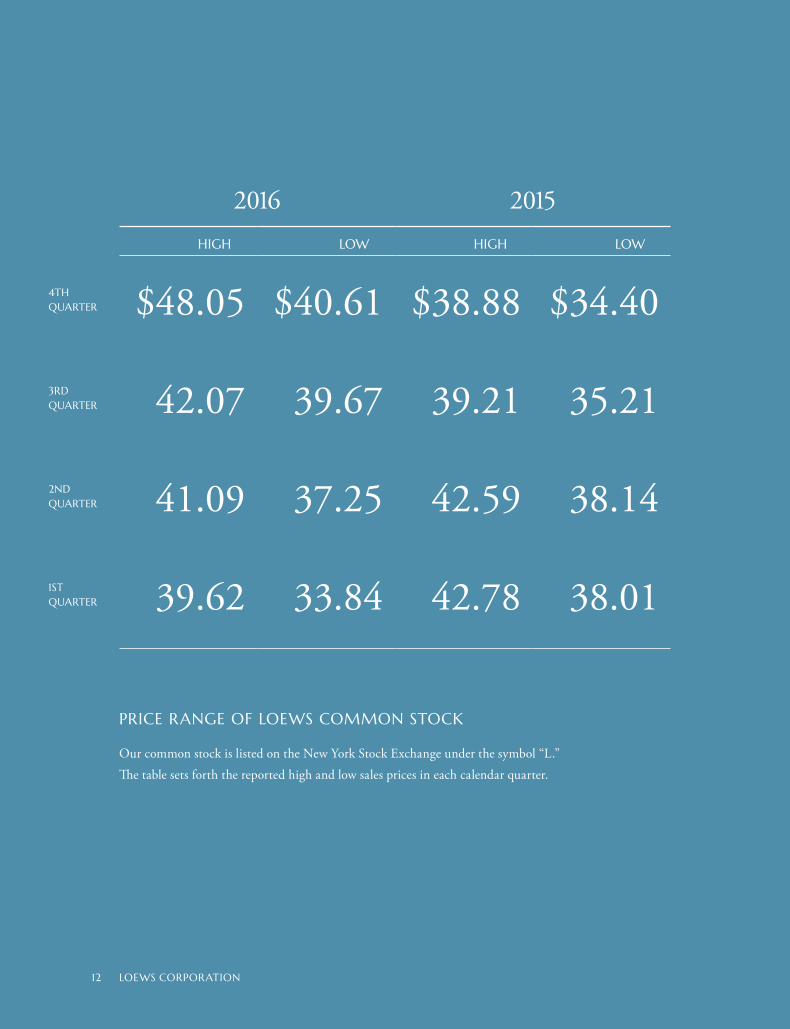
2016 2015HIGH LOW HIGH LOW
4TH QUARTER $48.05 $40.61 $38.88 $34.40
3RD QUARTER 42.07 39.67 39.21 35.21
2ND QUARTER 41.09 37.25 42.59 38.14
1ST QUARTER 39.62 33.84 42.78 38.01
PRICE RANGE OF LOEWS COMMON STOCK
Our common stock is listed on the New York Stock Exchange under the symbol “L.”
The table sets forth the reported high and low sales prices in each calendar quarter.
LOEWS CORPORATION12

1
UNITED STATES SECURITIES AND EXCHANGE COMMISSION
WASHINGTON, D.C. 20549
FORM 10-K
[X] ANNUAL REPORT PURSUANT TO SECTION 13 OR 15(d) OF THE SECURITIES EXCHANGE ACT OF 1934
For the Fiscal Year Ended December 31, 2016
OR
[ ] TRANSITION REPORT PURSUANT TO SECTION 13 OR 15(d) OF THE SECURITIES EXCHANGE ACT OF 1934
For the Transition Period From ____________ to _____________
Commission File Number 1-6541
LOEWS CORPORATION (Exact name of registrant as specified in its charter)
Delaware 13-2646102(State or other jurisdiction of (I.R.S. Employerincorporation or organization) Identification No.)
667 Madison Avenue, New York, N.Y. 10065-8087 (Address of principal executive offices) (Zip Code)
(212) 521-2000 (Registrant’s telephone number, including area code)
Securities registered pursuant to Section 12(b) of the Act:
Title of each class Name of each exchange on which registered
Common Stock, par value $0.01 per share New York Stock Exchange
Securities registered pursuant to Section 12(g) of the Act: None
Indicate by check mark if the registrant is a well-known seasoned issuer, as defined in Rule 405 of the Securities Act.
Yes X No
Indicate by check mark if the registrant is not required to file reports pursuant to Section 13 or Section 15(d) of the Act.
Yes No X
Indicate by check mark whether the registrant (1) has filed all reports required to be filed by Section 13 or 15 (d) of the Securities Exchange Act of 1934 during the preceding 12 months (or for such shorter period that the registrant was required to file such reports), and (2) has been subject to such filing requirements for the past 90 days.
Yes X No
Indicate by check mark whether the registrant has submitted electronically and posted on its corporate website, if any, every Interactive Data File required to be submitted and posted pursuant to Rule 405 of Regulation S-T during the preceding 12 months (or for such shorter period that the registrant was required to submit and post such files).
Yes X No
Indicate by check mark if disclosure of delinquent filers pursuant to Item 405 of Regulation S-K is not contained herein, and will not be contained, to the best of registrant’s knowledge, in definitive proxy or information statements incorporated by reference in Part III of this Form 10-K or any amendment to this Form 10-K. [ X ].
Indicate by check mark whether the registrant is a large accelerated filer, an accelerated filer, a non-accelerated filer, or a smaller reporting company. See the definitions of “large accelerated filer,” “accelerated filer” and “smaller reporting company” in Rule 12b-2 of the Exchange Act. (Check one):
Large accelerated filer X Accelerated filer Non-accelerated filer Smaller reporting company
Indicate by check mark whether the registrant is a shell company (as defined in Rule 12b-2 of the Exchange Act).
Yes No X
The aggregate market value of common stock held by non-affiliates of the registrant as of June 30, 2016, the last business day of the registrant’s most recently completed second fiscal quarter, was approximately $11,399,000,000.
As of February 3, 2017, there were 336,632,474 shares of the registrant’s common stock outstanding.
Documents Incorporated by Reference:
Portions of the registrant’s definitive proxy statement for the 2017 annual meeting of shareholders intended to be filed by the registrant with the Commission not later than 120 days after the close of its fiscal year are incorporated by reference into Part III of this Report.

2
LOEWS CORPORATION
INDEX TO ANNUAL REPORT ON FORM 10-K FILED WITH THE
SECURITIES AND EXCHANGE COMMISSION
For the Year Ended December 31, 2016
Item Page No. PART I No.
1 Business CNA Financial Corporation 3 Diamond Offshore Drilling, Inc. 6 Boardwalk Pipeline Partners, LP 9 Loews Hotels Holding Corporation 13 Executive Officers of the Registrant 15 Available Information 15
1A Risk Factors 15 1B Unresolved Staff Comments 45 2 Properties 45 3 Legal Proceedings 45 4 Mine Safety Disclosures 45 PART II
5 Market for the Registrant’s Common Equity, Related Stockholder Matters and Issuer Purchases of Equity Securities 45
6 Selected Financial Data 48 7 Management’s Discussion and Analysis of Financial Condition and Results of Operations 49 7A Quantitative and Qualitative Disclosures about Market Risk 83 8 Financial Statements and Supplementary Data 86 9 Changes in and Disagreements with Accountants on Accounting and Financial Disclosure 164 9A Controls and Procedures 164 9B Other Information 164 PART III
10 Directors, Executive Officers and Corporate Governance 164 11 Executive Compensation 165 12 Security Ownership of Certain Beneficial Owners and Management and Related
Stockholder Matters 165 13 Certain Relationships and Related Transactions, and Director Independence 165 14 Principal Accounting Fees and Services 165
PART IV
15 Exhibits and Financial Statement Schedules 166 16 Form 10-K Summary 169

3
PART I Item 1. Business. Loews Corporation was incorporated in 1969 and is a holding company. Our subsidiaries are engaged in the following lines of business:
commercial property and casualty insurance (CNA Financial Corporation, a 90% owned subsidiary); operation of offshore oil and gas drilling rigs (Diamond Offshore Drilling, Inc., a 53% owned subsidiary);
transportation and storage of natural gas and natural gas liquids (Boardwalk Pipeline Partners, LP, a 51%
owned subsidiary); and
operation of a chain of hotels (Loews Hotels Holding Corporation, a wholly owned subsidiary). Unless the context otherwise requires, references in this Report to “Loews Corporation,” “the Company,” “Parent Company,” “we,” “our,” “us” or like terms refer to the business of Loews Corporation excluding its subsidiaries. We have five reportable segments comprised of our four individual operating subsidiaries listed above and our Corporate segment. Each of our operating subsidiaries is headed by a chief executive officer who is responsible for the operation of its business and has the duties and authority commensurate with that position. Additional financial information on each of our segments is included under the heading corresponding to that segment under Item 7, Management’s Discussion and Analysis of Financial Condition and Results of Operations (“MD&A”).
CNA FINANCIAL CORPORATION CNA Financial Corporation (together with its subsidiaries, “CNA”) is an insurance holding company. CNA’s property and casualty and remaining life and group insurance operations are primarily conducted by Continental Casualty Company (“CCC”), The Continental Insurance Company, Western Surety Company, CNA Insurance Company Limited and Hardy Underwriting Bermuda Limited and its subsidiaries (“Hardy”). CNA accounted for 71.6%, 67.8% and 67.7% of our consolidated total revenue for the years ended December 31, 2016, 2015 and 2014. CNA’s insurance products primarily include commercial property and casualty coverages, including surety. CNA’s services include risk management, information services, warranty and claims administration. CNA’s products and services are primarily marketed through independent agents, brokers and managing general underwriters to a wide variety of customers, including small, medium and large businesses, insurance companies, associations, professionals and other groups. Property and Casualty Operations CNA’s core business, commercial property and casualty insurance operations, includes its Specialty, Commercial and International lines of business. Specialty Specialty provides management and professional liability and other coverages through property and casualty products and services using a network of brokers, independent agencies and managing general underwriters. Specialty includes the following business groups: Management & Professional Liability: Management & Professional Liability provides management and professional liability insurance and risk management services and other specialized property and casualty coverages. This group provides professional liability coverages to various professional firms, including architects, real estate agents, accounting firms, law firms and other professional firms. Management & Professional Liability also provides directors and officers (“D&O”), employment practices, fiduciary and fidelity coverages. Specific areas of focus include small and mid-size firms, public as well as privately held firms and not-for-profit organizations, where

4
Item 1. Business CNA Financial Corporation – (Continued) tailored products for these client segments are offered. Products within Management & Professional Liability are distributed through brokers, independent agents and managing general underwriters. Management & Professional Liability, through CNA HealthCare, also offers insurance products to serve the health care industry. Products include professional and general liability as well as associated standard property and casualty coverages, and are distributed on a national basis through brokers, independent agents and managing general underwriters. Key customer groups include aging services, allied medical facilities, life sciences, dentists, physicians, hospitals and nurses and other medical practitioners. Surety: Surety offers small, medium and large contract and commercial surety and fidelity bonds. Surety provides surety and fidelity bonds in all 50 states through a network of independent agencies and brokers. Warranty and Alternative Risks: Warranty and Alternative Risks provides extended service contracts and related products that provide protection from the financial burden associated with mechanical breakdown and other related losses, primarily for vehicles and portable electronic communication devices. Commercial Commercial works with a network of brokers and independent agents to market a broad range of property and casualty insurance products and services to small, middle-market and large businesses. Property products include standard and excess property, marine and boiler and machinery coverages. Casualty products include standard casualty insurance products such as workers’ compensation, general and product liability, commercial auto and umbrella coverages. Most insurance programs are provided on a guaranteed cost basis; however, CNA also offers specialized loss-sensitive insurance programs and total risk management services relating to claim and information services to the large commercial insurance marketplace through a wholly owned subsidiary, CNA ClaimPlus, Inc., a third party administrator. These property and casualty products are offered through CNA’s Middle Market, Small Business and Other Commercial insurance groups. International International provides property and casualty insurance and specialty coverages through a network of brokers, independent agencies and managing general underwriters, on a global basis through its operations in Canada, the United Kingdom, Continental Europe, China and Singapore as well as through its presence at Lloyd’s of London (“Lloyd’s”). The International business is grouped into broad business units which include Energy & Marine, Property, Casualty, Specialty and Healthcare & Technology, and is managed across three territorial platforms from Head Offices in London and Toronto. CNA’s property and casualty field structure consists of 49 underwriting locations across the United States. In addition, there are five centralized processing operations which handle policy processing, billing and collection activities and also act as call centers to optimize service. The claims structure consists of a national claim center designed to efficiently handle the high volume of low severity claims, including property damage, liability and workers’ compensation medical only claims, and 16 principal claim offices handling the more complex claims. CNA also has a presence in Canada, Europe, China and Singapore consisting of 17 branch operations and access to business placed at Lloyd’s through Hardy Syndicate 382. Non-Core Operations Non-core operations include CNA’s long term care business that is in run-off, certain corporate expenses, including interest on CNA corporate debt, and certain property and casualty businesses in run-off, including CNA Re and asbestos and environmental pollution (“A&EP”).

5
Item 1. BusinessCNA Financial Corporation – (Continued)
Direct Written Premiums by Geographic Concentration Set forth below is the distribution of CNA’s direct written premiums by geographic concentration. Year Ended December 31 2016 2015 2014 California 9.5% 9.1% 9.1% Texas 8.2 8.1 8.1 Illinois 7.6 7.5 6.7 New York 6.9 7.1 7.2 Florida 5.8 5.7 5.7 Pennsylvania 3.7 3.8 3.7 New Jersey 3.1 3.2 3.4 Canada 1.9 2.2 2.6 All other states, countries or political subdivisions 53.3 53.3 53.5 100.0% 100.0% 100.0% Approximately 7.9%, 8.0%, and 8.8% of CNA’s direct written premiums were derived from outside of the United States for the years ended December 31, 2016, 2015 and 2014. Other Competition: The property and casualty insurance industry is highly competitive both as to rate and service. CNA competes with a large number of stock and mutual insurance companies and other entities for both distributors and customers. Insurers compete on the basis of factors including products, price, services, ratings and financial strength. Accordingly, CNA must continuously allocate resources to refine and improve its insurance products and services. There are approximately 2,700 individual companies that sell property and casualty insurance in the United States. Based on 2015 statutory net written premiums, CNA is the eighth largest commercial insurance writer and the 14th largest property and casualty insurance organization in the United States. Regulation: The insurance industry is subject to comprehensive and detailed regulation and supervision. Regulatory oversight by applicable agencies is exercised through review of submitted filings and information, examinations (both financial and market conduct), direct inquiries and interviews. Each domestic and foreign jurisdiction has established supervisory agencies with broad administrative powers relative to licensing insurers and agents, approving policy forms, establishing reserve requirements, prescribing the form and content of statutory financial reports and regulating capital adequacy and the type, quality and amount of investments permitted. Such regulatory powers also extend to premium rate regulations, which require that rates not be excessive, inadequate or unfairly discriminatory, governance requirements and risk assessment practice and disclosure. In addition to regulation of dividends by insurance subsidiaries, intercompany transfers of assets may be subject to prior notice or approval by insurance regulators, depending on the size of such transfers and payments in relation to the financial position of the insurance subsidiaries making the transfer or payment. Domestic insurers are also required by state insurance regulators to provide coverage to certain insureds who would not otherwise be considered eligible by the insurers. Each state dictates the types of insurance and the level of coverage that must be provided to such involuntary risks. CNA’s share of these involuntary risks is mandatory and generally a function of its respective share of the voluntary market by line of insurance in each state. Further, domestic insurance companies are subject to state guaranty fund and other insurance-related assessments. Guaranty funds are governed by state insurance guaranty associations which levy assessments to meet the funding needs of insolvent insurer estates. Other insurance-related assessments are generally levied by state agencies to fund various organizations including disaster relief funds, rating bureaus, insurance departments, and workers’ compensation second injury funds, or by industry organizations that assist in the statistical analysis and ratemaking process and CNA has the ability to recoup certain of these assessments from policyholders.

6
Item 1. Business CNA Financial Corporation – (Continued) As CNA’s insurance operations are conducted in a multitude of both domestic and foreign jurisdictions, CNA is subject to a number of regulatory agency requirements applicable to a portion, or all, of its operations. These include, among other things, the State of Illinois Department of Insurance (which is CNA’s global group-wide supervisor), the U.K. Prudential Regulatory Authority and Financial Conduct Authority, the Bermuda Monetary Authority and the Office of Superintendent of Financial Institutions in Canada. Hardy, a specialized Lloyd’s underwriter, is also supervised by the Council of Lloyd’s, which is the franchisor for all Lloyd’s operations. The Council of Lloyd’s has wide discretionary powers to regulate Lloyd’s underwriting, such as establishing the capital requirements for syndicate participation. In addition, the annual business plans of each syndicate are subject to the review and approval of the Lloyd’s Franchise Board, which is responsible for business planning and monitoring for all syndicates. Capital adequacy and risk management regulations, referred to as Solvency II, apply to CNA’s European operations and are enacted by the European Union’s executive body, the European Commission. Additionally, the International Association of Insurance Supervisors (“IAIS”) continues to consider regulatory proposals addressing group supervision, capital requirements and enterprise risk management. The U.S. Federal Reserve, the U.S. Federal Insurance Office and the National Association of Insurance Commissioners are working with other global regulators to define such proposals. It is not currently clear to what extent the IAIS activities will impact CNA as any final proposal would ultimately need to be legislated or regulated by each individual country or state. Although the U.S. federal government does not currently directly regulate the business of insurance, federal legislative and regulatory initiatives can impact the insurance industry. These initiatives and legislation include proposals relating to potential federal oversight of certain insurers; terrorism and natural catastrophe exposures; cybersecurity risk management; federal financial services reforms; and certain tax reforms. The Terrorism Risk Insurance Program Reauthorization Act of 2015 provides for a federal government backstop for insured terrorism risks through 2020. The mitigating effect of such law is part of the analysis of CNA’s overall risk posture for terrorism and, accordingly, its risk positioning may change if such law were modified. CNA also continues to invest in the security network of its systems on an enterprise-wide basis, especially considering the implications of data and privacy breaches. This requires an investment of a significant amount of resources by CNA on an ongoing basis. Potential implications of possible cybersecurity legislation on such current investment, if any, are uncertain. The foregoing laws and proposals, either separately or in the aggregate, create a regulatory and legal environment that may require changes in CNA’s business plan or significant investment of resources in order to operate in an effective and compliant manner. Additionally, various legislative and regulatory efforts to reform the tort liability system have, and will continue to, impact CNA’s industry. Although there has been some tort reform with positive impact to the insurance industry, new causes of action and theories of damages continue to be proposed in court actions and by federal and state legislatures that continue to expand liability for insurers and their policyholders. Properties: CNA’s principal executive offices are based in Chicago, Illinois. CNA’s subsidiaries maintain office space in various cities throughout the United States and various countries. CNA leases all of its office space.
DIAMOND OFFSHORE DRILLING, INC. Diamond Offshore Drilling, Inc. (together with its subsidiaries, “Diamond Offshore”) is engaged, through its subsidiaries, in the business of operating drilling rigs for companies engaged in the offshore exploration and production of hydrocarbons. Diamond Offshore accounted for 12.1%, 18.1% and 19.7% of our consolidated total revenue for the years ended December 31, 2016, 2015 and 2014. Rigs: Diamond Offshore provides contract drilling services to the energy industry around the world with a fleet of 24 offshore drilling rigs. Diamond Offshore’s current fleet consists of four drillships, 19 semisubmersible rigs and one jack-up rig. Of the current fleet, as of January 30, 2017, ten rigs are cold stacked, consisting of four ultra-deepwater, three deepwater and three mid-water semisubmersible rigs. In December of 2016, Diamond Offshore placed the Ocean GreatWhite into service. The Ocean GreatWhite is currently on standby in Labuan, Malaysia, pending further instructions from BP.

7
Item 1. BusinessDiamond Offshore Drilling, Inc. – (Continued)
A floater rig is a type of mobile offshore drilling unit that floats and does not rest on the seafloor. This asset class includes self-propelled drillships and semisubmersible rigs. Semisubmersible rigs consist of an upper working and living deck resting on vertical columns connected to lower hull members. Such rigs operate in a “semi-submerged” position, remaining afloat, off bottom, in a position in which the lower hull is approximately 55 feet to 90 feet below the water line and the upper deck protrudes well above the surface. Semisubmersibles hold position while drilling by use of a series of small propulsion units or thrusters that provide dynamic positioning (“DP”) to keep the rig on location, or with anchors tethered to the seabed. Although DP semisubmersibles are self-propelled, such rigs may be moved long distances with the assistance of tug boats. Non-DP, or moored, semisubmersibles require tug boats or the use of a heavy lift vessel to move between locations. A drillship is an adaptation of a maritime vessel that is designed and constructed to carry out drilling operations by means of a substructure with a moon pool centrally located in the hull. Drillships are typically self-propelled and are positioned over a drillsite through the use of a DP system similar to those used on semisubmersible rigs. Diamond Offshore’s floater fleet (semisubmersibles and drillships) can be further categorized based on the nominal water depth for each class of rig as follows: Category Rated Water Depth (a) (in feet) Number of Units in Fleet Ultra-Deepwater 7,501 to 12,000 12 Deepwater 5,000 to 7,500 6 Mid-Water 400 to 4,999 5 (a) Rated water depth for semisubmersibles and drillships reflects the maximum water depth in which a floating rig has been
designed to operate. However, individual rigs are capable of drilling, or have drilled, in marginally greater water depthsdepending on various conditions (such as salinity of the ocean, weather and sea conditions).
Jack-up rigs are mobile, self-elevating drilling platforms equipped with legs that are lowered to the ocean floor. Diamond Offshore’s jack-up is used for drilling in water depths from 20 feet to 350 feet. As of January 30, 2017, the Ocean Scepter, a cantilevered jack-up drilling rig built in 2008, was offshore Mexico where it was waiting to commence a short-term contract for Fieldwood Energy. Fleet Enhancements and Additions: Diamond Offshore’s long term strategy is to upgrade its fleet to meet customer demand for advanced, efficient and high-tech rigs by acquiring or building new rigs when possible to do so at attractive prices, and otherwise by enhancing the capabilities of its existing rigs at a lower cost and shorter construction period than newbuild construction would require. Since 2009, commencing with the acquisition of two newbuild, ultra-deepwater semisubmersible rigs, the Ocean Courage and Ocean Valor, Diamond Offshore has spent over $5.0 billion towards upgrading its fleet. In 2016, Diamond Offshore took delivery of the Ocean GreatWhite, the final rig to be completed during Diamond Offshore’s most recent fleet enhancement cycle. Diamond Offshore will evaluate further rig acquisition and enhancement opportunities as they arise. However, Diamond Offshore can provide no assurance whether, or to what extent, it will continue to make rig acquisitions or enhancements to its fleet. Pressure Control by the Hour: During 2016, Diamond Offshore entered into a ten-year agreement with a subsidiary of GE Oil & Gas, (“GE”), to provide services with respect to certain blowout preventer and related well control equipment on Diamond Offshore’s four drillships. Such services include management of maintenance, certification and reliability with respect to such equipment. In connection with the services agreement with GE, Diamond Offshore sold the equipment to a GE affiliate and leased back such equipment under four separate ten-year operating leases. Markets: The principal markets for Diamond Offshore’s contract drilling services are:
the Gulf of Mexico, including the United States (“U.S.”) and Mexico;
South America, principally offshore Brazil and Trinidad and Tobago;
Australia and Southeast Asia, including Malaysia, Indonesia and Vietnam;
8
Item 1. Business Diamond Offshore Drilling, Inc. – (Continued)
Europe, principally offshore the United Kingdom (“U.K.”) and Norway;
East and West Africa;
the Mediterranean; and
the Middle East. Diamond Offshore actively markets its rigs worldwide. Drilling Contracts: Diamond Offshore’s contracts to provide offshore drilling services vary in their terms and provisions. Diamond Offshore typically obtains its contracts through a competitive bid process, although it is not unusual for Diamond Offshore to be awarded drilling contracts following direct negotiations. Drilling contracts generally provide for a basic dayrate regardless of whether or not drilling results in a productive well. Drilling contracts generally also provide for reductions in rates during periods when the rig is being moved or when drilling operations are interrupted or restricted by equipment breakdowns, adverse weather conditions or other circumstances. Under dayrate contracts, Diamond Offshore generally pays the operating expenses of the rig, including wages and the cost of incidental supplies. Historically, dayrate contracts have accounted for the majority of Diamond Offshore’s revenues. In addition, from time to time, Diamond Offshore’s dayrate contracts may also provide for the ability to earn an incentive bonus from its customer based upon performance. The duration of a dayrate drilling contract is generally tied to the time required to drill a single well or a group of wells, which Diamond Offshore refers to as a well-to-well contract, or a fixed period of time, in what Diamond Offshore refers to as a term contract. Many drilling contracts may be terminated by the customer in the event the drilling rig is destroyed or lost or if drilling operations are suspended for an extended period of time as a result of a breakdown of equipment or, in some cases, due to events beyond the control of either party to the contract. Certain of Diamond Offshore’s contracts also permit the customer to terminate the contract early by giving notice; in most circumstances, this requires the payment of an early termination fee by the customer. The contract term in many instances may also be extended by the customer exercising options for the drilling of additional wells or for an additional length of time, generally at competitive market rates and mutually agreeable terms at the time of the extension. In periods of decreasing demand for offshore rigs, drilling contractors may prefer longer term contracts to preserve dayrates at existing levels and ensure utilization, while customers may prefer shorter contracts that allow them to more quickly obtain the benefit of declining dayrates. Moreover, drilling contractors may accept lower dayrates in a declining market in order to obtain longer-term contracts and add backlog. Customers: Diamond Offshore provides offshore drilling services to a customer base that includes major and independent oil and gas companies and government-owned oil companies. During 2016, 2015 and 2014, Diamond Offshore performed services for 18, 19 and 35 different customers. During 2016, 2015 and 2014, one of Diamond Offshore’s customers in Brazil, Petróleo Brasileiro S.A. (“Petrobras”) accounted for 18%, 24% and 32% of Diamond Offshore’s annual total consolidated revenues. During 2016 and 2015, Anadarko accounted for 22% and 12% of Diamond Offshore’s annual consolidated revenues. During 2015, ExxonMobil accounted for 12% of Diamond Offshore’s annual consolidated revenues. No other customer accounted for 10% or more of Diamond Offshore’s annual total consolidated revenues during 2016, 2015 or 2014. As of January 1, 2017, Diamond Offshore’s contract backlog was $3.6 billion attributable to 11 customers. All four of its drillships are currently contracted to work in the U.S. Gulf of Mexico (“GOM”). As of January 1, 2017, contract backlog attributable to Diamond Offshore’s expected operations in the GOM was $639 million, $653 million, $554 million and $85 million for the years 2017, 2018, 2019 and 2020, all of which was attributable to two customers.

9
Item 1. BusinessDiamond Offshore Drilling, Inc. – (Continued)
Competition: Despite consolidation in previous years, the offshore contract drilling industry remains highly competitive with numerous industry participants, none of which at the present time has a dominant market share. The industry may also experience additional consolidation in the future, which could create other large competitors. Some of Diamond Offshore’s competitors may have greater financial or other resources than it does. Based on industry data as of the date of this Report, there are approximately 830 mobile drilling rigs in service worldwide, including approximately 290 floater rigs. The offshore contract drilling industry is influenced by a number of factors, including global economies and demand for oil and natural gas, current and anticipated prices of oil and natural gas, expenditures by oil and gas companies for exploration and development of oil and natural gas and the availability of drilling rigs. Drilling contracts are traditionally awarded on a competitive bid basis. Price is typically the primary factor in determining which qualified contractor is awarded a job. Customers may also consider rig availability and location, a drilling contractor’s operational and safety performance record, and condition and suitability of equipment. Diamond Offshore believes it competes favorably with respect to these factors. Diamond Offshore competes on a worldwide basis, but competition may vary significantly by region at any particular time. Competition for offshore rigs generally takes place on a global basis, as these rigs are highly mobile and may be moved, although at a cost that may be substantial, from one region to another. It is characteristic of the offshore drilling industry to move rigs from areas of low utilization and dayrates to areas of greater activity and relatively higher dayrates. The current oversupply of offshore drilling rigs also intensifies price competition. Governmental Regulation: Diamond Offshore’s operations are subject to numerous international, foreign, U.S., state and local laws and regulations that relate directly or indirectly to its operations, including regulations controlling the discharge of materials into the environment, requiring removal and clean-up under some circumstances, or otherwise relating to the protection of the environment, and may include laws or regulations pertaining to climate change, carbon emissions or energy use. Operations Outside the United States: Diamond Offshore’s operations outside the U.S. accounted for approximately 66%, 79% and 85% of its total consolidated revenues for the years ended December 31, 2016, 2015 and 2014. Properties: Diamond Offshore owns an office building in Houston, Texas, where its corporate headquarters are located, and offices and other facilities in New Iberia, Louisiana, Aberdeen, Scotland, Macae, Brazil and Ciudad del Carmen, Mexico. Additionally, Diamond Offshore currently leases various office, warehouse and storage facilities in Australia, Louisiana, Malaysia, Singapore, Trinidad and Tobago and the U.K. to support its offshore drilling operations.
BOARDWALK PIPELINE PARTNERS, LP Boardwalk Pipeline Partners, LP (together with its subsidiaries, “Boardwalk Pipeline”) is engaged, through its subsidiaries, in the business of natural gas and natural gas liquids and hydrocarbons (herein referred to together as “NGLs”) transportation and storage. Boardwalk Pipeline accounted for 10.0%, 9.3% and 8.6% of our consolidated total revenue for the years ended December 31, 2016, 2015 and 2014. We own approximately 51% of Boardwalk Pipeline comprised of 125,586,133 common units and a 2% general partner interest. A wholly owned subsidiary of ours, Boardwalk Pipelines Holding Corp. (“BPHC”) is the general partner and also holds all of Boardwalk Pipeline’s incentive distribution rights which entitle the general partner to an increasing percentage of the cash that is distributed by Boardwalk Pipeline in excess of $0.4025 per unit per quarter. Boardwalk Pipeline owns and operates approximately 13,930 miles of interconnected natural gas pipelines directly serving customers in 13 states and indirectly serving customers throughout the northeastern and southeastern U.S. through numerous interconnections with unaffiliated pipelines. Boardwalk Pipeline also owns and operates more than 435 miles of NGL pipelines in Louisiana and Texas. In 2016, its pipeline systems transported approximately 2.3 trillion cubic feet (“Tcf”) of natural gas and approximately 64.8 million barrels (“MMBbls”) of NGLs. Average daily throughput on Boardwalk Pipeline’s natural gas pipeline systems during 2016 was

10
Item 1. Business Boardwalk Pipeline Partners, LP – (Continued) approximately 6.3 billion cubic feet (“Bcf”). Boardwalk Pipeline’s natural gas storage facilities are comprised of 14 underground storage fields located in four states with aggregate working gas capacity of approximately 205.0 Bcf and Boardwalk Pipeline’s NGL storage facilities consist of nine salt dome storage caverns located in Louisiana with an aggregate storage capacity of approximately 24.0 MMBbls. Boardwalk Pipeline also owns three salt dome caverns and a brine pond for use in providing brine supply services and to support the NGL storage operations. Boardwalk Pipeline’s pipeline and storage systems are described below: The Gulf South pipeline system runs approximately 7,225 miles along the Gulf Coast in the states of Texas, Louisiana, Mississippi, Alabama and Florida. The pipeline system has a peak-day delivery capacity of 8.3 Bcf per day and average daily throughput for the year ended December 31, 2016 was 2.7 Bcf per day. Gulf South has ten natural gas storage facilities. The two natural gas storage facilities located in Louisiana and Mississippi have approximately 83.5 Bcf of working gas storage capacity and the eight salt dome natural gas storage caverns in Mississippi have approximately 46.0 Bcf of total storage capacity, of which approximately 29.6 Bcf is working gas capacity. Gulf South also owns undeveloped land which is suitable for up to five additional storage caverns. The Texas Gas pipeline system runs approximately 6,025 miles and is located in Louisiana, East Texas, Arkansas, Mississippi, Tennessee, Kentucky, Indiana and Ohio with smaller diameter lines extending into Illinois. The pipeline system has a peak-day delivery capacity of 5.2 Bcf per day and average daily throughput for the year ended December 31, 2016 was 2.4 Bcf per day. Texas Gas owns nine natural gas storage fields with 84.3 Bcf of working gas storage capacity. The Gulf Crossing pipeline system is located in Texas and runs approximately 375 miles into Louisiana. The pipeline system has a peak-day delivery capacity of 1.9 Bcf per day and average daily throughput for the year ended December 31, 2016 was 1.1 Bcf per day. Boardwalk Louisiana Midstream and Boardwalk Petrochemical Pipeline (collectively “Louisiana Midstream”) provide transportation and storage services for natural gas, NGLs and ethylene, fractionation services for NGLs and brine supply services. These assets provide approximately 71.4 MMBbls of salt dome storage capacity, including approximately 7.6 Bcf of working natural gas storage capacity, significant brine supply infrastructure, and approximately 270 miles of pipeline assets. Louisiana Midstream owns and operates the Evangeline Pipeline (“Evangeline”), which is an approximately 180 mile interstate ethylene pipeline that is capable of transporting approximately 2.6 billion pounds of ethylene per year between Texas and Louisiana, where it interconnects with its ethylene distribution system. Throughput for Louisiana Midstream was 64.8 MMBbls for the year ended December 31, 2016. Boardwalk Field Services operates natural gas gathering, compression, treating and processing infrastructure primarily in South Texas with approximately 290 miles of pipeline. Boardwalk Pipeline is also currently engaged in growth projects described below. Several growth projects were placed into service in 2016, including the Ohio to Louisiana Access, the Southern Indiana Lateral and the Western Kentucky Market Lateral projects and a power plant project in South Texas. These projects were completed on time at an aggregate cost which was approximately $30 million lower than the $350 million originally estimated. See Liquidity and Capital Resources – Subsidiaries for further discussion of capital expenditures and financing. Northern Supply Access Project: This project will increase the peak-day transmission capacity on Boardwalk Pipeline’s Texas Gas system by the addition of compression facilities and other system modifications to make this portion of the system bi-directional and is supported by precedent agreements for approximately 0.3 Bcf per day of peak-day transmission capacity. The project is expected to be placed into service in the second quarter of 2017, with a weighted-average contract life of 16 years. Sulphur Storage and Pipeline Expansion Project: Boardwalk Pipeline executed a long term agreement to provide liquids transportation and storage services to support the development of a new ethane cracker plant in Louisiana. The project will involve significant storage and infrastructure development to serve petrochemical customers near Boardwalk Pipeline’s Sulphur Hub and is expected to be placed into service in the fourth quarter of 2017.

11
Item 1. BusinessBoardwalk Pipeline Partners, LP – (Continued)
Coastal Bend Header Project: This project is supported by precedent agreements with foundation shippers to transport natural gas to serve a planned liquefied natural gas (“LNG”) liquefaction terminal in Freeport, Texas. As part of the project Boardwalk Pipeline will construct an approximately 65-mile pipeline supply header with approximately 1.4 Bcf per day of capacity to serve the terminal. Additionally, Boardwalk Pipeline will expand and modify its existing Gulf South pipeline facilities that will provide access to additional supply sources through various interconnects in South Texas and in the Louisiana area. The project is expected to be placed into service in the first half of 2018, with a weighted-average contract life of 20 years. Customers: Boardwalk Pipeline serves a broad mix of customers, including producers of natural gas, and with end-use customers including local distribution companies, marketers, electric power generators, industrial users and interstate and intrastate pipelines who, in turn, provide transportation and storage services for end-users. These customers are located throughout the Gulf Coast, Midwest and Northeast regions of the U.S. Competition: Boardwalk Pipeline competes with numerous other pipelines that provide transportation, storage and other services at many locations along its pipeline systems. Boardwalk Pipeline also competes with pipelines that are attached to natural gas supply sources that are closer to some of its traditional natural gas market areas. In addition, regulators’ continuing efforts to increase competition in the natural gas industry have increased the natural gas transportation options of Boardwalk Pipeline’s traditional customers. For example, as a result of regulators’ policies, capacity segmentation and capacity release have created an active secondary market which increasingly competes with Boardwalk Pipeline’s natural gas pipeline services. Further, natural gas competes with other forms of energy available to Boardwalk Pipeline’s customers, including electricity, coal, fuel oils and alternative fuel sources. The principal elements of competition among pipelines are availability of capacity, rates, terms of service, access to gas supplies, flexibility and reliability of service. In many cases, the elements of competition, in particular flexibility, terms of service and reliability, are key differentiating factors between competitors. This is especially the case with capacity being sold on a longer term basis. Boardwalk Pipeline is focused on finding opportunities to enhance its competitive profile in these areas by increasing the flexibility of its pipeline systems, such as modifying them to allow for bi-directional flows, to meet the demands of customers, such as power generators and industrial users, and is continually reviewing its services and terms of service to offer customers enhanced service options. Seasonality: Boardwalk Pipeline’s revenues can be affected by weather, natural gas price levels, gas price differentials between locations on its pipeline systems (basis spreads), gas price differentials between time periods, such as winter to summer (time period price spreads) and natural gas price volatility. Weather impacts natural gas demand for heating needs and power generation, which in turn influences the short term value of transportation and storage across Boardwalk Pipeline’s pipeline systems. Colder than normal winters can result in an increase in the demand for natural gas for heating needs and warmer than normal summers can impact cooling needs, both of which typically result in increased pipeline transportation revenues and throughput. While traditionally peak demand for natural gas occurs during the winter months driven by heating needs, the increased use of natural gas for cooling needs during the summer months has partially reduced the seasonality of revenues. In 2016, approximately 53% of Boardwalk Pipeline’s operating revenues were recognized in the first and fourth quarters of the year. Governmental Regulation: The Federal Energy Regulatory Commission (“FERC”) regulates Boardwalk Pipeline’s natural gas operating subsidiaries under the Natural Gas Act of 1938 and the Natural Gas Policy Act of 1978. The FERC regulates, among other things, the rates and charges for the transportation and storage of natural gas in interstate commerce and the extension, enlargement or abandonment of facilities under its jurisdiction. Where required, Boardwalk Pipeline’s natural gas pipeline subsidiaries hold certificates of public convenience and necessity issued by the FERC covering certain of their facilities, activities and services. The maximum rates that may be charged by Boardwalk Pipeline’s subsidiaries operating under the FERC’s jurisdiction, for all aspects of the natural gas transportation services they provide, are established through the FERC’s cost-of-service rate-making process. Key determinants in the FERC’s cost-of-service rate-making process are the costs of providing service, the volumes of gas being transported, the rate design, the allocation of costs between services, the capital structure and the rate of return a pipeline is permitted to earn. The maximum rates that may be charged by Boardwalk Pipeline for storage services on Texas Gas, with the exception of services associated with a portion of the working gas capacity on that system, are also established through the FERC’s cost-of-service rate-making process. The FERC has authorized Boardwalk Pipeline to charge market-based rates for its firm and interruptible storage services for the majority of its natural gas storage facilities. None of Boardwalk Pipeline’s FERC-regulated entities has an obligation
12
Item 1. Business Boardwalk Pipeline Partners, LP – (Continued) to file a new rate case and Gulf South is prohibited from filing a rate case until May 1, 2023, subject to certain exceptions. Boardwalk Pipeline is also regulated by the U.S. Department of Transportation (“DOT”) through the Pipeline and Hazardous Material Safety Administration (“PHMSA”) under the Natural Gas Pipeline Safety Act of 1968, as amended (“NGPSA”) and the Hazardous Liquids Pipeline Safety Act of 1979, as amended (“HLPSA”). The NGPSA and HLPSA govern the design, installation, testing, construction, operation, replacement and management of interstate natural gas and NGL pipeline facilities. Boardwalk Pipeline has received authority from PHMSA to operate certain natural gas pipeline assets under special permits that will allow it to operate those pipeline assets at higher than normal operating pressures of up to 0.80 of the pipe’s Specified Minimum Yield Strength (“SMYS”). Operating at higher than normal operating pressures will allow these pipelines to transport all of the volumes Boardwalk Pipeline has contracted for with its customers. PHMSA retains discretion whether to grant or maintain authority for Boardwalk Pipeline to operate its natural gas pipeline assets at higher pressures. PHMSA has also developed regulations that require transportation pipeline operators to implement integrity management programs to comprehensively evaluate certain high risk areas, known as high consequence areas (“HCAs”) along Boardwalk Pipeline’s pipelines and take additional measures to protect pipeline segments located in those areas, including highly populated areas. The NGPSA and HLPSA were most recently amended by the Pipeline Safety, Regulatory Certainty, and Job Creation Act of 2011 (“2011 Act”) in 2012. The 2011 Act increased the penalties for safety violations, established additional safety requirements for newly constructed pipelines and required studies of safety issues that could result in the adoption of new regulatory requirements by PHMSA for existing pipelines. More recently, in June of 2016, the NGPSA and HLPSA were amended by the Protecting Our Infrastructure of Pipelines and Enhancing Safety Act of 2016 (“2016 Act”), extending PHMSA’s statutory mandate through 2019 and, among other things, requiring PHMSA to complete certain of its outstanding mandates under the 2011 Act and developing new safety standards for natural gas storage facilities by June 22, 2018. The 2016 Act also empowers PHMSA to address imminent hazards by imposing emergency restrictions, prohibitions and safety measures on owners and operators of gas or hazardous liquid pipeline facilities without prior notice or an opportunity for a hearing. PHMSA issued interim regulations in October of 2016 to implement the agency’s expanded authority to address unsafe pipeline conditions or practices that pose an imminent hazard to life, property, or the environment. The Surface Transportation Board (“STB”), has authority to regulate the rates Boardwalk Pipeline charges for service on certain of its ethylene pipelines, while the Louisiana Public Service Commission (“LPSC”) regulates the rates Boardwalk Pipeline charges for service on its other NGL pipelines. The STB and LPSC require that Boardwalk Pipeline’s transportation rates are reasonable and that its practices cannot unreasonably discriminate among its shippers. Boardwalk Pipeline’s operations are also subject to extensive federal, state, and local laws and regulations relating to protection of the environment. Such laws and regulations impose, among other things, restrictions, liabilities and obligations in connection with the generation, handling, use, storage, transportation, treatment and disposal of hazardous substances and waste and in connection with spills, releases, discharges and emissions of various substances into the environment. Environmental regulations also require that Boardwalk Pipeline’s facilities, sites and other properties be operated, maintained, abandoned and reclaimed to the satisfaction of applicable regulatory authorities. Many states where Boardwalk Pipeline operates also have, or are developing, similar environmental or occupational health and safety legal requirements governing many of the same types of activities and those requirements can be more stringent than those adopted under federal laws and regulations. Failure to comply with these federal, state and local laws and regulations may result in the assessment of administrative, civil and criminal penalties, the imposition of corrective or remedial obligations, the occurrence of delays in the development or expansion of projects and the issuance of orders enjoining performance of some or all of Boardwalk Pipeline’s operations in the affected areas. Historically, Boardwalk Pipeline’s environmental compliance costs have not had a material adverse effect on its business, but there can be no assurance that continued compliance with existing requirements will not materially affect them, or that the current regulatory standards will not become more onerous in the future, resulting in more significant costs to maintain compliance or increased exposure to significant liabilities.

13
Item 1. BusinessBoardwalk Pipeline Partners, LP – (Continued)
Properties: Boardwalk Pipeline is headquartered in approximately 103,000 square feet of leased office space located in Houston, Texas. Boardwalk Pipeline also leases approximately 60,000 square feet of office space in Owensboro, Kentucky. Boardwalk Pipeline’s operating subsidiaries own their respective pipeline systems in fee. However, substantial portions of these systems are constructed and maintained on property owned by others pursuant to rights-of-way, easements, permits, licenses or consents.
LOEWS HOTELS HOLDING CORPORATION Loews Hotels Holding Corporation (together with its subsidiaries, “Loews Hotels”), through its subsidiaries, operates a chain of 25 primarily upper, upscale hotels. Thirteen of these hotels are owned by Loews Hotels, ten are owned by joint ventures in which Loews Hotels has equity interests and two are managed for unaffiliated owners. Loews Hotels’ earnings are derived from the operation of its wholly owned hotels, its share of earnings in joint venture hotels and hotel management fees earned from both joint venture and managed hotels. Loews Hotels accounted for 5.1%, 4.5% and 3.3% of our consolidated total revenue for the years ended December 31, 2016, 2015 and 2014. The hotels are described below.
Number ofName and Location Rooms Owned: Loews Annapolis Hotel, Annapolis, Maryland 215 Loews Chicago Hotel, Chicago, Illinois 400 Loews Chicago O’Hare Hotel, Chicago, Illinois 556 Loews Coronado Bay Resort, San Diego, California (a) 439 Loews Miami Beach Hotel, Miami Beach, Florida 790 Loews Minneapolis Hotel, Minneapolis, Minnesota (a) 251 Loews Philadelphia Hotel, Philadelphia, Pennsylvania 581 Loews Regency New York Hotel, New York, New York (a) 379 Loews Regency San Francisco Hotel, San Francisco, California 155 Hotel 1000, Seattle, Washington 120 Loews Vanderbilt Hotel, Nashville, Tennessee 340 Loews Ventana Canyon Resort, Tucson, Arizona 398 Loews Hotel Vogue, Montreal, Canada 142 Joint Venture: Hard Rock Hotel, at Universal Orlando, Orlando, Florida 650 Loews Atlanta Hotel, Atlanta, Georgia 414 Loews Boston Hotel, Boston, Massachusetts 225 Loews Don CeSar Hotel, St. Pete Beach, Florida (b) 347 Loews Hollywood Hotel, Hollywood, California 628 Loews Madison Hotel, Washington, D.C. 356 Loews Portofino Bay Hotel, at Universal Orlando, Orlando, Florida 750 Loews Royal Pacific Resort, at Universal Orlando, Orlando, Florida 1,000 Loews Sapphire Falls Resort, at Universal Orlando, Orlando, Florida 1,000 Universal’s Cabana Bay Beach Resort, Orlando, Florida 1,800 Management Contract: Loews New Orleans Hotel, New Orleans, Louisiana 285 Loews Santa Monica Beach Hotel, Santa Monica, California 347 (a) Subject to a land lease. (b) Expected to be sold in the first quarter of 2017. Competition: Competition from other hotels and lodging facilities is vigorous in all areas in which Loews Hotels operates. The demand for hotel rooms is seasonal and dependent on general and local economic conditions. Loews Hotels properties also compete with facilities offering similar services in locations other than those in which its hotels are located. Competition among luxury hotels is based primarily on quality of location, facilities and service.

14
Item 1. Business Loews Hotels Holding Corporation – (Continued) Competition among resort and commercial hotels is based on price and facilities as well as location and service. Because of the competitive nature of the industry, hotels must continually make expenditures for updating, refurnishing and repairs and maintenance, in order to prevent competitive obsolescence. Recent Developments:
In January of 2016, Loews Hotels acquired a hotel in Seattle, Washington, which is now operating as the
Hotel 1000;
In the third quarter of 2016, the Loews Sapphire Falls Resort, a 1,000 guestroom hotel at Universal Orlando, opened;
In the first quarter of 2017, the sale of the Loews Don CeSar Hotel in St. Pete Beach, Florida, a property in
which Loews Hotels has a joint venture interest, is expected to be completed;
In 2017, Universal Orlando’s Cabana Bay Beach Resort is expected to complete a 400 guestroom expansion; and
In 2018, Universal Orlando’s Aventura Hotel, a 600 guestroom hotel, is expected to open. As with Loews
Hotels’ other properties at Universal Orlando, Loews Hotels has a 50% joint venture interest in this hotel.
EMPLOYEE RELATIONS Including our operating subsidiaries as described below, we employed approximately 15,800 persons at December 31, 2016. CNA employed approximately 6,700 persons. Diamond Offshore employed approximately 2,800 persons, including international crew personnel furnished through independent labor contractors. Boardwalk Pipeline employed approximately 1,280 persons, approximately 110 of whom are union members covered under collective bargaining units. Loews Hotels employed approximately 4,775 persons, approximately 1,760 of whom are union members covered under collective bargaining units. We, and our subsidiaries, have experienced satisfactory labor relations.
15
Item 1. Business
EXECUTIVE OFFICERS OF THE REGISTRANT
First Became
Name Position and Offices Held Age Officer Marc A. Alpert Senior Vice President, General Counsel and Secretary 54 2016 David B. Edelson Senior Vice President and Chief Financial Officer 57 2005 Richard W. Scott Senior Vice President and Chief Investment Officer 63 2009 Kenneth I. Siegel Senior Vice President 59 2009 Andrew H. Tisch Office of the President, Co-Chairman of the Board 67 1985 and Chairman of the Executive Committee James S. Tisch Office of the President, President and 64 1981 Chief Executive Officer Jonathan M. Tisch Office of the President and Co-Chairman of the Board 63 1987 Andrew H. Tisch and James S. Tisch are brothers and are cousins of Jonathan M. Tisch. None of our other executive officers or directors is related to any other. All of our executive officers, except for Marc A. Alpert and David B. Edelson, have served in their current roles at the Company for at least the past five years. Prior to assuming his current role at the Company in July of 2016, Mr. Alpert served as a partner and head of the Public Companies Practice Group at the law firm of Chadbourne & Parke LLP. Mr. Edelson served as our Senior Vice President prior to May of 2014, when he assumed his current role. Officers are elected annually and hold office until their successors are elected and qualified, and are subject to removal by the Board of Directors.
AVAILABLE INFORMATION Our website address is www.loews.com. We make available, free of charge, through the website our Annual Report on Form 10-K, Quarterly Reports on Form 10-Q, Current Reports on Form 8-K and amendments to those reports filed or furnished pursuant to Section 13(a) or 15(d) of the Securities Exchange Act of 1934, as amended, as soon as reasonably practicable after these reports are electronically filed with or furnished to the SEC. Copies of our Code of Business Conduct and Ethics, Corporate Governance Guidelines, Audit Committee charter, Compensation Committee charter and Nominating and Governance Committee charter have also been posted and are available on our website. Information on or accessible through our website is not incorporated by reference into this Report. Item 1A. RISK FACTORS. Our business and the businesses of our subsidiaries face many risks and uncertainties. These risks and uncertainties could lead to events or circumstances that have a material adverse effect on our business, results of operations, cash flows, financial condition or equity and/or the business, results of operations, financial condition or equity of one or more of our subsidiaries. We have described below the most significant risks facing us and our subsidiaries. There may be additional risks that we do not yet know of or that we do not currently perceive to be as significant that may also impact our business or the businesses of our subsidiaries. You should carefully consider and evaluate all of the information included in this Report and any subsequent reports we may file with the SEC and the information we make available to the public before investing in any securities issued by us. Our subsidiaries, CNA Financial Corporation, Diamond Offshore Drilling, Inc. and Boardwalk Pipeline Partners, LP, are public companies and file reports with the SEC. You are also cautioned to carefully review and consider the information contained in the reports filed by those subsidiaries with the SEC and the information they make available to the public before investing in any of their securities.
16
Item 1A. Risk Factors Risks Related to Us and Our Subsidiary, CNA Financial Corporation If CNA determines that its recorded insurance reserves are insufficient to cover its estimated ultimate unpaid liability for claim and claim adjustment expenses, CNA may need to increase its insurance reserves which would result in a charge to CNA’s earnings. CNA maintains insurance reserves to cover its estimated ultimate unpaid liability for claim and claim adjustment expenses, including the estimated cost of the claims adjudication process, for reported and unreported claims. Insurance reserves are not an exact calculation of liability but instead are complex management estimates developed utilizing a variety of actuarial reserve estimation techniques as of a given reporting date. The reserve estimation process involves a high degree of judgment and variability and is subject to a number of factors which are highly uncertain. These variables can be affected by both changes in internal processes and external events. Key variables include claims severity, frequency of claims, mortality, morbidity, discount rates, inflation, claims handling policies and procedures, case reserving approach, underwriting and pricing policies, changes in the legal and regulatory environment and the lag time between the occurrence of an insured event and the time of its ultimate settlement. Mortality is the relative incidence of death. Morbidity is the frequency and severity of injury, illness, sickness and diseases contracted. There is generally a higher degree of variability in estimating required reserves for long-tail coverages, such as general liability and workers’ compensation, as they require a relatively longer period of time for claims to be reported and settled. The impact of changes in inflation and medical costs are also more pronounced for long-tail coverages due to the longer settlement period. CNA is also subject to the uncertain effects of emerging or potential claims and coverage issues that arise as industry practices and legal, judicial, social, economic and other environmental conditions change. These issues have had, and may continue to have, a negative effect on CNA’s business by either extending coverage beyond the original underwriting intent or by increasing the number or size of claims, resulting in further increases in CNA’s reserves. The effects of unforeseen emerging claim and coverage issues are extremely difficult to predict. Emerging or potential claims and coverage issues include, but are not limited to, uncertainty in future medical costs in workers’ compensation. In particular, medical cost inflation could be greater than expected due to new treatments, drugs and devices; increased health care utilization; and/or the future costs of health care facilities. In addition, the relationship between workers’ compensation and government and private health care providers could change, potentially shifting costs to workers’ compensation. In light of the many uncertainties associated with establishing the estimates and making the judgments necessary to establish reserve levels, CNA continually reviews and changes its reserve estimates in a regular and ongoing process as experience develops from the actual reporting and settlement of claims and as the legal, regulatory and economic environment evolves. If CNA’s recorded reserves are insufficient for any reason, the required increase in reserves would be recorded as a charge against earnings in the period in which reserves are determined to be insufficient. These charges could be substantial. CNA’s actual experience could vary from the key assumptions used to determine active life reserves for long term care policies. CNA’s active life reserves for long term care policies are based on CNA’s best estimate assumptions as of December 31, 2015 due to an unlocking at that date. Key assumptions include morbidity, persistency (the percentage of policies remaining in force), discount rate and future premium rate increases. These assumptions, which are critical bases for its reserve estimates are inherently uncertain. If actual experience varies from these assumptions or the future outlook for these assumptions changes, CNA may be required to increase its reserves. See the Non-Core Long Term Care Policyholder Reserves portion of the Insurance Reserves section of MD&A under Item 7 for more information. Estimating future experience for long term care policies is highly uncertain because the required projection period is very long and there is limited historical and industry data available to CNA, as only a small portion of the long term care policies which have been written to date are in claims paying status. Morbidity and persistency trends can

17
Item 1A. Risk Factors
be volatile and may be negatively affected by many factors including, but not limited to, policyholder behavior, judicial decisions regarding policy terms, socioeconomic factors, cost of care inflation, changes in health trends and advances in medical care. A prolonged period during which interest rates remain at levels lower than those anticipated in CNA’s reserving would result in shortfalls in investment income on assets supporting CNA’s obligations under long term care policies, which may require changes to its reserves. This risk is more significant for CNA’s long term care products because the long potential duration of the policy obligations exceeds the duration of the supporting investment assets. Further, changes to the corporate tax code may also impact the rate at which CNA discounts its reserves. In addition, CNA may not receive regulatory approval for the level of premium rate increases it requests. Any adverse deviation between the level of future premium rate increases approved and the level included in CNA’s reserving assumptions may require an increase to its reserves. If CNA’s estimated reserves are insufficient for any reason, including changes in assumptions, the required increase in reserves would be recorded as a charge against earnings in the period in which reserves are determined to be insufficient. These charges could be substantial. Catastrophe losses are unpredictable and could result in material losses. Catastrophe losses are an inevitable part of CNA’s business. Various events can cause catastrophe losses. These events can be natural or man-made, and may include hurricanes, windstorms, earthquakes, hail, severe winter weather, fires, floods, riots, strikes, civil commotion and acts of terrorism. The frequency and severity of these catastrophe events are inherently unpredictable. In addition, longer-term natural catastrophe trends may be changing and new types of catastrophe losses may be developing due to climate change, a phenomenon that has been associated with extreme weather events linked to rising temperatures, and includes effects on global weather patterns, greenhouse gases, sea, land and air temperatures, sea levels, rain, hail and snow. The extent of CNA’s losses from catastrophes is a function of the total amount of its insured exposures in the affected areas, the frequency and severity of the events themselves, the level of reinsurance assumed and ceded, reinsurance reinstatement premiums and state residual market assessments, if any. It can take a long time for the ultimate cost of any catastrophe losses to CNA to be finally determined, as a multitude of factors contribute to such costs, including evaluation of general liability and pollution exposures, infrastructure disruption, business interruption and reinsurance collectibility. Reinsurance coverage for terrorism events is provided only in limited circumstances, especially in regard to “unconventional” terrorism acts, such as nuclear, biological, chemical or radiological attacks. As a result of the items discussed above, catastrophe losses are particularly difficult to estimate. Additionally, claim frequency and severity for some lines of business can be correlated to an external factor such as economic activity, financial market volatility, increasing health care costs or changes in the legal or regulatory environment. Claim frequency and severity can also be correlated to insureds’ use of common business practices, equipment, vendors or software. This can result in multiple insured losses emanating out of the same underlying cause. In these instances, CNA may be subject to increased claim frequency and severity across multiple policies or lines of business concurrently. While CNA does not define such instances as catastrophes for financial reporting purposes, they are similar to catastrophes in terms of the uncertainty and potential impact on its results. CNA has exposure related to A&EP claims, which could result in material losses. CNA’s property and casualty insurance subsidiaries have exposures related to A&EP claims. CNA’s experience has been that establishing claim and claim adjustment expense reserves for casualty coverages relating to A&EP claims is subject to uncertainties that are greater than those presented by other claims. Additionally, traditional actuarial methods and techniques employed to estimate the ultimate cost of claims for more traditional property and casualty exposures are less precise in estimating claim and claim adjustment expense reserves for A&EP. As a result, estimating the ultimate cost of both reported and unreported A&EP claims is subject to a higher degree of variability.

18
Item 1A. Risk Factors On August 31, 2010, CNA completed a retroactive reinsurance transaction under which substantially all of its legacy A&EP liabilities were ceded to National Indemnity Company (“NICO”), a subsidiary of Berkshire Hathaway Inc., subject to an aggregate limit of $4.0 billion (“loss portfolio transfer” or “LPT”). The cumulative amount ceded under the loss portfolio transfer as of December 31, 2016 is $2.8 billion. If the other parties to the loss portfolio transfer do not fully perform their obligations, net losses incurred on A&EP claims covered by the loss portfolio transfer exceed the aggregate limit of $4.0 billion or CNA determines it has exposures to A&EP claims not covered by the loss portfolio transfer, CNA may need to increase its recorded net reserves which would result in a charge against earnings. These charges could be substantial. CNA uses analytical models to assist its decision making in key areas such as pricing, reserving and capital modeling and may be adversely affected if actual results differ materially from the model outputs and related analyses. CNA uses various modeling techniques and data analytics (e.g., scenarios, predictive, stochastic and/or forecasting) to analyze and estimate exposures, loss trends and other risks associated with its assets and liabilities. This includes both proprietary and third party modeled outputs and related analyses to assist in decision-making related to underwriting, pricing, capital allocation, reserving, investing, reinsurance and catastrophe risk, among other things. CNA incorporates therein numerous assumptions and forecasts about the future level and variability of policyholder behavior, loss frequency and severity, interest rates, equity markets, inflation, capital requirements, and currency exchange rates, among others. The modeled outputs and related analyses from both proprietary and third parties are subject to the inherent limitations of any statistical analysis, including those arising from the use of historical internal and industry data and assumptions. In addition, the effectiveness of any model can be degraded by operational risks including, but not limited to, the improper use of the model, including input errors, data errors and human error. As a result, actual results may differ materially from CNA’s modeled results. The profitability and financial condition of CNA substantially depends on the extent to which its actual experience is consistent with the assumptions CNA uses in its models and the ultimate model outputs. If, based upon these models or other factors, CNA misprices its products or fails to appropriately estimate the risks it is exposed to, its business, financial condition, results of operations or liquidity may be adversely affected. CNA faces intense competition in its industry. All aspects of the insurance industry are highly competitive and CNA must continuously allocate resources to refine and improve its insurance products and services to remain competitive. CNA competes with a large number of stock and mutual insurance companies and other entities, some of which may be larger or have greater financial or other resources than CNA does, for both distributors and customers. This includes agents and brokers who may increasingly compete with CNA to the extent that they continue to have direct access to providers of capital seeking exposure to insurance risk. Insurers compete on the basis of many factors, including products, price, services, ratings and financial strength. The competitor insurer landscape has evolved substantially in recent years, with significant consolidation and new market entrants, resulting in increased pressures on CNA’s ability to remain competitive, particularly in implementing pricing that is both attractive to CNA’s customer base and risk appropriate to CNA. The property and casualty market is cyclical and has experienced periods characterized by relatively high levels of price competition, resulting in less restrictive underwriting standards and relatively low premium rates, followed by periods of relatively lower levels of competition, more selective underwriting standards and relatively high premium rates. During periods in which price competition is high, CNA may lose business to competitors offering competitive insurance products at lower prices. As a result, CNA’s premium levels and expense ratio could be materially adversely impacted. CNA markets its insurance products worldwide primarily through independent insurance agents and insurance brokers, who also promote and distribute the products of CNA’s competitors. Any change in CNA’s relationships with its distribution network agents and brokers, including as a result of consolidation and their increased promotion and distribution of CNA’s competitors’ products, could adversely affect CNA’s ability to sell its products. As a result, CNA’s business volume and results of operations could be materially adversely impacted.

19
Item 1A. Risk Factors
CNA purchases reinsurance to help manage its exposure to risk. Under CNA’s ceded reinsurance arrangements, another insurer assumes a specified portion of CNA’s exposure in exchange for a specified portion of policy premiums. Market conditions determine the availability and cost of the reinsurance protection CNA purchases, which affects the level of its business and profitability, as well as the level and types of risk CNA retains. If CNA is unable to obtain sufficient reinsurance at a cost it deems acceptable, CNA may be unwilling to bear the increased risk and would reduce the level of its underwriting commitments. CNA may be adversely affected by technological changes or disruptions in the insurance marketplace. Technological changes in the way insurance transactions are completed in the marketplace, and CNA’s ability to react effectively to such change, may present significant competitive risks. For example, more insurers are utilizing “big data” analytics to make underwriting and other decisions that impact product design and pricing. If such utilization is more effective than how CNA uses similar data and information, CNA will be at a competitive disadvantage. There can be no assurance that CNA will continue to compete effectively with its industry peers due to technological changes; accordingly this may have a material adverse effect on CNA’s business and results of operations. In addition, agents and brokers, technology companies or other third parties may create alternate distribution channels for commercial business that may adversely impact product differentiation and pricing. For example, they may create a digitally enabled distribution channel that may adversely impact CNA’s competitive position. CNA’s efforts or the efforts of agents and brokers with respect to new products or alternate distribution channels, as well as changes in the way agents and brokers utilize greater levels of data and technology, could adversely impact CNA’s business relationships with independent agents and brokers who currently market its products, resulting in a lower volume and/or profitability of business generated from these sources. CNA may not be able to collect amounts owed to it by reinsurers, which could result in higher net incurred losses. CNA has significant amounts recoverable from reinsurers which are reported as receivables on its balance sheets and are estimated in a manner consistent with claim and claim adjustment expense reserves or future policy benefits reserves. The ceding of insurance does not, however, discharge CNA’s primary liability for claims. As a result, CNA is subject to credit risk relating to its ability to recover amounts due from reinsurers. Certain of CNA’s reinsurance carriers have experienced credit downgrades by rating agencies within the term of CNA’s contractual relationship, which indicates an increase in the likelihood that CNA will not be able to recover amounts due. In addition, reinsurers could dispute amounts which CNA believes are due to it. If the amounts due from reinsurers that CNA is able to collect are less than the amount recorded by CNA with respect to such amounts due, its incurred losses will be higher. CNA may not be able to collect amounts owed to it by policyholders who hold deductible policies and/or who purchase retrospectively rated policies, which could result in higher net incurred losses. A portion of CNA’s business is written under deductible policies. Under these policies, CNA is obligated to pay the related insurance claims and is reimbursed by the policyholder to the extent of the deductible, which may be significant. Moreover, certain policyholders purchase retrospectively rated workers’ compensation policies (i.e., policies in which premiums are adjusted after the policy period based on the actual loss experience of the policyholder during the policy period). Retrospectively rated policies expose CNA to additional credit risk to the extent that the adjusted premium is greater than the original premium, which may be significant. As a result, CNA is exposed to policyholder credit risk. If the amounts due from policyholders that CNA is able to collect are less than the amounts recorded with respect to such amounts due, CNA’s net incurred losses will be higher. CNA may incur significant realized and unrealized investment losses and volatility in net investment income arising from changes in the financial markets. CNA’s investment portfolio is exposed to various risks, such as interest rate, credit spread, issuer default, equity prices and foreign currency, which are unpredictable. Financial markets are highly sensitive to changes in economic conditions, monetary policies, tax policies, domestic and international geopolitical issues and many other factors. Changes in financial markets including fluctuations in interest rates, credit, equity prices and foreign currency

20
Item 1A. Risk Factors prices, and many other factors beyond CNA’s control can adversely affect the value of its investments, the realization of investment income and the rate at which it discounts certain liabilities. CNA has significant holdings in fixed maturity investments that are sensitive to changes in interest rates. A decline in interest rates may reduce the returns earned on new fixed maturity investments, thereby reducing CNA’s net investment income, while an increase in interest rates may reduce the value of its existing fixed maturity investments. The value of CNA’s fixed maturity investments is also subject to risk that certain investments may default or become impaired due to deterioration in the financial condition of issuers of the investments CNA holds or in the underlying collateral of the security. Any such impairments which CNA deems to be other-than-temporary would result in a charge to earnings. In addition, CNA invests a portion of its assets in equity securities and limited partnerships which are subject to greater market volatility than its fixed maturity investments. Limited partnership investments generally provide a lower level of liquidity than fixed maturity or equity investments, which may also limit CNA’s ability to withdraw assets. Further, CNA holds a portfolio of commercial mortgage loans. CNA is subject to credit risk relating to its ability to recover amounts due from the borrowers as a result of the creditworthiness of the borrowers or tenants of credit tenant loan properties. If the amounts CNA collects from the borrowers is less than the amount recorded, it would result in a charge to earnings. As a result of all of these factors, CNA may not earn an adequate return on its investments, may be required to write down the value of its investments and may incur losses on the disposition of its investments. Inability to detect and prevent significant employee or third party service provider misconduct or inadvertent errors and omissions could result in a material adverse effect on CNA’s operations. CNA may incur losses which arise from employees or third party service providers engaging in intentional misconduct, fraud, errors and omissions, failure to comply with internal guidelines, including with respect to underwriting authority, or failure to comply with regulatory requirements. CNA’s controls may not be able to detect all possible circumstances of employee and third party service provider non-compliant activity and the internal structures in place to prevent this activity may not be effective in all cases. Any losses relating to such non-compliant activity could adversely affect CNA’s results of operations. CNA is subject to capital adequacy requirements and, if it is unable to maintain or raise sufficient capital to meet these requirements, regulatory agencies may restrict or prohibit CNA from operating its business. Insurance companies such as CNA are subject to capital adequacy standards set by regulators to help identify companies that merit further regulatory attention. These standards apply specified risk factors to various asset, premium and reserve components of CNA’s legal entity statutory basis of accounting financial statements. Current rules, including those promulgated by insurance regulators and specialized markets such as Lloyd’s, require companies to maintain statutory capital and surplus at a specified minimum level determined using the applicable jurisdiction’s regulatory capital adequacy formula. If CNA does not meet these minimum requirements, CNA may be restricted or prohibited from operating its business in the applicable jurisdictions and specialized markets. If CNA is required to record a material charge against earnings in connection with a change in estimated insurance reserves, the occurrence of a catastrophic event or if it incurs significant losses related to its investment portfolio, which severely deteriorates its capital position, CNA may violate these minimum capital adequacy requirements unless it is able to raise sufficient additional capital. CNA may be limited in its ability to raise significant amounts of capital on favorable terms or at all. Globally, insurance regulators are working cooperatively to develop a common framework for the supervision of internationally active insurance groups. Finalization and adoption of this framework could increase CNA’s minimum regulatory capital requirement as well as significantly increase its cost of regulatory compliance.

21
Item 1A. Risk Factors
CNA’s insurance subsidiaries, upon whom CNA depends for dividends in order to fund its corporate obligations, are limited by insurance regulators in their ability to pay dividends. CNA is a holding company and is dependent upon dividends, loans and other sources of cash from its subsidiaries in order to meet its obligations. Ordinary dividend payments or dividends that do not require prior approval by the insurance subsidiaries’ domiciliary insurance regulator are generally limited to amounts determined by formulas that vary by jurisdiction. If CNA is restricted from paying or receiving intercompany dividends, by regulatory rule or otherwise, CNA may not be able to fund its corporate obligations and debt service requirements from available cash. As a result, CNA would need to look to other sources of capital which may be more expensive or may not be available at all. Rating agencies may downgrade their ratings of CNA and thereby adversely affect its ability to write insurance at competitive rates or at all. Ratings are an important factor in establishing the competitive position of insurance companies. CNA’s insurance company subsidiaries, as well as CNA’s public debt, are rated by rating agencies, including, A.M. Best Company (“A.M. Best”), Moody’s Investors Service, Inc. (“Moody’s”) and S&P Global Ratings (“S&P”). Ratings reflect the rating agency’s opinions of an insurance company’s or insurance holding company’s financial strength, capital adequacy, operating performance, strategic position and ability to meet its obligations to policyholders and debt holders. The rating agencies may take action to lower CNA’s ratings in the future as a result of any significant financial loss or possible changes in the methodology or criteria applied by the rating agencies. The severity of the impact on CNA’s business is dependent on the level of downgrade and, for certain products, which rating agency takes the rating action. Among the adverse effects in the event of such downgrades would be the inability to obtain a material volume of business from certain major insurance brokers, the inability to sell a material volume of CNA’s insurance products to certain markets and the required collateralization of certain future payment obligations or reserves. In addition, it is possible that a significant lowering of our corporate debt ratings by certain of the rating agencies could result in an adverse impact on CNA’s ratings, independent of any change in CNA’s circumstances. CNA is subject to extensive regulations that restrict its ability to do business and generate revenues. The insurance industry is subject to comprehensive and detailed regulation and supervision. Most insurance regulations are designed to protect the interests of CNA’s policyholders and third-party claimants rather than its investors. Each jurisdiction in which CNA does business has established supervisory agencies that regulate the manner in which CNA conducts its business. Any changes in regulation could also impose significant burdens on CNA. In addition, the Lloyd’s marketplace sets rules under which its members, including CNA’s Hardy syndicate, operate. These rules and regulations relate to, among other things, the standards of solvency (including risk-based capital measures), government-supported backstops for certain catastrophic events (including terrorism), investment restrictions, accounting and reporting methodology, establishment of reserves and potential assessments of funds to settle covered claims against impaired, insolvent or failed private or quasi-governmental insurers. Regulatory powers also extend to premium rate regulations which require that rates not be excessive, inadequate or unfairly discriminatory. State jurisdictions ensure compliance with such regulations through market conduct exams, which may result in losses to the extent non-compliance is ascertained, either as a result of failure to document transactions properly or failure to comply with internal guidelines, or otherwise. CNA may also be required by the jurisdictions in which it does business to provide coverage to persons who would not otherwise be considered eligible or restrict CNA from withdrawing from unprofitable lines of business or unprofitable market areas. Each jurisdiction dictates the types of insurance and the level of coverage that must be provided to such involuntary risks. CNA’s share of these involuntary risks is mandatory and generally a function of its respective share of the voluntary market by line of insurance in each jurisdiction.

22
Item 1A. Risk Factors The United Kingdom’s expected exit from the European Union is expected to increase the complexity and cost of regulatory compliance of CNA’s European business. On June 23, 2016, the U.K. held a referendum in which voters approved an exit from the European Union (“E.U.”), commonly referred to as “Brexit.” As a result of the referendum, it is currently expected that the British government will formally commence the process to leave the E.U. and begin negotiating the terms of treaties that will govern the U.K.’s future relationship with the E.U. in the first quarter of 2017. Although the terms of any future treaties are unknown, changes in CNA’s international operating platform may be required to allow CNA to continue to write business in the E.U. after the completion of Brexit. As a result of these changes, the complexity and cost of regulatory compliance of CNA’s European business is likely to increase. Risks Related to Us and Our Subsidiary, Diamond Offshore Drilling, Inc. The worldwide demand for Diamond Offshore’s drilling services has declined significantly as a result of the decline in oil prices, which commenced during the second half of 2014 and has continued into 2017. Demand for Diamond Offshore’s drilling services depends in large part upon the oil and natural gas industry’s offshore exploration and production activity and expenditure levels, which are directly affected by oil and gas prices and market expectations of potential changes in oil and gas prices. Commencing in the second half of 2014, oil prices have declined precipitously, falling to a 12-year low of less than $30 per barrel in January of 2016. Oil prices have recently rebounded to some extent, but continue to exhibit day-to-day volatility. The dramatic reduction in commodity prices has caused a sharp decline in the demand for offshore drilling services, including services that Diamond Offshore provides, and adversely affected Diamond Offshore’s operations and cash flows in 2015 and 2016, compared to previous years. A prolonged period of low oil prices would have a material adverse effect on many of Diamond Offshore’s customers and, therefore, on demand for its services and on its business. Oil prices have been, and are expected to continue to be, volatile and are affected by numerous factors beyond Diamond Offshore’s control, including:
worldwide supply of and demand for oil and gas;
the level of economic activity in energy-consuming markets;
the worldwide economic environment and economic trends, including recessions and the level of international trade activity;
the ability of the Organization of Petroleum Exporting Countries (“OPEC”) to set and maintain production
levels and pricing;
the level of production in non-OPEC countries;
civil unrest and the worldwide political and military environment, including uncertainty or instability resulting from an escalation or additional outbreak of armed hostilities involving the Middle East, Russia, other oil-producing regions or other geographic areas or further acts of terrorism in the United States or elsewhere;
the cost of exploring for, developing, producing and delivering oil and gas;
the discovery rate of new oil and gas reserves;
the rate of decline of existing and new oil and gas reserves and production;
available pipeline and other oil and gas transportation and refining capacity;
the ability of oil and gas companies to raise capital;

23
Item 1A. Risk Factors
weather conditions, including hurricanes, which can affect oil and gas operations over a wide area;
natural disasters or incidents resulting from operating hazards inherent in offshore drilling, such as oil spills;
the policies of various governments regarding exploration and development of their oil and gas reserves;
technological advances affecting energy consumption, including development and exploitation of alternative fuels or energy sources;
laws and regulations relating to environmental or energy security matters, including those purporting to
address global climate change;
domestic and foreign tax policy; and
advances in exploration and development technology. An increase in commodity demand and prices will not necessarily result in a prompt increase in offshore drilling activity since Diamond Offshore’s customers’ project development times, reserve replacement needs and expectations of future commodity demand, prices and supply of available competing rigs all combine to affect demand for its rigs. Diamond Offshore’s business depends on the level of activity in the offshore oil and gas industry, which has been cyclical and is significantly affected by many factors outside of its control. Demand for Diamond Offshore’s drilling services depends upon the level of offshore oil and gas exploration, development and production in markets worldwide, and those activities depend in large part on oil and gas prices, worldwide demand for oil and gas and a variety of political and economic factors. The level of offshore drilling activity is adversely affected when operators reduce or defer new investment in offshore projects, reduce or suspend their drilling budgets or reallocate their drilling budgets away from offshore drilling in favor of other priorities, such as shale or other land-based projects. As a result, Diamond Offshore’s business and the oil and gas industry in general are subject to cyclical fluctuations. As a result of the cyclical fluctuations in the market, there have been periods of lower demand, excess rig supply and lower dayrates, followed by periods of higher demand, shorter rig supply and higher dayrates. Diamond Offshore cannot predict the timing or duration of such fluctuations. Periods of lower demand or excess rig supply, which have occurred in the recent past and are continuing, intensify the competition in the industry and often result in periods of lower utilization and lower dayrates. During these periods, Diamond Offshore’s rigs may not obtain contracts for future work and may be idle for long periods of time or may be able to obtain work only under contracts with lower dayrates or less favorable terms which could have a material adverse effect on Diamond Offshore’s business during these periods. Additionally, prolonged periods of low utilization and dayrates could also result in the recognition of further impairment charges on certain of Diamond Offshore’s drilling rigs if future cash flow estimates, based upon information available to management at the time, indicate that the carrying value of these rigs may not be recoverable. Diamond Offshore’s industry is highly competitive, with oversupply and intense price competition. The offshore contract drilling industry is highly competitive with numerous industry participants. Some of Diamond Offshore’s competitors may be larger companies, have larger or more technologically advanced fleets and have greater financial or other resources than it does. The drilling industry has experienced consolidation in the past and may experience additional consolidation, which could create additional large competitors. Drilling contracts are traditionally awarded on a competitive bid basis. Price is typically the primary factor in determining which qualified contractor is awarded a job.

24
Item 1A. Risk Factors New rig construction and upgrades of existing drilling rigs, cancelation or termination of drilling contracts and established rigs coming off contract have contributed to the current oversupply of drilling rigs, intensifying price competition. Additional newbuild rigs entering the market are expected to further negatively impact rig utilization and intensify price competition as rigs are delivered. Diamond Offshore’s customer base is concentrated. Diamond Offshore provides offshore drilling services to a customer base that includes major and independent oil and gas companies and government-owned oil companies. During 2016, one of Diamond Offshore’s customers in the GOM, Anadarko, and Diamond Offshore’s five largest customers in the aggregate accounted for 22% and 65% of its annual total consolidated revenues. In addition, the number of customers Diamond Offshore has performed services for has declined from 35 in 2014 to 18 in 2016. The loss of a significant customer could have a material adverse impact on Diamond Offshore’s financial results, especially in a declining market where the number of Diamond Offshore’s working drilling rigs is declining along with the number of its active customers. In addition, if a significant customer experiences liquidity constraints or other financial difficulties, or elects to terminate one of Diamond Offshore’s drilling contracts, it could materially adversely affect utilization rates in the affected market and also displace demand for Diamond Offshore’s other drilling rigs as the resulting excess supply enters the market. Diamond Offshore can provide no assurance that its drilling contracts will not be terminated early or that its current backlog of contract drilling revenue will be ultimately realized. Currently, Diamond Offshore’s customers may terminate their drilling contracts under certain circumstances, such as the destruction or loss of a drilling rig or if Diamond Offshore suspends drilling operations for a specified period of time as a result of a breakdown of major equipment, excessive downtime for repairs, failure to meet minimum performance criteria (including customer acceptance testing) or, in some cases, due to other events beyond the control of either party. In addition, some of Diamond Offshore’s drilling contracts permit the customer to terminate the contract after specified notice periods, often by tendering contractually specified termination amounts, which may not fully compensate Diamond Offshore for the loss of the contract. During depressed market conditions, such as those currently in effect, certain customers have utilized such contract clauses to seek to renegotiate or terminate a drilling contract or claim that Diamond Offshore has breached provisions of its drilling contracts in order to avoid their obligations to Diamond Offshore under circumstances where Diamond Offshore believes it is in compliance with the contracts. For example, in August of 2016, Petrobras, the customer for the Ocean Valor, delivered a notice of termination of its drilling contract. Diamond Offshore is disputing in court the termination attempt as unlawful and has obtained a preliminary injunction against the termination, which Petrobras has appealed. Additionally, because of depressed commodity prices, restricted credit markets, economic downturns, changes in priorities or strategy or other factors beyond Diamond Offshore’s control, a customer may no longer want or need a rig that is currently under contract or may be able to obtain a comparable rig at a lower dayrate. For these reasons, customers may seek to renegotiate the terms of Diamond Offshore’s existing drilling contracts, terminate their contracts without justification or repudiate or otherwise fail to perform their obligations under the contracts. Such renegotiations could include requests to lower the contract dayrate in some cases, in exchange for additional contract term, shorten the term on one contracted rig in exchange for additional term on another rig, early termination of a contract in exchange for a lump sum payout and many other possibilities. Diamond Offshore’s contract backlog may be adversely impacted as a result of such contract terminations or renegotiations. When a customer terminates a contract prior to the contract’s scheduled expiration, Diamond Offshore’s contract backlog is adversely impacted and Diamond Offshore might not recover any compensation for the termination, or any recovery Diamond Offshore might obtain may not fully compensate it for the loss of the contract. In any case, the early termination of a contract may result in Diamond Offshore’s rig being idle for an extended period of time. Currently, Diamond Offshore’s reported contract backlog only includes future revenues under firm commitments; however, from time to time, Diamond Offshore may report anticipated commitments for which definitive agreements have not yet been, but are expected to be, executed. Diamond Offshore can provide no assurance in such cases that it will be able to ultimately execute a definitive agreement. In addition, for the reasons described above,

25
Item 1A. Risk Factors
Diamond Offshore can provide no assurance that its customers will be willing or able to fulfill their contractual commitments. Diamond Offshore may not be able to renew or replace expiring contracts for its rigs. As of the date of this Report, Diamond Offshore has a number of customer contracts that will expire in 2017 and 2018. Diamond Offshore’s ability to renew or replace expiring contracts or obtain new contracts, and the terms of any such contracts, will depend on various factors, including market conditions and the specific needs of its customers at such times. Given the historically cyclical and highly competitive nature of the industry, Diamond Offshore may not be able to renew or replace the contracts or it may be required to renew or replace expiring contracts or obtain new contracts at dayrates that are below, and potentially substantially below, existing dayrates, or that have terms that are less favorable than existing contracts. Moreover, Diamond Offshore may be unable to secure contracts for these rigs. Failure to secure contracts for a rig may result in a decision to cold stack the rig, which puts the rig at risk for impairment and may competitively disadvantage the rig as customers during the most recent market downturn have expressed a preference for ready or “hot” stacked rigs over cold-stacked rigs. Diamond Offshore’s contract drilling expense includes fixed costs that will not decline in proportion to decreases in rig utilization and dayrates. Diamond Offshore’s contract drilling expense includes all direct and indirect costs associated with the operation, maintenance and support of its drilling equipment, which is often not affected by changes in dayrates and utilization. During periods of reduced revenue and/or activity, certain of Diamond Offshore’s fixed costs will not decline and often it may incur additional operating costs, such as fuel and catering costs, for which it is generally reimbursed by the customer when a rig is under contract. During times of reduced utilization, reductions in costs may not be immediate as Diamond Offshore may incur additional costs associated with cold stacking of a rig (particularly if Diamond Offshore cold stacks a newer rig, such as a drillship, for which cold stacking costs are typically substantially higher than for a jack-up rig or an older floater rig), or it may not be able to fully reduce the cost of its support operations in a particular geographic region due to the need to support the remaining drilling rigs in that region. Accordingly, a decline in revenue due to lower dayrates and/or utilization may not be offset by a corresponding decrease in contract drilling expense. Diamond Offshore may enter into drilling contracts that expose it to greater risks than it normally assumes. From time to time, Diamond Offshore may enter into drilling contracts with national oil companies, government-controlled entities or others that expose it to greater risks than it normally assumes, such as exposure to greater environmental or other liability and more onerous termination provisions giving the customer a right to terminate without cause or upon little or no notice. Upon termination, these contracts may not result in a payment to Diamond Offshore, or if a termination payment is required, it may not fully compensate Diamond Offshore for the loss of a contract. Diamond Offshore is subject to extensive domestic and international laws and regulations that could significantly limit its business activities and revenues and increase its costs. Certain countries are subject to restrictions, sanctions and embargoes imposed by the United States government or other governmental or international authorities. These restrictions, sanctions and embargoes may prohibit or limit Diamond Offshore from participating in certain business activities in those countries. Diamond Offshore’s operations are also subject to numerous local, state and federal laws and regulations in the United States and in foreign jurisdictions concerning the containment and disposal of hazardous materials, the remediation of contaminated properties and the protection of the environment. The offshore drilling industry is dependent on demand for services from the oil and gas exploration industry and, accordingly, can be affected by changes in tax and other laws relating to the energy business generally. Diamond Offshore may be required to make significant expenditures for additional capital equipment or inspections and recertifications to comply with existing or new governmental laws and regulations. It is also possible that these laws and regulations may, in the future, add significantly to Diamond Offshore’s operating costs or result in a reduction in revenues associated with downtime required to install such equipment, or may otherwise significantly limit drilling activity.

26
Item 1A. Risk Factors In addition, Diamond Offshore’s business is negatively impacted when it performs certain regulatory inspections, which Diamond Offshore refers to as a special survey, that are due every five years for most of its rigs. The inspection interval for Diamond Offshore’s North Sea rigs is two and one half years. These special surveys are generally performed in a shipyard and require scheduled downtime, which can negatively impact operating revenue. Operating expenses increase as a result of these special surveys due to the cost to mobilize the rigs to a shipyard, and inspection, repair and maintenance costs. Repair and maintenance activities may result from the special survey or may have been previously planned to take place during this mandatory downtime. The number of rigs undergoing a special survey will vary from year to year, as well as from quarter to quarter. Diamond Offshore’s business may also be negatively impacted by intermediate surveys, which are performed at interim periods between special surveys. Although an intermediate survey normally does not require shipyard time, the survey may require some downtime for the rig. Diamond Offshore can provide no assurance as to the exact timing and/or duration of downtime associated with regulatory inspections, planned rig mobilizations and other shipyard projects. In April of 2016, the Bureau of Safety and Environmental Enforcement (“BSEE”) issued its final well control regulations in response to the 2010 Macondo well blowout and subsequent investigation into the causes of the event. The final well control rule, which became effective in July of 2016, resulted in reforms that consolidated new regulations regarding equipment and operational requirements pertaining to offshore oil and gas drilling, completions, workovers and decommissioning operations in the GOM to enhance safety and environmental protection. BSEE’s final rule focuses on blowout preventers (“BOPs”) and well-control requirements. Key features of the well control rule include requirements for BOPs, double shear rams, third-party reviews of equipment, real-time monitoring data, safe drilling margins, centralizers, inspections and other reforms related to well design and control, casing, cementing and subsea containment. BSEE’s new regulations under the well control rule, to be phased in over time, could require modifications or enhancements to existing systems and equipment, or require new equipment, and could increase Diamond Offshore’s operating costs and cause downtime for its rigs if it is required to take any of them out of service between scheduled surveys or inspections, or if it is required to extend scheduled surveys or inspections, to meet any such new requirements. Diamond Offshore is not able to predict the likelihood, nature or extent of any additional rulemaking or the future impact of these events on its operations. Additional governmental regulations concerning licensing, taxation, equipment specifications, training requirements or other matters could increase the costs of Diamond Offshore’s operations, and enhanced permitting requirements, as well as escalating costs borne by its customers, could reduce exploration activity in the GOM and therefore demand for its services. Governments in some countries are increasingly active in regulating and controlling the ownership of concessions, the exploration for oil and gas and other aspects of the oil and gas industry. The modification of existing laws or regulations or the adoption of new laws or regulations curtailing exploratory or developmental drilling for oil and gas for economic, environmental or other reasons could materially and adversely affect Diamond Offshore’s operations by limiting drilling opportunities. If Diamond Offshore or its customers are unable to acquire or renew permits and approvals required for drilling operations, Diamond Offshore may be forced to delay, suspend or cease its operations. Oil and natural gas exploration and production operations require numerous permits and approvals for Diamond Offshore and its customers from governmental agencies in the areas in which it operates or expects to operate. Obtaining all necessary permits and approvals may necessitate substantial expenditures to comply with the requirements of these permits and approvals, future changes to these permits or approvals, or any adverse change in the interpretation of existing permits and approvals. In addition, such regulatory requirements and restrictions could also delay or curtail Diamond Offshore’s operations. Contracts for Diamond Offshore’s drilling rigs are generally fixed dayrate contracts, and increases in Diamond Offshore’s operating costs could adversely affect the profitability of those contracts. Diamond Offshore’s contracts for its drilling rigs generally provide for the payment of a fixed dayrate per rig operating day, although some contracts do provide for a limited escalation in dayrate due to increased operating costs it incurs on the project. Many of Diamond Offshore’s operating costs, such as labor costs, are unpredictable and may fluctuate based on events beyond its control. In addition, equipment repair and maintenance expenses vary

27
Item 1A. Risk Factors
depending on the type of activity the rig is performing, the age and condition of the equipment and general market factors impacting relevant parts, components and services. The gross margin that Diamond Offshore realizes on these fixed dayrate contracts will fluctuate based on variations in its operating costs over the terms of the contracts. In addition, for contracts with dayrate escalation clauses, Diamond Offshore may not be able to fully recover increased or unforeseen costs from its customers. Diamond Offshore’s business involves numerous operating hazards which could expose it to significant losses and significant damage claims. Diamond Offshore is not fully insured against all of these risks and its contractual indemnity provisions may not fully protect Diamond Offshore. Diamond Offshore’s operations are subject to the significant hazards inherent in drilling for oil and gas offshore, such as blowouts, reservoir damage, loss of production, loss of well control, unstable or faulty sea floor conditions, fires and natural disasters such as hurricanes. The occurrence of any of these types of events could result in the suspension of drilling operations, damage to or destruction of the equipment involved and injury or death to rig personnel and damage to producing or potentially productive oil and gas formations, oil spillage, oil leaks, well blowouts and extensive uncontrolled fires, any of which could cause significant environmental damage. In addition, offshore drilling operations are subject to marine hazards, including capsizing, grounding, collision and loss or damage from severe weather. Operations also may be suspended because of machinery breakdowns, abnormal drilling conditions, failure of suppliers or subcontractors to perform or supply goods or services or personnel shortages. Any of the foregoing events could result in significant damage or loss to Diamond Offshore’s properties and assets or the properties and assets of others, injury or death to rig personnel or others, significant loss of revenues and significant damage claims against Diamond Offshore. Diamond Offshore’s drilling contracts with its customers provide for varying levels of indemnity and allocation of liabilities between its customers and Diamond Offshore with respect to the hazards and risks inherent in, and damages or losses arising out of, its operations, and Diamond Offshore may not be fully protected. Diamond Offshore’s contracts with its customers generally provide that Diamond Offshore and its customers each assume liability for their respective personnel and property. Diamond Offshore’s contracts also generally provide that its customers assume most of the responsibility for and indemnify Diamond Offshore against loss, damage or other liability resulting from, among other hazards and risks, pollution originating from the well and subsurface damage or loss, while Diamond Offshore typically retains responsibility for and indemnifies its customers against pollution originating from the rig. However, in certain drilling contracts Diamond Offshore may not be fully indemnified by its customers for damage to their property and/or the property of their other contractors. In certain contracts Diamond Offshore may assume liability for losses or damages (including punitive damages) resulting from pollution or contamination caused by negligent or willful acts of commission or omission by Diamond Offshore, its suppliers and/or subcontractors, generally (but not always) subject to negotiated caps on a per occurrence basis and/or on an aggregate basis for the term of the contract. In some cases, suppliers or subcontractors who provide equipment or services to Diamond Offshore may seek to limit their liability resulting from pollution or contamination. Diamond Offshore’s contracts are individually negotiated, and the levels of indemnity and allocation of liabilities in them can vary from contract to contract depending on market conditions, particular customer requirements and other factors existing at the time a contract is negotiated. Additionally, the enforceability of indemnification provisions in Diamond Offshore’s contracts may be limited or prohibited by applicable law or such provisions may not be enforced by courts having jurisdiction, and Diamond Offshore could be held liable for substantial losses or damages and for fines and penalties imposed by regulatory authorities. The indemnification provisions in Diamond Offshore’s contracts may be subject to differing interpretations, and the laws or courts of certain jurisdictions may enforce such provisions while other laws or courts may find them to be unenforceable, void or limited by public policy considerations, including when the cause of the underlying loss or damage is Diamond Offshore’s gross negligence or willful misconduct, when punitive damages are attributable to Diamond Offshore or when fines or penalties are imposed directly against Diamond Offshore. The law with respect to the enforceability of indemnities varies from jurisdiction to jurisdiction and is unsettled under certain laws that are applicable to Diamond Offshore’s contracts. Current or future litigation in particular jurisdictions, whether or not Diamond Offshore is a party, may impact the interpretation and enforceability of indemnification provisions in its contracts. There can be no assurance that Diamond Offshore’s contracts with its customers, suppliers and subcontractors will fully protect it against all hazards and risks inherent in its operations.

28
Item 1A. Risk Factors There can also be no assurance that those parties with contractual obligations to indemnify Diamond Offshore will be financially able to do so or will otherwise honor their contractual obligations. Diamond Offshore maintains liability insurance, which includes coverage for environmental damage; however, because of contractual provisions and policy limits, Diamond Offshore’s insurance coverage may not adequately cover its losses and claim costs. In addition, certain risks such as pollution, reservoir damage and environmental risks are generally not fully insurable. Also, Diamond Offshore does not typically purchase loss-of-hire insurance to cover lost revenues when a rig is unable to work. Diamond Offshore believes that the policy limit under its marine liability insurance is within the range that is customary for companies of its size in the offshore drilling industry and is appropriate for its business. However, if an accident or other event occurs that exceeds Diamond Offshore’s coverage limits or is not an insurable event under its insurance policies, or is not fully covered by contractual indemnity, it could result in significant loss to Diamond Offshore. There can be no assurance that Diamond Offshore will continue to carry the insurance it currently maintains, that its insurance will cover all types of losses or that Diamond Offshore will be able to maintain adequate insurance in the future at rates it considers to be reasonable or that Diamond Offshore will be able to obtain insurance against some risks. Significant portions of Diamond Offshore’s operations are conducted outside the United States and involve additional risks not associated with United States domestic operations. Diamond Offshore’s operations outside the United States accounted for approximately 66%, 79% and 85% of its total consolidated revenues for 2016, 2015 and 2014 and include, or have included, operations in South America, Australia and Southeast Asia, Europe, East and West Africa, the Mediterranean and Mexico. Because Diamond Offshore operates in various regions throughout the world, it is exposed to a variety of risks inherent in international operations, including risks of war, political disruption, civil disturbance, acts of terrorism, political corruption, possible economic and legal sanctions (such as possible restrictions against countries that the U.S. government may consider to be state sponsors of terrorism) and changes in global trade policies. Diamond Offshore may not have insurance coverage for these risks, or it may not be able to obtain adequate insurance coverage for such events at reasonable rates. Diamond Offshore’s operations may become restricted, disrupted or prohibited in any country in which any of these risks occur. In particular, Diamond Offshore is also subject to the following risks in connection with its international operations:
political and economic instability; piracy, terrorism or other assaults on property or personnel;
kidnapping of personnel;
seizure, expropriation, nationalization, deprivation, malicious damage or other loss of possession or use of
property or equipment; renegotiation or nullification of existing contracts;
disputes and legal proceedings in international jurisdictions;
changing social, political and economic conditions;
enactment of additional or stricter U.S. government or international sanctions;
imposition of wage and price controls, trade barriers, export controls or import-export quotas;
restrictive foreign and domestic monetary policies;
the inability to repatriate income or capital;

29
Item 1A. Risk Factors
difficulties in collecting accounts receivable and longer collection periods; fluctuations in currency exchange rates and restrictions on currency exchange;
regulatory or financial requirements to comply with foreign bureaucratic actions;
restriction or disruption of business activities;
limitation of access to markets for periods of time;
travel limitations or operational problems caused by public health threats or changes in immigration policies;
difficulties in supplying, repairing or replacing equipment or transporting personnel in remote locations;
difficulties in obtaining visas or work permits for employees on a timely basis; and
changing taxation policies and confiscatory or discriminatory taxation.
Diamond Offshore is also subject to the regulations of the U.S. Treasury Department’s Office of Foreign Assets Control and other U.S. laws and regulations governing its international operations in addition to domestic and international anti-bribery laws and sanctions and other restrictions imposed by other governmental or international authorities. In addition, international contract drilling operations are subject to various laws and regulations in countries in which Diamond Offshore operates, including laws and regulations relating to:
the equipping and operation of drilling rigs;
import-export quotas or other trade barriers;
repatriation of foreign earnings or capital;
oil and gas exploration and development;
local content requirements;
taxation of offshore earnings and earnings of expatriate personnel; and
use and compensation of local employees and suppliers by foreign contractors. Some foreign governments favor or effectively require the awarding of drilling contracts to local contractors, require use of a local agent or require foreign contractors to employ citizens of, or purchase supplies from, a particular jurisdiction. These practices may adversely affect Diamond Offshore’s ability to compete in those regions. It is difficult to predict what governmental regulations may be enacted in the future that could adversely affect the international offshore drilling industry. The actions of foreign governments may materially and adversely affect Diamond Offshore’s ability to compete against local competitors. In addition, the shipment of goods, including the movement of a drilling rig across international borders, subjects Diamond Offshore to extensive trade laws and regulations. Diamond Offshore’s import activities are governed by unique customs laws and regulations that differ in each of the countries in which Diamond Offshore operates and often impose record-keeping and reporting obligations. The laws and regulations concerning import/export activity and record-keeping and reporting requirements are complex and change frequently. These laws and regulations may be enacted, amended, enforced and/or interpreted in a manner adverse to Diamond Offshore. Shipments can be delayed and denied export or entry for a variety of reasons, some of which may be outside of Diamond Offshore’s control. Shipping delays or denials could cause unscheduled downtime for rigs. Failure to comply with these laws and regulations could result in criminal and civil penalties, economic sanctions, seizure of shipments and/or the contractual withholding of monies owed to Diamond Offshore, among other things.

30
Item 1A. Risk Factors Diamond Offshore has elected to self-insure for physical damage to rigs and equipment caused by named windstorms in the GOM. Because the amount of insurance coverage available to Diamond Offshore has been limited, and the cost for such coverage is substantial, Diamond Offshore self-insures for physical damage to rigs and equipment caused by named windstorms in the GOM. This results in a higher risk of losses, which could be material, that are not covered by third party insurance contracts. In addition, certain of Diamond Offshore’s shore-based facilities are located in geographic regions that are susceptible to damage or disruption from hurricanes and other weather events. Future hurricanes or similar natural disasters that impact Diamond Offshore’s facilities, its personnel located at those facilities or its ongoing operations may negatively affect its business. These negative effects may include or result from reduced or lost sales and revenues; costs associated with interruption in operations and with resuming operations; reduced demand for Diamond Offshore’s services from customers that were similarly affected by these events; lost market share; late deliveries; uninsured property losses; lack of or inadequate business interruption insurance; employee evacuations; and an inability to retain necessary staff. Diamond Offshore’s consolidated effective income tax rate may vary substantially from one reporting period to another. Diamond Offshore’s consolidated effective income tax rate is impacted by the mix between its domestic and international pre-tax earnings or losses, as well as the mix of the international tax jurisdictions in which it operates. Diamond Offshore cannot provide any assurances as to what its consolidated effective income tax rate will be in the future due to, among other factors, uncertainty regarding the nature and extent of its business activities in any particular jurisdiction in the future and the tax laws of such jurisdictions, as well as potential changes in U.S. and foreign tax laws, regulations or treaties or the interpretation or enforcement thereof, changes in the administrative practices and precedents of tax authorities or any reclassification or other matter (such as changes in applicable accounting rules) that increases the amounts Diamond Offshore has provided for income taxes or deferred tax assets and liabilities in its consolidated financial statements. This variability may cause its consolidated effective income tax rate to vary substantially from one reporting period to another. Diamond Offshore may be required to accrue additional tax liability on certain of its foreign earnings. Certain of Diamond Offshore’s international rigs are owned and operated, directly or indirectly, by Diamond Foreign Asset Company (“DFAC”), a Cayman Islands subsidiary that it owns. It is Diamond Offshore’s intention to indefinitely reinvest future earnings of DFAC and its foreign subsidiaries to finance foreign activities. Diamond Offshore does not expect to provide for U.S. taxes on any future earnings generated by DFAC and its foreign subsidiaries, except to the extent that these earnings are immediately subjected to U.S. federal income tax. Should a future distribution be made from any unremitted earnings of this subsidiary, Diamond Offshore may be required to record additional U.S. income taxes. Fluctuations in exchange rates and nonconvertibility of currencies could result in losses. Due to Diamond Offshore’s international operations, certain of its monetary assets and liabilities, including tax related liabilities, are denominated in a foreign currency. Fluctuations in currency exchange rates could increase or decrease the amount receivable or payable by Diamond Offshore. Diamond Offshore has experienced currency exchange losses where revenues are received and expenses are paid in nonconvertible currencies or where it does not effectively hedge an exposure to a foreign currency. Diamond Offshore may also incur losses as a result of an inability to collect revenues because of a shortage of convertible currency available to the country of operation, controls over currency exchange or controls over the repatriation of income or capital.

31
Item 1A. Risk Factors
Diamond Offshore must make substantial capital and operating expenditures to build, maintain, and upgrade its drilling fleet. Diamond Offshore’s business is highly capital intensive and dependent on having sufficient cash flow and/or available sources of financing in order to fund its desired capital expenditure requirements. Diamond Offshore can provide no assurance that it will have access to adequate or economical sources of capital to fund its capital expenditures. Diamond Offshore’s debt levels may limit its liquidity and flexibility in obtaining additional financing and in pursuing other business opportunities. As of December 31, 2016, Diamond Offshore had outstanding approximately $104 million in borrowings under its revolving credit facility and $2 billion of senior notes, maturing at various times from 2019 through 2043. As of February 10, 2017, Diamond Offshore had no outstanding borrowings and $1.5 billion available under its revolving credit facility to meet its short term liquidity requirements. Diamond Offshore may incur additional indebtedness in the future and borrow from time to time under its revolving credit facility to fund working capital or other needs, subject to compliance with its covenants. Diamond Offshore’s ability to meet its debt service obligations is dependent upon its future performance, which is subject to general economic conditions, industry cycles and financial, business and other factors affecting its operations, many of which are beyond its control. High levels of indebtedness could have negative consequences to Diamond Offshore, including:
it may have difficulty satisfying its obligations with respect to its outstanding debt;
it may have difficulty obtaining financing in the future for working capital, capital expenditures, acquisitions or other purposes;
it may need to use a substantial portion of available cash flow from operations to pay interest and
principal on its debt, which would reduce the amount of money available to fund working capital requirements, capital expenditures, the payment of dividends and other general corporate or business activities;
vulnerability to the effects of general economic downturns, adverse industry conditions and adverse
operating results could increase;
flexibility in planning for, or reacting to, changes in its business and in its industry in general could be limited;
it may not have the ability to pursue business opportunities that become available;
the amount of debt and the amount it must pay to service its debt obligations could place Diamond
Offshore at a competitive disadvantage compared to its competitors that have less debt;
customers may react adversely to its significant debt level and seek alternative service providers; and
failure to comply with the restrictive covenants in its debt instruments that, among other things, require Diamond Offshore to maintain a specified ratio of its consolidated indebtedness to total capitalization and limit the ability of its subsidiaries to incur debt, could result in an event of default that, if not cured or waived, could have a material adverse effect on its business.
In addition, approximately $500 million of Diamond Offshore’s long-term senior notes will mature over the next five years and will need to be paid or refinanced. Diamond Offshore may not be able to refinance its maturing debt upon commercially reasonable terms, or at all, depending on numerous factors, including its financial condition and prospects at the time and the then current state of the bank and capital markets in the U.S. Further, Diamond

32
Item 1A. Risk Factors Offshore’s liquidity may be adversely affected if it is unable to replace the revolving credit facility upon acceptable terms when it matures. In November of 2016, S&P downgraded Diamond Offshore’s corporate credit rating to BB+ from BBB, and, in January of 2017, further downgraded its corporate credit rating to BB-; the outlook remains negative. Diamond Offshore’s current corporate credit rating by Moody’s is Ba2, with a stable outlook. These credit ratings are below investment grade and could raise the cost of financing. As a consequence, Diamond Offshore may not be able to issue additional debt in amounts and/or with terms that it considers to be reasonable. Diamond Offshore’s revolving credit facility bears interest at variable rates, based on its corporate credit rating and market interest rates. If market interest rates increase, Diamond Offshore’s cost to borrow under its revolving credit facility may also increase. Favorable changes in Diamond Offshore’s current credit ratings could lower the fees that it pays under its revolving credit facility, however, any further downgrade in Diamond Offshore’s credit ratings would have no further impact on the applicable interest rate margins and fees under the revolving credit facility. Although Diamond Offshore may employ hedging strategies such that a portion of the aggregate principal amount outstanding under this credit facility would effectively carry a fixed rate of interest, any hedging arrangement put in place may not offer complete protection from this risk. Unionization efforts and labor regulations in some of the countries in which Diamond Offshore operates could materially increase its costs or limit its flexibility. Some of Diamond Offshore’s employees in non-U.S. markets are represented by labor unions and work under collective bargaining or similar agreements which are subject to periodic renegotiation. These negotiations could result in higher personnel expenses, other increased costs or increased operational restrictions. Efforts have been made from time to time to unionize other portions of Diamond Offshore’s workforce. In addition, Diamond Offshore may be subjected to strikes or work stoppages and other labor disruptions in certain countries. Additional unionization efforts, new collective bargaining agreements or work stoppages could materially increase Diamond Offshore’s costs, reduce its revenues or limit its flexibility. Rig conversions, upgrades or newbuilds may be subject to delays and cost overruns. From time to time, Diamond Offshore adds new capacity through conversions or upgrades to its existing rigs or through new construction. Projects of this type are subject to risks of delay or cost overruns inherent in any large construction project resulting from numerous factors, including the following:
shortages of equipment, materials or skilled labor;
work stoppages;
unscheduled delays in the delivery of ordered materials and equipment;
unanticipated cost increases or change orders;
weather interferences or storm damage;
difficulties in obtaining necessary permits or in meeting permit conditions;
design and engineering problems;
disputes with shipyards or suppliers;
availability of suppliers to recertify equipment for enhanced regulations;
customer acceptance delays;
shipyard failures or unavailability; and

33
Item 1A. Risk Factors
failure or delay of third party service providers, civil unrest and labor disputes. Failure to complete a rig upgrade or new construction on time, or failure to complete a rig conversion or new construction in accordance with its design specifications may, in some circumstances, result in the delay, renegotiation or cancellation of a drilling contract, resulting in a loss of contract drilling backlog and revenue to Diamond Offshore. If a drilling contract is terminated under these circumstances, Diamond Offshore may not be able to secure a replacement contract, or if it does secure a replacement contract, it may not contain equally favorable terms. In addition, impairment write-offs could result if a rig’s carrying value becomes excessive due to spending over budget on a newbuild construction project or major rig upgrade. Risks Related to Us and Our Subsidiary, Boardwalk Pipeline Partners, LP Boardwalk Pipeline may not be able to replace expiring natural gas transportation contracts at attractive rates or on a long-term basis and may not be able to sell short-term services at attractive rates or at all due to market conditions. Each year, a portion of Boardwalk Pipeline’s firm natural gas transportation contracts expire and need to be renewed or replaced. Over the past several years, Boardwalk Pipeline has renewed some expiring contracts at lower rates and for shorter terms than in the past, and in some cases, it remarketed the capacity to other customers. Boardwalk Pipeline expects this trend to continue, including for the contracts entered into in 2008 and 2009 related to its East Texas Pipeline, Southeast Expansion, Gulf Crossing Pipeline, and Fayetteville and Greenville Lateral growth projects. These projects are supported by firm transportation agreements, typically having a term of ten years and priced based on then current market conditions. As the terms of these contracts expire in 2018 and 2019, Boardwalk Pipeline will have significantly more transportation contract expirations than it has had during the past several years. Boardwalk Pipeline cannot predict what market conditions will prevail when these contracts expire. If these contracts are renewed, Boardwalk Pipeline expects that the new contracts will be at lower rates and for shorter contract terms than its current contracts. If these contracts are renewed at current market rates, the revenues earned from these transportation contracts would be materially lower than they are today. The narrowing of the price differentials between natural gas supplies and market demand for natural gas has reduced the transportation rates that Boardwalk Pipeline can charge. The transportation rates Boardwalk Pipeline is able to charge customers are heavily influenced by market trends (both short and longer term), including the available supply, geographical location of natural gas production, the competition between producing basins, the demand for gas by end-users such as power plants, petrochemical facilities and LNG export facilities and the price differentials between the gas supplies and the market demand for the gas (basis differentials). Current market conditions have resulted in a sustained narrowing of basis differentials on certain portions of Boardwalk Pipeline’s pipeline system, which has reduced transportation rates that can be charged in the affected areas and adversely affected the contract terms Boardwalk Pipeline can secure from its customers for available transportation capacity and for contracts being renewed or replaced in these areas. The prevailing market conditions may also lead some of its customers to seek to renegotiate existing contracts to terms that are less attractive to Boardwalk Pipeline; for example, seeking a current price reduction in exchange for an extension of the contract term. Boardwalk Pipeline expects these market conditions to continue. Boardwalk Pipeline is exposed to credit risk relating to default or bankruptcy by its customers. Credit risk relates to the risk of loss resulting from the default by a customer of its contractual obligations or the customer filing bankruptcy. Boardwalk Pipeline has credit risk with both its existing customers and those supporting its growth projects. Natural gas producers comprise a significant portion of Boardwalk Pipeline’s revenues and support several of its growth projects. In 2016, approximately 46% of Boardwalk Pipeline’s revenues were generated from contracts with natural gas producers. For existing customers on its interstate pipelines, FERC gas tariffs only allow Boardwalk Pipeline to require limited credit support. During 2016, the prices of oil and natural gas remained volatile. If gas prices continue to remain volatile for a sustained period of time, Boardwalk Pipeline’s producer customers will be

34
Item 1A. Risk Factors adversely affected, which could lead some customers to default on their obligations to Boardwalk Pipeline or file for bankruptcy. Credit risk also exists in relation to Boardwalk Pipeline’s growth projects, both because foundation customers make long term firm capacity commitments to Boardwalk Pipeline for such projects and certain of those foundation customers agree to provide credit support as construction for such projects progresses. If a customer fails to post the required credit support during the growth project process, overall returns on the project may be reduced to the extent an adjustment to the scope of the project results or Boardwalk Pipeline is unable to replace the defaulting customer. Boardwalk Pipeline’s credit exposure also includes receivables for services provided, future performance under firm agreements and volumes of gas owed by customers for imbalances or gas loaned by Boardwalk Pipeline to them under certain NNS and parking and lending (“PAL”) services. In 2016, the credit ratings of several of Boardwalk Pipeline’s producer customers, including some of those supporting its growth projects, were downgraded. The downgrades may restrict liquidity for those customers and indicate a greater likelihood of nonperformance of their contractual obligations, including failure to make future payments, or the failure to post required letters of credit or other forms of credit support. In addition, Boardwalk Pipeline’s customers that file for bankruptcy protection may also seek to have their contracts with Boardwalk Pipeline rejected in the bankruptcy proceedings. During 2016, several of its customers declared bankruptcy. While the overall impact of these bankruptcies was not material to its business in 2016, one of the bankruptcies did negatively affect one of its growth projects. Boardwalk Pipeline relies on a limited number of customers for a significant portion of its revenues. For 2016, while no customer comprised 10% or more of its operating revenues, the top ten customers comprised approximately 42% of revenues. If any of Boardwalk Pipeline’s significant customers have credit or financial problems which result in bankruptcy, a delay or failure to pay for services provided by Boardwalk Pipeline to post the required credit support for construction associated with its growth projects or existing contracts or to repay the gas they owe Boardwalk Pipeline, it could have a material adverse effect on its business. Boardwalk Pipeline’s actual construction and development costs could exceed its forecasts, its anticipated cash flow from construction and development projects will not be immediate and its construction and development projects may not be completed on time or at all. Boardwalk Pipeline is engaged in multiple significant construction projects involving its existing assets and the construction of new facilities for which it has expended or will expend significant capital. Boardwalk Pipeline expects to continue to engage in the construction of additional growth projects and modifications of its system. When Boardwalk Pipeline builds a new pipeline or expands or modifies an existing facility, the design, construction and development occurs over an extended period of time, and it will not receive any revenue or cash flow from that project until after it is placed in service. Typically, there are several years between when the project is announced and when customers begin using the new facilities. During this period, Boardwalk Pipeline spends capital and incurs costs without receiving any of the financial benefits associated with the projects. The construction of new assets involves regulatory, environmental, activist, legal, political, materials and labor costs, as well as operational and other risks that are difficult to predict and beyond Boardwalk Pipeline’s control. Any of these projects may not be completed on time or at all due to a variety of factors, may be impacted by significant cost overruns or may be materially changed prior to completion as a result of developments or circumstances that Boardwalk Pipeline is not aware of when it commits to the project, including the inability of any shipper to provide adequate credit support or to otherwise perform their obligations under any precedent agreements. Any of these events could result in material unexpected costs or have a material adverse effect on Boardwalk Pipeline’s ability to realize the anticipated benefits from its growth projects.

35
Item 1A. Risk Factors
Legislative and regulatory initiatives relating to pipeline safety that require the use of new or more prescriptive compliance activities, substantial changes to existing integrity management programs or withdrawal of regulatory waivers could subject Boardwalk Pipeline to increased capital and operating costs and operational delays. Boardwalk Pipeline’s interstate pipelines are subject to regulation by PHMSA, which is part of DOT. PHMSA regulates the design, installation, testing, construction, operation, replacement and management of existing interstate natural gas and NGLs pipeline facilities. PHMSA regulation currently requires pipeline operators to implement integrity management programs, including frequent inspections, correction of certain identified anomalies and other measures to promote pipeline safety in HCAs, such as high population areas, areas unusually sensitive to environmental damage and commercially navigable waterways. States have jurisdiction over certain of Boardwalk Pipeline’s intrastate pipelines and have adopted regulations similar to existing PHMSA regulations. State regulations may impose more stringent requirements than found under federal law. Compliance with these rules has resulted in an overall increase in maintenance costs. PHMSA has issued notices of proposed rulemaking in April of 2015 and March of 2016, which have proposed new, more prescriptive regulations related to the overall operations of Boardwalk Pipeline’s interstate natural gas and NGLs pipelines, which, if adopted as proposed, will cause it to incur increased capital and operating costs, experience operational delays and result in potential adverse impacts to its ability to reliably serve its customers. Additionally, requirements that are imposed under the 2011 Act and 2016 Act may also increase Boardwalk Pipeline’s capital and operating costs or impact the operation of its pipeline. Boardwalk Pipeline has entered into firm transportation contracts with shippers on certain of its expansion projects that utilize the design capacity of certain of its pipeline assets, based upon the authority Boardwalk Pipeline received from PHMSA to operate those pipelines at higher than normal operating pressures of up to 0.80 of the pipeline’s SMYS. PHMSA retains discretion to withdraw or modify this authority. If PHMSA were to withdraw or materially modify such authority, it could affect Boardwalk Pipeline’s ability to transport all of its contracted quantities of natural gas on these pipeline assets and it could incur significant additional costs to reinstate this authority or to develop alternate ways to meet its contractual obligations. Changes in energy prices, including natural gas, oil and NGLs, impact the supply of and demand for those commodities, which impact Boardwalk Pipeline’s business. Boardwalk Pipeline’s customers, especially producers, are directly impacted by changes in commodity prices. The prices of natural gas, oil and NGLs fluctuate in response to changes in supply and demand, market uncertainty and a variety of additional factors. The declines in the levels of natural gas, oil and NGLs prices experienced in 2015 and 2016 have adversely affected the businesses of Boardwalk Pipeline’s producer customers and reduced the demand for Boardwalk Pipeline’s services and could result in defaults or the non-renewal of Boardwalk Pipeline’s contracted capacity when existing contracts expire. Future increases in the price of natural gas and NGLs could make alternative energy and feedstock sources more competitive and reduce demand for natural gas and NGLs. A reduced level of demand for natural gas and NGLs could reduce the utilization of capacity on Boardwalk Pipeline’s systems and reduce the demand of its services. A significant portion of Boardwalk Pipeline’s debt will mature over the next five years and will need to be paid or refinanced and changes to the debt and equity markets could adversely affect its business. A significant portion of Boardwalk Pipeline’s debt is set to mature in the next five years, including its revolving credit facility. Boardwalk Pipeline may not be able to refinance its maturing debt on commercially reasonable terms, or at all, depending on numerous factors, including its financial condition and prospects at the time and the then current state of the banking and capital markets in the U.S. Limited access to the debt and equity markets could adversely affect Boardwalk Pipeline’s business. Boardwalk Pipeline’s current strategy is to fund its announced growth projects through currently available financing options, including utilizing cash generated from operations, borrowings under its revolving credit facility, accessing proceeds from its subordinated loan agreement with a subsidiary of the Company and accessing the capital markets. Changes in the debt and equity markets, including market disruptions, limited liquidity, and interest rate volatility, may increase the cost of financing as well as the risks of refinancing maturing debt. Instability in the

36
Item 1A. Risk Factors financial markets may increase Boardwalk Pipeline’s cost of capital while reducing the availability of funds. This may affect its ability to raise capital and reduce the amount of cash available to fund its operations or growth projects. If the debt and equity markets were not available, it is not certain if other adequate financing options would be available to Boardwalk Pipeline on terms and conditions that it would find acceptable. Any disruption in the capital markets could require Boardwalk Pipeline to take additional measures to conserve cash until the markets stabilize or until it can arrange alternative credit arrangements or other funding for its business needs. Such measures could include reducing or delaying business activities, reducing its operations to lower expenses and reducing other discretionary uses of cash. Boardwalk Pipeline may be unable to execute its growth strategy or take advantage of certain business opportunities. Boardwalk Pipeline’s natural gas transportation and storage operations are subject to extensive regulation by the FERC, including rules and regulations related to the rates it can charge for its services and its ability to construct or abandon facilities. The FERC’s rate-making policies could limit its ability to recover the full cost of operating its pipelines, including earning a reasonable return. Boardwalk Pipeline’s natural gas transportation and storage operations are subject to extensive regulation by the FERC, including the types and terms of services Boardwalk Pipeline may offer to its customers, construction of new facilities, creation, modification or abandonment of services or facilities, recordkeeping and relationships with affiliated companies. An adverse FERC action in any of these areas could affect Boardwalk Pipeline’s ability to compete for business, construct new facilities, offer new services or recover the full cost of operating its pipelines. This regulatory oversight can result in longer lead times to develop and complete any future project than competitors that are not subject to the FERC’s regulations. The FERC can also deny Boardwalk Pipeline the right to abandon certain facilities from service. The FERC also regulates the rates Boardwalk Pipeline can charge for its natural gas transportation and storage operations. For cost-based services, the FERC establishes both the maximum and minimum rates Boardwalk Pipeline can charge. The basic elements that the FERC considers are the costs of providing service, the volumes of gas being transported, the rate design, the allocation of costs between services, the capital structure and the rate of return a pipeline is permitted to earn. The FERC has issued a notice of inquiry concerning the inclusion of income taxes in the rates of an interstate pipeline that operates as a master limited partnership. The ultimate outcome of this proceeding could impact the maximum rates Boardwalk Pipeline can charge on its FERC regulated pipelines. Boardwalk Pipeline may not be able to earn a return or recover all of its costs, including certain costs associated with pipeline integrity activities, through existing or future rates. The FERC or Boardwalk Pipeline’s customers can challenge the existing rates on any of Boardwalk Pipeline’s pipelines. Such a challenge against Boardwalk Pipeline could adversely affect its ability to charge rates that would cover future increases in its costs or even to continue to collect rates to maintain its current revenue levels that are designed to permit a reasonable opportunity to recover current costs and depreciation and earn a reasonable return. Boardwalk Pipeline may not be successful in executing its strategy to grow and diversify its business. Boardwalk Pipeline relies primarily on the revenues generated from its natural gas long-haul transportation and storage services. Negative developments in these services have significantly greater impact on Boardwalk Pipeline’s financial condition and results of operations than if it maintained more diverse assets. Boardwalk Pipeline is pursuing a strategy of growing and diversifying its business through acquisition and development of assets in complementary areas of the midstream energy sector, such as liquids transportation and storage assets. Boardwalk Pipeline’s ability to grow, diversify and increase distributable cash flows will depend, in part, on its ability to expand its existing business lines and to close and execute on accretive acquisitions. Boardwalk Pipeline may not be successful in acquiring or developing such assets or may do so on terms that ultimately are not profitable. Any such transactions involve potential risks that may include, among other things:
• the diversion of management’s and employees’ attention from other business concerns;
• inaccurate assumptions about volume, revenues and project costs, including potential synergies;

37
Item 1A. Risk Factors
• a decrease in Boardwalk Pipeline’s liquidity as a result of using available cash or borrowing capacity to finance the acquisition or project;
• a significant increase in interest expense or financial leverage if it incurs additional debt to finance the
acquisition or project;
• inaccurate assumptions about the overall costs of equity or debt;
• an inability to hire, train or retain qualified personnel to manage and operate the acquired business and assets or the developed assets;
• unforeseen difficulties operating in new product areas or new geographic areas; and
• changes in regulatory requirements or delays of regulatory approvals.
Additionally, acquisitions also contain the following risks:
• an inability to integrate successfully the businesses Boardwalk Pipeline acquires;
• the assumption of unknown liabilities for which it is not indemnified, for which its indemnity is inadequate or for which its insurance policies may exclude from coverage;
• limitations on rights to indemnity from the seller; and
• customer or key employee losses of an acquired business.
Boardwalk Pipeline’s ability to replace expiring gas storage contracts at attractive rates or on a long-term basis and to sell short-term services at attractive rates or at all are subject to market conditions. Boardwalk Pipeline owns and operates substantial natural gas storage facilities. The market for the storage and PAL services that it offers is impacted by the factors and market conditions discussed above for Boardwalk Pipeline’s transportation services, and is also impacted by natural gas price differentials between time periods, such as winter to summer (time period price spreads), and the volatility in time period price spreads. When market conditions cause a narrowing of time period price spreads and a decline in the price volatility of natural gas, these factors adversely impact the rates Boardwalk Pipeline can charge for its storage and PAL services. Boardwalk Pipeline’s operations are subject to catastrophic losses, operational hazards and unforeseen interruptions for which it may not be adequately insured. There are a variety of operating risks inherent in transporting and storing natural gas, ethylene and NGLs, such as leaks and other forms of releases, explosions, fires, cyber-attacks and mechanical problems, some of which could have catastrophic consequences. Additionally, the nature and location of Boardwalk Pipeline’s business may make it susceptible to catastrophic losses from hurricanes or other named storms, particularly with regard to its assets in the Gulf Coast region, windstorms, earthquakes, hail, and severe winter weather. Any of these or other similar occurrences could result in the disruption of Boardwalk Pipeline’s operations, substantial repair costs, personal injury or loss of human life, significant damage to property, environmental pollution, impairment of its operations and substantial financial losses. The location of pipelines in HCAs, which includes populated areas, residential areas, commercial business centers and industrial sites, could significantly increase the level of damages resulting from some of these risks. Boardwalk Pipeline currently possesses property, business interruption, cyber threat and general liability insurance, but proceeds from such insurance coverage may not be adequate for all liabilities or expenses incurred or revenues lost. Moreover, such insurance may not be available in the future at commercially reasonable costs and terms. The insurance coverage Boardwalk Pipeline does obtain may contain large deductibles or fail to cover certain events, hazards or all potential losses.

38
Item 1A. Risk Factors Climate change legislation and regulations restricting emissions of greenhouse gases (“GHGs”) could result in increased operating and capital costs and reduced demand for Boardwalk Pipeline’s pipeline and storage services. Climate change continues to attract considerable public and scientific attention. As a result, numerous proposals have been made and are likely to continue to be made at the international, national, regional and state levels of government to monitor and limit emissions of greenhouse gases. While no comprehensive climate change legislation has been implemented at the federal level, the Environmental Protection Agency (“EPA”) and states or groupings of states have pursued legal initiatives in recent years that seek to reduce GHG emissions through efforts that include consideration of cap-and-trade programs, carbon taxes and GHG reporting and tracking programs and regulations that directly limit GHG emissions from certain sources. In particular, the EPA has adopted rules that, among other things, establish certain permit reviews for GHG emissions from certain large stationary sources, which reviews could require securing permits at covered facilities emitting GHGs and meeting defined technological standards for those GHG emissions. The EPA has also adopted rules requiring the monitoring and annual reporting of GHG emissions from certain petroleum and natural gas system sources in the U.S., including, among others, onshore processing, transmission, storage and distribution facilities as well as gathering, compression and boosting facilities and blowdowns of natural gas transmission pipelines. Federal agencies also have begun directly regulating emissions of methane, a GHG, from oil and natural gas operations. In June of 2016, the EPA published regulations requiring certain new, modified or reconstructed facilities in the oil and natural gas sector to reduce these methane gas and volatile organic compound emissions and, in November of 2016, the EPA began seeking additional information on methane emissions from certain existing facilities and operations in the oil and natural gas sector that could be developed into federal guidelines that states must consider in developing their own rules for regulating sources within their borders. In December of 2015, the U.S. joined the international community at the 21st Conference of the Parties of the United Nations Framework Convention on Climate Change in Paris, France that prepared an agreement requiring member countries to review and “represent a progression” in their intended nationally determined contributions, which set GHG emission reduction goals every five years beginning in 2020. This “Paris Agreement” was signed by the U.S. in April of 2016 and entered into force in November of 2016, however this agreement does not create any binding obligations for nations to limit their GHG emissions, but rather includes pledges to voluntarily limit or reduce future emissions. The adoption and implementation of any international, federal or state legislation or regulations that require reporting of GHGs or otherwise restrict emissions of GHGs could result in increased compliance costs or additional operating restrictions. Finally, some scientists have concluded that increasing concentrations of GHG in the atmosphere may produce climate changes that have significant physical effects, such as increased frequency and severity of storms, droughts, and floods and other climate events. Risks Related to Us and Our Subsidiary, Loews Hotels Holding Corporation Loews Hotels’ business may be adversely affected by various operating risks common to the lodging industry, including competition, excess supply and dependence on business travel and tourism. Loews Hotels owns and operates hotels which have different economic characteristics than many other real estate assets. A typical office property, for example, has long-term leases with third-party tenants, which provide a relatively stable long-term stream of revenue. Hotels, on the other hand, generate revenue from guests that typically stay at the hotel for only a few nights, which causes the room rate and occupancy levels at each hotel to change every day, and results in earnings that can be highly volatile. In addition, Loews Hotels’ properties are subject to various operating risks common to the lodging industry, many of which are beyond Loews Hotels’ control, including:
changes in general economic conditions, including the severity and duration of any downturn in the U.S. or global economy and financial markets;

39
Item 1A. Risk Factors
war, political conditions or civil unrest, terrorist activities or threats and heightened travel security measures instituted in response to these events;
outbreaks of pandemic or contagious diseases, such as norovirus, avian flu, severe acute respiratory syndrome
(“SARS”), H1N1 (“swine flu”), Ebola and Zika virus;
natural or man-made disasters, such as earthquakes, tsunamis, tornadoes, hurricanes, typhoons, floods, oil spills, fires and nuclear incidents;
any material reduction or prolonged interruption of public utilities and services, including water and electric
power;
decreased corporate or government travel-related budgets and spending and cancellations, deferrals or renegotiations of group business due to adverse economic conditions or otherwise;
decreased need for business-related travel due to innovations in business-related technology;
competition from other hotels and alternative accommodations, such as Airbnb, in the markets in which
Loews Hotels operates;
excess supply of hotels in the markets in which Loews Hotels operates;
requirements for periodic capital reinvestment to repair and upgrade hotels;
increases in operating costs including, but not limited to, labor (including minimum wage increases), workers’ compensation, benefits, insurance, food, energy and unanticipated costs resulting from force majeure events, due to inflation, new or different federal, state or local governmental regulations and other factors that may not be offset by increased room rates;
the costs and administrative burdens associated with compliance with applicable laws and regulations;
the financial condition and general business condition of the airline, automotive and other transportation-
related industries and its impact on travel;
decreased airline capacities and routes;
statements, actions or interventions by governmental officials related to travel and corporate travel-related activities and the resulting negative public perception of such travel and activities;
organized labor activities, which could cause a diversion of business from hotels involved in labor
negotiations and loss of business for Loews Hotels’ properties generally as a result of certain labor tactics;
changes in the desirability of particular locations or travel patterns of customers, geographic concentration of Loews Hotels’ operations and customers and shortages of desirable locations for development; and
relationships with third-party property owners, developers, landlords and joint venture partners, including the
risk that owners and/or partners may terminate management or joint venture agreements. These factors, and the reputational repercussions of these factors, could adversely affect, and from time to time have adversely affected, individual hotels and hotels in particular regions.
40
Item 1A. Risk Factors Loews Hotels is exposed to the risks resulting from significant investments in owned and leased real estate, which could increase its costs, reduce its profits, limit its ability to respond to market conditions or restrict its growth strategy. Loews Hotels’ proportion of owned and leased properties, compared to the number of properties that it manages for third-party owners, is larger than that of some of its competitors. Real estate ownership and leasing is subject to risks not applicable to managed or franchised properties, including:
governmental regulations relating to real estate ownership;
real estate, insurance, zoning, tax, environmental and eminent domain laws;
the ongoing need for owner-funded capital improvements and expenditures to maintain or upgrade properties;
risks associated with mortgage debt, including the possibility of default, fluctuating interest rate levels and the availability of replacement financing;
risks associated with the possibility that cost increases will outpace revenue increases and that, in the event of
an economic slowdown, a high proportion of fixed costs will make it difficult to reduce costs to the extent required to offset declining revenues;
risks associated with real estate leases, including the possibility of rent increases and the inability to renew or
extend upon favorable terms;
fluctuations in real estate values and potential impairments in the value of Loews Hotels’ assets; and
the relative illiquidity of real estate compared to some other assets. The hospitality industry is subject to seasonal and cyclical volatility. The hospitality industry is seasonal in nature. The periods during which Loews Hotels’ properties experience higher revenues vary from property to property, depending principally upon location and the consumer base served. Loews Hotels generally expects revenues to be lower in the first quarter of each year than in each of the three subsequent quarters. In addition, the hospitality industry is cyclical and demand generally follows the general economy on a lagged basis. The seasonality and cyclicality of its industry may contribute to fluctuation in Loews Hotels’ results of operations and financial condition. Loews Hotels operates in a highly competitive industry, both for customers and for acquisitions of new properties. The lodging industry is highly competitive. Loews Hotels’ properties compete with other hotels and alternative accommodations based on a number of factors, including room rates, quality of accommodations, service levels and amenities, location, brand affiliation, reputation and reservation systems. New hotels may be constructed and these additions to supply create new competitors, in some cases without corresponding increases in demand for hotel rooms. Some of its competitors also have greater financial and marketing resources than Loews Hotels, which could allow them to reduce their rates, offer greater convenience, services or amenities, build new hotels in direct competition with Loews Hotels’ existing hotels, improve their properties, expand and improve their marketing efforts, all of which could adversely affect the ability of Loews Hotels’ properties to attract prospective guests as well as limit or slow future growth. In addition, travelers can book stays on websites that facilitate the short-term rental of homes and apartments from owners, thereby providing an alternative to hotel rooms. Loews Hotels also competes for hotel acquisitions with entities that have similar investment objectives as it does. This competition could limit the number of suitable investment opportunities. It may also increase the bargaining power of property owners seeking to sell to Loews Hotels, making it more difficult for Loews Hotels to acquire new properties on attractive terms or on the terms contemplated in its business plan.

41
Item 1A. Risk Factors
Any deterioration in the quality or reputation of Loews Hotels’ brands could have an adverse effect on its reputation and business. Loews Hotels’ brands and its reputation are among its most important assets. Its ability to attract and retain guests depends, in part, on the public recognition of its brands and their associated reputation. If its brands become obsolete or consumers view them as unfashionable or lacking in consistency and quality, Loews Hotels may be unable to attract guests to its properties, and may further be unable to attract or retain joint venture partners or hotel owners. The occurrence of accidents or injuries, natural disasters, crime, individual guest notoriety or similar events at Loews Hotels’ properties can harm its reputation, create adverse publicity and cause a loss of consumer confidence in its business. Because of the broad expanse of Loews Hotels’ business and hotel locations, events occurring in one location could negatively affect the reputation and operations of otherwise successful individual locations. In addition, the recent expansion of social media has compounded the potential scope of negative publicity. Loews Hotels’ properties are geographically concentrated, which exposes its business to the effects of regional events and occurrences. Loews Hotels has a concentration of hotels in Florida. Specifically, as of December 31, 2016, seven hotels, representing approximately 50% of rooms in its system, were located in Florida. The concentration of hotels in one region or a limited number of markets may expose Loews Hotels to risks of adverse economic and other developments that are greater than if its portfolio were more geographically diverse. These developments include regional economic downturns, a decline in the popularity of or access to area tourist attractions, such as theme parks, significant increases in the number of Loews Hotels’ competitors’ hotels in these markets and potentially higher local property, sales and income taxes in the geographic markets in which it is concentrated. In addition, Loews Hotels’ properties in Florida are subject to the effects of adverse acts of nature, such as hurricanes, strong winds and flooding, which have in the past caused damage to its hotels in Florida, which may in the future be intensified as a result of climate change, as well as outbreaks of pandemic or contagious diseases, such as Zika virus. Depending on the severity of these acts of nature, Loews Hotels could be required to close all or substantially all of its hotels in the Florida market for a period of time while the necessary repairs and renovations, as applicable, are undertaken, or until the adverse condition has dissipated. The growth and use of alternative reservation channels adversely affects Loews Hotels’ business. A significant percentage of hotel rooms for guests at Loews Hotels’ properties is booked through internet travel and other intermediaries. In most cases, Loews Hotels has agreements with such intermediaries and pays them commissions and/or fees for sales of its rooms through their systems. If such bookings increase, these intermediaries may be able to obtain higher commissions or fees, reduced room rates or other significant concessions from Loews Hotels. There can be no assurance that Loews Hotels will be able to negotiate such agreements in the future with terms as favorable as those that exist today. Moreover, these intermediaries generally employ aggressive marketing strategies, including expending significant resources for online and television advertising campaigns to drive consumers to their websites and other outlets. As a result, consumers may develop brand loyalties to the intermediaries’ offered brands, websites and reservations systems rather than to Loews Hotels’ brands. Under certain circumstances, Loews Hotels’ insurance coverage may not cover all possible losses, and it may not be able to renew its insurance policies on favorable terms, or at all. Although Loews Hotels maintains various property, casualty and other insurance policies, proceeds from such insurance coverage may not be adequate for all liabilities or expenses incurred or revenues lost. Moreover, such insurance may not be available in the future at commercially reasonable costs and terms. The insurance coverage Loews Hotels does obtain may contain large deductibles or fail to cover certain events, hazards or all potential losses.

42
Item 1A. Risk Factors Labor shortages could restrict Loews Hotels’ ability to operate its properties or grow its business or result in increased labor costs that could reduce its profits. Loews Hotels’ properties are staffed 24 hours a day, seven days a week by thousands of employees. If it is unable to attract, retain, train and engage skilled employees, its ability to manage and staff its properties adequately could be impaired, which could reduce customer satisfaction. Staffing shortages could also hinder its ability to grow and expand its business. Because payroll costs are a major component of the operating expenses at its properties, a shortage of skilled labor could also require higher wages that would increase its labor costs. Risks Related to Us and Our Subsidiaries Generally In addition to the specific risks and uncertainties faced by our subsidiaries, as discussed above, we and all of our subsidiaries face additional risks and uncertainties described below. Acts of terrorism could harm us and our subsidiaries. Terrorist attacks and the continued threat of terrorism in the United States or abroad, the continuation or escalation of existing armed hostilities or the outbreak of additional hostilities, including military and other action by the United States and its allies, could have a significant impact on us and the assets and businesses of our subsidiaries. CNA issues coverages that are exposed to risk of loss from an act of terrorism. Terrorist acts or the threat of terrorism could also result in increased political, economic and financial market instability, a decline in energy consumption and volatility in the price of oil and gas, which could affect the market for Diamond Offshore’s drilling services and Boardwalk Pipeline’s transportation and storage services. In addition, future terrorist attacks could lead to reductions in business travel and tourism which could harm Loews Hotels. While our subsidiaries take steps that they believe are appropriate to secure their assets, there is no assurance that they can completely secure them against a terrorist attack or obtain adequate insurance coverage for terrorist acts at reasonable rates. Changes in tax laws, regulations or treaties, or the interpretation or enforcement thereof in jurisdictions in which we or our subsidiaries operate could adversely impact us. Changes in federal, state or foreign tax laws, regulations or treaties applicable to us or our subsidiaries or changes in the interpretation or enforcement thereof could materially and adversely impact our and our subsidiaries’ tax liability, financial condition, results of operations and cash flows, including the amount of cash our subsidiaries have available to distribute to their shareholders, including us. In particular, potential changes to tax laws relating to tax credits, the corporate tax rate or the taxation of interest from municipal bonds (and thus the rate at which CNA discounts its long term care reserves), foreign earnings and publicly traded partnerships could have such material adverse effects. Our subsidiaries face significant risks related to compliance with environmental laws. Our subsidiaries have extensive obligations and financial exposure related to compliance with federal, state, local, foreign and international environmental laws, including those relating to the discharge of substances into the environment, the disposal, removal or clean up of hazardous wastes and other activities relating to the protection of the environment. Many of such laws have become increasingly stringent in recent years and may in some cases impose strict liability, which could be substantial, rendering a person liable for environmental damage without regard to negligence or fault on the part of that person. For example, Diamond Offshore could be liable for damages and costs incurred in connection with oil spills related to its operations, including for conduct of or conditions caused by others. Boardwalk Pipeline is also subject to environmental laws and regulations, including requiring the acquisition of permits or other approvals to conduct regulated activities, restricting the manner in which it disposes of waste, requiring remedial action to remove or mitigate contamination resulting from a spill or other release and requiring capital expenditures to comply with pollution control requirements. Further, existing environmental laws or the interpretation or enforcement thereof may be amended and new laws may be adopted in the future.
43
Item 1A. Risk Factors
Failures or interruptions in or breaches to our or our subsidiaries’ computer systems could materially and adversely affect our or our subsidiaries’ operations. We and our subsidiaries are dependent upon information technologies, computer systems and networks to conduct operations and are reliant on technology to help increase efficiency in our businesses. We are dependent upon operational and financial computer systems to process the data necessary to conduct almost all aspects of our businesses. Any failure of our or our subsidiaries’ computer systems, or those of our or their customers, vendors or others with whom we and they do business, could materially disrupt business operations. Computer, telecommunications and other business facilities and systems could become unavailable or impaired from a variety of causes, including among others, storms and other natural disasters, terrorist attacks, fires, utility outages theft, design defects, human error or complications encountered as existing systems are replaced or upgraded. In addition, it has been reported that unknown entities or groups have mounted so-called “cyber attacks” on businesses and other organizations solely to disable or disrupt computer systems, disrupt operations and, in some cases, steal data. In particular, the U.S. government has issued public warnings that indicate energy assets may be specific targets of cyber attacks, which can have catastrophic consequences and there have also been reports that hotel chains, among other consumer facing businesses, have been subject to various cyber attacks targeting payment card and other sensitive consumer information. Breaches of our computer security infrastructure can result from actions by our employees, vendors, third party administrators or by unknown third parties, and may disrupt our operations, cause damage to our assets and surrounding areas and impact our data framework or cause a failure to protect personal information of customers or employees. The foregoing risks relating to disruption of service, interruption of operations and data loss could impact our and our subsidiaries’ ability to timely perform critical business functions, resulting in disruption or deterioration in our and our subsidiaries’ operations and business and expose us to monetary and reputational damages. In addition, potential exposures include substantially increased compliance costs and required computer system upgrades and security related investments. The breach of confidential information also could give rise to legal liability and regulatory action under data protection and privacy laws and regulations, both in the U.S. and foreign jurisdictions. Loss of key vendor relationships or issues relating to the transitioning of vendor relationships could result in a materially adverse effect on our and our subsidiaries’ operations. We and our subsidiaries rely on products, equipment and services provided by many third party suppliers, manufacturers and service providers in the United States and abroad, which exposes us and them to volatility in the quality, price and availability of such items. These include, for example, vendors of computer hardware, software and services, as well as other critical materials and services (including, in the case of CNA, claims administrators performing significant claims administration and adjudication functions). Certain products, equipment and services may be available from a limited number of sources. If one or more key vendors becomes unable to continue to provide products, equipment or services at the requisite level for any reason, or fails to protect our proprietary information, including in some cases personal information of employees, customers or hotel guests, we and our subsidiaries may experience a material adverse effect on our or their business, operations and reputation. We could incur impairment charges related to the carrying value of the long-lived assets and goodwill of our subsidiaries. Our subsidiaries regularly evaluate their long-lived assets and goodwill for impairment whenever events or changes in circumstances indicate the carrying value of these assets may not be recoverable. Most notably, we could incur impairment charges related to the carrying value of offshore drilling equipment at Diamond Offshore, pipeline and storage assets at Boardwalk Pipeline and hotel properties owned by Loews Hotels. In particular, Diamond Offshore is currently experiencing declining demand for certain offshore drilling rigs as a result of excess rig supply in the industry and depressed market conditions. As a result, Diamond Offshore may incur additional asset impairments, rig retirements and/or rigs being scrapped. We also test goodwill for impairment on an annual basis or when events or changes in circumstances indicate that a potential impairment exists. Asset impairment evaluations by us and our subsidiaries with respect to both long-lived assets and goodwill are, by nature, highly subjective. The use of different estimates and assumptions could

44
Item 1A. Risk Factors result in materially different carrying values of our assets which could impact the need to record an impairment charge and the amount of any charge taken. We are a holding company and derive substantially all of our income and cash flow from our subsidiaries. We rely upon our invested cash balances and distributions from our subsidiaries to generate the funds necessary to meet our obligations and to declare and pay any dividends to holders of our common stock. Our subsidiaries are separate and independent legal entities and have no obligation, contingent or otherwise, to make funds available to us, whether in the form of loans, dividends or otherwise. The ability of our subsidiaries to pay dividends is subject to, among other things, the availability of sufficient earnings and funds in such subsidiaries, applicable state laws, including in the case of the insurance subsidiaries of CNA, laws and rules governing the payment of dividends by regulated insurance companies, and their compliance with covenants in their respective loan agreements. Claims of creditors of our subsidiaries will generally have priority as to the assets of such subsidiaries over our claims and those of our creditors and shareholders. We and our subsidiaries face competition for senior executives and qualified specialized talent. We and our subsidiaries depend on the services of our key personnel, who possess skills critical to the operation of our and their businesses. Our and our subsidiaries’ executive management teams are highly experienced and possess extensive skills in their relevant industries. The ability to retain senior executives and to attract and retain highly skilled professionals and personnel with specialized industry and technical experience is important to our and our subsidiaries’ success and future growth. Competition for this talent can be intense, and we and our subsidiaries may not be successful in our efforts. The unexpected loss of the services of these individuals could have a detrimental effect on us and our subsidiaries and could hinder our and their ability to effectively compete in the various industries in which we and they operate. We could have liability in the future for tobacco-related lawsuits. As a result of our ownership of Lorillard, Inc. (“Lorillard”) prior to the separation of Lorillard from us in 2008 (the “Separation”), from time to time we have been named as a defendant in tobacco-related lawsuits and could be named as a defendant in additional tobacco-related suits, notwithstanding the completion of the Separation. In the Separation Agreement entered into between us and Lorillard and its subsidiaries in connection with the Separation, Lorillard and each of its subsidiaries has agreed to indemnify us for liabilities related to Lorillard’s tobacco business, including liabilities that we may incur for current and future tobacco-related litigation against us. While we do not believe that we have any liability for tobacco-related claims, and we have never been held liable for any such claims, an adverse decision in a tobacco-related lawsuit against us could, if the indemnification is deemed for any reason to be unenforceable or any amounts owed to us thereunder are not collectible, in whole or in part, have a material adverse effect on us. From time to time we and our subsidiaries are subject to litigation, for which we and they may be unable to accurately assess the level of exposure and which if adversely determined, may have a significant adverse effect on our or their consolidated financial condition or results of operations. We and our subsidiaries are or may become parties to legal proceedings and disputes. These matters may include, among others, contract disputes, claims disputes, reinsurance disputes, personal injury claims, environmental claims or proceedings, asbestos and other toxic tort claims, employment and tax matters and other litigation incidental to our or their businesses. Although our current assessment is that, other than as disclosed in this Report, there is no pending litigation that could have a significant adverse impact, it is difficult to predict the outcome or effect of any litigation matters and if our assessment proves to be in error, then the outcome of litigation could have a significant impact on our financial statements.

45
Item 1B. Unresolved Staff Comments. None. Item 2. Properties. Our corporate headquarters is located in approximately 136,000 square feet of leased office space in New York City. Information relating to our subsidiaries’ properties is contained under Item 1. Item 3. Legal Proceedings. Information on our legal proceedings is included in Notes 17 and 18 of the Notes to Consolidated Financial Statements, included under Item 8. Item 4. Mine Safety Disclosures. Not applicable.
PART II Item 5. Market for the Registrant’s Common Equity, Related Stockholder Matters and Issuer Purchases of Equity Securities. Price Range of Common Stock Our common stock is listed on the New York Stock Exchange under the symbol “L.” The following table sets forth the reported high and low sales prices in each calendar quarter: 2016 2015 High Low High Low First Quarter $ 39.62 $ 33.84 $ 42.78 $ 38.01 Second Quarter 41.09 37.25 42.59 38.14 Third Quarter 42.07 39.67 39.21 35.21 Fourth Quarter 48.05 40.61 38.88 34.40

46
Item 5. Market for the Registrant’s Common Equity, Related Stockholder Matters and Issuer Purchases of Equity Securities The following graph compares annual total return of our Common Stock, the Standard & Poor’s 500 Composite Stock Index (“S&P 500 Index”) and our Peer Group (“Loews Peer Group”) for the five years ended December 31, 2016. The graph assumes that the value of the investment in our Common Stock, the S&P 500 Index and the Loews Peer Group was $100 on December 31, 2011 and that all dividends were reinvested.
2011 2012 2013 2014 2015 2016 Loews Common Stock 100.0 108.91 129.64 113.59 104.47 128.19 S&P 500 Index 100.0 116.00 153.57 174.60 177.01 198.18 Loews Peer Group (a) 100.0 113.39 142.85 150.44 142.44 165.34
(a) The Loews Peer Group consists of the following companies that are industry competitors of our principal operating
subsidiaries: Chubb Limited (name change from ACE Limited after it acquired The Chubb Corporation on January 15,2016), W.R. Berkley Corporation, The Chubb Corporation (included through January 15, 2016 when it was acquired byACE Limited), Energy Transfer Partners L.P., Ensco plc, The Hartford Financial Services Group, Inc., Kinder Morgan Energy Partners, L.P. (included through November 26, 2014 when it was acquired by Kinder Morgan Inc.), Noble Corporation, Spectra Energy Corp, Transocean Ltd. and The Travelers Companies, Inc.
Dividend Information We have paid quarterly cash dividends in each year since 1967. Regular dividends of $0.0625 per share of Loews common stock were paid in each calendar quarter of 2016 and 2015.

47
Item 5. Market for the Registrant’s Common Equity, Related Stockholder Mattersand Issuer Purchases of Equity Securities
Securities Authorized for Issuance Under Equity Compensation Plans The following table provides certain information as of December 31, 2016 with respect to our equity compensation plans under which our equity securities are authorized for issuance. Number of securities remaining Number of available for future securities to be issuance under issued upon exercise Weighted average equity compensation of outstanding exercise price of plans (excluding options, warrants outstanding options, securities reflected Plan category and rights warrants and rights in the first column) Equity compensation plans approved by security holders (a) 6,334,709 $ 40.90 5,734,425Equity compensation plans not approved by security holders (b) N/A N/A N/A (a) Reflects 5,982,880 stock appreciation rights awarded under the Loews Corporation 2000 Stock Option Plan and 351,829
outstanding unvested time-based and performance-based restricted stock units (“RSUs”) awarded under the Loews Corporation 2016 Incentive Compensation Plan. The weighted average exercise price does not take into account RSUs as they do not have an exercise price.
(b) We do not have equity compensation plans that have not been approved by our shareholders. Approximate Number of Equity Security Holders As of February 10, 2017, we had approximately 900 holders of record of our common stock. Common Stock Repurchases During the fourth quarter of 2016, we purchased shares of our common stock as follows:
Period
(a) Total number of shares purchased
(b) Average price paid per
share
(c) Total number of shares purchased as
part of publicly announced plans or
programs
(d) Maximum number of shares (or approximate dollar value)
of shares that may yet be purchased under the plans or
programs (in millions) October 1, 2016 - October 31, 2016 N/A N/A N/A N/A November 1, 2016 - November 30, 2016 456,049 $42.05 N/A N/A December 1, 2016 - December 31, 2016 N/A N/A N/A N/A

48
Item 6. Selected Financial Data. The following table presents selected financial data. The table should be read in conjunction with Item 7. Management’s Discussion and Analysis of Financial Condition and Results of Operations and Item 8. Financial Statements and Supplementary Data of this Form 10-K. Year Ended December 31 2016 2015 2014 2013 2012 (In millions, except per share data) Results of Operations: Revenues $ 13,105 $ 13,415 $ 14,325 $ 14,613 $ 14,072 Income before income tax $ 936 $ 244 $ 1,810 $ 2,277 $ 2,022 Income from continuing operations $ 716 $ 287 $ 1,353 $ 1,621 $ 1,509 Discontinued operations, net (391) (552) (399) Net income 716 287 962 1,069 1,110 Amounts attributable to noncontrolling interests (62) (27) (371) (474) (542) Net income attributable to Loews Corporation $ 654 $ 260 $ 591 $ 595 $ 568 Net income attributable to Loews Corporation: Income from continuing operations $ 654 $ 260 $ 962 $ 1,149 $ 968 Discontinued operations, net (371) (554) (400) Net income $ 654 $ 260 $ 591 $ 595 $ 568 Diluted Net Income Per Share: Income from continuing operations $ 1.93 $ 0.72 $ 2.52 $ 2.95 $ 2.44 Discontinued operations, net (0.97) (1.42) (1.01) Net income $ 1.93 $ 0.72 $ 1.55 $ 1.53 $ 1.43 Financial Position: Investments $ 50,711 $ 49,400 $ 52,032 $ 52,945 $ 53,040 Total assets 76,594 76,006 78,342 79,913 79,997 Debt 10,778 10,560 10,643 10,318 8,476 Shareholders’ equity 18,163 17,561 19,280 19,458 19,459 Cash dividends per share 0.25 0.25 0.25 0.25 0.25 Book value per share 53.96 51.67 51.70 50.25 49.67 Shares outstanding 336.62 339.90 372.93 387.21 391.81

49
Item 7. Management’s Discussion and Analysis of Financial Condition and Results of Operations. Management’s discussion and analysis of financial condition and results of operations is comprised of the following sections: Page No. Overview 50 Results of Operations 50 Consolidated Financial Results 50 CNA Financial 51 Diamond Offshore 57 Boardwalk Pipeline 60 Loews Hotels 64 Corporate 65 Liquidity and Capital Resources 66 Parent Company 66 Subsidiaries 66 Contractual Obligations 68 Investments 69 Insurance Reserves 73 Critical Accounting Estimates 80 Accounting Standards Update 82 Forward-Looking Statements 83

50
Item 7. Management’s Discussion and Analysis of Financial Condition and Results of Operations OVERVIEW We are a holding company and have five reportable segments comprised of our four individual operating subsidiaries, CNA Financial Corporation (“CNA”), Diamond Offshore Drilling, Inc. (Diamond Offshore”), Boardwalk Pipeline Partners, LP (“Boardwalk Pipeline”) and Loews Hotels Holding Corporation (“Loews Hotels”); and our Corporate segment. Each of our operating subsidiaries is headed by a chief executive officer who is responsible for the operation of its business and has the duties and authority commensurate with that position. We rely upon our invested cash balances and distributions from our subsidiaries to generate the funds necessary to meet our obligations and to declare and pay any dividends to our shareholders. The ability of our subsidiaries to pay dividends is subject to, among other things, the availability of sufficient earnings and funds in such subsidiaries, applicable state laws, including in the case of the insurance subsidiaries of CNA, laws and rules governing the payment of dividends by regulated insurance companies (see Note 13 of the Notes to Consolidated Financial Statements included under Item 8) and compliance with covenants in their respective loan agreements. Claims of creditors of our subsidiaries will generally have priority as to the assets of such subsidiaries over our claims and those of our creditors and shareholders. Unless the context otherwise requires, references in this Report to “Loews Corporation,” “the Company,” “Parent Company,” “we,” “our,” “us” or like terms refer to the business of Loews Corporation excluding its subsidiaries. The following discussion should be read in conjunction with Item 1A, Risk Factors, and Item 8, Financial Statements and Supplementary Data of this Form 10-K. RESULTS OF OPERATIONS Consolidated Financial Results The following table summarizes net income (loss) attributable to Loews Corporation by segment and net income per share attributable to Loews Corporation for the years ended December 31, 2016, 2015 and 2014: Year Ended December 31 2016 2015 2014 (In millions) CNA Financial $ 774 $ 433 $ 802 Diamond Offshore (186) (156) 183 Boardwalk Pipeline 89 74 18 Loews Hotels 12 12 11 Corporate (35) (103) (52) Income from continuing operations 654 260 962 Discontinued operations, net (371) Net income attributable to Loews Corporation $ 654 $ 260 $ 591 Basic and diluted net income per common share: Income from continuing operations $ 1.93 $ 0.72 $ 2.52 Discontinued operations, net (0.97) Net income $ 1.93 $ 0.72 $ 1.55 2016 Compared with 2015 Consolidated net income attributable to Loews Corporation for 2016 was $654 million, or $1.93 per share, compared to $260 million, or $0.72 per share, in 2015. Net income for 2016 included asset impairment charges of $267 million (after tax and noncontrolling interests) at Diamond Offshore. In 2015, net income included asset impairment charges at Diamond Offshore of $341 million (after tax and noncontrolling interests) and a reserve charge of $177 million (after tax and noncontrolling interests) related to the long term care business at CNA.

51
Item 7. Management’s Discussion and Analysis of Financial Condition and Results of OperationsResults of Operations – (Continued)
Net income attributable to Loews Corporation in 2016 increased compared to the prior year primarily due to the impact of the reserve charge at CNA in 2015 and the asset impairment charges at Diamond Offshore which were lower in 2016 compared to 2015. Absent these charges, net income increased $143 million due to higher earnings at CNA and Boardwalk Pipeline and improved results from the parent company investment portfolio. These increases were partially offset by lower earnings at Diamond Offshore. 2015 Compared to 2014 Consolidated net income attributable to Loews Corporation for 2015 was $260 million, or $0.72 per share, compared to $591 million, or $1.55 per share, in 2014. Net income in 2014 included discontinued operations reflecting the sale of HighMount Exploration & Production, LLC and CNA’s former life insurance subsidiary. Income from continuing operations for 2015 was $260 million, or $0.72 per share, compared to $962 million, or $2.52 per share, in 2014. The decline in income from continuing operations was primarily due to a reserve charge at CNA related to the long term care business, asset impairment charges at Diamond Offshore and lower results from the parent company investment portfolio. Unless the context otherwise requires, references to net operating income (loss), net realized investment results and net income (loss) reflect amounts attributable to Loews Corporation shareholders. CNA Financial The following table summarizes the results of operations for CNA for the years ended December 31, 2016, 2015 and 2014 as presented in Note 20 of the Notes to Consolidated Financial Statements included under Item 8. For further discussion of Net investment income and Net realized investment results, see the Investments section of this MD&A. Year Ended December 31 2016 2015 2014 (In millions) Revenues: Insurance premiums $ 6,924 $ 6,921 $ 7,212 Net investment income 1,988 1,840 2,067 Investment gains (losses) 62 (71) 54 Other revenues 410 411 359 Total 9,384 9,101 9,692 Expenses: Insurance claims and policyholders’ benefits 5,283 5,384 5,591 Amortization of deferred acquisition costs 1,235 1,540 1,317 Other operating expenses 1,558 1,469 1,386 Interest 167 155 183 Total 8,243 8,548 8,477 Income before income tax 1,141 553 1,215 Income tax expense (279) (71) (322) Income from continuing operations 862 482 893 Discontinued operations, net (197) Net income 862 482 696 Amounts attributable to noncontrolling interests (88) (49) (71) Net income attributable to Loews Corporation $ 774 $ 433 $ 625 2016 Compared with 2015 Income from continuing operations increased $380 million in 2016 as compared with 2015, primarily as a result of a $305 million ($177 million after tax and noncontrolling interests) charge in 2015 related to increasing long term care active life and claim reserves. As the active life reserve assumptions were unlocked in 2015, long term care results in 2016 improved significantly. Results in 2016 also reflect favorable net prior year development of $314

52
Item 7. Management’s Discussion and Analysis of Financial Condition and Results of Operations Results of Operations – CNA Financial – (Continued) million as compared to $218 million recorded in 2015. Further information on net prior year development is included in Note 8 of the Notes to Consolidated Financial Statements under Item 8. In addition, net investment income increased $148 million and investment results improved $133 million in 2016 as compared with 2015, driven by improved limited partnership investments and fixed maturity securities income, lower other-than-temporary impairment (“OTTI”) losses recognized in earnings and higher net realized investment gains on sales of securities. These increases were partially offset by an increase in the current accident year loss ratio and higher underwriting expenses. 2015 Compared with 2014 Income from continuing operations decreased $411 million in 2015 as compared with 2014. Results in 2015 were negatively impacted by a $305 million ($177 million after tax and noncontrolling interests) charge related to recognition of a premium deficiency and a small deficiency in claim reserves in CNA’s long term care business as further discussed in the Insurance Reserves section of this MD&A. In addition, results in 2015 decreased $78 million ($46 million after tax and noncontrolling interests) as compared to 2014 as a result of the application of retroactive reinsurance accounting to adverse reserve development ceded under the 2010 asbestos and environmental pollution (“A&EP”) loss portfolio transfer, as further discussed in Note 8 of the Notes to Consolidated Financial Statements included under Item 8. In addition, results in 2015 as compared with 2014 included lower net investment income and investment losses driven by lower limited partnership results and higher OTTI losses, partially offset by improved underwriting results. Results in 2014 were impacted by a $31 million (after tax and noncontrolling interests) loss on a coinsurance transaction related to the sale of CNA’s former life insurance subsidiary. CNA’s Core and Non-Core Operations CNA’s core business is its property and casualty insurance operations that include its Specialty, Commercial and International lines of business. CNA’s non-core operations include its long term care business that is in run-off, certain corporate expenses, including interest on CNA’s corporate debt, and certain property and casualty businesses in run-off, including CNA Re and A&EP. CNA’s products and services are primarily marketed through independent agents, brokers and managing general underwriters to a wide variety of customers, including small, medium and large businesses, insurance companies, associations, professionals and other groups. We believe the presentation of CNA as one reportable segment is appropriate in accordance with applicable accounting standards on segment reporting. However, for purposes of this discussion and analysis of the results of operations, we provide greater detail with respect to CNA’s core and non-core operations to enhance the reader’s understanding and to provide further transparency into key drivers of CNA’s financial results. In assessing CNA’s insurance operations, the Company utilizes the net operating income (loss) financial measure. Net operating income (loss) is calculated by excluding from net income (loss) the after tax and noncontrolling interests effects of (i) net realized investment gains or losses, (ii) income or loss from discontinued operations and (iii) any cumulative effects of changes in accounting guidance. The calculation of net operating income excludes net realized investment gains or losses because net realized investment gains or losses are largely discretionary, except for some losses related to OTTI, and are generally driven by economic factors that are not necessarily consistent with key drivers of underwriting performance, and are therefore not considered an indication of trends in insurance operations. Net operating income (loss) is deemed to be a non-GAAP financial measure and management believes this measure is useful to investors as management uses this measure to assess financial performance. Property and Casualty Operations In evaluating the results of the property and casualty operations, CNA utilizes the loss ratio, the expense ratio, the dividend ratio and the combined ratio. These ratios are calculated using GAAP financial results. The loss ratio is the percentage of net incurred claim and claim adjustment expenses to net earned premiums. The expense ratio is the percentage of insurance underwriting and acquisition expenses, including the amortization of deferred acquisition costs, to net earned premiums. The dividend ratio is the ratio of policyholders’ dividends incurred to net earned premiums. The combined ratio is the sum of the loss, expense and dividend ratios. In addition, CNA also utilizes rate, retention and new business in evaluating operating trends. Rate represents the average change in price on policies that renew excluding exposure change. Retention represents the percentage of premium dollars renewed in

53
Item 7. Management’s Discussion and Analysis of Financial Condition and Results of OperationsResults of Operations – CNA Financial – (Continued)
comparison to the expiring premium dollars from policies available to renew. New business represents premiums from policies written with new customers and additional policies written with existing customers. The following tables summarize the results of CNA’s property and casualty operations for the years ended December 31, 2016, 2015 and 2014. Year Ended December 31, 2016 Specialty Commercial International Total (In millions, except %) Net written premiums $ 2,780 $ 2,841 $ 821 $ 6,442 Net earned premiums 2,779 2,804 806 6,389 Net investment income 516 638 51 1,205 Net operating income 583 280 18 881 Net realized investment gains 3 1 14 18 Net income 586 281 32 899 Other performance metrics: Loss and loss adjustment expense ratio 52.8% 68.7% 61.0% 60.8% Expense ratio 32.0 36.8 38.1 34.9 Dividend ratio 0.2 0.3 0.2 Combined ratio 85.0% 105.8% 99.1% 95.9% Rate 1% (2)% (1)% 0% Retention 87% 84% 76% 84% New Business (a) $ 252 $ 524 $ 240 $ 1,016 Year Ended December 31, 2015 Net written premiums $ 2,781 $ 2,818 $ 822 $ 6,421 Net earned premiums 2,782 2,788 804 6,374 Net investment income 474 593 52 1,119 Net operating income 502 331 33 866 Net realized investment (losses) gains (19) (28) 1 (46) Net income 483 303 34 820 Other performance metrics: Loss and loss adjustment expense ratio 57.4% 65.1% 59.5% 61.0% Expense ratio 31.1 36.1 38.1 34.2 Dividend ratio 0.2 0.3 0.2 Combined ratio 88.7% 101.5% 97.6% 95.4% Rate 1% 1% (1)% 1% Retention 87% 78% 76% 81% New Business (a) $ 279 $ 552 $ 111 $ 942

54
Item 7. Management’s Discussion and Analysis of Financial Condition and Results of Operations Results of Operations – CNA Financial – (Continued) Year Ended December 31, 2014 Specialty Commercial International Total (In millions, except %) Net written premiums $ 2,839 $ 2,817 $ 880 $ 6,536 Net earned premiums 2,838 2,906 913 6,657 Net investment income 560 723 61 1,344 Net operating income 569 276 63 908 Net realized investment gains (losses) 9 9 (1) 17 Net income 578 285 62 925 Other performance metrics: Loss and loss adjustment expense ratio 57.3% 75.3% 53.5% 64.6% Expense ratio 30.1 33.7 38.9 32.9 Dividend ratio 0.2 0.3 0.2 Combined ratio 87.6% 109.3% 92.4% 97.7% Rate 3% 5% (1)% 3% Retention 87% 73% 74% 78% New Business (a) $ 309 $ 491 $ 115 $ 915 (a) Includes Hardy new business of $133 million for the year ended December 31, 2016. Prior years amounts are not included
for Hardy. 2016 Compared with 2015 Net written premiums increased $21 million in 2016 as compared with 2015. Net written premiums for Commercial increased $23 million in 2016 as compared with 2015, driven by strong retention in middle markets, partially offset by a decrease in small business, which included a premium rate adjustment, as discussed in Note 18 of the Notes to Consolidated Financial Statements under Item 8. Net written premiums for Specialty in 2016 were consistent with 2015 as growth in warranty was offset by a decrease in management and professional liability and health care due to underwriting actions undertaken in certain business lines. Net written premiums for International in 2016 were consistent with 2015 and include favorable period over period premium development of $24 million. Excluding the effect of foreign currency exchange rates and premium development, net written premiums increased 1.4% in 2016 in International. The increase in net earned premiums was consistent with the trend in net written premiums in Commercial. Excluding the effect of foreign currency exchange rates and premium development, the increase in net earned premiums was consistent with the trend in net written premiums in International. Net operating income increased $15 million in 2016 as compared with 2015. The increase in net operating income was primarily due to higher favorable net prior year reserve development and net investment income, partially offset by an increase in the current accident year loss ratio and higher underwriting expenses. Catastrophe losses were $100 million (after tax and noncontrolling interests) in 2016 as compared to catastrophe losses of $85 million (after tax and noncontrolling interests) in 2015. Favorable net prior year development of $316 million and $218 million was recorded in 2016 and 2015. Specialty recorded favorable net prior year development of $305 million and $152 million in 2016 and 2015, Commercial recorded unfavorable net prior year development of $53 million in 2016 as compared with favorable net prior year development of $30 million in 2015 and International recorded favorable net prior year development of $64 million and $36 million in 2016 and 2015. Further information on net prior year development is included in Note 8 of the Notes to Consolidated Financial Statements included under Item 8. Specialty’s combined ratio decreased 3.7 points in 2016 as compared with 2015. The loss ratio decreased 4.6 points due to higher favorable net prior year reserve development, partially offset by a higher current accident year loss ratio. Specialty’s expense ratio increased 0.9 points in 2016 as compared with 2015 due to higher employee costs and higher information technology (“IT”) spending primarily related to new underwriting platforms.

55
Item 7. Management’s Discussion and Analysis of Financial Condition and Results of OperationsResults of Operations – CNA Financial – (Continued)
Commercial’s combined ratio increased 4.3 points in 2016 as compared with 2015. The loss ratio increased 3.6 points due to the unfavorable period over period effect of net prior year reserve development and a higher current accident year loss ratio due to higher large losses. Commercial’s expense ratio increased 0.7 points in 2016 as compared with 2015 due to higher employee costs and higher IT spending primarily related to a new underwriting platform. International’s combined ratio increased 1.5 points in 2016 as compared with 2015. The loss ratio increased 1.5 points, primarily due to an increase in the current accident year loss ratio driven by a higher level of large losses related to political risk, property and financial institutions, partially offset by higher favorable net prior year development. International’s expense ratio was consistent with 2015. 2015 Compared with 2014 Net written premiums decreased $115 million in 2015 as compared with 2014. This decrease was driven by the unfavorable effect of foreign currency exchange rates, the 2014 termination of a specialty product managing general underwriter relationship in Canada and unfavorable premium development at Hardy, all in International, lower new business in Specialty and the residual effect of previous underwriting actions undertaken in certain business classes, offset by positive rate, higher retention and new business in Commercial. Net earned premiums decreased $283 million in 2015 as compared with 2014, consistent with the trend in net written premiums. Net operating income decreased $42 million in 2015 as compared with 2014. The decrease in net operating income was due to lower net investment income and less favorable underwriting results in International, partially offset by improved underwriting results in Commercial. Catastrophe losses were $85 million (after tax and noncontrolling interests) in 2015 as compared to catastrophe losses of $92 million (after tax and noncontrolling interests) in 2014. Favorable net prior year development of $218 million and $50 million was recorded in 2015 and 2014. Specialty recorded favorable net prior year development of $152 million and $149 million in 2015 and 2014, Commercial recorded favorable net prior year development of $30 million in 2015 as compared with unfavorable net prior year development of $156 million in 2014 and International recorded favorable net prior year development of $36 million and $57 million in 2015 and 2014. Further information on net prior year development is included in Note 8 of the Notes to Consolidated Financial Statements included under Item 8. Specialty’s combined ratio increased 1.1 points in 2015 as compared with 2014. The loss ratio increased 0.1 point due to deterioration in the current accident year loss ratio, primarily offset by higher net favorable prior year development. Specialty’s expense ratio increased 1.0 point in 2015 as compared with 2014, driven by increased underwriting expenses and the unfavorable effect of lower net earned premiums. Commercial’s combined ratio improved 7.8 points in 2015 as compared with 2014. The loss ratio improved 10.2 points, due to favorable net prior year development for 2015 as compared to unfavorable net prior year development for 2014 and an improved current accident year loss ratio. Commercial’s expense ratio increased 2.4 points in 2015 as compared with 2014, due to higher expenses including increased commissions, the favorable impact in 2014 of recoveries on insurance receivables written off in prior years and the unfavorable effect of lower net earned premiums. International’s combined ratio increased 5.2 points in 2015 as compared with 2014. The loss ratio increased 6.0 points, primarily due to less favorable net prior year development and an increase in the current accident year loss ratio driven by large losses. International’s expense ratio improved 0.8 points as compared with 2014, due to lower expenses, partially offset by the unfavorable effect of lower net earned premiums.

56
Item 7. Management’s Discussion and Analysis of Financial Condition and Results of Operations Results of Operations – CNA Financial – (Continued) Non-Core Operations The following table summarizes the results of CNA’s non-core operations for the years ended December 31, 2016, 2015 and 2014. Years Ended December 31 2016 2015 2014 (In millions) Net earned premiums $ 536 $ 548 $ 556 Net investment income 783 721 723 Net operating loss (146) (399) (138) Net realized investment gains 21 12 15 Net loss from continuing operations (125) (387) (123) 2016 Compared with 2015 Net loss from continuing operations decreased $262 million in 2016 as compared to 2015. In 2015, CNA recognized a $177 million (after-tax and noncontrolling interests) charge relating to a premium deficiency and claim reserve strengthening in its long term care business. The December 31, 2015 Gross Premium Valuation (“GPV”) indicated a premium deficiency of $296 million. The indicated premium deficiency necessitated a charge to income that was effected by the write off of the entire long term care deferred acquisition cost of $289 million and an increase to active life reserves of $7 million. Due to the recognition of the premium deficiency and resetting of actuarial assumptions in the fourth quarter of 2015, the operating results of CNA’s long term care business in 2016 reflect the variance between actual experience and the expected results contemplated in its best estimate reserves. In 2016, the long term care business recorded net operating income of $18 million (after tax and noncontrolling interests), driven by a favorable release of claim reserves resulting from the annual claims experience study and higher net investment income due to an increase in the invested asset base. The long term care results were generally in line with expectations, as the impact of favorable morbidity was partially offset by unfavorable persistency. In 2015, results of CNA’s long term care business reflected variances between actual experience and actuarial assumptions that were locked-in at policy issuance. As a result of the reserve assumption unlocking, the 2016 and 2015 results are not comparable. For further discussion of the GPV and premium deficiency, see the Insurance Reserves section of this MD&A. Results in 2016 and 2015 were also negatively affected by $74 million and $49 million (after tax and noncontrolling interests) charges related to the application of retroactive reinsurance accounting to adverse reserve development ceded under the 2010 A&EP loss portfolio transfer, as further discussed in Note 8 of the Notes to Consolidated Financial Statements included under Item 8. 2015 Compared with 2014 Net loss from continuing operations increased $264 million in 2015 as compared with 2014 driven by the $177 million (after tax and noncontrolling interests) charge related to recognition of a premium deficiency and claim reserve strengthening in CNA’s long term care business, discussed above. Excluding the effects of this item, results in 2015 were also negatively affected by higher morbidity in CNA’s long term care business. Results in 2014 were negatively affected by a $31 million loss (after tax and noncontrolling interests) on a coinsurance transaction related to the sale of CNA’s former life insurance subsidiary. Results in 2015 were also negatively impacted by an increase in gross A&EP claim reserves. While all of this reserve development is reinsured under the loss portfolio transfer, only a portion of the reinsurance recovery is currently recognized because of the application of retroactive reinsurance accounting. As a result, a charge of $84 million ($49 million after tax and noncontrolling interests) was recorded in 2015, as further discussed in Note 8 of the Notes to Consolidated Financial Statements included under Item 8. Additionally, results in 2015 benefited from lower interest expense due to the maturity of higher coupon debt in the fourth quarter of 2014.

57
Item 7. Management’s Discussion and Analysis of Financial Condition and Results of OperationsResults of Operations – CNA Financial – (Continued)
Referendum on the United Kingdom’s Membership in the European Union On June 23, 2016, the United Kingdom (“U.K.”) held a referendum in which voters approved an exit from the European Union (“E.U.”), commonly referred to as “Brexit.” As a result of the referendum, it is currently expected that the British government will formally commence the process to leave the E.U. and begin negotiating the terms of treaties that will govern the U.K.’s future relationship with the E.U. in the first quarter of 2017. Although the terms of any future treaties are unknown, changes in CNA’s international operating platform may be required to allow CNA to continue to write business in the E.U. after the completion of Brexit. As a result of these changes, the complexity and cost of regulatory compliance of CNA’s European business is likely to increase. Diamond Offshore Overview Oil prices, which had fallen to a 12-year low of less than $30 per barrel in January of 2016, rebounded to some extent into the low-to-mid-$50s per barrel range by the end of January of 2017, in part due to expectations that an agreement to cut production by certain members of the Organization of Petroleum Exporting Countries (“OPEC”) and others that went into effect in 2017 would reduce the oversupply of oil and raise and potentially stabilize oil prices. To date, however, oil prices have continued to exhibit volatility due to multiple factors, including fluctuations in the current and expected level of global oil inventories and estimates of global demand. Despite the recent rise in oil prices and announcements by a few customers of planned increases in capital spending in 2017, Diamond Offshore expects that overall capital spending for offshore exploration and development in 2017 will be lower than 2016 levels. As a consequence, the offshore contract drilling industry remains weak. Industry analysts have reported that in 2016, for the second consecutive year, the global supply of floater rigs decreased with 24 floaters being scrapped during the year. In addition, many drilling rigs across all water depth categories were cold stacked in 2016. Despite these events, the oversupply of drilling rigs in the floater markets continues to persist. Industry reports indicate that only three newbuild floaters were delivered in 2016; however, there are approximately 40 newbuild floaters scheduled for delivery between 2017 and 2021. Industry analysts predict that these delivery dates may extend further as newbuild owners negotiate with their respective shipyards. Given the oversupply of rigs, competition for the limited number of offshore drilling jobs continues to be intense. In some cases, dayrates have been negotiated at break-even or below-cost levels in order to enable the drilling contractor to recover a portion of operating costs for rigs that would otherwise be uncontracted or cold stacked. In addition, customers have indicated a preference for “hot” rigs rather than reactivated cold-stacked rigs. This preference incentivizes the drilling contractor to contract rigs at lower rates for the sole purpose of maintaining the rigs in an active state and allowing for at least partial cost recovery. Industry analysts have predicted that the offshore contract drilling market will remain depressed through 2017. As a result of the continuing depressed market conditions in the offshore drilling industry and continued pessimistic outlook for the near term, certain of Diamond Offshore’s customers, as well as those of its competitors, have attempted to renegotiate or terminate existing drilling contracts. Such renegotiations have included requests to lower the contract dayrate in some cases in exchange for additional contract term, shorten the term on one contracted rig in exchange for additional term on another rig, to early terminate a contract in exchange for a lump sum payout and other requests. In addition to the potential for renegotiations, some of Diamond Offshore’s drilling contracts permit the customer to terminate the contract early after specified notice periods, usually resulting in a requirement for the customer to pay a contractually specified termination amount, which may not fully compensate Diamond Offshore for the loss of the contract. As a result of these depressed market conditions, some customers have also utilized such contract clauses to seek to renegotiate or terminate a drilling contract or claim that Diamond Offshore has breached provisions of its drilling contracts in order to avoid their obligations to Diamond Offshore under circumstances where Diamond Offshore believes it is in compliance with the contracts.

58
Item 7. Management’s Discussion and Analysis of Financial Condition and Results of Operations Results of Operations – Diamond Offshore – (Continued) Particularly during depressed market conditions, the early termination of a contract may result in a rig being idle for an extended period of time, which could adversely affect Diamond Offshore’s business. When a customer terminates a contract prior to the contract’s scheduled expiration, Diamond Offshore’s contract backlog is also adversely impacted. Diamond Offshore’s results of operations and cash flows for the years ended December 31, 2016 and 2015 have been materially impacted by depressed market conditions in the offshore drilling industry. Diamond Offshore currently expects that these adverse market conditions will continue for the foreseeable future. The continuation of these conditions for an extended period could result in more of Diamond Offshore’s rigs being without contracts and/or cold stacked or scrapped and could further materially and adversely affect its financial condition, results of operations and cash flows. When Diamond Offshore cold stacks or elects to scrap a rig, it evaluates the rig for impairment. During 2016, Diamond Offshore recognized an aggregate impairment loss of $680 million, related to eight of its drilling rigs and related spare parts and supplies. During 2015, Diamond Offshore recognized an aggregate impairment loss of $861 million related to 17 of its drilling rigs. Historically, the longer a drilling rig remains cold stacked, the higher the cost of reactivation and, depending on the age, technological obsolescence and condition of the rig, the lower the likelihood that the rig will be reactivated at a future date. As of January 30, 2017, ten rigs in Diamond Offshore’s fleet were cold stacked. Contract Drilling Backlog Diamond Offshore’s contract drilling backlog was $3.6 billion, $4.1 billion and $5.2 billion as of January 1, 2017 (based on contract information known at that time), October 1, 2016 (the date reported in our Quarterly Report on Form 10-Q for the quarter ended September 30, 2016) and February 16, 2016 (the date reported in our Annual Report on Form 10-K for the year ended December 31, 2015). The contract drilling backlog by year as of January 1, 2017 is $1.5 billion in 2017, $1.1 billion in 2018, $0.8 billion in 2019 and $0.2 billion in 2020. Contract drilling backlog includes $158 million, $158 million, $150 million and $6 million for 2017, 2018, 2019 and 2020 attributable to the Ocean GreatWhite, which reflects a revised standby rate that allows Diamond Offshore to pass along certain cost savings to its customer while maintaining approximately the same operating margin and cash flows as the original contract and $149 million and $119 million for 2017 and 2018 attributable to contracted work for the Ocean Valor under a contract that Petróleo Brasileiro S.A. (“Petrobras”) has attempted to terminate and is currently in effect pursuant to an injunction granted by a Brazilian court, which Petrobras has appealed. Contract drilling backlog includes only firm commitments (typically represented by signed contracts) and is calculated by multiplying the contracted operating dayrate by the firm contract period. Diamond Offshore’s calculation also assumes full utilization of its drilling equipment for the contract period (excluding scheduled shipyard and survey days); however, the amount of actual revenue earned and the actual periods during which revenues are earned will be different than the amounts and periods stated above due to various factors affecting utilization such as weather conditions and unscheduled repairs and maintenance. Contract drilling backlog excludes revenues for mobilization, demobilization, contract preparation and customer reimbursables. Changes in Diamond Offshore’s contract drilling backlog between periods are generally a function of the performance of work on term contracts, as well as the extension or modification of existing term contracts and the execution of additional contracts. In addition, under certain circumstances, Diamond Offshore’s customers may seek to terminate or renegotiate its contracts, which could adversely affect its reported backlog. Results of Operations Diamond Offshore’s pretax income (loss) is primarily a function of contract drilling revenue earned less contract drilling expenses incurred or recognized. The two most significant variables affecting Diamond Offshore’s contract drilling revenues are dayrates earned and rig utilization rates achieved by its rigs, each of which is a function of rig supply and demand in the marketplace. Revenues can also be affected as a result of the acquisition or disposal of rigs, rig mobilizations, required surveys and shipyard projects.

59
Item 7. Management’s Discussion and Analysis of Financial Condition and Results of OperationsResults of Operations – Diamond Offshore – (Continued)
Operating expenses represent all direct and indirect costs associated with the operation and maintenance of Diamond Offshore’s drilling equipment. The principal components of Diamond Offshore’s operating costs are, among other things, direct and indirect costs of labor and benefits, repairs and maintenance, freight, regulatory inspections, boat and helicopter rentals and insurance. The following table summarizes the results of operations for Diamond Offshore for the years ended December 31, 2016, 2015 and 2014 as presented in Note 20 of the Notes to Consolidated Financial Statements included under Item 8: Year Ended December 31 2016 2015 2014 (In millions) Revenues: Contract drilling revenues $ 1,525 $ 2,360 $ 2,737 Net investment income 1 3 1 Investment losses (12) Other revenues 75 65 87 Total 1,589 2,428 2,825 Expenses: Contract drilling expenses 772 1,228 1,524 Other operating expenses Impairment of assets 680 881 109 Other expenses 518 627 616 Interest 90 94 62 Total 2,060 2,830 2,311 Income (loss) before income tax (471) (402) 514 Income tax (expense) benefit 111 117 (142) Amounts attributable to noncontrolling interests 174 129 (189) Net income (loss) attributable to Loews Corporation $ (186) $ (156) $ 183 2016 Compared with 2015 Contract drilling revenue decreased $835 million in 2016 as compared with 2015 due to continued depressed market conditions in all floater markets and for the jack-up rig. The decrease in contract drilling revenues for ultra-deepwater and deepwater floater fleets was primarily due to currently cold stacked rigs that had operated in 2015, lower amortized mobilization and contract preparation fees and lower dayrates earned by the Ocean Valiant and Ocean Apex. The decrease in contract drilling revenues for the mid-water and jack-up fleets was primarily due to fewer mid-water floaters operating under contract in 2016 compared to 2015 and the early contract termination for the Ocean Scepter in 2016, which is expected to commence operations offshore Mexico in the first quarter of 2017. These decreases were partially offset by the favorable settlement of a contractual dispute of $36 million and receipt of loss-of-hire insurance proceeds in 2016. Contract drilling expense decreased $456 million in 2016 as compared with 2015, reflecting Diamond Offshore’s lower cost structure due to additional rigs idled, cold stacked or retired during 2015 and 2016, as well as the favorable impact of cost control initiatives. Asset impairment charges decreased $201 million as compared with the prior year. As a result of the impairment charges in 2015 and 2016 and resulting lower depreciable asset base, depreciation expense decreased $111 million in 2016 as compared to 2015. Net results decreased $30 million in 2016 as compared with 2015, primarily due to lower utilization of the rig fleet, which reduced both contract drilling revenue and expense for the year. Results for 2016 also reflected an aggregate impairment charge of $267 million (after taxes and noncontrolling interests) compared to impairment charges aggregating $341 million (after taxes and noncontrolling interests) in 2015. In addition, during 2016, Diamond Offshore sold its investment in privately-held corporate bonds for a total recognized loss of $12 million ($4 million after tax and noncontrolling interests). The lower results were partially offset by a decrease in depreciation expense, recognition of $40 million in demobilization revenue and $15 million in net reimbursable revenue related to the Ocean Endeavor’s demobilization from the Black Sea and the absence of a $20 million

60
Item 7. Management’s Discussion and Analysis of Financial Condition and Results of Operations Results of Operations – Diamond Offshore – (Continued) impairment charge in 2015 to write-off all goodwill associated with the Company’s investment in Diamond Offshore. In addition, results in 2016 were favorably impacted by a $43 million tax adjustment primarily related to Diamond Offshore’s Egyptian liability for uncertain tax positions related to the devaluation of the Egyptian pound. 2015 Compared with 2014 Contract drilling revenue decreased $377 million in 2015 as compared with 2014, primarily due to a decrease in revenue earned by both the mid-water and jack-up fleets, partially offset by an increase in revenue earned by both the ultra-deepwater and deepwater floaters. The decrease in contract drilling revenue was primarily due to cold stacking, rig sales and incremental downtime between contracts for several rigs. During 2015, twelve mid-water rigs were cold stacked or retired and five jack-up rigs were cold stacked and marketed for sale. These decreases were partially offset by increased incremental revenue earning days for newly constructed ultra-deepwater floaters and upgraded or enhanced rigs. In addition, during 2015, four deepwater floaters returned to operation after prolonged periods of nonproductive time for planned upgrades and surveys, as well as warm-stacking between contracts. Contract drilling expense decreased $296 million in 2015 as compared with 2014, primarily due to lower rig utilization, combined with efforts to control costs. This decrease in expenses was partially offset by an increase in depreciation expense due to a higher depreciable asset base in 2015, including the Ocean Apex and two drillships, which were placed in service in December of 2014, partially offset by the absence of depreciation for certain rigs that were impaired or sold during late 2014 and in 2015. A net loss of $156 million in 2015 and net income of $183 million in 2014 resulted in a change of $339 million due to the impact of a $341 million asset impairment charge (after tax and noncontrolling interests) in 2015 related to the carrying value of 17 drilling rigs, as compared to the prior year when Diamond Offshore recorded a $55 million asset impairment charge (after tax and noncontrolling interests) related to the carrying values of six drilling rigs. Results in 2015 also include the recognition of a $20 million impairment charge to write off all goodwill associated with the Company’s investment in Diamond Offshore as well as higher depreciation and interest expense. Boardwalk Pipeline Overview Boardwalk Pipeline derives revenues primarily from the transportation and storage of natural gas and natural gas liquids (“NGLs”). Transportation services consist of firm natural gas transportation, where the customer pays a capacity reservation charge to reserve pipeline capacity at receipt and delivery points along pipeline systems, plus a commodity and fuel charge on the volume of natural gas actually transported, and interruptible natural gas transportation, under which the customer pays to transport gas only when capacity is available and used. The transportation rates Boardwalk Pipeline is able to charge customers are heavily influenced by market trends (both short and longer term), including the available natural gas supplies, geographical location of natural gas production, the demand for gas by end-users such as power plants, petrochemical facilities and liquefied natural gas (“LNG”) export facilities and the price differentials between the gas supplies and the market demand for the gas (basis differentials). Rates for short term firm and interruptible transportation services are influenced by shorter term market conditions such as current and forecasted weather. Boardwalk Pipeline offers firm natural gas storage services in which the customer reserves and pays for a specific amount of storage capacity, including injection and withdrawal rights, and interruptible storage and parking and lending (“PAL”) services where the customer receives and pays for capacity only when it is available and used. The value of Boardwalk Pipeline’s storage and PAL services (comprised of parking gas for customers and/or lending gas to customers) is affected by natural gas price differentials between time periods, such as between winter and summer (time period price spreads), price volatility of natural gas and other factors. Boardwalk Pipeline’s storage and parking services have greater value when the natural gas futures market is in contango (a positive time period price spread, meaning that current price quotes for delivery of natural gas further in the future are higher than in the nearer term), while its lending service has greater value when the futures market is backwardated (a negative time period price spread, meaning that current price quotes for delivery of natural gas in the nearer term are higher than further in the future). The value of both storage and PAL services may also be favorably impacted by increased volatility in the price of natural gas, which allows Boardwalk Pipeline to optimize the value of its storage and PAL capacity.

61
Item 7. Management’s Discussion and Analysis of Financial Condition and Results of OperationsResults of Operations – Boardwalk Pipeline – (Continued)
Boardwalk Pipeline also transports and stores NGLs. Contracts for Boardwalk Pipeline’s NGLs services are generally fee based or based on minimum volume requirements, while others are dependent on actual volumes transported. Boardwalk Pipeline’s NGLs storage rates are market-based and contracts are typically fixed price arrangements with escalation clauses. Boardwalk Pipeline is not in the business of buying and selling natural gas and NGLs other than for system management purposes, but changes in natural gas and NGLs prices may impact the volumes of natural gas or NGLs transported and stored by customers on its systems. Due to the capital intensive nature of its business, Boardwalk Pipeline’s operating costs and expenses typically do not vary significantly based upon the amount of products transported, with the exception of fuel consumed at its compressor stations and not included in a fuel tracker. Firm Transportation Agreements A substantial portion of Boardwalk Pipeline’s transportation capacity is contracted for under firm transportation agreements. Actual revenues recognized from capacity reservation and minimum bill charges in 2016 were $1.0 billion. Approximate projected revenues from capacity reservation and minimum bill charges under committed firm transportation agreements in place as of December 31, 2016 are $1.1 billion for 2017 and $975 million for 2018. The amounts for 2016 and 2017 increased approximately $13 million and $25 million from what was reported in our 2015 Form 10-K. The increase in each year is primarily due to contract renewals and new contracts that were entered into during 2016. Additional revenues Boardwalk Pipeline has recognized and may receive under firm transportation agreements based on actual utilization of the contracted pipeline capacity, any expected revenues for periods after the expiration dates of the existing agreements, execution of precedent agreements associated with growth projects or other events that occurred or will occur subsequent to December 31, 2016 are not included in these amounts. Each year a portion of Boardwalk Pipeline’s firm transportation agreements expire and need to be renewed or replaced. In the 2018 to 2020 timeframe, the agreements associated with the East Texas Pipeline, Southeast Expansion, Gulf Crossing Pipeline and Fayetteville and Greenville Laterals, which were placed into service in 2008 and 2009, will expire. These projects were large, new pipeline expansions, developed to serve growing production in Texas, Oklahoma, Arkansas and Louisiana and anchored primarily by 10-year firm transportation agreements with producers. Since Boardwalk Pipeline’s expansion projects went into service, gas production from the Utica and Marcellus area in the Northeast has grown significantly and has altered the flow patterns of natural gas in North America. Over the last few years, gas production from other basins such as Barnett and Fayetteville, which primarily supported two of Boardwalk Pipeline’s expansions, has declined because the production economics in those basins are not as competitive as other production basins, such as Utica and Marcellus. These market dynamics have resulted in less production from certain basins tied to Boardwalk Pipeline’s system and a narrowing of basis differentials across portions of its pipeline systems, primarily for capacity associated with natural gas flows from west to east. Boardwalk Pipeline expects that the total revenues generated from the expansion projects’ capacity could be materially lower when these contracts expire. Boardwalk Pipeline’s marketing efforts are focused on enhancing the value of this expansion capacity. Boardwalk Pipeline is working with customers to match gas supplies from various basins to new and existing customers and markets, including aggregating supplies at key locations along its pipelines to provide end-use customers with attractive and diverse supply options. Partially as a result of the increase in overall gas supplies, demand markets, primarily in the Gulf Coast area, are growing due to new natural gas export facilities, power plants and petrochemical facilities and increased exports to Mexico. These developments have resulted in significant growth projects for Boardwalk Pipeline. Boardwalk Pipeline placed into service approximately $320 million of growth projects in 2016, and have an additional $1.3 billion of growth projects under development that are expected to be placed into service in 2017 and 2018. These new projects have lengthy planning and construction periods and, as a result, will not contribute to Boardwalk Pipeline’s earnings and cash flows until they are placed into service over the next several years. The revenues generated that are expected to be realized in 2017 and 2018 from these projects are included in the amounts above.

62
Item 7. Management’s Discussion and Analysis of Financial Condition and Results of Operations Results of Operations – Boardwalk Pipeline – (Continued) Pipeline System Maintenance Boardwalk Pipeline incurs substantial costs for ongoing maintenance of its pipeline systems and related facilities, including those incurred for pipeline integrity management activities, equipment overhauls, general upkeep and repairs. These costs are not dependent on the amount of revenues earned from its natural gas transportation services. The Pipeline and Hazardous Materials Safety Administration (“PHMSA”) has developed regulations that require transportation pipeline operators to implement integrity management programs to comprehensively evaluate certain areas along pipelines and take additional measures to protect pipeline segments located in highly populated areas. These regulations have resulted in an overall increase in ongoing maintenance costs, including maintenance capital and maintenance expense. PHMSA has proposed more prescriptive regulations, including expanded integrity management requirements, automatic or remote-controlled valve use, leak detection system installation, pipeline material strength testing and verification of maximum allowable pressures of certain pipelines, which if implemented, could require Boardwalk Pipeline to incur significant additional costs. Maintenance costs may be capitalized or expensed, depending on the nature of the activities. For any given reporting period, the mix of projects that Boardwalk Pipeline undertakes will affect the amounts it records as property, plant and equipment on its balance sheet or recognize as expenses, which impacts Boardwalk Pipeline’s earnings. In 2017, Boardwalk Pipeline expects to spend approximately $340 million to maintain its pipeline systems, of which approximately $140 million is expected to be maintenance capital. In 2016, Boardwalk Pipeline spent $321 million, of which $121 million was recorded as maintenance capital. The maintenance capital amounts include pipeline integrity upgrades associated with certain segments of Boardwalk Pipeline’s natural gas pipelines which are expected to be completed in 2018. Credit Risk Credit risk relates to the risk of loss resulting from the default by a customer of its contractual obligations or the customer filing bankruptcy. Boardwalk Pipeline actively monitors its customer credit profiles, as well as the portion of its revenues generated from investment-grade and non-investment-grade customers. A majority of Boardwalk Pipeline’s customers are rated investment-grade by at least one of the major credit rating agencies, however, the ratings of several of its producer customers, including some of those supporting its growth projects, have been downgraded in the past year. The downgrades may restrict liquidity for those customers and indicate a greater likelihood of nonperformance of their contractual obligations, including failure to make future payments or, for customers supporting its growth projects, failure to post required letters of credit or other collateral as construction progresses. Gulf South Rate Case Boardwalk Pipeline’s Gulf South subsidiary filed a rate case with the Federal Energy Regulatory Commission (“FERC”) in 2014 and reached an uncontested settlement with its customers in 2015, which was subsequently approved by the FERC and became effective on March 1, 2016. The rate case settlement provided for, among other things, a system-wide rate design across the majority of the pipeline system, which resulted in a general overall increase in rates and implementation of a fuel tracker for determining future fuel rates on April 1, 2016. As of December 31, 2015, Boardwalk Pipeline had a $16 million rate refund liability recorded, which was settled in April of 2016 through a combination of cash payments and invoice credits. Had the fuel tracker been implemented April 1, 2015, revenues would have been lower by $18 million and operating expense would have been lower by $13 million for the year ended December 31, 2015.

63
Item 7. Management’s Discussion and Analysis of Financial Condition and Results of OperationsResults of Operations – Boardwalk Pipeline – (Continued)
Results of Operations The following table summarizes the results of operations for Boardwalk Pipeline for the years ended December 31, 2016, 2015 and 2014 as presented in Note 20 of the Notes to Consolidated Financial Statements included under Item 8: Year Ended December 31 2016 2015 2014 (In millions) Revenues: Other revenue, primarily operating $ 1,316 $ 1,253 $ 1,235 Net investment income 1 1 Total 1,316 1,254 1,236 Expenses: Operating 835 851 931 Interest 183 176 165 Total 1,018 1,027 1,096 Income before income tax 298 227 140 Income tax expense (61) (46) (11) Amounts attributable to noncontrolling interests (148) (107) (111) Net income attributable to Loews Corporation $ 89 $ 74 $ 18 2016 Compared with 2015 Total revenues increased $62 million in 2016 as compared with 2015. Excluding the net effect of $13 million of proceeds received from the settlement of a legal matter in 2016, $9 million of proceeds received from a business interruption claim in 2015 and items offset in fuel and transportation expense, primarily retained fuel, operating revenues increased $83 million. The increase was driven by an increase in transportation revenues of $71 million, which resulted primarily from growth projects recently placed into service, incremental revenues from the Gulf South rate case of $18 million and a full year of revenues from the Evangeline pipeline. Storage and PAL revenues were higher by $17 million primarily from the effects of favorable market conditions on time period price spreads. Operating expenses decreased $16 million in 2016 as compared with 2015. Excluding receipt of a franchise tax refund of $10 million in 2015 and items offset in operating revenues, operating costs and expenses increased $5 million primarily due to higher employee related costs, partially offset by decreases in maintenance activities and depreciation expense. Interest expense increased $7 million primarily due to higher average interest rates compared to 2015. Net income increased $15 million in 2016 as compared with 2015, primarily reflecting higher revenues and lower operating expenses, partially offset by higher interest expense as discussed above. 2015 Compared with 2014 Total revenues increased $18 million in 2015 as compared with 2014. Excluding the business interruption claim proceeds of $8 million and items offset in fuel and transportation expense, primarily retained fuel, operating revenues increased $33 million. This increase is primarily due to higher transportation revenues of $39 million from growth projects recently placed into service, including the Evangeline pipeline which was acquired in October of 2014 and $20 million of additional revenues resulting from the Gulf South rate case, partially offset by the effects of comparably warm weather experienced in the early part of the 2015 period in Boardwalk Pipeline’s market areas and unfavorable market conditions. Storage and PAL revenues decreased $20 million primarily as a result of the effects of unfavorable market conditions on time period price spreads. Operating expenses decreased $80 million in 2015 as compared with 2014. This decrease is primarily due to a $94 million prior year charge to write off all capitalized costs associated with the terminated Bluegrass project, a $10 million franchise tax refund related to settlement of prior tax periods and a decrease in fuel and transportation expense due to lower natural gas prices. These decreases were partially offset by higher depreciation expense of $35

64
Item 7. Management’s Discussion and Analysis of Financial Condition and Results of Operations Results of Operations – Boardwalk Pipeline – (Continued) million from an increase in the asset base, including the Evangeline pipeline acquisition and a change in the estimated lives of certain older, low-pressure assets. Maintenance expense increased by $15 million primarily due to pipeline system maintenance activities and the Evangeline pipeline acquisition. Interest expense increased $11 million primarily due to higher average debt balances as compared with 2014, lower capitalized interest related to capital projects and the expensing of previously deferred costs related to the refinancing of Boardwalk Pipeline’s revolving credit facility. Net income increased $56 million in 2015 as compared with 2014, primarily reflecting the prior year Bluegrass charge of $55 million (after tax and noncontrolling interests) and higher revenues partially offset by higher depreciation and interest expense as discussed above. Loews Hotels The following table summarizes the results of operations for Loews Hotels for the years ended December 31, 2016, 2015 and 2014 as presented in Note 20 of the Notes to Consolidated Financial Statements included under Item 8: Year Ended December 31 2016 2015 2014 (In millions) Revenues: Operating revenue $ 557 $ 527 $ 398 Revenues related to reimbursable expenses 110 77 77 Total 667 604 475 Expenses: Operating 489 467 351 Reimbursable expenses 110 77 77 Depreciation 63 54 37 Equity income from joint ventures (41) (43) (25) Interest 24 21 14 Total 645 576 454 Income before income tax 22 28 21 Income tax expense (10) (16) (10) Net income attributable to Loews Corporation $ 12 $ 12 $ 11 2016 Compared with 2015 Operating revenues increased $30 million in 2016 as compared with 2015 primarily due to the acquisition of one hotel during 2016 and the acquisition of two hotels during 2015, partially offset by a decrease in revenue at the Loews Miami Beach Hotel due to renovations during 2016. Operating and depreciation expenses increased $22 million and $9 million in 2016 as compared with 2015 primarily due to the acquisition of one hotel during 2016 and the acquisition of two hotels during 2015. Equity income from joint ventures in 2016 was impacted by costs associated with opening one new hotel during 2016 and the $13 million impairment of an equity interest in a joint venture hotel property. Interest expense increased $3 million in 2016 as compared with 2015 primarily due to new property-level debt incurred to fund acquisitions. Net income was consistent in 2016 as compared with 2015 due to the increases in revenues and expenses discussed above. Loews Hotels expects to sell its equity interest in and conclude its management contract for the Loews Don CeSar Hotel, a joint venture hotel property, in the first quarter of 2017 and record a gain on the sale.

65
Item 7. Management’s Discussion and Analysis of Financial Condition and Results of OperationsResults of Operations – Loews Hotels – (Continued)
2015 Compared with 2014 Operating revenues increased $129 million in 2015 as compared with 2014 primarily due to the acquisition of two hotels during 2015 and three hotels during 2014. Operating and depreciation expenses increased $116 million and $17 million in 2015 as compared with 2014 primarily due to the acquisition of two hotels during 2015 and three hotels during 2014. Equity income increased $18 million in 2015 as compared with 2014 primarily due to improved performance of the Universal Orlando joint ventures, partially offset by a $5 million impairment of a joint venture equity interest in a hotel property. Interest expense increased $7 million in 2015 as compared with 2014 primarily due to higher debt levels, including refinancings and new property-level debt incurred to fund acquisitions. Net income increased slightly as compared to the prior year as higher income from Universal Orlando joint venture properties was partially offset by the negative impact of transaction and transition costs for hotels acquired during the year and higher interest expense. In addition, the effective tax rate increased due to an adjustment for prior years’ estimate and a higher state tax accrual for an increase in the ratio of Florida based income. Corporate Corporate operations consist primarily of investment income at the Parent Company, corporate interest expenses and other corporate administrative costs. Investment income includes earnings on cash and short term investments held at the Parent Company level to meet current and future liquidity needs, as well as results of limited partnership investments and the trading portfolio. The following table summarizes the results of operations for Corporate for the years ended December 31, 2016, 2015 and 2014 as presented in Note 20 of the Notes to Consolidated Financial Statements included under Item 8: Year Ended December 31 2016 2015 2014 (In millions) Revenues: Net investment income $ 146 $ 22 $ 94 Other revenues 3 6 3 Total 149 28 97 Expenses: Operating 131 116 103 Interest 72 74 74 Total 203 190 177 Loss before income tax (54) (162) (80) Income tax benefit 19 59 28 Net loss attributable to Loews Corporation $ (35) $ (103) $ (52) 2016 Compared with 2015 Net investment income increased by $124 million in 2016 as compared with 2015 primarily due to improved performance of equity based investments and fixed income investments in the trading portfolio and improved results from limited partnership investments. Operating expenses increased $15 million in 2016 as compared with 2015 primarily due to expenses related to the 2016 Incentive Compensation Plan, which was approved by shareholders on May 10, 2016. Net results improved by $68 million in 2016 as compared with 2015 primarily due to the changes discussed above.

66
Item 7. Management’s Discussion and Analysis of Financial Condition and Results of Operations Results of Operations – Corporate – (Continued) 2015 Compared with 2014 Net investment income decreased by $72 million in 2015 as compared with 2014 primarily due to lower performance of equities and derivative related securities in the trading portfolio and lower results from limited partnership investments. Net results decreased by $51 million in 2015 as compared with 2014 primarily due to the change in revenues discussed above and increased corporate overhead expenses. LIQUIDITY AND CAPITAL RESOURCES Parent Company Parent Company cash and investments, net of receivables and payables, at December 31, 2016 totaled $5.0 billion, as compared to $4.3 billion at December 31, 2015. In 2016, we received $780 million in dividends from our subsidiaries, including a special dividend from CNA of $485 million. Cash outflows included the payment of $134 million to fund treasury stock purchases, $8 million to purchase shares of CNA, $84 million of cash dividends to our shareholders and net cash contributions of approximately $20 million to Loews Hotels. As a holding company we depend on dividends from our subsidiaries and returns on our investment portfolio to fund our obligations. We are not responsible for the liabilities and obligations of our subsidiaries and there are no Parent Company guarantees. As of December 31, 2016, there were 336,621,358 shares of Loews common stock outstanding. Depending on market and other conditions, we may purchase our shares and shares of our subsidiaries’ outstanding common stock in the open market or otherwise. In 2016, we purchased 3.4 million shares of Loews common stock and 0.3 million shares of CNA common stock. We have an effective Registration Statement on Form S-3 on file with the Securities and Exchange Commission (“SEC”) registering the future sale of an unlimited amount of our debt and equity securities. In March of 2016, Moody’s Investors Service, Inc. (“Moody’s”) downgraded our unsecured debt rating from A2 to A3, and the outlook remains stable. Our current unsecured debt ratings are A+ for S&P Global Ratings (“S&P”) and A for Fitch Ratings, Inc., with a stable outlook for both. Should one or more rating agencies downgrade our credit ratings from current levels, or announce that they have placed us under review for a potential downgrade, our cost of capital could increase and our ability to raise new capital could be adversely affected. We continue to pursue conservative financial strategies while seeking opportunities for responsible growth. Future uses of our cash may include investing in our subsidiaries, new acquisitions and/or repurchases of our and our subsidiaries’ outstanding common stock. Subsidiaries CNA’s cash provided by operating activities was $1.4 billion in 2016 and 2015. Cash provided by operating activities in 2016 reflected increased receipts relating to the returns on invested capital for limited partnerships, lower income taxes paid, and offset by higher net claim and expense payments. In 2015, cash provided by operating activities reflected lower premiums collected and decreased receipts relating to returns on limited partnerships, offset by lower net claim payments. CNA declared and paid dividends of $3.00 per share on its common stock, including a special dividend of $2.00 per share in 2016. On February 3, 2017, CNA’s Board of Directors declared a quarterly dividend of $0.25 per share, and a special dividend of $2.00 per share payable March 8, 2017 to shareholders of record on February 20, 2017. CNA’s declaration and payment of future dividends is at the discretion of its Board of Directors and will depend on many factors, including CNA’s earnings, financial condition, business needs and regulatory constraints. The payment of dividends by CNA’s insurance subsidiaries without prior approval of the insurance department of each subsidiary’s domiciliary jurisdiction is limited by formula. Dividends in excess of these amounts are subject to prior approval by the respective state insurance departments.

67
Item 7. Management’s Discussion and Analysis of Financial Condition and Results of OperationsLiquidity and Capital Resources – Subsidiaries – (Continued)
Dividends from the Continental Casualty Company (“CCC”), a subsidiary of CNA, are subject to the insurance holding company laws of the State of Illinois, the domiciliary state of CCC. Under these laws, ordinary dividends, or dividends that do not require prior approval by the Illinois Department of Insurance (the “Department”), are determined based on the greater of the prior year’s statutory net income or 10% of statutory surplus as of the end of the prior year, as well as timing and amount of dividends paid in the preceding 12 months. Additionally, ordinary dividends may only be paid from earned surplus, which is calculated by removing unrealized gains from unassigned surplus. As of December 31, 2016, CCC is in a positive earned surplus position. The maximum allowable dividend CCC could pay during 2017 that would not be subject to the Department’s prior approval is $1.1 billion, less dividends paid during the preceding 12 months measured at that point in time. CCC paid dividends of $765 million in 2016. The actual level of dividends paid in any year is determined after an assessment of available dividend capacity, holding company liquidity and cash needs as well as the impact the dividends will have on the statutory surplus of the applicable insurance company. Diamond Offshore’s cash provided by operating activities decreased approximately $90 million in 2016 as compared with 2015, primarily due to lower cash receipts from contract drilling services of $705 million, partially offset by a $585 million net decrease in cash payments for contract drilling and general and administrative expenses, including personnel-related, maintenance and other rig operating costs and lower income taxes paid, net of refunds of $30 million. The decline in cash receipts and cash payments related to contract drilling services both reflect an aggregate decline in contract drilling operations, as well as a lower cost structure and the favorable impact of cost control initiatives. For 2017, Diamond Offshore has budgeted approximately $135 million for capital expenditures. In 2016, Diamond Offshore completed four sale and leaseback transactions and received $210 million in proceeds, which was less than the carrying value of the equipment. The resulting difference was recorded as prepaid rent with no gain or loss recognized on the transactions. For further information about these transactions, see Note 6 of the Notes to Consolidated Financial Statements included under Item 8. As of December 31, 2016, Diamond Offshore had $104 million in borrowings outstanding under its credit agreement and was in compliance with all covenant requirements thereunder. As of February 10, 2017, Diamond Offshore had no outstanding borrowings and $1.5 billion available under its credit agreement to provide short term liquidity for payment obligations. In November of 2016, S&P downgraded Diamond Offshore’s corporate credit rating to BB+ from BBB, and, in January of 2017, further downgraded its corporate credit rating to BB-, with a negative outlook. Diamond Offshore’s current corporate credit rating by Moody’s is Ba2 with a stable outlook. Market conditions and other factors, many of which are outside of Diamond Offshore’s control, could cause its credit ratings to be lowered further. A downgrade in Diamond Offshore’s credit ratings could adversely impact its cost of issuing additional debt and the amount of additional debt that it could issue, and could further restrict its access to capital markets and its ability to raise additional debt. As a consequence, Diamond Offshore may not be able to issue additional debt in amounts and/or with terms that it considers to be reasonable. One or more of these occurrences could limit Diamond Offshore’s ability to pursue other business opportunities. Diamond Offshore will make periodic assessments of its capital spending programs based on industry conditions and will make adjustments if it determines they are required. Diamond Offshore, may, from time to time, issue debt or equity securities, or a combination thereof, to finance capital expenditures, the acquisition of assets and businesses or for general corporate purposes. Diamond Offshore’s ability to access the capital markets by issuing debt or equity securities will be dependent on its results of operations, current financial condition, current credit ratings, current market conditions and other factors beyond its control. Boardwalk Pipeline’s cash provided by operating activities increased $24 million in 2016 compared to 2015, primarily due to increased net income, excluding the effects of non-cash items such as depreciation and amortization, partially offset by timing of accruals and the Gulf South rate refund.

68
Item 7. Management’s Discussion and Analysis of Financial Condition and Results of Operations Liquidity and Capital Resources – Subsidiaries – (Continued) In 2016 and 2015, Boardwalk Pipeline declared and paid distributions to its common unitholders of record of $0.40 per common unit and an amount to the general partner on behalf of its 2% general partner interest. In February of 2017, the Partnership declared a quarterly cash distribution to unitholders of record of $0.10 per common unit. In January of 2017, Boardwalk Pipeline completed a public offering of $500 million aggregate principal amount of 4.5% senior notes due July 15, 2027 and plans to use the proceeds to refinance future maturities of debt and to fund growth capital expenditures. Initially, the proceeds were used to reduce outstanding borrowings under its revolving credit facility. As of February 13, 2017, Boardwalk Pipeline had $65 million of outstanding borrowings and $1.4 billion of available borrowing capacity under its revolving credit facility. During 2016, Boardwalk Pipeline extended the maturity date of the revolving credit facility by one year to May 26, 2021. Boardwalk Pipeline has in place a subordinated loan agreement with a subsidiary of the Company under which it could borrow up to $300 million until December 31, 2018. Boardwalk Pipeline had no outstanding borrowings under the subordinated loan agreement. For 2016 and 2015, Boardwalk Pipeline’s capital expenditures were $590 million and $375 million, consisting of a combination of growth and maintenance capital. Boardwalk Pipeline expects total capital expenditures to be approximately $850 million in 2017, primarily related to growth projects and pipeline system maintenance expenditures. Boardwalk Pipeline anticipates that for 2017 its existing capital resources, including its revolving credit facility, subordinated loan and cash flows from operating activities, will be adequate to fund its operations. Boardwalk Pipeline may seek to access the capital markets to fund some or all capital expenditures for growth projects, acquisitions or for general business purposes. Boardwalk Pipeline’s ability to access the capital markets for equity and debt financing under reasonable terms depends on its financial condition, credit ratings and market conditions. Off-Balance Sheet Arrangements At December 31, 2016 and 2015, we did not have any off-balance sheet arrangements. Contractual Obligations Our contractual payment obligations are as follows: Payments Due by Period Less than More than December 31, 2016 Total 1 year 1-3 years 3-5 years 5 years (In millions) Debt (a) $ 15,650 $ 1,202 $ 2,751 $ 2,278 $ 9,419 Operating leases 638 72 110 107 349 Claim and claim adjustment expense reserves (b) 24,005 5,114 6,551 3,173 9,167 Future policy benefits reserves (c) 31,133 (422) (196) 499 31,252 Purchase and other obligations 893 320 138 135 300 Total (d) $ 72,319 $ 6,286 $ 9,354 $ 6,192 $ 50,487
(a) Includes estimated future interest payments. (b) Claim and claim adjustment expense reserves are not discounted and represent CNA’s estimate of the amount and timing of
the ultimate settlement and administration of gross claims based on its assessment of facts and circumstances known as of December 31, 2016. See the Insurance Reserves section of this MD&A for further information.
(c) Future policy benefits reserves are not discounted and represent CNA’s estimate of the ultimate amount and timing of the settlement of benefits based on its assessment of facts and circumstances known as of December 31, 2016. Additional information on future policy benefits reserves is included in Note 1 of the Notes to Consolidated Financial Statements included under Item 8.
(d) Does not include expected contribution of approximately $18 million to the Company’s pension and postretirement plans in 2017.

69
Item 7. Management’s Discussion and Analysis of Financial Condition and Results of Operations
Further information on our commitments, contingencies and guarantees is provided in the Notes to Consolidated Financial Statements included under Item 8. INVESTMENTS Investment activities of non-insurance subsidiaries primarily include investments in fixed income securities, including short term investments. The Parent Company portfolio also includes equity securities, including short sales and derivative instruments, and investments in limited partnerships. These types of investments generally present greater volatility, less liquidity and greater risk than fixed income investments and are included within Results of Operations – Corporate. We enter into short sales and invest in certain derivative instruments that are used for asset and liability management activities, income enhancements to our portfolio management strategy and to benefit from anticipated future movements in the underlying markets. If such movements do not occur as anticipated, then significant losses may occur. Monitoring procedures include senior management review of daily reports of existing positions and valuation fluctuations to seek to ensure that open positions are consistent with our portfolio strategy. Credit exposure associated with non-performance by counterparties to our derivative instruments is generally limited to the uncollateralized change in fair value of the derivative instruments recognized in the Consolidated Balance Sheets. We mitigate the risk of non-performance by monitoring the creditworthiness of counterparties and diversifying derivatives by using multiple counterparties. We occasionally require collateral from our derivative investment counterparties depending on the amount of the exposure and the credit rating of the counterparty. Insurance CNA maintains a large portfolio of fixed maturity and equity securities, including large amounts of corporate and government issued debt securities, residential and commercial mortgage-backed securities, and other asset-backed securities and investments in limited partnerships which pursue a variety of long and short investment strategies across a broad array of asset classes. CNA’s investment portfolio supports its obligation to pay future insurance claims and provides investment returns which are an important part of CNA’s overall profitability. Net Investment Income The significant components of CNA’s net investment income are presented in the following table: Year Ended December 31 2016 2015 2014 (In millions) Fixed maturity securities: Taxable $ 1,414 $ 1,375 $ 1,399 Tax-exempt 405 376 404 Total fixed maturity securities 1,819 1,751 1,803 Limited partnership investments 155 92 263 Other, net of investment expense 14 (3) 1 Net investment income before tax $ 1,988 $ 1,840 $ 2,067 Net investment income after tax and noncontrolling interests $ 1,280 $ 1,192 $ 1,323 Effective income yield for the fixed maturity securities portfolio, before tax 4.8% 4.7% 4.8% Effective income yield for the fixed maturity securities portfolio, after tax 3.5% 3.4% 3.5% Net investment income after tax and noncontrolling interests increased $88 million in 2016 as compared with 2015. The increase was driven by limited partnership investments, which returned 6.3% in 2016 as compared with 3.0% in the prior year. Income from fixed maturity securities increased by $40 million, after tax and noncontrolling
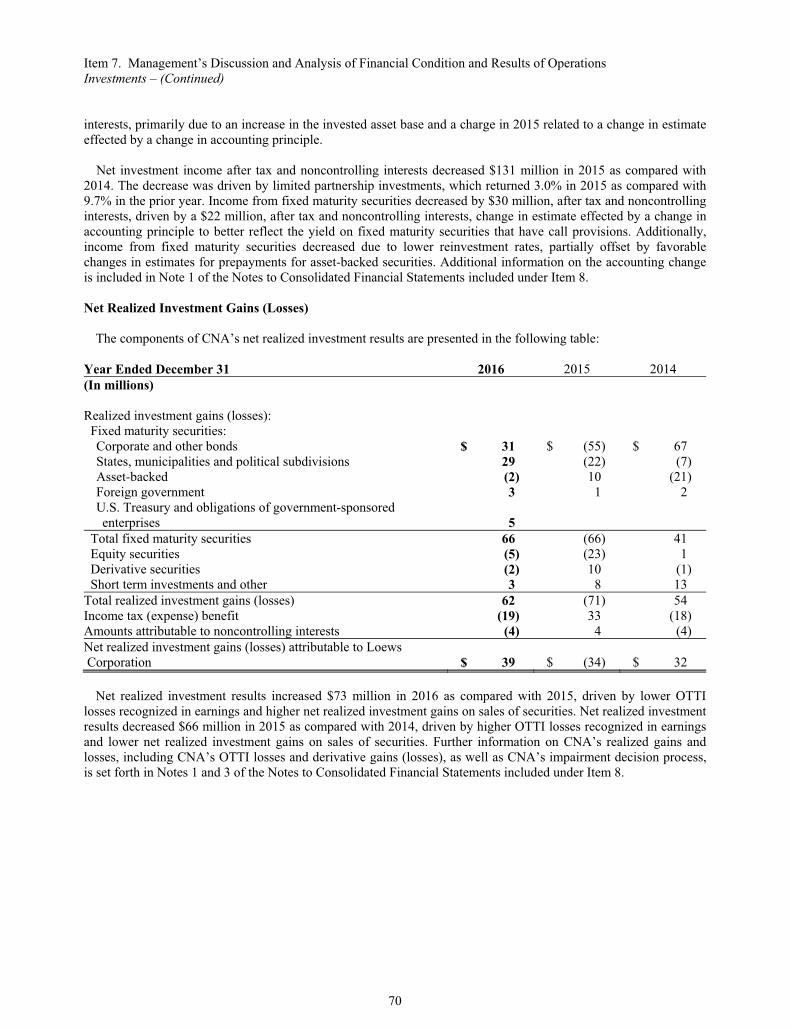
70
Item 7. Management’s Discussion and Analysis of Financial Condition and Results of Operations Investments – (Continued) interests, primarily due to an increase in the invested asset base and a charge in 2015 related to a change in estimate effected by a change in accounting principle. Net investment income after tax and noncontrolling interests decreased $131 million in 2015 as compared with 2014. The decrease was driven by limited partnership investments, which returned 3.0% in 2015 as compared with 9.7% in the prior year. Income from fixed maturity securities decreased by $30 million, after tax and noncontrolling interests, driven by a $22 million, after tax and noncontrolling interests, change in estimate effected by a change in accounting principle to better reflect the yield on fixed maturity securities that have call provisions. Additionally, income from fixed maturity securities decreased due to lower reinvestment rates, partially offset by favorable changes in estimates for prepayments for asset-backed securities. Additional information on the accounting change is included in Note 1 of the Notes to Consolidated Financial Statements included under Item 8. Net Realized Investment Gains (Losses) The components of CNA’s net realized investment results are presented in the following table: Year Ended December 31 2016 2015 2014 (In millions) Realized investment gains (losses): Fixed maturity securities: Corporate and other bonds $ 31 $ (55) $ 67 States, municipalities and political subdivisions 29 (22) (7) Asset-backed (2) 10 (21) Foreign government 3 1 2 U.S. Treasury and obligations of government-sponsored enterprises 5 Total fixed maturity securities 66 (66) 41 Equity securities (5) (23) 1 Derivative securities (2) 10 (1) Short term investments and other 3 8 13 Total realized investment gains (losses) 62 (71) 54 Income tax (expense) benefit (19) 33 (18) Amounts attributable to noncontrolling interests (4) 4 (4) Net realized investment gains (losses) attributable to Loews Corporation $ 39 $ (34) $ 32 Net realized investment results increased $73 million in 2016 as compared with 2015, driven by lower OTTI losses recognized in earnings and higher net realized investment gains on sales of securities. Net realized investment results decreased $66 million in 2015 as compared with 2014, driven by higher OTTI losses recognized in earnings and lower net realized investment gains on sales of securities. Further information on CNA’s realized gains and losses, including CNA’s OTTI losses and derivative gains (losses), as well as CNA’s impairment decision process, is set forth in Notes 1 and 3 of the Notes to Consolidated Financial Statements included under Item 8.

71
Item 7. Management’s Discussion and Analysis of Financial Condition and Results of OperationsInvestments – (Continued)
Portfolio Quality The following table presents the estimated fair value and net unrealized gains (losses) of CNA’s fixed maturity securities by rating distribution: December 31, 2016 December 31, 2015 Net Net Unrealized Unrealized Estimated Gains Estimated Gains Fair Value (Losses) Fair Value (Losses) (In millions) U.S. Government, Government agencies and Government-sponsored enterprises $ 4,212 $ 32 $ 3,910 $ 101 AAA 1,881 110 1,938 123 AA 8,911 750 8,919 900 A 9,866 832 10,044 904 BBB 12,802 664 11,595 307 Non-investment grade 3,233 156 3,166 (16) Total $ 40,905 $ 2,544 $ 39,572 $ 2,319 As of December 31, 2016 and 2015, only 2% and 1% of CNA’s fixed maturity portfolio was rated internally. The following table presents CNA’s available-for-sale fixed maturity securities in a gross unrealized loss position by ratings distribution: Gross Estimated Unrealized December 31, 2016 Fair Value Losses (In millions) U.S. Government, Government agencies and Government-sponsored enterprises $ 2,033 $ 44 AAA 363 9 AA 744 20 A 851 22 BBB 2,791 74 Non-investment grade 766 23 Total $ 7,548 $ 192 The following table presents the maturity profile for these available-for-sale fixed maturity securities. Securities not due to mature on a single date are allocated based on weighted average life: Gross Estimated Unrealized December 31, 2016 Fair Value Losses (In millions) Due in one year or less $ 125 $ 2 Due after one year through five years 909 12 Due after five years through ten years 4,775 109 Due after ten years 1,739 69 Total $ 7,548 $ 192

72
Item 7. Management’s Discussion and Analysis of Financial Condition and Results of Operations Investments – (Continued) Duration A primary objective in the management of CNA’s investment portfolio is to optimize return relative to corresponding liabilities and respective liquidity needs. CNA’s views on the current interest rate environment, tax regulations, asset class valuations, specific security issuer and broader industry segment conditions and domestic and global economic conditions, are some of the factors that enter into an investment decision. CNA also continually monitors exposure to issuers of securities held and broader industry sector exposures and may from time to time adjust such exposures based on its views of a specific issuer or industry sector. A further consideration in the management of CNA’s investment portfolio is the characteristics of the corresponding liabilities and the ability to align the duration of the portfolio to those liabilities and to meet future liquidity needs, minimize interest rate risk and maintain a level of income sufficient to support the underlying insurance liabilities. For portfolios where future liability cash flows are determinable and typically long term in nature, CNA segregates investments for asset/liability management purposes. The segregated investments support the long term care and structured settlement liabilities in non-core operations. The effective durations of CNA’s fixed maturity securities and short term investments are presented in the following table. Amounts presented are net of payable and receivable amounts for securities purchased and sold, but not yet settled. December 31, 2016 December 31, 2015 Effective Effective Estimated Duration Estimated Duration Fair Value (In Years) Fair Value (In Years) (In millions of dollars) Investments supporting non-core operations $ 15,724 8.7 $ 14,879 9.6 Other interest sensitive investments 26,669 4.6 26,435 4.3 Total $ 42,393 6.1 $ 41,314 6.2 The duration of the total fixed income portfolio is in line with portfolio targets. The duration of the assets supporting the non-core operations has declined, reflective of increases in expected bond call activity in CNA’s municipal bond portfolio and the low interest rate environment. The investment portfolio is periodically analyzed for changes in duration and related price risk. Additionally, CNA periodically reviews the sensitivity of the portfolio to the level of foreign exchange rates and other factors that contribute to market price changes. A summary of these risks and specific analysis on changes is in Quantitative and Qualitative Disclosures about Market Risk included under Item 7A. Short Term Investments The carrying value of the components of CNA’s Short term investments are presented in the following table: December 31 2016 2015 (In millions) Short term investments: Commercial paper $ 733 $ 998 U.S. Treasury securities 433 411 Money market funds 44 60 Other 197 191 Total short term investments $ 1,407 $ 1,660

73
Item 7. Management’s Discussion and Analysis of Financial Condition and Results of Operations
INSURANCE RESERVES The level of reserves CNA maintains represents its best estimate, as of a particular point in time, of what the ultimate settlement and administration of claims will cost based on CNA’s assessment of facts and circumstances known at that time. Reserves are not an exact calculation of liability but instead are complex estimates that CNA derives, generally utilizing a variety of actuarial reserve estimation techniques, from numerous assumptions and expectations about future events, both internal and external, many of which are highly uncertain. As noted below, CNA reviews its reserves for each segment of its business periodically, and any such review could result in the need to increase reserves in amounts which could be material and could adversely affect our results of operations and equity and CNA’s business and insurer financial strength and corporate debt ratings. Further information on reserves is provided in Note 8 of the Notes to Consolidated Financial Statements included under Item 8. Property and Casualty Claim and Claim Adjustment Expense Reserves CNA maintains loss reserves to cover its estimated ultimate unpaid liability for claim and claim adjustment expenses, including the estimated cost of the claims adjudication process, for claims that have been reported but not yet settled (case reserves) and claims that have been incurred but not reported (“IBNR”). IBNR includes a provision for development on known cases as well as a provision for late reported incurred claims. Claim and claim adjustment expense reserves are reflected as liabilities and are included on the Consolidated Balance Sheets under the heading “Insurance Reserves.” Adjustments to prior year reserve estimates, if necessary, are reflected in results of operations in the period that the need for such adjustments is determined. The carried case and IBNR reserves as of each balance sheet date are provided in the discussion that follows and in Note 8 of the Notes to Consolidated Financial Statements included under Item 8. There is a risk that CNA’s recorded reserves are insufficient to cover its estimated ultimate unpaid liability for claims and claim adjustment expenses. Unforeseen emerging or potential claims and coverage issues are difficult to predict and could materially adversely affect the adequacy of CNA’s claim and claim adjustment expense reserves and could lead to future reserve additions. In addition, CNA’s property and casualty insurance subsidiaries also have actual and potential exposures related to A&EP claims, which could result in material losses. To mitigate the risks posed by CNA’s exposure to A&EP claims and claim adjustment expenses, CNA completed a transaction with National Indemnity Company (“NICO”), under which substantially all of CNA’s legacy A&EP liabilities were ceded to NICO effective January 1, 2010. See Note 8 of the Notes to the Consolidated Financial Statements included under Item 8 for further discussion about the transaction with NICO, its impact on CNA’s results of operations and the deferred retroactive reinsurance gain. Establishing Property & Casualty Reserve Estimates In developing claim and claim adjustment expense (“loss” or “losses”) reserve estimates, CNA’s actuaries perform detailed reserve analyses that are staggered throughout the year. The data is organized at a reserve group level. A reserve group can be a line of business covering a subset of insureds such as commercial automobile liability for small or middle market customers, it can encompass several lines of business provided to a specific set of customers such as dentists, or it can be a particular type of claim such as construction defect. Every reserve group is reviewed at least once during the year. The analyses generally review losses gross of ceded reinsurance and apply the ceded reinsurance terms to the gross estimates to establish estimates net of reinsurance. In addition to the detailed analyses, CNA reviews actual loss emergence for all products each quarter. Most of CNA’s business can be characterized as long-tail. For long-tail business, it will generally be several years between the time the business is written and the time when all claims are settled. CNA’s long-tail exposures include commercial automobile liability, workers’ compensation, general liability, medical professional liability, other professional liability and management liability coverages, assumed reinsurance run-off and products liability. Short-tail exposures include property, commercial automobile physical damage, marine, surety and warranty. Property and casualty operations contain both long-tail and short-tail exposures. Non-core operations contain long-tail exposures. Various methods are used to project ultimate losses for both long-tail and short-tail exposures.

74
Item 7. Management’s Discussion and Analysis of Financial Condition and Results of Operations Insurance Reserves – (Continued) The paid development method estimates ultimate losses by reviewing paid loss patterns and applying them to accident or policy years with further expected changes in paid losses. Selection of the paid loss pattern may require consideration of several factors including the impact of inflation on claims costs, the rate at which claims professionals make claim payments and close claims, the impact of judicial decisions, the impact of underwriting changes, the impact of large claim payments and other factors. Claim cost inflation itself may require evaluation of changes in the cost of repairing or replacing property, changes in the cost of medical care, changes in the cost of wage replacement, judicial decisions, legislative changes and other factors. Because this method assumes that losses are paid at a consistent rate, changes in any of these factors can impact the results. Since the method does not rely on case reserves, it is not directly influenced by changes in their adequacy. For many reserve groups, paid loss data for recent periods may be too immature or erratic for accurate predictions. This situation often exists for long-tail exposures. In addition, changes in the factors described above may result in inconsistent payment patterns. Finally, estimating the paid loss pattern subsequent to the most mature point available in the data analyzed often involves considerable uncertainty for long-tail products such as workers’ compensation. The incurred development method is similar to the paid development method, but it uses case incurred losses instead of paid losses. Since the method uses more data (case reserves in addition to paid losses) than the paid development method, the incurred development patterns may be less variable than paid patterns. However, selection of the incurred loss pattern typically requires analysis of all of the same factors described above. In addition, the inclusion of case reserves can lead to distortions if changes in case reserving practices have taken place, and the use of case incurred losses may not eliminate the issues associated with estimating the incurred loss pattern subsequent to the most mature point available. The loss ratio method multiplies earned premiums by an expected loss ratio to produce ultimate loss estimates for each accident or policy year. This method may be useful for immature accident or policy periods or if loss development patterns are inconsistent, losses emerge very slowly, or there is relatively little loss history from which to estimate future losses. The selection of the expected loss ratio typically requires analysis of loss ratios from earlier accident or policy years or pricing studies and analysis of inflationary trends, frequency trends, rate changes, underwriting changes and other applicable factors. The Bornhuetter-Ferguson method using paid loss is a combination of the paid development method and the loss ratio method. This method normally determines expected loss ratios similar to the approach used to estimate the expected loss ratio for the loss ratio method and typically requires analysis of the same factors described above. This method assumes that future losses will develop at the expected loss ratio level. The percent of paid loss to ultimate loss implied from the paid development method is used to determine what percentage of ultimate loss is yet to be paid. The use of the pattern from the paid development method typically requires consideration of the same factors listed in the description of the paid development method. The estimate of losses yet to be paid is added to current paid losses to estimate the ultimate loss for each year. For long-tail lines, this method will react very slowly if actual ultimate loss ratios are different from expectations due to changes not accounted for by the expected loss ratio calculation. The Bornhuetter-Ferguson method using incurred loss is similar to the Bornhuetter-Ferguson method using paid loss except that it uses case incurred losses. The use of case incurred losses instead of paid losses can result in development patterns that are less variable than paid patterns. However, the inclusion of case reserves can lead to distortions if changes in case reserving have taken place, and the method typically requires analysis of the same factors that need to be reviewed for the loss ratio and incurred development methods. The frequency times severity method multiplies a projected number of ultimate claims by an estimated ultimate average loss for each accident or policy year to produce ultimate loss estimates. Since projections of the ultimate number of claims are often less variable than projections of ultimate loss, this method can provide more reliable results for reserve groups where loss development patterns are inconsistent or too variable to be relied on exclusively. In addition, this method can more directly account for changes in coverage that impact the number and size of claims. However, this method can be difficult to apply to situations where very large claims or a substantial number of unusual claims result in volatile average claim sizes. Projecting the ultimate number of claims may require analysis of several factors, including the rate at which policyholders report claims to CNA, the impact of judicial decisions, the impact of underwriting changes and other factors. Estimating the ultimate average loss may

75
Item 7. Management’s Discussion and Analysis of Financial Condition and Results of OperationsInsurance Reserves – (Continued)
require analysis of the impact of large losses and claim cost trends based on changes in the cost of repairing or replacing property, changes in the cost of medical care, changes in the cost of wage replacement, judicial decisions, legislative changes and other factors. Stochastic modeling produces a range of possible outcomes based on varying assumptions related to the particular reserve group being modeled. For some reserve groups, CNA uses models which rely on historical development patterns at an aggregate level, while other reserve groups are modeled using individual claim variability assumptions supplied by the claims department. In either case, multiple simulations using varying assumptions are run and the results are analyzed to produce a range of potential outcomes. The results will typically include a mean and percentiles of the possible reserve distribution which aid in the selection of a point estimate. For many exposures, especially those that can be considered long-tail, a particular accident or policy year may not have a sufficient volume of paid losses to produce a statistically reliable estimate of ultimate losses. In such a case, CNA’s actuaries typically assign more weight to the incurred development method than to the paid development method. As claims continue to settle and the volume of paid loss increases, the actuaries may assign additional weight to the paid development method. For most of CNA’s products, even the incurred losses for accident or policy years that are early in the claim settlement process will not be of sufficient volume to produce a reliable estimate of ultimate losses. In these cases, CNA may not assign any weight to the paid and incurred development methods. CNA will use the loss ratio, Bornhuetter-Ferguson and frequency times severity methods. For short-tail exposures, the paid and incurred development methods can often be relied on sooner primarily because CNA’s history includes a sufficient number of years to cover the entire period over which paid and incurred losses are expected to change. However, CNA may also use the loss ratio, Bornhuetter-Ferguson and frequency times severity methods for short-tail exposures. For other more complex reserve groups where the above methods may not produce reliable indications, CNA uses additional methods tailored to the characteristics of the specific situation. Periodic Reserve Reviews The reserve analyses performed by CNA’s actuaries result in point estimates. Each quarter, the results of the detailed reserve reviews are summarized and discussed with CNA’s senior management to determine the best estimate of reserves. CNA’s senior management considers many factors in making this decision. CNA’s recorded reserves reflect its best estimate as of a particular point in time based upon known facts and circumstances, consideration of the factors cited above and its judgment. The carried reserve may differ from the actuarial point estimate. See Note 8 of the Notes to the Consolidated Financial Statements included under Item 8 for further discussion of the factors considered in determining management’s best estimate. Currently, CNA’s recorded reserves are modestly higher than the actuarial point estimate. For the property and casualty operations, the difference between CNA’s reserves and the actuarial point estimate is primarily driven by uncertainty with respect to immature accident years, claim cost inflation, changes in claims handling, changes to the tort environment which may adversely impact claim costs and the effects from the economy. For CNA’s legacy A&EP liabilities, the difference between CNA’s reserves and the actuarial point estimate is primarily driven by the potential tail volatility of run-off exposures. The key assumptions fundamental to the reserving process are often different for various reserve groups and accident or policy years. Some of these assumptions are explicit assumptions that are required of a particular method, but most of the assumptions are implicit and cannot be precisely quantified. An example of an explicit assumption is the pattern employed in the paid development method. However, the assumed pattern is itself based on several implicit assumptions such as the impact of inflation on medical costs and the rate at which claim professionals close claims. As a result, the effect on reserve estimates of a particular change in assumptions typically cannot be specifically quantified, and changes in these assumptions cannot be tracked over time. CNA’s recorded reserves are management’s best estimate. In order to provide an indication of the variability associated with CNA’s net reserves, the following discussion provides a sensitivity analysis that shows the approximate estimated impact of variations in significant factors affecting CNA’s reserve estimates for particular types of business. These significant factors are the ones that CNA believes could most likely materially affect the

76
Item 7. Management’s Discussion and Analysis of Financial Condition and Results of Operations Insurance Reserves – (Continued) reserves. This discussion covers the major types of business for which CNA believes a material deviation to its reserves is reasonably possible. There can be no assurance that actual experience will be consistent with the current assumptions or with the variation indicated by the discussion. In addition, there can be no assurance that other factors and assumptions will not have a material impact on CNA’s reserves. The three areas for which CNA believes a significant deviation to its net reserves is reasonably possible are (i) professional liability, management liability and surety products; (ii) workers’ compensation and (iii) general liability. Professional liability, management liability and surety products include professional liability coverages provided to various professional firms, including architects, real estate agents, small and mid-sized accounting firms, law firms and other professional firms. They also include D&O, employment practices, fiduciary, fidelity and surety coverages, as well as insurance products serving the health care delivery system. The most significant factor affecting reserve estimates for these liability coverages is claim severity. Claim severity is driven by the cost of medical care, the cost of wage replacement, legal fees, judicial decisions, legislative changes and other factors. Underwriting and claim handling decisions such as the classes of business written and individual claim settlement decisions can also impact claim severity. If the estimated claim severity increases by 9%, CNA estimates that net reserves would increase by approximately $450 million. If the estimated claim severity decreases by 3%, CNA estimates that net reserves would decrease by approximately $150 million. CNA’s net reserves for these products were approximately $5.2 billion as of December 31, 2016. For workers’ compensation, since many years will pass from the time the business is written until all claim payments have been made, the most significant factor affecting workers’ compensation reserve estimate is claim cost inflation on claim payments. Workers’ compensation claim cost inflation is driven by the cost of medical care, the cost of wage replacement, expected claimant lifetimes, judicial decisions, legislative changes and other factors. If estimated workers’ compensation claim cost inflation increases by 100 basis points for the entire period over which claim payments will be made, CNA estimates that its net reserves would increase by approximately $400 million. If estimated workers’ compensation claim cost inflation decreases by 100 basis points for the entire period over which claim payments will be made, CNA estimates that its net reserves would decrease by approximately $350 million. Net reserves for workers’ compensation were approximately $4.3 billion as of December 31, 2016. For general liability, the most significant factor affecting reserve estimates is claim severity. Claim severity is driven by changes in the cost of repairing or replacing property, the cost of medical care, the cost of wage replacement, judicial decisions, legislation and other factors. If the estimated claim severity for general liability increases by 6%, CNA estimates that its net reserves would increase by approximately $200 million. If the estimated claim severity for general liability decreases by 3%, CNA estimates that its net reserves would decrease by approximately $100 million. Net reserves for general liability were approximately $3.4 billion as of December 31, 2016. Given the factors described above, it is not possible to quantify precisely the ultimate exposure represented by claims and related litigation. As a result, CNA regularly reviews the adequacy of its reserves and reassesses its reserve estimates as historical loss experience develops, additional claims are reported and settled and additional information becomes available in subsequent periods. In reviewing CNA’s reserve estimates, CNA makes adjustments in the period that the need for such adjustments is determined. These reviews have resulted in CNA’s identification of information and trends that have caused CNA to change its reserves in prior periods and could lead to CNA’s identification of a need for additional material increases or decreases in claim and claim adjustment expense reserves, which could materially affect our results of operations and equity and CNA’s business and insurer financial strength and corporate debt ratings positively or negatively. See Note 8 of the Notes to the Consolidated Financial Statements included under Item 8 for additional information about reserve development.

77
Item 7. Management’s Discussion and Analysis of Financial Condition and Results of OperationsInsurance Reserves – (Continued)
The following table summarizes gross and net carried reserves for CNA’s core property and casualty operations: December 31 2016 2015 (In millions) Gross Case Reserves $ 7,164 $ 7,608 Gross IBNR Reserves 9,207 9,191 Total Gross Carried Claim and Claim Adjustment Expense Reserves $ 16,371 $ 16,799 Net Case Reserves $ 6,582 $ 6,992 Net IBNR Reserves 8,328 8,371 Total Net Carried Claim and Claim Adjustment Expense Reserves $ 14,910 $ 15,363 The following table summarizes the gross and net carried reserves for certain non-core property and casualty businesses in run-off, including CNA Re and A&EP: December 31 2016 2015 (In millions) Gross Case Reserves $ 1,524 $ 1,521 Gross IBNR Reserves 1,090 1,123 Total Gross Carried Claim and Claim Adjustment Expense Reserves $ 2,614 $ 2,644 Net Case Reserves $ 94 $ 130 Net IBNR Reserves 136 153 Total Net Carried Claim and Claim Adjustment Expense Reserves $ 230 $ 283 Non-Core Long Term Care Policyholder Reserves CNA’s non-core operations includes its run-off long term care business as well as structured settlement obligations related to certain property and casualty claimants not funded by annuities. Long term care policies provide benefits for nursing homes, assisted living and home health care subject to various daily and lifetime caps. Policyholders must continue to make periodic premium payments to keep the policy in force. Generally, CNA has the ability to increase policy premiums, subject to state regulatory approval. CNA maintains both claim and claim adjustment expense reserves as well as future policy benefits reserves for policyholder benefits for its long term care business. Claim and claim adjustment expense reserves consist of estimated reserves for long term care policyholders that are currently receiving benefits, including claims that have been incurred but are not yet reported. In developing the claim and claim adjustment expense reserve estimates for CNA’s long term care policies, its actuaries perform a detailed claim experience study on an annual basis. The study reviews the sufficiency of existing reserves for policyholders currently on claim and includes an evaluation of expected benefit utilization and claim duration. CNA’s recorded claim and claim adjustment expense reserves reflect CNA management’s best estimate after incorporating the results of the most recent study. In addition, claim and claim adjustment expense reserves are also maintained for the structured settlement obligations. Future policy benefits reserves represent the active life reserves related to CNA’s long term care policies and are the present value of expected future benefit payments and expenses less expected future premium. The determination of these reserves is fundamental to CNA’s financial results and requires management to make estimates and assumptions about expected investment and policyholder experience over the life of the contract. Since many of these contracts may be in force for several decades, these assumptions are subject to significant estimation risk. The actuarial assumptions that management believes are subject to the most variability are morbidity, persistency, discount rate and anticipated future premium rate increases. Persistency can be affected by policy lapses and death. Discount rate is influenced by the investment yield on assets supporting long term care reserves which is subject to interest rate and market volatility and may also be impacted by changes to the corporate tax code. There is limited historical company and industry data available to CNA for long term care morbidity and mortality, as only a portion

78
Item 7. Management’s Discussion and Analysis of Financial Condition and Results of Operations Insurance Reserves – (Continued) of the policies written to date are in claims paying status. As a result of this variability, CNA’s long term care reserves may be subject to material increases if actual experience develops adversely to its expectations. Annually, management assesses the adequacy of its GAAP long term care future policy benefits reserves as well as the claim and claim adjustment expense reserves for structured settlement obligations by performing a gross premium valuation (“GPV”) to determine if there is a premium deficiency. Under the GPV, management estimates required reserves using best estimate assumptions as of the date of the assessment without provisions for adverse deviation. The GPV reserves are then compared to the recorded reserves. If the GPV reserves are greater than the existing net GAAP reserves (i.e. reserves net of any deferred acquisition costs asset), the existing net GAAP reserves are unlocked and are increased to the greater amount. Any such increase is reflected in CNA’s results of operations in the period in which the need for such adjustment is determined, and could materially adversely affect our results of operations and equity and CNA’s business and insurer financial strength and corporate debt ratings. The December 31, 2016 GPV indicated carried reserves included a margin of approximately $255 million. A summary of the changes in the GPV results is presented in the table below: (In millions) Long term care active life reserve - change in GPV December 31, 2015 margin $ - Changes in underlying morbidity assumptions (130) Changes in underlying persistency assumptions 25 Changes in underlying discount rate assumptions (45) Changes in underlying premium rate action assumptions 350 Changes in underlying expense and other assumptions 55 December 31, 2016 margin $ 255 The increase in the margin in 2016 was driven by expected rate increases from near-term future rate filings on segments of CNA’s individual long term care block of business as well as higher than expected premium rate increase achievement on rate filings related to CNA’s group long term care block. This improvement from rate actions was partially offset by minor changes in morbidity assumptions. The effects of persistency and discount rates were relatively small and largely offset one another. Additionally, in 2016, CNA’s annual experience study of long term care claim reserves resulted in a release of $30 million due to favorable severity relative to expectations. The December 31, 2015 GPV indicated a premium deficiency of $296 million resulting in the unlocking of reserves and the resetting of actuarial assumptions to best estimate assumptions at that date. The indicated premium deficiency necessitated a charge to income of $296 million. In addition to the premium deficiency, CNA’s annual experience study of claim reserves resulted in reserve strengthening of $9 million. The total impact of the premium deficiency and claim reserve strengthening was $177 million (after tax and noncontrolling interests).

79
Item 7. Management’s Discussion and Analysis of Financial Condition and Results of OperationsInsurance Reserves – (Continued)
The table below summarizes the estimated pretax impact on CNA’s results of operations from various hypothetical revisions to CNA’s active life reserve assumptions. CNA has assumed that revisions to such assumptions would occur in each policy type, age and duration within each policy group and would occur absent any changes, mitigating or otherwise, in the other assumptions. Although such hypothetical revisions are not currently required or anticipated, CNA believes they could occur based on past variances in experience and its expectations of the ranges of future experience that could reasonably occur. Any required increase in the net GAAP reserves resulting from the hypothetical revision in the table below would first reduce the margin in CNA’s carried reserves before it would affect results of operations. The estimated impacts to results of operations in the table below are after consideration of the existing margin. Estimated Reduction December 31, 2016 to Pretax Income (In millions) Hypothetical revisions Morbidity: 5% increase in morbidity $ 372 10% increase in morbidity 999 Persistency: 5% decrease in active life mortality and lapse - 10% decrease in active life mortality and lapse 163 Discount rates: 50 basis point decline in future interest rates 156 100 basis point decline in future interest rates 664 Premium rate actions: 25% decrease in anticipated future rate increases premium - 50% decrease in anticipated future rate increases premium 142 Modification of the corporate tax rate could adversely affect the value of the tax benefit received on tax exempt municipal investments and thus the rate at which CNA discounts its long term care active life reserves. For illustrative reference, absent a change in investment strategy, a reduction in the corporate tax rate to 20% would require an increase to CNA’s existing net GAAP reserves for the long term care business and an estimated reduction to pretax income of approximately $700 million. Any actual adjustment would be dependent on the specific policies affected and, therefore, may differ from the estimates summarized above.

80
Item 7. Management’s Discussion and Analysis of Financial Condition and Results of Operations Insurance Reserves – (Continued) The following table summarizes policyholder reserves for CNA’s non-core long term care operations: Claim and claim adjustment Future December 31, 2016 expenses policy benefits Total (In millions) Long term care $ 2,426 $ 8,654 $ 11,080 Structured settlement annuities 565 565 Other 17 17 Total 3,008 8,654 11,662 Shadow adjustments (a) 101 1,459 1,560 Ceded reserves (b) 249 213 462 Total gross reserves $ 3,358 $ 10,326 $ 13,684 December 31, 2015 Long term care $ 2,229 $ 8,335 $ 10,564 Structured settlement annuities 581 581 Other 21 21 Total 2,831 8,335 11,166 Shadow adjustments (a) 99 1,610 1,709 Ceded reserves (b) 290 207 497 Total gross reserves $ 3,220 $ 10,152 $ 13,372 (a) To the extent that unrealized gains on fixed income securities supporting long term care products and annuity contracts would result
in a premium deficiency if those gains were realized an increase in Insurance reserves is recorded, after tax and noncontrolling interests, as a reduction of net unrealized gains through Other comprehensive income (“Shadow Adjustments”).
(b) Ceded reserves relate to claim or policy reserves fully reinsured in connection with a sale or exit from the underlying business. CRITICAL ACCOUNTING ESTIMATES The preparation of the Consolidated Financial Statements in conformity with accounting principles generally accepted in the United States of America (“GAAP”) requires us to make estimates and assumptions that affect the amounts reported in the Consolidated Financial Statements and the related notes. Actual results could differ from those estimates. The Consolidated Financial Statements and accompanying notes have been prepared in accordance with GAAP, applied on a consistent basis. We continually evaluate the accounting policies and estimates used to prepare the Consolidated Financial Statements. In general, our estimates are based on historical experience, evaluation of current trends, information from third party professionals and various other assumptions that we believe are reasonable under the known facts and circumstances. We consider the accounting policies discussed below to be critical to an understanding of our Consolidated Financial Statements as their application places the most significant demands on our judgment. Due to the inherent uncertainties involved with these types of judgments, actual results could differ significantly from estimates, which may have a material adverse impact on our results of operations and/or equity and CNA’s insurer financial strength and corporate debt ratings. Insurance Reserves Insurance reserves are established for both short and long-duration insurance contracts. Short-duration contracts are primarily related to property and casualty insurance policies where the reserving process is based on actuarial estimates of the amount of loss, including amounts for known and unknown claims. Long-duration contracts are primarily related to long term care policies and are estimated using actuarial estimates about morbidity and persistency as well as assumptions about expected investment returns and future premium rate increases. The reserve for unearned premiums on property and casualty contracts represents the portion of premiums written related

81
Item 7. Management’s Discussion and Analysis of Financial Condition and Results of OperationsCritical Accounting Estimates – (Continued)
to the unexpired terms of coverage. The reserving process is discussed in further detail in the Insurance Reserves section of this MD&A. Reinsurance and Other Receivables Exposure exists with respect to the collectibility of ceded property and casualty and life reinsurance to the extent that any reinsurer is unable to meet its obligations or disputes the liabilities CNA has ceded under reinsurance agreements. An allowance for doubtful accounts on reinsurance receivables is recorded on the basis of periodic evaluations of balances due from reinsurers, reinsurer solvency, CNA’s past experience and current economic conditions. Further information on CNA’s reinsurance receivables is included in Note 15 of the Notes to Consolidated Financial Statements included under Item 8. Additionally, exposure exists with respect to the collectibility of amounts due from customers on other receivables. An allowance for doubtful accounts is recorded on the basis of periodic evaluations of balances due, currently as well as in the future, management’s experience and current economic conditions. If actual experience differs from the estimates made by management in determining the allowances for doubtful accounts on reinsurance and other receivables, net receivables as reflected on our Consolidated Balance Sheets may not be collected. Therefore, our results of operations and/or equity could be materially adversely affected. Valuation of Investments and Impairment of Securities We classify fixed maturity securities and equity securities as either available-for-sale or trading which are both carried at fair value on the balance sheet. Fair value represents the price that would be received in a sale of an asset in an orderly transaction between market participants on the measurement date, the determination of which requires us to make a significant number of assumptions and judgments. Securities with the greatest level of subjectivity around valuation are those that rely on inputs that are significant to the estimated fair value and that are not observable in the market or cannot be derived principally from or corroborated by observable market data. These unobservable inputs are based on assumptions consistent with what we believe other market participants would use to price such securities. Further information on fair value measurements is included in Note 4 of the Notes to Consolidated Financial Statements included under Item 8. CNA’s investment portfolio is subject to market declines below amortized cost that may be other-than-temporary and therefore result in the recognition of impairment losses in earnings. Factors considered in the determination of whether or not a decline is other-than-temporary include a current intention or need to sell the security or an indication that a credit loss exists. Significant judgment exists regarding the evaluation of the financial condition and expected near-term and long term prospects of the issuer, the relevant industry conditions and trends, and whether CNA expects to receive cash flows sufficient to recover the entire amortized cost basis of the security. Further information on CNA’s process for evaluating impairments is included in Note 1 of the Notes to Consolidated Financial Statements included under Item 8. Long Term Care Policies Future policy benefits reserves for CNA’s long term care policies are based on certain assumptions including morbidity, persistency, discount rates and future premium rate increases. The adequacy of the reserves is contingent upon actual experience and CNA’s future expectations related to these key assumptions. If actual or CNA’s expected future experience differs from these assumptions, the reserves may not be adequate, requiring CNA to add to reserves. A prolonged period during which interest rates remain at levels lower than those anticipated in CNA’s reserving discount rate assumption could result in shortfalls in investment income on assets supporting CNA’s obligations under long term care policies, which may also require an increase to CNA’s reserves. In addition, CNA may not receive regulatory approval for the premium rate increases it requests. These changes to CNA’s reserves could materially adversely impact our results of operations and equity. The reserving process is discussed in further detail in the Insurance Reserves section of this MD&A.

82
Item 7. Management’s Discussion and Analysis of Financial Condition and Results of Operations Critical Accounting Estimates – (Continued) Pension and Postretirement Benefit Obligations We make a significant number of assumptions in order to estimate the liabilities and costs related to our pension and postretirement benefit obligations. The assumptions that have the most impact on pension costs are the discount rate and the expected long term rate of return on plan assets. These assumptions are based on, among other things, current economic factors such as inflation, interest rates and broader capital market expectations. Changes in these assumptions can have a material impact on pension obligations and pension expense. In determining the discount rate assumption, we utilize current market information and liability information, including a discounted cash flow analysis of our pension and postretirement obligations. In particular, the basis for our discount rate selection was the yield on indices of highly rated fixed income debt securities with durations comparable to that of our plan liabilities. The yield curve was applied to expected future retirement plan payments to adjust the discount rate to reflect the cash flow characteristics of the plans. The yield curves and indices evaluated in the selection of the discount rate are comprised of high quality corporate bonds that are rated AA by an accepted rating agency. In determining the expected long term rate of return on plan assets assumption, we consider the historical performance of the investment portfolio as well as the long term market return expectations based on the investment mix of the portfolio and the expected investment horizon. Further information on our pension and postretirement benefit obligations is in Note 14 of the Notes to Consolidated Financial Statements included under Item 8. Impairment of Long-Lived Assets We review our long-lived assets for impairment when changes in circumstances indicate that the carrying amount of an asset may not be recoverable. We use a probability-weighted cash flow analysis to test property and equipment for impairment based on relevant market data. If an asset is determined to be impaired, a loss is recognized to reduce the carrying amount to the fair value of the asset. Management’s cash flow assumptions are an inherent part of our asset impairment evaluation and the use of different assumptions could produce results that differ from the reported amounts. Income Taxes Deferred income taxes are recognized for temporary differences between the financial statement and tax return bases of assets and liabilities. Any resulting future tax benefits are recognized to the extent that realization of such benefits is more likely than not, and a valuation allowance is established for any portion of a deferred tax asset that management believes may not be realized. The assessment of the need for a valuation allowance requires management to make estimates and assumptions about future earnings, reversal of existing temporary differences and available tax planning strategies. If actual experience differs from these estimates and assumptions, the recorded deferred tax asset may not be fully realized, resulting in an increase to income tax expense in our results of operations. In addition, the ability to record deferred tax assets in the future could be limited resulting in a higher effective tax rate in that future period. We have not established deferred tax liabilities for certain of our foreign earnings as we intend to indefinitely reinvest those earnings to finance foreign activities. However, if these earnings become subject to U.S. federal tax, any required provision could have a material impact on our financial results. ACCOUNTING STANDARDS UPDATE For a discussion of accounting standards updates that have been adopted or will be adopted in the future, please read Note 1 of the Notes to Consolidated Financial Statements included under Item 8.

83
Item 7. Management’s Discussion and Analysis of Financial Condition and Results of Operations
FORWARD-LOOKING STATEMENTS Investors are cautioned that certain statements contained in this Report as well as some statements in other SEC filings and periodic press releases and some oral statements made by us and our subsidiaries and our and their officials during presentations may constitute “forward-looking statements” within the meaning of the Private Securities Litigation Reform Act of 1995 (the “Act”). Forward-looking statements include, without limitation, any statement that does not directly relate to any historical or current fact and may project, indicate or imply future results, events, performance or achievements. Such statements may contain the words “expect,” “intend,” “plan,” “anticipate,” “estimate,” “believe,” “will be,” “will continue,” “will likely result,” and similar expressions. In addition, any statement concerning future financial performance (including future revenues, earnings or growth rates), ongoing business strategies or prospects, and possible actions taken by us or our subsidiaries are also forward-looking statements as defined by the Act. Forward-looking statements are based on current expectations and projections about future events and are inherently subject to a variety of risks and uncertainties, many of which are beyond our control, that could cause actual results to differ materially from those anticipated or projected. Developments in any of the risks or uncertainties facing us or our subsidiaries, including those described under Item 1A, Risk Factors of this Report and in our other filings with the SEC, could cause our results to differ materially from results that have been or may be anticipated or projected. Given these risks and uncertainties, investors should not place undue reliance on forward-looking statements. Forward-looking statements speak only as of the date they are made and we expressly disclaim any obligation or undertaking to update these statements to reflect any change in our expectations or beliefs or any change in events, conditions or circumstances on which any forward-looking statement is based. Item 7A. Quantitative and Qualitative Disclosures about Market Risk. We are a large diversified holding company. As such, we and our subsidiaries have significant amounts of financial instruments that involve market risk. Our measure of market risk exposure represents an estimate of the change in fair value of our financial instruments. Changes in the trading portfolio are recognized in the Consolidated Statements of Income. Market risk exposure is presented for each class of financial instrument held by us at December 31, assuming immediate adverse market movements of the magnitude described below. We believe that the various rates of adverse market movements represent a measure of exposure to loss under hypothetically assumed adverse conditions. The estimated market risk exposure represents the hypothetical loss to future earnings and does not represent the maximum possible loss nor any expected actual loss, even under adverse conditions, because actual adverse fluctuations would likely differ. In addition, since our investment portfolio is subject to change based on our portfolio management strategy as well as in response to changes in the market, these estimates are not necessarily indicative of the actual results which may occur. Exposure to market risk is managed and monitored by senior management. Senior management approves our overall investment strategy and has responsibility to ensure that the investment positions are consistent with that strategy with an acceptable level of risk. We may manage risk by buying or selling instruments or entering into offsetting positions. Interest Rate Risk – We have exposure to interest rate risk arising from changes in the level or volatility of interest rates. We attempt to mitigate our exposure to interest rate risk by utilizing instruments such as interest rate swaps, commitments to purchase securities, options, futures and forwards. We monitor our sensitivity to interest rate changes by revaluing financial assets and liabilities using a variety of different interest rates. The Company uses duration and convexity at the security level to estimate the change in fair value that would result from a change in each security’s yield. Duration measures the price sensitivity of an asset to changes in the yield rate. Convexity measures how the duration of the asset changes with interest rates. The duration and convexity analysis takes into account the unique characteristics (e.g., call and put options and prepayment expectations) of each security, in determining the hypothetical change in fair value. The analysis is performed at the security level and is aggregated up to the asset category level. The evaluation is performed by applying an instantaneous change in the yield rates by varying magnitudes on a static balance sheet to determine the effect such a change in rates would have on the recorded market value of our investments and the resulting effect on shareholders’ equity. The analysis presents the sensitivity of the market value

84
Item 7A. Quantitative and Qualitative Disclosures about Market Risk of our financial instruments to selected changes in market rates and prices which we believe are reasonably possible over a one year period. The sensitivity analysis estimates the change in the fair value of our interest sensitive assets and liabilities that were held on December 31, 2016 and 2015 due to an instantaneous change in the yield of the security at the end of the period of 100 basis points, with all other variables held constant. The interest rates on certain types of assets and liabilities may fluctuate in advance of changes in market interest rates, while interest rates on other types may lag behind changes in market rates. Accordingly, the analysis may not be indicative of, is not intended to provide, and does not provide a precise forecast of the effect of changes of market interest rates on our earnings or shareholders’ equity. Further, the computations do not contemplate any actions we could undertake in response to changes in interest rates. Our debt is primarily denominated in U.S. Dollars and has been primarily issued at fixed rates, therefore, interest expense would not be impacted by interest rate shifts. The impact of a 100 basis point increase in interest rates on fixed rate debt would result in a decrease in market value of $544 million and $481 million at December 31, 2016 and 2015. The impact of a 100 basis point decrease would result in an increase in market value of $605 million and $519 million at December 31, 2016 and 2015. At December 31, 2016, the impact of a 100 basis point increase in interest rates on variable rate debt would increase interest expense by approximately $2 million on an annual basis. Equity Price Risk – We have exposure to equity price risk as a result of our investment in equity securities and equity derivatives. Equity price risk results from changes in the level or volatility of equity prices which affect the value of equity securities or instruments that derive their value from such securities or indexes. Equity price risk was measured assuming an instantaneous 25% decrease in the underlying reference price or index from its level at December 31, 2016 and 2015, with all other variables held constant. A model was developed to analyze the observed changes in the value of limited partnerships held by the Company over a multiple year period along with the corresponding changes in various equity indices. The result of the model allowed us to estimate the change in value of limited partnerships when equity markets decline by 25%. Foreign Exchange Rate Risk – Foreign exchange rate risk arises from the possibility that changes in foreign currency exchange rates will impact the value of financial instruments. We have foreign exchange rate exposure when we buy or sell foreign currencies or financial instruments denominated in a foreign currency, which is reduced through the use of forward contracts. At December 31, 2016, we had no foreign exchange rate risk on our investments. At December 31, 2015, our foreign transactions were primarily denominated in Japanese yen, Saudi Arabian riyals, Chinese yuan and European Monetary Unit. The sensitivity analysis assumes an instantaneous 20% decrease in the foreign currency exchange rates versus the U.S. dollar from their levels at December 31, 2015, with all other variables held constant. Commodity Price Risk – We have exposure to price risk as a result of our investments in commodities. Commodity price risk results from changes in the level or volatility of commodity prices that impact instruments which derive their value from such commodities. Commodity price risk was measured assuming an instantaneous decrease of 20% from their levels at December 31, 2016. Credit Risk – We are exposed to credit risk relating to the risk of loss resulting from the nonperformance by a customer of its contractual obligations. Although nearly all of the Company’s customers pay for its services on a timely basis, the Company actively monitors the credit exposure to its customers. Certain of the Company’s subsidiaries may perform credit reviews of customers and may require customers to provide cash collateral, post a letter of credit, prepay for services or provide other credit enhancements.

85
Item 7A. Quantitative and Qualitative Disclosures about Market Risk
The following tables present our market risk by category (equity prices, interest rates, foreign exchange rates and commodity prices) on the basis of those entered into for trading purposes and other than trading purposes. Trading portfolio: Category of risk exposure: Fair Value Asset (Liability) Market RiskDecember 31 2016 2015 2016 2015 (In millions) Equity prices (1): Equity securities – long $ 425 $ 540 $ (106) $ (135) – short (36) (166) 9 42 Options – purchased 14 15 8 40 – written (8) (28) (4) (36) Other derivatives 1 (1) 56 (78) Interest rate (2): Fixed maturities long 601 120 (1) (5) Short term investments 3,064 2,884 Other invested assets 55 102 (1) Foreign exchange (3): Forwards and options 9 (8) Note: The calculation of estimated market risk exposure is based on assumed adverse changes in the underlying reference price
or index of (1) a decrease in equity prices of 25%, (2) an increase in yield rates of 100 basis points and (3) a decrease in the foreign currency exchange rates versus the U.S. dollar of 20%.
Other than trading portfolio: Category of risk exposure: Fair Value Asset (Liability) Market RiskDecember 31 2016 2015 2016 2015 (In millions) Equity prices (1): Equity securities: General accounts (a) $ 110 $ 197 $ (28) $ (49) Limited partnership investments 3,220 3,313 (449) (478) Interest rate (2): Fixed maturities (a) 40,893 39,581 (2,571) (2,562) Short term investments (a) 1,701 1,926 (1) (2) Other invested assets, primarily mortgage loans 594 688 (30) (31) Other derivatives 3 5 13 13 Foreign exchange (3): Other invested assets 36 44 (5)
Note: The calculation of estimated market risk exposure is based on assumed adverse changes in the underlying reference price
or index of (1) a decrease in equity prices of 25%, (2) an increase in yield rates of 100 basis points and (3) a decrease in the foreign currency exchange rates versus the U.S. dollar of 20%.
(a) Certain securities are denominated in foreign currencies. An assumed 20% decline in the underlying exchange rates
would result in an aggregate foreign currency exchange rate risk of $(399) and $(383) at December 31, 2016 and 2015.
86
Item 8. Financial Statements and Supplementary Data. Financial Statements and Supplementary Data are comprised of the following sections: Page No. Management’s Report on Internal Control Over Financial Reporting 87 Reports of Independent Registered Public Accounting Firm 88 Consolidated Balance Sheets 90 Consolidated Statements of Income 92 Consolidated Statements of Comprehensive Income (Loss) 93 Consolidated Statements of Equity 94 Consolidated Statements of Cash Flows 96 Notes to Consolidated Financial Statements: 98
1. Summary of Significant Accounting Policies 98 2. Acquisitions and Divestitures 106 3. Investments 107 4. Fair Value 113 5. Receivables 121 6. Property, Plant and Equipment 121 7. Goodwill 123 8. Claim and Claim Adjustment Expense Reserves 123 9. Leases 138
10. Income Taxes 139 11. Debt 142 12. Shareholders’ Equity 145 13. Statutory Accounting Practices 146 14. Benefit Plans 148 15. Reinsurance 154 16. Quarterly Financial Data (Unaudited) 156 17. Legal Proceedings 156 18. Commitments and Contingencies 157 19. Discontinued Operations 158 20. Segments 159

87
MANAGEMENT’S REPORT ON INTERNAL CONTROL OVER FINANCIAL REPORTING Our management is responsible for establishing and maintaining adequate internal control over financial reporting (as defined in Exchange Act Rules 13a-15(f) and 15d-15(f)) for us. Our internal control system was designed to provide reasonable assurance to our management and Board of Directors regarding the preparation and fair presentation of published financial statements. There are inherent limitations to the effectiveness of any control system, however well designed, including the possibility of human error and the possible circumvention or overriding of controls. Further, the design of a control system must reflect the fact that there are resource constraints, and the benefits of controls must be considered relative to their costs. Management must make judgments with respect to the relative cost and expected benefits of any specific control measure. The design of a control system also is based in part upon assumptions and judgments made by management about the likelihood of future events, and there can be no assurance that a control will be effective under all potential future conditions. As a result, even an effective system of internal control over financial reporting can provide no more than reasonable assurance with respect to the fair presentation of financial statements and the processes under which they were prepared. Our management assessed the effectiveness of our internal control over financial reporting as of December 31, 2016. In making this assessment, management used the criteria set forth by the Committee of Sponsoring Organizations of the Treadway Commission in Internal Control – Integrated Framework (2013). Based on this assessment, our management believes that, as of December 31, 2016, our internal control over financial reporting was effective. Our independent registered public accounting firm, Deloitte & Touche LLP, has issued an audit report on the Company’s internal control over financial reporting. The report of Deloitte & Touche LLP follows this Report.

88
REPORT OF INDEPENDENT REGISTERED PUBLIC ACCOUNTING FIRM To the Board of Directors and Shareholders of Loews Corporation New York, NY We have audited the internal control over financial reporting of Loews Corporation and subsidiaries (the “Company”) as of December 31, 2016, based on criteria established in Internal Control – Integrated Framework (2013) issued by the Committee of Sponsoring Organizations of the Treadway Commission. The Company’s management is responsible for maintaining effective internal control over financial reporting and for its assessment of the effectiveness of internal control over financial reporting, included in the accompanying management’s report on internal control over financial reporting. Our responsibility is to express an opinion on the Company’s internal control over financial reporting based on our audit. We conducted our audit in accordance with the standards of the Public Company Accounting Oversight Board (United States). Those standards require that we plan and perform the audit to obtain reasonable assurance about whether effective internal control over financial reporting was maintained in all material respects. Our audit included obtaining an understanding of internal control over financial reporting, assessing the risk that a material weakness exists, testing and evaluating the design and operating effectiveness of internal control based on the assessed risk, and performing such other procedures as we considered necessary in the circumstances. We believe that our audit provides a reasonable basis for our opinion. A company’s internal control over financial reporting is a process designed by, or under the supervision of, the company’s principal executive and principal financial officers, or persons performing similar functions, and effected by the company’s board of directors, management, and other personnel to provide reasonable assurance regarding the reliability of financial reporting and the preparation of financial statements for external purposes in accordance with generally accepted accounting principles. A company’s internal control over financial reporting includes those policies and procedures that (1) pertain to the maintenance of records that, in reasonable detail, accurately and fairly reflect the transactions and dispositions of the assets of the company; (2) provide reasonable assurance that transactions are recorded as necessary to permit preparation of financial statements in accordance with generally accepted accounting principles, and that receipts and expenditures of the company are being made only in accordance with authorizations of management and directors of the company; and (3) provide reasonable assurance regarding prevention or timely detection of unauthorized acquisition, use, or disposition of the company’s assets that could have a material effect on the financial statements. Because of the inherent limitations of internal control over financial reporting, including the possibility of collusion or improper management override of controls, material misstatements due to error or fraud may not be prevented or detected on a timely basis. Also, projections of any evaluation of the effectiveness of the internal control over financial reporting to future periods are subject to the risk that the controls may become inadequate because of changes in conditions, or that the degree of compliance with the policies or procedures may deteriorate. In our opinion, the Company maintained, in all material respects, effective internal control over financial reporting as of December 31, 2016, based on the criteria established in Internal Control – Integrated Framework (2013) issued by the Committee of Sponsoring Organizations of the Treadway Commission. We have also audited, in accordance with the standards of the Public Company Accounting Oversight Board (United States), the consolidated financial statements and financial statement schedules as of and for the year ended December 31, 2016 of the Company and our report dated February 16, 2017 expressed an unqualified opinion on those consolidated financial statements and financial statement schedules. /s/ DELOITTE & TOUCHE LLP New York, NY February 16, 2017

89
REPORT OF INDEPENDENT REGISTERED PUBLIC ACCOUNTING FIRM To the Board of Directors and Shareholders of Loews Corporation New York, NY We have audited the accompanying consolidated balance sheets of Loews Corporation and subsidiaries (the “Company”) as of December 31, 2016 and 2015, and the related consolidated statements of income, comprehensive income (loss), equity, and cash flows for each of the three years in the period ended December 31, 2016. Our audits also included the financial statement schedules listed in the Index at Item 15. These consolidated financial statements and financial statement schedules are the responsibility of the Company’s management. Our responsibility is to express an opinion on the consolidated financial statements and financial statement schedules based on our audits. We conducted our audits in accordance with the standards of the Public Company Accounting Oversight Board (United States). Those standards require that we plan and perform the audit to obtain reasonable assurance about whether the financial statements are free of material misstatement. An audit includes examining, on a test basis, evidence supporting the amounts and disclosures in the financial statements. An audit also includes assessing the accounting principles used and significant estimates made by management, as well as evaluating the overall financial statement presentation. We believe that our audits provide a reasonable basis for our opinion. In our opinion, such consolidated financial statements present fairly, in all material respects, the financial position of Loews Corporation and subsidiaries as of December 31, 2016 and 2015, and the results of their operations and their cash flows for each of the three years in the period ended December 31, 2016, in conformity with accounting principles generally accepted in the United States of America. Also, in our opinion, such financial statement schedules, when considered in relation to the basic consolidated financial statements taken as a whole, present fairly, in all material respects, the information set forth therein. We have also audited, in accordance with the standards of the Public Company Accounting Oversight Board (United States), the Company’s internal control over financial reporting as of December 31, 2016, based on the criteria established in Internal Control – Integrated Framework (2013) issued by the Committee of Sponsoring Organizations of the Treadway Commission and our report dated February 16, 2017 expressed an unqualified opinion on the Company’s internal control over financial reporting. /s/ DELOITTE & TOUCHE LLP New York, NY February 16, 2017

90
Loews Corporation and Subsidiaries CONSOLIDATED BALANCE SHEETS Assets: December 31 2016 2015 (Dollar amounts in millions, except per share data) Investments: Fixed maturities, amortized cost of $38,947 and $37,407 $ 41,494 $ 39,701 Equity securities, cost of $571 and $824 549 752 Limited partnership investments 3,220 3,313 Other invested assets, primarily mortgage loans 683 824 Short term investments 4,765 4,810 Total investments 50,711 49,400 Cash 327 440 Receivables 7,644 8,041 Property, plant and equipment 15,230 15,477 Goodwill 346 351 Other assets 1,736 1,699 Deferred acquisition costs of insurance subsidiaries 600 598 Total assets $ 76,594 $ 76,006 See Notes to Consolidated Financial Statements.

91
Loews Corporation and Subsidiaries CONSOLIDATED BALANCE SHEETS
Liabilities and Equity: December 31 2016 2015 (Dollar amounts in millions, except per share data) Insurance reserves: Claim and claim adjustment expense $ 22,343 $ 22,663 Future policy benefits 10,326 10,152 Unearned premiums 3,762 3,671 Total insurance reserves 36,431 36,486 Payable to brokers 150 567 Short term debt 110 1,040 Long term debt 10,668 9,520 Deferred income taxes 636 382 Other liabilities 5,238 5,201 Total liabilities 53,233 53,196 Commitments and contingent liabilities Shareholders’ equity: Preferred stock, $0.10 par value: Authorized – 100,000,000 shares Common stock, $0.01 par value: Authorized – 1,800,000,000 shares Issued and outstanding – 336,621,358 and 339,897,547 shares 3 3 Additional paid-in capital 3,187 3,184 Retained earnings 15,196 14,731 Accumulated other comprehensive loss (223) (357) Total shareholders’ equity 18,163 17,561 Noncontrolling interests 5,198 5,249 Total equity 23,361 22,810 Total liabilities and equity $ 76,594 $ 76,006 See Notes to Consolidated Financial Statements.

92
Loews Corporation and Subsidiaries CONSOLIDATED STATEMENTS OF INCOME Year Ended December 31 2016 2015 2014 (In millions, except per share data) Revenues: Insurance premiums $ 6,924 $ 6,921 $ 7,212 Net investment income 2,135 1,866 2,163 Investment gains (losses): Other-than-temporary impairment losses (81) (156) (77) Other net investment gains 131 85 131 Total investment gains (losses) 50 (71) 54 Contract drilling revenues 1,525 2,360 2,737 Other revenues 2,471 2,339 2,159 Total 13,105 13,415 14,325 Expenses: Insurance claims and policyholders’ benefits 5,283 5,384 5,591 Amortization of deferred acquisition costs 1,235 1,540 1,317 Contract drilling expenses 772 1,228 1,524 Other operating expenses (Note 6) 4,343 4,499 3,585 Interest 536 520 498 Total 12,169 13,171 12,515 Income before income tax 936 244 1,810 Income tax (expense) benefit (220) 43 (457) Income from continuing operations 716 287 1,353 Discontinued operations, net (391) Net income 716 287 962 Amounts attributable to noncontrolling interests (62) (27) (371) Net income attributable to Loews Corporation $ 654 $ 260 $ 591 Net income attributable to Loews Corporation: Income from continuing operations $ 654 $ 260 $ 962 Discontinued operations, net (371) Net income $ 654 $ 260 $ 591 Basic and diluted net income per common share: Income from continuing operations $ 1.93 $ 0.72 $ 2.52 Discontinued operations, net (0.97) Net income $ 1.93 $ 0.72 $ 1.55 Dividends per share $ 0.25 $ 0.25 $ 0.25 Basic weighted average number of shares outstanding 337.95 362.43 381.92 Diluted weighted average number of shares outstanding 338.31 362.69 382.55 See Notes to Consolidated Financial Statements
93
Loews Corporation and Subsidiaries CONSOLIDATED STATEMENTS OF COMPREHENSIVE INCOME (LOSS)
Year Ended December 31 2016 2015 2014 (In millions) Net income $ 716 $ 287 $ 962 Other comprehensive income (loss), after tax Changes in: Net unrealized gains (losses) on investments with other- than-temporary impairments 3 (9) 15 Net other unrealized gains (losses) on investments 257 (557) 267 Total unrealized gains (losses) on available-for-sale investments 260 (566) 282 Discontinued operations (19) Unrealized gains (losses) on cash flow hedges 2 5 (3) Pension liability 5 (18) (235) Foreign currency translation (114) (139) (94) Other comprehensive income (loss) 153 (718) (69) Comprehensive income (loss) 869 (431) 893 Amounts attributable to noncontrolling interests (81) 53 (361) Total comprehensive income (loss) attributable to Loews Corporation $ 788 $ (378) $ 532 See Notes to Consolidated Financial Statements.

Loe
ws C
orpo
ratio
n an
d Su
bsid
iari
es
CO
NSO
LID
AT
ED
ST
ATE
ME
NT
S O
F E
QU
ITY
Loew
s Cor
pora
tion
Shar
ehol
ders
Acc
umul
ated
C
omm
on
A
dditi
onal
Oth
er
Stoc
k
C
omm
on
Paid
-in
Ret
aine
d C
ompr
ehen
sive
H
eld
in
Non
cont
rolli
ng
To
tal
Stoc
k C
apita
l Ea
rnin
gs
Inco
me
(Los
s)
Trea
sury
In
tere
sts
(In
mill
ions
)
Bal
ance
, Jan
uary
1, 2
014
$
24
,906
$ 4
$
3,60
7
$ 15
,508
$
33
9 $
-
$
5,44
8 N
et in
com
e
96
2
591
37
1 O
ther
com
preh
ensi
ve lo
ss
(69)
(5
9)
(10)
D
ivid
ends
pai
d
(4
33)
(9
5)
(3
38)
Purc
hase
s of s
ubsi
diar
y st
ock
from
non
cont
rolli
ng in
tere
sts
(144
)
(9
)
(1
35)
Purc
hase
s of L
oew
s tre
asur
y st
ock
(622
)
(622
)
Ret
irem
ent o
f tre
asur
y st
ock
-
(1
36)
(4
86)
622
Is
suan
ce o
f Loe
ws c
omm
on st
ock
6
6
St
ock-
base
d co
mpe
nsat
ion
26
13
13
Oth
er
18
(3)
21
B
alan
ce, D
ecem
ber 3
1, 2
014
$
24
,650
$ 4
$
3,48
1
$ 15
,515
$
28
0 $
-
$
5,37
0 N
et in
com
e
28
7
260
27
O
ther
com
preh
ensi
ve lo
ss
(718
)
(6
38)
(80)
D
ivid
ends
pai
d
(2
55)
(90)
(1
65)
Issu
ance
of e
quity
secu
ritie
s by
subs
idia
ry
115
(2)
1
11
6 Pu
rcha
ses o
f sub
sidi
ary
stoc
k fr
om n
onco
ntro
lling
inte
rest
s
(3
1)
5
(3
6)
Purc
hase
s of L
oew
s tre
asur
y st
ock
(1,2
65)
(1
,265
)
Ret
irem
ent o
f tre
asur
y st
ock
-
(1)
(3
11)
(9
53)
1,26
5
Issu
ance
of L
oew
s com
mon
stoc
k
7
7
Stoc
k-ba
sed
com
pens
atio
n
26
23
3
Oth
er
(6)
(1
9)
(1
)
14
Bal
ance
, Dec
embe
r 31,
201
5
$
22,8
10
$
3 $
3,
184
$
14,7
31
$
(357
) $
-
$
5,24
9 Se
e No
tes t
o Co
nsol
idat
ed F
inan
cial
Sta
tem
ents
.
94

L
oew
s Cor
pora
tion
and
Subs
idia
ries
C
ON
SOL
IDA
TE
D S
TA
TEM
EN
TS
OF
EQ
UIT
Y
L
oew
s Cor
pora
tion
Shar
ehol
ders
A
ccum
ulat
ed
Com
mon
A
dditi
onal
Oth
er
Stoc
k
Com
mon
Pa
id-in
R
etai
ned
Com
preh
ensi
ve
Hel
d in
N
onco
ntro
lling
T
otal
St
ock
Cap
ital
Ear
ning
s In
com
e (L
oss)
T
reas
ury
Inte
rest
s (I
n m
illio
ns)
B
alan
ce, D
ecem
ber
31, 2
015
$
22,8
10
$
3 $
3,
184
$
14,7
31
$
(357
) $
-
$
5,24
9 N
et in
com
e
716
65
4
62
Oth
er c
ompr
ehen
sive
inco
me
15
3
13
4
19
D
ivid
ends
pai
d
(218
)
(8
4)
(134
) Pu
rcha
ses o
f sub
sidi
ary
stoc
k fr
om n
onco
ntro
lling
inte
rest
s
(9)
3
(1
2)
Purc
hase
s of L
oew
s tre
asur
y st
ock
(1
34)
(134
)
Ret
irem
ent o
f tre
asur
y st
ock
-
(3
2)
(1
02)
134
St
ock-
base
d co
mpe
nsat
ion
47
45
2
Oth
er
(4
)
(13)
(3)
12
B
alan
ce, D
ecem
ber
31, 2
016
$
23,3
61
$
3 $
3,
187
$
15,1
96
$
(223
) $
-
$
5,19
8 Se
e No
tes t
o Co
nsol
idat
ed F
inan
cial
Sta
tem
ents
.
95

96
Loews Corporation and Subsidiaries CONSOLIDATED STATEMENTS OF CASH FLOWS Year Ended December 31 2016 2015 2014 (In millions) Operating Activities: Net income $ 716 $ 287 $ 962 Adjustments to reconcile net income to net cash provided (used) by operating activities: Loss on sale of subsidiaries 451 Investment (gains) losses (50) 71 (47) Equity method investees 221 182 64 Amortization of investments (27) 17 3 Depreciation 841 955 899 Impairment of goodwill 20 Asset impairments 697 865 228 Provision for deferred income taxes 102 (225) 11 Other non-cash items 73 105 134 Changes in operating assets and liabilities, net: Receivables 24 120 738 Deferred acquisition costs (8) 311 44 Insurance reserves 237 241 (363) Other assets (71) (43) (128) Other liabilities 26 (33) 123 Trading securities (528) 674 (129) Net cash flow operating activities 2,253 3,547 2,990 Investing Activities: Purchases of fixed maturities (9,827) (8,675) (9,381) Proceeds from sales of fixed maturities 5,332 4,390 4,914 Proceeds from maturities of fixed maturities 3,219 4,095 3,983 Purchases of limited partnership investments (355) (188) (271) Proceeds from sales of limited partnership investments 327 174 167 Purchases of property, plant and equipment (1,450) (1,555) (2,753) Acquisitions (79) (157) (448) Dispositions 330 33 1,031 Change in short term investments 158 120 1,396 Other, net 158 (172) (108) Net cash flow investing activities (2,187) (1,935) (1,470)

97
Loews Corporation and Subsidiaries CONSOLIDATED STATEMENTS OF CASH FLOWS
Year Ended December 31 2016 2015 2014 (In millions) Financing Activities: Dividends paid $ (84) $ (90) $ (95) Dividends paid to noncontrolling interests (134) (165) (338) Purchases of subsidiary stock from noncontrolling interests (8) (29) (149) Purchases of Loews treasury stock (134) (1,265) (622) Issuance of Loews common stock 7 6 Proceeds from sale of subsidiary stock 114 5 Principal payments on debt (3,418) (1,929) (2,269) Issuance of debt 3,614 1,828 2,004 Other, net (2) 4 16 Net cash flow financing activities (166) (1,525) (1,442) Effect of foreign exchange rate on cash (13) (11) (8) Net change in cash (113) 76 70 Cash, beginning of year 440 364 294 Cash, end of year $ 327 $ 440 $ 364 See Notes to Consolidated Financial Statements.

98
Loews Corporation and Subsidiaries NOTES TO CONSOLIDATED FINANCIAL STATEMENTS Note 1. Summary of Significant Accounting Policies Basis of presentation Loews Corporation is a holding company. Its subsidiaries are engaged in the following lines of business: commercial property and casualty insurance (CNA Financial Corporation (“CNA”), a 90% owned subsidiary); the operation of offshore oil and gas drilling rigs (Diamond Offshore Drilling, Inc. (“Diamond Offshore”), a 53% owned subsidiary); transportation and storage of natural gas and natural gas liquids (Boardwalk Pipeline Partners, LP (“Boardwalk Pipeline”), a 51% owned subsidiary); and the operation of a chain of hotels (Loews Hotels Holding Corporation (“Loews Hotels”), a wholly owned subsidiary). Unless the context otherwise requires, the terms “Company,” “Loews” and “Registrant” as used herein mean Loews Corporation excluding its subsidiaries and the term “Net income (loss) attributable to Loews Corporation” as used herein means Net income (loss) attributable to Loews Corporation shareholders. Principles of consolidation – The Consolidated Financial Statements include all subsidiaries and intercompany accounts and transactions have been eliminated. The equity method of accounting is used for investments in associated companies in which the Company generally has an interest of 20% to 50%. Accounting estimates – The preparation of financial statements in conformity with accounting principles generally accepted in the United States of America (“GAAP”) requires management to make estimates and assumptions that affect the amounts reported in the consolidated financial statements and the related notes. Actual results could differ from those estimates. Investments – The Company classifies its fixed maturity securities and equity securities as either available-for-sale or trading, and as such, they are carried at fair value. Short term investments are carried at fair value. Changes in fair value of trading securities are reported within Net investment income on the Consolidated Statements of Income. Changes in fair value related to available-for-sale securities are reported as a component of Other comprehensive income. Losses may be recognized within the Consolidated Statements of Income when a decline in value is determined by the Company to be other-than-temporary. The cost of fixed maturity securities classified as available-for-sale is adjusted for amortization of premiums and accretion of discounts, which are included in Net investment income on the Consolidated Statements of Income. The amortization of premium and accretion of discount for fixed maturity securities takes into consideration call and maturity dates that produce the lowest yield. In 2015, the Company changed its accounting principle as previously the amortization of premiums was to maturity. This change in estimate, effected by a change in accounting principle was adopted in the fourth quarter of 2015 and decreased Net investment income and the amortized cost of fixed maturity securities by $39 million in the Consolidated Statements of Income for the year ended December 31, 2015 and the Consolidated Balance Sheet as of December 31, 2015. The decrease to Net investment income included a $22 million cumulative adjustment relating to prior periods. The total adjustment decreased basic and diluted net income per share by $0.06 for the year ended December 31, 2015. To the extent that unrealized gains on fixed income securities supporting long term care products and structured settlements not funded by annuities would result in a premium deficiency if those gains were realized, a related increase in Insurance reserves is recorded, net of tax and noncontrolling interests, as a reduction of net unrealized gains through Other comprehensive income (“Shadow Adjustments”). Shadow Adjustments decreased $87 million (after tax and noncontrolling interests) and $159 million (after tax and noncontrolling interests) for the years ended December 31, 2016 and 2015. As of December 31, 2016 and 2015, net unrealized gains on investments included in Accumulated other comprehensive income (“AOCI”) were correspondingly reduced by Shadow Adjustments of $909 million and $996 million (after tax and noncontrolling interests). For asset-backed securities included in fixed maturity securities, the Company recognizes income using an effective yield based on anticipated prepayments and the estimated economic life of the securities. When estimates of prepayments change, the effective yield is recalculated to reflect actual payments to date and anticipated future payments. The amortized cost of high credit quality fixed rate securities is adjusted to the amount that would have existed had the new effective yield been applied since the acquisition of the securities. Such adjustments are

99
Notes to Consolidated Financial StatementsNote 1. Summary of Significant Accounting Policies – (Continued)
reflected in Net investment income on the Consolidated Statements of Income. Interest income on lower rated and variable rate securities is determined using the prospective yield method. The Company’s carrying value of investments in limited partnerships is its share of the net asset value of each partnership, as determined by the general partner. Certain partnerships for which results are not available on a timely basis are reported on a lag, primarily three months or less. These investments are accounted for under the equity method and changes in net asset values are recorded within Net investment income on the Consolidated Statements of Income. Investments in derivative securities are carried at fair value with changes in fair value reported as a component of Investment gains (losses), Income (loss) from trading portfolio, or Other comprehensive income (loss), depending on their hedge designation. A derivative is typically defined as an instrument whose value is “derived” from an underlying instrument, index or rate, has a notional amount, requires little or no initial investment and can be net settled. Derivatives include, but are not limited to, the following types of investments: interest rate swaps, interest rate caps and floors, put and call options, warrants, futures, forwards, commitments to purchase securities, credit default swaps and combinations of the foregoing. Derivatives embedded within non-derivative instruments (such as call options embedded in convertible bonds) must be split from the host instrument when the embedded derivative is not clearly and closely related to the host instrument. A security is impaired if the fair value of the security is less than its cost adjusted for accretion, amortization and previously recorded other-than-temporary impairment (“OTTI”) losses, otherwise defined as an unrealized loss. When a security is impaired, the impairment is evaluated to determine whether it is temporary or other-than-temporary. Significant judgment is required in the determination of whether an OTTI loss has occurred for a security. CNA follows a consistent and systematic process for determining and recording an OTTI loss. CNA has established a committee responsible for the OTTI process referred to as the Impairment Committee. The Impairment Committee is responsible for evaluating all securities in an unrealized loss position on at least a quarterly basis. The Impairment Committee’s assessment of whether an OTTI loss has occurred incorporates both quantitative and qualitative information. Fixed maturity securities that CNA intends to sell, or it more likely than not will be required to sell before recovery of amortized cost, are considered to be other-than-temporarily impaired and the entire difference between the amortized cost basis and fair value of the security is recognized as an OTTI loss in earnings. The remaining fixed maturity securities in an unrealized loss position are evaluated to determine if a credit loss exists. The factors considered by the Impairment Committee include: (i) the financial condition and near term and long term prospects of the issuer, (ii) whether the debtor is current on interest and principal payments, (iii) credit ratings of the securities and (iv) general market conditions and industry or sector specific outlook. CNA also considers results and analysis of cash flow modeling for asset-backed securities, and when appropriate, other fixed maturity securities. The focus of the analysis for asset-backed securities is on assessing the sufficiency and quality of underlying collateral and timing of cash flows based on scenario tests. If the present value of the modeled expected cash flows equals or exceeds the amortized cost of a security, no credit loss is judged to exist and the asset-backed security is deemed to be temporarily impaired. If the present value of the expected cash flows is significantly less than amortized cost, the security is judged to be other-than-temporarily impaired for credit reasons and that shortfall, referred to as the credit component, is recognized as an OTTI loss in earnings. The difference between the adjusted amortized cost basis and fair value, referred to as the non-credit component, is recognized as OTTI in Other comprehensive income. In subsequent reporting periods, a change in intent to sell or further credit impairment on a security whose fair value has not deteriorated will cause the non-credit component originally recorded as OTTI in Other comprehensive income to be recognized as an OTTI loss in earnings. CNA performs the discounted cash flow analysis using stressed scenarios to determine future expectations regarding recoverability. Significant assumptions enter into these cash flow projections including delinquency rates, probable risk of default, loss severity upon a default, over collateralization and interest coverage triggers and credit support from lower level tranches.

100
Notes to Consolidated Financial Statements Note 1. Summary of Significant Accounting Policies – (Continued) CNA applies the same impairment model as described above for the majority of its non-redeemable preferred stock securities on the basis that these securities possess characteristics similar to debt securities and that the issuers maintain their ability to pay dividends. For all other equity securities, in determining whether the security is other-than-temporarily impaired, the Impairment Committee considers a number of factors including, but not limited to: (i) the length of time and the extent to which the fair value has been less than amortized cost, (ii) the financial condition and near term prospects of the issuer, (iii) the intent and ability of CNA to retain its investment for a period of time sufficient to allow for an anticipated recovery in value and (iv) general market conditions and industry or sector specific outlook. Joint venture investments – The Company has 20% to 50% interests in operating joint ventures related to hotel properties and had joint venture interests in the former Bluegrass Project, as discussed in Note 2, that are accounted for under the equity method. The Company’s investment in these entities was $217 million and $234 million for the years ended December 31, 2016 and 2015 and reported in Other assets on the Company’s Consolidated Balance Sheets. Equity income (loss) for these investments was $41 million, $43 million and $(62) million for the years ended December 31, 2016, 2015 and 2014 and reported in Other operating expenses on the Company’s Consolidated Statements of Income. Some of these investments are variable interest entities (“VIE”) as defined in the accounting guidance because the entities will require additional funding from each equity owner throughout the development and construction phase and are accounted for under the equity method since the Company is not the primary beneficiary. The maximum exposure to loss for the VIE investments is $337 million, consisting of the amount of the investment and debt guarantees. The following tables present summarized financial information for these joint ventures: Year Ended December 31 2016 2015 (In millions) Total assets $ 1,749 $ 1,577 Total liabilities 1,444 1,231 Year Ended December 31 2016 2015 2014 Revenues $ 693 $ 606 $ 491 Net income 80 71 32 Hedging – The Company formally documents all relationships between hedging instruments and hedged items, as well as its risk-management objective and strategy for undertaking various hedging transactions. The Company also formally assesses (both at the hedge’s inception and on an ongoing basis) whether the derivatives that are used in hedging transactions have been highly effective in offsetting changes in fair value or cash flows of hedged items and whether those derivatives may be expected to remain highly effective in future periods. When it is determined that a derivative for which hedge accounting has been designated is not (or ceases to be) highly effective, the Company discontinues hedge accounting prospectively. See Note 3 for additional information on the Company’s use of derivatives. Securities lending activities – The Company lends securities for the purpose of enhancing income or to finance positions to unrelated parties who have been designated as primary dealers by the Federal Reserve Bank of New York. Borrowers of these securities must deposit and maintain collateral with the Company of no less than 100% of the fair value of the securities loaned. U.S. Government securities and cash are accepted as collateral. The Company maintains effective control over loaned securities and, therefore, continues to report such securities as investments on the Consolidated Balance Sheets. Securities lending is typically done on a matched-book basis where the collateral is invested to substantially match the term of the loan. This matching of terms tends to limit risk. In accordance with the Company’s lending agreements, securities on loan are returned immediately to the Company upon notice. Collateral is not reflected as an asset of the Company. There was no collateral held at December 31, 2016 and 2015.

101
Notes to Consolidated Financial StatementsNote 1. Summary of Significant Accounting Policies – (Continued)
Revenue recognition – Premiums on property and casualty insurance contracts are recognized in proportion to the underlying risk insured and are principally earned ratably over the duration of the policies. Premiums on long term care contracts are earned ratably over the policy year in which they are due. The reserve for unearned premiums represents the portion of premiums written relating to the unexpired terms of coverage. Insurance receivables include balances due currently or in the future, including amounts due from insureds related to losses under high deductible policies, and are presented at unpaid balances, net of an allowance for doubtful accounts. Amounts are considered past due based on policy payment terms. The allowance is determined based on periodic evaluations of aged receivables, management’s experience and current economic conditions. Insurance receivables and any related allowance are written off after collection efforts are exhausted or a negotiated settlement is reached. Property and casualty contracts that are retrospectively rated contain provisions that result in an adjustment to the initial policy premium depending on the contract provisions and loss experience of the insured during the experience period. For such contracts, CNA estimates the amount of ultimate premiums that it may earn upon completion of the experience period and recognizes either an asset or a liability for the difference between the initial policy premium and the estimated ultimate premium. CNA adjusts such estimated ultimate premium amounts during the course of the experience period based on actual results to date. The resulting adjustment is recorded as either a reduction of or an increase to the earned premiums for the period. Contract drilling revenue from dayrate drilling contracts is recognized as services are performed. In connection with such drilling contracts, Diamond Offshore may receive fees (either lump-sum or dayrate) for the mobilization of equipment. These fees are earned as services are performed over the initial term of the related drilling contracts. Absent a contract, mobilization costs are recognized currently. From time to time, Diamond Offshore may receive fees from its customers for capital improvements to their rigs. Diamond Offshore defers such fees received and recognizes these fees into revenue on a straight-line basis over the period of the related drilling contract. Diamond Offshore capitalizes the costs of such capital improvements and depreciates them over the estimated useful life of the improvement. Revenues from transportation and storage services are recognized in the period the service is provided based on contractual terms and the related transported and stored volumes. The majority of Boardwalk Pipeline’s operating subsidiaries are subject to Federal Energy Regulatory Commission (“FERC”) regulations and, accordingly, certain revenues collected may be subject to possible refunds to its customers. An estimated refund liability is recorded considering regulatory proceedings, advice of counsel and estimated total exposure. Claim and claim adjustment expense reserves – Claim and claim adjustment expense reserves, except reserves for structured settlements not associated with asbestos and environmental pollution (“A&EP”), workers’ compensation lifetime claims and long term care claims, are not discounted and are based on (i) case basis estimates for losses reported on direct business, adjusted in the aggregate for ultimate loss expectations; (ii) estimates of incurred but not reported losses; (iii) estimates of losses on assumed reinsurance; (iv) estimates of future expenses to be incurred in the settlement of claims; (v) estimates of salvage and subrogation recoveries and (vi) estimates of amounts due from insureds related to losses under high deductible policies. Management considers current conditions and trends as well as past CNA and industry experience in establishing these estimates. The effects of inflation, which can be significant, are implicitly considered in the reserving process and are part of the recorded reserve balance. Ceded claim and claim adjustment expense reserves are reported as a component of Receivables on the Consolidated Balance Sheets. Claim and claim adjustment expense reserves are presented net of anticipated amounts due from insureds related to losses under deductible policies of $1.2 billion as of December 31, 2016 and 2015. A significant portion of these amounts are supported by collateral. CNA also has an allowance for uncollectible deductible amounts, which is presented as a component of the allowance for doubtful accounts included in Receivables on the Consolidated Balance Sheets. Structured settlements have been negotiated for certain property and casualty insurance claims. Structured settlements are agreements to provide fixed periodic payments to claimants. CNA’s obligations for structured settlements not funded by annuities are included in claim and claim adjustment expense reserves and carried at

102
Notes to Consolidated Financial Statements Note 1. Summary of Significant Accounting Policies – (Continued) present values determined using interest rates ranging from 5.5% to 8.0% at December 31, 2016 and 2015. At December 31, 2016 and 2015, the discounted reserves for unfunded structured settlements were $544 million and $560 million, net of discount of $841 million and $880 million. For the years ended December 31, 2016, 2015 and 2014, the amount of interest recognized on the discounted reserves of unfunded structured settlements was $42 million, $42 million and $43 million. This interest accretion is presented as a component of Insurance claims and policyholders’ benefits on the Consolidated Statements of Income but is excluded from the disclosure of prior year development. Workers’ compensation lifetime claim reserves are calculated using mortality assumptions determined through statutory regulation and economic factors. At December 31, 2016 and 2015, workers’ compensation lifetime claim reserves are discounted at a 3.5% interest rate. As of December 31, 2016 and 2015, the discounted reserves for workers’ compensation lifetime claim reserves were $371 million and $396 million, net of discount of $202 million and $218 million. For the years ended December 31, 2016, 2015 and 2014, the amount of interest accretion recognized on the discounted reserves of workers’ compensation lifetime claim reserves was $17 million, $20 million and $22 million. Long term care claim reserves are calculated using mortality and morbidity assumptions based on CNA and industry experience. Long term care claim reserves are discounted at interest rates ranging from 4.5% to 6.8% at December 31, 2016 and 2015. At December 31, 2016 and 2015, such discounted reserves totaled $2.2 billion, net of discount of $529 million and $435 million. Future policy benefits reserves – Future policy benefits reserves represent the active life reserves related to CNA’s long term care policies and are computed using the net level premium method, which incorporates actuarial assumptions as to morbidity, persistency, discount rate and expenses. Expense assumptions primarily relate to claim adjudication. Actuarial assumptions generally vary by plan, age at issue policy duration and gender. The initial assumptions are determined at issuance, include a margin for adverse deviation and are locked in throughout the life of the contract unless a premium deficiency develops. If a premium deficiency emerges, the assumptions are unlocked and deferred acquisition costs, if any, and the future policy benefits reserves are adjusted. The December 31, 2015 gross premium valuation (“GPV”) indicated a premium deficiency of $296 million. The indicated premium deficiency necessitated a charge to income that was effected by the write off of the entire long term care deferred acquisition cost asset of $289 million and an increase to active life reserves of $7 million. As a result, the long term care active life reserves carried as of December 31, 2015 represent management’s best estimate assumptions at that date with no margin for adverse deviation. The December 31, 2016 GPV indicated the carried reserves were sufficient, therefore there was no unlocking of assumptions. Interest rates for long term care active life reserves range from 6.6% to 7.0% as of December 31, 2016 and 2015. Guaranty fund and other insurance-related assessments – Liabilities for guaranty fund and other insurance-related assessments are accrued when an assessment is probable, when it can be reasonably estimated and when the event obligating the entity to pay an imposed or probable assessment has occurred. Liabilities for guaranty funds and other insurance-related assessments are not discounted and are included as part of Other liabilities on the Consolidated Balance Sheets. As of December 31, 2016 and 2015, the liability balances were $125 million and $129 million. Reinsurance – Reinsurance accounting allows for contractual cash flows to be reflected as premiums and losses. To qualify for reinsurance accounting, reinsurance agreements must include risk transfer. To meet risk transfer requirements, a reinsurance contract must include both insurance risk, consisting of underwriting and timing risk, and a reasonable possibility of a significant loss for the assuming entity. Reinsurance receivables related to paid losses are presented at unpaid balances. Reinsurance receivables related to unpaid losses are estimated in a manner consistent with claim and claim adjustment expense reserves or future policy benefits reserves. Reinsurance receivables are reported net of an allowance for doubtful accounts on the Consolidated Balance Sheets. The cost of reinsurance is primarily accounted for over the life of the underlying reinsured policies using assumptions consistent with those used to account for the underlying policies or over the reinsurance contract period. The ceding of insurance does not discharge the primary liability of CNA.

103
Notes to Consolidated Financial StatementsNote 1. Summary of Significant Accounting Policies – (Continued)
CNA has established an allowance for doubtful accounts on reinsurance receivables which relates to both amounts already billed on ceded paid losses as well as ceded reserves that will be billed when losses are paid in the future. The allowance for doubtful accounts on reinsurance receivables is estimated on the basis of periodic evaluations of balances due from reinsurers, reinsurer solvency, management’s experience and current economic conditions. Reinsurer financial strength ratings are updated and reviewed on an annual basis or sooner if CNA becomes aware of significant changes related to a reinsurer. Because billed receivables generally approximate 3% or less of total reinsurance receivables, the age of the reinsurance receivables related to paid losses is not a significant input into the allowance analysis. Changes in the allowance for doubtful accounts on reinsurance receivables are presented as a component of Insurance claims and policyholders’ benefits on the Consolidated Statements of Income. Amounts are considered past due based on the reinsurance contract terms. Reinsurance receivables related to paid losses and any related allowance are written off after collection efforts have been exhausted or a negotiated settlement is reached with the reinsurer. Reinsurance receivables related to paid losses from insolvent insurers are written off when the settlement due from the estate can be reasonably estimated. At the time reinsurance receivables related to paid losses are written off, any required adjustment to reinsurance receivables related to unpaid losses is recorded as a component of Insurance claims and policyholders’ benefits on the Consolidated Statements of Income. Reinsurance contracts that do not effectively transfer the economic risk of loss on the underlying policies are recorded using the deposit method of accounting, which requires that premium paid or received by the ceding company or assuming company be accounted for as a deposit asset or liability. CNA had $3 million recorded as deposit assets at December 31, 2016 and 2015, and $6 million and $8 million recorded as deposit liabilities as of December 31, 2016 and 2015. Income on reinsurance contracts accounted for under the deposit method is recognized using an effective yield based on the anticipated timing of payments and the remaining life of the contract. When the anticipated timing of payments changes, the effective yield is recalculated to reflect actual payments to date and the estimated timing of future payments. The deposit asset or liability is adjusted to the amount that would have existed had the new effective yield been applied since the inception of the contract. A loss portfolio transfer is a retroactive reinsurance contract. If the cumulative claim and allocated claim adjustment expenses ceded under a loss portfolio transfer exceed the consideration paid, the resulting gain from such excess is deferred and amortized into earnings in future periods in proportion to actual recoveries under the loss portfolio transfer. In any period in which there is a gain position and a revised estimate of claim and allocated claim adjustment expenses, a portion of the deferred gain is cumulatively recognized in earnings as if the revised estimate was available at the inception date of the loss portfolio transfer. Deferred acquisition costs – Deferrable acquisition costs include commissions, premium taxes and certain underwriting and policy issuance costs which are incremental direct costs of successful contract acquisitions. Acquisition costs related to property and casualty business are deferred and amortized ratably over the period the related premiums are earned. Deferred acquisition costs are presented net of ceding commissions and other ceded acquisition costs. CNA evaluates deferred acquisition costs for recoverability. Anticipated investment income is considered in the determination of the recoverability of deferred acquisition costs. Adjustments, if necessary, are recorded in current period results of operations. Deferred acquisition costs related to long term care contracts issued prior to January 1, 2004 include costs which vary with and are primarily related to the acquisition of business. As noted under Future policy benefits reserves, all of the long term care deferred acquisition costs of $289 million were written off as of December 31, 2015 in recognition of a premium deficiency. Investments in life settlement contracts and related revenue recognition – Prior to 2002, CNA purchased investments in life settlement contracts. CNA obtained the ownership and beneficiary rights of an underlying life insurance policy through a life settlement contract with the owner of the life insurance contract. CNA accounts for its investments in life settlement contracts using the fair value method. Under the fair value method, each life settlement contract is carried at its fair value at the end of each reporting period. The change in fair value estimated through CNA’s internal valuation process, life insurance proceeds received and periodic

104
Notes to Consolidated Financial Statements Note 1. Summary of Significant Accounting Policies – (Continued) maintenance costs, such as premiums, necessary to keep the underlying policy in force, are recorded in Other revenues on the Consolidated Statements of Income. The increase in fair value recognized in Other revenues for the years ended December 31, 2016, 2015 and 2014 on contracts still held was $7 million, $1 million and $8 million. The gains recognized during the years ended December 31, 2016, 2015 and 2014 on contracts that settled were $8 million, $24 million and $25 million. In December of 2016, CNA reached agreement on terms to sell the entire portfolio of life settlement contracts to a third party. CNA expects to consummate this transaction in 2017. As a result, the portfolio was determined to be held for sale as of December 31, 2016. Therefore, the contracts were measured at the lower of the carrying amount or the fair value per the agreed terms, resulting in a $10 million loss recognized within Other operating expenses. As of December 31, 2016, there were 526 life settlement contracts with a total fair value of $58 million, included in Other assets on the Consolidated Balance Sheets, and a face value of $285 million. Goodwill – Goodwill represents the excess of purchase price over fair value of net assets of acquired entities. Goodwill is tested for impairment annually or when certain triggering events require additional tests. Subsequent reversal of a goodwill impairment charge is not permitted. Property, plant and equipment – Property, plant and equipment is carried at cost less accumulated depreciation and amortization. Depreciation is computed principally by the straight-line method over the estimated useful lives of the various classes of properties. Leaseholds and leasehold improvements are depreciated or amortized over the terms of the related leases (including optional renewal periods where appropriate) or the estimated lives of improvements, if less than the lease term. The principal service lives used in computing provisions for depreciation are as follows: Years Pipeline equipment 30 to 50Offshore drilling equipment 15 to 30Other 3 to 40 Impairment of long-lived assets –Long-lived assets are reviewed for impairment when changes in circumstances indicate that the carrying amount of an asset may not be recoverable. Long-lived assets and intangibles with finite lives, under certain circumstances, are reported at the lower of carrying amount or fair value. Assets to be disposed of and assets not expected to provide any future service potential to the Company are recorded at the lower of carrying amount or fair value less cost to sell. Income taxes The Company and its eligible subsidiaries file a consolidated tax return. Deferred income taxes are recognized for temporary differences between the financial statement and tax return bases of assets and liabilities, based on enacted tax rates and other provisions of the tax law. The effect of a change in tax laws or rates on deferred tax assets and liabilities is recognized in income in the period in which such change is enacted. Future tax benefits are recognized to the extent that realization of such benefits is more likely than not, and a valuation allowance is established for any portion of a deferred tax asset that management believes may not be realized. The Company recognizes uncertain tax positions that it has taken or expects to take on a tax return. The tax benefit of a qualifying position is the largest amount of tax benefit that is greater than 50% likely of being realized upon ultimate settlement with a taxing authority having full knowledge of all relevant information. See Note 10 for additional information on the provision for income taxes. Pension and postretirement benefits – The Company recognizes the overfunded or underfunded status of its defined benefit plans in Other assets or Other liabilities in the Consolidated Balance Sheets. Changes in funded status related to prior service costs and credits and actuarial gains and losses are recognized in the year in which the changes occur through Accumulated other comprehensive income (loss). The Company measures its benefit plan assets and obligations at December 31. Annual service cost, interest cost, expected return on plan assets, amortization of prior service costs and credits and amortization of actuarial gains and losses are recognized in the Consolidated Statements of Income.

105
Notes to Consolidated Financial StatementsNote 1. Summary of Significant Accounting Policies – (Continued)
Stock-based compensation – The Company records compensation expense upon issuance, modification or cancellation of all share-based payment awards granted, primarily on a straight-line basis over the requisite service period, generally three to four years. Stock Appreciation Rights (“SARs”) are valued using the Black-Scholes option pricing model. The application of this valuation model involves assumptions that are judgmental and highly sensitive. These assumptions include the term that the awards are expected to be outstanding, an estimate of the volatility of the underlying stock price, applicable risk-free interest rates and the dividend yield of the Company’s stock. Restricted Stock Units (“RSUs”) are valued using the grant-date fair value of the Company’s stock. Net income per share – Companies with complex capital structures are required to present basic and diluted net income per share. Basic net income per share excludes dilution and is computed by dividing net income attributable to common stock by the weighted average number of common shares outstanding for the period. Diluted net income per share reflects the potential dilution that could occur if securities or other contracts to issue common stock were exercised or converted into common stock. For each of the years ended December 31, 2016, 2015 and 2014, approximately 0.4 million, 0.3 million and 0.6 million potential shares attributable to issuances and exercises under the Loews Corporation 2016 Incentive Compensation Plan and the prior plan were included in the calculation of diluted net income per share. For those same periods, approximately 3.7 million, 4.8 million and 2.3 million shares attributable to employee stock-based compensation awards were not included in the calculation of diluted net income per share because the effect would have been antidilutive. Foreign currency – Foreign currency translation gains and losses are reflected in Shareholders’ equity as a component of Accumulated other comprehensive income (loss). The Company’s foreign subsidiaries’ balance sheet accounts are translated at the exchange rates in effect at each reporting date and income statement accounts are translated at the average exchange rates during the reporting period. Foreign currency transaction losses of $21 million, $8 million and $22 million for the years ended December 31, 2016, 2015 and 2014 were included in the Consolidated Statements of Income. Regulatory accounting – The majority of Boardwalk Pipeline’s operating subsidiaries are regulated by FERC. GAAP for regulated entities requires Texas Gas Transmission, LLC (“Texas Gas”), a wholly owned subsidiary of Boardwalk Pipeline, to report certain assets and liabilities consistent with the economic effect of the manner in which independent third party regulators establish rates. Effective April 1, 2016, Gulf South Pipeline, LP (“Gulf South”), a wholly owned subsidiary of Boardwalk Pipeline, implemented a fuel tracker pursuant to a FERC rate case settlement, for which Gulf South applies regulatory accounting. Accordingly, certain costs and benefits are capitalized as regulatory assets and liabilities in order to provide for recovery from or refund to customers in future periods. Other than as described for Texas Gas and Gulf South, regulatory accounting is not applicable to Boardwalk Pipeline’s other FERC regulated entities or operations. Supplementary cash flow information – Cash payments made for interest on long term debt, net of capitalized interest, amounted to $511 million, $513 million and $501 million for the years ended December 31, 2016, 2015 and 2014. Cash payments for federal, foreign, state and local income taxes amounted to $114 million, $110 million and $189 million for the years ended December 31, 2016, 2015 and 2014. Investing activities exclude $18 million and $3 million of accrued capital expenditures for the years ended December 31, 2016 and 2015 and include $14 million of previously accrued capital expenditures for the year ended December 31, 2014. Accounting changes – In April of 2015, the Financial Accounting Standards Board (“FASB”) issued Accounting Standards Update (“ASU”) 2015-03, “Interest-Imputation of Interest (Subtopic 835-30): Simplifying the Presentation of Debt Issuance Costs.” The updated accounting guidance requires that debt issuance costs related to a recognized debt liability be presented in the balance sheet as a direct deduction from the carrying amount of that debt liability, rather than as a deferred asset. As required, the Company’s Consolidated Balance Sheet has been retrospectively adjusted to reflect the effect of the adoption of the updated accounting guidance, which resulted in a decrease of $23 million in Other assets and Long term debt at December 31, 2015.

106
Notes to Consolidated Financial Statements Note 1. Summary of Significant Accounting Policies – (Continued) In May of 2015, the FASB issued ASU 2015-09, “Financial Services – Insurance (Topic 944): Disclosures about Short-Duration Contracts.” The updated accounting guidance requires enhanced disclosures to provide additional information about insurance liabilities for short-duration contracts. The guidance is effective for annual periods beginning after December 15, 2015 and for interim periods beginning after December 15, 2016. The Company has adopted the change in disclosure requirements for short-duration contracts. Recently issued ASUs – In May of 2014, the FASB issued ASU 2014-09, “Revenue from Contracts with Customers (Topic 606).” The core principle of the new accounting guidance is that a company should recognize revenue to depict the transfer of promised goods or services to customers in an amount that reflects the consideration to which the company expects to be entitled in exchange for those goods or services. The new accounting guidance provides a five-step analysis of transactions to determine when and how revenue is recognized and requires enhanced disclosures about revenue. In August of 2015, the FASB formally amended the effective date of this update to annual reporting periods beginning after December 15, 2017, including interim periods. The guidance can be adopted either retrospectively or with a cumulative effect adjustment at the date of adoption. The Company expects the updated guidance will not have a material impact on its consolidated financial statements. In January of 2016, the FASB issued ASU 2016-01, “Financial Instruments – Overall (Subtopic 825-10): Recognition and Measurement of Financial Assets and Financial Liabilities.” The updated accounting guidance requires changes to the reporting model for financial instruments. The guidance is effective for interim and annual periods beginning after December 15, 2017. The Company is currently evaluating the effect the guidance will have on its consolidated financial statements, and expects the primary change to be the requirement for equity investments (except those accounted for under the equity method of accounting or those that result in consolidation of the investee) to be measured at fair value with changes in fair value recognized in net income. In February of 2016, the FASB issued ASU 2016-02, “Leases (Topic 842).” The updated guidance requires lessees to recognize lease assets and lease liabilities for most operating leases. In addition, the updated guidance requires that lessors separate lease and nonlease components in a contract in accordance with the new revenue guidance in ASU 2014-09. The updated guidance is effective for interim and annual periods beginning after December 15, 2018. The Company is currently evaluating the effect the updated guidance will have on its consolidated financial statements. In June of 2016, the FASB issued ASU 2016-13, “Financial Instruments – Credit Losses (Topic 326): Measurement of Credit Losses on Financial Instruments.” The updated accounting guidance requires changes to the recognition of credit losses on financial instruments not accounted for at fair value through net income. The guidance is effective for interim and annual periods beginning after December 15, 2019. The Company is currently evaluating the effect the guidance will have on its consolidated financial statements, and expects the primary changes to be the use of the expected credit loss model for the mortgage loan portfolio and reinsurance receivables and the presentation of credit losses within the available-for-sale fixed maturities portfolio through an allowance method rather than as a direct write-down. The expected credit loss model will require a financial asset to be presented at the net amount expected to be collected. The allowance method for available-for-sale debt securities will allow the Company to record reversals of credit losses if the estimate of credit losses declines. Note 2. Acquisitions and Divestitures CNA Financial On August 1, 2014, CNA completed the sale of Continental Assurance Company (“CAC”), its former life insurance subsidiary, which is reported as discontinued operations in the Consolidated Statements of Income for year ended December 31, 2014. See Note 19 for further discussion of discontinued operations. In connection with the sale of CAC, CNA entered into a 100% coinsurance agreement on a separate small block of annuity business outside of CAC. The coinsurance agreement required the transfer of assets with a book value equal to the ceded reserves on the inception date of the contract. Because a substantial portion of the assets supporting these liabilities are held in trust for the benefit of the original cedant, those assets were transferred on a funds withheld basis. Under this approach CNA maintains legal ownership of the assets, but the investment income and realized gains and losses on those assets inure to the reinsurer. As a result, the $31 million (after tax and
107
Notes to Consolidated Financial StatementsNote 2. Acquisitions and Divestitures – (Continued)
noncontrolling interests) difference between market value and book value of the funds withheld assets at the coinsurance contract’s inception was recognized in Other operating expenses in 2014. HighMount On September 30, 2014, the Company sold HighMount Exploration & Production LLC (“HighMount”), its former natural gas and oil exploration and production subsidiary. As of December 31, 2014, the Company had no remaining natural gas and oil exploration and production properties. The results of this sold business are reported as discontinued operations in the Consolidated Statements of Income for year ended December 31, 2014. See Note 19 for further discussion of discontinued operations. Boardwalk Pipeline In October of 2014, Boardwalk Pipeline acquired Boardwalk Petrochemical, which owns and operates the Evangeline ethylene pipeline system, from Chevron Pipe Line Company, for $295 million in cash. In 2013, Boardwalk Pipeline executed a series of agreements with the Williams Companies, Inc. (“Williams”) to develop the Bluegrass Project. In 2014, the Company expensed the previously capitalized project costs related to the development process due to cost escalations, construction delays and the lack of customer commitments, resulting in a charge of $94 million ($55 million after tax and noncontrolling interests), inclusive of a $10 million charge recorded by Boardwalk Pipeline Partners, LP. This charge was recorded within Other operating expenses on the Consolidated Statements of Income. In the fourth quarter of 2014, Boardwalk Pipeline and Williams dissolved the Bluegrass project entities. Loews Hotels Loews Hotels paid a total of approximately $84 million to acquire a hotel in 2016, approximately $330 million to acquire two hotels in 2015 and approximately $230 million to acquire three hotels in 2014. These acquisitions were funded with a combination of cash and property-level debt. Note 3. Investments Net investment income is as follows: Year Ended December 31 2016 2015 2014 (In millions) Fixed maturity securities $ 1,819 $ 1,751 $ 1,803 Limited partnership investments 199 119 304 Short term investments 9 11 4 Equity securities 10 12 12 Income from trading portfolio (a) 112 2 64 Other 45 34 34 Total investment income 2,194 1,929 2,221 Investment expenses (59) (63) (58) Net investment income $ 2,135 $ 1,866 $ 2,163 (a) Includes net unrealized gains (losses) related to changes in fair value on trading securities still held of $44, $(46) and $42
for the years ended December 31, 2016, 2015 and 2014.

108
Notes to Consolidated Financial Statements Note 3. Investments – (Continued) As of December 31, 2016, the Company held no non-income producing fixed maturity securities. As of December 31, 2015, the Company held $54 million of non-income producing fixed maturity securities. As of December 31, 2016 and 2015, no investments in a single issuer exceeded 10% of shareholders’ equity other than investments in securities issued by the U.S. Treasury and obligations of government-sponsored enterprises. Investment gains (losses) are as follows: Year Ended December 31 2016 2015 2014 (In millions) Fixed maturity securities $ 54 $ (66) $ 41 Equity securities (5) (23) 1 Derivative instruments (2) 10 (1) Short term investments and other 3 8 13 Investment gains (losses) (a) $ 50 $ (71) $ 54 (a) Includes gross realized gains of $209, $133 and $178 and gross realized losses of $160, $222 and $136 on available-for-sale
securities for the years ended December 31, 2016, 2015 and 2014. Net change in unrealized gains (losses) on available-for-sale investments is as follows: Year Ended December 31 2016 2015 2014 (In millions) Fixed maturity securities $ 225 $ (1,114) $ 1,511 Equity securities (2) (6) 6 Other 1 1 Total net change in unrealized gains (losses) on available-for-sale investments $ 224 $ (1,119) $ 1,517 The components of OTTI losses recognized in earnings by asset type are as follows: Year Ended December 31 2016 2015 2014 (In millions) Fixed maturity securities available-for-sale: Corporate and other bonds $ 59 $ 104 $ 18 States, municipalities and political subdivisions 18 46 Asset-backed: Residential mortgage-backed 10 8 5 Other asset-backed 3 1 1 Total asset-backed 13 9 6 Total fixed maturities available-for-sale 72 131 70 Equity securities available-for-sale - common stock 9 25 7 Net OTTI losses recognized in earnings $ 81 $ 156 $ 77

109
Notes to Consolidated Financial StatementsNote 3. Investments – (Continued)
The amortized cost and fair values of securities are as follows: Cost or Gross Gross Unrealized Amortized Unrealized Unrealized Estimated OTTI LossesDecember 31, 2016 Cost Gains Losses Fair Value (Gains) (In millions) Fixed maturity securities: Corporate and other bonds $ 17,711 $ 1,323 $ 76 $ 18,958 $ (1) States, municipalities and political subdivisions 12,060 1,213 33 13,240 (16) Asset-backed: Residential mortgage-backed 5,004 120 51 5,073 (28) Commercial mortgage-backed 2,016 48 24 2,040 Other asset-backed 1,022 8 5 1,025 Total asset-backed 8,042 176 80 8,138 (28) U.S. Treasury and obligations of government- sponsored enterprises 83 10 93 Foreign government 435 13 3 445 Redeemable preferred stock 18 1 19 Fixed maturities available-for-sale 38,349 2,736 192 40,893 (45) Fixed maturities, trading 598 3 601 Total fixed maturities 38,947 2,739 192 41,494 (45) Equity securities: Common stock 13 6 19 Preferred stock 93 2 4 91 Equity securities available-for-sale 106 8 4 110 - Equity securities, trading 465 60 86 439 Total equity securities 571 68 90 549 - Total $ 39,518 $ 2,807 $ 282 $ 42,043 $ (45) December 31, 2015 (In millions) Fixed maturity securities: Corporate and other bonds $ 17,097 $ 1,019 $ 347 $ 17,769 States, municipalities and political subdivisions 11,729 1,453 8 13,174 $ (4) Asset-backed: Residential mortgage-backed 4,935 154 17 5,072 (37) Commercial mortgage-backed 2,154 55 12 2,197 Other asset-backed 923 6 8 921 Total asset-backed 8,012 215 37 8,190 (37) U.S. Treasury and obligations of government- sponsored enterprises 62 5 67 Foreign government 334 13 1 346 Redeemable preferred stock 33 2 35 Fixed maturities available-for-sale 37,267 2,707 393 39,581 (41) Fixed maturities, trading 140 20 120 Total fixed maturities 37,407 2,707 413 39,701 (41) Equity securities: Common stock 46 3 1 48 Preferred stock 145 7 3 149 Equity securities available-for-sale 191 10 4 197 - Equity securities, trading 633 56 134 555 Total equity securities 824 66 138 752 - Total $ 38,231 $ 2,773 $ 551 $ 40,453 $ (41)

110
Notes to Consolidated Financial Statements Note 3. Investments – (Continued) The available-for-sale securities in a gross unrealized loss position are as follows: Less than 12 Months 12 Months or Longer Total Gross Gross Gross Estimated Unrealized Estimated Unrealized Estimated UnrealizedDecember 31, 2016 Fair Value Losses Fair Value Losses Fair Value Losses (In millions) Fixed maturity securities: Corporate and other bonds $ 2,615 $ 61 $ 254 $ 15 $ 2,869 $ 76 States, municipalities and political subdivisions 959 32 23 1 982 33 Asset-backed: Residential mortgage-backed 2,136 44 201 7 2,337 51 Commercial mortgage-backed 756 22 69 2 825 24 Other asset-backed 398 5 24 422 5 Total asset-backed 3,290 71 294 9 3,584 80 U.S. Treasury and obligations of government- sponsored enterprises 5 5 Foreign government 108 3 108 3 Total fixed maturity securities 6,977 167 571 25 7,548 192 Equity securities 12 13 4 25 4 Total $ 6,989 $ 167 $ 584 $ 29 $ 7,573 $ 196 December 31, 2015 (In millions) Fixed maturity securities: Corporate and other bonds $ 4,882 $ 302 $ 174 $ 45 $ 5,056 $ 347 States, municipalities and political subdivisions 338 8 75 413 8 Asset-backed: Residential mortgage-backed 963 9 164 8 1,127 17 Commercial mortgage-backed 652 10 96 2 748 12 Other asset-backed 552 8 5 557 8 Total asset-backed 2,167 27 265 10 2,432 37 U.S. Treasury and obligations of government- sponsored enterprises 4 4 Foreign government 54 1 54 1 Redeemable preferred stock 3 3 Total fixed maturity securities 7,448 338 514 55 7,962 393 Equity securities: Common stock 3 1 3 1 Preferred stock 13 3 13 3 Total equity securities 16 4 16 4 Total $ 7,464 $ 342 $ 514 $ 55 $ 7,978 $ 397 Based on current facts and circumstances, the Company believes the unrealized losses presented in the table above are not indicative of the ultimate collectibility of the current amortized cost of the securities, but rather are attributable to changes in interest rates, credit spreads and other factors. The Company has no current intent to sell securities with unrealized losses, nor is it more likely than not that it will be required to sell prior to recovery of amortized cost; accordingly, the Company has determined that there are no additional OTTI losses to be recorded at December 31, 2016.
111
Notes to Consolidated Financial StatementsNote 3. Investments – (Continued)
The following table presents the activity related to the pretax credit loss component reflected in Retained earnings on fixed maturity securities still held at December 31, 2016, 2015 and 2014 for which a portion of an OTTI loss was recognized in Other comprehensive income. Year Ended December 31 2016 2015 2014 (In millions) Beginning balance of credit losses on fixed maturity securities $ 53 $ 62 $ 74 Reductions for securities sold during the period (16) (9) (9) Reductions for securities the Company intends to sell or more likely than not will be required to sell (1) (3) Ending balance of credit losses on fixed maturity securities $ 36 $ 53 $ 62 Contractual Maturity The following table presents available-for-sale fixed maturity securities by contractual maturity. December 31 2016 2015 Cost or Cost or Amortized Estimated Amortized Estimated Cost Fair Value Cost Fair Value (In millions) Due in one year or less $ 1,779 $ 1,828 $ 1,574 $ 1,595 Due after one year through five years 7,566 7,955 7,738 8,082 Due after five years through ten years 15,892 16,332 14,652 14,915 Due after ten years 13,112 14,778 13,303 14,989 Total $ 38,349 $ 40,893 $ 37,267 $ 39,581 Actual maturities may differ from contractual maturities because certain securities may be called or prepaid. Securities not due at a single date are allocated based on weighted average life. Limited Partnerships The carrying value of limited partnerships as of December 31, 2016 and 2015 was approximately $3.2 billion and $3.3 billion, which includes undistributed earnings of $820 million and $952 million. Limited partnerships comprising 70.4% of the total carrying value are reported on a current basis through December 31, 2016 with no reporting lag, 13.4% of the total carrying value are reported on a one month lag and the remainder are reported on more than a one month lag. The number of limited partnerships held and the strategies employed provide diversification to the limited partnership portfolio and the overall invested asset portfolio. Limited partnerships comprising 76.6% of the carrying value as of December 31, 2016 and 2015 employ hedge fund strategies. Limited partnerships comprising 19.8% and 23.4% of the carrying value at December 31, 2016 and 2015 were invested in private debt and equity and the remainder were primarily invested in real estate strategies. Hedge fund strategies include both long and short positions in fixed income, equity and derivative instruments. These hedge fund strategies may seek to generate gains from mispriced or undervalued securities, price differentials between securities, distressed investments, sector rotation or various arbitrage disciplines. Within hedge fund strategies, approximately 59.8% were equity related, 25.5% pursued a multi-strategy approach, 11.1% were focused on distressed investments and 3.6% were fixed income related as of December 31, 2016.

112
Notes to Consolidated Financial Statements Note 3. Investments – (Continued) The ten largest limited partnership positions held totaled $1.5 billion as of December 31, 2016 and 2015. Based on the most recent information available regarding the Company’s percentage ownership of the individual limited partnerships, the carrying value reflected on the Consolidated Balance Sheets represents approximately 3.5% and 2.8% of the aggregate partnership equity at December 31, 2016 and 2015, and the related income reflected on the Consolidated Statements of Income represents approximately 4.0%, 2.8% and 4.3% of the changes in aggregate partnership equity for the years ended December 31, 2016, 2015 and 2014. While the Company generally does not invest in highly leveraged partnerships, there are risks inherent in limited partnership investments which may result in losses due to short-selling, derivatives or other speculative investment practices. The use of leverage increases volatility generated by the underlying investment strategies. The Company’s limited partnership investments contain withdrawal provisions that generally limit liquidity for a period of thirty days up to one year and in some cases do not permit withdrawals until the termination of the partnership. Typically, withdrawals require advance written notice of up to 90 days. Derivative Financial Instruments The Company may use derivatives in the normal course of business, primarily in an attempt to reduce exposure to market risk (principally interest rate risk, credit risk, equity price risk, commodity price risk and foreign currency risk) stemming from various assets and liabilities. The principal objective under such strategies is to achieve the desired reduction in economic risk, even if the position does not receive hedge accounting treatment. The Company may enter into interest rate swaps, futures and forward commitments to purchase securities to manage interest rate risk. Credit derivatives such as credit default swaps may be entered into to modify the credit risk inherent in certain investments. Forward contracts, futures, swaps and options may be used to manage foreign currency and commodity price risk. In addition to the derivatives used for risk management purposes described above, the Company may also use derivatives for purposes of income enhancement. Income enhancement transactions include but are not limited to interest rate swaps, call options, put options, credit default swaps, index futures and foreign currency forwards. See Note 4 for information regarding the fair value of derivative instruments.
113
Notes to Consolidated Financial StatementsNote 3. Investments – (Continued)
The following tables present the aggregate contractual or notional amount and estimated fair value related to derivative financial instruments. December 31 2016 2015 Contractual/ Contractual/ Notional Estimated Fair Value Notional Estimated Fair Value Amount Asset (Liability) Amount Asset (Liability)(In millions) Without hedge designation: Equity markets: Options – purchased $ 223 $ 14 $ 501 $ 16 – written 267 $ (8) 614 $ (28) Futures – long 312 (1) Futures – short 225 1 Interest rate risk: Futures – long 63 Foreign exchange: Currency forwards – long 133 2 – short 152 Currency options – long 550 7 Commodities: Futures – long 42 Embedded derivative on funds withheld liability 174 3 179 5 Investment Commitments As of December 31, 2016, the Company had committed approximately $380 million to future capital calls from various third party limited partnership investments in exchange for an ownership interest in the related partnerships. The Company invests in various privately placed debt securities, including bank loans, as part of its overall investment strategy and has committed to additional future purchases, sales and funding. Purchases and sales of privately placed debt securities are recorded once funded. As of December 31, 2016, the Company had commitments to purchase or fund additional amounts of $130 million and sell $121 million under the terms of such securities. Investments on Deposit Securities with carrying values of approximately $2.3 billion and $2.8 billion were deposited by CNA’s insurance subsidiaries under requirements of regulatory authorities and others as of December 31, 2016 and 2015. Cash and securities with carrying values of approximately $514 million and $364 million were deposited with financial institutions as collateral for letters of credit as of December 31, 2016 and 2015. In addition, cash and securities were deposited in trusts with financial institutions to secure reinsurance and other obligations with various third parties. The carrying values of these deposits were approximately $261 million and $263 million as of December 31, 2016 and 2015. Note 4. Fair Value Fair value is the price that would be received upon sale of an asset or paid to transfer a liability in an orderly transaction between market participants at the measurement date. The following fair value hierarchy is used in selecting inputs, with the highest priority given to Level 1, as these are the most transparent or reliable:
Level 1 – Quoted prices for identical instruments in active markets.

114
Notes to Consolidated Financial Statements Note 4. Fair Value – (Continued)
Level 2 – Quoted prices for similar instruments in active markets; quoted prices for identical or similar instruments in markets that are not active; and model-derived valuations in which all significant inputs are observable in active markets.
Level 3 – Valuations derived from valuation techniques in which one or more significant inputs are not
observable. Prices may fall within Level 1, 2 or 3 depending upon the methodology and inputs used to estimate fair value for each specific security. In general, the Company seeks to price securities using third party pricing services. Securities not priced by pricing services are submitted to independent brokers for valuation and, if those are not available, internally developed pricing models are used to value assets using a methodology and inputs the Company believes market participants would use to value the assets. Prices obtained from third-party pricing services or brokers are not adjusted by the Company. The Company performs control procedures over information obtained from pricing services and brokers to ensure prices received represent a reasonable estimate of fair value and to confirm representations regarding whether inputs are observable or unobservable. Procedures may include: (i) the review of pricing service methodologies or broker pricing qualifications, (ii) back-testing, where past fair value estimates are compared to actual transactions executed in the market on similar dates, (iii) exception reporting, where period-over-period changes in price are reviewed and challenged with the pricing service or broker based on exception criteria, (iv) detailed analysis, where the Company performs an independent analysis of the inputs and assumptions used to price individual securities and (v) pricing validation, where prices received are compared to prices independently estimated by the Company. The fair values of CNA’s life settlement contracts are included in Other assets on the Consolidated Balance Sheets. Equity options purchased are included in Equity securities, and all other derivative assets are included in Receivables. Derivative liabilities are included in Payable to brokers. Assets and liabilities measured at fair value on a recurring basis are summarized in the tables below: December 31, 2016 Level 1 Level 2 Level 3 Total (In millions) Fixed maturity securities: Corporate and other bonds $ 18,828 $ 130 $ 18,958 States, municipalities and political subdivisions 13,239 1 13,240 Asset-backed: Residential mortgage-backed 4,944 129 5,073 Commercial mortgage-backed 2,027 13 2,040 Other asset-backed 968 57 1,025 Total asset-backed 7,939 199 8,138 U.S. Treasury and obligations of government- sponsored enterprises $ 93 93 Foreign government 445 445 Redeemable preferred stock 19 19 Fixed maturities available-for-sale 112 40,451 330 40,893 Fixed maturities trading 595 6 601 Total fixed maturities $ 112 $ 41,046 $ 336 $ 41,494 Equity securities available-for-sale $ 91 $ 19 $ 110 Equity securities trading 438 1 439 Total equity securities $ 529 $ - $ 20 $ 549 Short term investments $ 3,833 $ 853 $ 4,686 Other invested assets 55 5 60 Receivables 1 1 Life settlement contracts $ 58 58 Payable to brokers (44) (44)

115
Notes to Consolidated Financial StatementsNote 4. Fair Value – (Continued)
December 31, 2015 Level 1 Level 2 Level 3 Total (In millions) Fixed maturity securities: Corporate and other bonds $ 17,601 $ 168 $ 17,769 States, municipalities and political subdivisions 13,172 2 13,174 Asset-backed: Residential mortgage-backed 4,938 134 5,072 Commercial mortgage-backed 2,175 22 2,197 Other asset-backed 868 53 921 Total asset-backed 7,981 209 8,190 U.S. Treasury and obligations of government- sponsored enterprises $ 66 1 67 Foreign government 346 346 Redeemable preferred stock 35 35 Fixed maturities available-for-sale 101 39,101 379 39,581 Fixed maturities trading 35 85 120 Total fixed maturities $ 101 $ 39,136 $ 464 $ 39,701 Equity securities available-for-sale $ 177 $ 20 $ 197 Equity securities trading 554 1 555 Total equity securities $ 731 $ - $ 21 $ 752 Short term investments $ 3,600 $ 1,134 $ 4,734 Other invested assets 102 44 146 Receivables 9 $ 3 12 Life settlement contracts 74 74 Payable to brokers (196) (196)

Not
es to
Con
solid
ated
Fin
anci
al S
tate
men
ts
Not
e 4.
Fai
r Val
ue –
(Con
tinue
d)
Th
e ta
bles
bel
ow p
rese
nt re
conc
iliat
ions
for a
ll as
sets
and
liab
ilitie
s m
easu
red
at fa
ir va
lue
on a
recu
rrin
g ba
sis
usin
g si
gnifi
cant
uno
bser
vabl
e in
puts
(Lev
el 3
) for
the
year
s end
ed D
ecem
ber 3
1, 2
016
and
2015
:
Unr
ealiz
ed
G
ains
(Los
ses)
Rec
ogni
zed
in
Net
Rea
lized
Gai
ns
Net
Inco
me
(L
osse
s) a
nd N
et C
hang
e
on
Lev
el
in
Unr
ealiz
ed G
ains
3
Ass
ets a
nd
(L
osse
s)
T
rans
fers
T
rans
fers
Lia
bilit
ies
Bal
ance
, In
clud
ed in
In
clud
ed in
in
to
out o
f B
alan
ce,
Hel
d at
20
16
Ja
nuar
y 1
Net
Inco
me
OC
I Pu
rcha
ses
Sale
s Se
ttle
men
ts
Lev
el 3
L
evel
3
Dec
embe
r 31
D
ecem
ber
31
(In
mill
ions
)
Fixe
d m
atur
ity se
curi
ties:
C
orpo
rate
and
oth
er b
onds
$
168
$
1 $
1
$
163
$
(36)
$
(1
03)
$
(64)
$
13
0
Stat
es, m
unic
ipal
ities
and
p
oliti
cal s
ubdi
visi
ons
2
(1
)
1
A
sset
-bac
ked:
R
esid
entia
l mor
tgag
e-ba
cked
134
3
(5
)
15
(1
4)
$
56
(6
0)
12
9
C
omm
erci
al m
ortg
age-
back
ed
22
(1)
(1
)
32
(1
7)
3
(2
5)
13
O
ther
ass
et-b
acke
d
53
(2
)
1
86
(2
5)
(1
)
2
(57)
57
T
otal
ass
et-b
acke
d
209
-
(5
)
133
(2
5)
(3
2)
61
(142
)
199
$
- Fi
xed
mat
uriti
es a
vaila
ble-
for-
sale
379
1
(4
)
296
(6
1)
(1
36)
61
(206
)
330
Fixe
d m
atur
ities
trad
ing
85
5
2
(86)
6
3 T
otal
fixe
d m
atur
ities
$
464
$
6 $
(4
) $
29
8 $
(1
47)
$
(136
) $
61
$
(2
06)
$
336
$
3
Equ
ity se
curi
ties a
vaila
ble-
for-
sale
$
20
$
(1)
$
19
$
(2)
Equ
ity se
curi
ties t
radi
ng
1
1
$
(1)
1
T
otal
equ
ity se
curi
ties
$ 21
$
-
$
- $
-
$
(1)
$
- $
-
$
- $
20
$
(2
)
L
ife se
ttle
men
t con
trac
ts
$ 74
$
5
$
(2
1)
$
58
$
(3)
Der
ivat
ive
finan
cial
inst
rum
ents
, net
3
(1
)
$
(2
)
-
116

Not
es to
Con
solid
ated
Fin
anci
al S
tate
men
tsN
ote
4. F
air V
alue
– (C
ontin
ued)
Unr
ealiz
ed
G
ains
(Los
ses)
Rec
ogni
zed
in
N
et R
ealiz
ed G
ains
N
et In
com
e
(Los
ses)
and
Net
Cha
nge
on L
evel
in U
nrea
lized
Gai
ns
3 A
sset
s and
(Los
ses)
Tran
sfer
s Tr
ansf
ers
Li
abili
ties
Bal
ance
, In
clud
ed in
In
clud
ed in
into
ou
t of
Bal
ance
, H
eld
at
2015
Janu
ary
1 N
et In
com
e O
CI
Purc
hase
s Sa
les
Settl
emen
ts
Leve
l 3
Leve
l 3
Dec
embe
r 31
Dec
embe
r 31
(In
mill
ions
)
Fixe
d m
atur
ity se
curit
ies:
C
orpo
rate
and
oth
er b
onds
$
162
$
(2)
$
(3)
$
65
$
(13)
$
(3
5)
$
40
$
(46)
$
16
8 $
(2
)
Stat
es, m
unic
ipal
ities
and
p
oliti
cal s
ubdi
visi
ons
94
1
(10)
(83)
2
A
sset
-bac
ked:
R
esid
entia
l mor
tgag
e-ba
cked
189
5
(3
)
81
(3
5)
14
(117
)
134
Com
mer
cial
mor
tgag
e-ba
cked
83
7
(4
)
23
(1
7)
17
(87)
22
Oth
er a
sset
-bac
ked
65
5
3
3
130
(2
63)
(5
2)
7
(4
30)
53
Tota
l ass
et-b
acke
d
927
15
(4)
23
4
(263
)
(104
)
38
(6
34)
20
9
- Fi
xed
mat
uriti
es a
vaila
ble-
for-
sale
1,18
3
14
(7
)
299
(2
76)
(1
49)
78
(763
)
379
(2
) Fi
xed
mat
uriti
es tr
adin
g
90
(3
)
(2
)
85
(3
) To
tal f
ixed
mat
uriti
es
$ 1,
273
$
11
$
(7)
$
299
$
(278
) $
(1
49)
$
78
$
(763
) $
46
4 $
(5
)
Equi
ty se
curit
ies a
vaila
ble-
for-
sale
$
16
$
(1)
$
4
$
1
$
20
Equi
ty se
curit
ies t
radi
ng
1
$
1
1
$
(2)
1
$
1 To
tal e
quity
secu
ritie
s
$
17
$
1 $
(1
) $
5
$
(2)
$
- $
1
$
- $
21
$
1
Life
settl
emen
t con
tract
s
$
82
$
25
$
(3
3)
$
74
$
1 D
eriv
ativ
e fin
anci
al in
stru
men
ts, n
et
$
3
3
Net
real
ized
and
unr
ealiz
ed g
ains
and
loss
es a
re re
porte
d in
Net
inco
me
as fo
llow
s:
Maj
or C
ateg
ory
of A
sset
s and
Lia
bilit
ies
Con
solid
ated
Sta
tem
ents
of I
ncom
e Li
ne It
ems
Fixe
d m
atur
ity se
curit
ies a
vaila
ble-
for-
sale
In
vest
men
t gai
ns (l
osse
s)
Fixe
d m
atur
ity se
curit
ies,
tradi
ng
Net
inve
stm
ent i
ncom
e
Equi
ty se
curit
ies a
vaila
ble-
for-
sale
In
vest
men
t gai
ns (l
osse
s)
Equi
ty se
curit
ies,
tradi
ng
Net
inve
stm
ent i
ncom
e O
ther
inve
sted
ass
ets
Inve
stm
ent g
ains
(los
ses)
and
Net
inve
stm
ent i
ncom
e D
eriv
ativ
e fin
anci
al in
stru
men
ts h
eld
in a
trad
ing
portf
olio
N
et in
vest
men
t inc
ome
Der
ivat
ive
finan
cial
inst
rum
ents
, oth
er
Inve
stm
ent g
ains
(los
ses)
and
Oth
er re
venu
es
Life
settl
emen
t con
tract
s O
ther
reve
nues
117

118
Notes to Consolidated Financial Statements Note 4. Fair Value – (Continued) Securities may be transferred in or out of levels within the fair value hierarchy based on the availability of observable market information and quoted prices used to determine the fair value of the security. The availability of observable market information and quoted prices varies based on market conditions and trading volume. During the year ended December 31, 2016 there were no transfers between Level 1 and Level 2. There were $63 million of transfers from Level 2 to Level 1 and $52 million of transfers from Level 1 to Level 2 during the year ended December 31, 2015. The Company’s policy is to recognize transfers between levels at the beginning of quarterly reporting periods. Valuation Methodologies and Inputs The following section describes the valuation methodologies and relevant inputs used to measure different financial instruments at fair value, including an indication of the level in the fair value hierarchy in which the instruments are generally classified. Fixed Maturity Securities Level 1 securities include highly liquid and exchange traded bonds and redeemable preferred stock, valued using quoted market prices. Level 2 securities include most other fixed maturity securities as the significant inputs are observable in the marketplace. All classes of Level 2 fixed maturity securities are valued using a methodology based on information generated by market transactions involving identical or comparable assets, a discounted cash flow methodology or a combination of both when necessary. Common inputs for all classes of fixed maturity securities include prices from recently executed transactions of similar securities, marketplace quotes, benchmark yields, spreads off benchmark yields, interest rates and U.S. Treasury or swap curves. Specifically for asset-backed securities, key inputs include prepayment and default projections based on past performance of the underlying collateral and current market data. Fixed maturity securities are primarily assigned to Level 3 in cases where broker/dealer quotes are significant inputs to the valuation and there is a lack of transparency as to whether these quotes are based on information that is observable in the marketplace. Level 3 securities also include private placement debt securities whose fair value is determined using internal models with inputs that are not market observable. Equity Securities Level 1 equity securities include publicly traded securities valued using quoted market prices. Level 2 securities are primarily non-redeemable preferred stocks and common stocks valued using pricing for similar securities, recently executed transactions and other pricing models utilizing market observable inputs. Level 3 securities are primarily priced using broker/dealer quotes and internal models with inputs that are not market observable. Derivative Financial Instruments Exchange traded derivatives are valued using quoted market prices and are classified within Level 1 of the fair value hierarchy. Level 2 derivatives primarily include currency forwards valued using observable market forward rates. Over-the-counter derivatives, principally interest rate swaps, total return swaps, commodity swaps, equity warrants and options, are valued using inputs including broker/dealer quotes and are classified within Level 2 or Level 3 of the valuation hierarchy, depending on the amount of transparency as to whether these quotes are based on information that is observable in the marketplace. Short Term Investments Securities that are actively traded or have quoted prices are classified as Level 1. These securities include money market funds and treasury bills. Level 2 primarily includes commercial paper, for which all inputs are market observable. Fixed maturity securities purchased within one year of maturity are classified consistent with fixed maturity securities discussed above. Short term investments as presented in the tables above differ from the amounts presented in the Consolidated Balance Sheets because certain short term investments, such as time deposits, are not measured at fair value.

119
Notes to Consolidated Financial StatementsNote 4. Fair Value – (Continued)
Other Invested Assets Level 1 securities include exchange traded open-end funds valued using quoted market prices. Life Settlement Contracts Historically, the fair values of life settlement contracts were determined as the present value of the anticipated death benefits less anticipated premium payments based on contract terms that are distinct for each insured, as well as CNA’s own assumptions for mortality, premium expense, and the rate of return that a buyer would require on the contracts. As discussed in Note 1, because CNA has reached agreement on terms to sell the portfolio of life settlement contracts to a third party, the fair value was written down to reflect the value determined per the agreed terms of sale. Despite the pending sale, as there is not an active market for life settlement contracts, they have been classified as Level 3. Significant Unobservable Inputs The following tables present quantitative information about the significant unobservable inputs utilized by the Company in the fair value measurements of Level 3 assets. Valuations for assets and liabilities not presented in the tables below are primarily based on broker/dealer quotes for which there is a lack of transparency as to inputs used to develop the valuations. The quantitative detail of unobservable inputs from these broker quotes is neither provided nor reasonably available to the Company. The valuation of life settlement contracts as of December 31, 2016 was based on the terms of the pending sale of the contracts to a third party, therefore the contracts are not included in the table below. Range Estimated Valuation Unobservable (Weighted December 31, 2016 Fair Value Techniques Inputs Average) (In millions) Fixed maturity securities $ 106 Discounted cash flow Credit spread 2% – 40% (4%) December 31, 2015 Fixed maturity securities $ 138 Discounted cash flow Credit spread 3% – 184% (6%) Life settlement contracts 74 Discounted cash flow Discount rate risk premium 9% Mortality assumption 55% – 1,676% (164%) For fixed maturity securities, an increase to the credit spread assumptions would result in a lower fair value measurement. For life settlement contracts, an increase in the discount rate risk premium or decrease in the mortality assumption would result in a lower fair value measurement.

120
Notes to Consolidated Financial Statements Note 4. Fair Value – (Continued) Financial Assets and Liabilities Not Measured at Fair Value The carrying amount, estimated fair value and the level of the fair value hierarchy of the Company’s financial assets and liabilities which are not measured at fair value on the Consolidated Balance Sheets are presented in the following tables. The carrying amounts and estimated fair values of short term debt and long term debt exclude capital lease obligations. The carrying amounts reported on the Consolidated Balance Sheets for cash and short term investments not carried at fair value and certain other assets and liabilities approximate fair value due to the short term nature of these items. Carrying Estimated Fair Value December 31, 2016 Amount Level 1 Level 2 Level 3 Total (In millions) Assets: Other invested assets, primarily mortgage loans $ 591 $ 594 $ 594 Liabilities: Short term debt 107 $ 104 3 107 Long term debt 10,655 10,150 646 10,796 December 31, 2015 Assets: Other invested assets, primarily mortgage loans $ 678 $ 688 $ 688 Liabilities: Short term debt 1,038 $ 1,050 2 1,052 Long term debt 9,507 8,538 595 9,133 The following methods and assumptions were used in estimating the fair value of these financial assets and liabilities. The fair values of mortgage loans, included in Other invested assets, were based on the present value of the expected future cash flows discounted at the current interest rate for similar financial instruments, adjusted for specific loan risk. Fair value of debt was based on observable market prices when available. When observable market prices were not available, the fair value of debt was based on observable market prices of comparable instruments adjusted for differences between the observed instruments and the instruments being valued or is estimated using discounted cash flow analyses, based on current incremental borrowing rates for similar types of borrowing arrangements.

121
Notes to Consolidated Financial Statements
Note 5. Receivables December 31 2016 2015 (In millions) Reinsurance (Note 15) $ 4,453 $ 4,491 Insurance 2,255 2,129 Receivable from brokers 178 471 Accrued investment income 410 408 Federal income taxes 7 45 Other, primarily customer accounts 431 593 Total 7,734 8,137 Less: allowance for doubtful accounts on reinsurance receivables 37 38 allowance for other doubtful accounts 53 58 Receivables $ 7,644 $ 8,041 Note 6. Property, Plant and Equipment December 31 2016 2015 (In millions) Pipeline equipment (net of accumulated depreciation of $2,174 and $1,887) $ 7,631 $ 7,462 Offshore drilling equipment (net of accumulated depreciation of $3,310 and $3,335) 5,693 6,071 Other (net of accumulated depreciation of $873 and $811) 1,527 1,450 Construction in process 379 494 Property, plant and equipment $ 15,230 $ 15,477 Depreciation expense and capital expenditures are as follows: Year Ended December 31 2016 2015 2014 Depre- Capital Depre- Capital Depre- Capital ciation Expend. ciation Expend. ciation Expend. (In millions) CNA Financial $ 67 $ 128 $ 74 $ 123 $ 69 $ 72 Diamond Offshore 384 629 494 812 457 2,050 Boardwalk Pipeline 321 648 327 390 292 378 Loews Hotels 63 164 54 389 37 289 Corporate 6 3 6 4 6 24 Total $ 841 $ 1,572 $ 955 $ 1,718 $ 861 $ 2,813 Capitalized interest related to the construction and upgrade of qualifying assets amounted to approximately $51 million, $36 million and $80 million for the years ended December 31, 2016, 2015 and 2014. Offshore Drilling Equipment Purchase of Assets In 2016, Diamond Offshore took delivery of one ultra-deepwater semisubmersible rig. The net book value of this newly constructed rig was $774 million at December 31, 2016, of which $270 million was reported in Construction in process at December 31, 2015. In 2015, Diamond Offshore took delivery of one ultra-deepwater drillship. The net book value of this newly constructed rig was $655 million at December 31, 2015, of which $225 million was reported in Construction in process at December 31, 2014.

122
Notes to Consolidated Financial Statements Note 6. Property, Plant and Equipment – (Continued) Sale of Assets In February of 2016, Diamond Offshore entered into a ten-year agreement with a subsidiary of GE Oil & Gas (“GE”) to provide services with respect to certain blowout preventer and related well control equipment on four newly-built drillships. Such services include management of maintenance, certification and reliability with respect to such equipment. In connection with the contractual services agreement with GE, Diamond Offshore agreed to sell the well control equipment to a GE affiliate and subsequently lease back such equipment pursuant to separate ten-year operating leases. In 2016, Diamond Offshore completed four sale and leaseback transactions with respect to the well control equipment on its ultra-deepwater drillships and received an aggregate of $210 million in proceeds, which was less than the carrying value of the equipment. The resulting difference was recorded as prepaid rent with no gain or loss recognized on the transactions, and will be amortized over the terms of the operating leases. Future commitments under the operating leases and contractual services agreements for the ultra-deepwater drillships are estimated to aggregate approximately $655 million over the term of the agreements. During 2016, Diamond Offshore recognized $34 million in aggregate expense related to the well control equipment leases and contractual services agreement. Asset Impairments During 2016, in response to the continuing industry-wide decline in utilization for semisubmersible rigs, further exacerbated by additional and more frequent contract cancelations by customers, declining dayrates, as well as the results of a third-party strategic review of Diamond Offshore’s long-term business plan completed in the second quarter of 2016, Diamond Offshore reassessed its projections for a recovery in the offshore drilling market. As a result, Diamond Offshore concluded that an expected market recovery is now likely further in the future than had previously been estimated. Consequently, Diamond Offshore believes its cold-stacked rigs, as well as those rigs expected to be cold-stacked in the near term after they come off contract, will likely remain cold-stacked for an extended period of time. Diamond Offshore also believes that the re-entry costs for these rigs will be higher than previously estimated, negatively impacting the undiscounted, probability-weighted cash flow projections utilized in its earlier impairment analysis. In addition, in response to the declining market, Diamond Offshore also reduced anticipated market pricing and expected utilization of these rigs after reactivation. In 2016, Diamond Offshore evaluated 15 of its drilling rigs with indications that their carrying amounts may not be recoverable. Based on updated assumptions and analyses, Diamond Offshore determined that the carrying values of eight of these rigs were impaired, including one rig that had previously been impaired in a prior year. The impaired rigs consisted of three ultra-deepwater, three deepwater and two mid-water semisubmersible rigs. Diamond Offshore estimated the fair value of the eight impaired rigs using an income approach. The fair value of each rig was estimated based on a calculation of the rig’s discounted future net cash flows over its remaining economic life, which utilized significant unobservable inputs, including, but not limited to, assumptions related to estimated dayrate revenue, rig utilization, estimated reactivation and regulatory survey costs, as well as estimated proceeds that may be received on ultimate disposition of the rig. The fair value estimates were representative of Level 3 fair value measurements due to the significant level of estimation involved and the lack of transparency as to the inputs used. During the second quarter of 2016, Diamond Offshore recognized an impairment loss of $672 million ($263 million after tax and noncontrolling interests). During 2015, Diamond Offshore evaluated 25 of its drilling rigs with indications that their carrying amounts may not be recoverable. Based on this analysis, Diamond Offshore determined that the carrying value of 17 of these rigs, consisting of two ultra-deepwater, one deepwater and nine mid-water floaters and five jack-up rigs, were impaired. The fair value of 16 impaired rigs was determined utilizing a market approach, which required an estimate of the value that would be received for each rig in the principal or most advantageous market for that rig in an orderly transaction between market participants. Such estimates were based on various inputs, including historical contracted sales prices for similar rigs in the fleet, nonbinding quotes from rig brokers and/or indicative bids, where applicable. Diamond Offshore estimated the fair value of the one remaining impaired rig using an income approach, as discussed above. The fair value estimates are representative of Level 3 fair value measurements due to the significant level of estimation involved and the lack of transparency as to the inputs used. During 2015, Diamond Offshore recognized aggregate impairment losses of $861 million ($341 million after tax and noncontrolling interests).

123
Notes to Consolidated Financial StatementsNote 6. Property, Plant and Equipment – (Continued)
During 2014, Diamond Offshore initiated a plan to retire and scrap six mid-water drilling rigs. Using an undiscounted, projected probability-weighted cash flow analysis, it was determined that the carrying values of these six rigs were impaired. Diamond Offshore determined the fair value of the impaired rigs by applying a combination of income and market approaches which were representative of Level 3 fair value measurements due to the significant level of estimation involved and the lack of transparency as to the inputs used. As a result of the valuations, an impairment loss aggregating $109 million ($55 million after tax and noncontrolling interests) was recognized during 2014. Of the rigs impaired during the three-year period ended December 31, 2016, 20 rigs have been sold and eight rigs are currently cold-stacked. Two other previously impaired rigs are currently operating under contract. The impairment losses recorded during the years ended December 31, 2016, 2015 and 2014 are reported within Other operating expenses on the Consolidated Statements of Income. If market fundamentals in the offshore oil and gas industry deteriorate further or if Diamond Offshore is unable to secure new or extend existing contracts for its current, actively-marketed drilling fleet or reactivate any of its cold stacked rigs or if Diamond Offshore experiences unfavorable changes to actual dayrates and rig utilization, additional impairment losses may be required to be recognized in future periods if the carrying value of any of the drilling rigs is not recoverable. Note 7. Goodwill
CNA Diamond Boardwalk Loews Total Financial Offshore Pipeline Hotels Corporate
(In millions) Balance, December 31, 2014 $ 374 $ 117 $ 20 $ 237 $ - $ - Impairments (20) (20) Other adjustments (3) (3) Balance, December 31, 2015 351 114 - 237 - - Other adjustments (5) (5) Balance, December 31, 2016 $ 346 $ 109 $ - $ 237 $ - $ - An impairment charge of $20 million was recorded in Other operating expenses in 2015 to write off all goodwill attributable to Diamond Offshore. Note 8. Claim and Claim Adjustment Expense Reserves CNA’s property and casualty insurance claim and claim adjustment expense reserves represent the estimated amounts necessary to resolve all outstanding claims, including claims that are incurred but not reported (“IBNR”) as of the reporting date. CNA’s reserve projections are based primarily on detailed analysis of the facts in each case, CNA’s experience with similar cases and various historical development patterns. Consideration is given to such historical patterns as claim reserving trends and settlement practices, loss payments, pending levels of unpaid claims and product mix, as well as court decisions, economic conditions including inflation and public attitudes. All of these factors can affect the estimation of claim and claim adjustment expense reserves. Establishing claim and claim adjustment expense reserves, including claim and claim adjustment expense reserves for catastrophic events that have occurred, is an estimation process. Many factors can ultimately affect the final settlement of a claim and, therefore, the necessary reserve. Changes in the law, results of litigation, medical costs, the cost of repair materials and labor rates can all affect ultimate claim costs. In addition, time can be a critical part of reserving determinations since the longer the span between the incidence of a loss and the payment or settlement of the claim, the more variable the ultimate settlement amount can be. Accordingly, short-tail claims, such as property damage claims, tend to be more reasonably estimable than long-tail claims, such as workers’ compensation, general liability and professional liability claims. Adjustments to prior year reserve estimates, if necessary, are reflected in the results of operations in the period that the need for such adjustments is determined. There can be no assurance that CNA’s ultimate cost for insurance losses will not exceed current estimates.

124
Notes to Consolidated Financial Statements Note 8. Claim and Claim Adjustment Expense Reserves – (Continued) Catastrophes are an inherent risk of the property and casualty insurance business and have contributed to material period-to-period fluctuations in CNA’s results of operations and/or equity. CNA reported catastrophe losses, net of reinsurance, of $165 million, $141 million and $156 million for the years ended December 31, 2016, 2015 and 2014. Catastrophe losses in 2016 related primarily to U.S. weather-related events and the Fort McMurray wildfires. In developing claim and claim adjustment expense (“loss” or “losses”) reserve estimates, CNA’s actuaries perform detailed reserve analyses that are staggered throughout the year. Every reserve group is reviewed at least once during the year. The analyses generally review losses gross of ceded reinsurance and apply the ceded reinsurance terms to the gross estimates to establish estimates net of reinsurance. In addition to the detailed analyses, CNA reviews actual loss emergence for all products each quarter. In developing the loss reserve estimates for property and casualty contracts, CNA generally projects ultimate losses using several common actuarial methods as listed below. CNA reviews the various indications from the various methods and applies judgment to select an actuarial point estimate. The indicated required reserve is the difference between the selected ultimate loss and the inception-to-date paid losses. The difference between the selected ultimate loss and the case incurred or reported loss is IBNR. IBNR includes a provision for development on known cases as well as a provision for late reported incurred claims. Further, CNA does not establish case reserves for allocated loss adjustment expenses (“ALAE”), therefore all ALAE reserves are included in its estimate of IBNR. The most frequently utilized methods to project ultimate losses include the following:
paid development;
incurred development;
loss ratio;
Bornhuetter-Ferguson using premiums and paid loss;
Bornhuetter-Ferguson using premiums and incurred loss;
frequency times severity; and
stochastic modeling. The paid development method estimates ultimate losses by reviewing paid loss patterns and applying them to accident years with further expected changes in paid losses. The incurred development method is similar to the paid development method, but it uses case incurred losses instead of paid losses. The loss ratio method multiplies premiums by an expected loss ratio to produce ultimate loss estimates for each accident year. The Bornhuetter-Ferguson using premiums and paid loss method is a combination of the paid development approach and the loss ratio approach. This method normally determines expected loss ratios similar to the approach used to estimate the expected loss ratio for the loss ratio method. The Bornhuetter-Ferguson using premiums and incurred loss method is similar to the Bornhuetter-Ferguson using premiums and paid loss method except that it uses case incurred losses. The frequency times severity method multiplies a projected number of ultimate claims by an estimated ultimate average loss for each accident year to produce ultimate loss estimates. Stochastic modeling produces a range of possible outcomes based on varying assumptions related to the particular product being modeled. For many exposures, especially those that can be considered long-tail, a particular accident or policy year may not have a sufficient volume of paid losses to produce a statistically reliable estimate of ultimate losses. In such a case, CNA’s actuaries typically assign more weight to the incurred development method than to the paid development method. As claims continue to settle and the volume of paid loss increases, the actuaries may assign additional weight to the paid development method. For most of CNA’s products, even the incurred losses for accident or policy years that are early in the claim settlement process will not be of sufficient volume to produce a reliable estimate of ultimate losses. In these cases, CNA may not assign any weight to the paid and incurred development methods. CNA will use the loss ratio, Bornhuetter-Ferguson and frequency times severity methods. For short-tail exposures, the paid and incurred development methods can often be relied on sooner, primarily because CNA’s history includes a sufficient number of years to cover the entire period over which paid and incurred losses are expected to change.

125
Notes to Consolidated Financial StatementsNote 8. Claim and Claim Adjustment Expense Reserves – (Continued)
However, CNA may also use the loss ratio, Bornhuetter-Ferguson and frequency times severity methods for short-tail exposures. For other more complex reserve groups where the above methods may not produce reliable indications, CNA uses additional methods tailored to the characteristics of the specific situation. Reserves for policyholder benefits for non-core operations, which primarily includes long term care, are based on actuarial assumptions which include estimates of morbidity, persistency, discount rates and expenses over the life of the contracts. Under GAAP, the best estimates of the actuarial assumptions at the date the contract was issued are locked-in throughout the life of the contract unless a premium deficiency develops, which occurred in 2015. As a result, CNA updated the assumptions to represent management’s best estimates at the time of the premium deficiency and these revised assumptions are locked-in unless another premium deficiency is identified. Certain claim liabilities are more difficult to estimate and have differing methodologies and considerations which are described below. CNA’s mass tort and A&EP reserving methodologies are similar as both are based on detailed account reviews of all large accounts with estimates based on ultimate payments considering the applicable law and coverage litigation. These reserves are subject to greater inherent variability than is typical of the remainder of CNA’s reserves due to, among other things, a general lack of sufficiently detailed data, expansion of the population being held responsible for these exposures and significant unresolved legal issues such as the existence of coverage and the definition of an occurrence. CNA’s actuarial reserve analyses result in point estimates. Each quarter, the results of detailed reserve reviews are summarized and discussed with CNA’s senior management to determine management’s best estimate of reserves. CNA’s senior management considers many factors in making this decision. The factors include, but are not limited to, the historical pattern and volatility of the actuarial indications, the sensitivity of the actuarial indications to changes in paid and incurred loss patterns, the consistency of claims handling processes, the consistency of case reserving practices, changes in CNA’s pricing and underwriting, pricing and underwriting trends in the insurance market and legal, judicial, social and economic trends. CNA’s recorded reserves reflect its best estimate as of a particular point in time based upon known facts, consideration of the factors cited above and its judgment. The carried reserve may differ from the actuarial point estimate as the result of CNA’s consideration of the factors noted above as well as the potential volatility of the projections associated with the specific product being analyzed and other factors affecting claims costs that may not be quantifiable through traditional actuarial analysis. The loss reserve development tables presented herein illustrate the change over time of reserves established for claim and allocated claim adjustment expenses arising from short duration insurance contracts for certain lines of business within CNA’s property and casualty operations. Not all lines of business are presented based on their context to CNA’s overall loss reserves, calendar year reserve development, or calendar year net earned premiums. Insurance contracts are considered to be short duration contracts when the contracts are not expected to remain in force for an extended period of time. The Cumulative Net Incurred Claim and Allocated Claim Adjustment Expenses tables, reading across, show the cumulative net incurred claim and allocated claim adjustment expenses relating to each accident year at the end of the stated calendar year. Changes in the cumulative amount across time are the result of CNA’s expanded awareness of additional facts and circumstances that pertain to the unsettled claims. The Cumulative Net Paid Claim and Allocated Claim Adjustment Expenses tables, reading across, show the cumulative amount paid for claims in each accident year as of the end of the stated calendar year. The Net Strengthening or (Releases) of Prior Accident Year Reserves tables, reading across, show the net increase or decrease in the cumulative net incurred accident year claim and allocated claim adjustment expenses during each stated calendar year and indicates whether the reserves for that accident year were strengthened or released. The information in the tables is reported on a net basis after reinsurance and does not include unallocated claim and claim adjustment expenses or the effects of discounting. The information contained in the years preceding the current calendar year is unaudited. To the extent CNA enters into a commutation, the transaction is reported on a prospective basis. To the extent that CNA enters into a disposition, the effects of the disposition are reported on a retrospective basis by removing the balances associated with it.

126
Notes to Consolidated Financial Statements Note 8. Claim and Claim Adjustment Expense Reserves – (Continued) The amounts reported for the cumulative number of reported claims include direct and assumed open and closed claims by accident year at the claimant level. The number excludes claim counts for claims within a policy deductible where the insured is responsible for payment of losses in the deductible layer. Claim count data for certain assumed reinsurance contracts is unavailable. In the loss reserve development tables, IBNR includes reserves for incurred but not reported losses and expected development on case reserves. Liability for Unpaid Claim and Claim Adjustment Expenses Rollforward The following table presents a reconciliation between beginning and ending claim and claim adjustment expense reserves, including claim and claim adjustment expense reserves of non-core operations. Year Ended December 31 2016 2015 2014 (In millions) Reserves, beginning of year: Gross $ 22,663 $ 23,271 $ 24,089 Ceded 4,087 4,344 4,972 Net reserves, beginning of year 18,576 18,927 19,117 Change in net reserves due to disposition of subsidiaries (13) Net incurred claim and claim adjustment expenses: Provision for insured events of current year 5,025 4,934 5,043 Decrease in provision for insured events of prior years (342) (255) (36) Amortization of discount 175 166 161 Total net incurred (a) 4,858 4,845 5,168 Net payments attributable to: Current year events (967) (856) (945) Prior year events (4,167) (4,089) (4,355) Total net payments (5,134) (4,945) (5,300) Foreign currency translation adjustment and other (51) (251) (45) Net reserves, end of year 18,249 18,576 18,927 Ceded reserves, end of year 4,094 4,087 4,344 Gross reserves, end of year $ 22,343 $ 22,663 $ 23,271 (a) Total net incurred above does not agree to Insurance claims and policyholders’ benefits as reflected in the Consolidated
Statements of Income due to amounts related to retroactive reinsurance deferred gain accounting, uncollectible reinsurance and loss deductible receivables and benefit expenses related to future policy benefits, which are not reflected in the table above.

127
Notes to Consolidated Financial StatementsNote 8. Claim and Claim Adjustment Expense Reserves – (Continued)
The following tables present the gross and net carried reserves: Property and Casualty Non-Core December 31, 2016 Operations Operations Total (In millions) Gross Case Reserves $ 7,164 $ 4,696 $ 11,860 Gross IBNR Reserves 9,207 1,276 10,483 Total Gross Carried Claim and Claim Adjustment Expense Reserves $ 16,371 $ 5,972 $ 22,343 Net Case Reserves $ 6,582 $ 3,045 $ 9,627 Net IBNR Reserves 8,328 294 8,622 Total Net Carried Claim and Claim Adjustment Expense Reserves $ 14,910 $ 3,339 $ 18,249 December 31, 2015 Gross Case Reserves $ 7,608 $ 4,494 $ 12,102 Gross IBNR Reserves 9,191 1,370 10,561 Total Gross Carried Claim and Claim Adjustment Expense Reserves $ 16,799 $ 5,864 $ 22,663 Net Case Reserves $ 6,992 $ 2,844 $ 9,836 Net IBNR Reserves 8,371 369 8,740 Total Net Carried Claim and Claim Adjustment Expense Reserves $ 15,363 $ 3,213 $ 18,576 Net Prior Year Development Changes in estimates of claim and allocated claim adjustment expense reserves and premium accruals, net of reinsurance, for prior years are defined as net prior year development. These changes can be favorable or unfavorable. Favorable net prior year development of $316 million, $218 million and $50 million was recorded for property and casualty operations for the years ended December 31, 2016, 2015 and 2014. Favorable net prior year development of $43 million, $50 million and $17 million was recorded for non-core operations for the years ended December 31, 2016, 2015 and 2014. The favorable net prior year development for the year ended December 31, 2016 was driven by a reserve release resulting from the annual experience study of long term care reserves which indicated lower than expected claim severity. Premium development can occur in the property and casualty business when there is a change in exposure on auditable policies or when premium accruals differ from processed premium. Audits on policies usually occur in a period after the expiration date of the policy.

128
Notes to Consolidated Financial Statements Note 8. Claim and Claim Adjustment Expense Reserves – (Continued) The following table and discussion presents detail of the net prior year claim and allocated claim adjustment expense reserve development (“development”): Year Ended December 31 2016 2015 2014 (In millions) Medical professional liability $ (37) $ (43) $ 39 Other professional liability and management liability (130) (87) Surety (63) (69) (82) Commercial auto (46) (22) 31 General liability (28) (33) 45 Workers’ compensation 150 80 139 Other (134) (123) (106) Total pretax (favorable) unfavorable development $ (288) $ (210) $ (21) 2016 Favorable development for medical professional liability was primarily due to lower than expected severities for individual health care professionals, allied facilities and hospitals in accident years 2011 and prior and better than expected severity in medical products liability in accident years 2010 through 2015. This was partially offset by unfavorable development in accident years 2012 and 2013 related to higher than expected large loss emergence in hospitals and higher than expected frequency and severity in accident years 2014 and 2015 in the aging services business. Favorable development in other professional liability and management liability was primarily due to favorable settlements on closed claims and lower than expected frequency of claims in accident years 2010 through 2014 related to professional services and financial institutions. This was partially offset by unfavorable development related to a specific financial institutions claim in accident year 2014, higher management liability severities in accident year 2015 and deterioration on credit crises-related claims in accident year 2009. Favorable development in surety coverages was primarily due to lower than expected frequency of large losses in accident years 2014 and prior. Favorable development for commercial auto was primarily due to favorable settlements on claims in accident years 2010 through 2014 and lower than expected severities in accident years 2012 through 2015. Favorable development for general liability was primarily due to better than expected claim settlements in accident years 2012 through 2014 and better than expected severity on umbrella claims in accident years 2010 through 2013. This was partially offset by unfavorable development related to an increase in reported claims prior to the closing of the three year window set forth by the Minnesota Child Victims Act in accident years 2006 and prior. Unfavorable development for workers’ compensation was primarily due to higher than expected severity for Defense Base Act contractors that largely resulted from a reduction of expected future recoveries from the U.S. Department of Labor under the War Hazard Act. Further unfavorable development was due to the impact of recent Florida court rulings for accident years 2008 through 2015. These were partially offset by favorable development related to lower than expected frequencies related to the ongoing Middle Market and Small Business results for accident years 2009 through 2014. 2015 Overall, favorable development for medical professional liability was related to lower than expected severity in accident years 2012 and prior. Unfavorable development was recorded related to increased claim frequency and severity in the aging services business in accident years 2013 and 2014.

129
Notes to Consolidated Financial StatementsNote 8. Claim and Claim Adjustment Expense Reserves – (Continued)
Favorable development in other professional liability and management liability related to better than expected large loss emergence in financial institutions primarily in accident years 2011 through 2014. Additional favorable development related to lower than expected severity for professional services in accident years 2011 and prior. Unfavorable development was recorded related to increased frequency of large claims on public company management liability in accident years 2012 through 2014. Favorable development for surety coverages was primarily due to lower than expected frequency of large losses in accident years 2013 and prior. Favorable development for commercial auto was primarily due to lower than expected severity in accident years 2009 through 2014. Favorable development for general liability was primarily due to favorable settlements on claims in accident years 2010 through 2013. Unfavorable development for workers’ compensation was primarily due to higher than expected severity related to Defense Base Act contractors in accident years 2008 through 2014. 2014 Unfavorable development for medical professional liability was primarily related to increased frequency of large medical products liability class action lawsuits in accident years 2012 and prior and increased frequency of other large medical professional liability losses in accident years 2011 through 2013. Overall, favorable development for other professional liability and management liability was related to better than expected severity in accident years 2008 through 2011, including favorable outcomes on individual large claims. Additional favorable development related to lower than expected frequency in accident years 2011 through 2013. Unfavorable development was recorded due to higher than expected severity in financial institution and professional service coverages in accident years 2009 through 2011. Favorable development for surety coverages was primarily due to better than expected large loss emergence in accident years 2012 and prior. Unfavorable development for commercial auto was primarily related to higher than expected frequency in accident years 2012 and 2013 and higher than expected severity for liability coverages in accident years 2010 through 2013. Favorable development was recorded related to fewer large claims than expected in accident years 2008 and 2009. Overall, unfavorable development for general liability was primarily related to higher than expected severity in accident years 2010 through 2013. Favorable development was recorded primarily related to lower than expected frequency of large losses in accident years 2005 through 2009. Overall, unfavorable development for workers’ compensation was primarily due to increased medical severity in accident years 2010 and prior, higher than expected severity related to Defense Base Act contractors in accident years 2010 through 2013 and the recognition of losses related to favorable premium development in accident year 2013. Favorable development of $26 million was recorded in accident years 1996 and prior related to the commutation of a workers’ compensation reinsurance pool.

130
Notes to Consolidated Financial Statements Note 8. Claim and Claim Adjustment Expense Reserves – (Continued) Property and Casualty Operations – Line of Business Composition The table below presents the net liability for unpaid claim and claim adjustment expenses, by line of business for property and casualty operations: December 31 2016 (In millions) Medical professional liability $ 1,779 Other professional liability and management liability 3,063 Surety 394 Commercial auto 424 General liability 3,248 Workers’ compensation 4,306 Other 1,696 Total net liability for unpaid claim and claim adjustment expenses $ 14,910

131
Notes to Consolidated Financial StatementsNote 8. Claim and Claim Adjustment Expense Reserves – (Continued)
Medical Professional Liability December 31, 2016 Cumulative Net Incurred Claim and Allocated Claim Adjustment Expenses Cumulative Number ofDecember 31 2007 (a) 2008 (a) 2009 (a) 2010 (a) 2011 (a) 2012 (a) 2013 (a) 2014 (a) 2015 (a) 2016 IBNR Claims (In millions, except reported claims data) Accident Year 2007 $ 448 $ 452 $ 444 $ 427 $ 395 $ 391 $ 390 $ 401 $ 399 $ 385 $ 9 12,122 2008 426 451 496 480 468 468 467 455 442 9 14,094 2009 462 469 494 506 480 471 463 432 12 15,573 2010 483 478 478 486 470 446 403 16 15,206 2011 486 492 507 533 501 491 23 17,428 2012 526 529 575 567 559 47 18,375 2013 534 540 560 567 95 19,565 2014 511 548 585 165 19,286 2015 480 539 278 16,798 2016 469 400 11,600 Total $ 4,872 $ 1,054 Cumulative Net Paid Claim and Allocated Claim Adjustment Expenses Accident Year 2007 $ 11 $ 68 $ 134 $ 201 $ 247 $ 296 $ 326 $ 352 $ 364 $ 365 2008 9 90 207 282 332 377 395 409 428 2009 9 75 180 278 328 353 377 396 2010 11 93 186 273 338 361 371 2011 18 121 225 315 379 407 2012 15 121 236 359 428 2013 18 121 259 364 2014 25 149 274 2015 22 105 2016 18 Total $ 3,156
Net liability for unpaid claim and allocated claim adjustment expenses for the accident years presented $ 1,716 Net liability for unpaid claim and claim adjustment expenses for accident years prior to 2007 30
Liability for unallocated claim adjustment expenses for accident years presented 33 Total net liability for unpaid claim and claim adjustment expenses $ 1,779
Net Strengthening or (Releases) of Prior Accident Year Reserves Years Ended December 31 Total Accident Year 2007 $ 4 $ (8) $ (17) $ (32) $ (4) $ (1) $ 11 $ (2) $ (14) $ (63) 2008 25 45 (16) (12) (1) (12) (13) 16 2009 7 25 12 (26) (9) (8) (31) (30) 2010 (5) 8 (16) (24) (43) (80) 2011 6 15 26 (32) (10) 5 2012 3 46 (8) (8) 33 2013 6 20 7 33 2014 37 37 74 2015 59 59
Total net development for the accident years presented above $ 63 $ (29) $ (16) Total net development for accident years prior to 2007 (24) (14) (21)
Total $ 39 $ (43) $ (37) (a) Data presented for these calendar years is required supplemental information, which is unaudited.

132
Notes to Consolidated Financial Statements Note 8. Claim and Claim Adjustment Expense Reserves – (Continued) Other Professional Liability and Management Liability December 31, 2016 Cumulative Net Incurred Claim and Allocated Claim Adjustment Expenses Cumulative Number ofDecember 31 2007 (a) 2008 (a) 2009 (a) 2010 (a) 2011 (a) 2012 (a) 2013 (a) 2014 (a) 2015 (a) 2016 IBNR Claims (In millions, except reported claims data) Accident Year 2007 $ 804 $ 817 $ 806 $ 754 $ 734 $ 724 $ 704 $ 681 $ 662 $ 662 $ 13 16,011 2008 916 933 954 924 915 880 850 845 827 35 16,326 2009 829 873 903 898 891 900 895 903 50 17,263 2010 825 827 850 848 846 836 823 39 17,796 2011 876 904 933 948 944 910 107 18,620 2012 907 894 876 870 833 107 18,228 2013 844 841 879 840 137 17,324 2014 841 859 854 306 16,886 2015 847 851 478 16,391 2016 859 742 15,045 Total $ 8,362 $ 2,014 Cumulative Net Paid Claim and Allocated Claim Adjustment Expenses Accident Year 2007 $ 32 $ 162 $ 307 $ 397 $ 472 $ 524 $ 564 $ 585 $ 593 $ 614 2008 39 181 376 515 600 641 678 719 741 2009 37 195 358 550 638 719 769 798 2010 31 203 404 541 630 670 721 2011 71 313 502 604 682 726 2012 57 248 398 570 648 2013 51 240 426 583 2014 51 212 375 2015 48 209 2016 60 Total $ 5,475
Net liability for unpaid claim and allocated claim adjustment expenses for the accident years presented $ 2,887 Net liability for unpaid claim and claim adjustment expenses for accident years prior to 2007 104
Liability for unallocated claim adjustment expenses for accident years presented 72 Total net liability for unpaid claim and claim adjustment expenses $ 3,063
Net Strengthening or (Releases) of Prior Accident Year Reserves Years Ended December 31 Total Accident Year 2007 $ 13 $ (11) $ (52) $ (20) $ (10) $ (20) $ (23) $ (19) $ (142) 2008 17 21 (30) (9) (35) (30) (5) $ (18) (89) 2009 44 30 (5) (7) 9 (5) 8 74 2010 2 23 (2) (2) (10) (13) (2) 2011 28 29 15 (4) (34) 34 2012 (13) (18) (6) (37) (74) 2013 (3) 38 (39) (4) 2014 18 (5) 13 2015 4 4
Total net development for the accident years presented above $ (52) $ 7 $ (134) Total net development for accident years prior to 2007 (35) (7) 4
Total $ (87) $ - $ (130) (a) Data presented for these calendar years is required supplemental information, which is unaudited.

133
Notes to Consolidated Financial StatementsNote 8. Claim and Claim Adjustment Expense Reserves – (Continued)
Surety December 31, 2016 Cumulative Net Incurred Claim and Allocated Claim Adjustment Expenses Cumulative Number ofDecember 31 2007 (a) 2008 (a) 2009 (a) 2010 (a) 2011 (a) 2012 (a) 2013 (a) 2014 (a) 2015 (a) 2016 IBNR Claims (In millions, except reported claims data) Accident Year 2007 $ 98 $ 107 $ 81 $ 57 $ 59 $ 56 $ 51 $ 49 $ 49 $ 50 6,270 2008 114 114 73 68 61 52 48 45 44 7,153 2009 114 114 103 85 68 59 52 53 $ 1 6,654 2010 112 112 111 84 76 66 63 8 5,943 2011 120 121 116 87 75 70 9 5,760 2012 120 122 98 70 52 16 5,473 2013 120 121 115 106 24 4,890 2014 123 124 94 51 4,737 2015 131 131 100 4,279 2016 124 110 2,902 Total $ 787 $ 319 Cumulative Net Paid Claim and Allocated Claim Adjustment Expenses Accident Year 2007 $ 12 $ 30 $ 40 $ 45 $ 46 $ 46 $ 46 $ 48 $ 49 $ 50 2008 9 27 35 39 42 43 43 43 43 2009 13 24 34 41 43 45 46 47 2010 13 34 50 55 57 58 55 2011 19 42 55 58 60 60 2012 5 32 34 35 35 2013 16 40 69 78 2014 7 30 38 2015 7 26 2016 5 Total $ 437
Net liability for unpaid claim and allocated claim adjustment expenses for the accident years presented $ 350 Net liability for unpaid claim and claim adjustment expenses for accident years prior to 2007 16
Liability for unallocated claim adjustment expenses for accident years presented 28 Total net liability for unpaid claim and claim adjustment expenses $ 394
Net Strengthening or (Releases) of Prior Accident Year Reserves Years Ended December 31 Total Accident Year 2007 $ 9 $ (26) $ (24) $ 2 $ (3) $ (5) $ (2) $ 1 $ (48) 2008 (41) (5) (7) (9) (4) $ (3) (1) (70) 2009 (11) (18) (17) (9) (7) 1 (61) 2010 (1) (27) (8) (10) (3) (49) 2011 1 (5) (29) (12) (5) (50) 2012 2 (24) (28) (18) (68) 2013 1 (6) (9) (14) 2014 1 (30) (29) 2015
Total net development for the accident years presented above $ (75) $ (65) $ (64) Total net development for accident years prior to 2007 (7) (4) 1
Total $ (82) $ (69) $ (63) (a) Data presented for these calendar years is required supplemental information, which is unaudited.

134
Notes to Consolidated Financial Statements Note 8. Claim and Claim Adjustment Expense Reserves – (Continued) Commercial Auto December 31, 2016 Cumulative Net Incurred Claim and Allocated Claim Adjustment Expenses Cumulative Number ofDecember 31 2007 (a) 2008 (a) 2009 (a) 2010 (a) 2011 (a) 2012 (a) 2013 (a) 2014 (a) 2015 (a) 2016 IBNR Claims (In millions, except reported claims data) Accident Year 2007 $ 348 $ 367 $ 368 $ 360 $ 355 $ 358 $ 356 $ 355 $ 354 $ 352 67,473 2008 322 323 316 306 309 305 298 298 296 56,407 2009 287 272 274 278 281 277 275 272 47,325 2010 262 274 279 283 291 286 281 $ 1 46,324 2011 262 273 279 293 290 285 5 46,676 2012 270 282 292 296 300 11 45,279 2013 242 259 257 241 20 38,513 2014 231 221 210 40 32,958 2015 199 197 65 29,714 2016 196 105 25,196 Total $ 2,630 $ 247 Cumulative Net Paid Claim and Allocated Claim Adjustment Expenses Accident Year 2007 $ 93 $ 185 $ 250 $ 295 $ 329 $ 340 $ 348 $ 349 $ 350 $ 351 2008 83 158 210 244 274 289 291 292 293 2009 72 128 188 229 257 269 270 270 2010 72 137 197 240 265 274 279 2011 78 141 193 241 264 275 2012 77 157 214 253 276 2013 73 132 164 195 2014 63 100 135 2015 52 95 2016 51 Total $ 2,220
Net liability for unpaid claim and allocated claim adjustment expenses for the accident years presented $ 410 Net liability for unpaid claim and claim adjustment expenses for accident years prior to 2007 4
Liability for unallocated claim adjustment expenses for accident years presented 10 Total net liability for unpaid claim and claim adjustment expenses $ 424
Net Strengthening or (Releases) of Prior Accident Year Reserves Years Ended December 31 Total Accident Year 2007 $ 19 $ 1 $ (8) $ (5) $ 3 $ (2) $ (1) $ (1) $ (2) $ 4 2008 1 (7) (10) 3 (4) (7) (2) (26) 2009 (15) 2 4 3 (4) (2) (3) (15) 2010 12 5 4 8 (5) (5) 19 2011 11 6 14 (3) (5) 23 2012 12 10 4 4 30 2013 17 (2) (16) (1) 2014 (10) (11) (21) 2015 (2) (2)
Total net development for the accident years presented above $ 37 $ (19) $ (42) Total net development for accident years prior to 2007 (6) (3) (4)
Total $ 31 $ (22) $ (46) (a) Data presented for these calendar years is required supplemental information, which is unaudited.

135
Notes to Consolidated Financial StatementsNote 8. Claim and Claim Adjustment Expense Reserves – (Continued)
General Liability December 31, 2016 Cumulative Net Incurred Claim and Allocated Claim Adjustment Expenses Cumulative Number ofDecember 31 2007 (a) 2008 (a) 2009 (a) 2010 (a) 2011 (a) 2012 (a) 2013 (a) 2014 (a) 2015 (a) 2016 IBNR Claims (In millions, except reported claims data) Accident Year 2007 $ 774 $ 673 $ 678 $ 639 $ 610 $ 600 $ 559 $ 545 $ 548 $ 540 $ 28 53,553 2008 611 604 630 647 633 632 613 600 591 18 44,586 2009 591 637 634 633 629 623 619 622 16 43,955 2010 566 597 599 649 695 675 659 25 43,378 2011 537 534 564 610 611 621 41 38,101 2012 539 563 579 570 558 63 34,037 2013 615 645 634 643 142 32,897 2014 627 634 635 224 26,744 2015 573 574 330 21,687 2016 622 495 16,720 Total $ 6,065 $ 1,382 Cumulative Net Paid Claim and Allocated Claim Adjustment Expenses Accident Year 2007 $ 30 $ 130 $ 236 $ 328 $ 413 $ 458 $ 481 $ 492 $ 497 $ 504 2008 31 129 261 390 473 528 550 560 567 2009 33 112 270 392 486 532 557 584 2010 27 139 267 414 530 577 608 2011 27 135 253 389 484 534 2012 27 127 233 340 417 2013 33 135 257 377 2014 29 115 245 2015 31 132 2016 34 Total $ 4,002
Net liability for unpaid claim and allocated claim adjustment expenses for the accident years presented $ 2,063 Net liability for unpaid claim and claim adjustment expenses for accident years prior to 2007 1,130
Liability for unallocated claim adjustment expenses for accident years presented 55 Total net liability for unpaid claim and claim adjustment expenses $ 3,248
Net Strengthening or (Releases) of Prior Accident Year Reserves Years Ended December 31 Total Accident Year 2007 $ (101) $ 5 $ (39) $ (29) $ (10) $ (41) $ (14) $ 3 $ (8) $ (234) 2008 (7) 26 17 (14) (1) (19) (13) (9) (20) 2009 46 (3) (1) (4) (6) (4) 3 31 2010 31 2 50 46 (20) (16) 93 2011 (3) 30 46 1 10 84 2012 24 16 (9) (12) 19 2013 30 (11) 9 28 2014 7 1 8 2015 1 1
Total net development for the accident years presented above $ 99 $ (46) $ (21) Total net development for accident years prior to 2007 (54) 13 (7)
Total $ 45 $ (33) $ (28) (a) Data presented for these calendar years is required supplemental information, which is unaudited.

136
Notes to Consolidated Financial Statements Note 8. Claim and Claim Adjustment Expense Reserves – (Continued) Workers’ Compensation December 31, 2016 Cumulative Net Incurred Claim and Allocated Claim Adjustment Expenses Cumulative Number ofDecember 31 2007 (a) 2008 (a) 2009 (a) 2010 (a) 2011 (a) 2012 (a) 2013 (a) 2014 (a) 2015 (a) 2016 IBNR Claims (In millions, except reported claims data) Accident Year 2007 $ 568 $ 580 $ 596 $ 604 $ 603 $ 603 $ 604 $ 610 $ 608 $ 627 $ 32 71,049 2008 558 575 593 606 608 612 622 630 638 36 59,883 2009 583 587 594 596 600 611 617 625 46 51,111 2010 576 619 641 663 683 697 717 45 48,056 2011 593 628 637 648 642 666 52 44,571 2012 589 616 648 661 671 86 41,683 2013 528 563 584 610 121 38,102 2014 459 474 474 157 32,996 2015 416 426 206 31,296 2016 421 287 27,042 Total $ 5,875 $ 1,068 Cumulative Net Paid Claim and Allocated Claim Adjustment Expenses Accident Year 2007 $ 100 $ 246 $ 337 $ 390 $ 429 $ 471 $ 502 $ 522 $ 533 $ 535 2008 92 233 323 381 425 461 489 505 520 2009 88 223 315 381 435 468 495 516 2010 94 245 352 433 500 531 565 2011 97 245 353 432 471 515 2012 86 229 338 411 465 2013 79 211 297 366 2014 60 157 213 2015 50 130 2016 52 Total $ 3,877
Net liability for unpaid claim and allocated claim adjustment expenses for the accident years presented $ 1,998 Net liability for unpaid claim and claim adjustment expenses for accident years prior to 2007 2,334
Other (b) (30) Liability for unallocated claim adjustment expenses for accident years presented 4
Total net liability for unpaid claim and claim adjustment expenses $ 4,306 (b) Other includes the effect of discounting lifetime claim reserves. Net Strengthening or (Releases) of Prior Accident Year Reserves Years Ended December 31 Total Accident Year 2007 $ 12 $ 16 $ 8 $ (1) $ 1 $ 6 $ (2) $ 19 $ 59 2008 17 18 13 $ 2 4 10 8 8 80 2009 4 7 2 4 11 6 8 42 2010 43 22 22 20 14 20 141 2011 35 9 11 (6) 24 73 2012 27 32 13 10 82 2013 35 21 26 82 2014 15 15 2015 10 10
Total net development for the accident years presented above $ 125 $ 69 $ 125 Adjustment for development on a discounted basis 1 (4) 1
Total net development for accident years prior to 2007 13 15 24 Total $ 139 $ 80 $ 150
(a) Data presented for these calendar years is required supplemental information, which is unaudited.
137
Notes to Consolidated Financial StatementsNote 8. Claim and Claim Adjustment Expense Reserves – (Continued)
The table below reconciles the net liability for unpaid claim and claim adjustment expenses for property and casualty operations to the amount presented in the Consolidated Balance Sheets. As of December 31, 2016 (In millions) Net liability for unpaid claim and claim adjustment expenses Property and casualty operations $ 14,910 Non-core operations (a) 3,339 Total net claim and claim adjustment expenses 18,249 Reinsurance receivables (b) Property and casualty operations 1,461 Non-core operations 2,633 Total reinsurance receivables 4,094 Total gross liability for unpaid claims and claims adjustment expenses $ 22,343 (a) Non-core operations include amounts primarily related to long term care claim reserves, which are long duration insurance
contracts, but also include amounts related to unfunded structured settlements arising from short duration insurancecontracts.
(b) Reinsurance receivables presented do not include reinsurance receivables related to paid losses. The table below presents information about average historical claims duration as of December 31, 2016 and is presented as required supplementary information, which is unaudited. Average Annual Percentage Payout of Ultimate Net Incurred Claim and Allocated Claim Adjustment Expenses in Year: 1 2 3 4 5 6 7 8 9 10 Total Medical professional liability 3.1% 18.2% 22.3% 19.6% 12.7% 8.0% 5.0% 4.8% 3.7% 0.3% 97.7%Other professional liability and management liability 5.7% 20.6% 21.0% 17.0% 10.0% 6.3% 5.6% 3.8% 1.9% 3.2% 95.1%Surety (a) 23.4% 32.8% 20.2% 8.9% 3.7% 1.5% (0.7)% 2.0% 1.0% 2.0% 94.8%Commercial auto 27.2% 23.1% 18.3% 13.9% 9.1% 3.9% 1.3% 0.2% 0.3% 0.3% 97.6%General liability 5.0% 16.3% 20.5% 20.1% 15.3% 8.0% 4.2% 2.7% 1.1% 1.3% 94.5%Workers’ compensation 13.5% 21.4% 14.6% 10.5% 7.5% 5.7% 4.6% 3.0% 2.1% 0.3% 83.2% (a) Due to the nature of the Surety business, average annual percentage payout of ultimate net incurred claim and allocated claim adjustment
expenses has been calculated using only the payouts of mature accident years presented in the loss reserve development tables. A&EP Reserves In 2010, Continental Casualty Company (“CCC”) together with several of CNA’s insurance subsidiaries completed a transaction with National Indemnity Company (“NICO”), a subsidiary of Berkshire Hathaway Inc., under which substantially all of CNA’s legacy A&EP liabilities were ceded to NICO (“loss portfolio transfer” or “LPT”). At the effective date of the transaction, CNA ceded approximately $1.6 billion of net A&EP claim and allocated claim adjustment expense reserves to NICO under a retroactive reinsurance agreement with an aggregate limit of $4.0 billion. The $1.6 billion of claim and allocated claim adjustment expense reserves ceded to NICO was net of $1.2 billion of ceded claim and allocated claim adjustment expense reserves under existing third party reinsurance contracts. The NICO LPT aggregate reinsurance limit also covers credit risk on the existing third party reinsurance related to these liabilities. CNA paid NICO a reinsurance premium of $2.0 billion and transferred to NICO billed third party reinsurance receivables related to A&EP claims with a net book value of $215 million, resulting in total consideration of $2.2 billion. Subsequent to the effective date of the LPT, CNA recognized adverse prior year development on its A&EP reserves which resulted in additional amounts ceded under the LPT. As a result, the cumulative amounts ceded under the LPT exceeded the $2.2 billion consideration paid, resulting in the NICO LPT moving into a gain position, requiring retroactive reinsurance accounting. Under retroactive reinsurance accounting, this gain is deferred and only recognized in earnings in proportion to actual paid recoveries under the LPT. Over the life of the contract, there is no economic impact as long as any additional losses incurred are within the limit of the LPT. In a period in which

138
Notes to Consolidated Financial Statements Note 8. Claim and Claim Adjustment Expense Reserves – (Continued) CNA recognizes a change in the estimate of A&EP reserves that increases the amounts ceded under the LPT, the proportion of actual paid recoveries to total ceded losses is impacted and the change in the deferred gain is recognized in earnings as if the revised estimate of ceded losses was available at the effective date of the LPT. The effect of the deferred retroactive reinsurance benefit is recorded in Insurance claims and policyholders’ benefits in the Consolidated Statements of Income. The following table presents the impact of the loss portfolio transfer on the Consolidated Statements of Income. Year Ended December 31 2016 2015 2014 (In millions) Net A&EP adverse development before consideration of LPT $ 200 $ 150 $ - Retroactive reinsurance benefit recognized (107) (85) (13) Pretax impact of A&EP reserve development and the LPT $ 93 $ 65 $ (13) Based upon CNA’s 2016 A&EP reserve review, net unfavorable prior year development of $200 million was recognized before consideration of cessions to the LPT. The unfavorable development was driven by an increase in anticipated future expenses associated with determination of coverage, higher anticipated payouts associated with a limited number of historical accounts having significant asbestos exposures and higher than expected severity on pollution claims. An A&EP reserve review was not completed in 2014 because additional information and analysis on inuring third-party reinsurance recoveries were needed to finalize the review. The review was finalized in the second quarter of 2015 and management has adopted the first quarter of the year as the timing for all future annual A&EP claims actuarial reviews, subject to the timing of the corresponding review performed by NICO. Unfavorable development of $150 million was recorded in 2015 to reflect a decrease in anticipated future reinsurance recoveries related to asbestos claims and higher than expected severity on pollution claims. While this unfavorable development was ceded to NICO in 2016 and 2015 under the LPT, CNA’s reported earnings in both periods were negatively affected due to the application of retroactive reinsurance accounting. As of December 31, 2016 and 2015, the cumulative amounts ceded under the LPT were $2.8 billion and $2.6 billion. The unrecognized deferred retroactive reinsurance benefit was $334 million and $241 million as of December 31, 2016 and 2015. NICO established a collateral trust account as security for its obligations to CNA. The fair value of the collateral trust account was $2.8 billion as of December 31, 2016 and 2015. In addition, Berkshire Hathaway Inc. guaranteed the payment obligations of NICO up to the aggregate reinsurance limit as well as certain of NICO’s performance obligations under the trust agreement. NICO is responsible for claims handling and billing and collection from third-party reinsurers related to CNA’s A&EP claims. Note 9. Leases Leases primarily cover office facilities, machinery and computer equipment. Hotel properties, in some instances, are constructed on leased land. Rent expense amounted to $97 million, $85 million and $94 million for the years ended December 31, 2016, 2015 and 2014. The table below presents the future minimum lease payments to be made under non-cancelable operating leases along with lease and sublease minimum receipts to be received on owned and leased properties. Future Minimum Lease Year Ended December 31 Payments Receipts (In millions) 2017 $ 72 $ 5 2018 59 5 2019 51 4 2020 54 4 2021 53 4 Thereafter 349 19 Total $ 638 $ 41

139
Notes to Consolidated Financial StatementsNote 9. Leases – (Continued)
In connection with the planned relocation of CNA’s global headquarters, in 2016, CNA sold the building in which it maintains its current principal executive offices. Concurrently, CNA leased back the current office space until the relocation of the global headquarters, which is expected to occur in 2018. The sale-leaseback arrangement includes expected future minimum lease payments of $10 million in 2017 and $4 million in 2018. Note 10. Income Taxes The Company and its eligible subsidiaries file a consolidated federal income tax return. The Company has entered into a separate tax allocation agreement with CNA, a majority-owned subsidiary in which its ownership exceeds 80%. The agreement provides that the Company will: (i) pay to CNA the amount, if any, by which the Company’s consolidated federal income tax is reduced by virtue of inclusion of CNA in the Company’s return or (ii) be paid by CNA an amount, if any, equal to the federal income tax that would have been payable by CNA if it had filed a separate consolidated return. The agreement may be canceled by either of the parties upon thirty days written notice. For 2014 through 2016, the Internal Revenue Service (“IRS”) has accepted the Company into the Compliance Assurance Process (“CAP”), which is a voluntary program for large corporations. Under CAP, the IRS conducts a real-time audit and works contemporaneously with the Company to resolve any issues prior to the filing of the tax return. The Company believes this approach should reduce tax-related uncertainties, if any. Although the outcome of tax audits is always uncertain, the Company believes that any adjustments resulting from audits will not have a material impact on its results of operations, financial position and cash flows. The Company and/or its subsidiaries also file income tax returns in various state, local and foreign jurisdictions. These returns, with few exceptions, are no longer subject to examination by the various taxing authorities before 2012. Diamond Offshore, which is not included in the Company’s consolidated federal income tax return, files income tax returns in the U.S. federal and various state and foreign jurisdictions. Tax years that remain subject to examination by these jurisdictions include years 2009 to 2016. The 2013 federal income tax return is under examination. The current and deferred components of income tax expense (benefit) are as follows: Year Ended December 31 2016 2015 2014 (In millions) Income tax expense (benefit): Federal: Current $ 71 $ 79 $ 370 Deferred 102 (234) (23) State and city: Current 13 21 12 Deferred 13 5 6 Foreign 21 86 92 Total $ 220 $ (43) $ 457

140
Notes to Consolidated Financial Statements Note 10. Income Taxes – (Continued) The components of U.S. and foreign income before income tax and a reconciliation between the federal income tax expense at statutory rates and the actual income tax expense (benefit) is as follows: Year Ended December 31 2016 2015 2014 (In millions) Income before income tax: U.S. $ 1,207 $ 543 $ 1,499 Foreign (271) (299) 311 Total $ 936 $ 244 $ 1,810 Income tax expense at statutory rate $ 328 $ 86 $ 633 Increase (decrease) in income tax expense resulting from: Exempt investment income (126) (126) (121) Foreign related tax differential 40 (18) (48) Amortization of deferred charges associated with intercompany rig sales to other tax jurisdictions 38 44 Taxes related to domestic affiliate (14) (10) 14 Partnership earnings not subject to taxes (52) (38) (39) Allowance for foreign tax credits 62 Unrecognized tax positions, including foreign currency revaluation (42) 1 (42) Other (a) 24 24 16 Income tax expense (benefit) $ 220 $ (43) $ 457 (a) Includes state and local taxes, adjustments to prior year estimates and other non-deductible expenses. Provision has been made for the expected U.S. federal income tax liabilities applicable to undistributed earnings of subsidiaries, except for certain subsidiaries for which the Company intends to invest the undistributed earnings indefinitely to finance foreign activities, or recover such undistributed earnings tax-free. The determination of the amount of the unrecognized deferred tax liability on approximately $1.8 billion of undistributed earnings related to foreign subsidiaries is not practicable. A reconciliation of the beginning and ending amount of unrecognized tax benefits, excluding tax carryforwards and interest and penalties, is as follows: Year Ended December 31 2016 2015 2014 (In millions) Balance at January 1 $ 54 $ 57 $ 91 Additions for tax positions related to the current year 4 7 6 Additions for tax positions related to a prior year 1 Reductions for tax positions related to a prior year (20) (3) (35) Lapse of statute of limitations (4) (7) (5) Balance at December 31 $ 35 $ 54 $ 57 The $20 million in reductions for tax positions related to a prior year is primarily from the devaluation of the Egyptian pound. At December 31, 2016, 2015 and 2014, $36 million, $49 million and $51 million of unrecognized tax benefits related to Diamond Offshore would affect the effective tax rate if recognized. The Company recognizes interest accrued related to: (i) unrecognized tax benefits in Interest expense and (ii) tax refund claims in Other revenues on the Consolidated Statements of Income. The Company recognizes penalties in Income tax expense on the Consolidated Statements of Income. Interest amounts recorded by the Company were insignificant for the years ended December 31, 2016, 2015 and 2014. The Company recorded income tax benefit of $23 million and $22 million for the years ended December 31, 2016 and 2014 and income tax expense of $2 million for the year ended December 31, 2015 related to penalties. The $23 million reduction in penalties related to uncertain tax positions results primarily from the devaluation of the Egyptian pound.

141
Notes to Consolidated Financial StatementsNote 10. Income Taxes – (Continued)
During 2014, Diamond Offshore settled certain disputes for the years 2006 through 2008 with the Egyptian tax authorities, resulting in a net reduction to income tax expense of $17 million. One issue for the 2006 through 2008 period remains open, which Diamond Offshore appealed. The court case is currently pending. Diamond Offshore has sought assistance from an agency of the U.S. Treasury Department, pursuant to international tax treaties and continues to believe that its position will, more likely than not, be sustained. However, if Diamond Offshore’s position is not sustained, tax expense and related penalties would increase by approximately $22 million related to this issue for the 2006 through 2008 tax years as of December 31, 2016. The following table summarizes deferred tax assets and liabilities: December 31 2016 2015 (In millions) Deferred tax assets: Insurance reserves: Property and casualty claim and claim adjustment expense reserves $ 125 $ 178 Unearned premium reserves 206 230 Receivables 26 30 Employee benefits 407 419 Life settlement contracts 56 48 Deferred retroactive reinsurance benefit 117 84 Net operating loss carryforwards 178 245 Tax credit carryforwards 289 131 Basis differential in investment in subsidiary 17 19 Other 246 282 Total deferred tax assets 1,667 1,666 Valuation allowance (210) (147) Net deferred tax assets 1,457 1,519 Deferred tax liabilities: Deferred acquisition costs (120) (117) Net unrealized gains (295) (166) Property, plant and equipment (1,019) (998) Basis differential in investment in subsidiary (409) (428) Other liabilities (235) (173) Total deferred tax liabilities (2,078) (1,882) Net deferred tax liabilities (a) $ (621) $ (363) (a) Includes $15 and $19 of deferred tax assets reflected in Other assets in the Consolidated Balance Sheets at December 31,
2016 and 2015. Federal net operating loss carryforwards of $76 million expire in 2034 and 2036. Net operating loss carryforwards in foreign tax jurisdictions of $59 million expire between 2020 and 2025 and $36 million can be carried forward indefinitely. Federal tax credit carryforwards of $157 million have indefinite lives and $98 million of foreign tax credit carryforwards expire between 2024 and 2026. Diamond Offshore intends to carryback foreign tax credits of $33 million to prior years, which otherwise will expire between 2021 and 2023. Although realization of deferred tax assets is not assured, management believes it is more likely than not that the recognized deferred tax assets will be realized through recoupment of ordinary and capital taxes paid in prior carryback years and through future earnings, reversal of existing temporary differences and available tax planning strategies. As of December 31, 2016, Diamond Offshore recorded a valuation allowance of $210 million related to net operating losses of $91 million, foreign tax credits of $62 million, and other deferred tax assets of $57 million.

142
Notes to Consolidated Financial Statements Note 11. Debt December 31 2016 2015 (In millions) Loews Corporation (Parent Company): Senior: 5.3% notes due 2016 (effective interest rate of 5.4%) (authorized, $400) $ 400 2.6% notes due 2023 (effective interest rate of 2.8%) (authorized, $500) $ 500 500 3.8% notes due 2026 (effective interest rate of 3.9%) (authorized, $500) 500 6.0% notes due 2035 (effective interest rate of 6.2%) (authorized, $300) 300 300 4.1% notes due 2043 (effective interest rate of 4.3%) (authorized, $500) 500 500 CNA Financial: Senior: 6.5% notes due 2016 (effective interest rate of 6.6%) (authorized, $350) 350 7.0% notes due 2018 (effective interest rate of 7.1%) (authorized, $150) 150 150 7.4% notes due 2019 (effective interest rate of 7.5%) (authorized, $350) 350 350 5.9% notes due 2020 (effective interest rate of 6.0%) (authorized, $500) 500 500 5.8% notes due 2021 (effective interest rate of 5.9%) (authorized, $400) 400 400 7.3% debentures due 2023 (effective interest rate of 7.3%) (authorized, $250) 243 243 4.0% notes due 2024 (effective interest rate of 4.0%) (authorized, $550) 550 550 4.5% notes due 2026 (effective interest rate of 4.5%) (authorized, $500) 500 Variable rate note due 2036 (effective interest rate of 4.3% and 3.8%) 30 30 Capital lease obligation 5 4 Diamond Offshore: Senior: Commercial paper (weighted average interest rate of 0.9%) 287 Variable rate revolving credit facility due 2020 (effective interest rate of 1.9%) 104 5.9% notes due 2019 (effective interest rate of 6.0%) (authorized, $500) 500 500 3.5% notes due 2023 (effective interest rate of 3.6%) (authorized, $250) 250 250 5.7% notes due 2039 (effective interest rate of 5.8%) (authorized, $500) 500 500 4.9% notes due 2043 (effective interest rate of 5.0%) (authorized, $750) 750 750 Boardwalk Pipeline: Senior: Variable rate revolving credit facility due 2021 (effective interest rate of 2.0% and 1.7%) 180 375 5.9% notes due 2016 (effective interest rate of 6.0%) (authorized, $250) 250 5.5% notes due 2017 (effective interest rate of 5.6%) (authorized, $300) 300 300 6.3% notes due 2017 (effective interest rate of 6.4%) (authorized, $275) 275 275 5.2% notes due 2018 (effective interest rate of 5.4%) (authorized, $185) 185 185 5.8% notes due 2019 (effective interest rate of 5.9%) (authorized, $350) 350 350 4.5% notes due 2021 (effective interest rate of 5.0%) (authorized, $440) 440 440 4.0% notes due 2022 (effective interest rate of 4.4%) (authorized, $300) 300 300 3.4% notes due 2023 (effective interest rate of 3.5%) (authorized, $300) 300 300 5.0% notes due 2024 (effective interest rate of 5.2%) (authorized, $600 and $350) 600 600 6.0% notes due 2026 (effective interest rate of 6.2%) (authorized, $550) 550 7.3% debentures due 2027 (effective interest rate of 8.1%) (authorized, $100) 100 100 Capital lease obligation 9 10 Loews Hotels: Senior debt, principally mortgages (effective interest rates approximate 4.1%) 650 598 10,871 10,647 Less unamortized discount and issuance costs 93 87 Debt $ 10,778 $ 10,560

143
Notes to Consolidated Financial StatementsNote 11. Debt – (Continued)
Unamortized Discount and Issuance Short Term Long TermDecember 31, 2016 Principal Costs Net Debt Debt (In millions) Loews Corporation $ 1,800 $ 25 $ 1,775 $ 1,775 CNA Financial 2,728 13 2,715 $ 2 2,713 Diamond Offshore 2,104 19 2,085 104 1,981 Boardwalk Pipeline 3,589 31 3,558 1 3,557 Loews Hotels 650 5 645 3 642 Total $ 10,871 $ 93 $ 10,778 $ 110 $ 10,668 At December 31, 2016, the aggregate long term debt maturing in each of the next five years is approximately as follows: $110 million in 2017, $534 million in 2018, $1.3 billion in 2019, $550 million in 2020, $1.6 billion in 2021, and $6.8 billion thereafter. Long term debt is generally redeemable in whole or in part at the greater of the principal amount or the net present value of remaining scheduled payments discounted at the specified treasury rate plus a margin. CNA Financial CNA is a member of the Federal Home Loan Bank of Chicago (“FHLBC”). FHLBC membership provides participants with access to additional sources of liquidity through various programs and services. As a requirement of membership in the FHLBC, CNA held $5 million of FHLBC stock as of December 31, 2016, giving it access to approximately $111 million of additional liquidity. As of December 31, 2016 and 2015, CNA had no outstanding borrowings from the FHLBC. In the first quarter of 2016, CNA completed a public offering of $500 million aggregate principal amount of 4.5% senior notes due March 1, 2026 and used the net proceeds to repay the entire $350 million outstanding principal amount of its 6.5% senior notes due August 15, 2016. CNA has a five-year $250 million senior unsecured revolving credit facility with a syndicate of banks which may be used for general corporate purposes. At CNA’s election, the commitments under the credit agreement may be increased from time to time up to an additional aggregate amount of $100 million and the credit agreement includes two optional one-year extensions prior to the first and second anniversary of the closing date, subject to applicable consents. As of December 31, 2016 and 2015, there were no outstanding borrowings under the credit agreements and CNA was in compliance with all covenants. Diamond Offshore In the first quarter of 2016, Diamond Offshore cancelled its commercial paper program and repaid $287 million in commercial paper outstanding at December 31, 2015 with proceeds from borrowings under its revolving credit agreement. Diamond Offshore has a $1.5 billion senior unsecured revolving credit facility that matures in October of 2020, except for $40 million of commitments that mature in March of 2019 and $60 million of commitments that mature in October of 2019. In addition, Diamond Offshore also has the option to increase the revolving commitments under the revolving credit facility by up to an additional $500 million from time to time, upon receipt of additional commitments from new or existing lenders, and to request one additional one-year extension of the maturity date. Up to $250 million of the facility may be used for the issuance of performance or other standby letters of credit and up to $100 million may be used for swingline loans.
144
Notes to Consolidated Financial Statements Note 11. Debt – (Continued) Boardwalk Pipeline In May of 2016, Boardwalk Pipeline completed a public offering of $550 million aggregate principal amount of 6.0% senior notes due June 1, 2026 and used the proceeds to reduce borrowings under its revolving credit facility. In November of 2016, the outstanding aggregate principal amount of the 5.9% senior notes was retired with borrowings under its revolving credit facility. In January of 2017, Boardwalk Pipeline completed a public offering of $500 million aggregate principal amount of 4.5% senior notes due July 15, 2027 and will use the proceeds to refinance future maturities of debt and to fund growth capital expenditures. Initially, the proceeds were used to reduce outstanding borrowings under its revolving credit facility. Boardwalk Pipeline has a revolving credit facility having aggregate lending commitments of $1.5 billion. During the third quarter of 2016, Boardwalk Pipeline extended the maturity date of the revolving credit facility by one year to May 26, 2021. Boardwalk Pipeline has in place a subordinated loan agreement with a subsidiary of the Company under which it can borrow up to $300 million until December 31, 2018. Boardwalk Pipeline had no outstanding borrowings under the subordinated loan agreement. Loews Corporation In March of 2016, the Company completed a public offering of $500 million aggregate principal amount of 3.8% senior notes due April 1, 2026 and repaid in full the entire $400 million aggregate principal amount of its 5.3% senior notes at maturity.

Not
es to
Con
solid
ated
Fin
anci
al S
tate
men
ts
N
ote
12.
Shar
ehol
ders
’ Equ
ity
Acc
umul
ated
oth
er c
ompr
ehen
sive
inco
me
Th
e ta
bles
bel
ow d
ispl
ay th
e ch
ange
s in
AO
CI b
y co
mpo
nent
for t
he y
ears
end
ed D
ecem
ber 3
1, 2
014,
201
5 an
d 20
16:
Tota
l
Acc
umul
ated
OTT
I U
nrea
lized
Fore
ign
Oth
er
G
ains
G
ains
(Los
ses)
D
isco
ntin
ued
Cas
h Fl
ow
Pens
ion
Cur
renc
y C
ompr
ehen
sive
(L
osse
s)
on In
vest
men
tsO
pera
tions
H
edge
s Li
abili
ty
Tran
slat
ion
Inco
me
(Los
s)
(In
mill
ions
)
Bal
ance
, Jan
uary
1, 2
014
$
23
$
622
$
(3)
$
(4)
$
(432
)
$ 13
3
$ 33
9 Sa
le o
f sub
sidi
arie
s
(5
)
(1
5)
20
Oth
er c
ompr
ehen
sive
inco
me
(loss
) bef
ore
recl
assi
ficat
ions
,
afte
r tax
of $
(8),
$(13
2), $
(3),
$1, $
132
and
$0
15
295
2
(2
)
(2
44)
(94)
(2
8)
Rec
lass
ifica
tion
of (g
ains
) los
ses f
rom
acc
umul
ated
oth
er
c
ompr
ehen
sive
inco
me,
afte
r tax
of $
0, $
10, $
16, $
0,
$
(7) a
nd $
0
(28)
(2
1)
(1)
9
(41)
O
ther
com
preh
ensi
ve in
com
e (lo
ss)
15
267
(19)
(3
)
(2
35)
(94)
(6
9)
Am
ount
s attr
ibut
able
to n
onco
ntro
lling
inte
rest
s
(1
)
(2
8)
2
1
26
10
10
Bal
ance
, Dec
embe
r 31,
201
4
32
84
6
-
(6)
(641
)
49
28
0 O
ther
com
preh
ensi
ve lo
ss b
efor
e re
clas
sific
atio
ns,
a
fter t
ax o
f $13
, $31
3, $
0, $
1, $
16 a
nd $
0
(2
3)
(600
)
(2)
(31)
(1
39)
(795
) R
ecla
ssifi
catio
n of
loss
es fr
om a
ccum
ulat
ed o
ther
com
preh
ensi
ve in
com
e, a
fter t
ax o
f $(8
), $(
31),
$0, $
(2),
$
(11)
and
$0
14
43
7
13
77
O
ther
com
preh
ensi
ve in
com
e (lo
ss)
(9)
(557
)
-
5
(1
8)
(139
)
(7
18)
Issu
ance
of e
quity
secu
ritie
s by
subs
idia
ry
1
1 A
mou
nts a
ttrib
utab
le to
non
cont
rolli
ng in
tere
sts
1
58
(2)
9
14
80
B
alan
ce, D
ecem
ber 3
1, 2
015
24
347
-
(3
)
(6
49)
(76)
(3
57)
Oth
er c
ompr
ehen
sive
inco
me
(loss
) bef
ore
recl
assi
ficat
ions
,
aft
er ta
x of
$(4
), $(
133)
, $0,
$0,
$9
and
$0
9
28
3
(2
2)
(114
)
15
6 R
ecla
ssifi
catio
n of
(gai
ns) l
osse
s fro
m a
ccum
ulat
ed o
ther
com
preh
ensi
ve in
com
e, a
fter
tax
of $
3, $
16, $
0, $
0,
$
(15)
and
$0
(6)
(26)
2
27
(3)
Oth
er c
ompr
ehen
sive
inco
me
(loss
)
3
257
-
2
5
(1
14)
153
Am
ount
s att
ribu
tabl
e to
non
cont
rolli
ng in
tere
sts
(2
8)
(1
)
(2
)
12
(1
9)
Bal
ance
, Dec
embe
r 31
, 201
6
$ 27
$ 57
6
$ -
$
(2)
$
(646
)
$ (1
78)
$
(223
)
145

146
Notes to Consolidated Financial Statements Note 12. Shareholders’ Equity – (Continued) Amounts reclassified from AOCI shown above are reported in Net income as follows: Major Category of AOCI Affected Line Item OTTI gains (losses) Investment gains (losses) Unrealized gains (losses) on investments Investment gains (losses) Unrealized gains (losses) and cash flow hedges related to Discontinued operations, net discontinued operations Cash flow hedges Other revenues and Contract drilling expenses Pension liability Other operating expenses Common Stock Dividends Dividends of $0.25 per share on the Company’s common stock were declared and paid in 2016, 2015 and 2014. There are no restrictions on the Company’s retained earnings or net income with regard to payment of dividends. However, as a holding company, Loews relies upon invested cash balances and distributions from its subsidiaries to generate the funds necessary to declare and pay any dividends to holders of its common stock. The ability of the Company’s subsidiaries to pay dividends is subject to, among other things, the availability of sufficient earnings and funds in such subsidiaries, compliance with covenants in their respective credit agreements and applicable state laws, including in the case of the insurance subsidiaries of CNA, laws and rules governing the payment of dividends by regulated insurance companies. See Note 13 for a discussion of the regulatory restrictions on CNA’s availability to pay dividends. Subsidiary Equity Transactions The Company purchased 0.3 million shares of CNA common stock at an aggregate cost of $8 million during 2016. The Company’s percentage ownership interest in CNA remained unchanged as a result of these transactions, at 90%. The Company’s purchase price of the shares was lower than the carrying value of its investment in CNA, resulting in an increase to Additional paid-in capital (“APIC”) of $3 million. Treasury Stock The Company repurchased 3.4 million, 33.3 million and 14.6 million shares of its common stock at aggregate costs of $134 million, $1.3 billion and $622 million during the years ended December 31, 2016, 2015 and 2014. As of December 31, 2016 all outstanding treasury stock was retired. Upon retirement, treasury stock was eliminated through a reduction to common stock, APIC and retained earnings. Note 13. Statutory Accounting Practices CNA’s insurance subsidiaries are domiciled in various jurisdictions. These subsidiaries prepare statutory financial statements in accordance with accounting practices prescribed or permitted by the respective jurisdictions’ insurance regulators. Domestic prescribed statutory accounting practices are set forth in a variety of publications of the National Association of Insurance Commissioners (“NAIC”) as well as state laws, regulations and general administrative rules. These statutory accounting principles vary in certain respects from GAAP. In converting from statutory accounting principles to GAAP, the more significant adjustments include deferral of policy acquisition costs and the inclusion of net unrealized holding gains or losses in shareholders’ equity relating to certain fixed maturity securities. CNA has a prescribed practice as it relates to the accounting under Statement of Statutory Accounting Principles No. 62R (“SSAP No. 62R”), Property and Casualty Reinsurance, paragraphs 67 and 68 in conjunction with the 2010 loss portfolio transfer with NICO which is further discussed in Note 8. The prescribed practice allows CNA to aggregate all third party AE&P reinsurance balances administered by NICO in Schedule F and to utilize the loss portfolio transfer as collateral for the underlying third-party reinsurance balances for purposes of calculating the statutory reinsurance penalty. This prescribed practice increased statutory capital and surplus by $67 million and $90 million at December 31, 2016 and 2015.

147
Notes to Consolidated Financial StatementsNote 13. Statutory Accounting Practices – (Continued)
The 2015 long term care premium deficiency discussed in Note 1 was recorded on a GAAP basis. There was no premium deficiency for statutory accounting purposes. Statutory accounting principles requires the use of prescribed discount rates in calculating the reserves for long term care future policy benefits which are lower than the discount rates used on a GAAP basis and results in higher carried reserves relative to GAAP reserves. The payment of dividends by CNA’s insurance subsidiaries without prior approval of the insurance department of each subsidiary’s domiciliary jurisdiction is generally limited by formula. Dividends in excess of these amounts are subject to prior approval by the respective insurance regulator. Dividends from CCC are subject to the insurance holding company laws of the State of Illinois, the domiciliary state of CCC. Under these laws, ordinary dividends, or dividends that do not require prior approval by the Illinois Department of Insurance (the “Department”) are determined based on the greater of the prior year’s statutory net income or 10% of statutory surplus as of the end of the prior year, as well as timing and amount of dividends paid in the preceding 12 months. Additionally, ordinary dividends may only be paid from earned surplus, which is calculated by removing unrealized gains from unassigned surplus. As of December 31, 2016, CCC is in a positive earned surplus position. The maximum allowable dividend CCC could pay during 2017 that would not be subject to the Department’s prior approval is $1.1 billion, less dividends paid during the preceding 12 months measured at that point in time. CCC paid dividends of $765 million in 2016. The actual level of dividends paid in any year is determined after an assessment of available dividend capacity, holding company liquidity and cash needs as well as the impact the dividends will have on the statutory surplus of the applicable insurance company. Combined statutory capital and surplus and statutory net income (loss), determined in accordance with accounting practices prescribed or permitted by insurance and/or other regulatory authorities for the Combined Continental Casualty Companies are presented in the table below. Statutory Capital and Surplus Statutory Net Income December 31 Year Ended December 31 2016 (a) 2015 2016 (a) 2015 2014 (In millions) Combined Continental Casualty Companies $ 10,748 $ 10,723 $ 1,033 $ 1,148 $ 914 (a) Information derived from the statutory-basis financial statements to be filed with insurance regulators. CNA’s domestic insurance subsidiaries are subject to risk-based capital (“RBC”) requirements. RBC is a method developed by the NAIC to determine the minimum amount of statutory capital appropriate for an insurance company to support its overall business operations in consideration of its size and risk profile. The formula for determining the amount of RBC specifies various factors, weighted based on the perceived degree of risk, which are applied to certain financial balances and financial activity. The adequacy of a company’s actual capital is evaluated by a comparison to the RBC results, as determined by the formula. Companies below minimum RBC requirements are classified within certain levels, each of which requires specified corrective action. The statutory capital and surplus presented above for CCC was approximately 270% and 266% of company action level RBC at December 31, 2016 and 2015. Company action level RBC is the level of RBC which triggers a heightened level of regulatory supervision. The statutory capital and surplus of CCC’s foreign insurance subsidiaries, which is not significant to the overall statutory capital and surplus, also met or exceeded their respective regulatory and other capital requirements.

148
Notes to Consolidated Financial Statements Note 14. Benefit Plans Pension Plans – The Company has several non-contributory defined benefit plans for eligible employees. Benefits for certain plans are determined annually based on a specified percentage of annual earnings (based on the participant’s age or years of service) and a specified interest rate (which is established annually for all participants) applied to accrued balances. The benefits for another plan which covers salaried employees are based on formulas which include, among others, years of service and average pay. The Company’s funding policy is to make contributions in accordance with applicable governmental regulatory requirements. Other Postretirement Benefit Plans – The Company has several postretirement benefit plans covering eligible employees and retirees. Participants generally become eligible after reaching age 55 with required years of service. Actual requirements for coverage vary by plan. Benefits for retirees who were covered by bargaining units vary by each unit and contract. Benefits for certain retirees are in the form of a Company health care account. Benefits for retirees reaching age 65 are generally integrated with Medicare. Other retirees, based on plan provisions, must use Medicare as their primary coverage, with the Company reimbursing a portion of the unpaid amount; or are reimbursed for the Medicare Part B premium or have no Company coverage. The benefits provided by the Company are basically health and, for certain retirees, life insurance type benefits. The Company funds certain of these benefit plans, and accrues postretirement benefits during the active service of those employees who would become eligible for such benefits when they retire. The Company uses December 31 as the measurement date for its plans. Weighted average assumptions used to determine benefit obligations: Pension Benefits Other Postretirement Benefits December 31 2016 2015 2014 2016 2015 2014 Discount rate 3.9% 4.0% 3.7% 3.7% 3.7% 3.4%Expected long term rate of return on plan assets 7.5% 7.5% 7.5% 5.3% 5.3% 5.3%Rate of compensation increase 3.9% to 5.5% 3.5% to 5.5% 3.5% to 5.5% Weighted average assumptions used to determine net periodic benefit cost: Pension Benefits Other Postretirement Benefits Year Ended December 31 2016 2015 2014 2016 2015 2014 Discount rate 4.0% 3.8% 4.4% 3.7% 3.4% 4.0%Expected long term rate of return on plan assets 7.5% 7.5% 7.5% 5.3% 5.3% 5.3%Rate of compensation increase 3.5% to 5.5% 3.5% to 5.5% 3.5% to 5.5% The expected long term rate of return for plan assets is determined based on widely-accepted capital market principles, long term return analysis for global fixed income and equity markets as well as the active total return oriented portfolio management style. Long term trends are evaluated relative to market factors such as inflation, interest rates and fiscal and monetary policies, in order to assess the capital market assumptions as applied to the plan. Consideration of diversification needs and rebalancing is maintained. Assumed health care cost trend rates: December 31 2016 2015 2014 Health care cost trend rate assumed for next year 4.0% to 7.0% 4.0% to 7.5% 4.0% to 8.0%Rate to which the cost trend rate is assumed to decline (the ultimate trend rate) 4.0% to 5.0% 4.0% to 5.0% 4.0% to 5.0%Year that the rate reaches the ultimate trend rate 2017-2021 2016-2021 2015-2021

149
Notes to Consolidated Financial StatementsNote 14. Benefit Plans – (Continued)
Assumed health care cost trend rates have a significant effect on the amounts reported for the health care plans. An increase or decrease in the assumed health care cost trend rate of 1% in each year would not have a significant impact on the Company’s service and interest cost as of December 31, 2016. An increase of 1% in each year would increase the Company’s accumulated postretirement benefit obligation as of December 31, 2016 by $2 million and a decrease of 1% in each year would decrease the Company’s accumulated postretirement benefit obligation as of December 31, 2016 by $2 million. Net periodic benefit cost components: Pension Benefits Other Postretirement Benefits Year Ended December 31 2016 2015 2014 2016 2015 2014 (In millions) Service cost $ 8 $ 12 $ 16 $ 1 $ 1 $ 1 Interest cost 128 127 149 3 3 4 Expected return on plan assets (177) (193) (209) (5) (5) (4) Amortization of unrecognized net loss 46 42 30 1 1 Amortization of unrecognized prior service benefit (1) (1) (1) (3) (10) (18) Settlement/Curtailment 3 3 86 (86) Net periodic benefit cost $ 7 $ (10) $ 71 $ (4) $ (10) $ (102) In 2016, the CNA Retirement Plan paid $88 million to settle its obligation to certain retirees through the purchase of a group annuity contract from a third party insurance company. The transaction reduced the plan’s projected benefit obligation by $86 million. In 2015, CNA eliminated future benefit accruals associated with the CNA Retirement Plan effective June 30, 2015. This amendment resulted in a $55 million curtailment which is a decrease in the plan benefit obligation liability and a reduction of the unrecognized actuarial losses included in AOCI. In connection with the curtailment, CNA remeasured the plan benefit obligation which resulted in an increase in the discount rate used to determine the benefit obligation from 3.9% to 4.0%. During 2014, CNA offered a limited-time lump sum settlement payment opportunity to the majority of the terminated vested participants of the CNA Retirement Plan. Settlement payments of $253 million were made from CNA Retirement Plan assets and an $84 million settlement charge was recorded by the Company in the fourth quarter of 2014 to recognize a portion of the unrecognized actuarial losses previously reflected in AOCI. This settlement charge is included in Other operating expenses in the Consolidated Statements of Income. In the second quarter of 2014, CNA eliminated certain postretirement medical benefits associated with the CNA Health and Group Benefits Program. This change was a negative plan amendment which resulted in an $86 million curtailment gain reported in Other operating expenses in the Consolidated Statements of Income. In connection with the plan amendment, CNA remeasured the plan benefit obligation which resulted in a decrease to the discount rate used to determine the benefit obligation from 3.6% to 3.1%.

150
Notes to Consolidated Financial Statements Note 14. Benefit Plans – (Continued) The following provides a reconciliation of benefit obligations and plan assets: Pension Benefits Other Postretirement Benefits 2016 2015 2016 2015 (In millions) Change in benefit obligation: Benefit obligation at January 1 $ 3,227 $ 3,446 $ 82 $ 97 Service cost 8 12 1 1 Interest cost 128 127 3 3 Plan participants’ contributions 5 5 Amendments/curtailments 1 (55) Actuarial (gain) loss 72 (96) (13) (11) Benefits paid from plan assets (188) (187) (12) (13) Settlements (101) (12) Foreign exchange (16) (8) Benefit obligation at December 31 3,131 3,227 66 82 Change in plan assets: Fair value of plan assets at January 1 2,500 2,713 86 87 Actual return on plan assets 211 (21) 3 2 Company contributions 19 15 4 5 Plan participants’ contributions 5 5 Benefits paid from plan assets (188) (187) (12) (13) Settlements (103) (12) Foreign exchange (16) (8) Fair value of plan assets at December 31 2,423 2,500 86 86 Funded status $ (708) $ (727) $ 20 $ 4 Amounts recognized in the Consolidated Balance Sheets consist of: Other assets $ 4 $ 11 $ 44 $ 38 Other liabilities (712) (738) (24) (34) Net amount recognized $ (708) $ (727) $ 20 $ 4 Amounts recognized in Accumulated other comprehensive income (loss), not yet recognized in net periodic (benefit) cost: Prior service credit $ (3) $ (5) $ (6) $ (9) Net actuarial loss 1,097 1,106 (2) 8 Net amount recognized $ 1,094 $ 1,101 $ (8) $ (1) Information for plans with projected and accumulated benefit obligations in excess of plan assets: Projected benefit obligation $ 3,103 $ 3,129 Accumulated benefit obligation 3,089 3,114 $ 24 $ 34 Fair value of plan assets 2,391 2,391

151
Notes to Consolidated Financial StatementsNote 14. Benefit Plans – (Continued)
The accumulated benefit obligation for all defined benefit pension plans was $3.1 billion and $3.2 billion at December 31, 2016 and 2015. The Company employs a total return approach whereby a mix of equity and fixed maturity securities are used to maximize the long term return of plan assets for a prudent level of risk and to manage cash flows according to plan requirements. The target allocation of plan assets is 40% to 60% invested in equity securities and limited partnerships, with the remainder primarily invested in fixed maturity securities. The intent of this strategy is to minimize the Company’s expenses by generating investment returns that exceed the growth of the plan liabilities over the long run. Risk tolerance is established after careful consideration of the plan liabilities, plan funded status and corporate financial conditions. The investment portfolio contains a diversified blend of fixed maturity, equity and short term securities. Alternative investments, including limited partnerships, are used to enhance risk adjusted long term returns while improving portfolio diversification. At December 31, 2016, the Company had committed $119 million to future capital calls from various third party limited partnership investments in exchange for an ownership interest in the related partnerships. Investment risk is monitored through annual liability measurements, periodic asset/liability studies and quarterly investment portfolio reviews. The table below presents the estimated amounts to be recognized from AOCI into net periodic cost (benefit) during 2017. Other Pension Postretirement Benefits Benefits (In millions) Amortization of net actuarial (gain) loss $ 43 $ (1) Amortization of prior service credit (2) Total estimated amounts to be recognized $ 43 $ (3) The table below presents the estimated future minimum benefit payments at December 31, 2016. Other Pension Postretirement Expected future benefit payments Benefits Benefits (In millions) 2017 $ 217 $ 6 2018 210 6 2019 212 6 2020 214 5 2021 212 5 2022 – 2026 1,041 20 In 2017, it is expected that contributions of approximately $15 million will be made to pension plans and $3 million to postretirement health care and life insurance benefit plans.
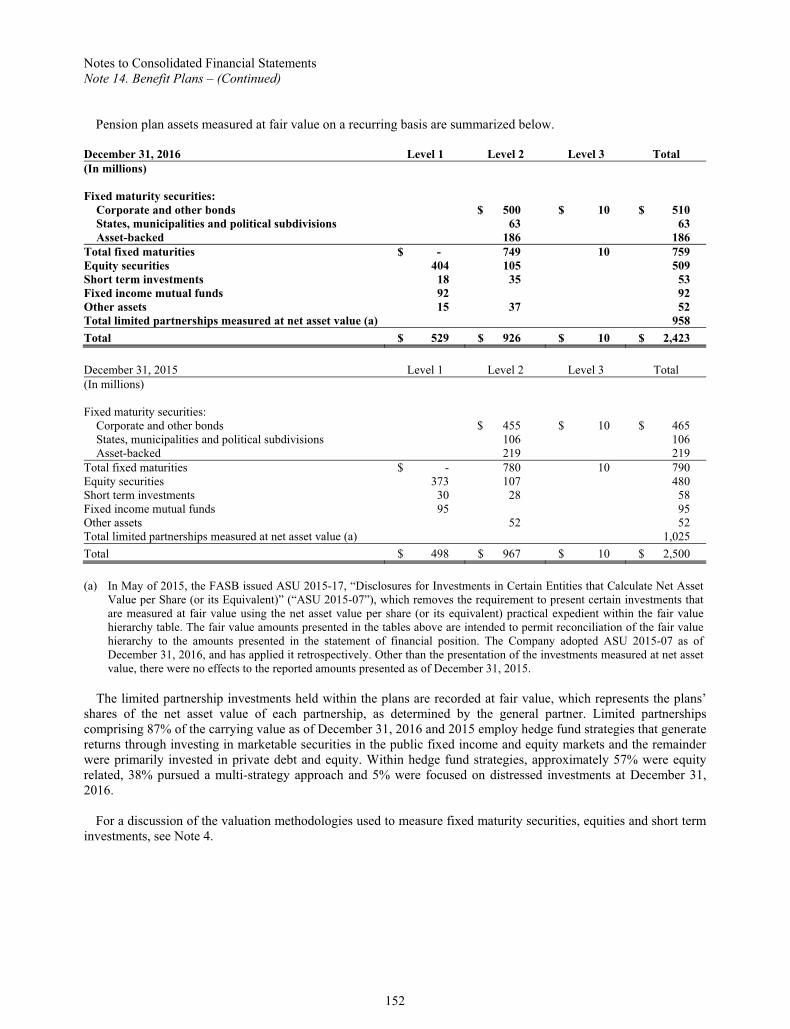
152
Notes to Consolidated Financial Statements Note 14. Benefit Plans – (Continued) Pension plan assets measured at fair value on a recurring basis are summarized below. December 31, 2016 Level 1 Level 2 Level 3 Total (In millions) Fixed maturity securities: Corporate and other bonds $ 500 $ 10 $ 510 States, municipalities and political subdivisions 63 63 Asset-backed 186 186 Total fixed maturities $ - 749 10 759 Equity securities 404 105 509 Short term investments 18 35 53 Fixed income mutual funds 92 92 Other assets 15 37 52 Total limited partnerships measured at net asset value (a) 958 Total $ 529 $ 926 $ 10 $ 2,423 December 31, 2015 Level 1 Level 2 Level 3 Total (In millions) Fixed maturity securities: Corporate and other bonds $ 455 $ 10 $ 465 States, municipalities and political subdivisions 106 106 Asset-backed 219 219 Total fixed maturities $ - 780 10 790 Equity securities 373 107 480 Short term investments 30 28 58 Fixed income mutual funds 95 95 Other assets 52 52 Total limited partnerships measured at net asset value (a) 1,025 Total $ 498 $ 967 $ 10 $ 2,500 (a) In May of 2015, the FASB issued ASU 2015-17, “Disclosures for Investments in Certain Entities that Calculate Net Asset
Value per Share (or its Equivalent)” (“ASU 2015-07”), which removes the requirement to present certain investments that are measured at fair value using the net asset value per share (or its equivalent) practical expedient within the fair value hierarchy table. The fair value amounts presented in the tables above are intended to permit reconciliation of the fair valuehierarchy to the amounts presented in the statement of financial position. The Company adopted ASU 2015-07 as of December 31, 2016, and has applied it retrospectively. Other than the presentation of the investments measured at net asset value, there were no effects to the reported amounts presented as of December 31, 2015.
The limited partnership investments held within the plans are recorded at fair value, which represents the plans’ shares of the net asset value of each partnership, as determined by the general partner. Limited partnerships comprising 87% of the carrying value as of December 31, 2016 and 2015 employ hedge fund strategies that generate returns through investing in marketable securities in the public fixed income and equity markets and the remainder were primarily invested in private debt and equity. Within hedge fund strategies, approximately 57% were equity related, 38% pursued a multi-strategy approach and 5% were focused on distressed investments at December 31, 2016. For a discussion of the valuation methodologies used to measure fixed maturity securities, equities and short term investments, see Note 4.

153
Notes to Consolidated Financial StatementsNote 14. Benefit Plans – (Continued)
The tables below present reconciliations for all pension plan assets measured at fair value on a recurring basis using significant unobservable inputs (Level 3) for the years ended December 31, 2016 and 2015: Net Actual Return on Assets Purchases, Net Transfers Balance at Still Held at Sold During Sales, and In (Out) of Balance at 2016 January 1, December 31, the Year Settlements Level 3 December 31,(In millions) Fixed maturity securities: Corporate and other bonds $ 10 $ 10 Total $ 10 $ - $ - $ - $ - $ 10 2015 (In millions) Fixed maturity securities: Corporate and other bonds $ 15 $ (5) $ 10 Total $ 15 $ - $ - $ - $ (5) $ 10 Other postretirement benefits plan assets measured at fair value on a recurring basis are summarized below. December 31, 2016 Level 1 Level 2 Level 3 Total (In millions) Fixed maturity securities: Corporate and other bonds $ 19 $ 19 States, municipalities and political subdivisions 44 44 Asset-backed 15 15 Total fixed maturities $ - 78 $ - 78 Short term investments 3 3 Fixed income mutual funds 5 5 Total $ 8 $ 78 $ - $ 86 December 31, 2015 Level 1 Level 2 Level 3 Total (In millions) Fixed maturity securities: Corporate and other bonds $ 17 $ 17 States, municipalities and political subdivisions 42 42 Asset-backed 19 19 Total fixed maturities $ - 78 $ - 78 Short term investments 3 3 Fixed income mutual funds 5 5 Total $ 8 $ 78 $ - $ 86 There were no Level 3 assets at December 31, 2016 and 2015. Savings Plans – The Company and its subsidiaries have several contributory savings plans which allow employees to make regular contributions based upon a percentage of their salaries. Matching contributions are made up to specified percentages of employees’ contributions. The contributions by the Company and its subsidiaries to these plans amounted to $107 million, $115 million and $125 million for the years ended December 31, 2016, 2015 and 2014. Stock-based Compensation – In 2016, shareholders approved the Loews Corporation 2016 Incentive Compensation Plan (the “2016 Loews Plan”) which replaced a previously existing plan. The aggregate number of shares of Loews common stock authorized under the 2016 Loews Plan is 6,000,000 shares, plus up to 3,000,000 shares that may be forfeited under the prior plan. The maximum number of shares of Loews common stock with

154
Notes to Consolidated Financial Statements Note 14. Benefit Plans – (Continued) respect to which awards may be granted to any individual in any calendar year is 500,000 shares. In accordance with the 2016 Loews Plan and the prior plan, the Company’s stock-based compensation consists of the following: SARs: SARs were granted under the prior plan. The exercise price per share may not be less than the fair market value of the common stock on the date of grant. Generally, SARs vest ratably over a four-year period and expire in ten years. Time-based Restricted Stock Units: Time-based restricted stock units (“RSUs”) were granted under the 2016 Loews Plan and represent the right to receive one share of the Company’s common stock for each vested RSU. Generally, RSUs vest 50% on the second anniversary of the grant date and 50% on the third anniversary of the grant date. Performance-based Restricted Stock Units: Performance-based RSUs (“PSUs”) were granted under the 2016 Loews Plan and represent the right to receive one share of the Company’s common stock for each vested PSU, subject to the achievement of specified performance goals by the Company. Generally, performance-based RSUs vest, if performance goals are satisfied, 50% on the second anniversary of the grant date and 50% on the third anniversary of the grant date. In 2016, the Company granted an aggregate of 367,908 RSUs and PSUs at a weighted average grant-date fair value of $39.74 per unit. 16,079 RSUs were forfeited during the year. 5,982,880 SARs were outstanding at December 31, 2016 with a weighted average exercise price of $40.90. The Company recognized compensation expense that decreased net income by $32 million, $14 million and $12 million for the years ended December 31, 2016, 2015 and 2014. Several of the Company’s subsidiaries also maintain their own stock-based compensation plans. Such amounts include the Company’s share of expense related to its subsidiaries’ plans. Note 15. Reinsurance CNA cedes insurance to reinsurers to limit its maximum loss, provide greater diversification of risk, minimize exposures on larger risks and to exit certain lines of business. The ceding of insurance does not discharge the primary liability of CNA. A credit exposure exists with respect to reinsurance ceded to the extent that any reinsurer is unable to meet its obligations. A collectability exposure also exists to the extent that the reinsurer disputes the liabilities assumed under reinsurance agreements. Property and casualty reinsurance coverages are tailored to the specific risk characteristics of each product line and CNA’s retained amount varies by type of coverage. Reinsurance contracts are purchased to protect specific lines of business such as property and workers’ compensation. Corporate catastrophe reinsurance is also purchased for property and workers’ compensation exposure. Currently most reinsurance contracts are purchased on an excess of loss basis. CNA also utilizes facultative reinsurance in certain lines. In addition, CNA assumes reinsurance, primarily through Hardy and as a member of various reinsurance pools and associations. The following table presents the amounts receivable from reinsurers: December 31 2016 2015 (In millions) Reinsurance receivables related to insurance reserves: Ceded claim and claim adjustment expenses $ 4,094 $ 4,087 Ceded future policy benefits 212 207 Reinsurance receivables related to paid losses 147 197 Reinsurance receivables 4,453 4,491 Less allowance for doubtful accounts 37 38 Reinsurance receivables, net of allowance for doubtful accounts $ 4,416 $ 4,453

155
Notes to Consolidated Financial StatementsNote 15. Reinsurance – (Continued)
CNA has established an allowance for doubtful accounts on reinsurance receivables related to credit risk. CNA reviews the allowance quarterly and adjusts the allowance as necessary to reflect changes in estimates of uncollectible balances. The allowance may also be reduced by write-offs of reinsurance receivable balances. CNA attempts to mitigate its credit risk related to reinsurance by entering into reinsurance arrangements with reinsurers that have credit ratings above certain levels and by obtaining collateral. On a limited basis, CNA may enter into reinsurance agreements with reinsurers that are not rated, primarily captive reinsurers. The primary methods of obtaining collateral are through reinsurance trusts, letters of credit and funds withheld balances. Such collateral was approximately $3.0 billion and $3.2 billion at December 31, 2016 and 2015. CNA’s largest recoverables from a single reinsurer, including ceded unearned premium reserves as of December 31, 2016 were approximately $2.4 billion from a subsidiary of Berkshire Hathaway Group, $350 million from the Gateway Rivers Insurance Company and $212 million from subsidiaries of Wilton Re. These amounts are substantially collaterized. The recoverable from the Berkshire Hathaway Group includes amounts related to third party reinsurance for which NICO has assumed the credit risk under the terms of the loss portfolio transfer as discussed in Note 8. The effects of reinsurance on earned premiums are presented in the following table:
Assumed/ Direct Assumed Ceded Net Net %
(In millions) Year Ended December 31, 2016 Property and casualty $ 10,400 $ 258 $ 4,270 $ 6,388 4.0%Long term care 486 50 536 9.3 Earned premiums $ 10,886 $ 308 $ 4,270 $ 6,924 4.4% Year Ended December 31, 2015 Property and casualty $ 9,853 $ 274 $ 3,754 $ 6,373 4.3%Long term care 498 50 548 9.1 Earned premiums $ 10,351 $ 324 $ 3,754 $ 6,921 4.7% Year Ended December 31, 2014 Property and casualty $ 9,452 $ 277 $ 3,073 $ 6,656 4.2%Long term care 508 48 556 8.6 Earned premiums $ 9,960 $ 325 $ 3,073 $ 7,212 4.5% Included in the direct and ceded earned premiums for the years ended December 31, 2016, 2015 and 2014 are $3.9 billion, $3.3 billion and $2.6 billion related to property business that is 100% reinsured under a significant third party captive program. The third party captives that participate in this program are affiliated with the non-insurance company policyholders, therefore this program provides a means for the policyholders to self-insure this property risk. CNA receives and retains a ceding commission. Long term care premiums are from long duration contracts; property and casualty premiums are from short duration contracts. Insurance claims and policyholders’ benefits reported on the Consolidated Statements of Income are net of reinsurance recoveries of $3.0 billion, $2.6 billion and $1.4 billion for the years ended December 31, 2016, 2015 and 2014, including $2.6 billion, $2.3 billion and $1.5 billion related to the significant third party captive program discussed above. Reinsurance recoveries in 2014 were unfavorably affected by the commutation of a workers’ compensation reinsurance pool.

156
Notes to Consolidated Financial Statements Note 16. Quarterly Financial Data (Unaudited) 2016 Quarter Ended Dec. 31 Sept. 30 June 30 March 31(In millions, except per share data) Total revenues $ 3,338 $ 3,287 $ 3,307 $ 3,173 Net income (loss) (a) 290 327 (65) 102 Per share-basic and diluted 0.86 0.97 (0.19) 0.30 2015 Quarter Ended Dec. 31 Sept. 30 June 30 March 31(In millions, except per share data) Total revenues $ 3,333 $ 3,169 $ 3,435 $ 3,478 Net income (loss) (b) (201) 182 170 109 Per share-basic and diluted (0.58) 0.50 0.46 0.29 The sum of the quarterly per share amounts may not equal per share amounts reported for year-to-date periods. This is due to changes in the number of weighted average shares outstanding and the effects of rounding for each period. (a) Net loss for the second quarter of 2016 includes the impact of a $267 million asset impairment charge at Diamond
Offshore. (b) Net loss for the fourth quarter of 2015 includes the impact of a $177 million charge related to recognition of a premium
deficiency in CNA’s long term care business and a $182 million asset impairment charge at Diamond Offshore. Note 17. Legal Proceedings CNA Financial In September of 2016, a class action lawsuit was filed against CCC, Continental Assurance Company (“CAC”), CNA, the Investment Committee of the CNA 401(k) Plus Plan, The Northern Trust Company and John Does 1-10 (collectively “Defendants”) over the CNA 401(k) Plus Plan. The complaint alleges that Defendants breached fiduciary duties to the CNA 401(k) Plus Plan and caused prohibited transactions in violation of the Employee Retirement Income Security Act of 1974 when the CNA 401(k) Plus Plan’s Fixed Income Fund’s annuity contract with CAC was canceled. The plaintiff alleges he and a proposed class of the CNA 401(k) Plus Plan participants who had invested in the Fixed Income Fund suffered lower returns in their CNA 401(k) Plus Plan investments as a consequence of these alleged violations and seeks relief on behalf of the putative class. CNA has only recently begun evaluating the lawsuit as this litigation is in its preliminary stages, and as of yet no class has been certified. CCC and the other Defendants are contesting the case and the Company currently is unable to predict the final outcome or the impact on its financial condition, results of operations or cash flows. As of December 31, 2016, the likelihood of loss is reasonably possible, but the amount of loss, if any, cannot be estimated at this stage of the litigation. Other Litigation The Company and its subsidiaries are parties to other litigation arising in the ordinary course of business. The outcome of this litigation will not, in the opinion of management, materially affect the Company’s results of operations or equity.
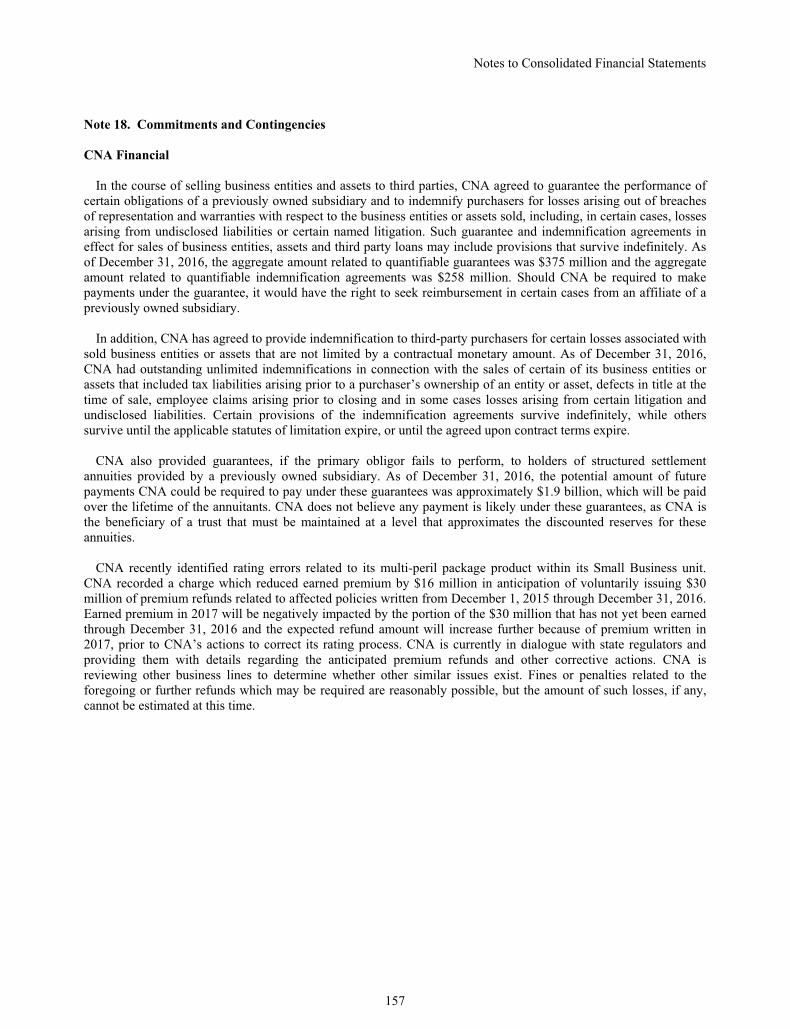
157
Notes to Consolidated Financial Statements
Note 18. Commitments and Contingencies CNA Financial In the course of selling business entities and assets to third parties, CNA agreed to guarantee the performance of certain obligations of a previously owned subsidiary and to indemnify purchasers for losses arising out of breaches of representation and warranties with respect to the business entities or assets sold, including, in certain cases, losses arising from undisclosed liabilities or certain named litigation. Such guarantee and indemnification agreements in effect for sales of business entities, assets and third party loans may include provisions that survive indefinitely. As of December 31, 2016, the aggregate amount related to quantifiable guarantees was $375 million and the aggregate amount related to quantifiable indemnification agreements was $258 million. Should CNA be required to make payments under the guarantee, it would have the right to seek reimbursement in certain cases from an affiliate of a previously owned subsidiary. In addition, CNA has agreed to provide indemnification to third-party purchasers for certain losses associated with sold business entities or assets that are not limited by a contractual monetary amount. As of December 31, 2016, CNA had outstanding unlimited indemnifications in connection with the sales of certain of its business entities or assets that included tax liabilities arising prior to a purchaser’s ownership of an entity or asset, defects in title at the time of sale, employee claims arising prior to closing and in some cases losses arising from certain litigation and undisclosed liabilities. Certain provisions of the indemnification agreements survive indefinitely, while others survive until the applicable statutes of limitation expire, or until the agreed upon contract terms expire. CNA also provided guarantees, if the primary obligor fails to perform, to holders of structured settlement annuities provided by a previously owned subsidiary. As of December 31, 2016, the potential amount of future payments CNA could be required to pay under these guarantees was approximately $1.9 billion, which will be paid over the lifetime of the annuitants. CNA does not believe any payment is likely under these guarantees, as CNA is the beneficiary of a trust that must be maintained at a level that approximates the discounted reserves for these annuities. CNA recently identified rating errors related to its multi-peril package product within its Small Business unit. CNA recorded a charge which reduced earned premium by $16 million in anticipation of voluntarily issuing $30 million of premium refunds related to affected policies written from December 1, 2015 through December 31, 2016. Earned premium in 2017 will be negatively impacted by the portion of the $30 million that has not yet been earned through December 31, 2016 and the expected refund amount will increase further because of premium written in 2017, prior to CNA’s actions to correct its rating process. CNA is currently in dialogue with state regulators and providing them with details regarding the anticipated premium refunds and other corrective actions. CNA is reviewing other business lines to determine whether other similar issues exist. Fines or penalties related to the foregoing or further refunds which may be required are reasonably possible, but the amount of such losses, if any, cannot be estimated at this time.
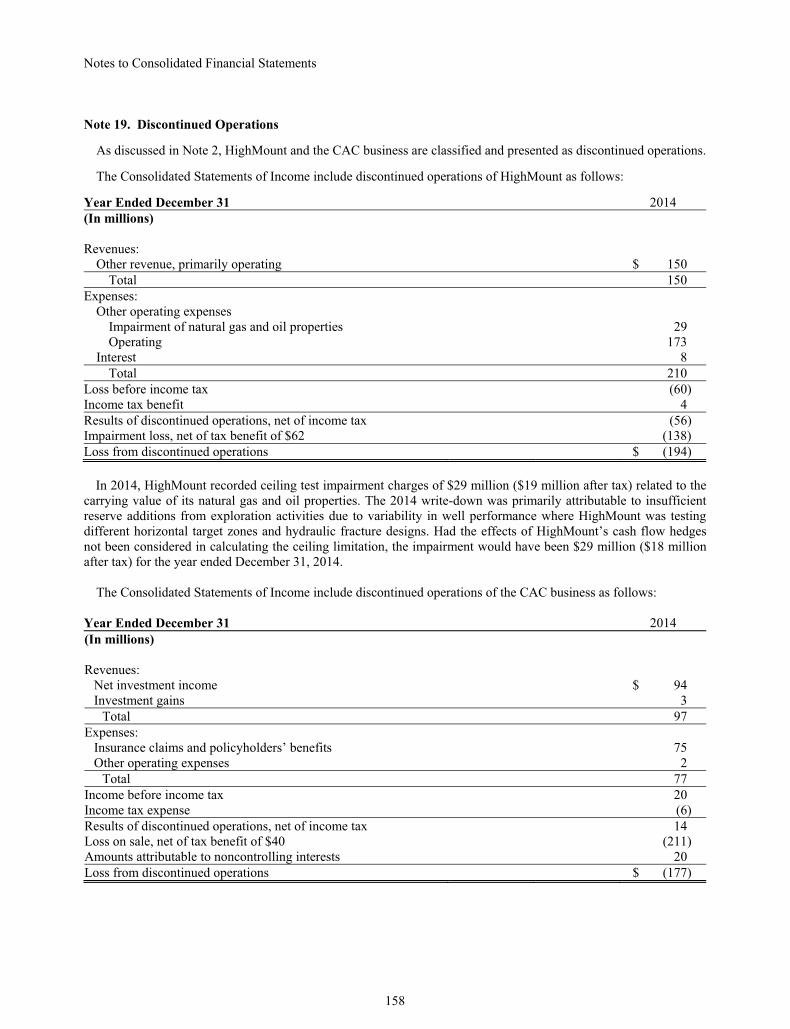
158
Notes to Consolidated Financial Statements Note 19. Discontinued Operations As discussed in Note 2, HighMount and the CAC business are classified and presented as discontinued operations. The Consolidated Statements of Income include discontinued operations of HighMount as follows: Year Ended December 31 2014 (In millions) Revenues: Other revenue, primarily operating $ 150 Total 150 Expenses: Other operating expenses Impairment of natural gas and oil properties 29 Operating 173 Interest 8 Total 210 Loss before income tax (60) Income tax benefit 4 Results of discontinued operations, net of income tax (56) Impairment loss, net of tax benefit of $62 (138) Loss from discontinued operations $ (194) In 2014, HighMount recorded ceiling test impairment charges of $29 million ($19 million after tax) related to the carrying value of its natural gas and oil properties. The 2014 write-down was primarily attributable to insufficient reserve additions from exploration activities due to variability in well performance where HighMount was testing different horizontal target zones and hydraulic fracture designs. Had the effects of HighMount’s cash flow hedges not been considered in calculating the ceiling limitation, the impairment would have been $29 million ($18 million after tax) for the year ended December 31, 2014. The Consolidated Statements of Income include discontinued operations of the CAC business as follows: Year Ended December 31 2014 (In millions) Revenues: Net investment income $ 94 Investment gains 3 Total 97 Expenses: Insurance claims and policyholders’ benefits 75 Other operating expenses 2 Total 77 Income before income tax 20 Income tax expense (6) Results of discontinued operations, net of income tax 14 Loss on sale, net of tax benefit of $40 (211) Amounts attributable to noncontrolling interests 20 Loss from discontinued operations $ (177)

159
Notes to Consolidated Financial Statements
Note 20. Segments The Company has five reportable segments comprised of its four individual operating subsidiaries, CNA, Diamond Offshore, Boardwalk Pipeline and Loews Hotels; and the Corporate segment. Each of the operating subsidiaries are headed by a chief executive officer who is responsible for the operation of its business and has the duties and authority commensurate with that position. CNA’s core business is the sale of property and casualty insurance coverage primarily through a network of independent agents, brokers and managing general underwriters. CNA’s operations also include its long term care business that is in run-off, certain corporate expenses, including interest on CNA’s corporate debt, and certain property and casualty businesses in run-off, including CNA Re and A&EP. Diamond Offshore owns and operates offshore drilling rigs that are chartered on a contract basis for fixed terms by companies engaged in exploration and production of hydrocarbons. Offshore rigs are mobile units that can be relocated based on market demand. Diamond Offshore’s fleet consists of 24 drilling rigs, which consist of four drillships, 19 semisubmersible rigs, and one jack-up rig. On December 31, 2016, Diamond Offshore’s drilling rigs were located offshore of five countries in addition to the United States. Boardwalk Pipeline is engaged in the interstate transportation and storage of natural gas and NGLs. This segment consists of interstate natural gas pipeline systems originating in the Gulf Coast region, Oklahoma and Arkansas, and extending north and east through the midwestern states of Tennessee, Kentucky, Illinois, Indiana and Ohio, natural gas storage facilities in four states and NGL pipelines and storage facilities in Louisiana and Texas, with approximately 14,365 miles of pipeline. Loews Hotels operates a chain of 25 hotels, 24 of which are in the United States and one of which is in Canada. The Corporate segment consists of investment income from the Parent Company’s cash and investments, interest expense and other unallocated expenses. Purchase accounting adjustments have been pushed down to the appropriate subsidiary. The accounting policies of the segments are the same as those described in the summary of significant accounting policies in Note 1. In the following tables certain financial measures are presented to provide information used by management to monitor the Company’s operating performance. These schedules present the reportable segments of the Company and their contribution to the consolidated financial statements. Amounts presented will not necessarily be the same as those in the individual financial statements of the Company’s subsidiaries due to adjustments for purchase accounting, income taxes and noncontrolling interests.

Not
es to
Con
solid
ated
Fin
anci
al S
tate
men
ts
Not
e 20
. Seg
men
ts –
(Con
tinue
d)
Stat
emen
ts o
f Inc
ome
and
Tota
l ass
ets b
y se
gmen
t are
pre
sent
ed in
the
follo
win
g ta
bles
.
CN
A
Dia
mon
d B
oard
wal
k L
oew
s
Y
ear
End
ed D
ecem
ber
31, 2
016
Fina
ncia
l O
ffsh
ore
Pipe
line
Hot
els
Cor
pora
te
Tot
al
(In
mill
ions
)
Rev
enue
s:
In
sura
nce
prem
ium
s
$ 6,
924
$
6,92
4 N
et in
vest
men
t inc
ome
1,98
8
$ 1
$
146
2,13
5 In
vest
men
t gai
ns (l
osse
s)
62
(12)
50
Con
trac
t dri
lling
rev
enue
s
1,52
5
1,52
5 O
ther
rev
enue
s
41
0
75
$ 1,
316
$
667
3
2,
471
Tot
al
9,38
4
1,
589
1,31
6
66
7
14
9
13
,105
Exp
ense
s:
In
sura
nce
clai
ms a
nd p
olic
yhol
ders
’ ben
efits
5,
283
5,28
3 A
mor
tizat
ion
of d
efer
red
acqu
isiti
on c
osts
1,
235
1,23
5 C
ontr
act d
rilli
ng e
xpen
ses
77
2
772
Oth
er o
pera
ting
expe
nses
1,
558
1,19
8
83
5
62
1
13
1
4,
343
Inte
rest
16
7
90
18
3
24
72
53
6 T
otal
8,
243
2,06
0
1,
018
645
203
12,1
69
Inco
me
(loss
) bef
ore
inco
me
tax
1,14
1
(4
71)
298
22
(54)
93
6 In
com
e ta
x (e
xpen
se) b
enef
it
(2
79)
111
(61)
(1
0)
19
(220
) N
et in
com
e (lo
ss)
862
(360
)
23
7
12
(3
5)
716
Am
ount
s att
ribu
tabl
e to
non
cont
rolli
ng in
tere
sts
(88)
17
4
(1
48)
(62)
N
et in
com
e (lo
ss) a
ttri
buta
ble
to L
oew
s Cor
pora
tion
$
774
$
(186
)
$ 89
$ 12
$ (3
5)
$
654
Dec
embe
r 31
, 201
6
(I
n m
illio
ns)
T
otal
ass
ets
$
55,2
07
$
6,37
1
$ 8,
706
$
1,49
8
$ 4,
812
$
76,5
94
160

Not
es to
Con
solid
ated
Fin
anci
al S
tate
men
tsN
ote
20. S
egm
ents
– (C
ontin
ued)
CN
A
Dia
mon
d B
oard
wal
k Lo
ews
Yea
r End
ed D
ecem
ber 3
1, 2
015
Fina
ncia
l O
ffsh
ore
Pipe
line
Hot
els
Cor
pora
te
Tota
l (I
n m
illio
ns)
R
even
ues:
Insu
ranc
e pr
emiu
ms
$
6,92
1
$ 6,
921
Net
inve
stm
ent i
ncom
e
1,
840
$
3
$ 1
$ 22
1,
866
Inve
stm
ent l
osse
s
(7
1)
(71)
C
ontra
ct d
rillin
g re
venu
es
2,
360
2,
360
Oth
er re
venu
es
411
65
1,25
3
$ 60
4
6
2,33
9 To
tal
9,10
1
2,
428
1,25
4
60
4
28
13
,415
Expe
nses
:
Insu
ranc
e cl
aim
s and
pol
icyh
olde
rs’ b
enef
its
5,38
4
5,
384
Am
ortiz
atio
n of
def
erre
d ac
quis
ition
cos
ts
1,54
0
1,
540
Con
tract
dril
ling
expe
nses
1,22
8
1,22
8 O
ther
ope
ratin
g ex
pens
es
1,46
9
1,
508
851
555
116
4,49
9 In
tere
st
155
94
176
21
74
520
Tota
l
8,
548
2,83
0
1,
027
576
190
13,1
71
Inco
me
(loss
) bef
ore
inco
me
tax
553
(402
)
22
7
28
(1
62)
244
Inco
me
tax
(exp
ense
) ben
efit
(71)
11
7
(4
6)
(16)
59
43
N
et in
com
e (lo
ss)
482
(285
)
18
1
12
(1
03)
287
Am
ount
s attr
ibut
able
to n
onco
ntro
lling
inte
rest
s
(4
9)
129
(107
)
(2
7)
Net
inco
me
(loss
) attr
ibut
able
to L
oew
s Cor
pora
tion
$
433
$
(156
)
$ 74
$ 12
$ (1
03)
$
260
Dec
embe
r 31,
201
5
(I
n m
illio
ns)
To
tal a
sset
s
$ 55
,025
$ 7,
154
$
8,36
5
$ 1,
416
$
4,04
6
$ 76
,006
161
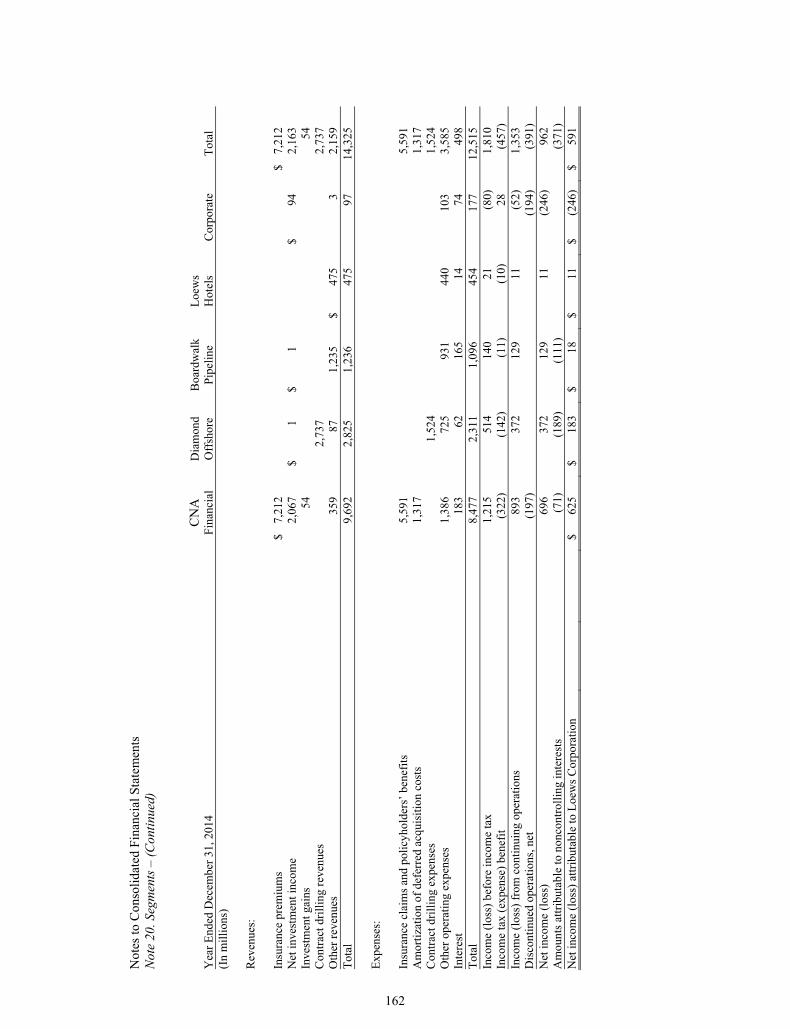
Not
es to
Con
solid
ated
Fin
anci
al S
tate
men
ts
Not
e 20
. Seg
men
ts –
(Con
tinue
d)
C
NA
D
iam
ond
Boa
rdw
alk
Loew
s
Y
ear E
nded
Dec
embe
r 31,
201
4
Fi
nanc
ial
Off
shor
e Pi
pelin
e H
otel
s C
orpo
rate
To
tal
(In
mill
ions
)
Rev
enue
s:
In
sura
nce
prem
ium
s
$ 7,
212
$
7,21
2 N
et in
vest
men
t inc
ome
2,06
7
$ 1
$
1
$
94
2,16
3 In
vest
men
t gai
ns
54
54
Con
tract
dril
ling
reve
nues
2,73
7
2,73
7 O
ther
reve
nues
35
9
87
1,
235
$
475
3
2,
159
Tota
l
9,
692
2,82
5
1,
236
475
97
14,3
25
Ex
pens
es:
In
sura
nce
clai
ms a
nd p
olic
yhol
ders
’ ben
efits
5,
591
5,59
1 A
mor
tizat
ion
of d
efer
red
acqu
isiti
on c
osts
1,
317
1,31
7 C
ontra
ct d
rillin
g ex
pens
es
1,
524
1,
524
Oth
er o
pera
ting
expe
nses
1,
386
725
931
440
103
3,58
5 In
tere
st
183
62
165
14
74
498
Tota
l
8,
477
2,31
1
1,
096
454
177
12,5
15
Inco
me
(loss
) bef
ore
inco
me
tax
1,21
5
51
4
14
0
21
(8
0)
1,81
0 In
com
e ta
x (e
xpen
se) b
enef
it
(3
22)
(142
)
(1
1)
(10)
28
(4
57)
Inco
me
(loss
) fro
m c
ontin
uing
ope
ratio
ns
893
372
129
11
(52)
1,
353
Dis
cont
inue
d op
erat
ions
, net
(1
97)
(1
94)
(391
) N
et in
com
e (lo
ss)
696
372
129
11
(246
)
96
2 A
mou
nts a
ttrib
utab
le to
non
cont
rolli
ng in
tere
sts
(71)
(1
89)
(111
)
(3
71)
Net
inco
me
(loss
) attr
ibut
able
to L
oew
s Cor
pora
tion
$
625
$
183
$
18
$
11
$
(246
)
$ 59
1
162

163
This Page Intentionally Left Blank

164
Item 9. Changes in and Disagreements with Accountants on Accounting and Financial Disclosure. None. Item 9A. Controls and Procedures. Disclosure Controls and Procedures The Company maintains a system of disclosure controls and procedures (as defined in Rules 13a-15(e) and 15d-15(e) under the Securities Exchange Act of 1934, as amended (the “Exchange Act”)), which is designed to ensure that information required to be disclosed by the Company in reports that it files or submits under the federal securities laws, including this Report, is recorded, processed, summarized and reported on a timely basis. These disclosure controls and procedures include controls and procedures designed to ensure that information required to be disclosed by the Company under the Exchange Act is accumulated and communicated to the Company’s management on a timely basis to allow decisions regarding required disclosure. The Company’s principal executive officer (“CEO”) and principal financial officer (“CFO”) undertook an evaluation of the Company’s disclosure controls and procedures as of the end of the period covered by this Report and, based on that evaluation, the CEO and CFO concluded that the Company’s controls and procedures were effective as of December 31, 2016. Internal Control Over Financial Reporting Pursuant to Section 404 of the Sarbanes-Oxley Act of 2002, and the implementing rules of the Securities and Exchange Commission, the Company included a report of management’s assessment of the design and effectiveness of its internal control over financial reporting as part of this Annual Report on Form 10-K for the year ended December 31, 2016. The independent registered public accounting firm of the Company also reported on the effectiveness of the Company’s internal control over financial reporting as of December 31, 2016. Management’s report and the independent registered public accounting firm’s report are included under Item 8 of this Report under the captions entitled “Management’s Report on Internal Control Over Financial Reporting” and “Report of Independent Registered Public Accounting Firm” and are incorporated herein by reference. There were no changes in the Company’s internal control over financial reporting (as defined in Rules 13a-15(f) and 15d-15(f) under the Exchange Act) that occurred during the quarter ended December 31, 2016 that have materially affected or that are reasonably likely to materially affect the Company’s internal control over financial reporting. Item 9B. Other Information. None.
PART III Item 10. Directors, Executive Officers and Corporate Governance. Information about our directors and persons nominated to become directors is contained under the caption “Election of Directors” in our Proxy Statement for our 2017 Annual Meeting of Shareholders to be filed with the SEC within 120 days of the fiscal year ended December 31, 2016 (the “2017 Proxy Statement”) and is incorporated herein by reference. Information about our executive officers is reported under the caption “Executive Officers of the Registrant” in Part I of this Report. Information about beneficial ownership reporting compliance is contained under the caption “Section 16(a) Beneficial Ownership Reporting Compliance” in our 2017 Proxy Statement and is incorporated herein by reference.

165
We have a Code of Business Conduct and Ethics which applies to all of our directors, officers and employees, including our principal executive officer, principal financial officer and principal accounting officer. This Code can be found on our website at www.loews.com and is available in print to any shareholder who requests a copy by writing to our Corporate Secretary at Loews Corporation, 667 Madison Avenue, New York, N.Y. 10065-8087. We intend to post any changes to or waivers of this Code for our directors and executive officers, including our principal executive officer, principal financial officer, principal accounting officer or persons performing similar functions on our website. Any amendment to this Code and any waiver applicable to our executive officers or senior financial officers will be posted on our website within the time period required by the SEC and New York Stock Exchange. Information about the procedures by which security holders may recommend nominees to our Board of Directors can be found in our 2017 Proxy Statement under the caption “Other Matters – Communications with Us by Shareholders and Others” and is incorporated herein by reference. Information about the composition of the Audit Committee and our Audit Committee financial experts is contained in our 2017 Proxy Statement under the caption “Committees of the Board – Audit Committee” and is incorporated herein by reference. Item 11. Executive Compensation. Information about director and executive officer compensation, Compensation Committee interlocks and the Compensation Committee Report is contained in our 2017 Proxy Statement under the captions “Director Compensation,” “Compensation Discussion and Analysis,” “Compensation Committee Report on Executive Compensation,” and “Compensation Committee Interlocks and Insider Participation” and is incorporated herein by reference. Item 12. Security Ownership of Certain Beneficial Owners and Management and Related Stockholder Matters. Information about securities authorized for issuance under equity compensation plans can be found under the caption “Securities Authorized for Issuance Under Equity Compensation Plans” under Item 5 of this Report. Information about the number of shares of our common stock beneficially owned by each director and named executive officer, by all directors and executive officers as a group and on each beneficial owner of more than 5% of our common stock is contained under the captions “Principal Shareholders” and “Director and Officer Holdings” in our 2017 Proxy Statement and is incorporated herein by reference. Item 13. Certain Relationships and Related Transactions, and Director Independence. Information about certain relationships and related transactions and director independence is contained under the captions “Transactions With Related Persons” and “Director Independence” in our 2017 Proxy Statement and is incorporated herein by reference. Item 14. Principal Accounting Fees and Services. Information about our Audit Committee’s pre-approval policy and procedures for audit and other services and information about our principal accountant fees and services is contained in our 2017 Proxy Statement under the caption “Ratification of the Appointment of Our Independent Auditors – Audit Fees and Services” and “ – Auditor Engagement Pre-Approval Policy” and is incorporated herein by reference.

166
PART IV Item 15. Exhibits and Financial Statement Schedules. (a) 1. Financial Statements: The financial statements above appear under Item 8. The following additional financial data should be read in conjunction with those financial statements. Schedules not included with these additional financial data have been omitted because they are not applicable or the required information is shown in the consolidated financial statements or notes to consolidated financial statements. Page Number 2. Financial Statement Schedules: Loews Corporation and Subsidiaries: Schedule I–Condensed financial information of Registrant as of December 31, 2016 and 2015 and for the years ended December 31, 2016, 2015 and 2014 172 Schedule II–Valuation and qualifying accounts for the years ended December 31, 2016, 2015 and 2014 174 Schedule V–Supplemental information concerning property and casualty insurance operations as of December 31, 2016 and 2015 and for the years ended December 31, 2016, 2015 and 2014 175
Exhibit Description Number 3. Exhibits:
(3) Articles of Incorporation and By-Laws
Restated Certificate of Incorporation of Registrant, dated August 11, 2009, incorporated herein by reference to Exhibit 3.1 to Registrant’s Report on Form 10-Q for the quarter ended September 30, 2009 3.01
By-Laws of Registrant as amended through October 9, 2007, incorporated herein by reference to Exhibit 3.1 to Registrant’s Report on Form 10-Q filed October 31, 2007 3.02
(4) Instruments Defining the Rights of Security Holders, Including Indentures
Registrant hereby agrees to furnish to the Commission upon request copies of instruments with respect to long term debt, pursuant to Item 601(b)(4)(iii) of Regulation S-K
(10) Material Contracts
Loews Corporation 2016 Incentive Compensation Plan, incorporated herein by reference to Exhibit 10.1 to Registrant’s Report on Form 10-Q for the quarter ended June 30, 2016 10.01+
Form of Performance-Based Restricted Stock Unit Award Notice under the Loews Corporation 2016 Incentive Compensation Form, incorporated herein by reference to Exhibit 10.2 to Registrant’s Report on Form 10-Q for the quarter ended June 30, 2016 10.02+

167
Exhibit Description Number
Form of Time-Vesting Restricted Stock Unit Award Notice under the Loews Corporation 2016 Incentive Compensation Plan, incorporated herein by reference to Exhibit 10.3 to Registrant’s Report on Form 10-Q for the quarter ended June 30, 2016 10.03+
Form of Directors Restricted Stock Unit Award Notice under the Loews Corporation 2016 Incentive Compensation Plan, incorporated herein by reference to Exhibit 10.4 to Registrant’s Report on Form 10-Q for the quarter ended June 30, 2016 10.04+
Form of Election Form for Restricted Stock Units under the Loews Corporation 2016 Incentive Compensation Plan, incorporated herein by reference to Exhibit 10.5 to Registrant’s Report on Form 10-Q for the quarter ended June 30, 2016 10.05+
Loews Corporation Amended and Restated Stock Option Plan, incorporated herein by reference to Exhibit A to Registrant’s Proxy Statement filed with the Commission on March 26, 2012 10.06+
Form of Stock Option Certificate for grants to executive officers and other employees and to non-employee directors pursuant to the Loews Corporation Amended and Restated Stock Option Plan, incorporated herein by reference to Exhibit 10.27 to Registrant’s Report on Form 10-K for the year ended December 31, 2009 10.07+
Form of Award Certificate for grants of stock appreciation rights pursuant to the Loews Corporation Amended and Restated Stock Option Plan, incorporated herein by reference to Exhibit 10.28 to Registrant’s Report on Form 10-K for the year ended December 31, 2009 10.08+
Loews Corporation Incentive Compensation Plan for Executive Officers, as amended through October 30, 2009, incorporated herein by reference to Exhibit 10.02 to Registrant’s Report on Form 10-K for the year ended December 31, 2009 10.09+
Loews Corporation Executive Deferred Compensation Plan, effective as of January 1, 2016, incorporated herein by reference to Exhibit 10.01 to Registrant’s Report on Form 10-K for the year ended December 31, 2015 10.10+
Loews Corporation Deferred Compensation Plan, amended and restated as of January 1, 2008, incorporated herein by reference to Exhibit 10.01 to Registrant’s Report on Form 10-K for the year ended December 31, 2008 10.11+
Separation Agreement, dated as of May 7, 2008, by and among Registrant, Lorillard, Inc., Lorillard Tobacco Company, Lorillard Licensing Company LLC, One Park Media Services, Inc. and Plisa, S.A., incorporated herein by reference to Exhibit 10.1 to Registrant’s Report on Form 10-Q for the quarter ended June 30, 2008 10.12
Amended and Restated Employment Agreement dated as of February 12, 2015 between Registrant and Andrew H. Tisch, incorporated herein by reference to Exhibit 10.05 to Registrant’s Report on Form 10-K for the year ended December 31, 2014 10.13+
Amendment dated as of February 12, 2016 to Amended and Restated Employment Agreement between Registrant and Andrew H. Tisch, incorporated herein by reference to Exhibit 10.06 to Registrant’s Report on Form 10-K for the year ended December 31, 2015 10.14+
Supplemental Retirement Agreement dated January 1, 2002 between Registrant and Andrew H. Tisch, incorporated herein by reference to Exhibit 10.30 to Registrant’s Report on Form 10-K for the year ended December 31, 2001 10.15+

168
Exhibit Description Number
Amendment No. 1 dated January 1, 2003 to Supplemental Retirement Agreement between Registrant and Andrew H. Tisch, incorporated herein by reference to Exhibit 10.33 to Registrant’s Report on Form 10-K for the year ended December 31, 2002 10.16+
Amendment No. 2 dated January 1, 2004 to Supplemental Retirement Agreement between Registrant and Andrew H. Tisch, incorporated herein by reference to Exhibit 10.27 to Registrant’s Report on Form 10-K for the year ended December 31, 2003 10.17+
Amended and Restated Employment Agreement dated as of February 12, 2015 between Registrant and James S. Tisch, incorporated herein by reference to Exhibit 10.09 to the Registrant’s Report on Form 10-K for the year ended December 31, 2014 10.18+
Amendment dated as of February 12, 2016 to Amended and Restated Employment Agreement between Registrant and James S. Tisch, incorporated herein by reference to Exhibit 10.11 to Registrant’s Report on Form 10-K for the year ended December 31, 2015 10.19+
Supplemental Retirement Agreement dated January 1, 2002 between Registrant and James S. Tisch, incorporated herein by reference to Exhibit 10.31 to Registrant’s Report on Form 10-K for the year ended December 31, 2001 10.20+
Amendment No. 1 dated January 1, 2003 to Supplemental Retirement Agreement between Registrant and James S. Tisch, incorporated herein by reference to Exhibit 10.35 to Registrant’s Report on Form 10-K for the year ended December 31, 2002 10.21+
Amendment No. 2 dated January 1, 2004 to Supplemental Retirement Agreement between Registrant and James S. Tisch, incorporated herein by reference to Exhibit 10.34 to Registrant’s Report on Form 10-K for the year ended December 31, 2003 10.22+
Amended and Restated Employment Agreement dated as of February 12, 2015 between Registrant and Jonathan M. Tisch, incorporated herein by reference to Exhibit 10.13 to the Registrant’s Report on Form 10-K for the year ended December 31, 2014 10.23+
Amendment dated as of February 12, 2016 to Amended and Restated Employment Agreement between Registrant and Jonathan M. Tisch, incorporated herein by reference to Exhibit 10.16 to Registrant’s Report on Form 10-K for the year ended December 31, 2015 10.24+
Supplemental Retirement Agreement dated January 1, 2002 between Registrant and Jonathan M. Tisch, incorporated herein by reference to Exhibit 10.32 to Registrant’s Report on Form 10-K for the year ended December 31, 2001 10.25+
Amendment No. 1 dated January 1, 2003 to Supplemental Retirement Agreement between Registrant and Jonathan M. Tisch, incorporated herein by reference to Exhibit 10.37 to Registrant’s Report on Form 10-K for the year ended December 31, 2002 10.26+
Amendment No. 2 dated January 1, 2004 to Supplemental Retirement Agreement between Registrant and Jonathan M. Tisch, incorporated herein by reference to Exhibit 10.41 to Registrant’s Report on Form 10-K for the year ended December 31, 2003 10.27+
Lease agreement dated November 20, 2001 between 61st & Park Ave. Corp. and Preston R. Tisch and Joan Tisch, incorporated herein by reference to Exhibit 10.1 to Registrant’s Report on Form 10-Q filed August 4, 2009 10.28

169
Exhibit Description Number
(12) Computation of ratio of earnings to fixed charges 12.1*
(21) Subsidiaries of the Registrant
List of subsidiaries of the Registrant 21.01*
(23) Consent of Experts and Counsel
Consent of Deloitte & Touche LLP 23.01*
(31) Rule 13a-14(a)/15d-14(a) Certifications
Certification by the Chief Executive Officer of the Company pursuant to Rule 13a-14(a) and Rule 15d-14(a) 31.01*
Certification by the Chief Financial Officer of the Company pursuant to Rule 13a-14(a) and Rule 15d-14(a) 31.02*
(32) Section 1350 Certifications
Certification by the Chief Executive Officer of the Company pursuant to 18 U.S.C. Section 1350 (as adopted by Section 906 of the Sarbanes-Oxley Act of 2002) 32.01*
Certification by the Chief Financial Officer of the Company pursuant to 18 U.S.C. Section 1350 (as adopted by Section 906 of the Sarbanes-Oxley Act of 2002) 32.02*
(100) XBRL Related Documents
XBRL Instance Document 101.INS* XBRL Taxonomy Extension Schema 101.SCH* XBRL Taxonomy Extension Calculation Linkbase 101.CAL* XBRL Taxonomy Extension Definition Linkbase 101.DEF* XBRL Taxonomy Label Linkbase 101.LAB* XBRL Taxonomy Extension Presentation Linkbase 101.PRE*
*Filed herewith. +Management contract or compensatory plan or arrangement.
Item 16. Form 10-K Summary. Not included.

170
SIGNATURES Pursuant to the requirements of Section 13 or 15(d) of the Securities Exchange Act of 1934, the Registrant has duly caused this Report to be signed on its behalf by the undersigned, thereunto duly authorized. LOEWS CORPORATION Dated: February 16, 2017 By /s/ David B. Edelson (David B. Edelson, Senior Vice President and Chief Financial Officer) Pursuant to the requirements of the Securities Exchange Act of 1934, this Report has been signed below by the following persons on behalf of the Registrant and in the capacities and on the dates indicated. Dated: February 16, 2017 By /s/ James S. Tisch (James S. Tisch, President, Chief Executive Officer and Director) Dated: February 16, 2017 By /s/ David B. Edelson (David B. Edelson, Senior Vice President and Chief Financial Officer) Dated: February 16, 2017 By /s/ Mark S. Schwartz (Mark S. Schwartz, Vice President and Chief Accounting Officer) Dated: February 16, 2017 By /s/ Lawrence S. Bacow (Lawrence S. Bacow, Director) Dated: February 16, 2017 By /s/ Ann E. Berman (Ann E. Berman, Director) Dated: February 16, 2017 By /s/ Joseph L. Bower (Joseph L. Bower, Director)

171
Dated: February 16, 2017 By /s/ Charles D. Davidson (Charles D. Davidson, Director) Dated: February 16, 2017 By /s/ Charles M. Diker (Charles M. Diker, Director) Dated: February 16, 2017 By /s/ Jacob A. Frenkel (Jacob A. Frenkel, Director) Dated: February 16, 2017 By /s/ Paul J. Fribourg (Paul J. Fribourg, Director) Dated: February 16, 2017 By /s/ Walter L. Harris (Walter L. Harris, Director) Dated: February 16, 2017 By /s/ Philip A. Laskawy (Philip A. Laskawy, Director) Dated: February 16, 2017 By /s/ Ken Miller (Ken Miller, Director) Dated: February 16, 2017 By /s/ Andrew H. Tisch (Andrew H. Tisch, Director) Dated: February 16, 2017 By /s/ Jonathan M. Tisch (Jonathan M. Tisch, Director) Dated: February 16, 2017 By /s/ Anthony Welters (Anthony Welters, Director)

172
SCHEDULE I
Condensed Financial Information of Registrant
LOEWS CORPORATION BALANCE SHEETS
ASSETS
December 31 2016 2015 (In millions) Current assets, principally investment in short term instruments $ 3,096 $ 2,888 Investments in securities 1,931 1,487 Investments in capital stocks of subsidiaries, at equity 15,114 15,129 Other assets 389 97 Total assets $ 20,530 $ 19,601
LIABILITIES AND SHAREHOLDERS’ EQUITY Current liabilities $ 140 $ 260 Short term debt 400 Long term debt 1,775 1,279 Deferred income tax and other 452 101 Total liabilities 2,367 2,040 Shareholders’ equity 18,163 17,561 Total liabilities and shareholders’ equity $ 20,530 $ 19,601
STATEMENTS OF INCOME AND COMPREHENSIVE INCOME (LOSS) Year Ended December 31 2016 2015 2014 (In millions) Revenues: Equity in income of subsidiaries (a) $ 655 $ 302 $ 1,034 Interest and other 165 74 92 Total 820 376 1,126 Expenses: Administrative 127 108 97 Interest 72 74 74 Total 199 182 171 Income before income tax 621 194 955 Income tax benefit 33 66 7 Income from continuing operations 654 260 962 Discontinued operations, net (371) Net income 654 260 591 Equity in other comprehensive income (loss) of subsidiaries 134 (638) (59) Total comprehensive income (loss) $ 788 $ (378) $ 532

173
SCHEDULE I (Continued)
Condensed Financial Information of Registrant
LOEWS CORPORATION STATEMENTS OF CASH FLOWS
Year Ended December 31 2016 2015 2014 (In millions) Operating Activities: Net income $ 654 $ 260 $ 591 Adjustments to reconcile net income to net cash provided (used) by operating activities: Equity method investees 115 488 95 Provision for deferred income taxes 10 113 (62) Changes in operating assets and liabilities, net: Receivables 2 (6) (2) Accounts payable and accrued liabilities 52 71 200 Trading securities (614) 718 (269) Other, net (15) (8) (23) 204 1,636 530 Investing Activities: Investments in and advances to subsidiaries 50 (285) 130 Change in investments, primarily short term (127) 7 Other (2) (4) (2) (79) (289) 135 Financing Activities: Dividends paid (84) (90) (95) Issuance of common stock 7 6 Purchases of treasury shares (134) (1,265) (622) Principal payments in debt (400) Issuance of debt 495 Other (2) 1 2 (125) (1,347) (709) Net change in cash - - (44) Cash, beginning of year 44 Cash, end of year $ - $ - $ - (a) Cash dividends paid to the Company by affiliates amounted to $780, $816 and $782 for the years ended December 31,
2016, 2015 and 2014.

174
SCHEDULE II
LOEWS CORPORATION AND SUBSIDIARIES
Valuation and Qualifying Accounts
Column A Column B Column C Column D Column E Additions Balance at Charged to Charged Balance at Beginning Costs and to Other End of
Description of Period Expenses Accounts Deductions Period (In millions) For the Year Ended December 31, 2016
Deducted from assets: Allowance for doubtful accounts $ 96 $ - $ - $ 6 $ 90 Total $ 96 $ - $ - $ 6 $ 90 For the Year Ended December 31, 2015
Deducted from assets: Allowance for doubtful accounts $ 117 $ - $ - $ 21 $ 96 Total $ 117 $ - $ - $ 21 $ 96 For the Year Ended December 31, 2014
Deducted from assets: Allowance for doubtful accounts $ 329 $ - $ - $ 212 $ 117 Total $ 329 $ - $ - $ 212 $ 117

175
SCHEDULE V
LOEWS CORPORATION AND SUBSIDIARIES
Supplemental Information Concerning Property and Casualty Insurance Operations Consolidated Property and Casualty Operations December 31 2016 2015 (In millions) Deferred acquisition costs $ 599 $ 598 Reserves for unpaid claim and claim adjustment expenses 22,343 22,663 Discount deducted from claim and claim adjustment expense reserves above (based on interest rates ranging from 3.5% to 8.0%) 1,572 1,534 Unearned premiums 3,762 3,671 Year Ended December 31 2016 2015 2014 (In millions) Net written premiums $ 6,988 $ 6,962 $ 7,088 Net earned premiums 6,924 6,921 7,212 Net investment income 1,952 1,807 2,031 Incurred claim and claim adjustment expenses related to current year 5,025 4,934 5,043 Incurred claim and claim adjustment expenses related to prior years (342) (255) (39) Amortization of deferred acquisition costs 1,235 1,540 1,317 Paid claim and claim adjustment expenses 5,134 4,945 5,297


DIVIDEND INFORMATION
We have paid quarterly cash dividends in each year since 1967. Regular dividends of $0.0625 per share of Loews common stock were paid in each calendar quarter of 2016 and 2015.
ANNUAL MEETING
The Annual Meeting of Shareholders will be held at the Loews Regency New York Hotel, 540 Park Avenue, New York, New York, on Tuesday, May 9, 2017, at 11:00 a.m. Eastern Time.
TRANSFER AGENT AND REGISTRARCOMPUTERSHARE
P.O. Box 30170 College Station, TX 77842-3170 800-358-9151www.computershare.com/investor
INDEPENDENT AUDITORSDELOITTE & TOUCHE LLP
30 Rockefeller Plaza New York, NY 10112www.deloitte.com
Des
ign
by
Ad
dis
on
w
ww
.ad
dis
on
.co
m

667 MADISON AVE. NEW YORK, NY 10065www.loews.com


