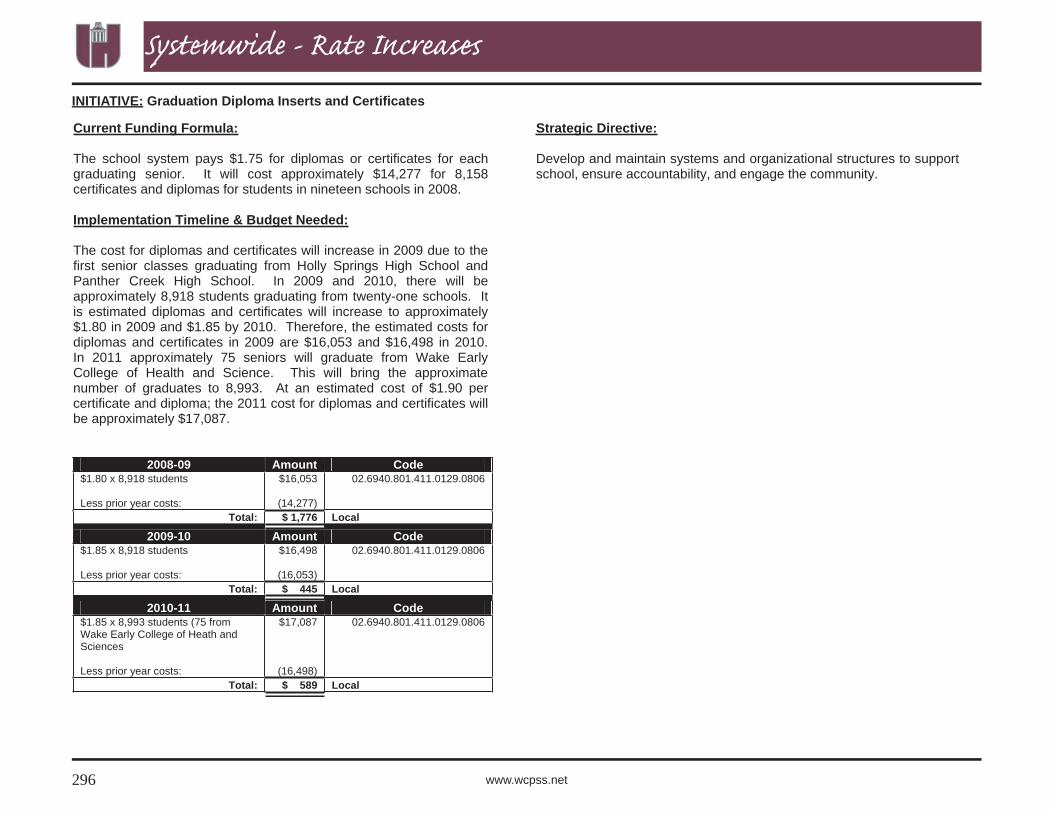
Letter to the Wake County Commissioners Wake County Public School System - FY 2008-09 Plan for Student Success Ler to th e Wake County Commi ioners WAKE COUNTY _____________________________________________________________________________________________ BOARD OF EDUCATION District 4 (East Raleigh) Rosa Gill, Chair [email protected]District 6 (Central Raleigh) Beverley Clark, Vice Chair [email protected]District 1 (Northeast Wake) Lori Millberg [email protected]District 2 (Southeast Wake) Horace Tart [email protected]District 3 (North Raleigh) Kevin Hill [email protected]District 5 (South Central Raleigh) Anne McLaurin [email protected]District 7 (West Raleigh/Morrisville) Patti Head [email protected]District 8 (Southern Wake) Ron Margiotta [email protected]District 9 (Western Wake) Eleanor Goettee [email protected]May 1, 2008 Dear Wake County Board of Commissioners: On behalf of the Wake County Board of Education, I am honored to present our 2008-09 Plan for Student Success for your consideration. The Plan for Student Success contains our requested operational budget for the 2008-09 school year, three-year planning projections, and business cases or growth cases for changes in expenditures. A comprehensive, independent curriculum management audit of the Wake County Public School System confirmed that we have strong schools in every corner of our county, but it also indicated that much more work needs to be done to ensure the elimination of achievement gaps and the preparation of all of our students for a global economy. As our board and administration have begun responding to the audit's implications, we are also moving forward with a budget request that supports academically gifted students, broadens the reach of literacy and foreign language instruction, and enables us to better retain and recruit high quality teachers. We look forward to working with you to continue strengthening the ability of our schools to help every child graduate prepared for the future. Sincerely, Rosa Gill, Chair Wake County Board of Education 3600 WAKE FOREST ROAD, P.O.BOX 28041 RALEIGH, NORTH CAROLINA 27611-804
Transcript
Letter to the Wake County CommissionersWake County Public School System - FY 2008-09 Plan for Student Success
Lett er to the Wake County Commiss ioners
WAKE COUNTY _____________________________________________________________________________________________ BOARD OF EDUCATION
On behalf of the Wake County Board of Education, I am honored to present our 2008-09 Plan for Student Success for your consideration. The Plan for Student Success contains our requested operational budget for the 2008-09 school year, three-year planning projections, and business cases or growth cases for changes in expenditures.
A comprehensive, independent curriculum management audit of the Wake County Public School System confirmed that we have strong schools in every corner of our county, but it also indicated that much more work needs to be done to ensure the elimination of achievement gaps and the preparation of all of our students for a global economy. As our board and administration have begun responding to the audit's implications, we are also moving forward with a budget request that supports academically gifted students, broadens the reach of literacy and foreign language instruction, and enables us to betterretain and recruit high quality teachers.
We look forward to working with you to continue strengthening the ability of our schools to help every child graduate prepared for the future.
Sincerely,
Rosa Gill, Chair Wake County Board of Education
3600 WAKE FOREST ROAD, P.O.BOX 28041RALEIGH, NORTH CAROLINA 27611-804
IContentsWake County Public School System - FY 2008-09 Plan for Student Success
Introduction1 A Message from the Superintendent Dr. Del Burns, Superintendent, provides a message about the 2008-09 Plan for Stu-dent Success which includes annual fi nan-cial planning and meeting the needs of a projected enrollment of 140,443 students in the upcoming school year.
3 Get to Know the Wake County Public School System Learn about our schools, students, and employees. Other information such as testing, student performance and our economy are also in-cluded in this section.
16 Budget at a Glance Where do funds come from and where are funds spent in the Wake County Public School System?
18 Budget Development and Drivers How is the budget developed for the upcoming school year? What drives funding?
20 Budget Highlights Detailed information about how the budget is distributed. Requests for resources in the new year can also be found.
Organization39 The Board of Education45 Wake County Public School Systems Strategic Plans 2007-201045 Organization Charts68 Assignments for Area Superintendents
75 Budget and Financial Policies80 Fund Balance82 Budget Process88 Budget Administration and Management Process
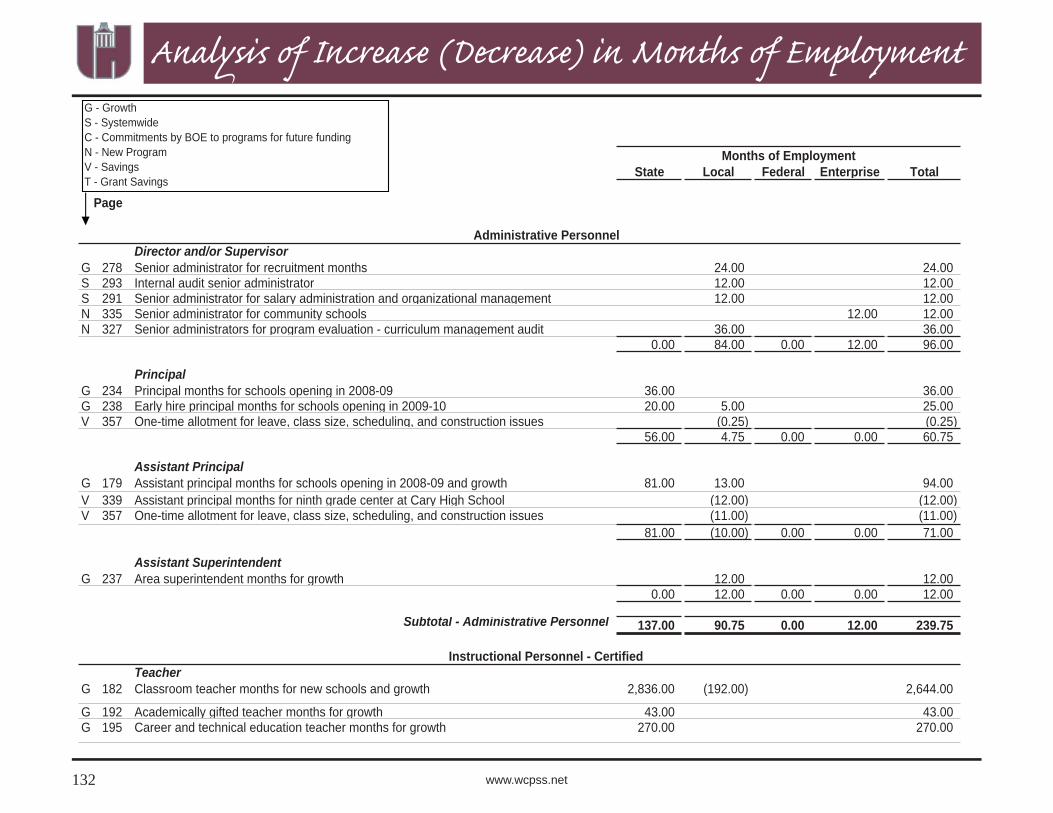
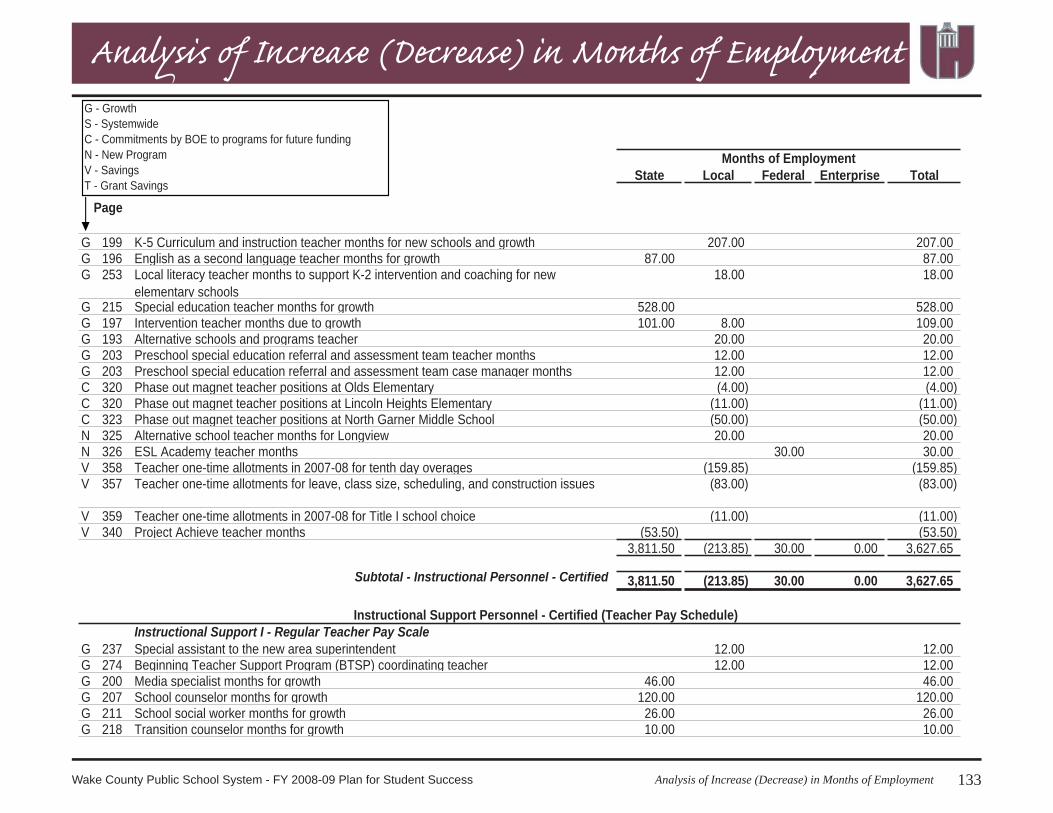
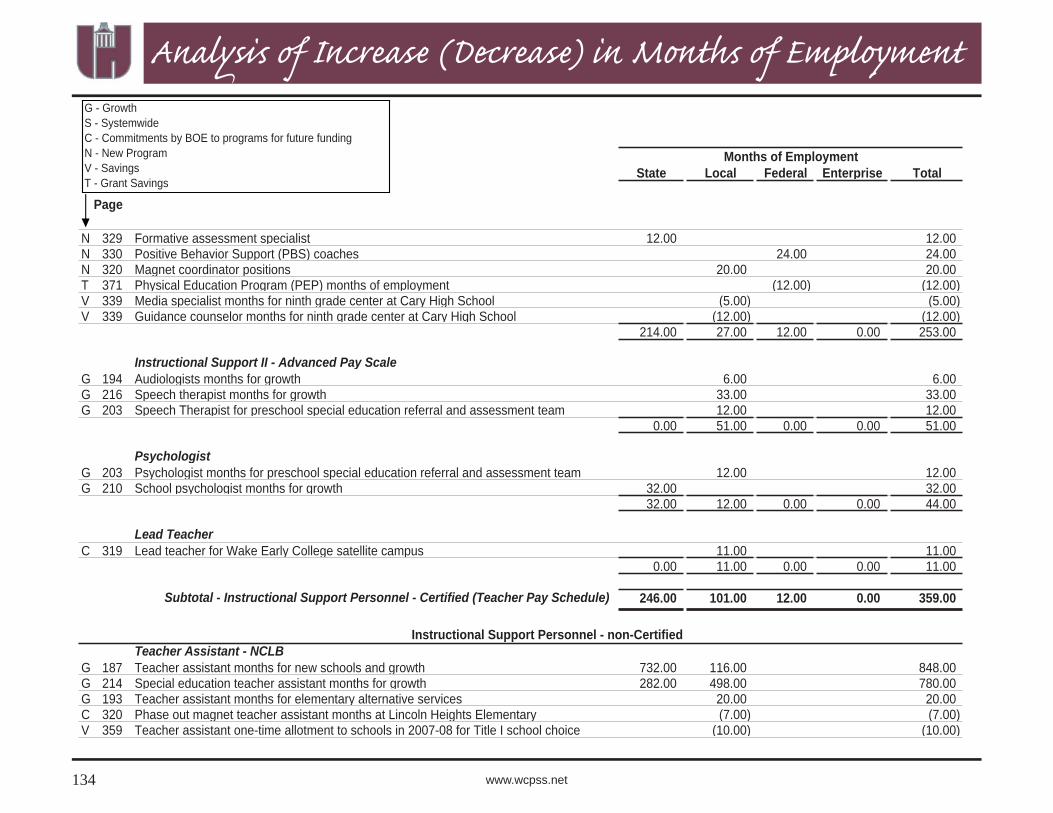
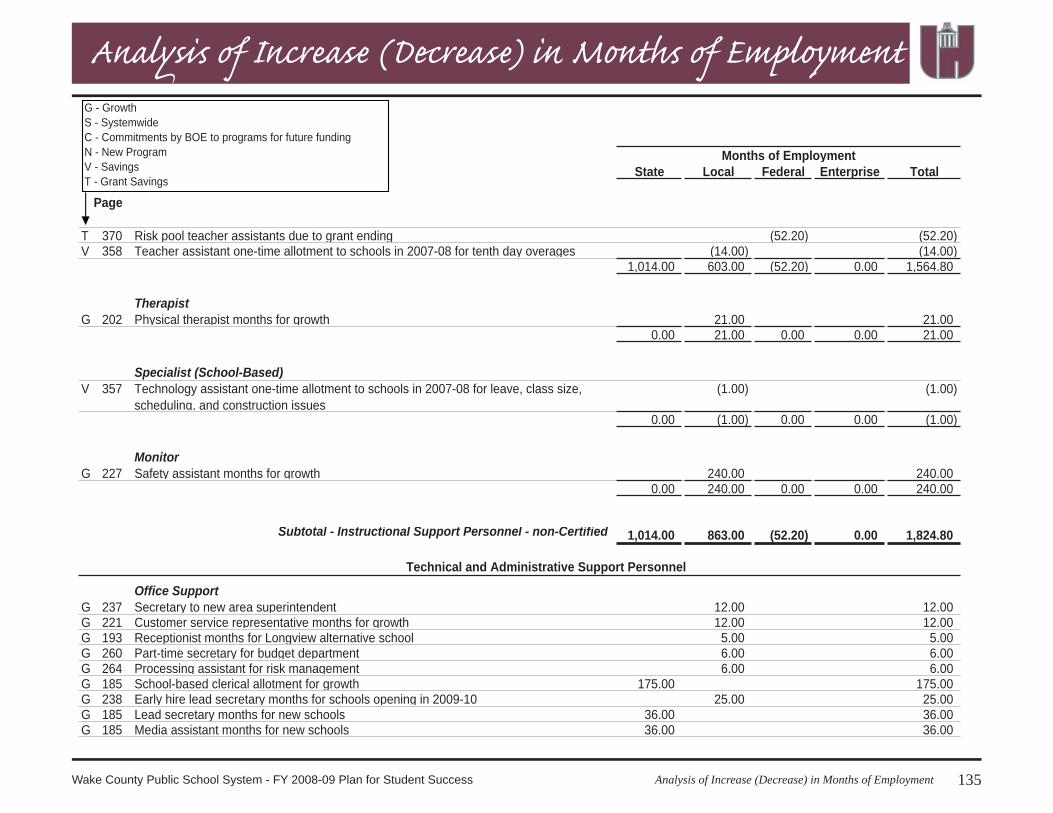
Financial91 District and Financial Structure 94 Budget Resolution98 Anticipated Revenues118 Budget by Object Code126 Budget by Purpose Code127 Staff Allotments139 Staff Budget132 Analysis of Increase (Decrease) in Months of Employment139 Statement of Revenues, Expenditures, and Changes in Fund Balance
Contents2008-09 Adopted Plan for Student Success
141Capital Improvement PlanThe Capital Improvement Plan builds new schools, iden-tifi es land for future building programs, renovates existing schools, and provides needed technology upgrades.
II www.wcpss.net
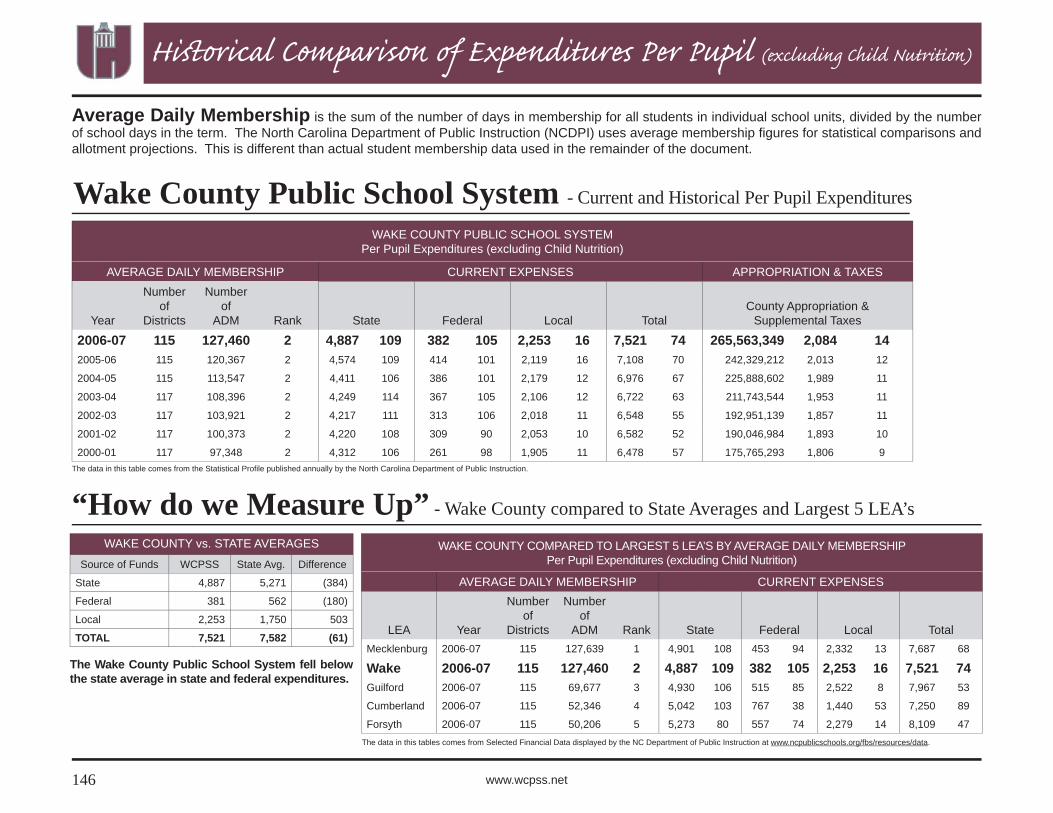
Information145 Historical Expenditures per Pupil (excluding Child Nutrition) Compare expenditures per pupil in the Wake County Public School System against the 5 largest school systems in North Carolina. How do we measure up?
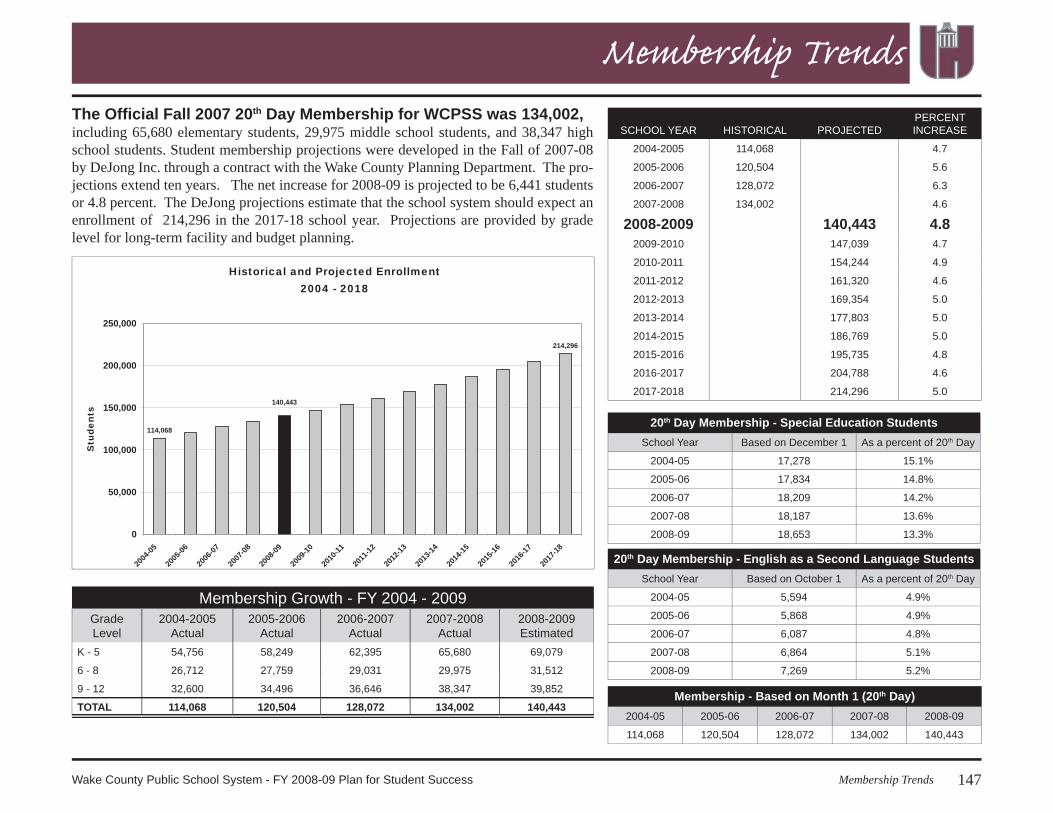
147 Membership TrendsInformation about historical enrollment and projections for students com-ing to the Wake County Public School System through the year 2018.
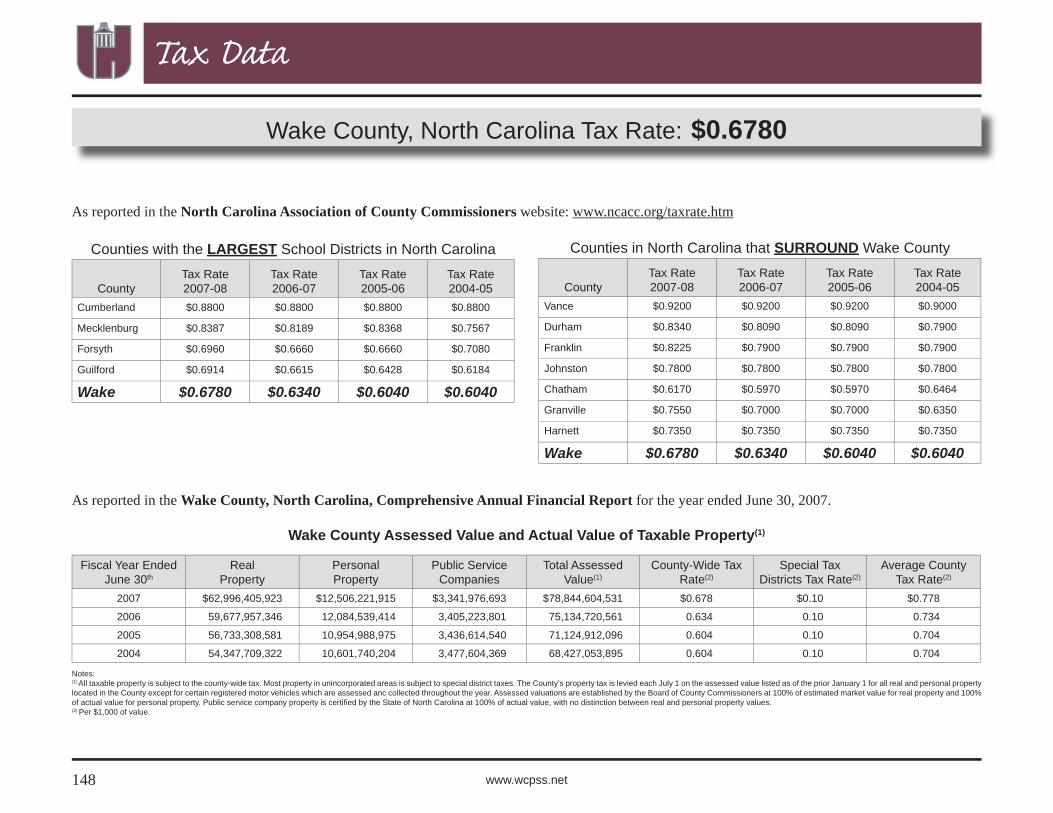
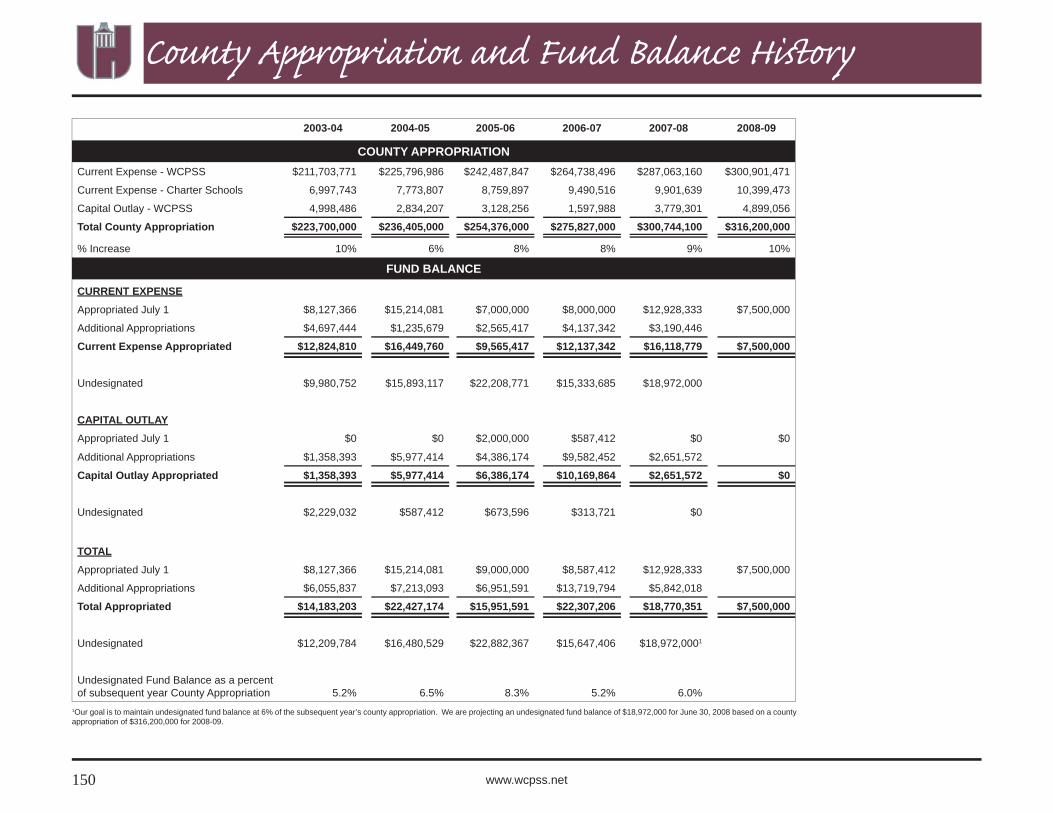
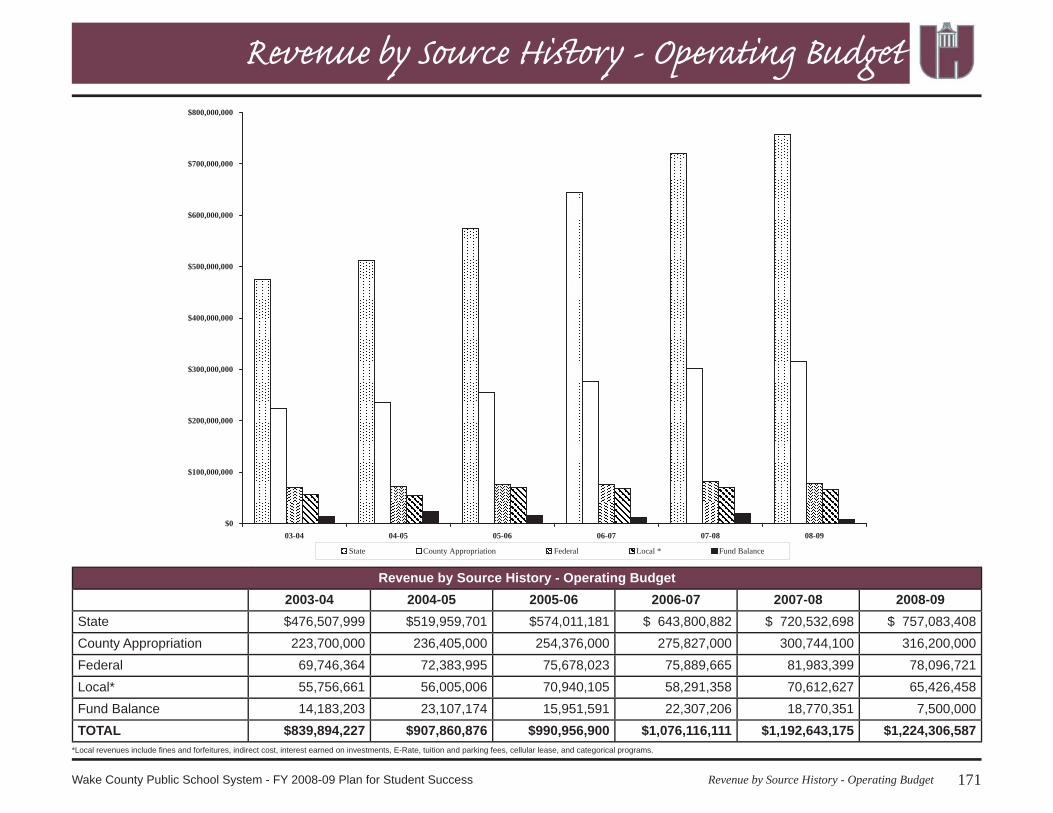
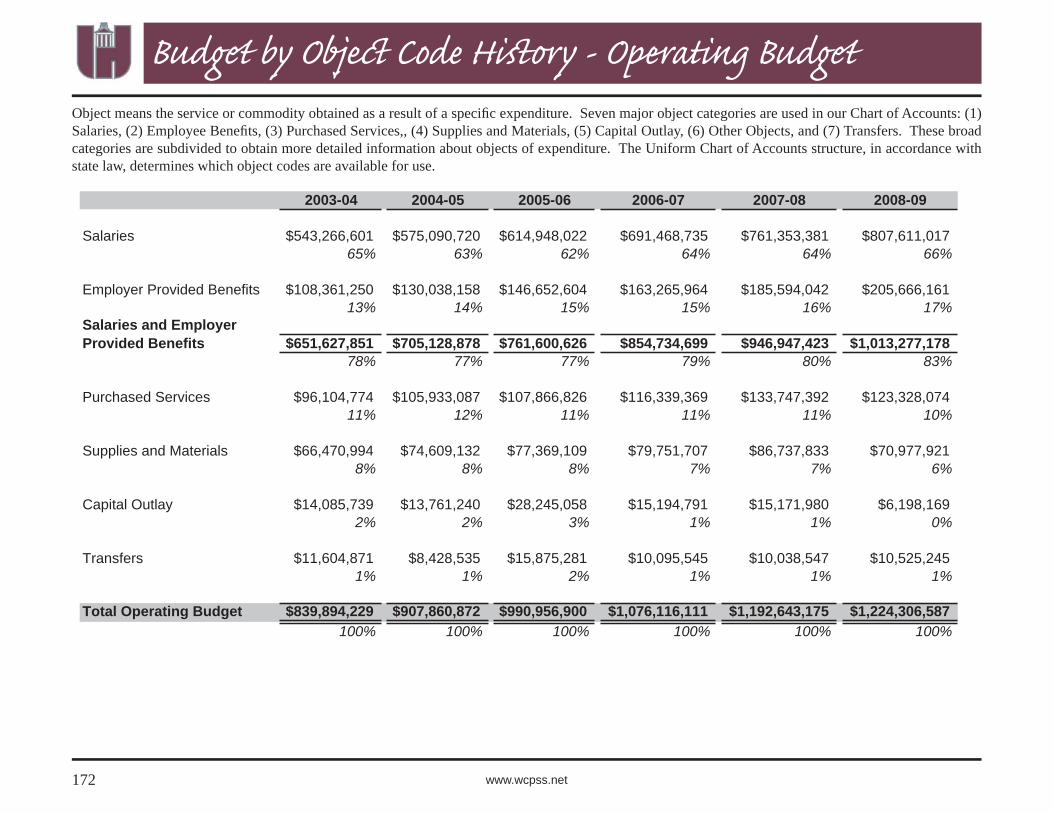
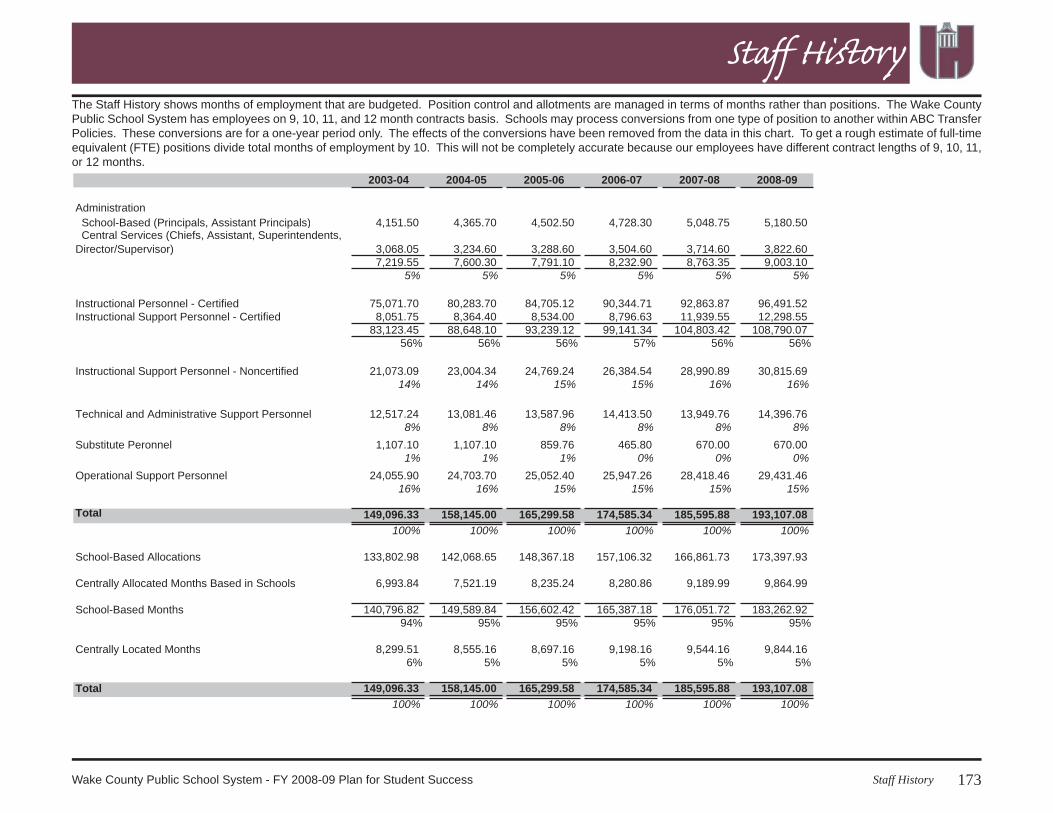
148 Tax Data150 County Appropriation and Fund Balance History152 Budgetary Assumptions166 Student Achievement169 Changes in Standards and Expectations171 Historical Comparison of Revenues by Source172 Budget by Object Code History - Operating Budget173 Staff History174 Wake County Demographics
Reques ts for Funding179 Growth RequestsRequests are included for months of employment (MOE) and dollars needed due to student membership, number and type of schools, number of staff, square footage, acreage, mileage, and number of facilities.
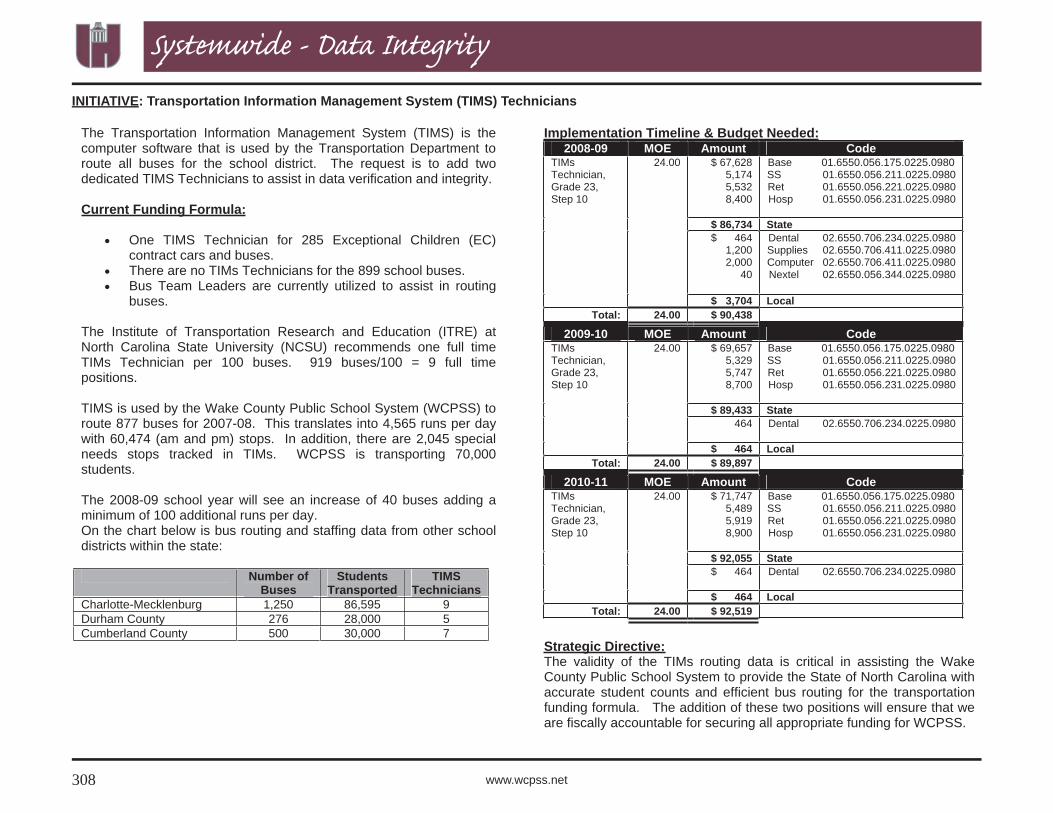
289 Systemwide RequestsRequests are included for fi scal accountability, rate increases, facil-ity leases, safety and security, data integrity, fi xed asset replacement and capital budget.
319 Commitments by the Board of Education for Future FundingAdjustments are included for changes to programs committed to by the Board of Education dur-ing 2007-08 to be effective in 2008-09, 2009-10, or 2010-11.
325 New Programs or Increases to Existing ProgramsRequests are included for any new programs or expansions to existing programs in terms of months of em-ployment and dollars. All increases requested must be aligned and re-lated to the system goal.
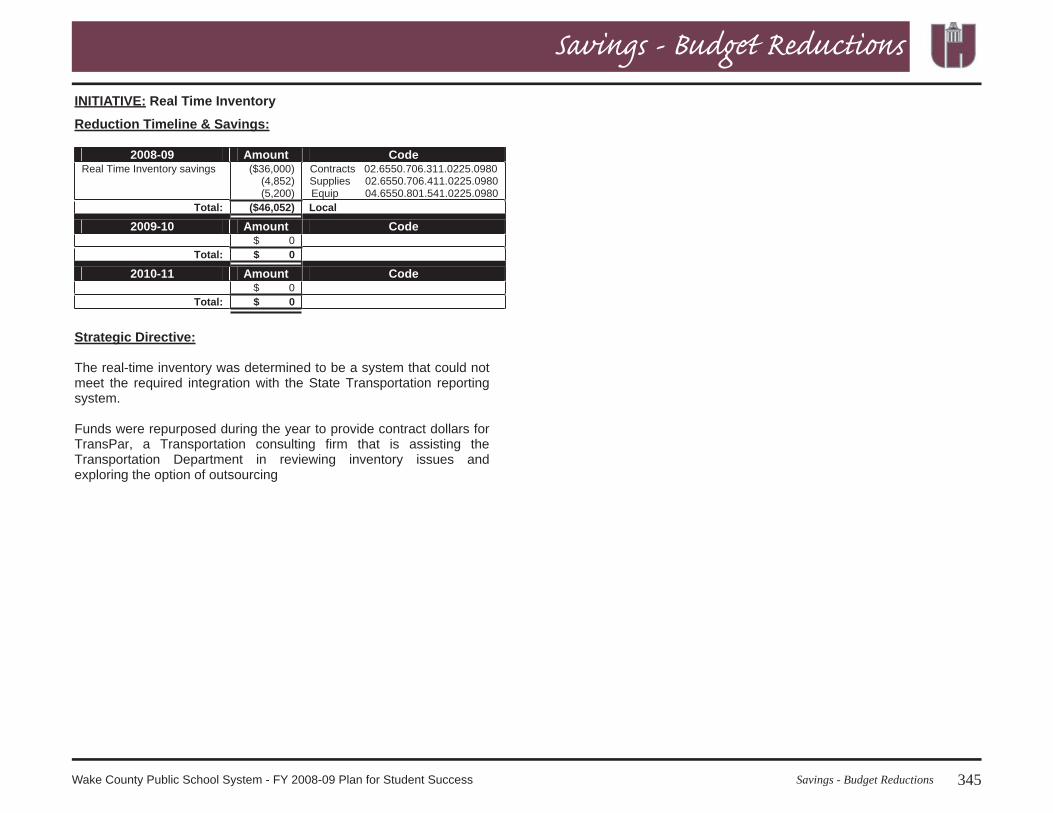
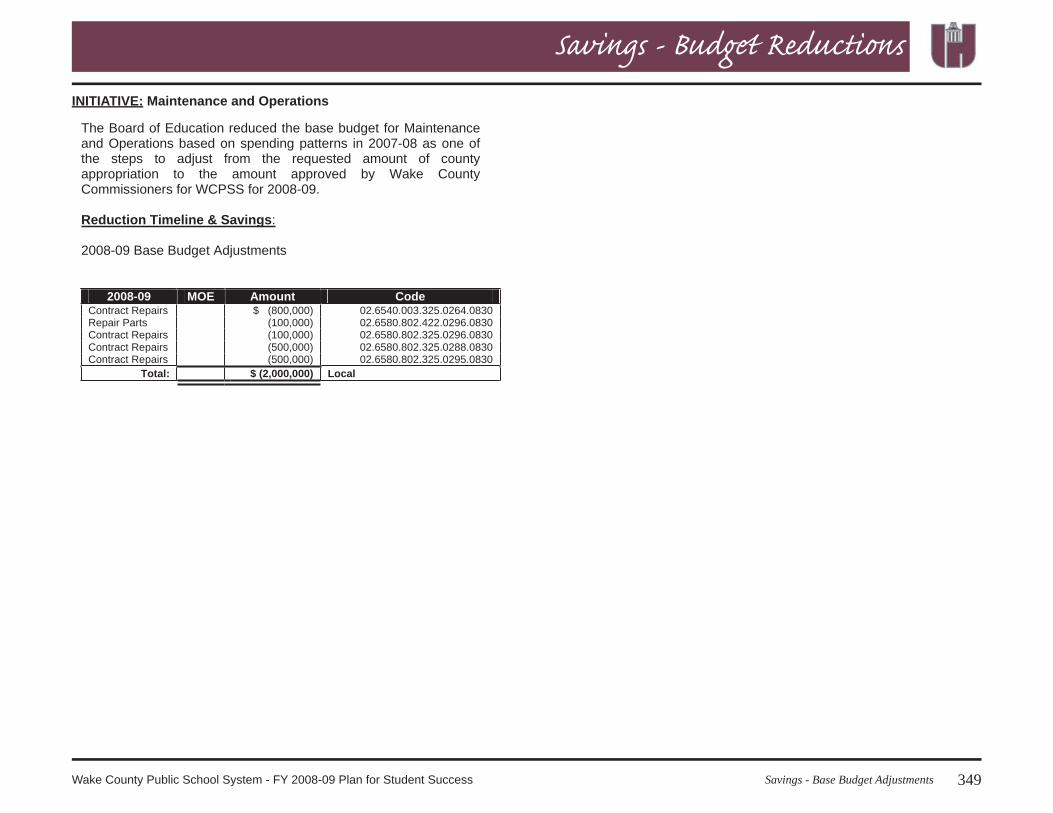
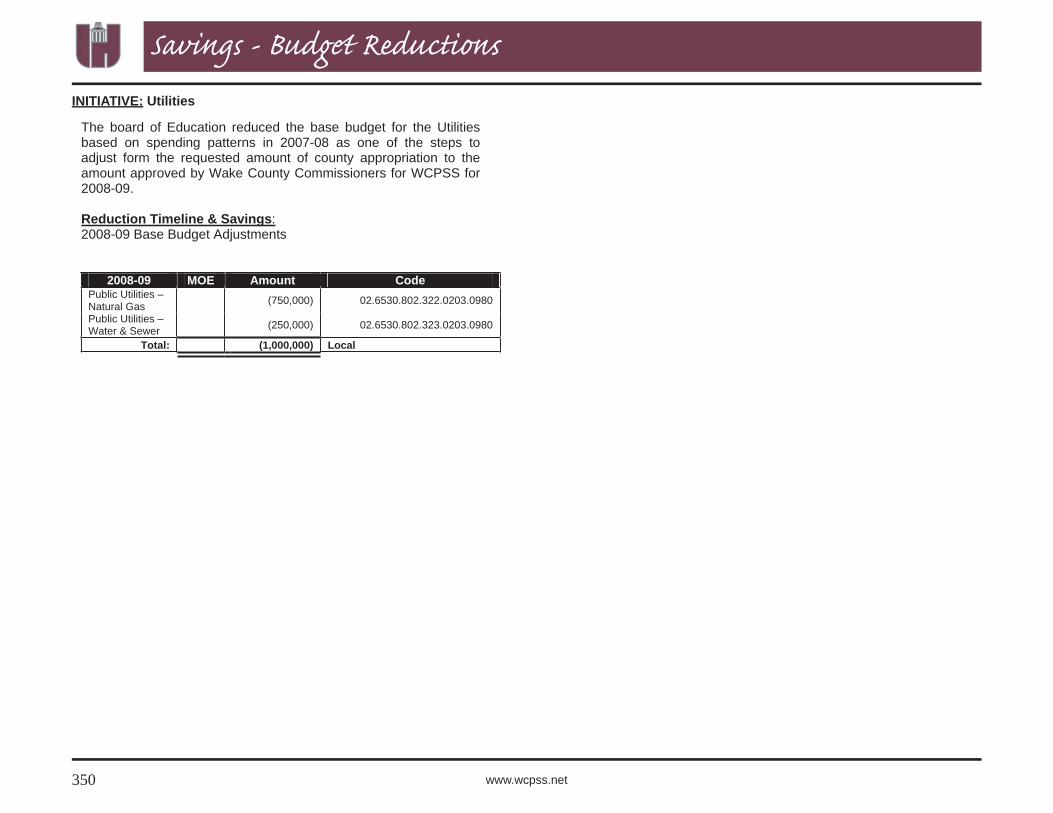
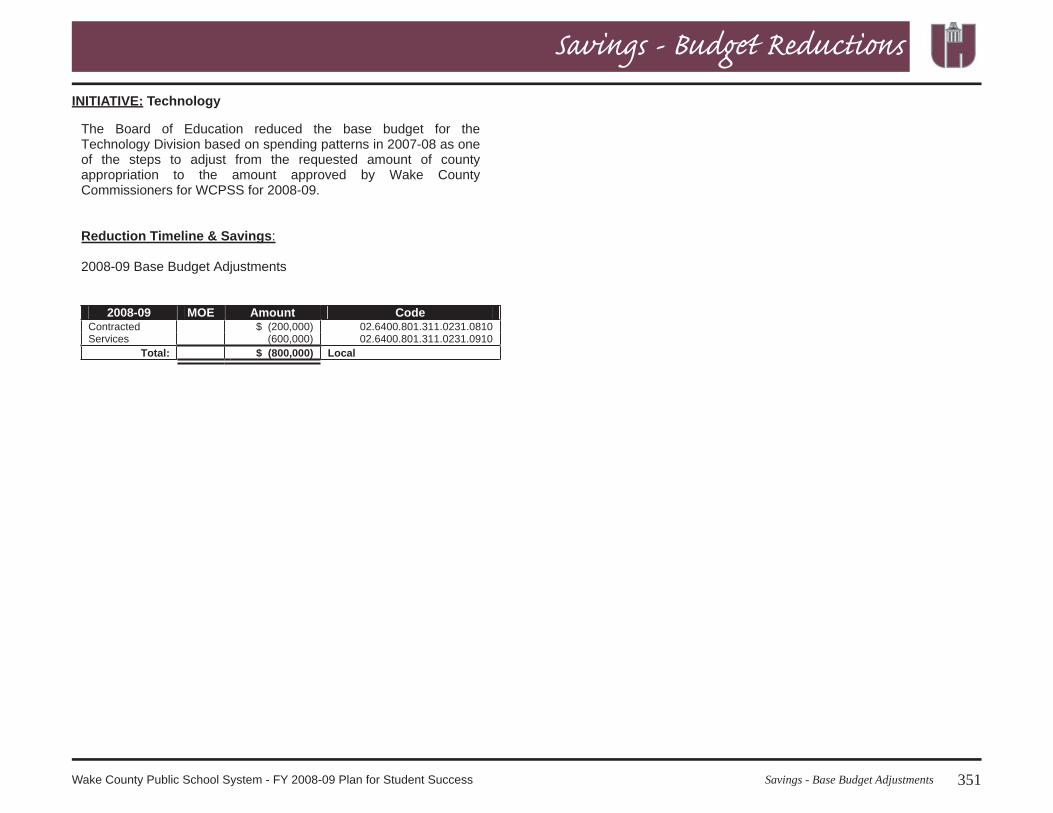
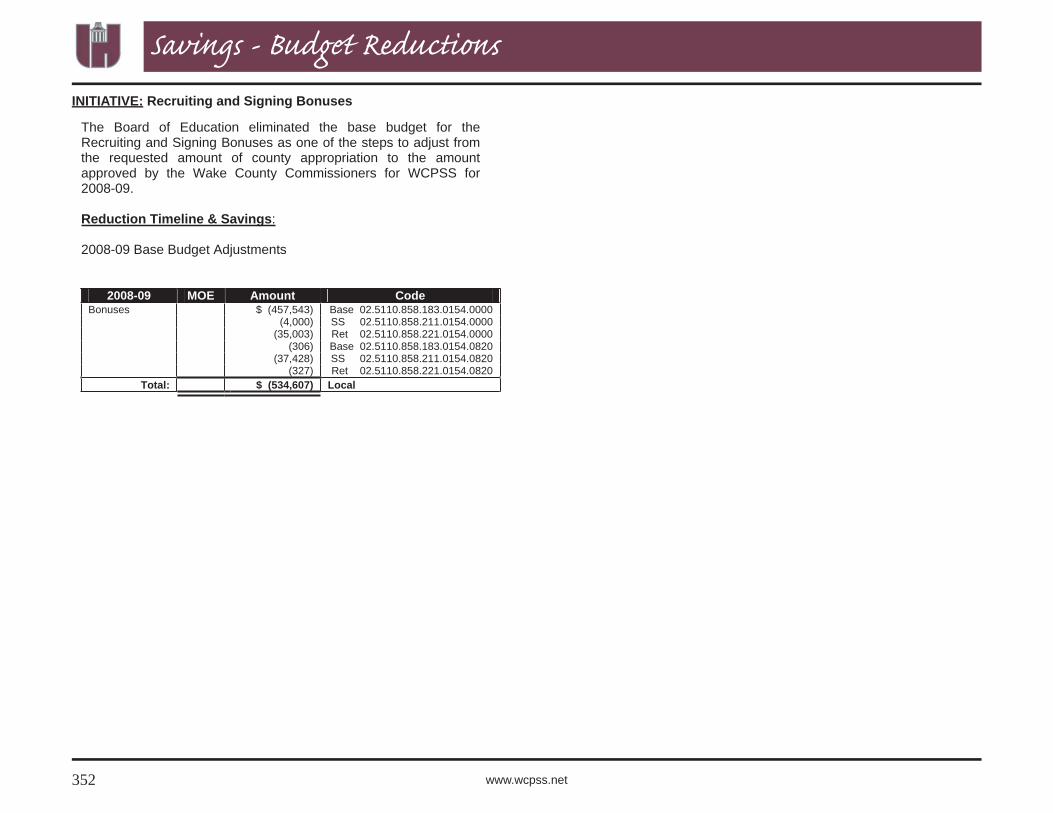
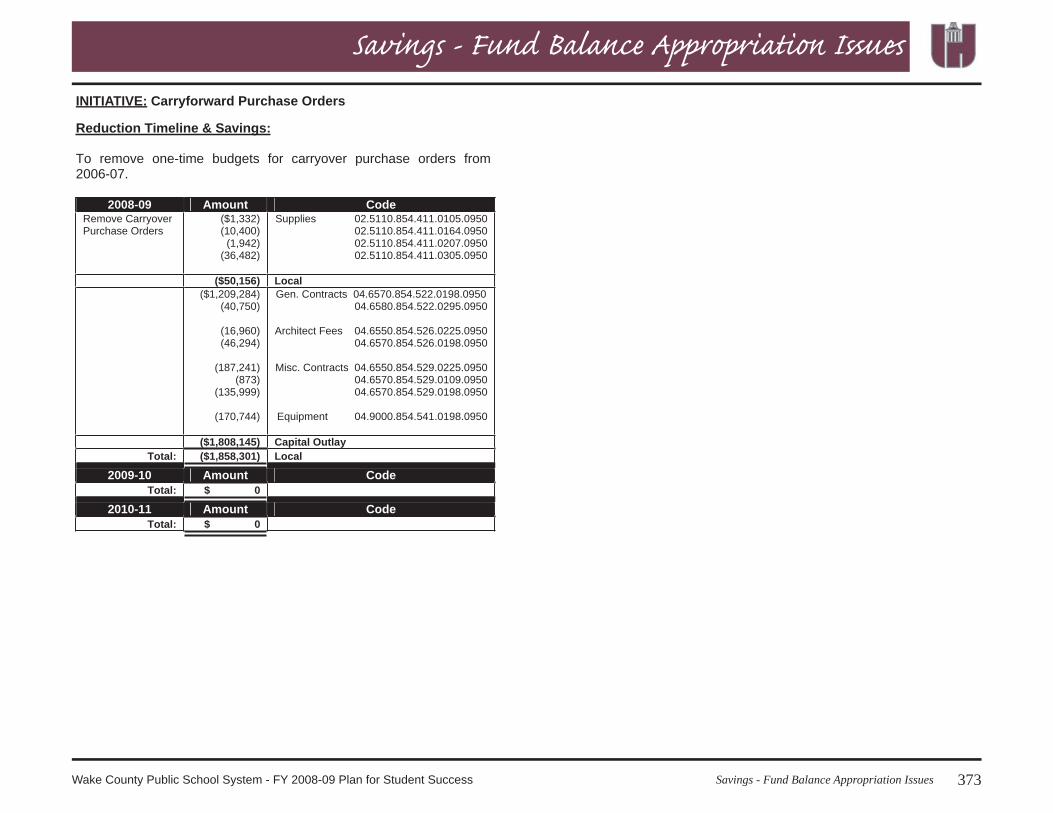
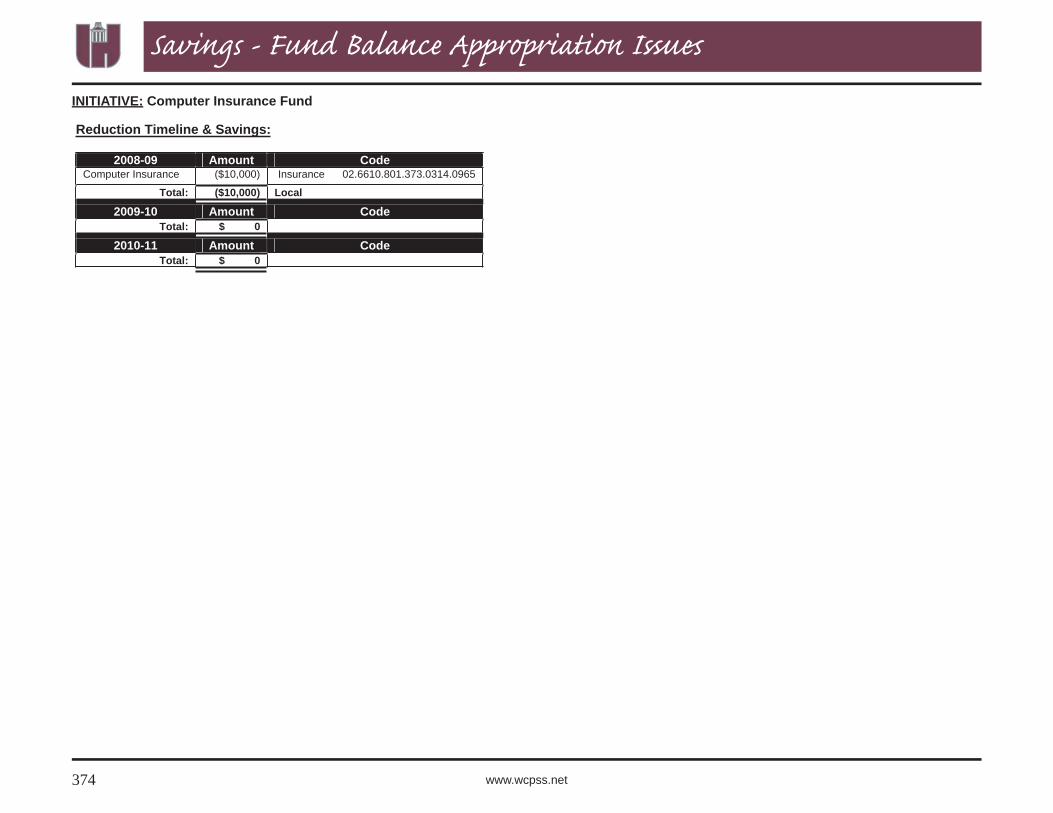
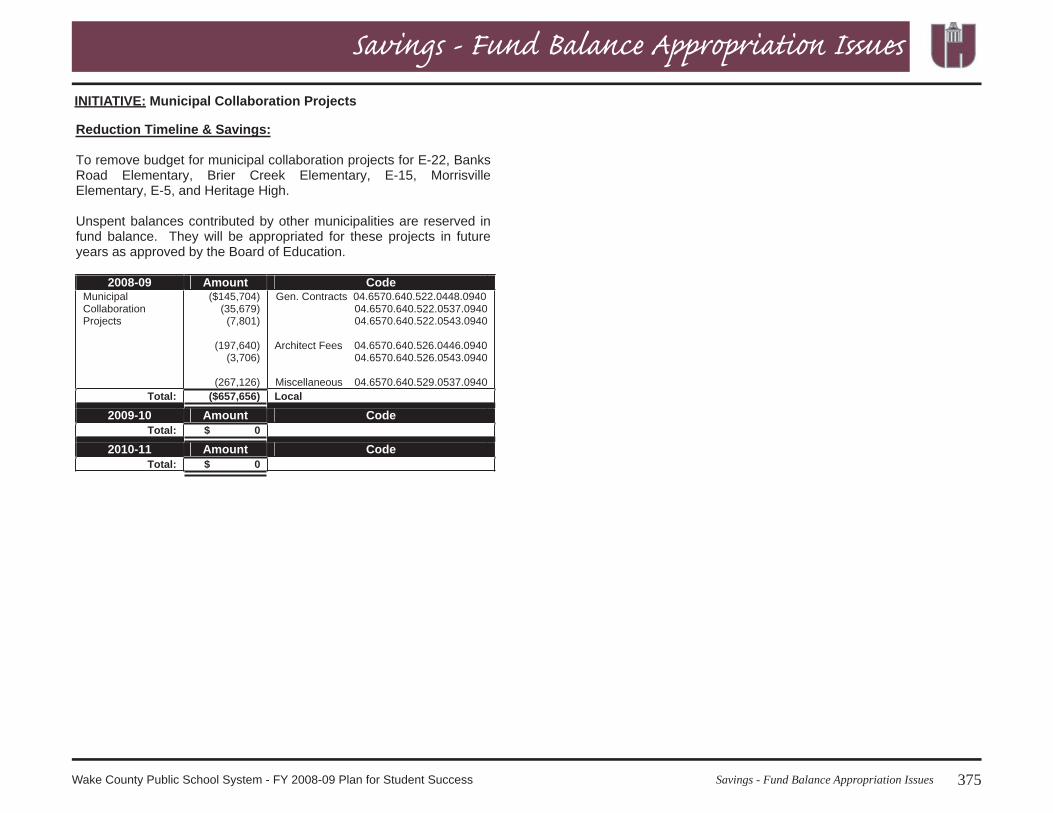
337 SavingsSavings from the previous year were identifi ed. Elimination of one-time costs will be included as a reduction in the budget. As part of our fi nancial management process, programs are reviewed monthly to determine expenditure patterns that may vary from budget.
Help with Navigating this Document377 Acronyms385 Glossary407 Index
Budget Document Survey 413 Take our Survey!Your opinion is important to us! Please take a few minutes to tell us what you think about our budget document. Your comments will be used to assist us in improving the document.
Contents2008-09 Adopted Plan for Student Success
1Message from the SuperintendentWake County Public School System - FY 2008-09 Plan for Student Success
March 4, 2008
Wake County Board of Education:
In an increasingly complex world, with increasingly complex student needs, the
Wake County Public School System is re-defi ning itself as a results-driven, continu-ously improving organization placing stu-dent learning fi rst.
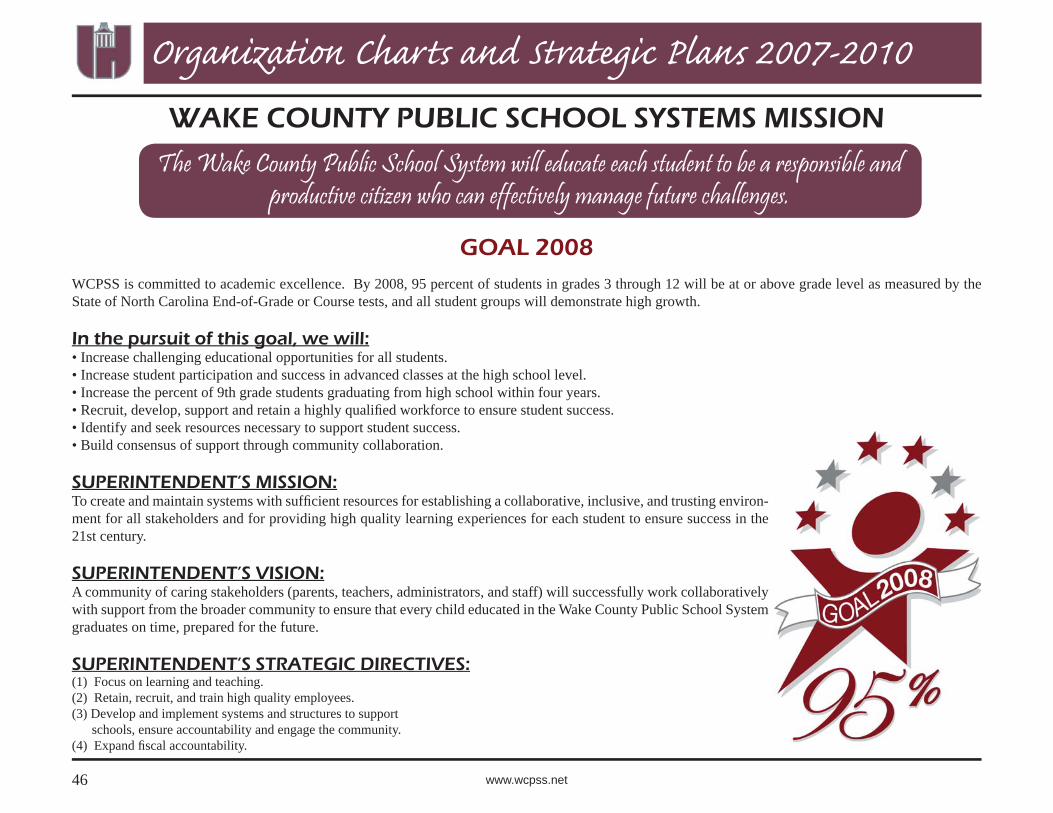
This document is the culmination of our annual fi nancial planning, which begins with re-purposing existing resources then identifi es unmet needs for our projected 140,443 students in the 2008-09 school year. Our planning aligns resources with results in order to achieve our vision:
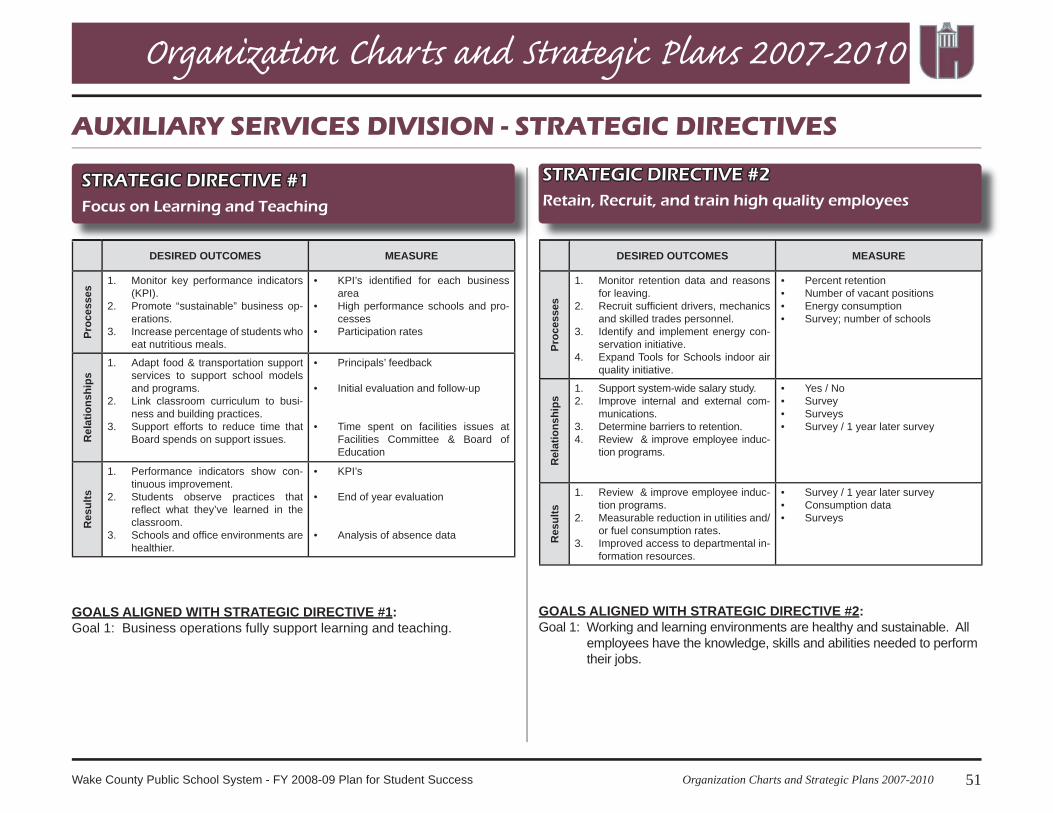
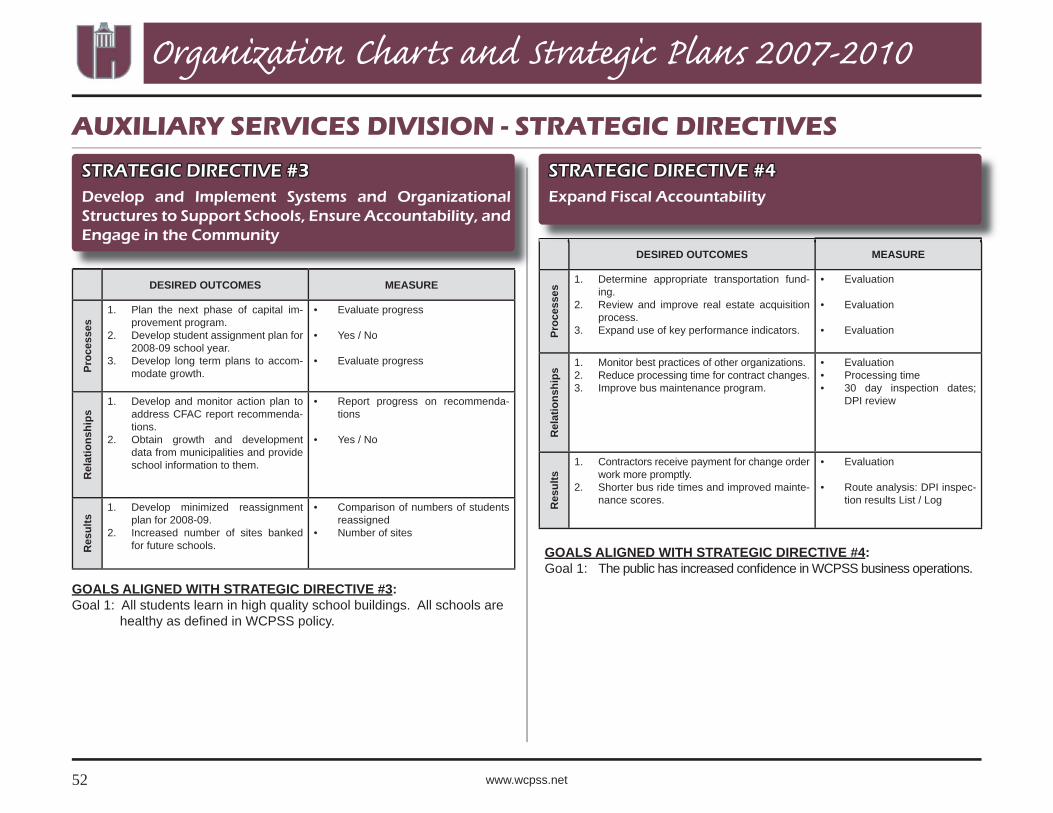
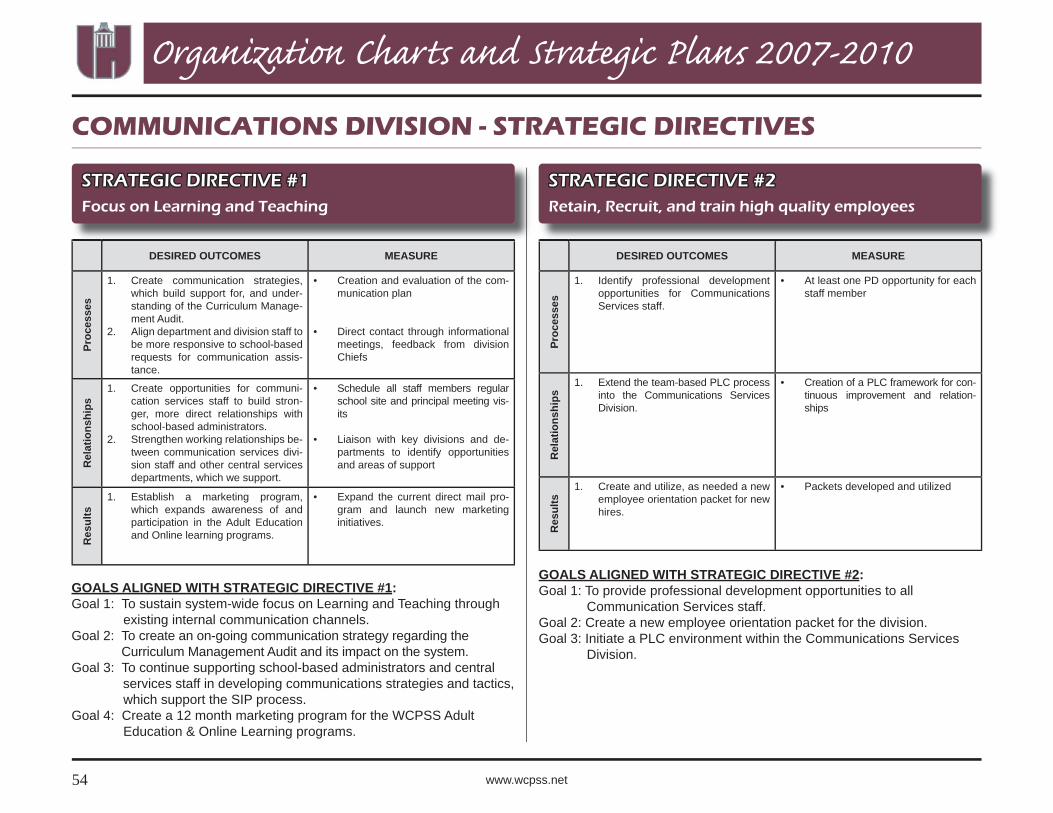
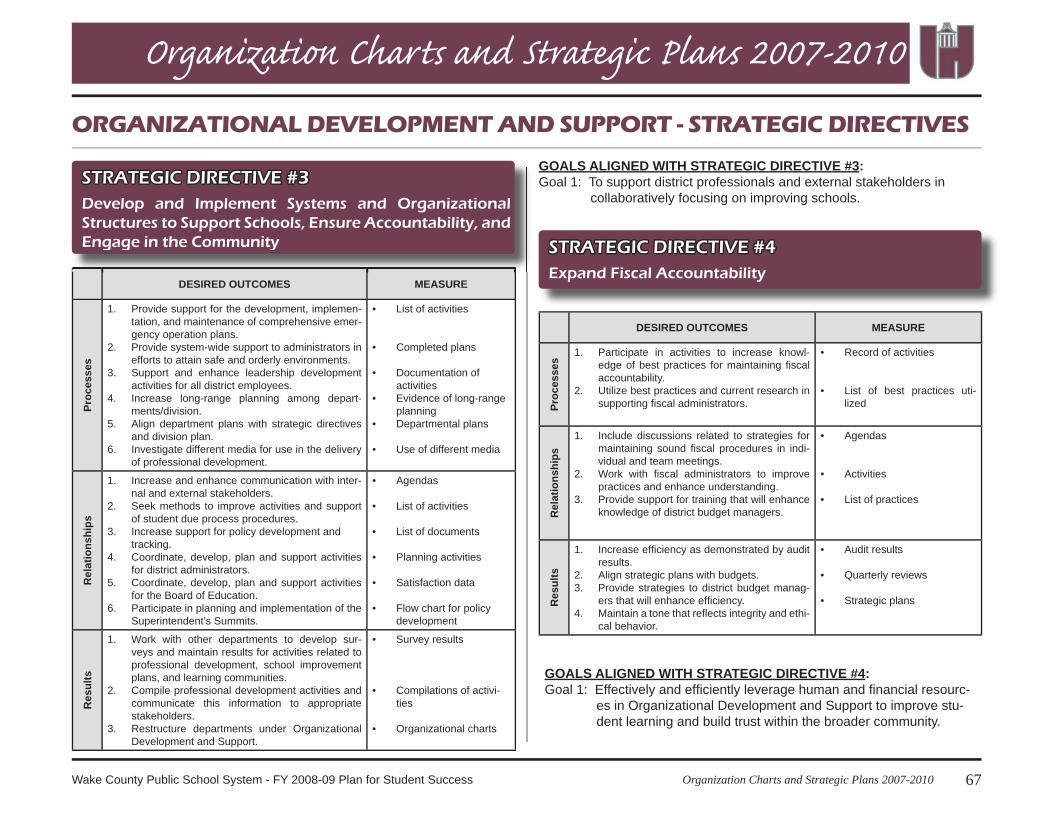
To realize that vision, our guiding strategic directives are:
Enhancing our focus on learning and teaching;Retaining, recruiting, and training high quality employees;Developing and implementing systems and organizational structures to sup-port schools, ensure accountability, and engage the community; andExpanding fi scal accountability.
We have changed the order of “learning” and “teaching” in the fi rst strategic directive to call our attention fi rst to results -- what students learn must al-ways take precedence over what we do.
1.2.3.
4.
Attention to the vision and strategic directives is essential in order for WCPSS to rise to a number of challenges. While enrollment growth has slowed slightly compared to the last few years, we anticipate an additional 6,400 students arriving in our classrooms this fall, bringing our total enroll-ment over 140,000. In comparison, roughly half of North Carolina school districts have fewer than 6,400 students enrolled. Our students’ academic performance, although high by state and national standards, has been on a plateau since 2003. Academic standards are continuing to increase, includ-ing elementary and middle school math, various high school courses, and overall graduation requirements.
With higher standards comes increased urgency in our efforts to eliminate achievement gaps between a child’s performance and potential -- both for our struggling and academically gifted students.
Recognizing these challenges, WCPSS began a process of purposeful change in July 2006, fi rst by focusing on the fundamentals of supporting our students and their aspirations. This was followed by commissioning a comprehensive independent curriculum management audit of our academic programs, and by accelerating our adoption of team-based, data-driven de-cision making through Professional Learning Communities in schools and Central Services departments.
These are not quick-fi x initiatives, but tools for promoting and sustaining the change necessary to foster a culture of learning. Implementation of the curriculum management audit’s recommendations will be a three to fi ve year process, and Professional Learning Community development will be an on-going effort. These two tools build on the improvements we have already
Dr. Del Burns, Ed.D, SuperintendentWake County Public School System
Working as a community of educators and stakeholders, with support of the broader community, we will ensure that every child educated in our school system graduates on time, prepared for the future.
Our vision is not for “most” students, it is for “every” student, and we accept that responsibility with confi-dence in our teachers and staff, our community, and
our children.
Mess age fr om the Superintendent
2 www.wcpss.net
Mess age fr om the Superintendent
made in streamlining our Central Services divisions, strengthening our in-ternal fi nancial controls, integrating community feedback through superin-tendent’s summits, and supporting School Improvement Planning through the area superintendents’ offi ces. In an effort to further increase our fi scal accountability, the Wake County Board of Education has adopted a new fund balance policy that limits the use of undesignated reserves while maintain-ing suffi cient funding for unanticipated needs. Our school system’s annu-al strategic plan and budget, the Plan for Student Success, is aligned with our strategic directives and leverages these tools. It contains a detailed FY 2008-09 budget with business cases for new or expansion items as well as a three-year projection. The initial plan is developed by the superintendent and submitted to the Wake County Board of Education. Once approved, the school board presents the plan to the Wake County Board of Commissioners, requesting the local funding needed to support it.
The 2008-09 Plan for Student Success identifi es additional funding needs that address growth and other changes in our operating environment that im-pact student learning. The Plan also begins the process of addressing higher standards, moving academic progress upward off its plateau, and eliminat-ing achievement gaps. As presented, the Plan represents our assessment of the fi nancial resources necessary to ensure the strength of the Wake County Public School System -- one of the economic engines of our county -- but that is only the means to an end.
The end we seek -- the result we are working toward -- is academic achieve-ment for all students. Our schools must prepare all students for a global and technological future diffi cult to imagine. Our vision is not for “most” students, it is for “every” student -- and we accept that responsibility with confi dence in our teachers and staff, our community, and our children.
Respectfully submitted,
Del Burns, Ed.D.Superintendent
3Get to Know the Wake County Public School SystemWake County Public School System - FY 2008-09 Plan for Student Success
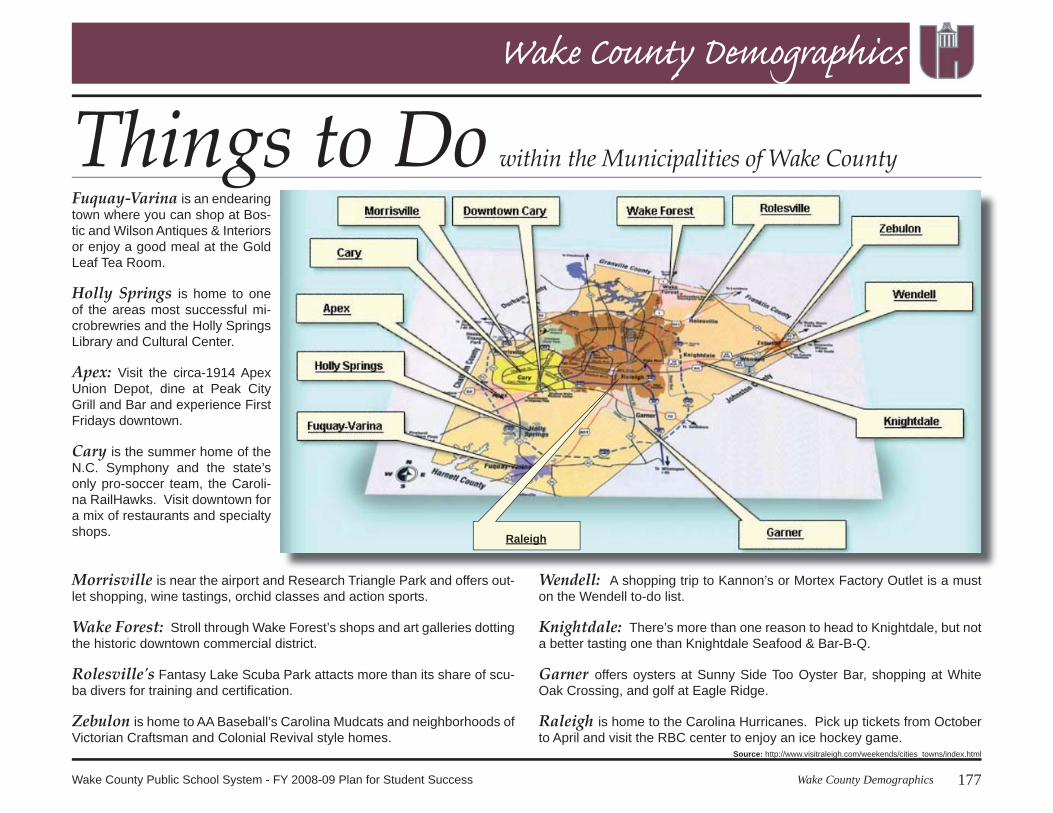
The Wake County Public School System (WCPSS) is one comprehensive school district serving the entire county. Twelve municipalities reside in Wake County: Apex, Cary, Fuquay-Varina, Garner, Holly Springs, Knight-dale, Morrisville, Rolesville, Wake Forest, Wendell, Zebulon, including Raleigh, the county seat, and state capital.
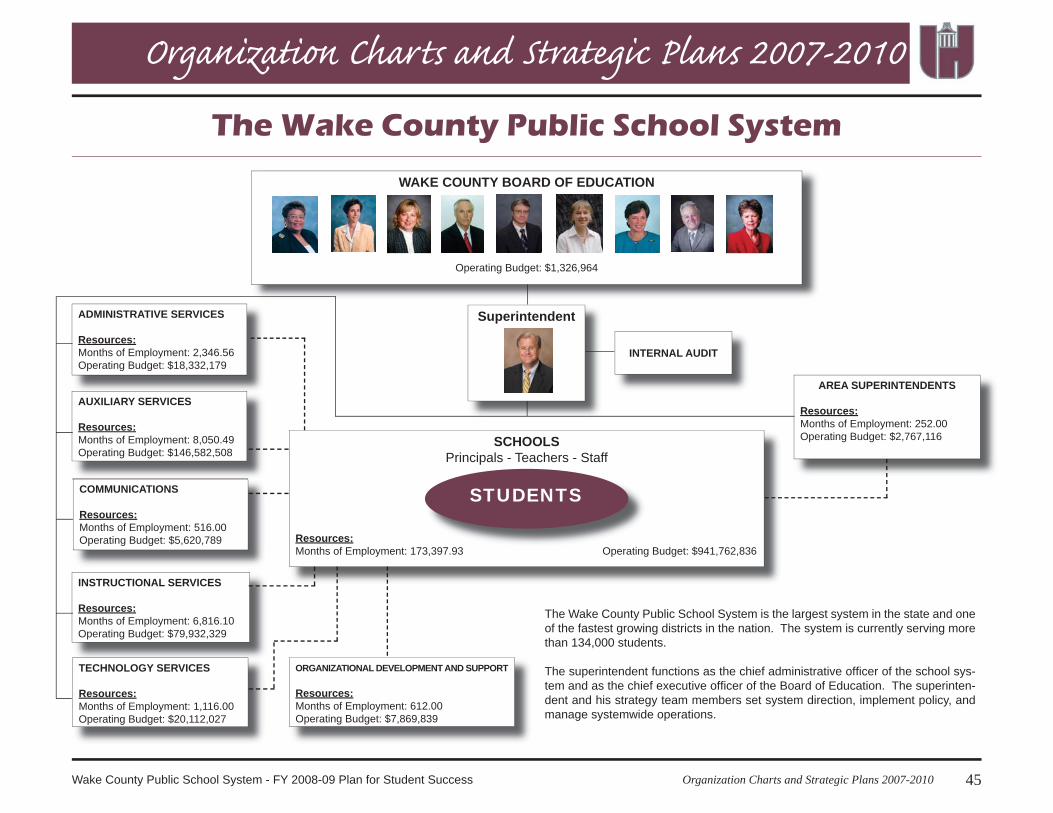
The system was created through a merger of the former Wake County and Raleigh City Public School Systems in July 1976. WCPSS is a large, complex system that requires effective leadership at both the central and school levels to drive continuous improvements. The Wake County Public School System is the LARGEST school system in North Carolina (passing Charlotte-Mecklenburg in 2007-08) and the 19th largest in the nation.
The Board consists of nine members, elected in districts by the public, who serve four-year terms. The Board of Education meets at least two times per month to consider policy is-sues and review system performance. Senior leadership is aligned to support the Board of Education’s decision-making structure. The Board has budget review authority, but it is not a taxing body and must submit its annual bud-get requests to the Wake County Board of Com-missioners, which controls allocation of funds to the schools. The board is the basic level of government exercising oversight responsibility and control over all activities related to public school education in Wake County. Because its members are elected by the public and have decision-making authority, the power to designate management, the ability to signifi cantly infl uence operations, and primary accountability for fi scal matters, the board is recognized as a separate government reporting entity, as defi ned by the Governmental Accounting Standards Board (GASB). The board receives funding from county, state, and federal government sources and must comply with the concomitant requirements of those funding entities. While the board receives county funding, the county is not entitled to share in any surpluses nor is it required to fi nance any defi cits.
Del Burns, Superintendent, is the Chief Executive Offi cer of WCPSS. He and his senior leadership team set system direction, implement policy, and man-age systemwide operations. In addition to the superintendent and his leadership team, principals, assistant principals, and central level administrative staff comprise the district wide administrative team. School leadership teams, of which principals are members, oversee school improvement planning and other site-based management responsibilities. In North Carolina the basic public education program is funded by the state and is augmented with local funds.
Our School System
The data in these tables comes from the Selected Financial Data published by the NC Department of Public Instruction.
WAKE COUNTY COMPARED TO NORTH CAROLINA’S 5 LARGEST LEA’S Per Pupil Expenditures (excluding Child Nutrition)
AVERAGE DAILY MEMBERSHIP CURRENT EXPENSES
LEA Year
Number of
Districts
Number of
ADM Rank State Federal Local TotalMecklenburg 2006-07 115 127,639 1 4,901 108 453 94 2,332 13 7,687 68
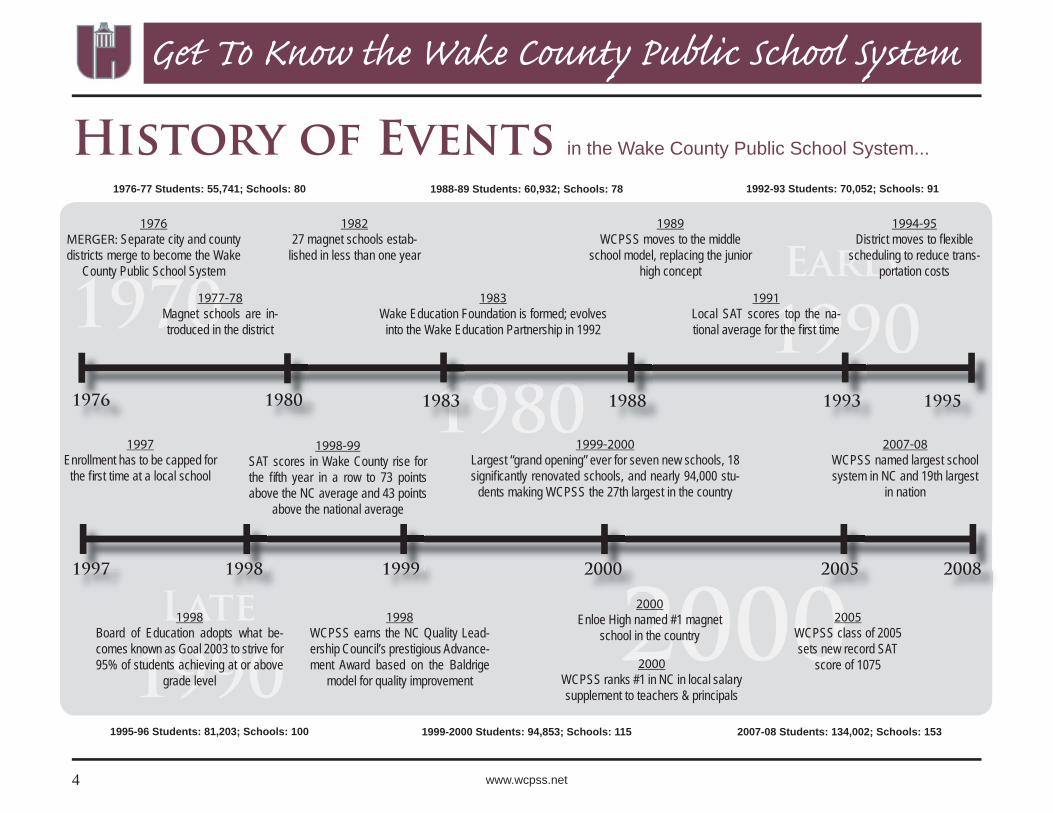
History of Events in the Wake County Public School System...
2000WCPSS ranks #1 in NC in local salary supplement to teachers & principals
5Get to Know the Wake County Public School SystemWake County Public School System - FY 2008-09 Plan for Student Success
Get To Know the Wake County Public School System
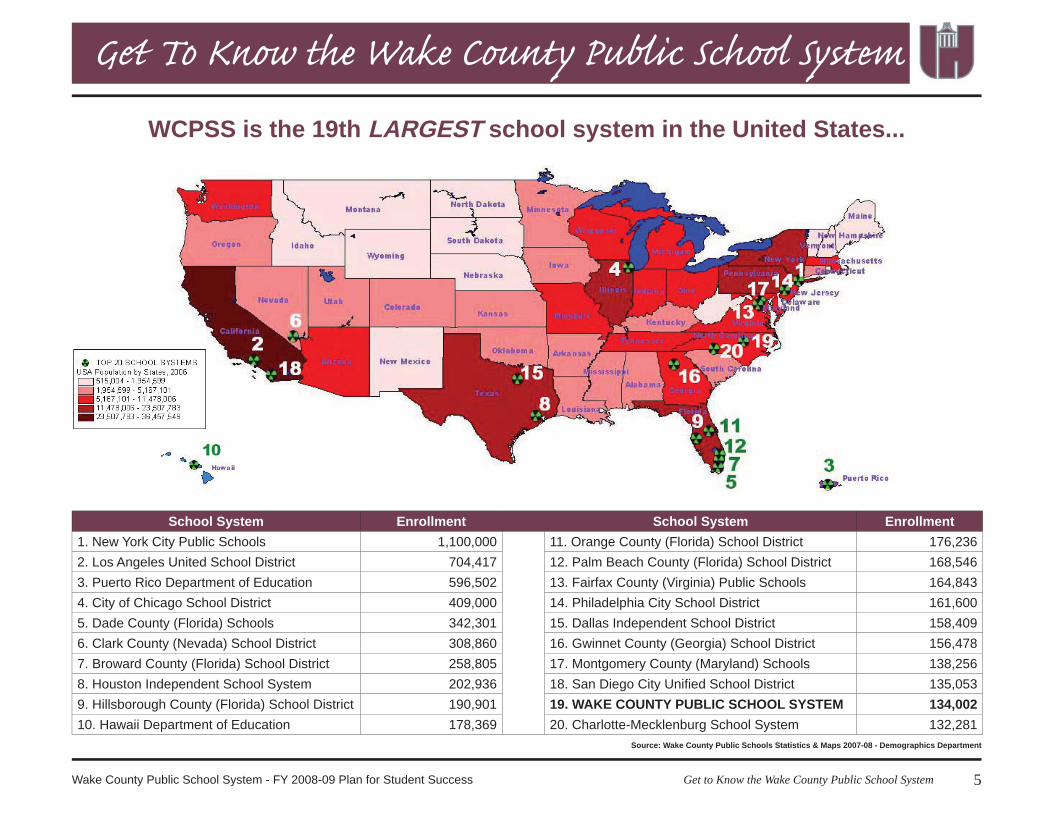
WCPSS is the 19th LARGEST school system in the United States...
Source: Wake County Public Schools Statistics & Maps 2007-08 - Demographics Department
School System Enrollment School System Enrollment1. New York City Public Schools 1,100,000 11. Orange County (Florida) School District 176,2362. Los Angeles United School District 704,417 12. Palm Beach County (Florida) School District 168,5463. Puerto Rico Department of Education 596,502 13. Fairfax County (Virginia) Public Schools 164,8434. City of Chicago School District 409,000 14. Philadelphia City School District 161,6005. Dade County (Florida) Schools 342,301 15. Dallas Independent School District 158,4096. Clark County (Nevada) School District 308,860 16. Gwinnet County (Georgia) School District 156,4787. Broward County (Florida) School District 258,805 17. Montgomery County (Maryland) Schools 138,2568. Houston Independent School System 202,936 18. San Diego City Unifi ed School District 135,0539. Hillsborough County (Florida) School District 190,901 19. WAKE COUNTY PUBLIC SCHOOL SYSTEM 134,00210. Hawaii Department of Education 178,369 20. Charlotte-Mecklenburg School System 132,281
6 www.wcpss.net
Get To Know the Wake County Public School System
M. Vouk 3-2-2007
School Openings, 2007-08:
Three Elementary Schools, Two Middle Schools,Two Non-Traditional HS, Two 9th Grade Centers,
One HS Expansion, Three Elementary Schools Open at their Permanent Locations.
E18 Holly GroveElementary YR-2006@ Holly Springs HS-In 2007, HollyGrove ES-YR willmove into its permanentlocation inHolly Springs.
E13 East GarnerElementary YR-2007
E9 Forest PinesDrive Elementary –2005 @DuBois
Modular-In 2007, Forest Pines ES will move into its permanent location on Forest
Pines Drive.
E14 Sanford Creek Elementary YR -2007
E12 North Forest PinesDrive Elementary YR -2007
Millbrook HSExpansion -2007
Wake Forest-Rolesville HS9th Gr. Ctr. -2007 @DuBois Modular
E15 WakelonElementary –2005@HWY 97 Modular
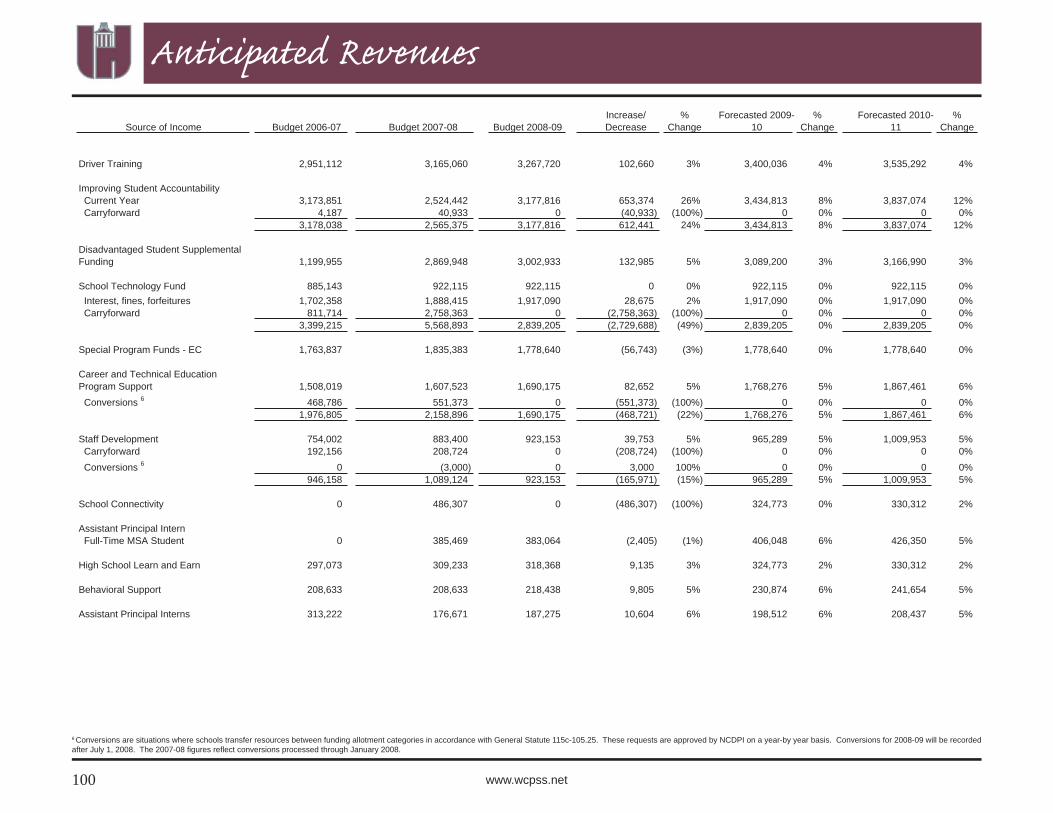
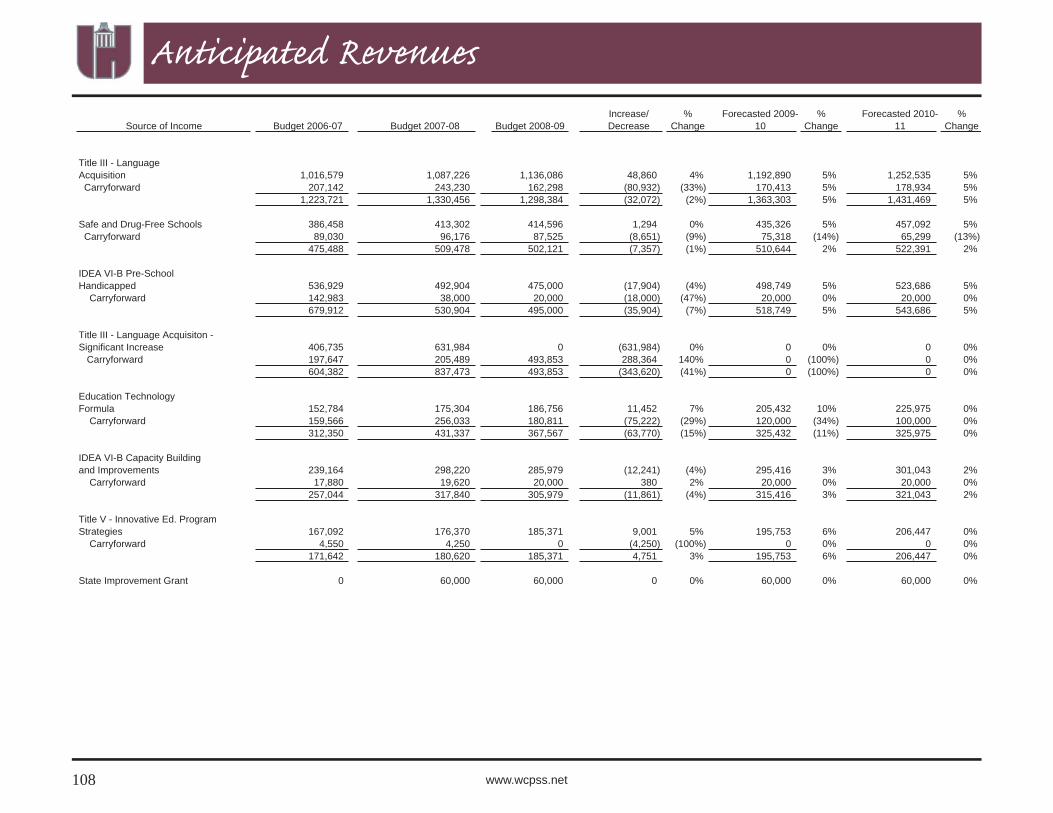
-In 2007, WakelonES will move into its
permanent location in Zebulon.
Wakefield HS9th Gr. Ctr. -2007@HWY 98
M5 Wendell Middle -2007@HWY 97 Modular
East Cary Middle YR-2007, 6th Grade
E. Wake School of Arts, Ed., Global Studies -2007 @ East Wake High
E. Wake School of Eng. Systems -2007 @ East Wake High
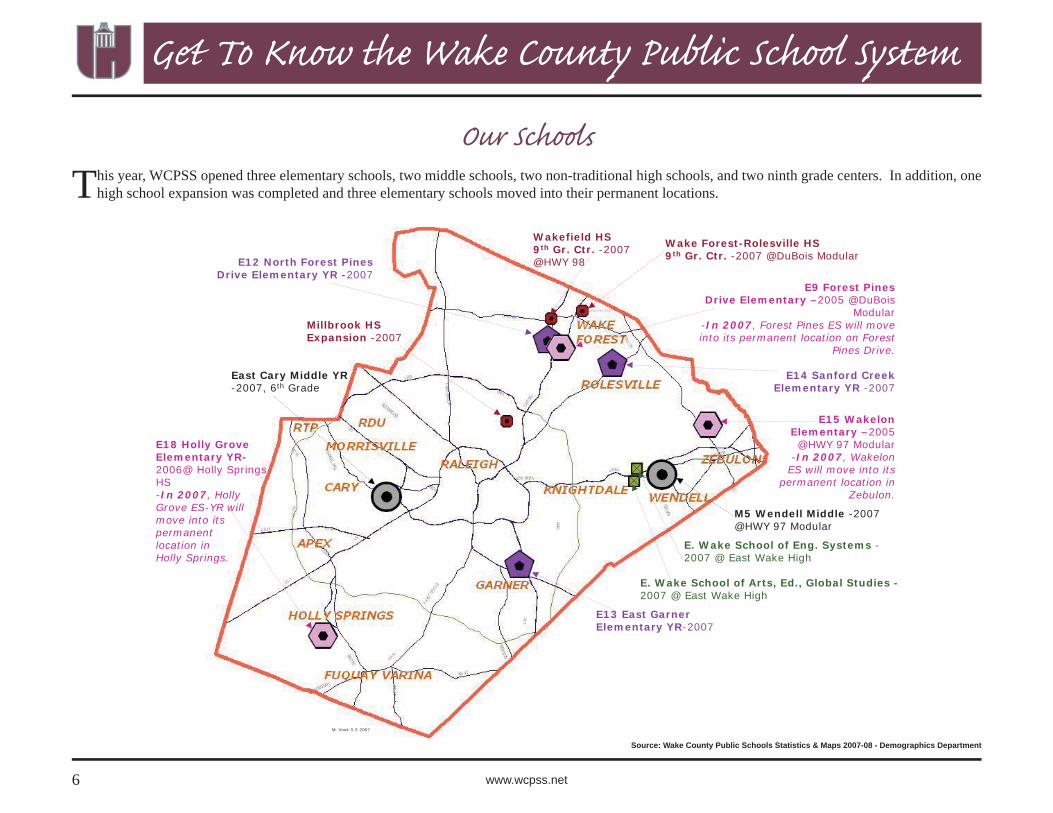
Our Schools
This year, WCPSS opened three elementary schools, two middle schools, two non-traditional high schools, and two ninth grade centers. In addition, one high school expansion was completed and three elementary schools moved into their permanent locations.
Source: Wake County Public Schools Statistics & Maps 2007-08 - Demographics Department
7Get to Know the Wake County Public School SystemWake County Public School System - FY 2008-09 Plan for Student Success
Get To Know the Wake County Public School System
EAST GARNER ELEMENTARYThis is a new two-story version of the PBC&L Archi-tects’ elementary prototype design. The building and site are completed. Classes began on July 9, 2007.
FOREST PINES ELEMENTARY SANFORD CREEK ELEMENTARYThe single site incorporates two new elementary schools- Forest Pines Drive and North Forest Pines. This is the fi rst re-use of the Boney prototype used at Brier Creek Elementary. School started August 27, 2007.
This is the third re-use of the Brier Creek Elementary prototype design. Sanford Creek opened for classes on July 9, 2007.
2007-08 Middle School Openings
East Cary Middle SchoolEast Cary Middle School2007-08 High School Openings
2007-08 Elementary School Openings
Sources: Wake County Public Schools Facilities Design and Construction website and Individual School websites
8 www.wcpss.net
Get To Know the Wake County Public School System
MAGNET SCHOOLS
Magnet programs offer enhancements to the North Carolina Standard Course of Study based on a theme or approach to learning and teaching. All stu-dents registered in the Wake County Public School System are eligible to ap-ply to a magnet school or a calendar option school. A total of 35 of our 153 schools are magnet schools (21 elementary, 9 middle, and 5 high schools).
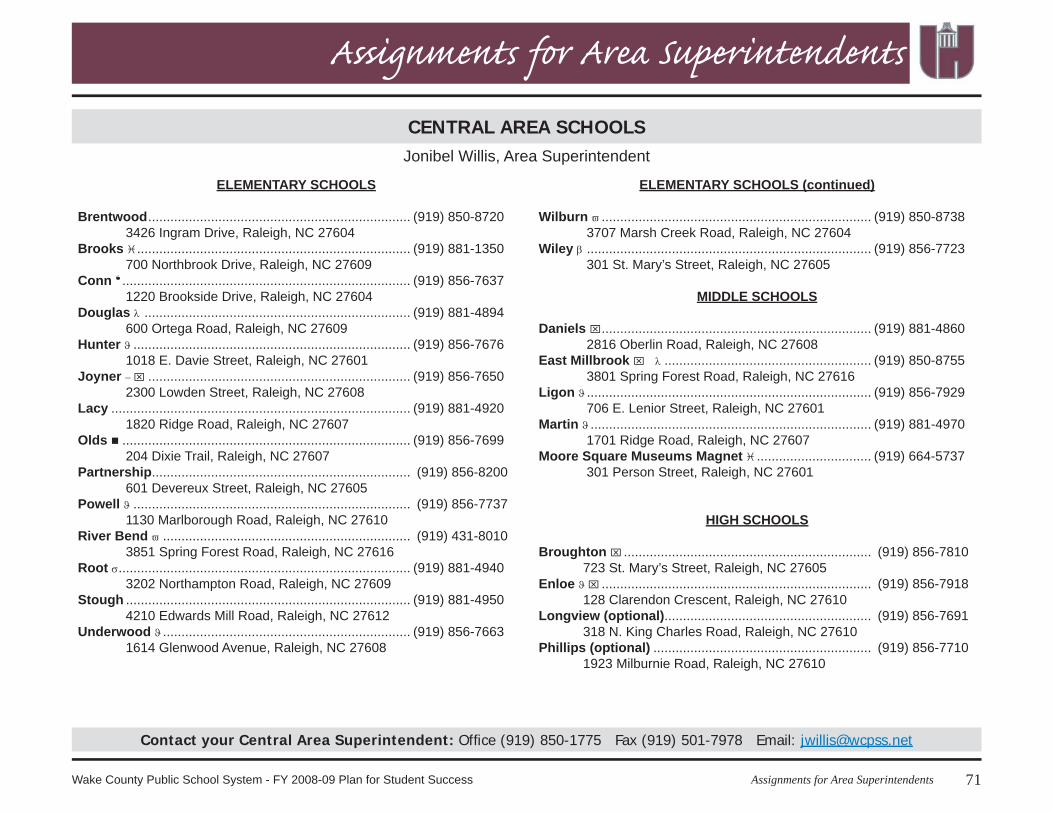
The magnet network features the following innovative program themes: Gifted and Talented (GT), Gifted and Talented with AG (Academically Gift-ed) Basics, University Leadership, Leadership and Technology, Creative Arts and Science, Community Model, Active Learning and Technology, In-ternational Baccalaureate (IB), Montessori, Museums, Early College, Inter-national Studies, and GT/IB Center for Humanities, Sciences and the Arts. Magnet programs were established in 1982 as “Schools of Choice” to attract families to downtown schools to fi ll under-utilized facilities and to promote diverse student populations. WCPSS now boasts nine authorized Interna-tional Baccalaureate World schools. Daniels, Broughton, and East Millbrook Magnet Middle School (EMMMS) Middle Years Programme Partnership completed their International Baccalaureate North America (IBNA) Evalua-tion process, and Joyner Elementary was authorized as an IB Primary Years Programme school in February 2007. The East Garner Middle/Garner Se-nior High MYP Partnership was visited for authorization in February 2007 and received offi cial notifi cation of MYP authorization in July. This year the Magnet Schools of America recognized Combs Leadership Magnet Elemen-tary and Farmington Woods International Baccalaureate PYP (Primary Years Programme) Elementary as National Schools of Excellence. East Millbrook Middle for International Baccalaureate MYP (Middle Years Programme) and Conn Active Learning and Technology Elementary received recognition as National Schools of Distinction.
The Board of Education, in collaboration with the Magnet Programs staff, engaged in an extensive review of the criteria for magnet schools. This process resulted in the demagnetization of fi ve schools and set in place a process of annual review of magnet school criteria to ensure that they con-
tinue to reduce high concentrations of poverty and support diverse popula-tions, maximize use of school facilities, and provide expanded educational opportunities.
WCPSS was awarded $8,320,469 from the U.S. Department of Education’s Magnet Schools Assistance Program (MSAP) to signifi cantly revise three existing magnet schools: Southeast Raleigh Magnet High School, Garner Magnet High School, and East Garner Magnet Middle School. The ‘Proj-ect Renaissance’ grant’s goals are to prepare students with the skills neces-sary to succeed in the 21st century, to attract and maintain diverse school populations, increase the achievement of students who attend the project schools, and provide students with greater access to quality programs. In addition, WCPSS submitted a ‘Gear Up’ grant application which required the development of partnerships with institutions of higher education and a community organization. If awarded, these partners would provide $3M in matching funds over a six-year grant cycle.
The magnet program continues as a vehicle to create healthy, diverse school populations, make optimal use of facilities, and offer innovative opportuni-ties within our district. To these ends, the program has proven to be highly successful. The WCPSS Magnet Program continues to contribute to Wake County’s stature as a leader in education.
YEAR-ROUND SCHOOLS
In response to the tremendous growth that Wake County has been experi-encing, the Board of Education members decided to convert 19 elementary schools and three middle schools to a multi-track year-round calendar for the 2007-08 school year. Four new schools opening in 2007-08 opened on a multi-track year-round calendar. In addition three new elementary schools opening in 2008-09 will operate on a year-round calendar bringing the number to 41 year-round elementary schools and eight year-round middle schools for a total of 49 multi-track year-round schools. Year-round schools offer the standard curriculum but operate on a multi-track calendar that en-ables the school to accommodate 25-33 percent more students than a school operating on a traditional calendar.
9Get to Know the Wake County Public School SystemWake County Public School System - FY 2008-09 Plan for Student Success
Get To Know the Wake County Public School System
We are committed to academic excellence. As we approach the comple-tion of Goal 2008, accomplishments were made such as increasing
challenging educational opportunities for all students, as well as identifying and seeking resources necessary to support student success. These are just a few of many goals that help our students remain some of the best in the nation.
This year, the Wake County Public School System (WCPSS) experienced continued growth with the addition of 5,930 students, putting the student population at 134,002 students in kindergarten through 12th grade. There are 153 schools including 96 elementary schools, 30 middle schools, 23 high schools, and four special/optional schools. Most students are assigned to at-tend their “base school” - the school assigned based on the parents’ or guard-ian’s home address. In some instances, the base school may be a magnet or year-round school since these schools have base populations in addition to accepting applications.
WCPSS Student Population Projections
0
50,000
100,000
150,000
200,000
250,000
1997
-9819
98-99
1999
-0020
00-01
2001
-0220
02-03
2003
-0420
04-05
2005
-0620
06-07
2007
-0820
08-09
2009
-1020
10-11
2011
-1220
12-13
2013
-1420
14-15
2015
-1620
16-17
2017
-18
A report by DeJONG, in collaboration with Wake County government and WCPSS put the student population at 214,296 students by the year 2018. With the student population expected to grow by more than 80,000 over the next 10 years, Wake County will need approximately 90 new schools. Within the next two years, WCPSS’ enrollment will be roughly 20 times the number of students in an average United States school district. Wake County will soon have more than 150,000 students.
Our Students
10 www.wcpss.net
Get To Know the Wake County Public School System
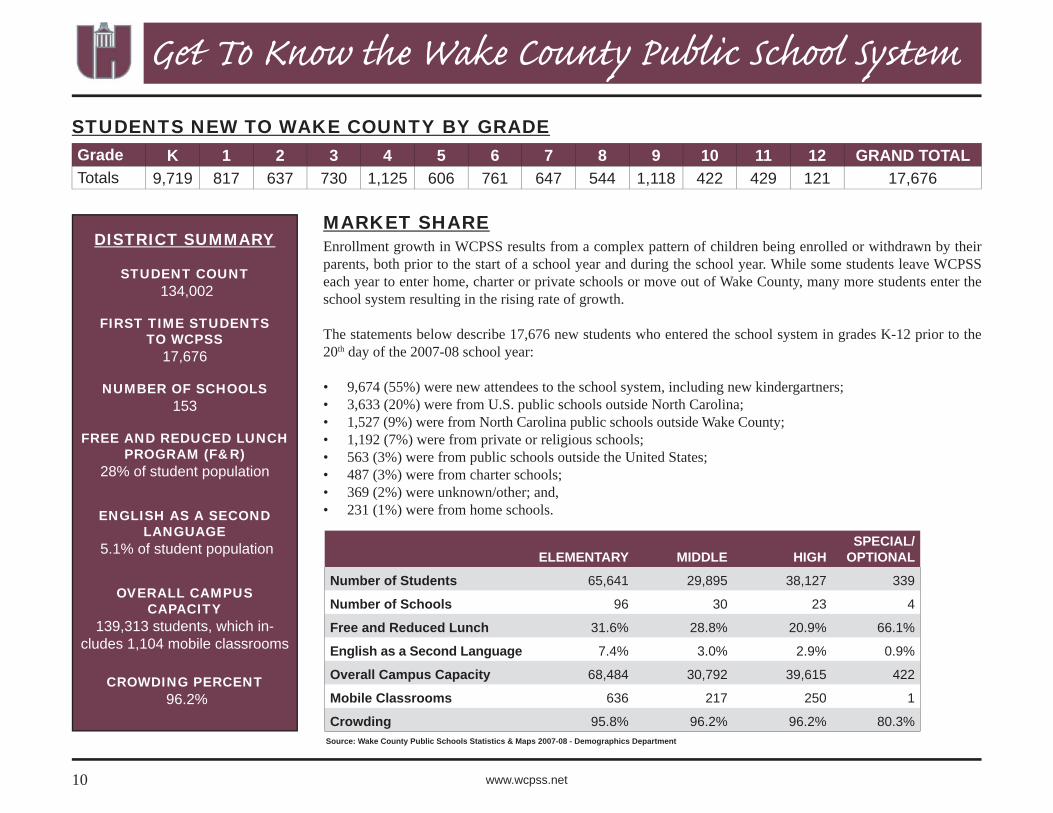
DISTRICT SUMMARY
STUDENT COUNT 134,002
FIRST TIME STUDENTS TO WCPSS
17,676
NUMBER OF SCHOOLS153
FREE AND REDUCED LUNCH PROGRAM (F&R)
28% of student population
ENGLISH AS A SECOND LANGUAGE
5.1% of student population
OVERALL CAMPUS CAPACITY
139,313 students, which in-cludes 1,104 mobile classrooms
CROWDING PERCENT 96.2%
ELEMENTARY MIDDLE HIGHSPECIAL/
OPTIONAL
Number of Students 65,641 29,895 38,127 339
Number of Schools 96 30 23 4
Free and Reduced Lunch 31.6% 28.8% 20.9% 66.1%
English as a Second Language 7.4% 3.0% 2.9% 0.9%
Overall Campus Capacity 68,484 30,792 39,615 422
Mobile Classrooms 636 217 250 1
Crowding 95.8% 96.2% 96.2% 80.3%
STUDENTS NEW TO WAKE COUNTY BY GRADEGrade K 1 2 3 4 5 6 7 8 9 10 11 12 GRAND TOTALTotals 9,719 817 637 730 1,125 606 761 647 544 1,118 422 429 121 17,676
MARKET SHAREEnrollment growth in WCPSS results from a complex pattern of children being enrolled or withdrawn by their parents, both prior to the start of a school year and during the school year. While some students leave WCPSS each year to enter home, charter or private schools or move out of Wake County, many more students enter the school system resulting in the rising rate of growth.
The statements below describe 17,676 new students who entered the school system in grades K-12 prior to the 20th day of the 2007-08 school year:
9,674 (55%) were new attendees to the school system, including new kindergartners;3,633 (20%) were from U.S. public schools outside North Carolina;1,527 (9%) were from North Carolina public schools outside Wake County;1,192 (7%) were from private or religious schools;563 (3%) were from public schools outside the United States;487 (3%) were from charter schools;369 (2%) were unknown/other; and,231 (1%) were from home schools.
••••••••
Source: Wake County Public Schools Statistics & Maps 2007-08 - Demographics Department
11Get to Know the Wake County Public School SystemWake County Public School System - FY 2008-09 Plan for Student Success
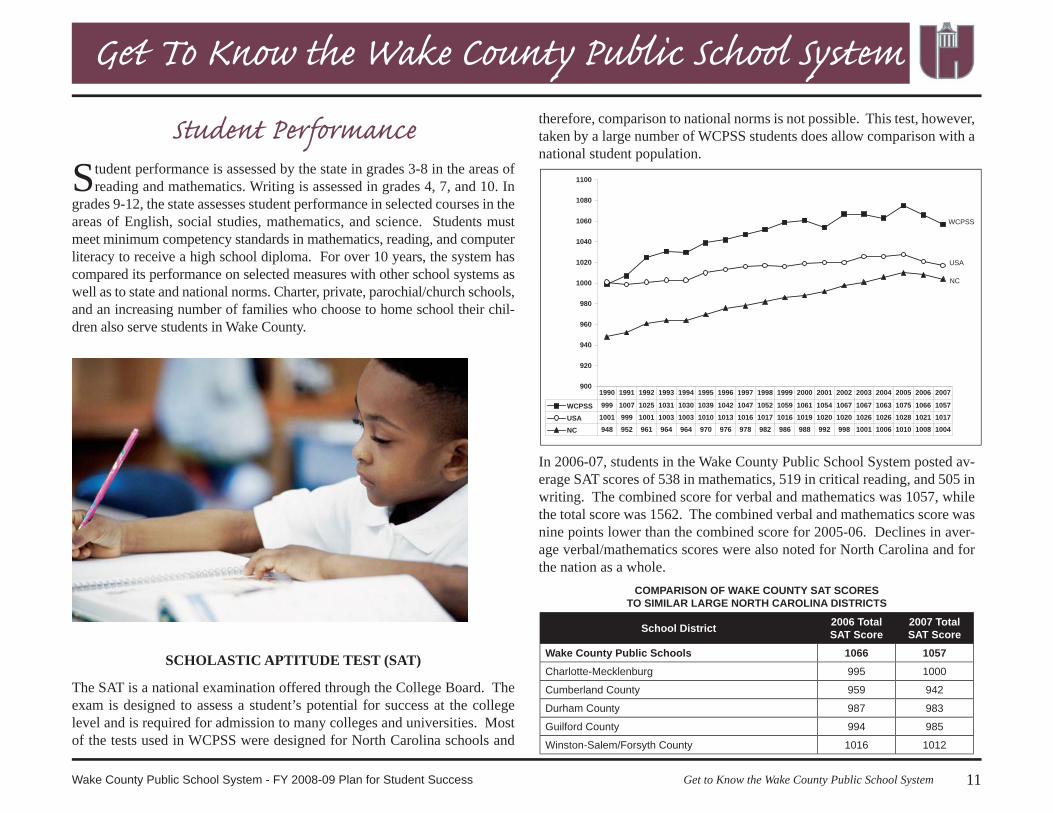
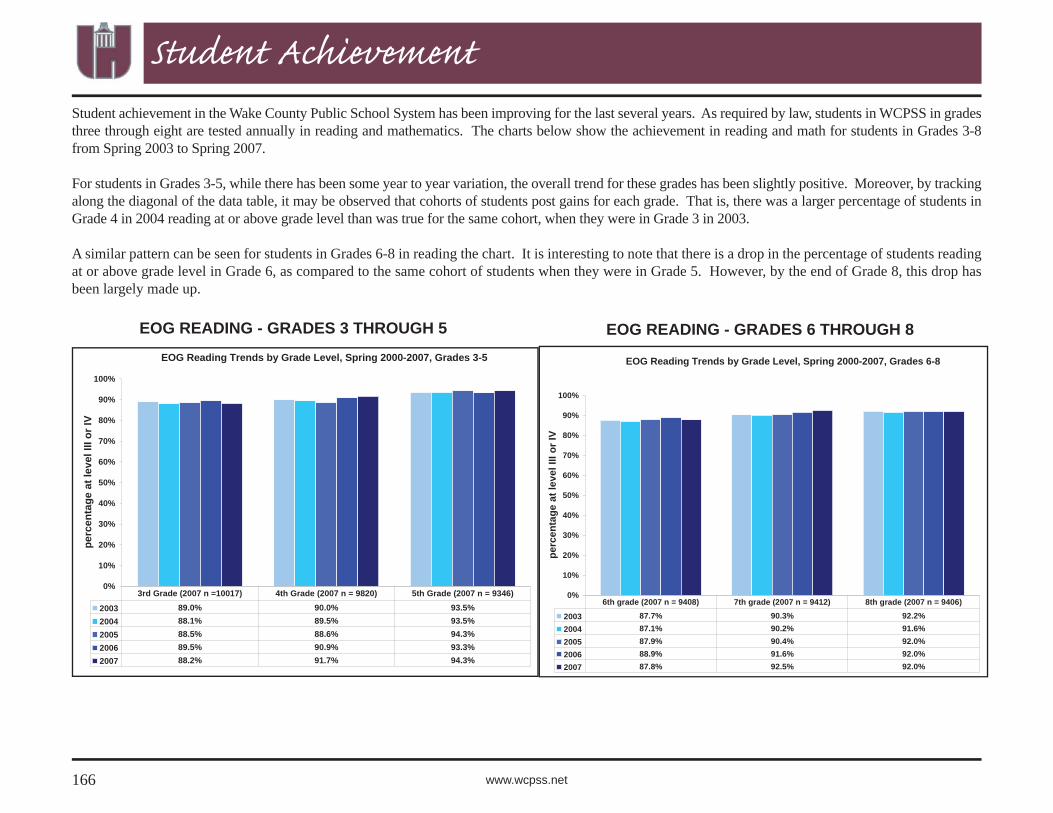
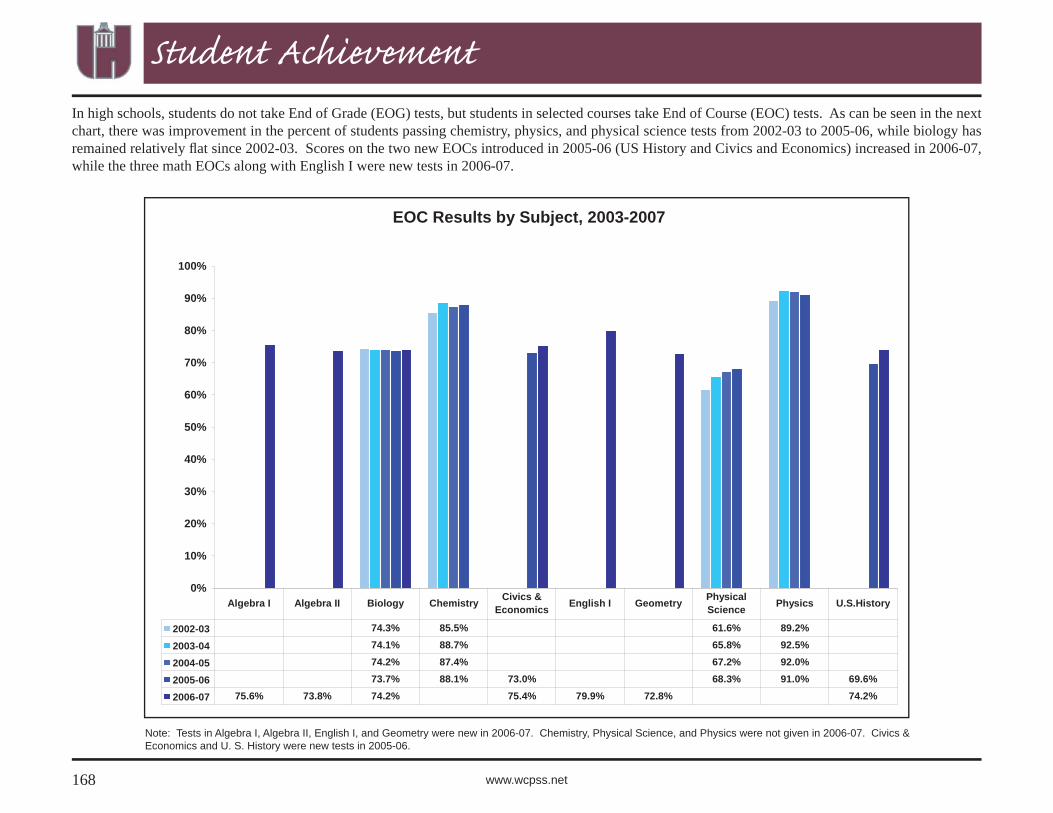
Student performance is assessed by the state in grades 3-8 in the areas of reading and mathematics. Writing is assessed in grades 4, 7, and 10. In
grades 9-12, the state assesses student performance in selected courses in the areas of English, social studies, mathematics, and science. Students must meet minimum competency standards in mathematics, reading, and computer literacy to receive a high school diploma. For over 10 years, the system has compared its performance on selected measures with other school systems as well as to state and national norms. Charter, private, parochial/church schools, and an increasing number of families who choose to home school their chil-dren also serve students in Wake County.
SCHOLASTIC APTITUDE TEST (SAT)
The SAT is a national examination offered through the College Board. The exam is designed to assess a student’s potential for success at the college level and is required for admission to many colleges and universities. Most of the tests used in WCPSS were designed for North Carolina schools and
therefore, comparison to national norms is not possible. This test, however, taken by a large number of WCPSS students does allow comparison with a national student population.
In 2006-07, students in the Wake County Public School System posted av-erage SAT scores of 538 in mathematics, 519 in critical reading, and 505 in writing. The combined score for verbal and mathematics was 1057, while the total score was 1562. The combined verbal and mathematics score was nine points lower than the combined score for 2005-06. Declines in aver-age verbal/mathematics scores were also noted for North Carolina and for the nation as a whole.
COMPARISON OF WAKE COUNTY SAT SCORES TO SIMILAR LARGE NORTH CAROLINA DISTRICTS
School District 2006 Total SAT Score
2007 Total SAT Score
Wake County Public Schools 1066 1057Charlotte-Mecklenburg 995 1000
Cumberland County 959 942
Durham County 987 983
Guilford County 994 985
Winston-Salem/Forsyth County 1016 1012
12 www.wcpss.net
Get To Know the Wake County Public School System
Over the 18-year period, the average SAT combined score (verbal and math-ematics) for WCPSS students has moved from 999 to 1057. The average score for North Carolina has gone from 948 to 1004, while the average for the U.S. has gone from 1001 to 1017. Thus, students in Wake County have added 58 points to their average score as compared with 56 and 16 points for the state and nation, respectively.
END-OF-GRADE (EOG) EXAMS
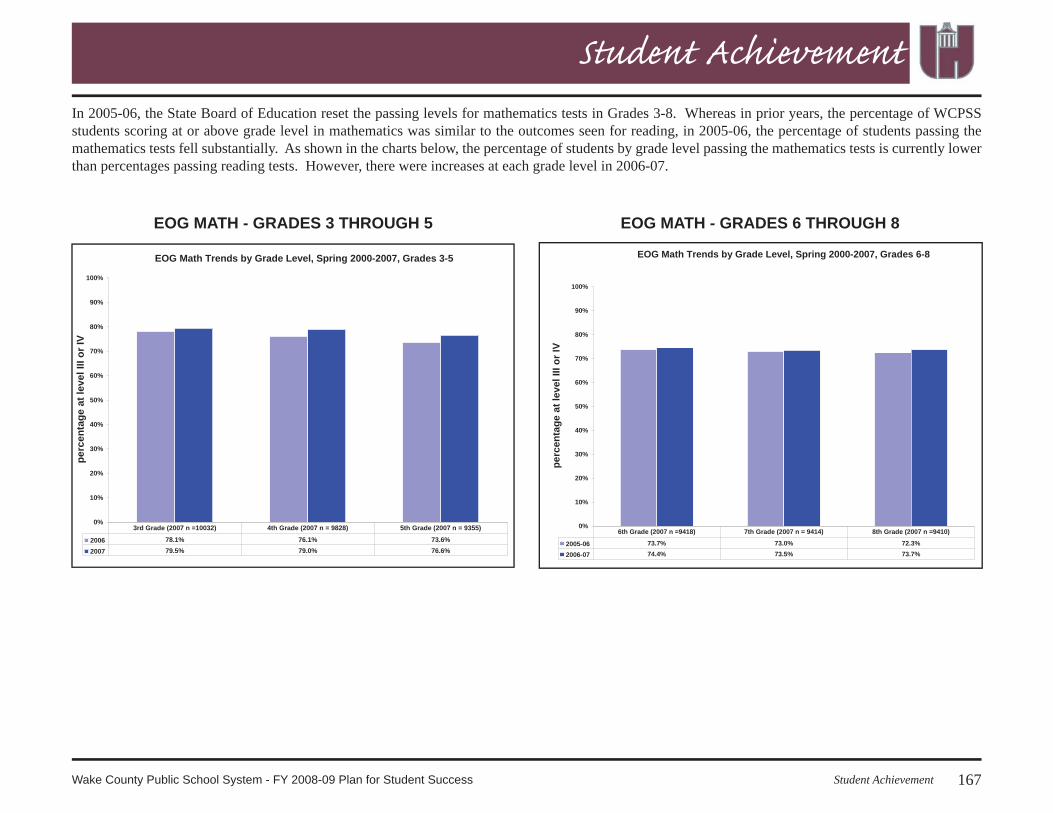
As part of the state’s testing program, students in grades 3 through 8 take tests in reading and mathematics at the end of each school year. The table below displays the percentage of students scoring at or above grade level on those tests for the past two years. In reading, the percentage of students scoring at or above grade level has hovered around 90%. In mathematics, the percentage of students scoring at or above grade level is in the mid to high 70s in the elementary grades, and in the lower 70s in the middle grades. Although the percentages in mathematics are currently lower than in read-ing, there was more improvement overall between 2005-06 and 2006-07 in mathematics than was seen for reading.
2006 and 2007 End-of Grade Test ResultsPercentage at or above Grade Level
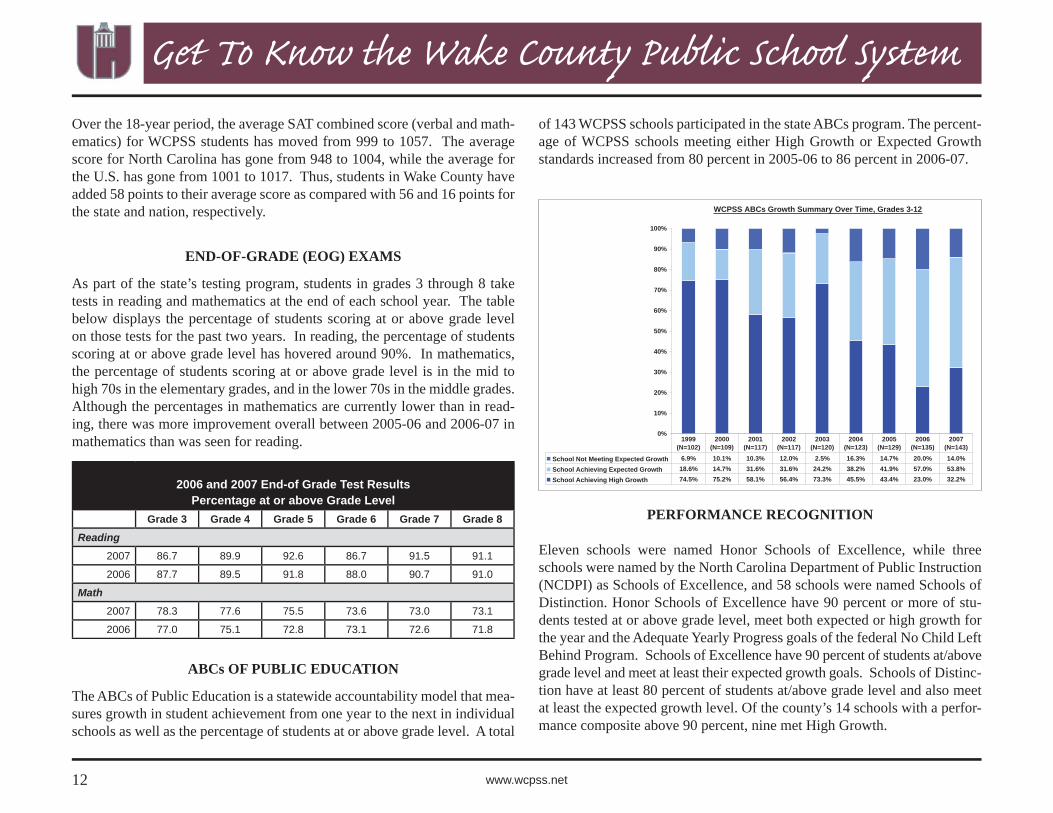
The ABCs of Public Education is a statewide accountability model that mea-sures growth in student achievement from one year to the next in individual schools as well as the percentage of students at or above grade level. A total
Eleven schools were named Honor Schools of Excellence, while three schools were named by the North Carolina Department of Public Instruction (NCDPI) as Schools of Excellence, and 58 schools were named Schools of Distinction. Honor Schools of Excellence have 90 percent or more of stu-dents tested at or above grade level, meet both expected or high growth for the year and the Adequate Yearly Progress goals of the federal No Child Left Behind Program. Schools of Excellence have 90 percent of students at/above grade level and meet at least their expected growth goals. Schools of Distinc-tion have at least 80 percent of students at/above grade level and also meet at least the expected growth level. Of the county’s 14 schools with a perfor-mance composite above 90 percent, nine met High Growth.
of 143 WCPSS schools participated in the state ABCs program. The percent-age of WCPSS schools meeting either High Growth or Expected Growth standards increased from 80 percent in 2005-06 to 86 percent in 2006-07.
13Get to Know the Wake County Public School SystemWake County Public School System - FY 2008-09 Plan for Student Success
Get To Know the Wake County Public School System
Our Employ ees
The school system has over 17,500 full-time and part-time employees and is the second largest employer in the Raleigh-Durham area. Principals
are legally responsible for the operation of schools in the district. Principals work in collaboration with leadership teams at their schools and develop, implement, and monitor school improvement plans (SIPs). All staff in our schools are involved in the school improvement process.
Tec hnology
Technology is utilized throughout WCPSS to support the district vision of every student graduating on time, prepared for the future. A robust
calling system is utilized by schools to provide information to parents on school events. Schools employ interactive white boards, projectors, inter-active response devices, and a variety of technology to support learning. A central data warehouse, still in its infancy, is being expanded to increase the data available to inform decisions. A sound disaster recovery plan and constantly evolving information security measures ensure security and reli-ability of crucial district data.
The district implemented a systematic fi ve-year school PC Refresh program with the fi rst three years funded by the bond approved in Fall 2006. The fi rst roll-out provided over 10,000 PCs (a combination of laptop and desktop computers) to replace the oldest computers in each district school. Viable Windows XP systems were identifi ed to replace an additional 1,300 comput-ers running Windows 98. The involvement and cooperation between school personnel and central services staff in this unprecedented rollout of equip-ment made it possible to improve technology in all district schools.
E-mail is provided to all faculty and staff and a majority of students at the secondary level. Elementary students are granted access to e-mail when re-quested for instructional purposes.
The district manages both an Internet and an Intranet site. The internet site (www.wcpss.net) can be accessed by anyone on the World Wide Web and provides a district profi le as well as pertinent information on past, present, and future events. The intranet site (www2.wcpss.net) is accessible from within the district’s network and is fi lled with valuable information for inter-nal staff. Principals and teachers may access district applications essential to their work from external locations (such as their homes). Wireless access options are integrated into the new school infrastructure, and modifi cations are being made in existing schools to enable wireless access.
Wake County has 9,228 Regular Classroom Teachers...
(Not including media specialists, counselors, psychologists, etc.)
14 www.wcpss.net
Get To Know the Wake County Public School System
Economic Condition and Outlook
The recurring publicity of Wake County as one of the most desired places to live and work in the United States, as evidenced by past surveys in
magazines such as Forbes, Money, Fortune, and Entrepreneur, has continued to turn the spotlight on quality of life enjoyed by Wake County citizens. While quality of life is an intangible asset, there are many tangible attributes that we can point to in explaining the county’s attractiveness. A unique ur-ban mix with rural areas and small towns distinguishes Wake County from other counties in the state and provides something for everyone in choosing a lifestyle.
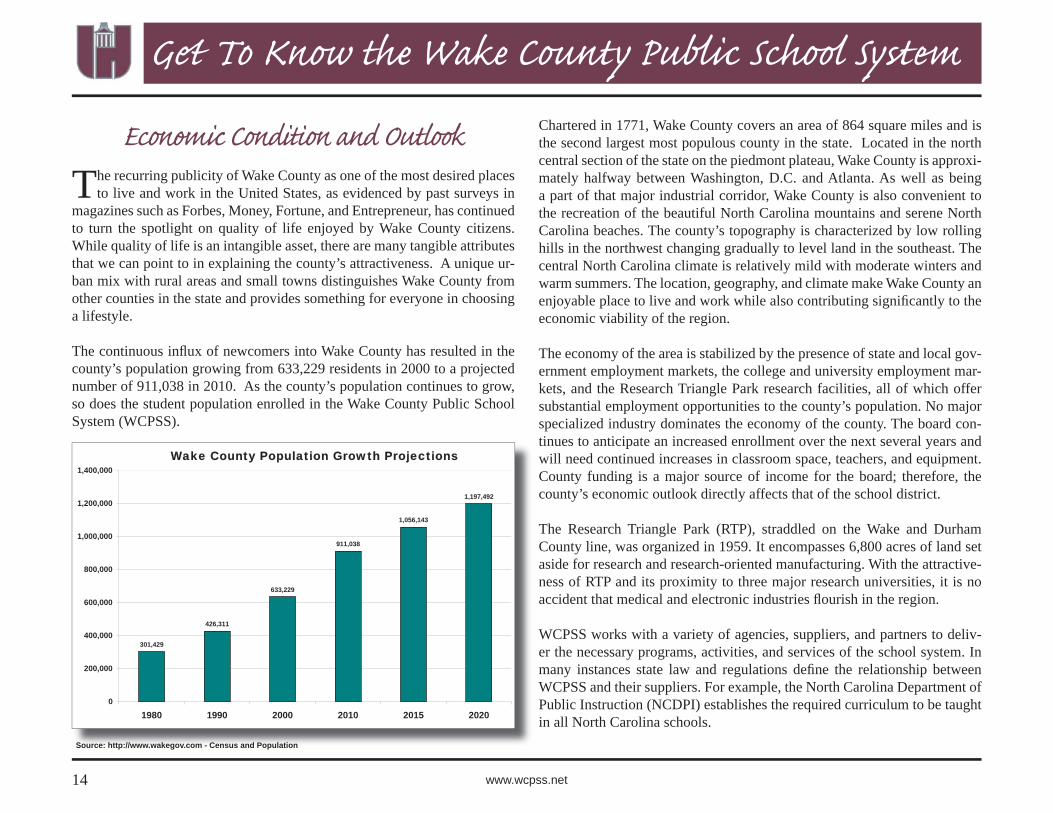
The continuous infl ux of newcomers into Wake County has resulted in the county’s population growing from 633,229 residents in 2000 to a projected number of 911,038 in 2010. As the county’s population continues to grow, so does the student population enrolled in the Wake County Public School System (WCPSS).
Chartered in 1771, Wake County covers an area of 864 square miles and is the second largest most populous county in the state. Located in the north central section of the state on the piedmont plateau, Wake County is approxi-mately halfway between Washington, D.C. and Atlanta. As well as being a part of that major industrial corridor, Wake County is also convenient to the recreation of the beautiful North Carolina mountains and serene North Carolina beaches. The county’s topography is characterized by low rolling hills in the northwest changing gradually to level land in the southeast. The central North Carolina climate is relatively mild with moderate winters and warm summers. The location, geography, and climate make Wake County an enjoyable place to live and work while also contributing signifi cantly to the economic viability of the region.
The economy of the area is stabilized by the presence of state and local gov-ernment employment markets, the college and university employment mar-kets, and the Research Triangle Park research facilities, all of which offer substantial employment opportunities to the county’s population. No major specialized industry dominates the economy of the county. The board con-tinues to anticipate an increased enrollment over the next several years and will need continued increases in classroom space, teachers, and equipment. County funding is a major source of income for the board; therefore, the county’s economic outlook directly affects that of the school district.
The Research Triangle Park (RTP), straddled on the Wake and Durham County line, was organized in 1959. It encompasses 6,800 acres of land set aside for research and research-oriented manufacturing. With the attractive-ness of RTP and its proximity to three major research universities, it is no accident that medical and electronic industries fl ourish in the region.
WCPSS works with a variety of agencies, suppliers, and partners to deliv-er the necessary programs, activities, and services of the school system. In many instances state law and regulations defi ne the relationship between WCPSS and their suppliers. For example, the North Carolina Department of Public Instruction (NCDPI) establishes the required curriculum to be taught in all North Carolina schools.
Wake County Population Growth Projections
301,429
426,311
633,229
911,038
1,056,143
1,197,492
0
200,000
400,000
600,000
800,000
1,000,000
1,200,000
1,400,000
1980 1990 2000 2010 2015 2020
Source: http://www.wakegov.com - Census and Population
15Get to Know the Wake County Public School SystemWake County Public School System - FY 2008-09 Plan for Student Success
Get To Know the Wake County Public School System
Community Relationships
WCPSS maintains relationships with local colleges and universities, community agencies, businesses, parent organizations, and the Wake
Education Partnership. The Wake Education Partnership is a community-based public school advocacy organization that links business and commu-nity resources to strengthen schools. The Partnership’s efforts include spon-soring annual education summits and community-based technology forums, conducting the Gallup Poll on education, and awarding grants to teachers. The Triangle United Way and the United Arts Council are also community partners that support students, families, and school programs. The WCPSS values these collaborative relationships.
WCPSS nurtures positive relation-ships with many local businesses. The Wake County School-to-Career Council through its Business Alliances, Career Pathway Employer Teams, and Career Academy Advisory Boards makes vital connections between the school sys-tem and the business community. The School-to-Career program involves over 600 businesses working with staff and students at our middle and high schools.
The Wake County Parent-Teacher-Student Association (PTSA) coordinates activities through membership in the state and national organization and pro-vides leadership to the individual school PTSAs. Through the valuable work of the many active members, schools receive volunteers and enrichment pro-grams. There is signifi cant parent and volunteer involvement in schools on a daily basis.
Special relationships exist between Wake County schools and the postsec-ondary institutions. Universities provide the system with licensed teachers and administrators, and WCPSS provides opportunities for student teachers,
graduate internships, and employment for their graduates. Other collabora-tions include programs such as the Math-Science Network, a pre-college program for minority students, summer enrichment programs, Governor’s School, and partnerships with community and technical colleges to meet both student and staff educational needs.
Citizen Involvement
Opportunities for public comment are provided through a public hearing at the beginning of each regular board meeting for items on the agenda
and at the end of each regular board meeting for items not on the agenda. Each participant may address the board for three minutes.
16 www.wcpss.net
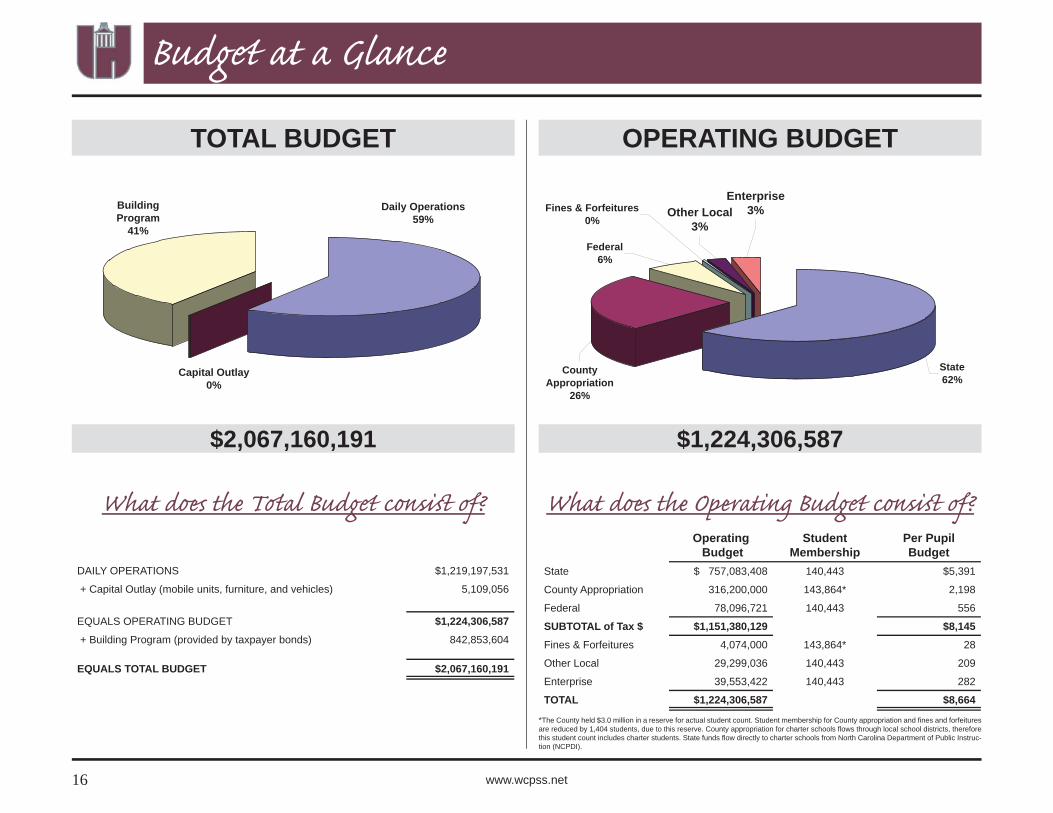
What does the Tot al Budget consist of ?Operating Budget
*The County held $3.0 million in a reserve for actual student count. Student membership for County appropriation and fi nes and forfeitures are reduced by 1,404 students, due to this reserve. County appropriation for charter schools fl ows through local school districts, therefore this student count includes charter students. State funds fl ow directly to charter schools from North Carolina Department of Public Instruc-tion (NCPDI).
TOTAL BUDGET
$2,067,160,191
Capital Outlay 0%
Daily Operations59%
BuildingProgram
41%
DAILY OPERATIONS $1,219,197,531
+ Capital Outlay (mobile units, furniture, and vehicles) 5,109,056
EQUALS OPERATING BUDGET $1,224,306,587 + Building Program (provided by taxpayer bonds) 842,853,604
EQUALS TOTAL BUDGET $2,067,160,191
OPERATING BUDGET
$1,224,306,587
What does the Operating Budget consist of ?
Enterprise3%Other Local
3%Fines & Forfeitures
0%
Federal6%
State62%
CountyAppropriation
26%
Budget at a Glance
17Budget at a GlanceWake County Public School System - FY 2008-09 Plan for Student Success
Budget at a Glance
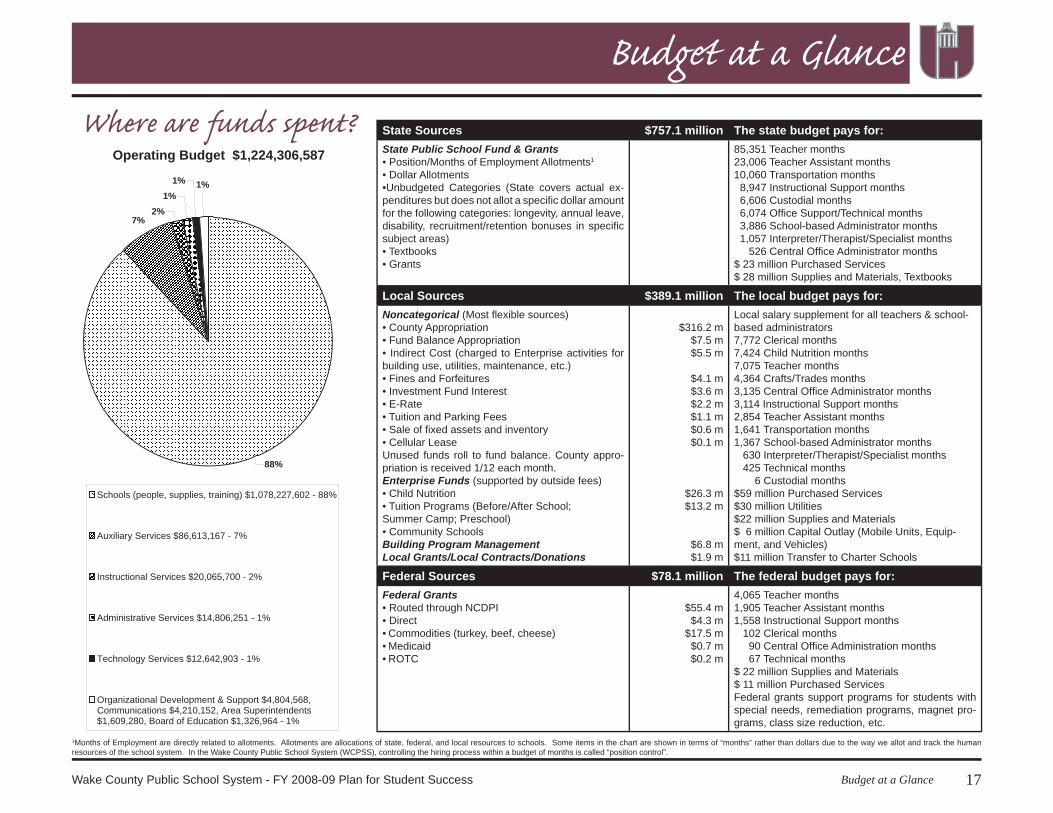
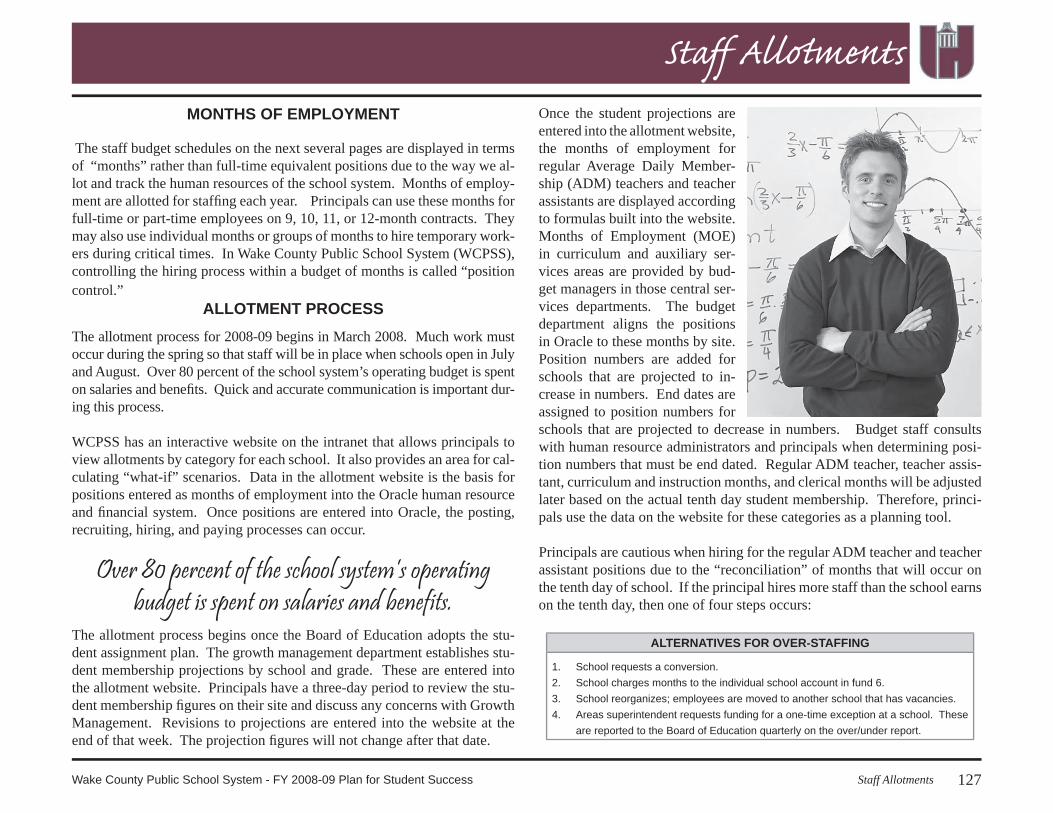
Where are funds spent? State Sources $757.1 million The state budget pays for:State Public School Fund & Grants• Position/Months of Employment Allotments1
• Dollar Allotments•Unbudgeted Categories (State covers actual ex-penditures but does not allot a specifi c dollar amount for the following categories: longevity, annual leave, disability, recruitment/retention bonuses in specifi c subject areas)• Textbooks• Grants
85,351 Teacher months23,006 Teacher Assistant months10,060 Transportation months 8,947 Instructional Support months 6,606 Custodial months 6,074 Offi ce Support/Technical months 3,886 School-based Administrator months 1,057 Interpreter/Therapist/Specialist months 526 Central Offi ce Administrator months$ 23 million Purchased Services$ 28 million Supplies and Materials, Textbooks
Local Sources $389.1 million The local budget pays for:Noncategorical (Most fl exible sources)• County Appropriation• Fund Balance Appropriation• Indirect Cost (charged to Enterprise activities for building use, utilities, maintenance, etc.)• Fines and Forfeitures• Investment Fund Interest• E-Rate• Tuition and Parking Fees• Sale of fi xed assets and inventory• Cellular LeaseUnused funds roll to fund balance. County appro-priation is received 1/12 each month.Enterprise Funds (supported by outside fees)• Child Nutrition• Tuition Programs (Before/After School; Summer Camp; Preschool)• Community SchoolsBuilding Program ManagementLocal Grants/Local Contracts/Donations
$316.2 m$7.5 m$5.5 m
$4.1 m$3.6 m$2.2 m$1.1 m$0.6 m$0.1 m
$26.3 m$13.2 m
$6.8 m$1.9 m
Local salary supplement for all teachers & school-based administrators7,772 Clerical months7,424 Child Nutrition months7,075 Teacher months4,364 Crafts/Trades months3,135 Central Offi ce Administrator months3,114 Instructional Support months2,854 Teacher Assistant months1,641 Transportation months1,367 School-based Administrator months 630 Interpreter/Therapist/Specialist months 425 Technical months 6 Custodial months$59 million Purchased Services$30 million Utilities$22 million Supplies and Materials$ 6 million Capital Outlay (Mobile Units, Equip-ment, and Vehicles)$11 million Transfer to Charter Schools
Federal Sources $78.1 million The federal budget pays for:Federal Grants• Routed through NCDPI• Direct
Commodities (turkey, beef, cheese)MedicaidROTC
•••
$55.4 m$4.3 m
$17.5 m$0.7 m$0.2 m
4,065 Teacher months1,905 Teacher Assistant months1,558 Instructional Support months 102 Clerical months 90 Central Offi ce Administration months 67 Technical months$ 22 million Supplies and Materials$ 11 million Purchased ServicesFederal grants support programs for students with special needs, remediation programs, magnet pro-grams, class size reduction, etc.
1Months of Employment are directly related to allotments. Allotments are allocations of state, federal, and local resources to schools. Some items in the chart are shown in terms of “months” rather than dollars due to the way we allot and track the human resources of the school system. In the Wake County Public School System (WCPSS), controlling the hiring process within a budget of months is called “position control”.
Organizational Development & Support $4,804,568,Communications $4,210,152, Area Superintendents$1,609,280, Board of Education $1,326,964 - 1%
Operating Budget $1,224,306,587
18 www.wcpss.net
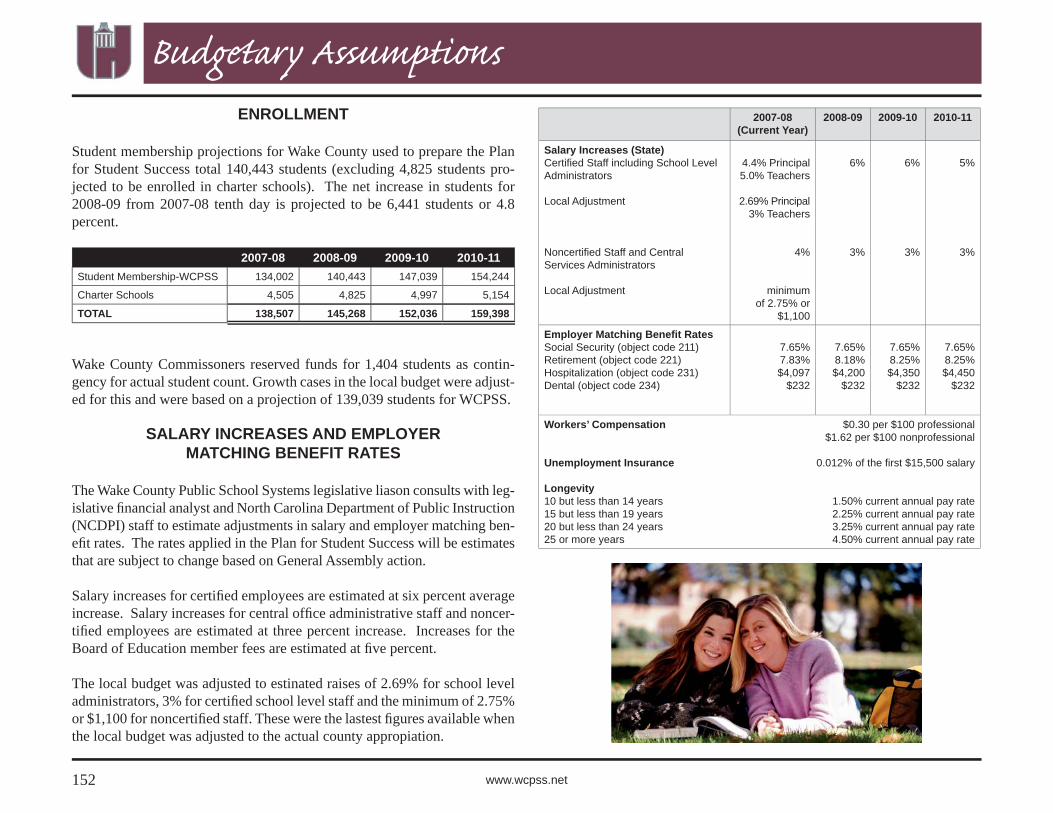
Salary and Benefi t Issues: The legislative liaison consults with legislative fi nancial analysts and the North Carolina Department of Public Instruction (NCDPI) staff to determine adjustments that may occur in salary and em-ployer matching benefi t rates. These adjustments applied in the Plan for Student Success are estimates that are subject to change based on General Assembly action(s).
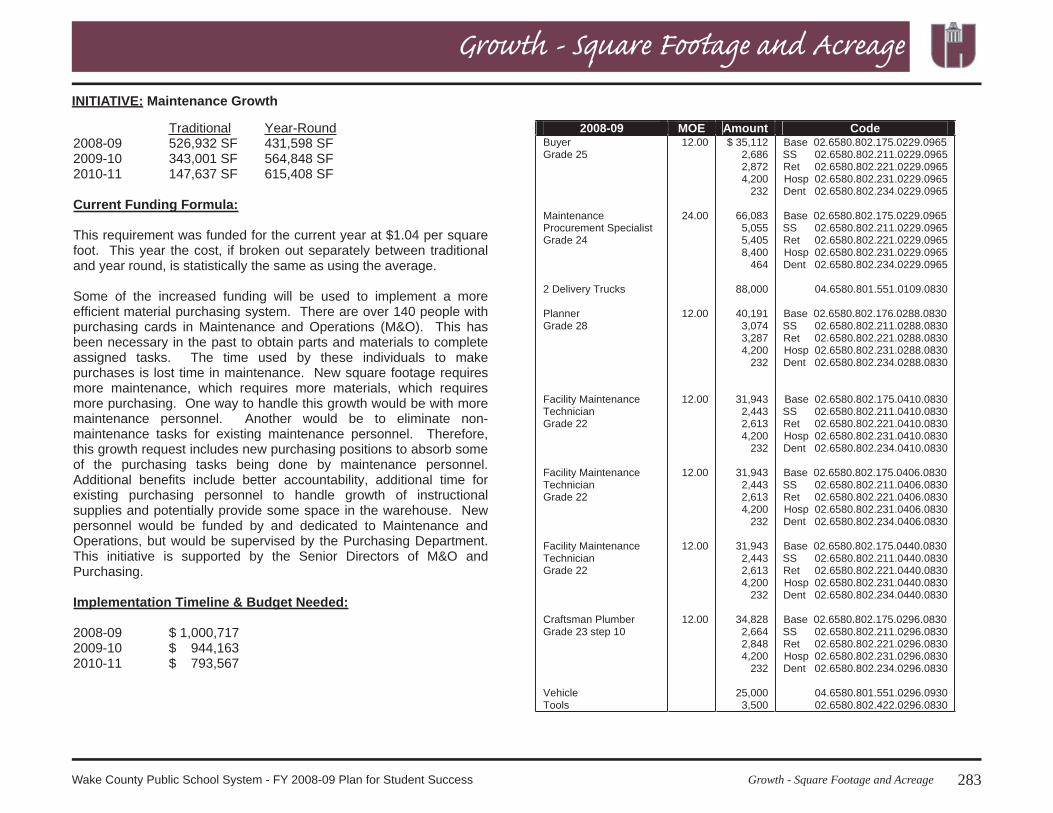
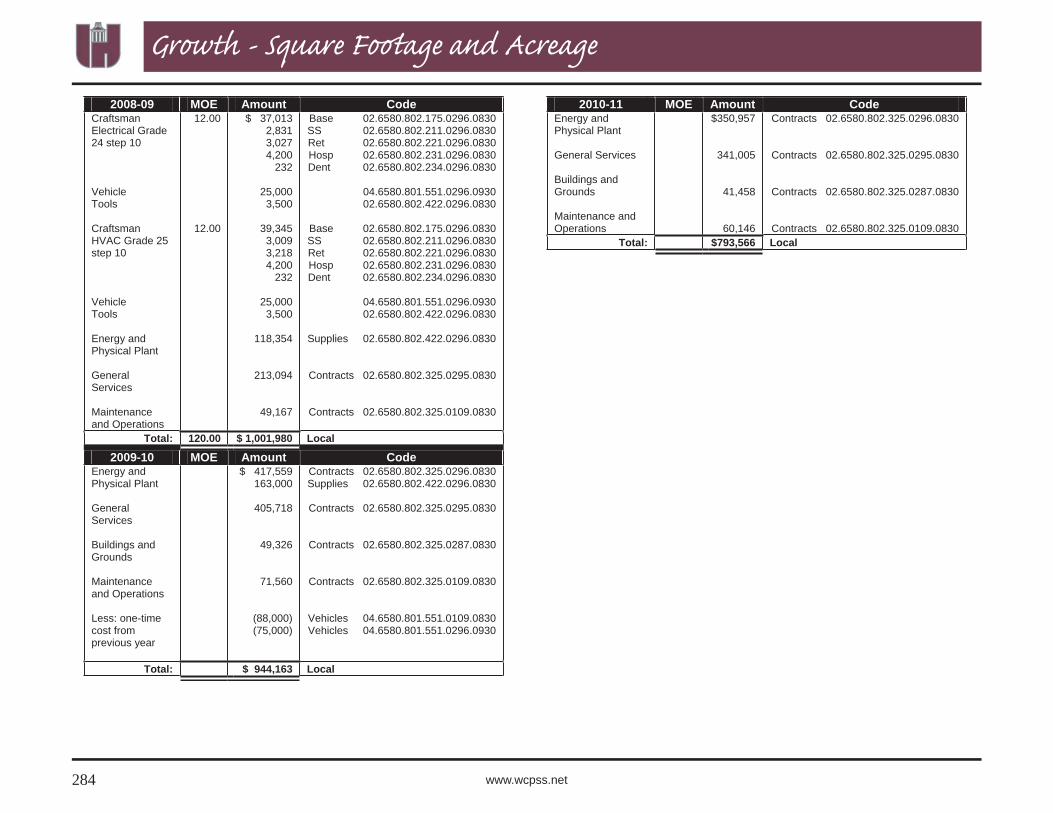
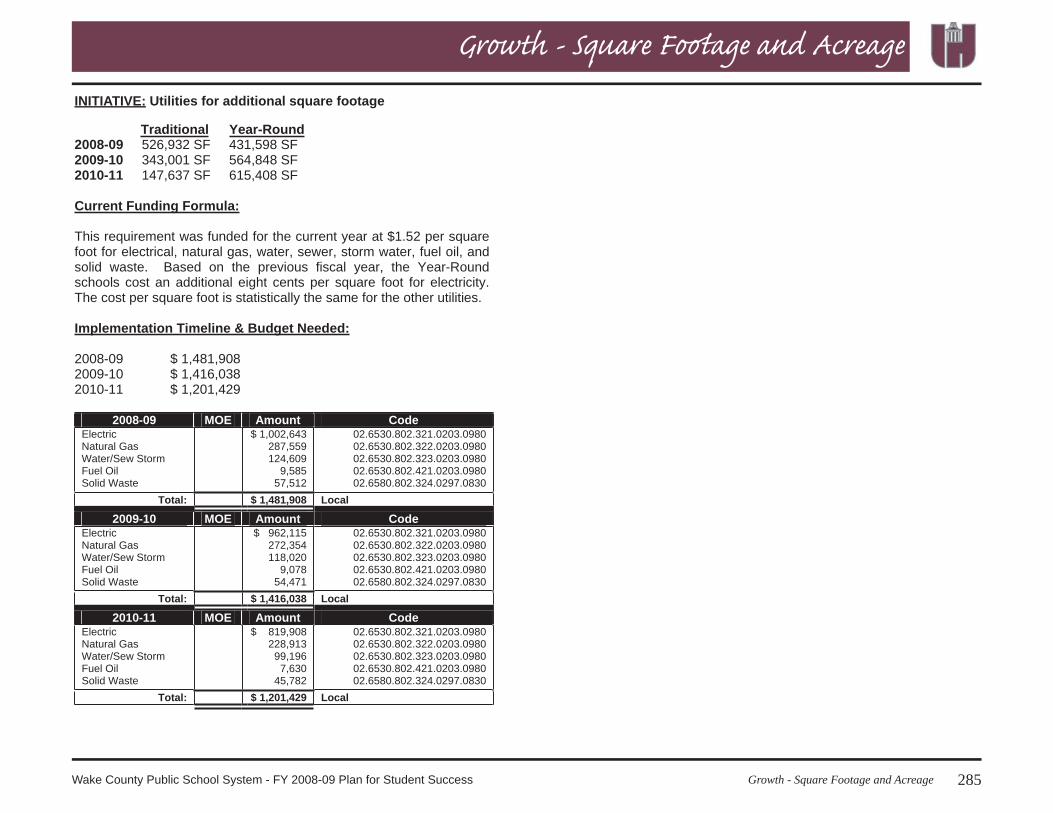
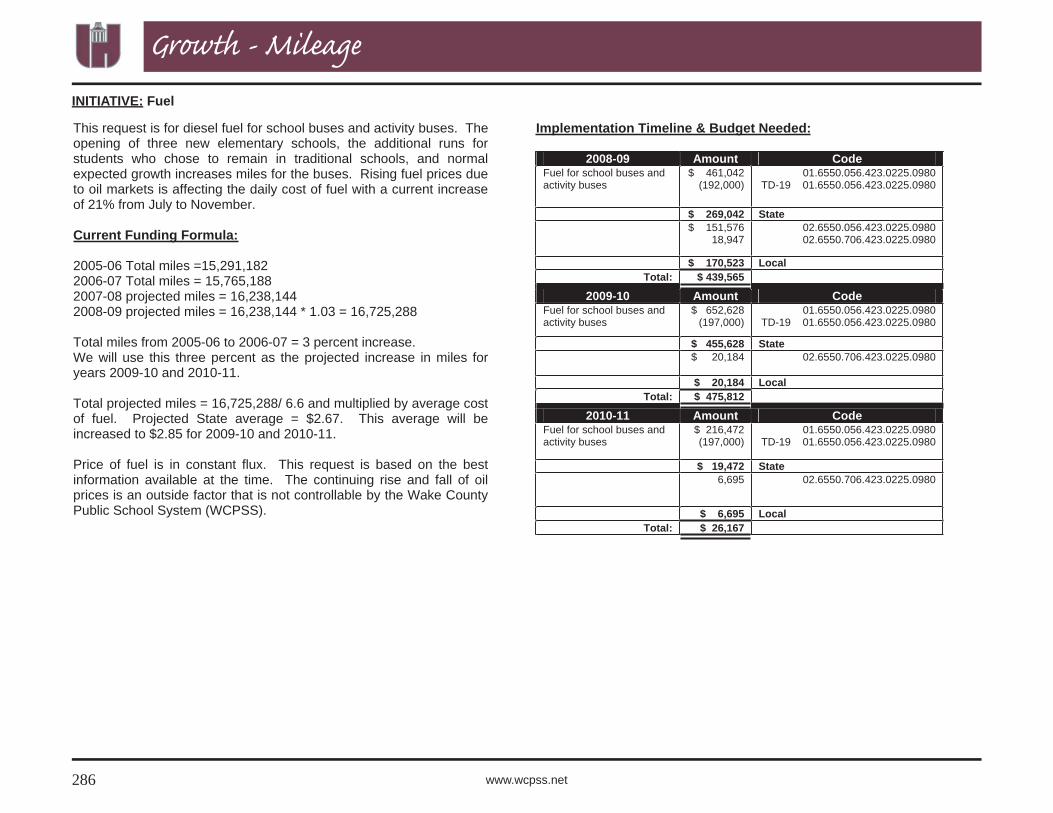
Growth Issues: Requests are included for months of employment (MOE) and dollars needed due to student membership, number and type of schools, number of staff, square footage, acreage, mileage, and number of facilities. Startup dollars were budgeted for early hires, purchased services, and staff development for schools that will be opening or expanding grade levels in the summer of 2009.
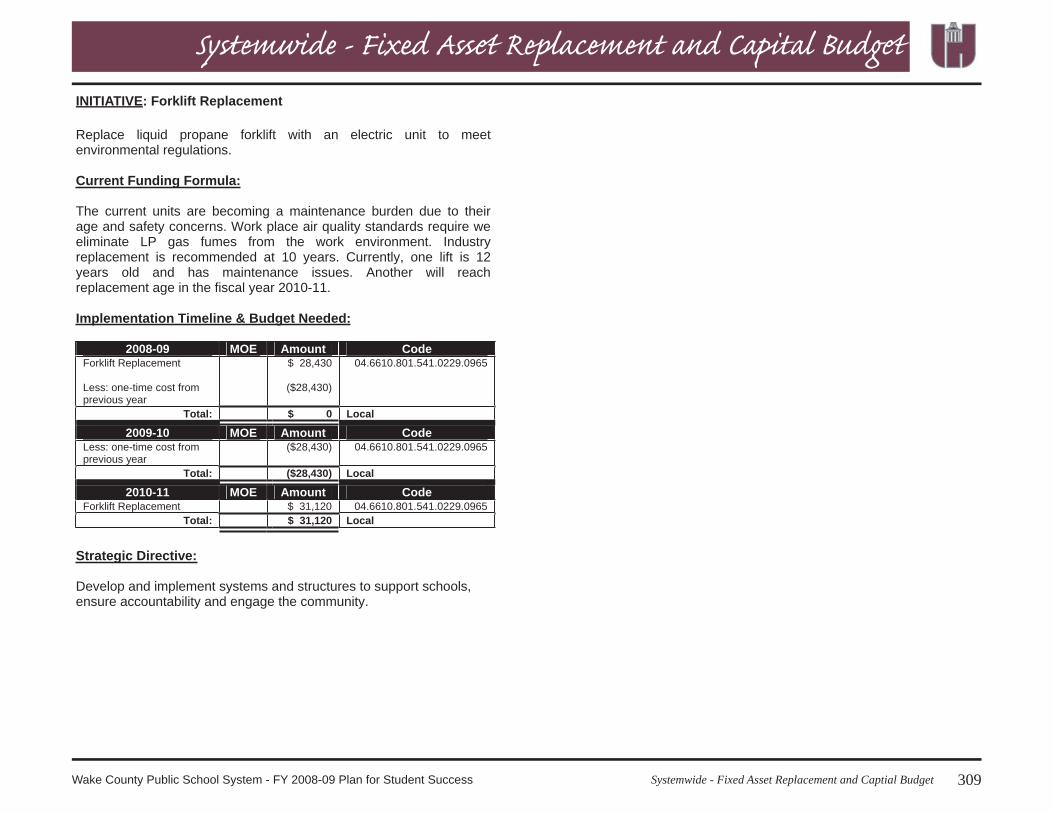
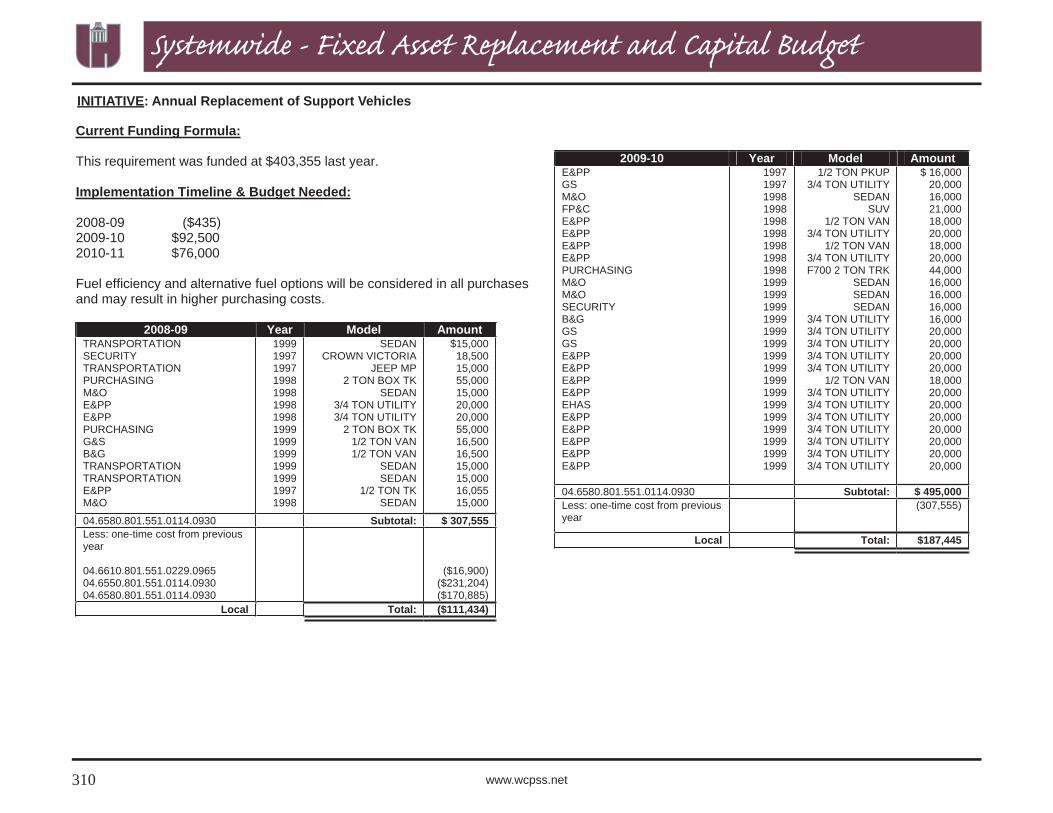
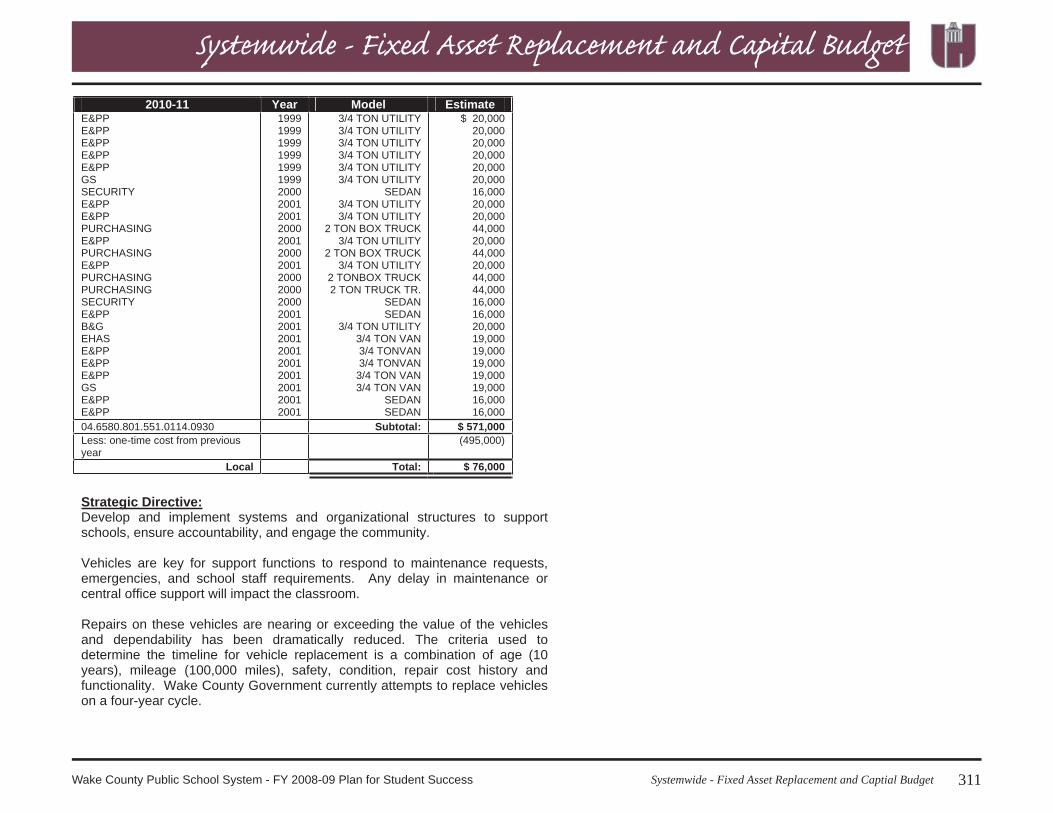
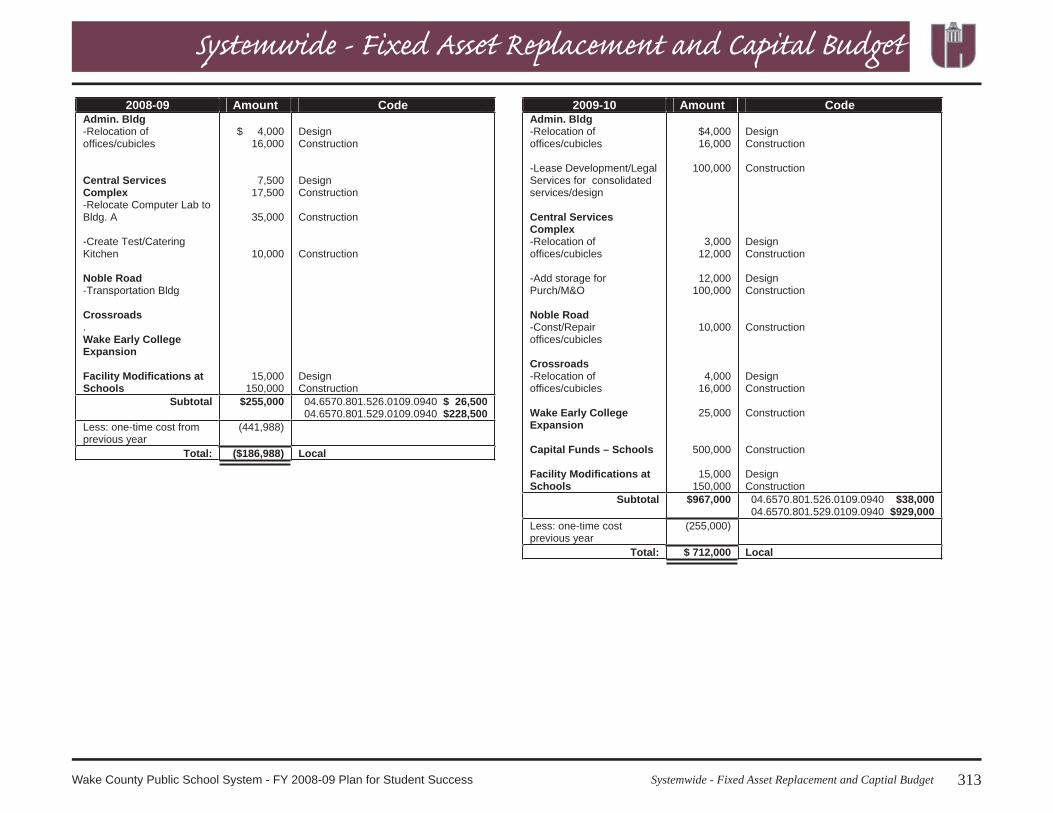
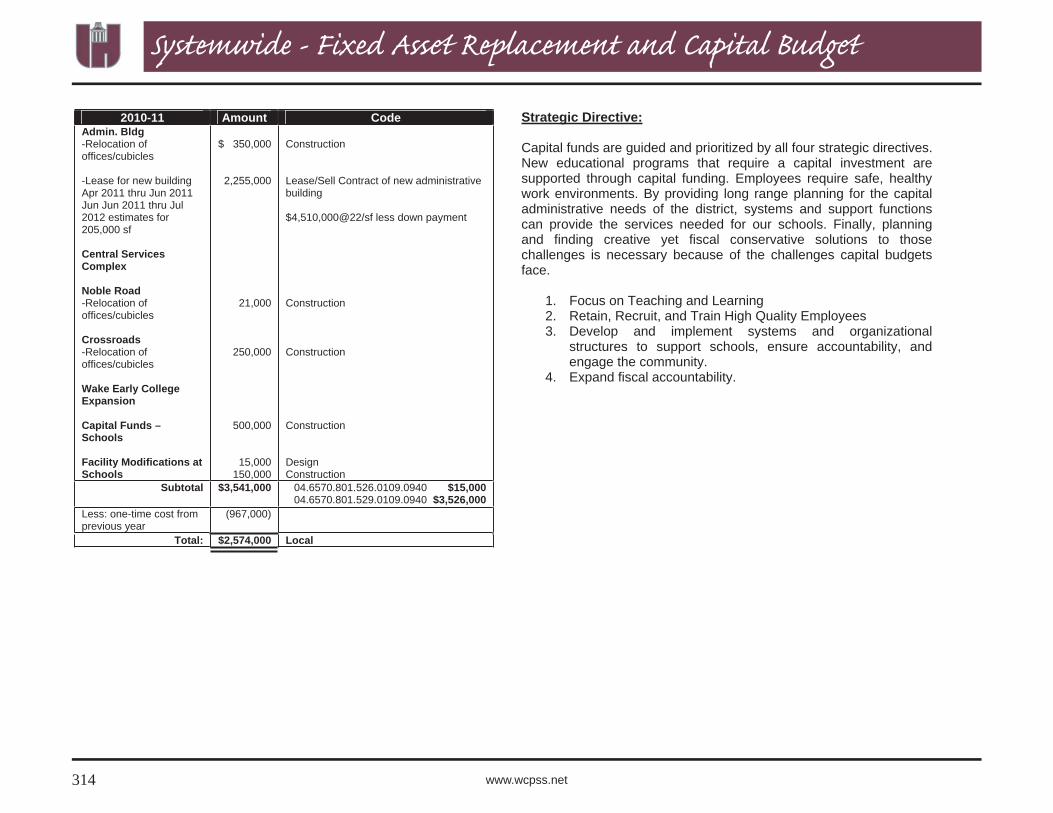
Systemwide Increases: Requests are included for fi scal accountability, rate increases, facility leases, safety and security, data integrity, fi xed asset re-placement and capital budget.
Commitments by the Board of Education: Adjustments are included for changes to programs committed to by the Board of Education during 2007-08 to be effective in 2008-09, 2009-10, or 2010-11. These are items the board has approved, but for which costs or savings are not yet in place.
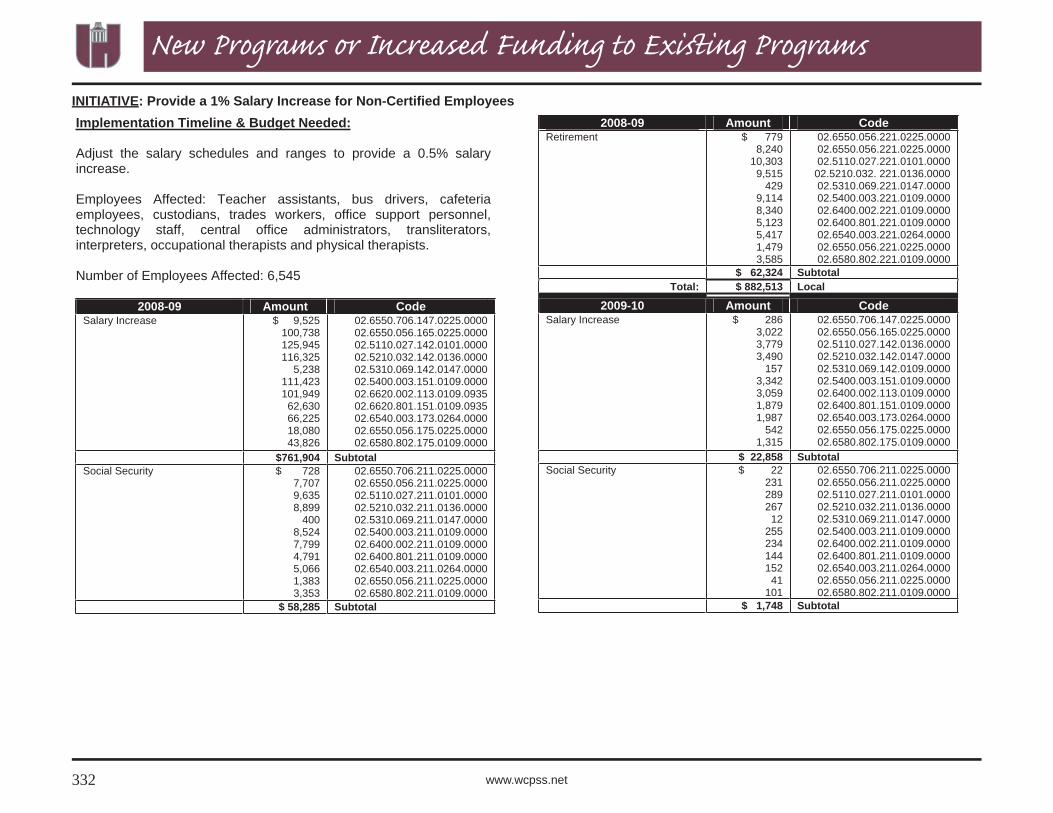
New Programs or Increased Funding to Existing Programs: Requests are included for any new programs or expansions to existing programs in
terms of months of employment and dollars. All increases requested sup-port the system’s strategic plan. Changes to current allotment formulas were considered in this category.
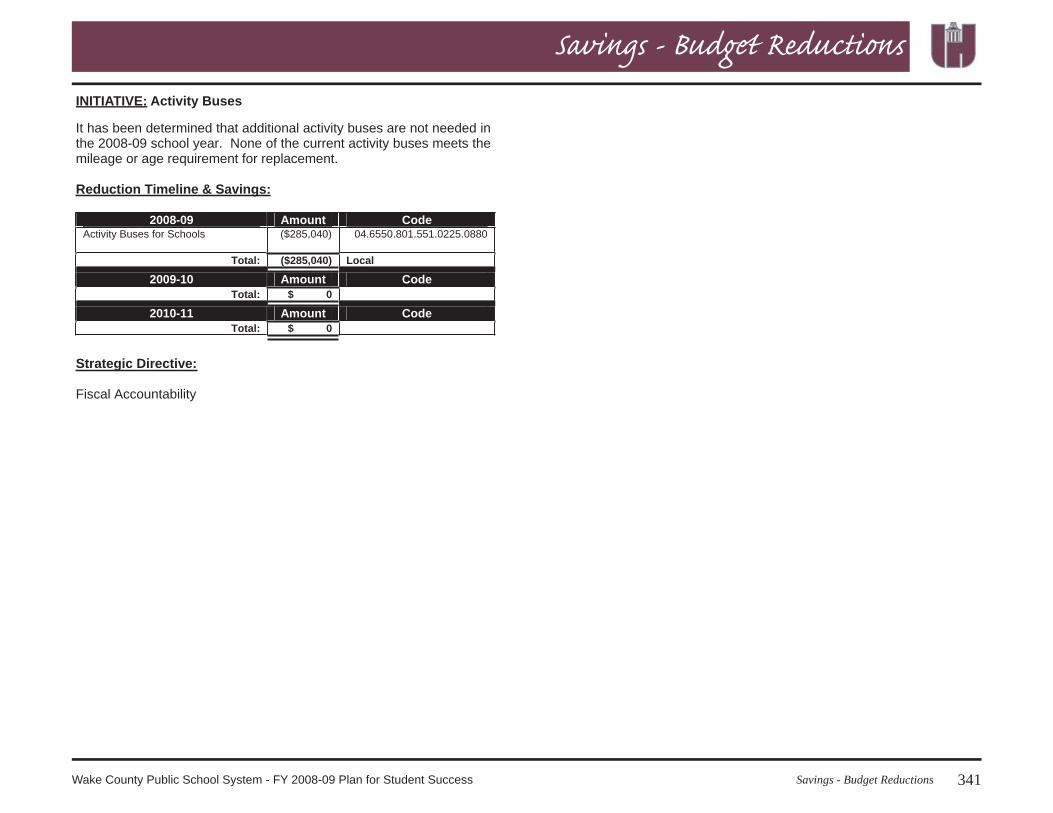
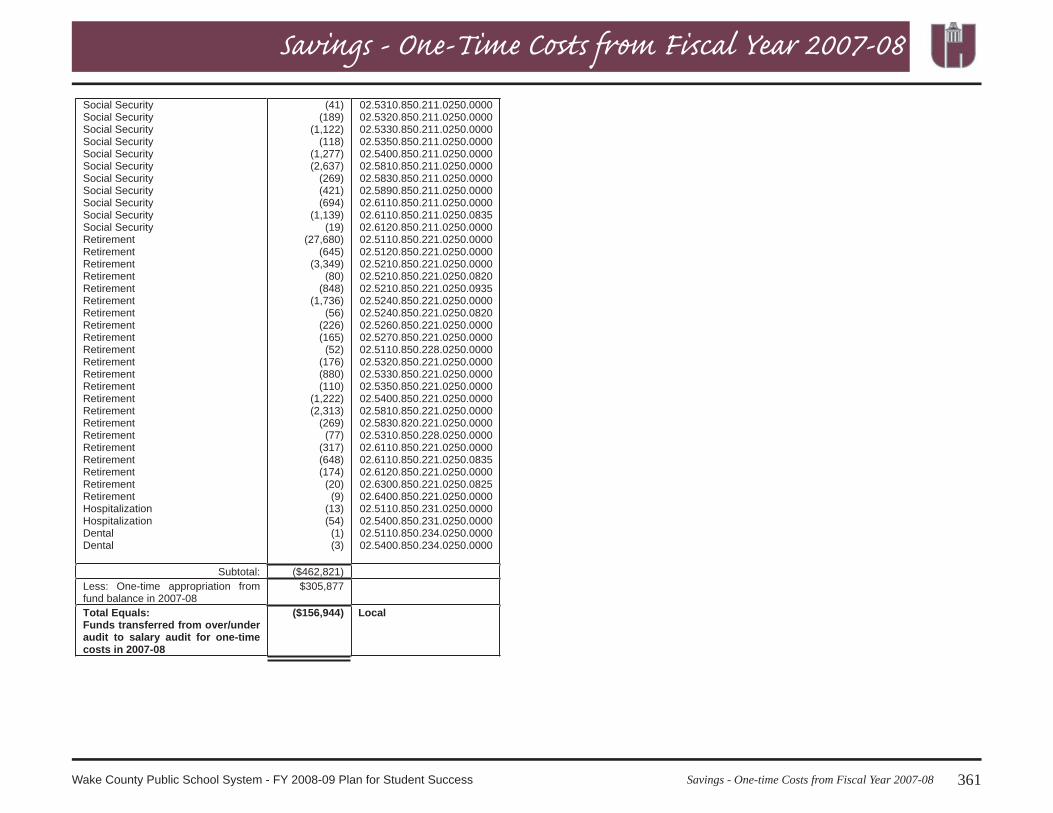
Savings and Reduction of One-Time Costs from the Previous Year:One-time costs from 2007-08 were eliminated. Savings from the previ-ous year were identifi ed. Elimination of one-time costs will be included as a reduction in the budget. As part of our fi nancial management process, programs are reviewed monthly to determine expenditure patterns that may vary from budget. Any material differences are reported to the Board of Education on a quarterly basis in the “over/under” document. The savings on the “over/under”, if recurring, will appear as reductions in the subsequent year budget.
When this budget was prepared, the General Assembly was not in session and planning allotments had not been released by North Carolina Depart-ment of Public Instruction (NCDPI). The state budget in this document was built by applying existing state funding formulas to projected student counts. Federal dollars are estimates and will be adjusted as actual awards are received.
See DRIVERS illustrated in the chart on the next page.
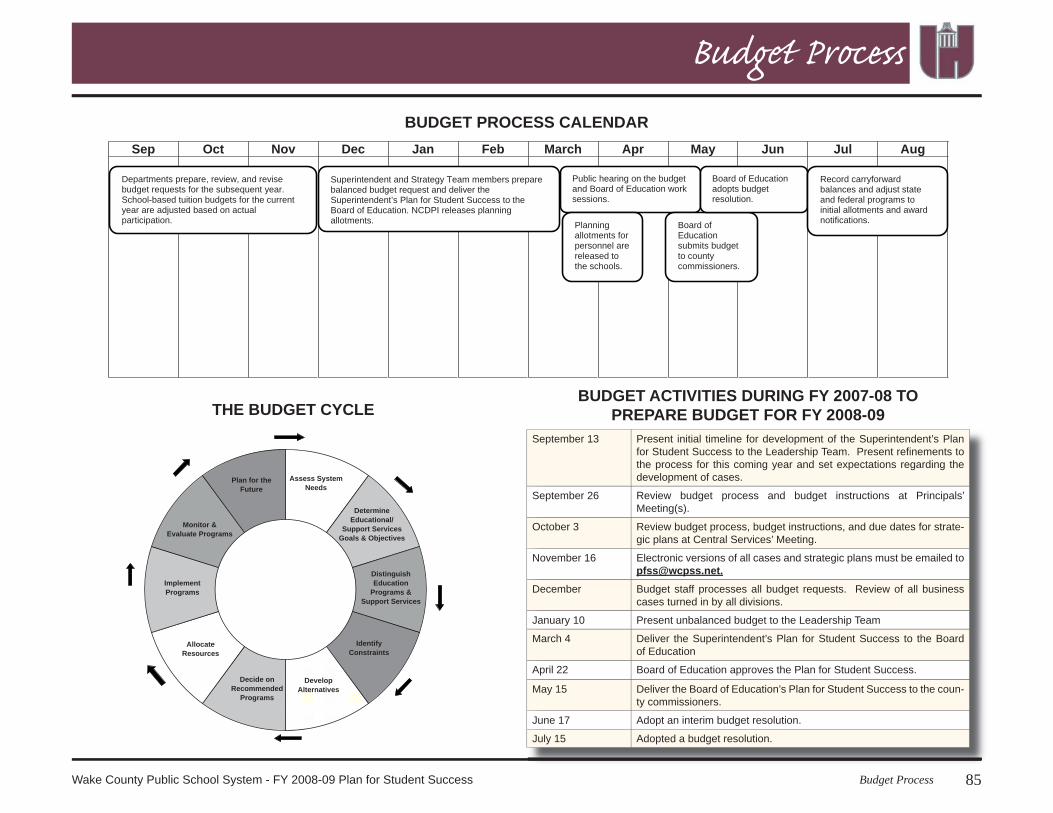
Budget development is a year-round process, beginning in the fall and culminating with the adoption of the budget resolution in June by the Wake County Board of Education. Participation in the process of budget development includes input from schools and central services departments, as well as other stake-holders. The process of budget development has been focused by our efforts to have 95 percent of students at or above grade level.
The Superintendent’s Strategy Team develops the Plan for Student Success to be delivered to the Board of Education. Following review, a public hearing, and action, the board approves a Plan for Student Success to be delivered to the Wake County Board of Commissioners by May 15. The budget is adopted following action by the Board of Commissioners.
Several “Drivers” played an important role in the development of the 2008-09 budget for our school system:
Budget Development and Drivers
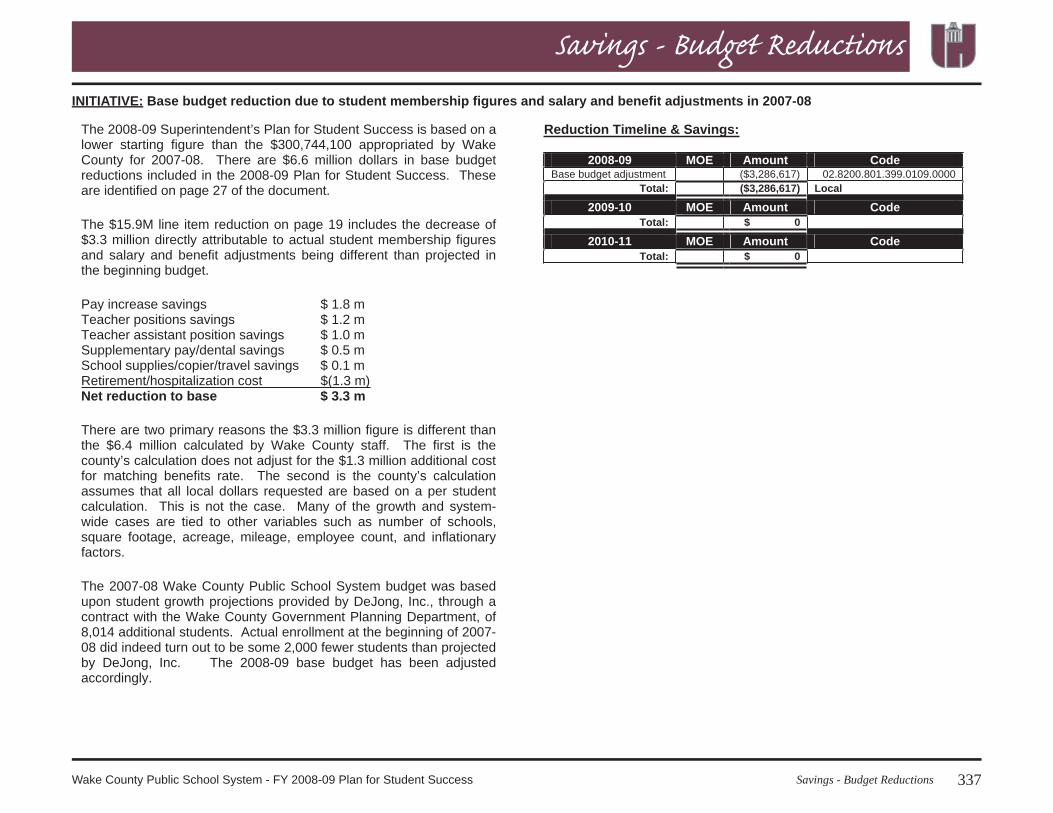
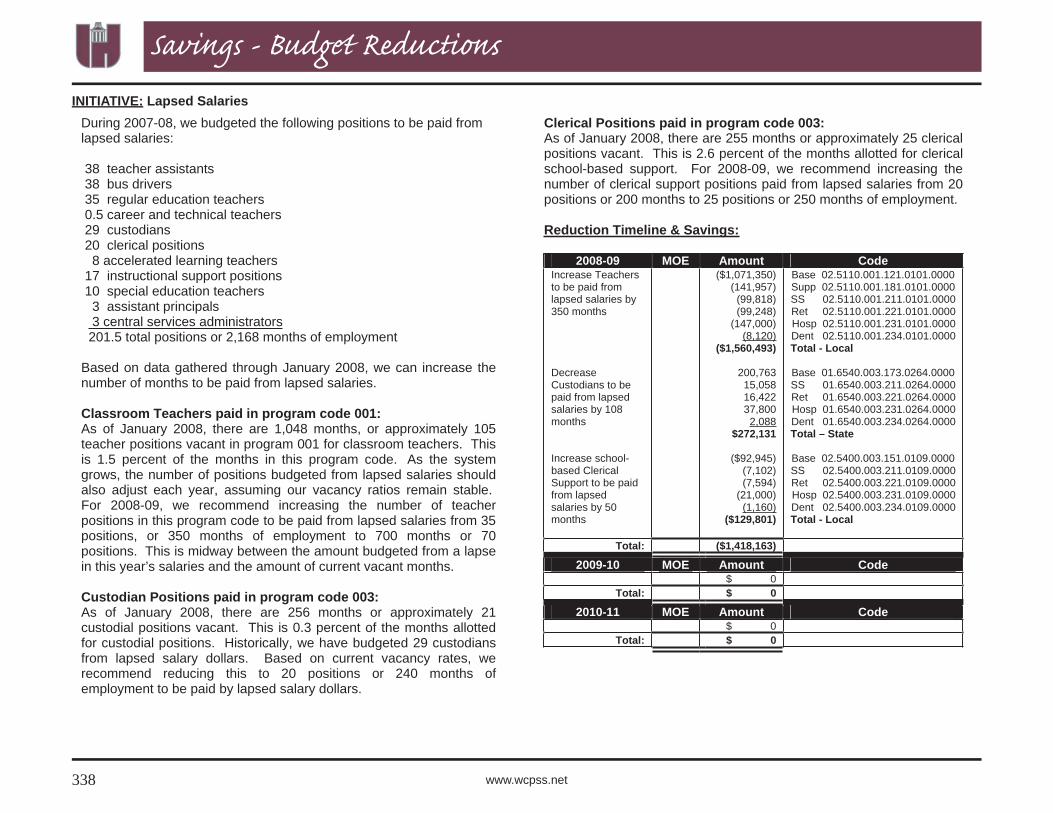
19Wake County Public School System - FY 2008-09 Plan for Student Success
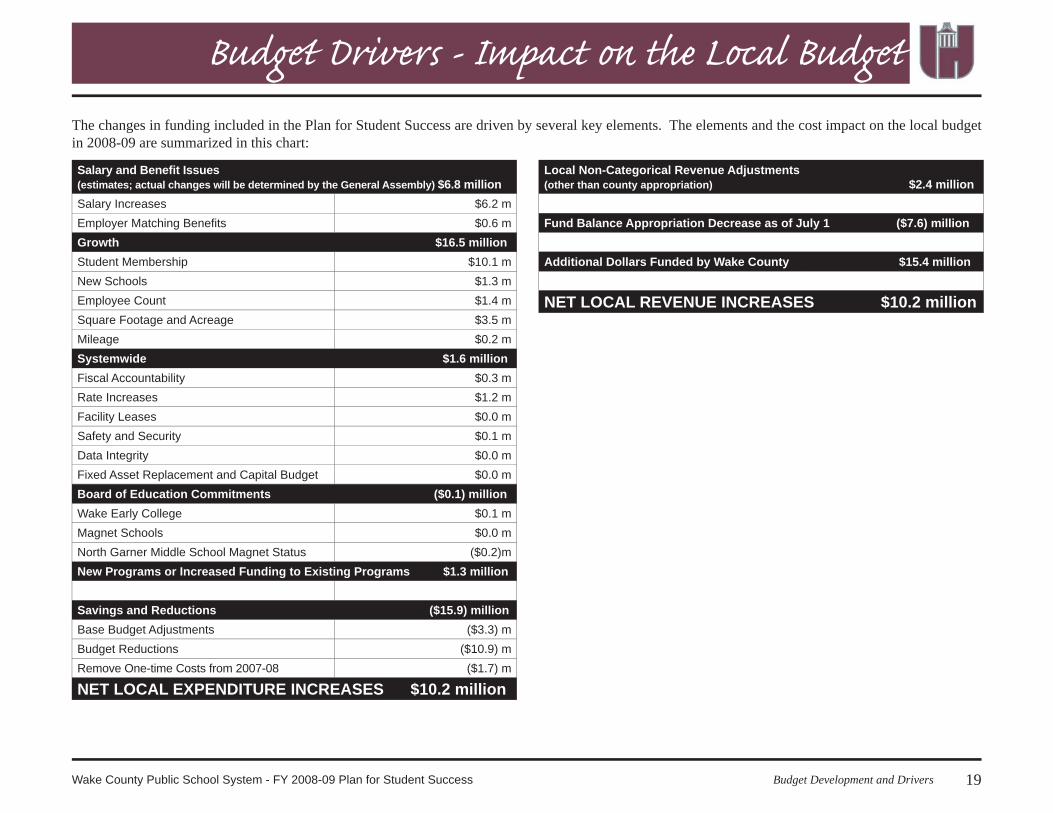
The changes in funding included in the Plan for Student Success are driven by several key elements. The elements and the cost impact on the local budget in 2008-09 are summarized in this chart:
Salary and Benefi t Issues (estimates; actual changes will be determined by the General Assembly) $6.8 millionSalary Increases $6.2 mEmployer Matching Benefi ts $0.6 mGrowth $16.5 millionStudent Membership $10.1 mNew Schools $1.3 mEmployee Count $1.4 mSquare Footage and Acreage $3.5 mMileage $0.2 mSystemwide $1.6 millionFiscal Accountability $0.3 mRate Increases $1.2 mFacility Leases $0.0 mSafety and Security $0.1 mData Integrity $0.0 mFixed Asset Replacement and Capital Budget $0.0 mBoard of Education Commitments ($0.1) millionWake Early College $0.1 mMagnet Schools $0.0 mNorth Garner Middle School Magnet Status ($0.2)mNew Programs or Increased Funding to Existing Programs $1.3 million
Savings and Reductions ($15.9) millionBase Budget Adjustments ($3.3) mBudget Reductions ($10.9) mRemove One-time Costs from 2007-08 ($1.7) m
NET LOCAL EXPENDITURE INCREASES $10.2 million
Budget Development and Drivers
Local Non-Categorical Revenue Adjustments (other than county appropriation) $2.4 million
Fund Balance Appropriation Decrease as of July 1 ($7.6) million
Additional Dollars Funded by Wake County $15.4 million
NET LOCAL REVENUE INCREASES $10.2 million
Budget Drivers - Impact on the Local Budget
20 www.wcpss.net
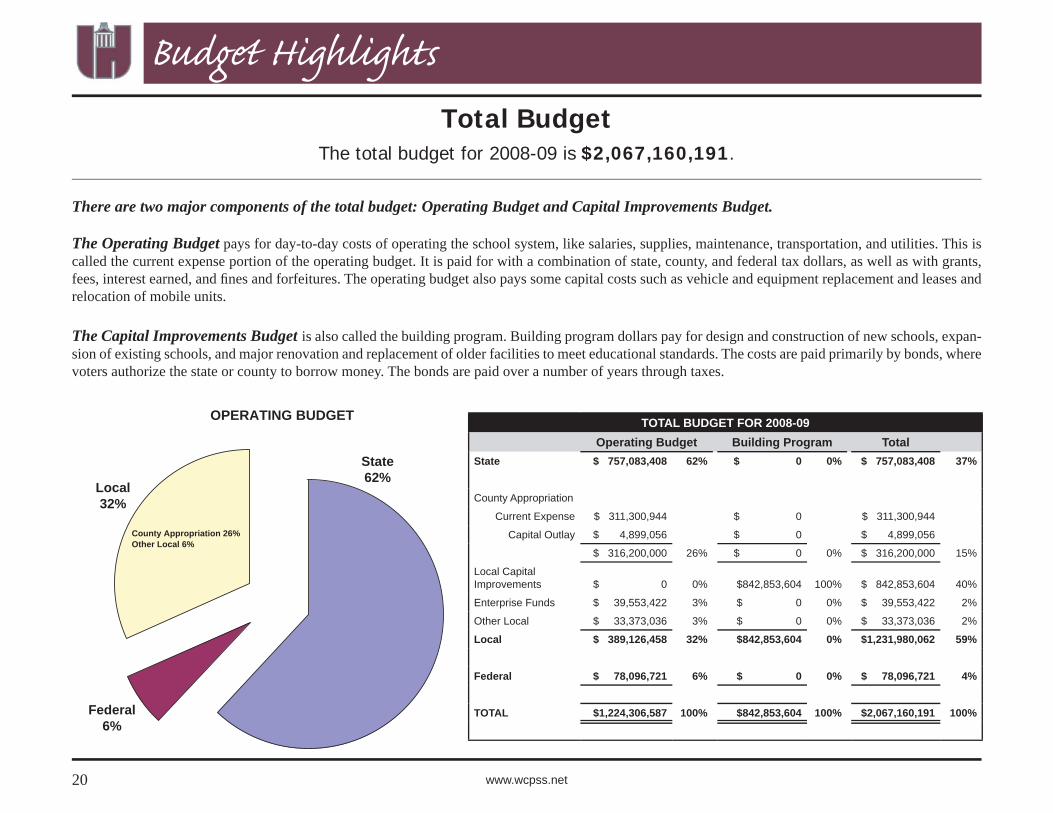
There are two major components of the total budget: Operating Budget and Capital Improvements Budget.
The Operating Budget pays for day-to-day costs of operating the school system, like salaries, supplies, maintenance, transportation, and utilities. This is called the current expense portion of the operating budget. It is paid for with a combination of state, county, and federal tax dollars, as well as with grants, fees, interest earned, and fi nes and forfeitures. The operating budget also pays some capital costs such as vehicle and equipment replacement and leases and relocation of mobile units.
The Capital Improvements Budget is also called the building program. Building program dollars pay for design and construction of new schools, expan-sion of existing schools, and major renovation and replacement of older facilities to meet educational standards. The costs are paid primarily by bonds, where voters authorize the state or county to borrow money. The bonds are paid over a number of years through taxes.
Total BudgetThe total budget for 2008-09 is $2,067,160,191.
TOTAL BUDGET FOR 2008-09Operating Budget Building Program Total
State $ 757,083,408 62% $ 0 0% $ 757,083,408 37%
County Appropriation
Current Expense $ 311,300,944 $ 0 $ 311,300,944
Capital Outlay $ 4,899,056 $ 0 $ 4,899,056
$ 316,200,000 26% $ 0 0% $ 316,200,000 15%
Local Capital Improvements $ 0 0% $842,853,604 100% $ 842,853,604 40%
Other Local $ 33,373,036 3% $ 0 0% $ 33,373,036 2%
Local $ 389,126,458 32% $842,853,604 0% $1,231,980,062 59%
Federal $ 78,096,721 6% $ 0 0% $ 78,096,721 4%
TOTAL $1,224,306,587 100% $842,853,604 100% $2,067,160,191 100%
OPERATING BUDGET
Federal6%
State62%
Local32%
County Appropriation 26%Other Local 6%
Budget Highlights
21Budget HighlightsWake County Public School System - FY 2008-09 Plan for Student Success
Budget Highlights
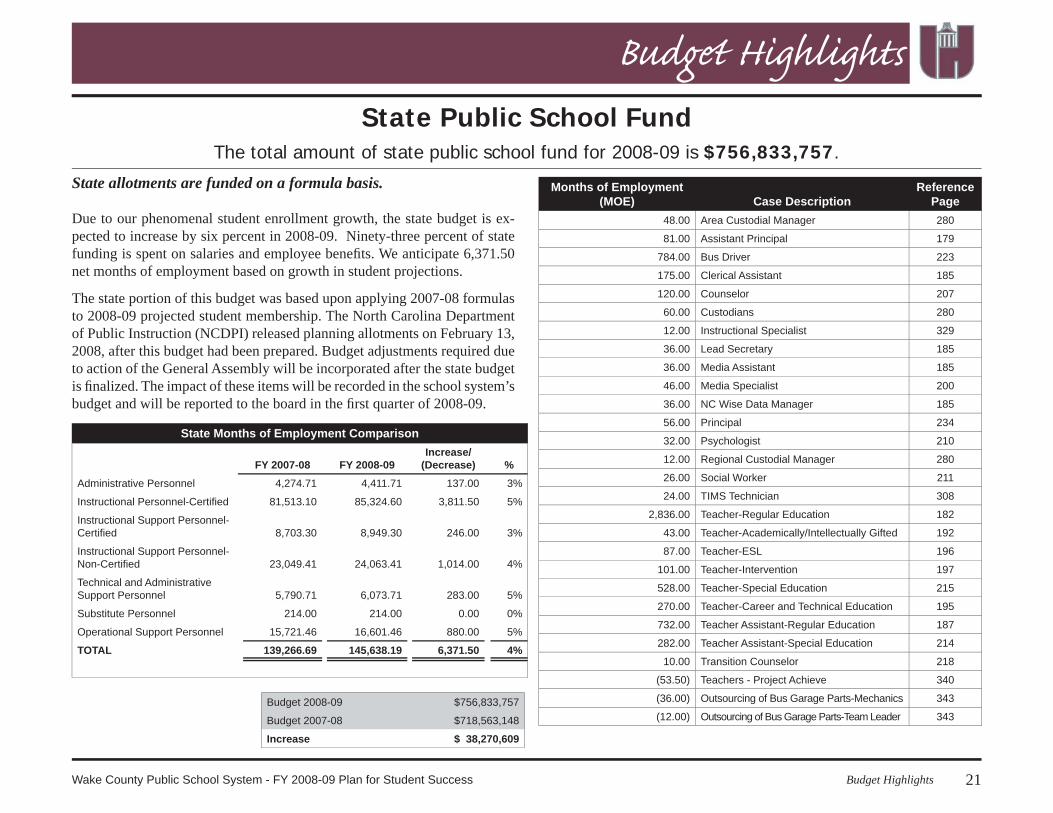
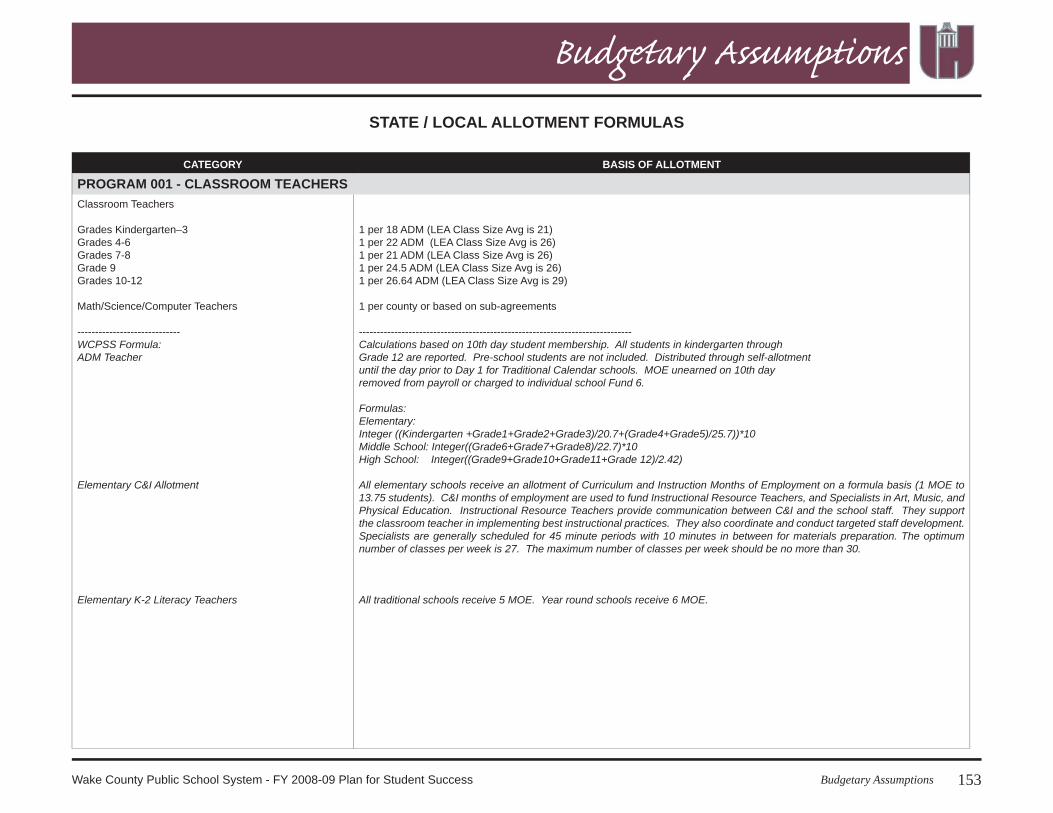
State allotments are funded on a formula basis.
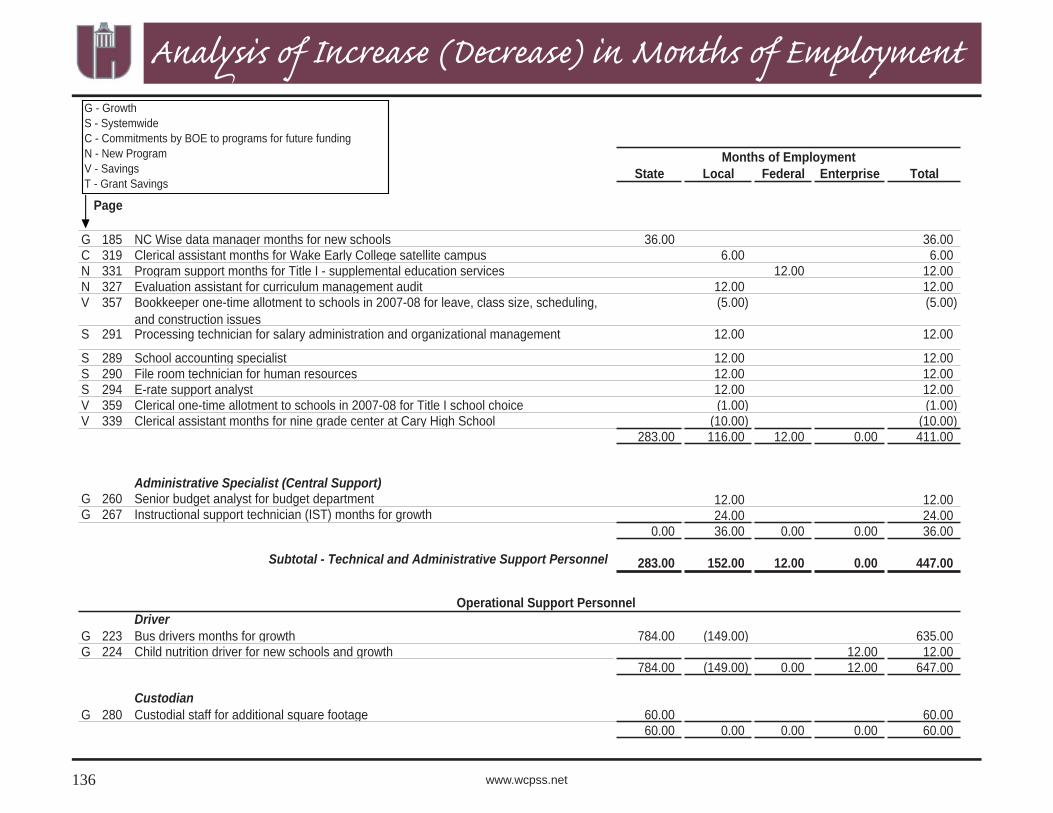
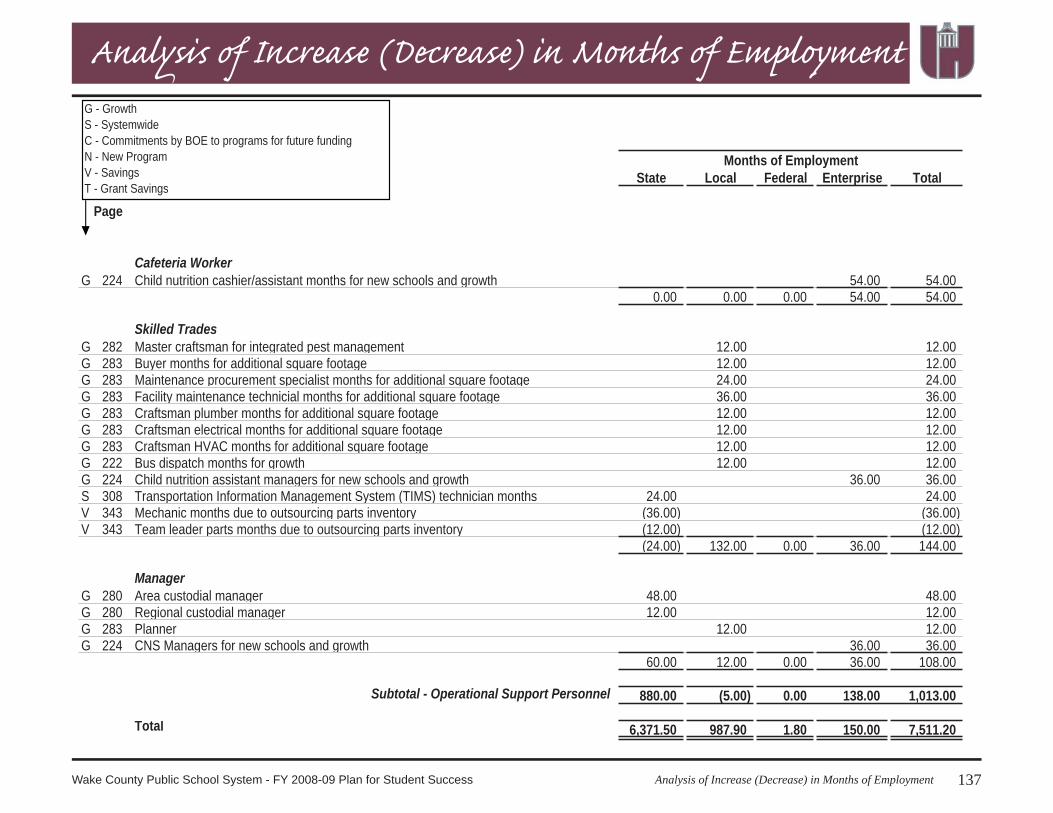
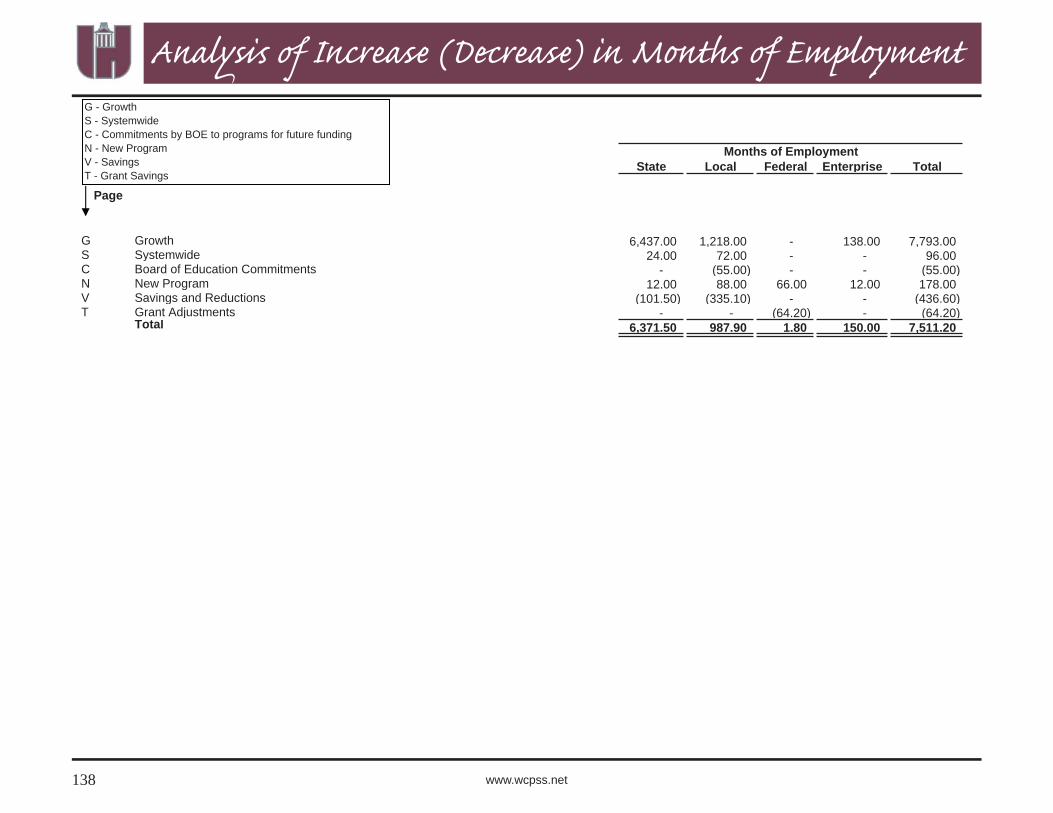
Due to our phenomenal student enrollment growth, the state budget is ex-pected to increase by six percent in 2008-09. Ninety-three percent of state funding is spent on salaries and employee benefi ts. We anticipate 6,371.50 net months of employment based on growth in student projections.
The state portion of this budget was based upon applying 2007-08 formulas to 2008-09 projected student membership. The North Carolina Department of Public Instruction (NCDPI) released planning allotments on February 13, 2008, after this budget had been prepared. Budget adjustments required due to action of the General Assembly will be incorporated after the state budget is fi nalized. The impact of these items will be recorded in the school system’s budget and will be reported to the board in the fi rst quarter of 2008-09.
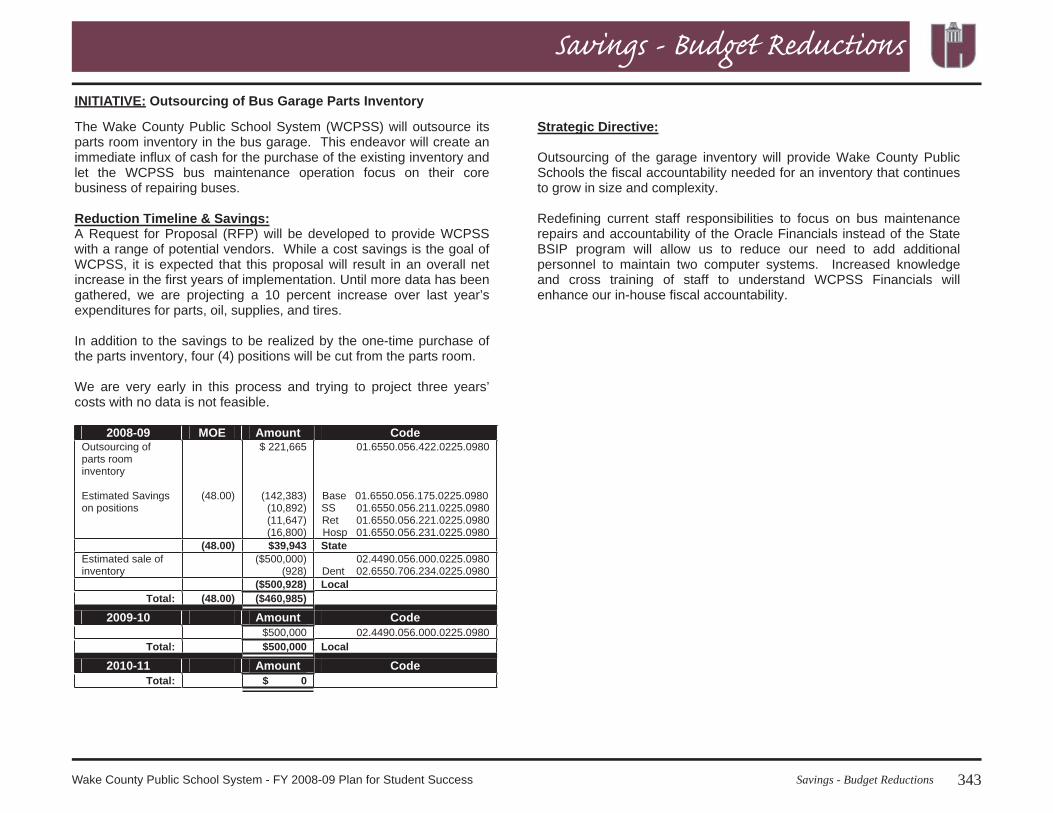
(36.00) Outsourcing of Bus Garage Parts-Mechanics 343
(12.00) Outsourcing of Bus Garage Parts-Team Leader 343Budget 2008-09 $756,833,757
Budget 2007-08 $718,563,148
Increase $ 38,270,609
22 www.wcpss.net
Budget Highlights
Local Current Expense FundThe total amount of the local current expense fund for 2008-09 is $342,765,070.
The local current expense budget includes local noncategorical revenues of the school system.
The largest of these is the county appropriation. Others include fi nes and forfeitures, indirect cost, interest earned, E-Rate, tuition and parking fees, and fund balance appropriation.
Ongoing, rapid growth and efforts to improve student achievement continue to be the most signifi cant fi scal challenges for our school system. Student membership projections total 140,443 students (excluding 4,825 students projected to be enrolled in charter schools). Our net projected increase in students for 2008-09 is 6,441 students or 4.8 percent.
WCPSS manages resources in an effi cient and effective manner, which has been confi rmed by numerous audits and studies by independent citi-zen groups. We are proud of our effi ciency, and we continually seek ways to make the best use of every dollar spent. We utilize a purchasing card throughout the system to decrease the time between order and delivery by teachers and other staff, as well as to reduce purchase orders and accounts payable transactions. We utilize a systemwide e-mail system to reduce paper transactions and improve timeliness of communication. We have eliminated option pay and require direct deposit for employee pay. This reduced cost, saved processing time, and signifi cantly reduced salary audit exceptions from NCDPI. The chief business offi cer, fi nance offi cer, and senior director of budget meet with each division and the principals quarterly to review fi -nancial issues, spending and collection patterns, and to discuss risks. A $1.0 million reduction remains in the base budget to be recouped from a 60-day freeze of all central services vacancies.
During the year, vacancies occur in positions in the school system as em-ployee turnover occurs. Dollar savings occur for each day positions remain
vacant and salaries are not paid. Based on historical experience, data gener-ated from our fi nancial system, and the state of the economy, we are able to track where and how often this occurs. In order to gain maximum use of our resources, we include positions in our budget with no assigned costs to be paid from these lapsed dollars. We budget 233 positions to be paid from lapsed salaries, including 70 regular education teachers, 38 teacher assis-tants, 38 bus drivers, 25 clerical positions, 20 custodians, 17 instructional support positions, 10 special education teachers, eight intervention teachers, three assistant principals, three central services administrator positions, and 0.5 career and technical teachers. This is very aggressive and can vary based on turnover. We constantly monitor these areas throughout the year to make sure we will be within budgeted dollars.
We continually monitor state funding. We shift local costs onto state dollars whenever possible to make the most of state funding. We charge indirect costs on all enterprise programs to help support the local budget.
Schools process conversions during the year within State ABC transfer poli-cies. This allows schools to move dollars between program codes as defi ned in legislation in order to meet the needs of that particular school.
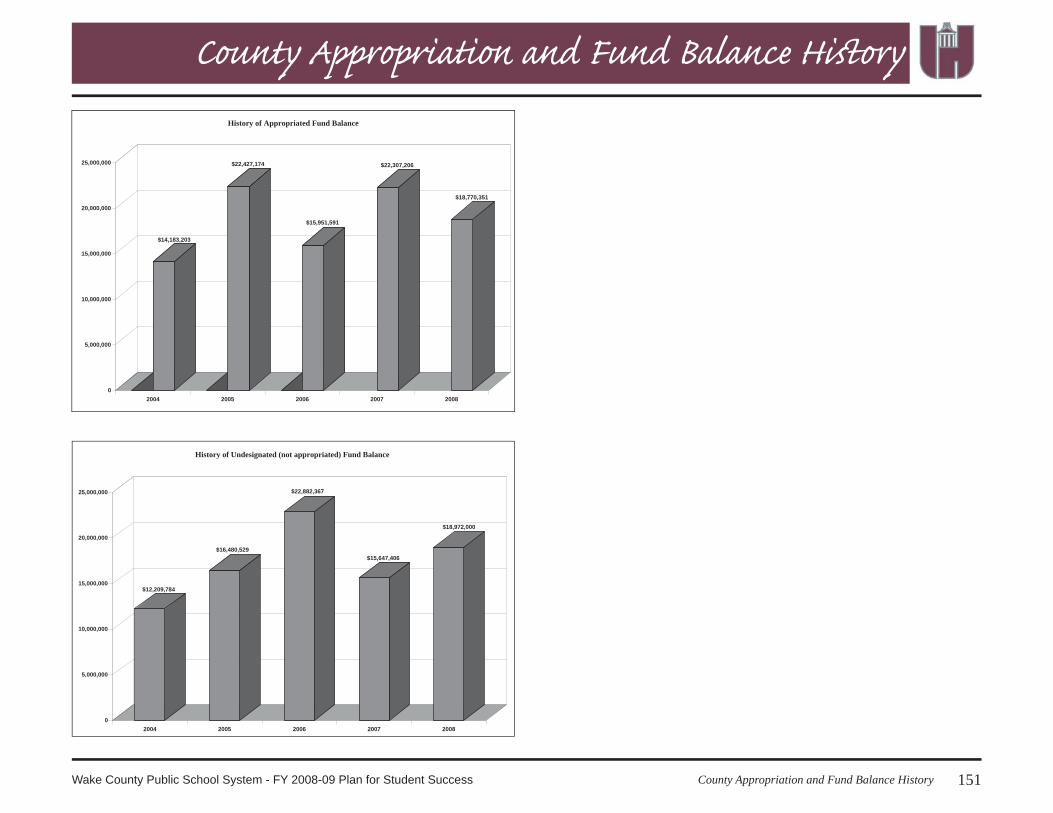
Our goal is to maintain undesignated fund balance at six percent of the sub-sequent year’s county appropriation. We allocate fund balance as part of our beginning budget. At the same time, we attempt to maintain a reserve at a level we feel is necessary to support the district in cases of emergency, unusual cir-cumstances, or negative budget variances.
We seek additional sources of revenue. The grants offi ce supports schools and assists with identifi cation of new sources of funding. We adjust fees annually as needed for tuition and parking fees.
23Budget HighlightsWake County Public School System - FY 2008-09 Plan for Student Success
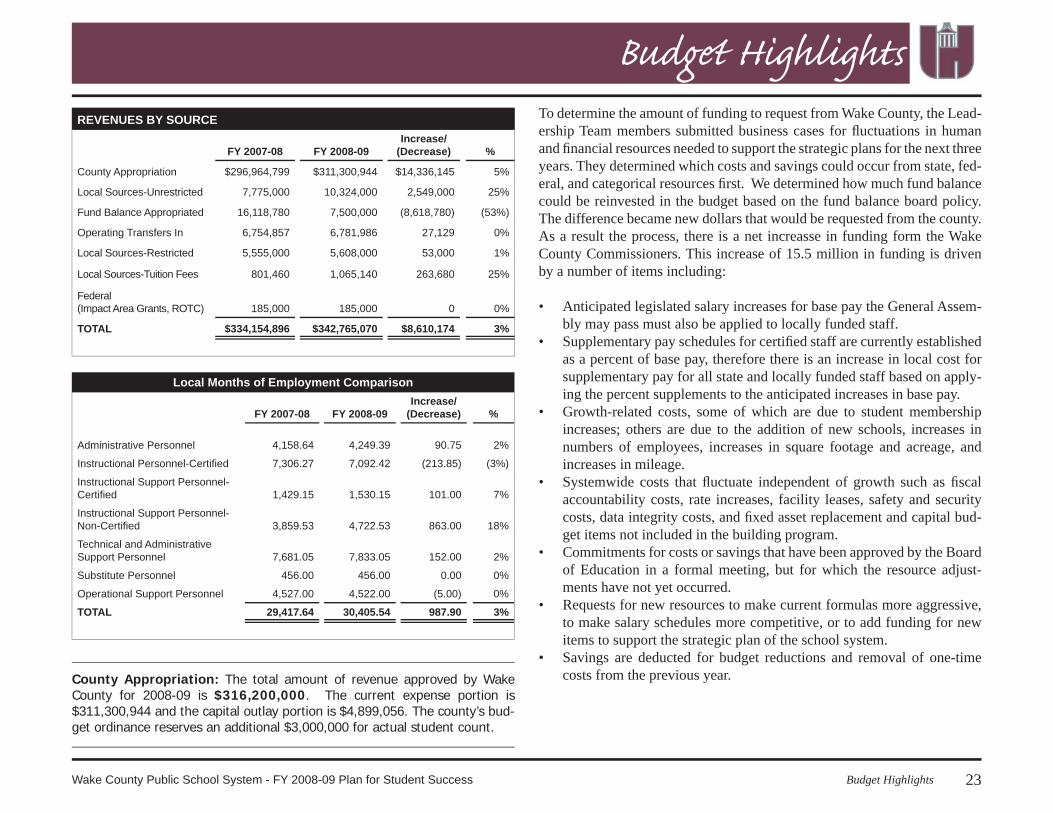
Budget HighlightsTo determine the amount of funding to request from Wake County, the Lead-ership Team members submitted business cases for fl uctuations in human and fi nancial resources needed to support the strategic plans for the next three years. They determined which costs and savings could occur from state, fed-eral, and categorical resources fi rst. We determined how much fund balance could be reinvested in the budget based on the fund balance board policy. The difference became new dollars that would be requested from the county.As a result the process, there is a net increasse in funding form the Wake County Commissioners. This increase of 15.5 million in funding is driven by a number of items including:
Anticipated legislated salary increases for base pay the General Assem-bly may pass must also be applied to locally funded staff.Supplementary pay schedules for certifi ed staff are currently established as a percent of base pay, therefore there is an increase in local cost for supplementary pay for all state and locally funded staff based on apply-ing the percent supplements to the anticipated increases in base pay.Growth-related costs, some of which are due to student membership increases; others are due to the addition of new schools, increases in numbers of employees, increases in square footage and acreage, and increases in mileage.Systemwide costs that fl uctuate independent of growth such as fi scal accountability costs, rate increases, facility leases, safety and security costs, data integrity costs, and fi xed asset replacement and capital bud-get items not included in the building program.Commitments for costs or savings that have been approved by the Board of Education in a formal meeting, but for which the resource adjust-ments have not yet occurred.Requests for new resources to make current formulas more aggressive, to make salary schedules more competitive, or to add funding for new items to support the strategic plan of the school system.Savings are deducted for budget reductions and removal of one-time costs from the previous year.
•
•
•
•
•
•
•
REVENUES BY SOURCE
FY 2007-08 FY 2008-09Increase/
(Decrease) %
County Appropriation $296,964,799 $311,300,944 $14,336,145 5%
Local Sources-Unrestricted 7,775,000 10,324,000 2,549,000 25%
Fund Balance Appropriated 16,118,780 7,500,000 (8,618,780) (53%)
Operating Transfers In 6,754,857 6,781,986 27,129 0%
Local Sources-Restricted 5,555,000 5,608,000 53,000 1%
Local Sources-Tuition Fees 801,460 1,065,140 263,680 25%
Federal (Impact Area Grants, ROTC) 185,000 185,000 0 0%
Instructional Personnel-Certifi ed 7,306.27 7,092.42 (213.85) (3%)
Instructional Support Personnel-Certifi ed 1,429.15 1,530.15 101.00 7%
Instructional Support Personnel-Non-Certifi ed 3,859.53 4,722.53 863.00 18%
Technical and Administrative Support Personnel 7,681.05 7,833.05 152.00 2%
Substitute Personnel 456.00 456.00 0.00 0%
Operational Support Personnel 4,527.00 4,522.00 (5.00) 0%
TOTAL 29,417.64 30,405.54 987.90 3%
County Appropriation: The total amount of revenue approved by Wake County for 2008-09 is $316,200,000. The current expense portion is $311,300,944 and the capital outlay portion is $4,899,056. The county’s bud-get ordinance reserves an additional $3,000,000 for actual student count.
24 www.wcpss.net
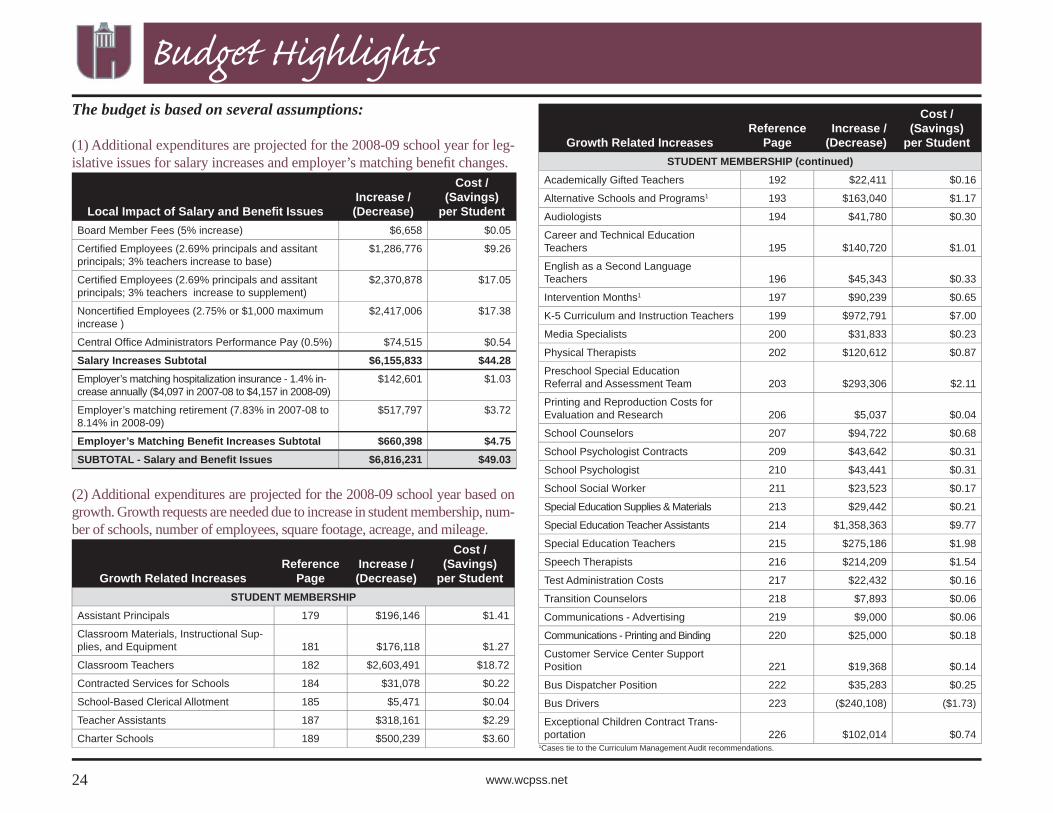
Budget HighlightsThe budget is based on several assumptions:
(1) Additional expenditures are projected for the 2008-09 school year for leg-islative issues for salary increases and employer’s matching benefi t changes.
Local Impact of Salary and Benefi t IssuesIncrease / (Decrease)
Cost / (Savings)
per StudentBoard Member Fees (5% increase) $6,658 $0.05
Certifi ed Employees (2.69% principals and assitant principals; 3% teachers increase to base)
$1,286,776 $9.26
Certifi ed Employees (2.69% principals and assitant principals; 3% teachers increase to supplement)
$2,370,878 $17.05
Noncertifi ed Employees (2.75% or $1,000 maximum increase )
$2,417,006 $17.38
Central Offi ce Administrators Performance Pay (0.5%) $74,515 $0.54
Salary Increases Subtotal $6,155,833 $44.28Employer’s matching hospitalization insurance - 1.4% in-crease annually ($4,097 in 2007-08 to $4,157 in 2008-09)
$142,601 $1.03
Employer’s matching retirement (7.83% in 2007-08 to 8.14% in 2008-09)
$517,797 $3.72
Employer’s Matching Benefi t Increases Subtotal $660,398 $4.75SUBTOTAL - Salary and Benefi t Issues $6,816,231 $49.03
(2) Additional expenditures are projected for the 2008-09 school year based on growth. Growth requests are needed due to increase in student membership, num-ber of schools, number of employees, square footage, acreage, and mileage.
Growth Related IncreasesReference
PageIncrease / (Decrease)
Cost / (Savings)
per StudentSTUDENT MEMBERSHIP
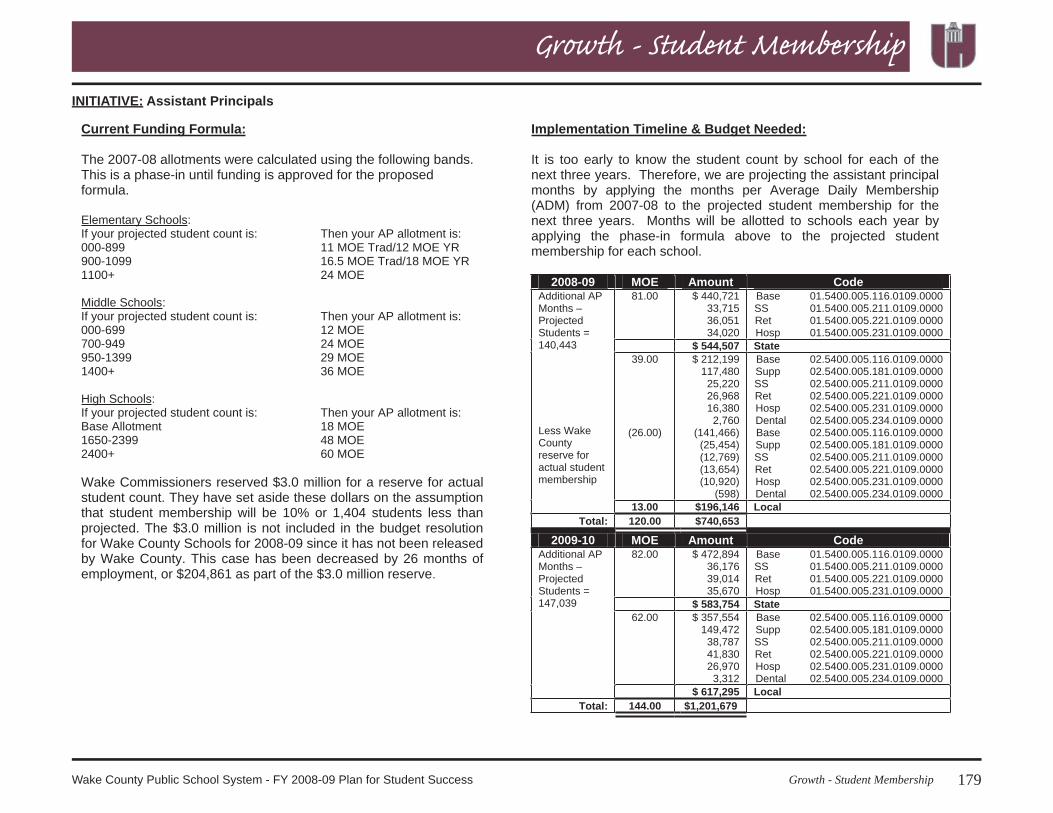
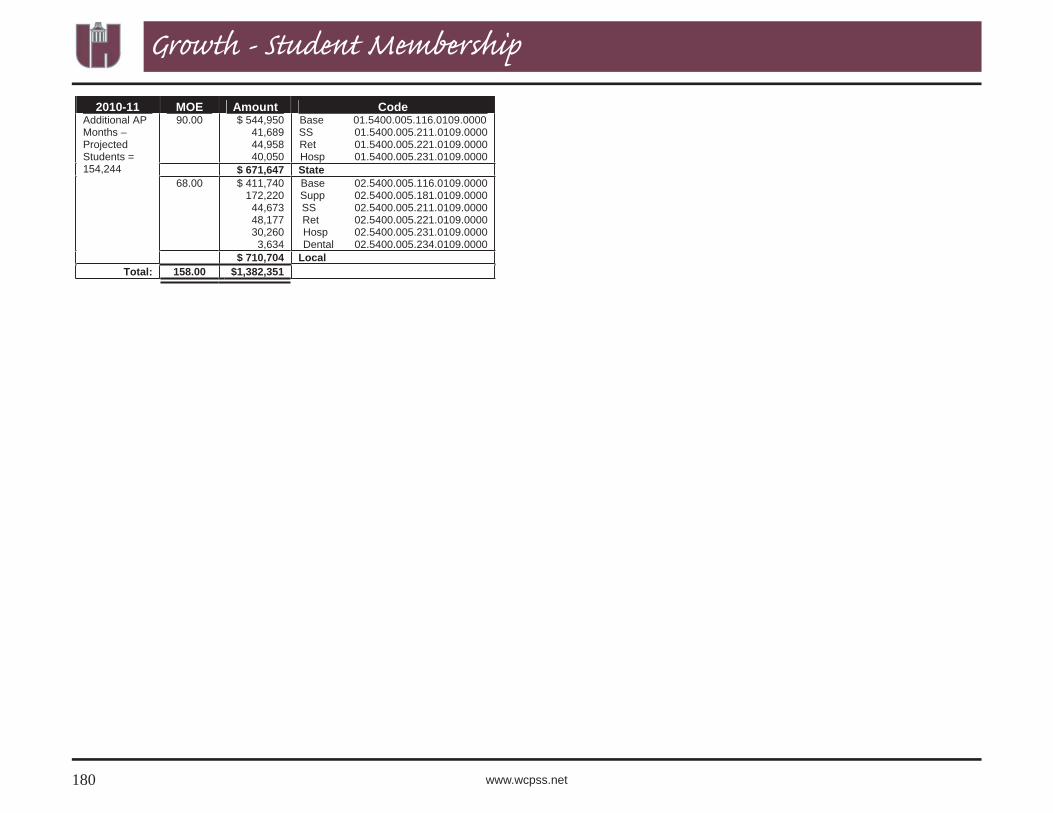
Assistant Principals 179 $196,146 $1.41
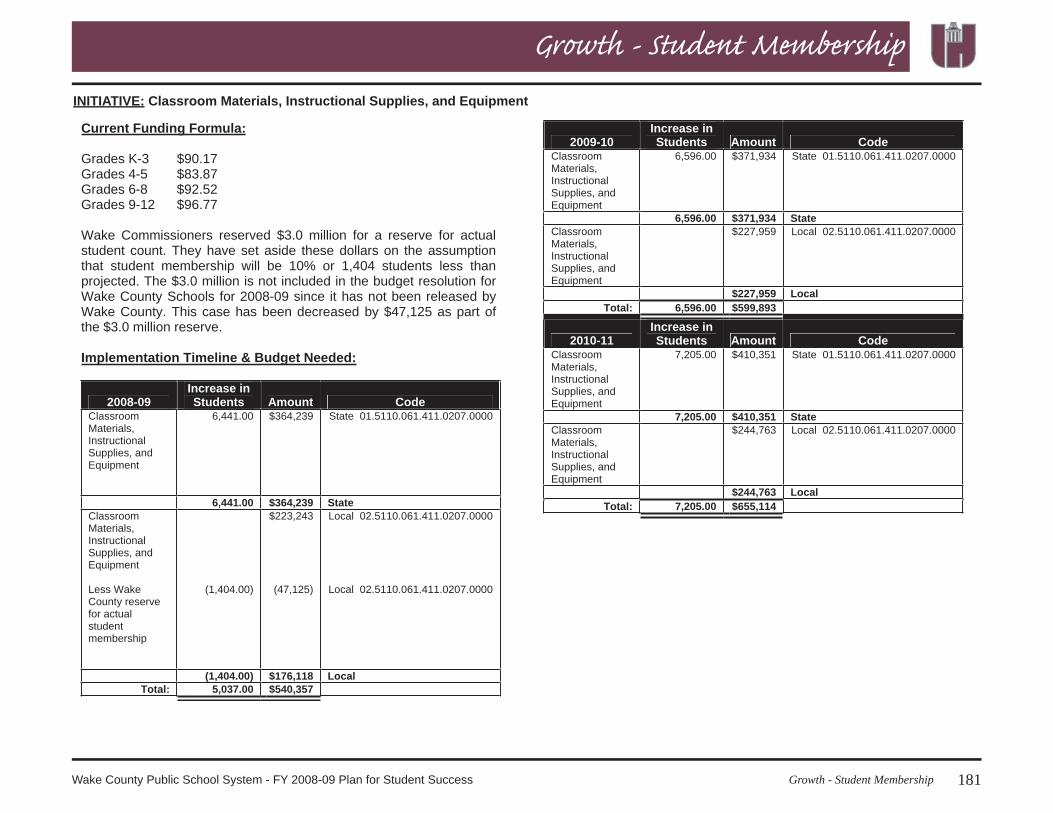
Classroom Materials, Instructional Sup-plies, and Equipment 181 $176,118 $1.27
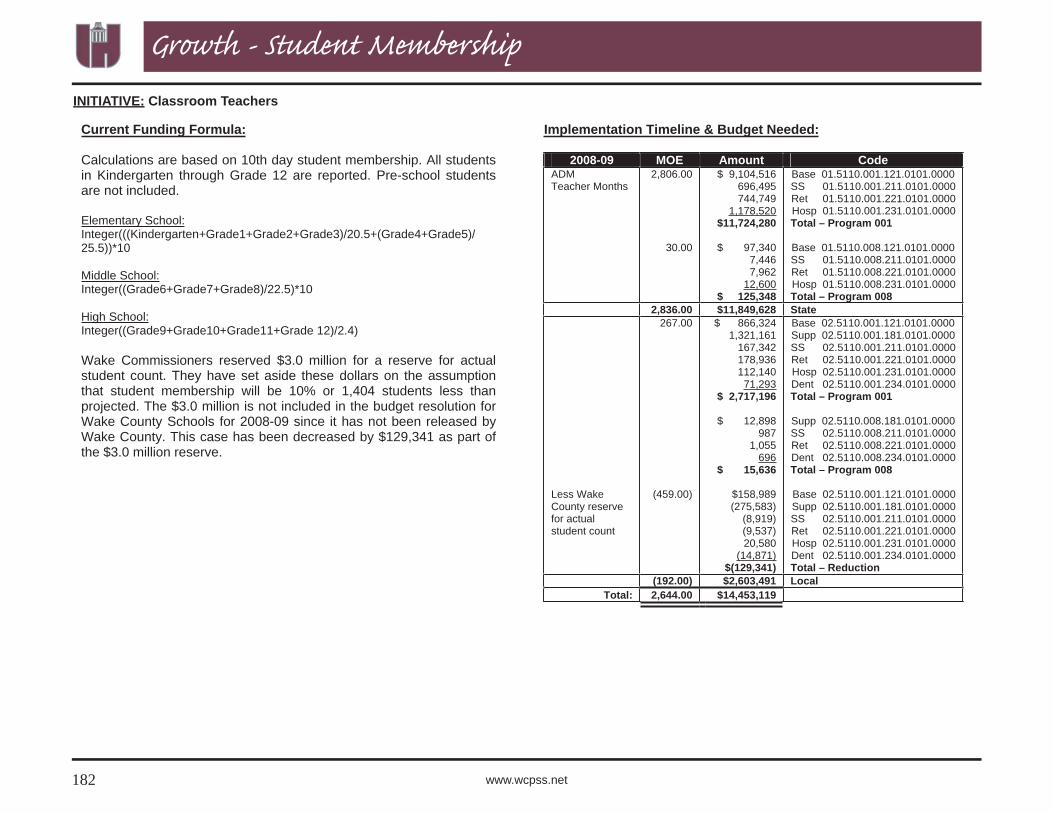
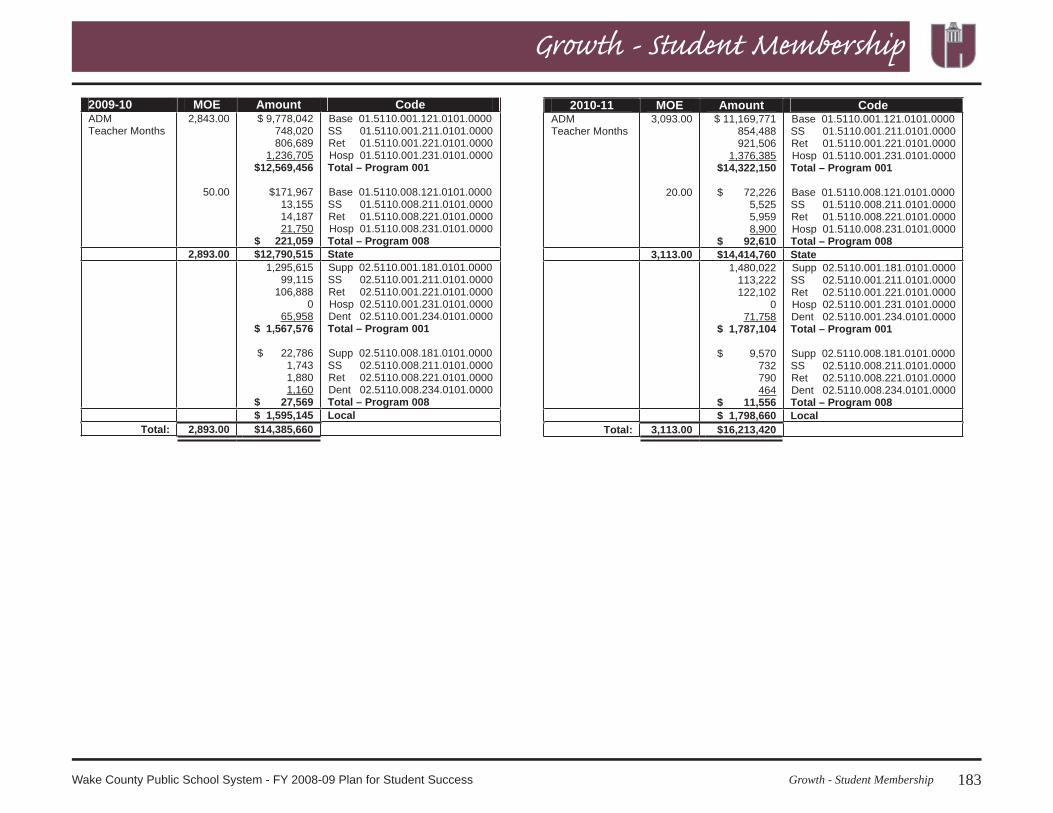
Classroom Teachers 182 $2,603,491 $18.72
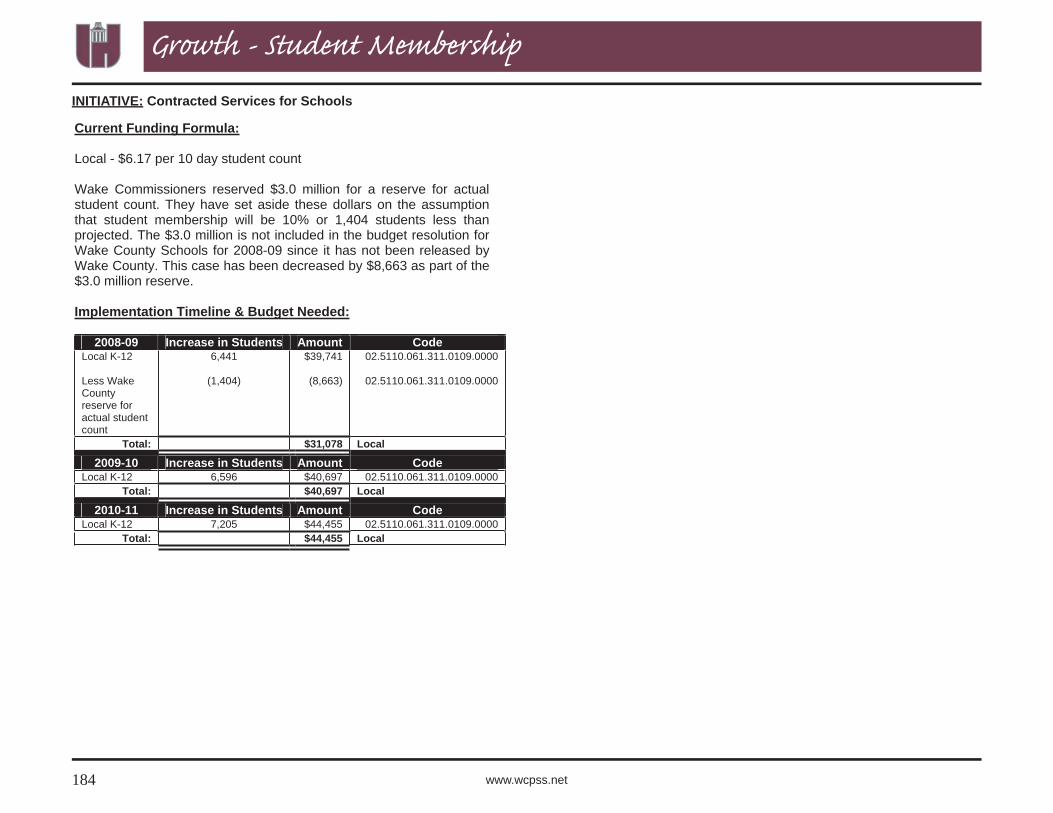
Contracted Services for Schools 184 $31,078 $0.22
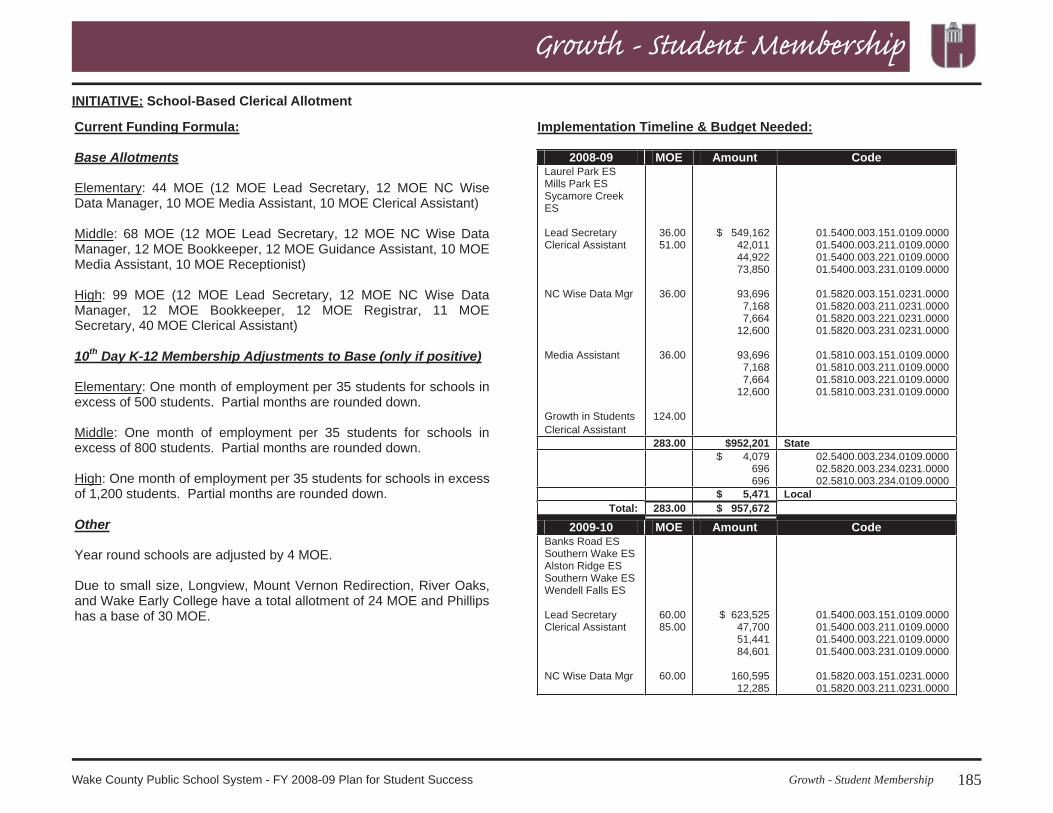
School-Based Clerical Allotment 185 $5,471 $0.04
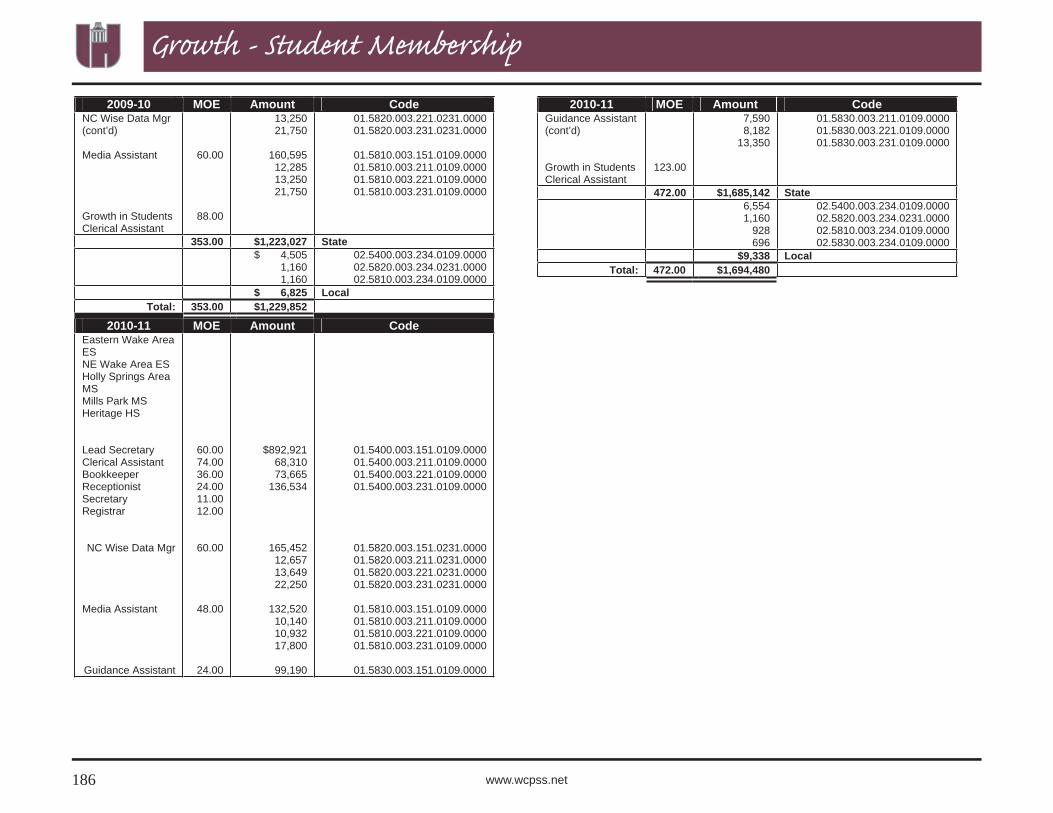
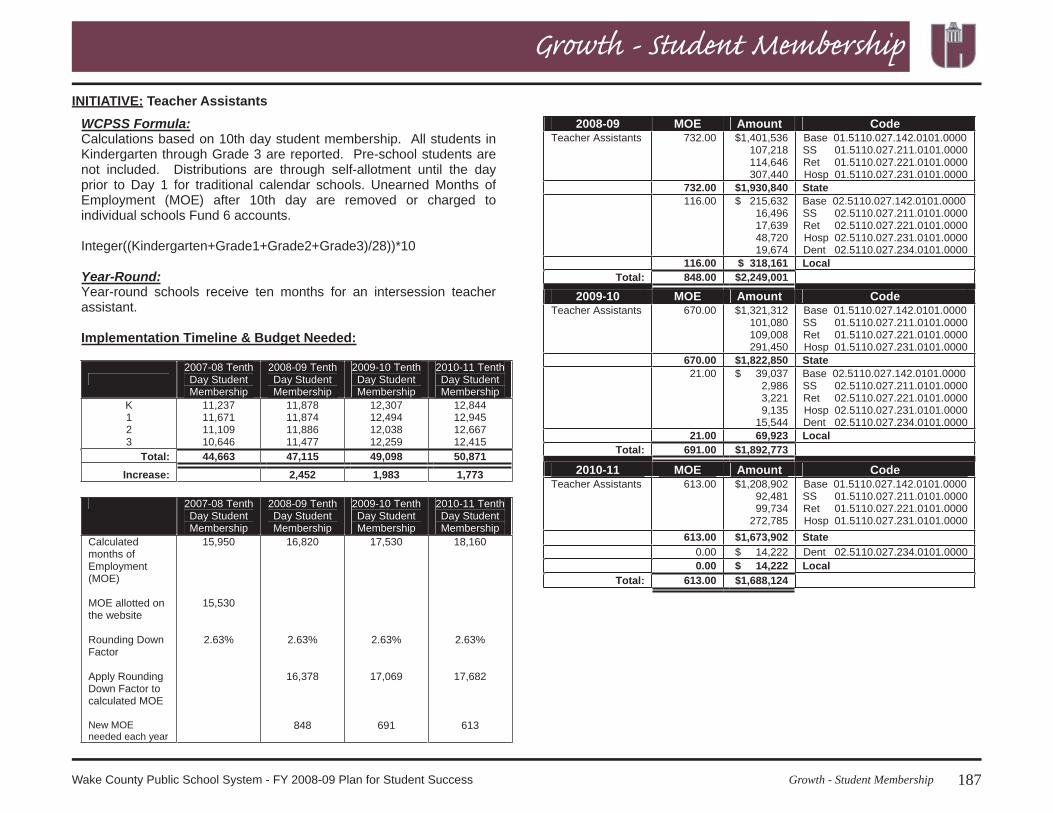
Teacher Assistants 187 $318,161 $2.29
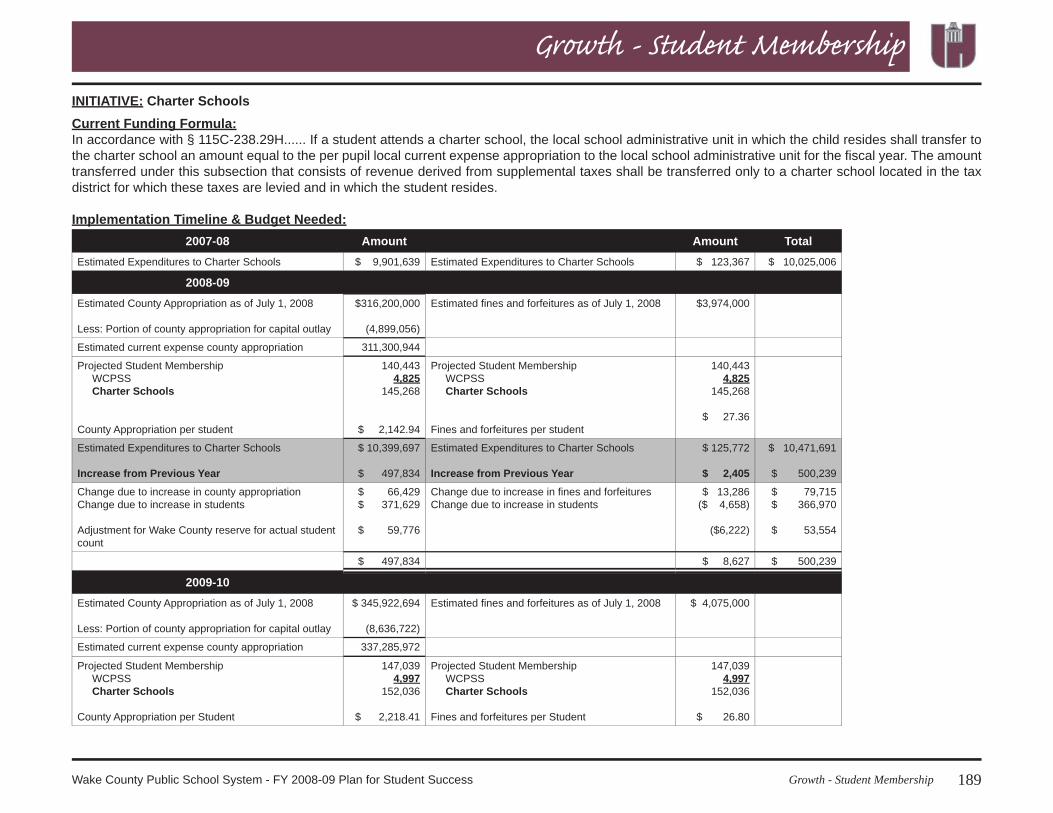
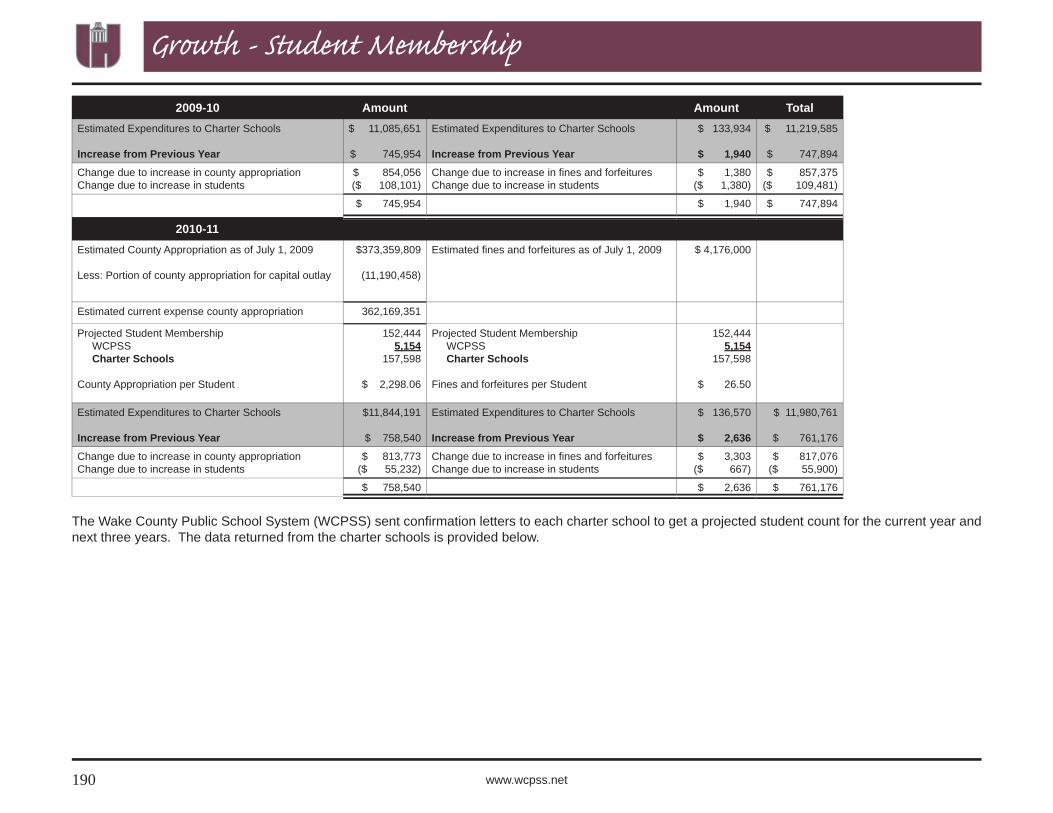
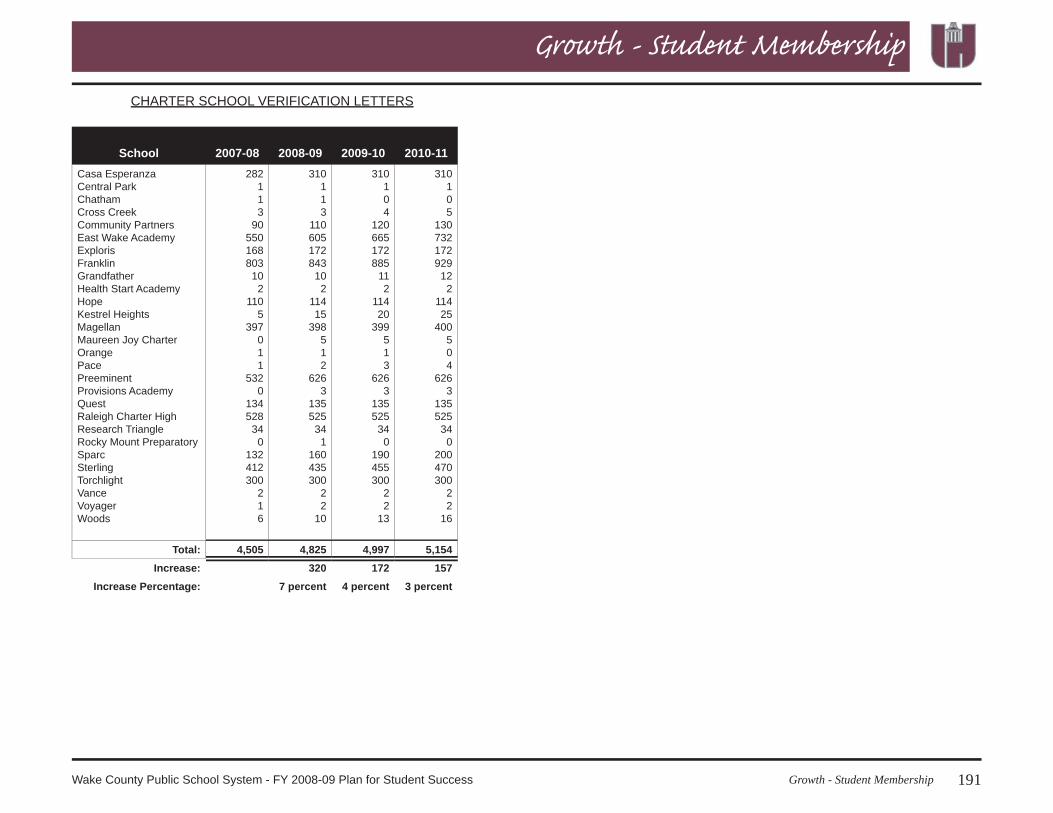
Charter Schools 189 $500,239 $3.60
Growth Related IncreasesReference
PageIncrease /
(Decrease)
Cost / (Savings)
per StudentSTUDENT MEMBERSHIP (continued)
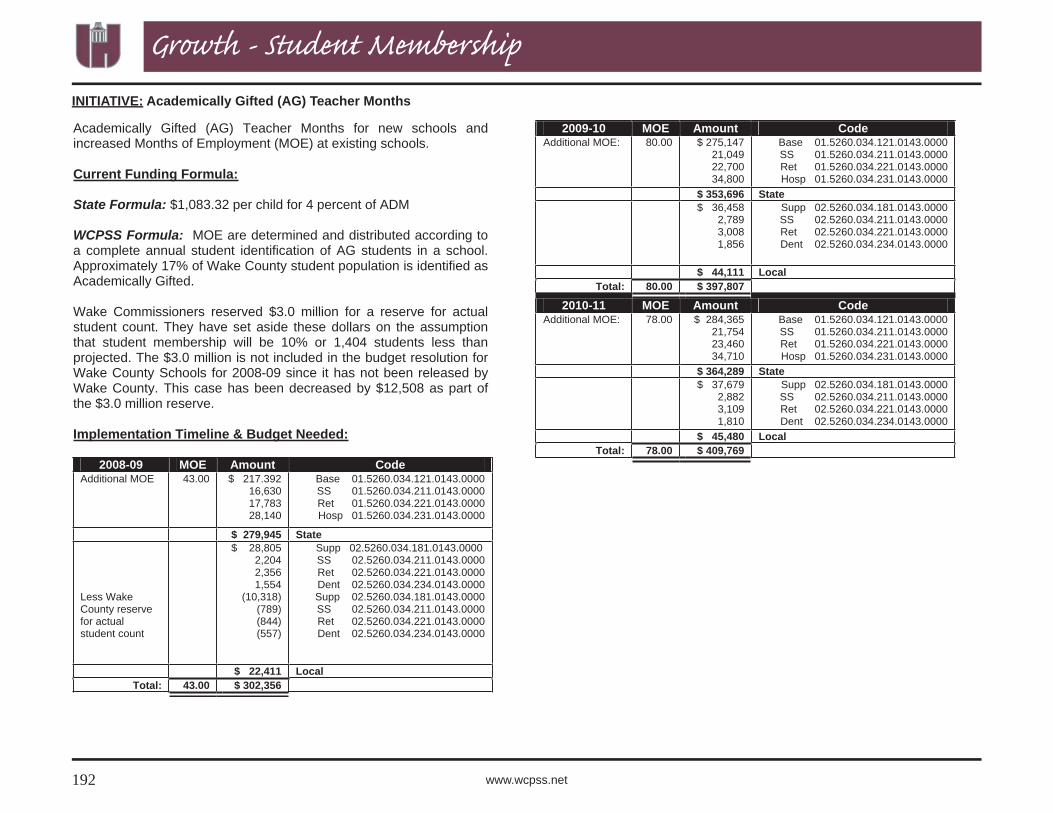
Academically Gifted Teachers 192 $22,411 $0.16
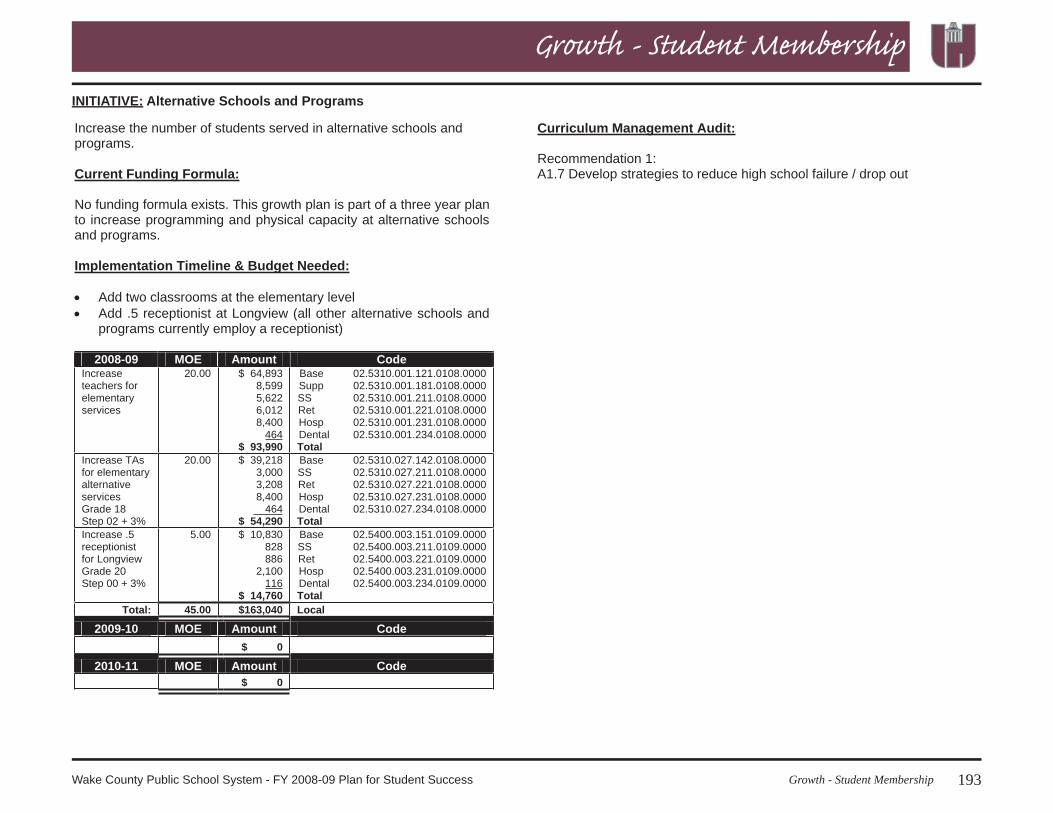
Alternative Schools and Programs1 193 $163,040 $1.17
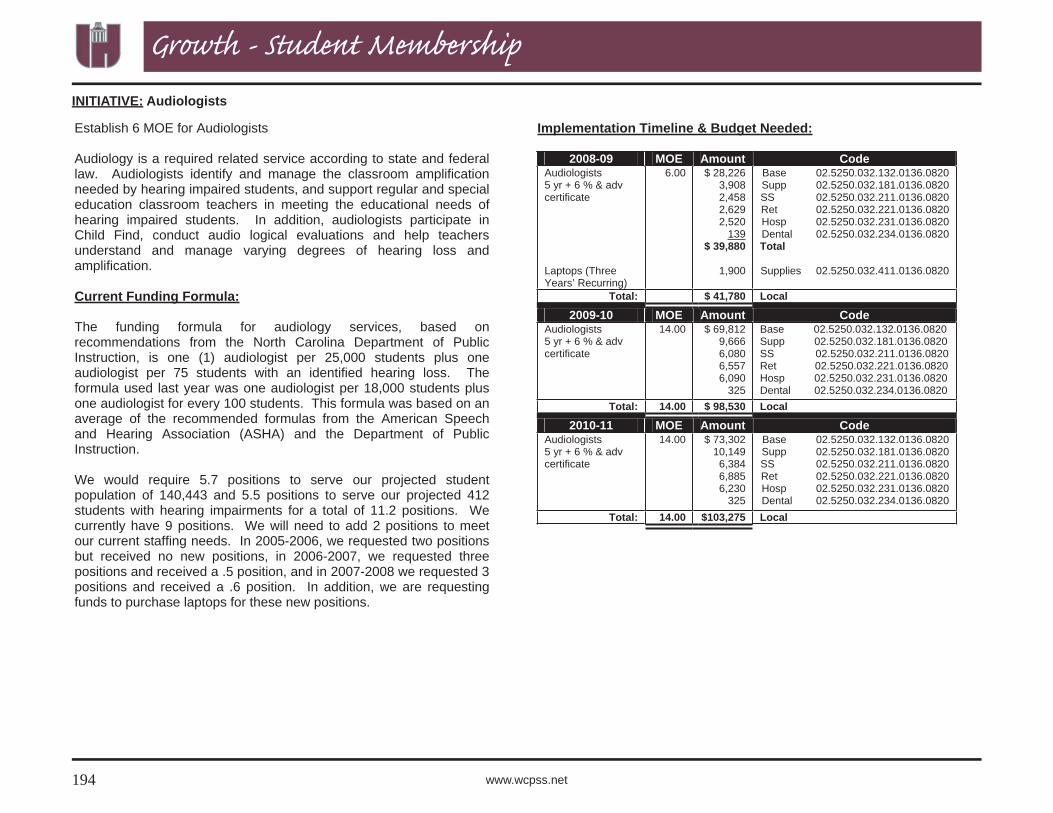
Audiologists 194 $41,780 $0.30
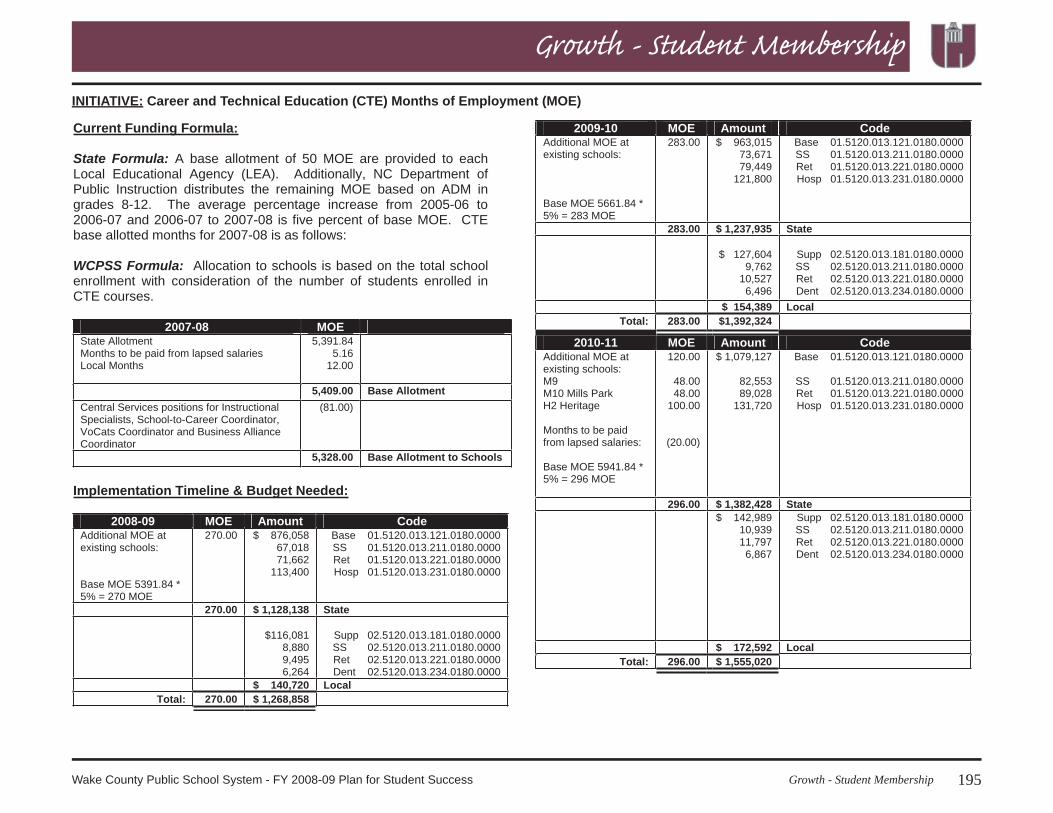
Career and Technical Education Teachers 195 $140,720 $1.01
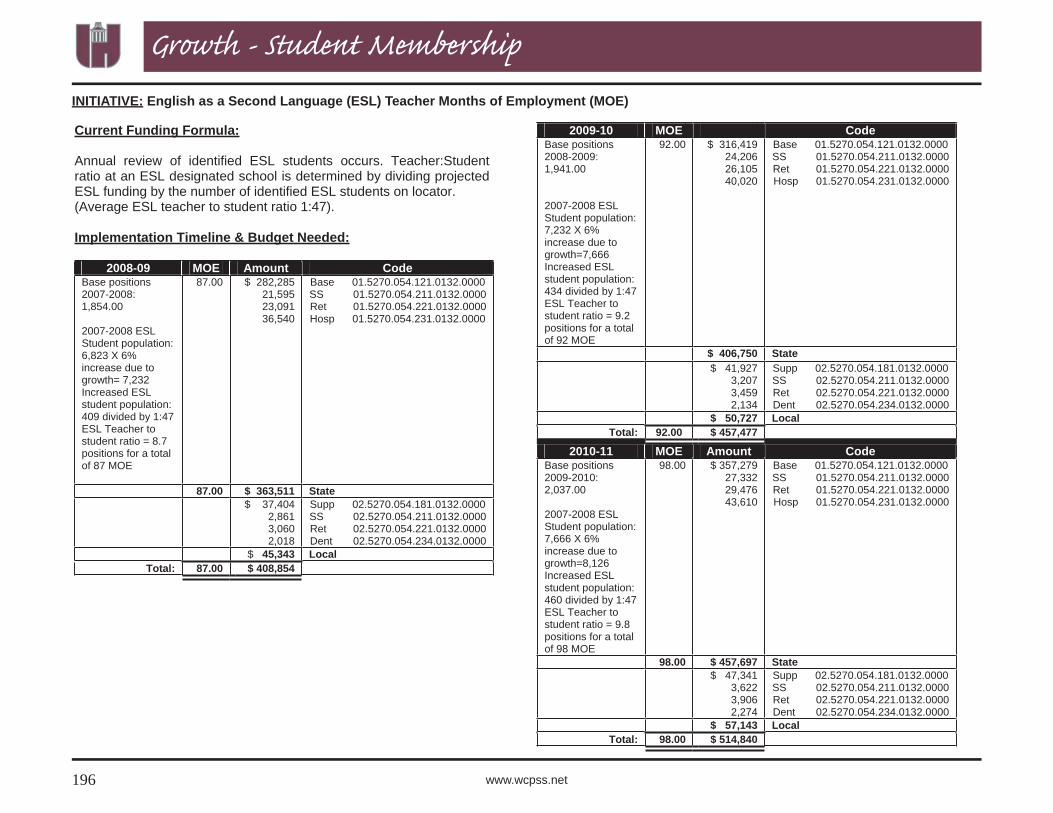
English as a Second Language Teachers 196 $45,343 $0.33
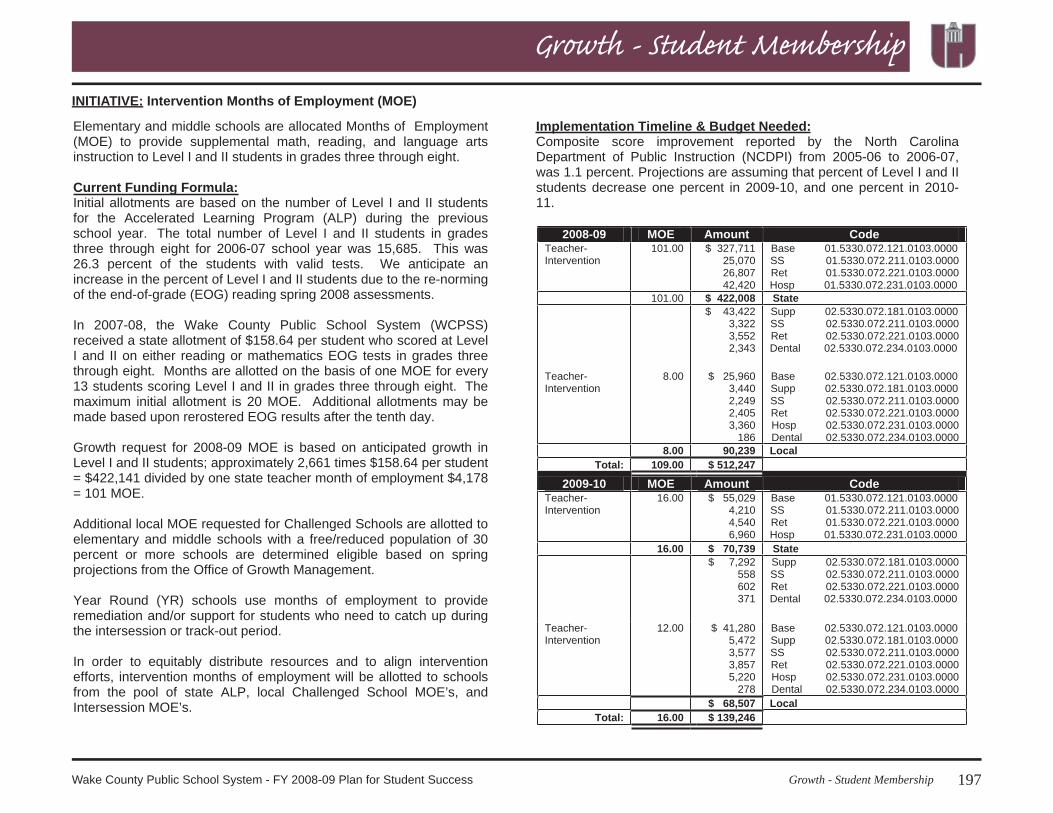
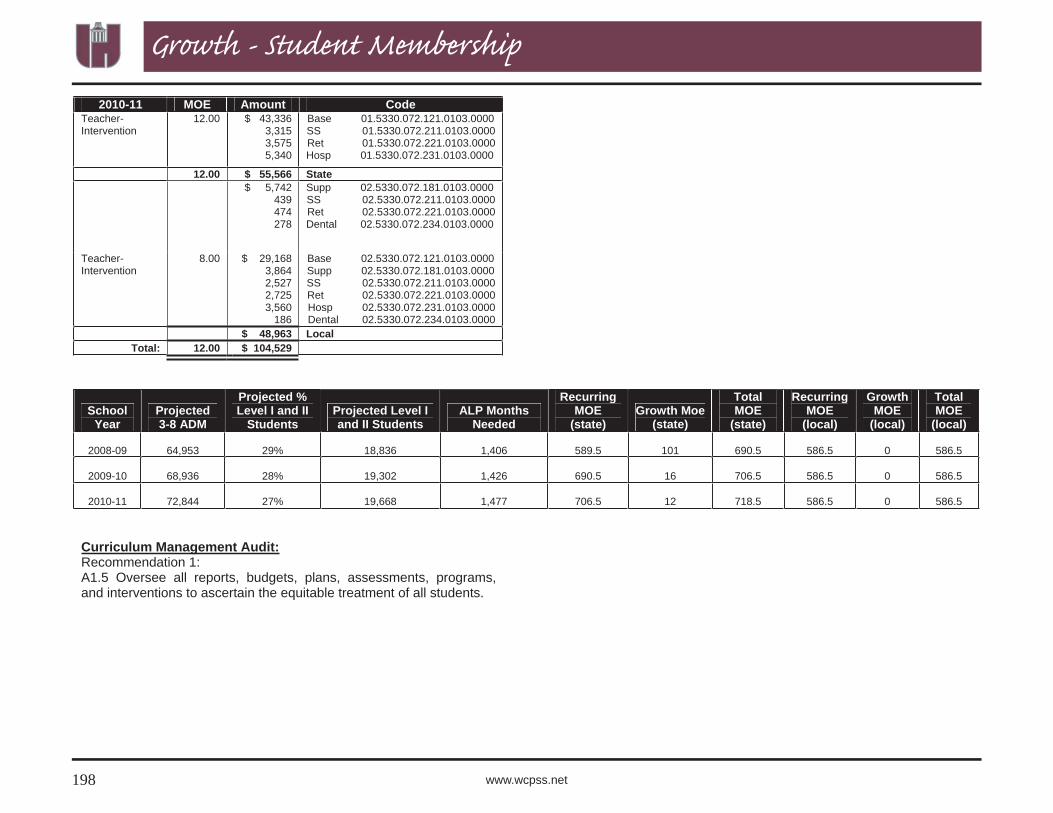
Intervention Months1 197 $90,239 $0.65
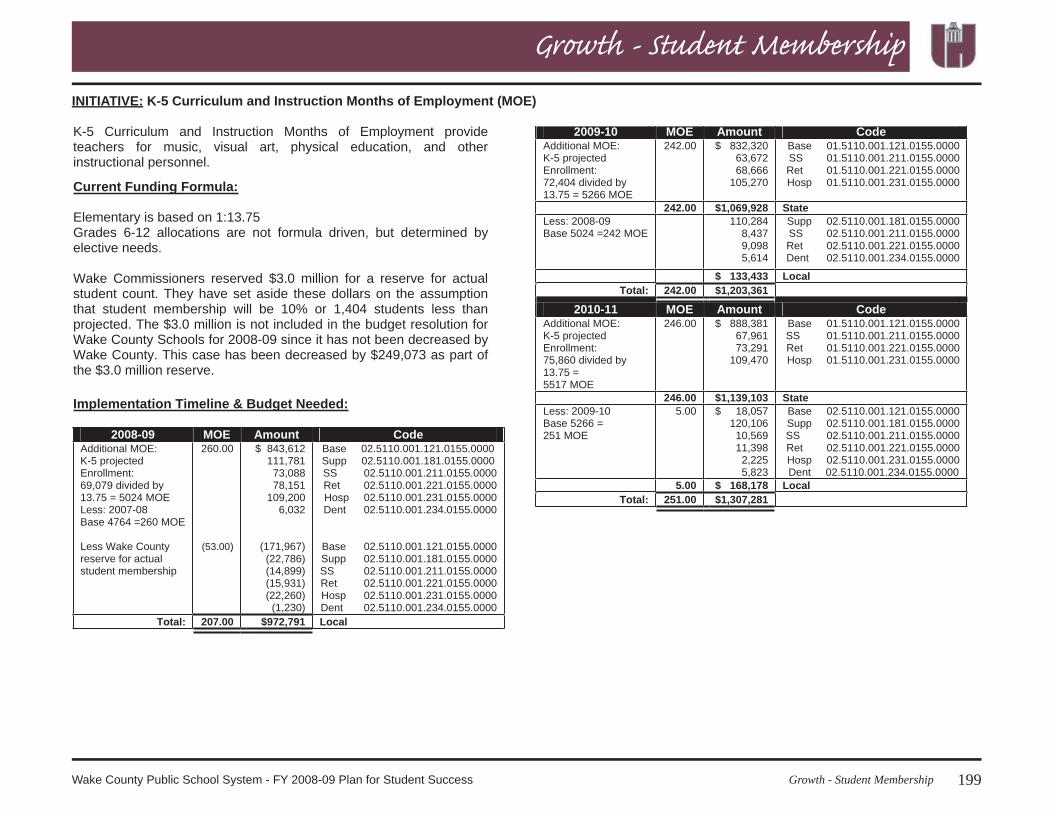
K-5 Curriculum and Instruction Teachers 199 $972,791 $7.00
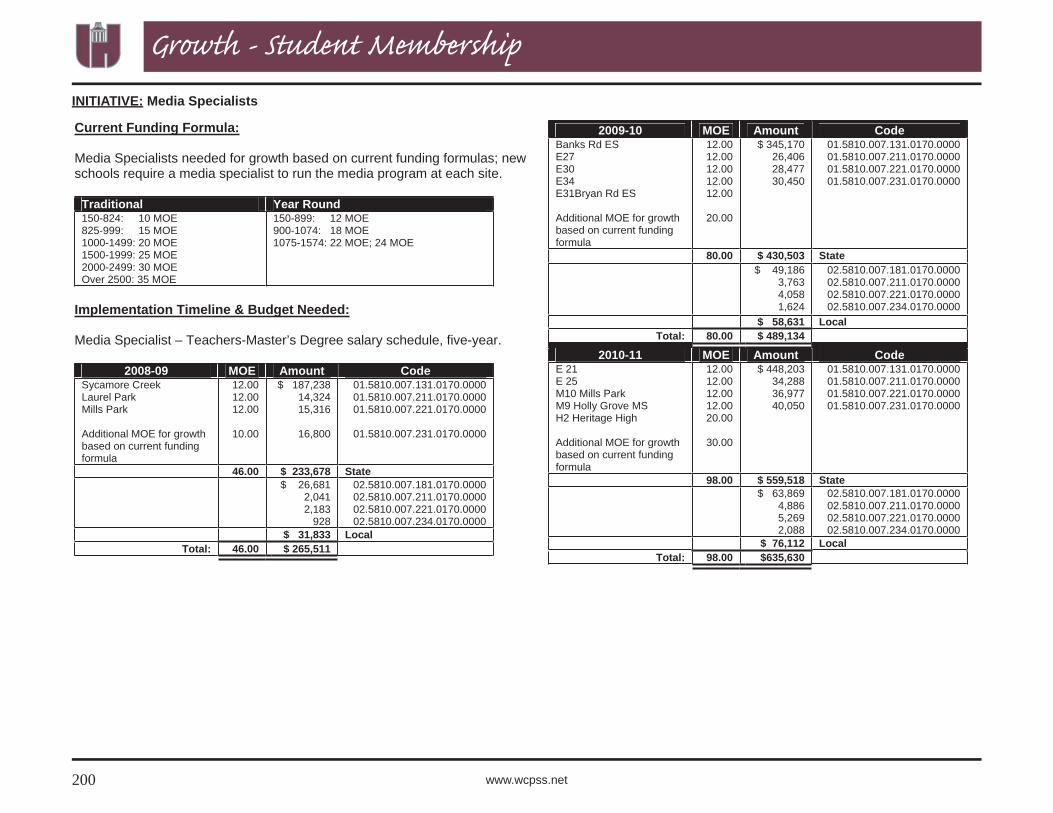
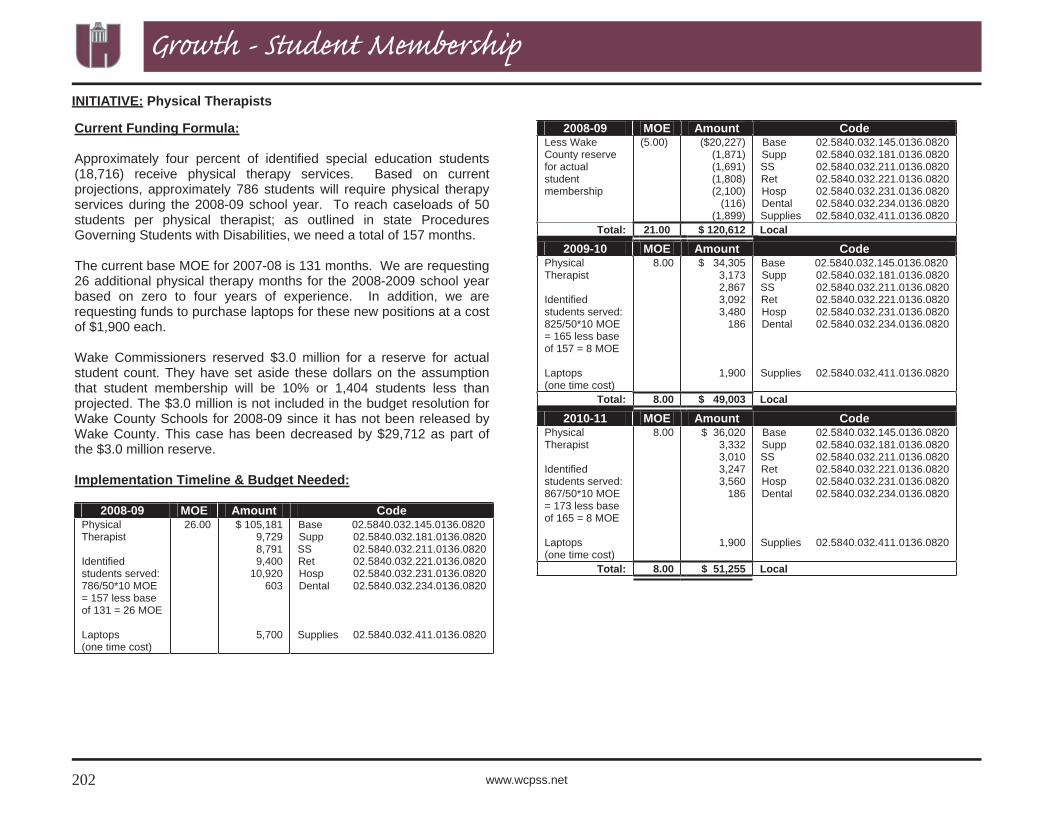
Media Specialists 200 $31,833 $0.23
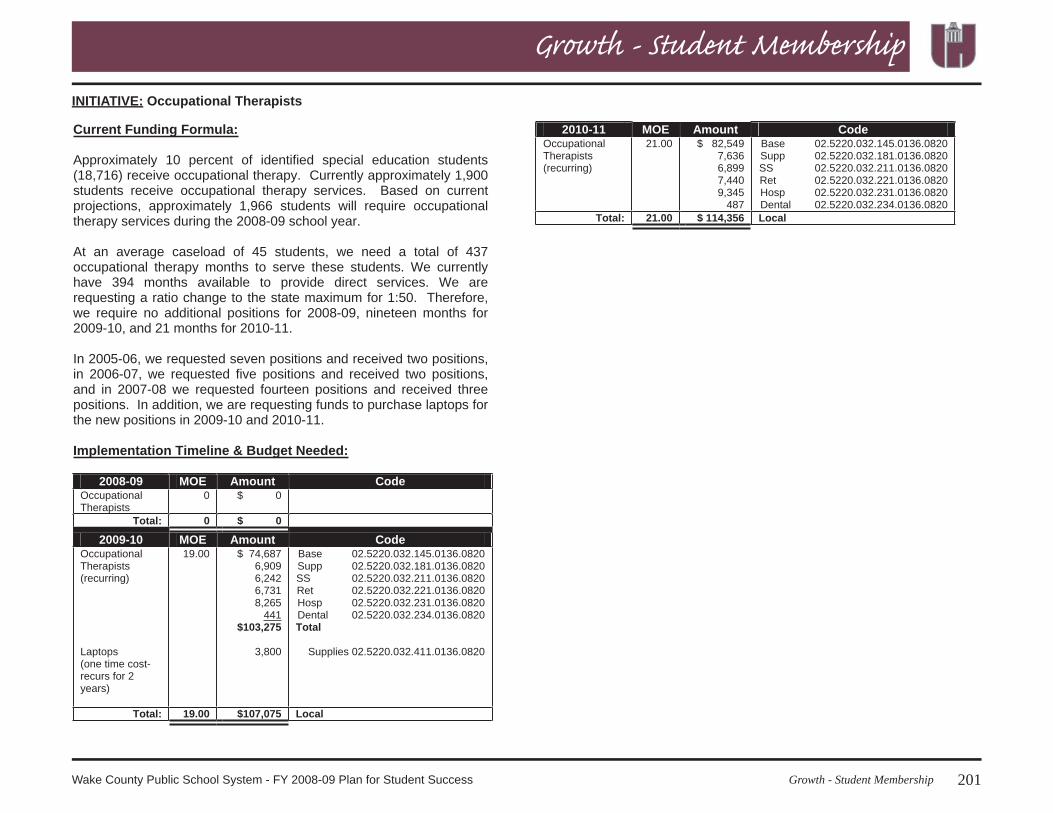
Physical Therapists 202 $120,612 $0.87
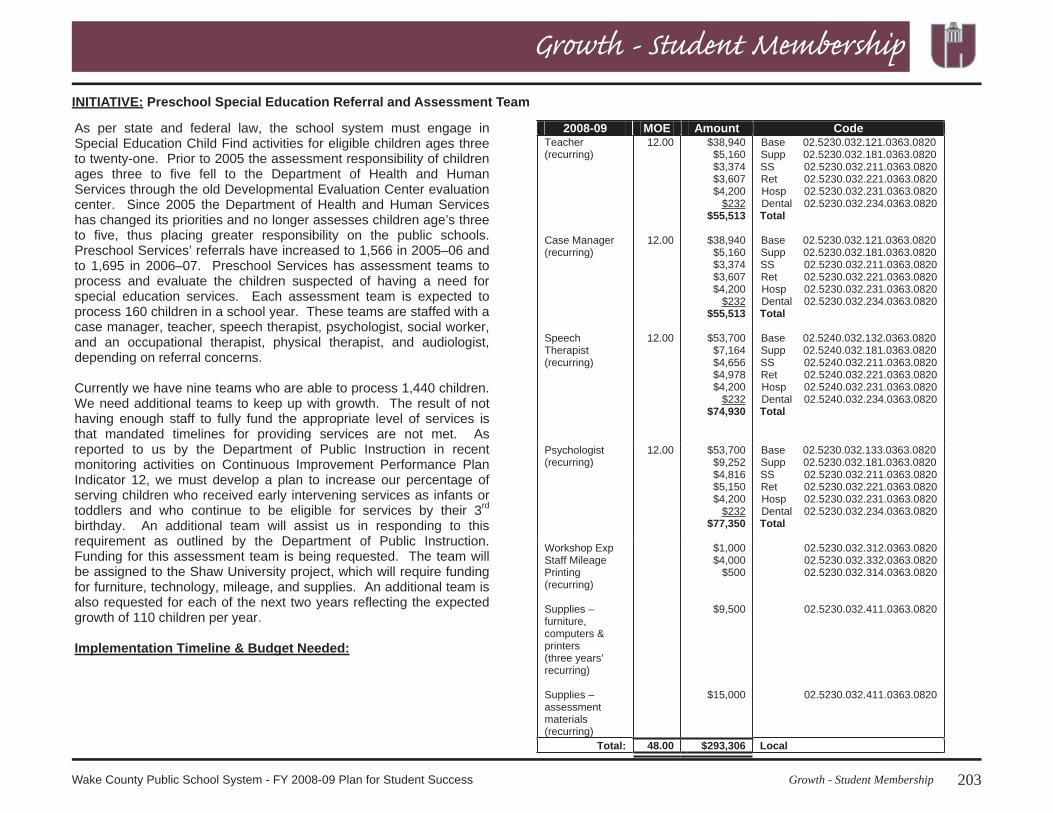
Preschool Special Education Referral and Assessment Team 203 $293,306 $2.11
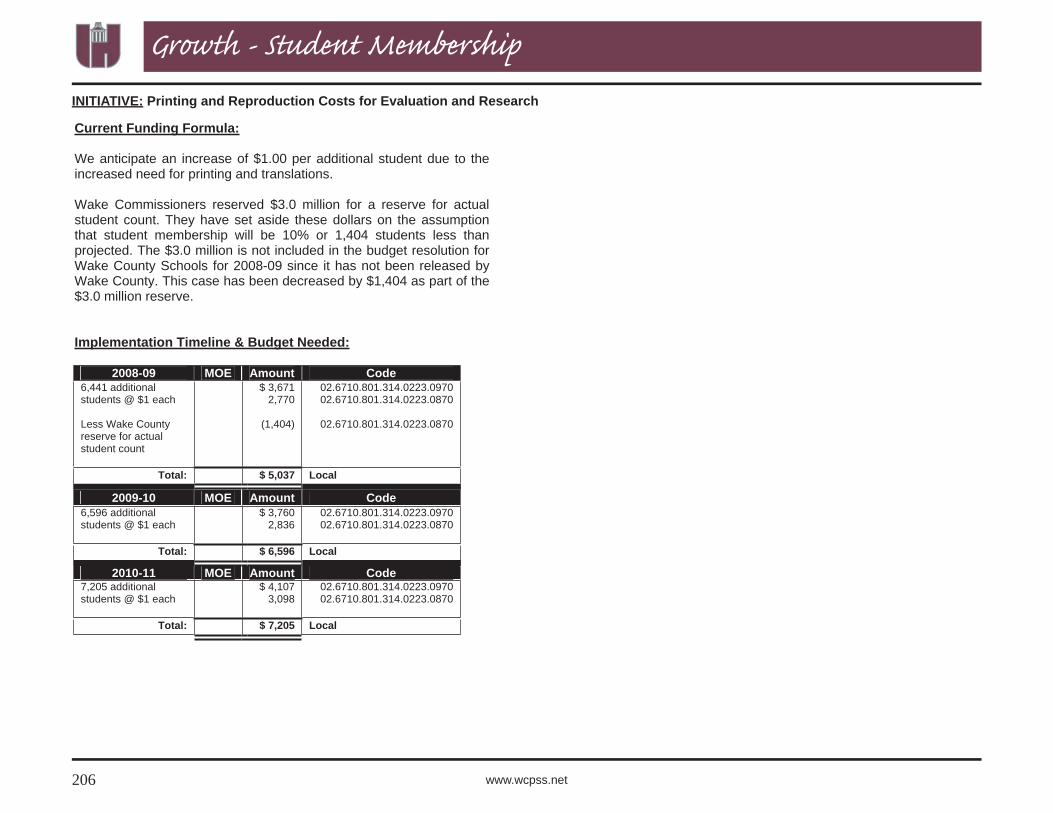
Printing and Reproduction Costs for Evaluation and Research 206 $5,037 $0.04
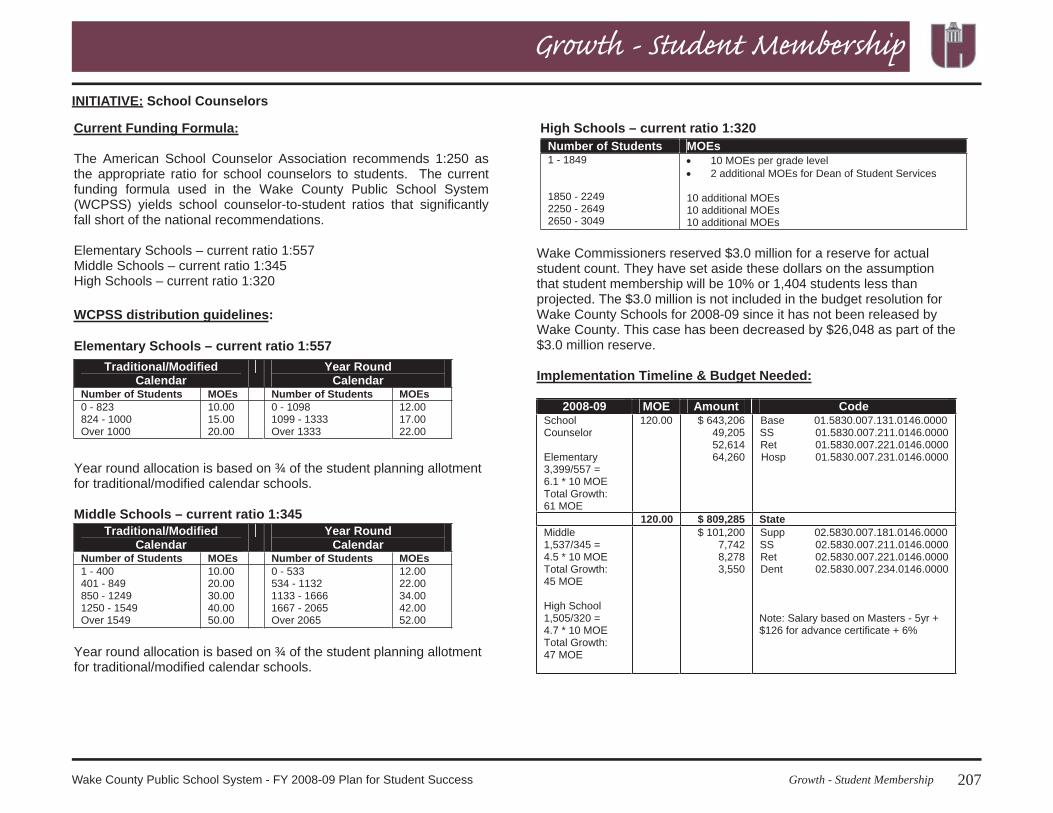
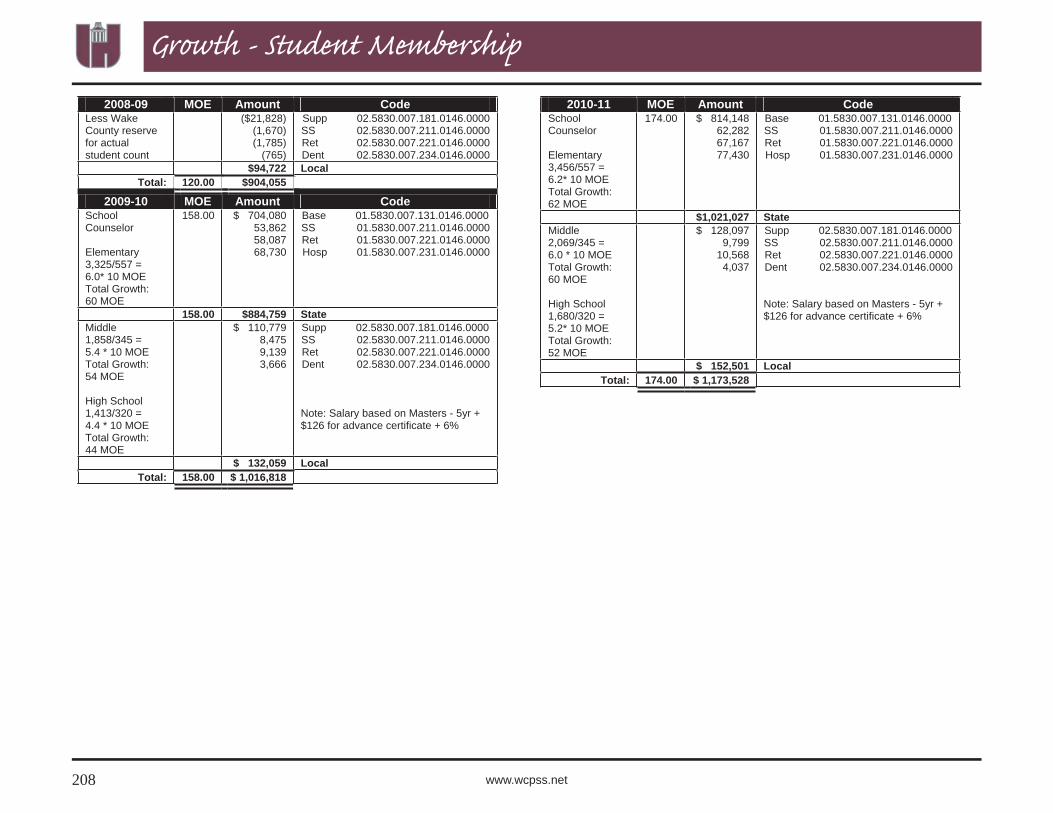
School Counselors 207 $94,722 $0.68
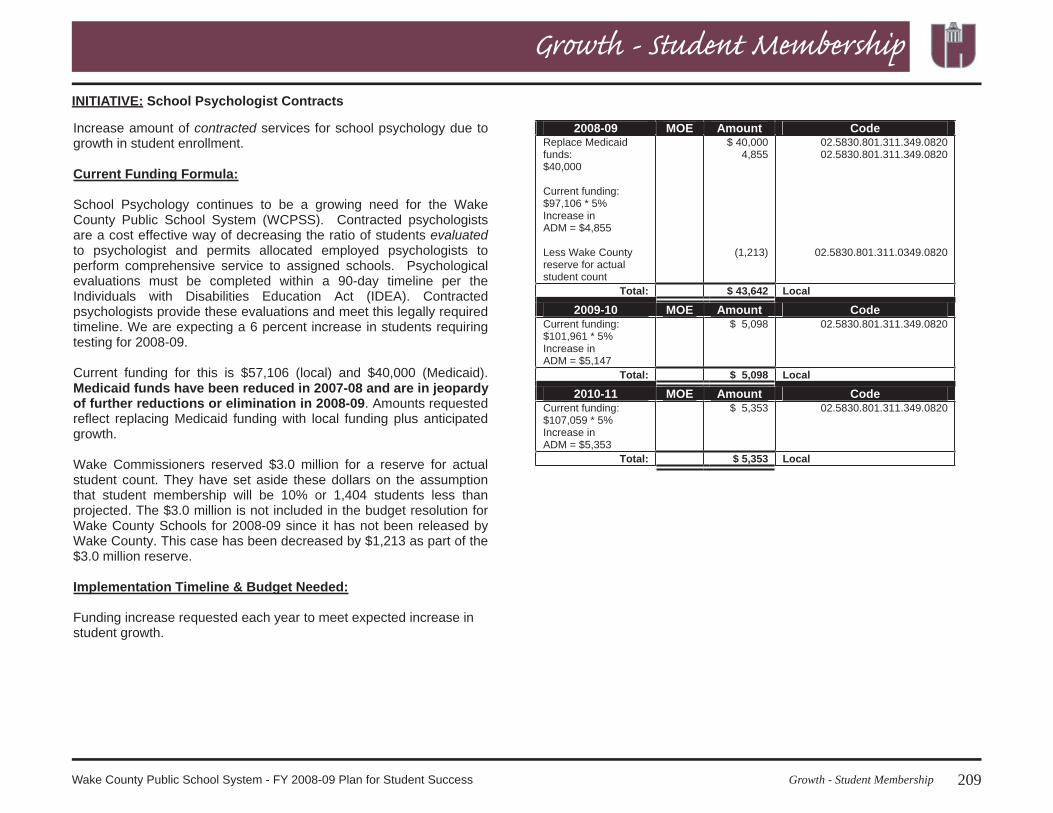
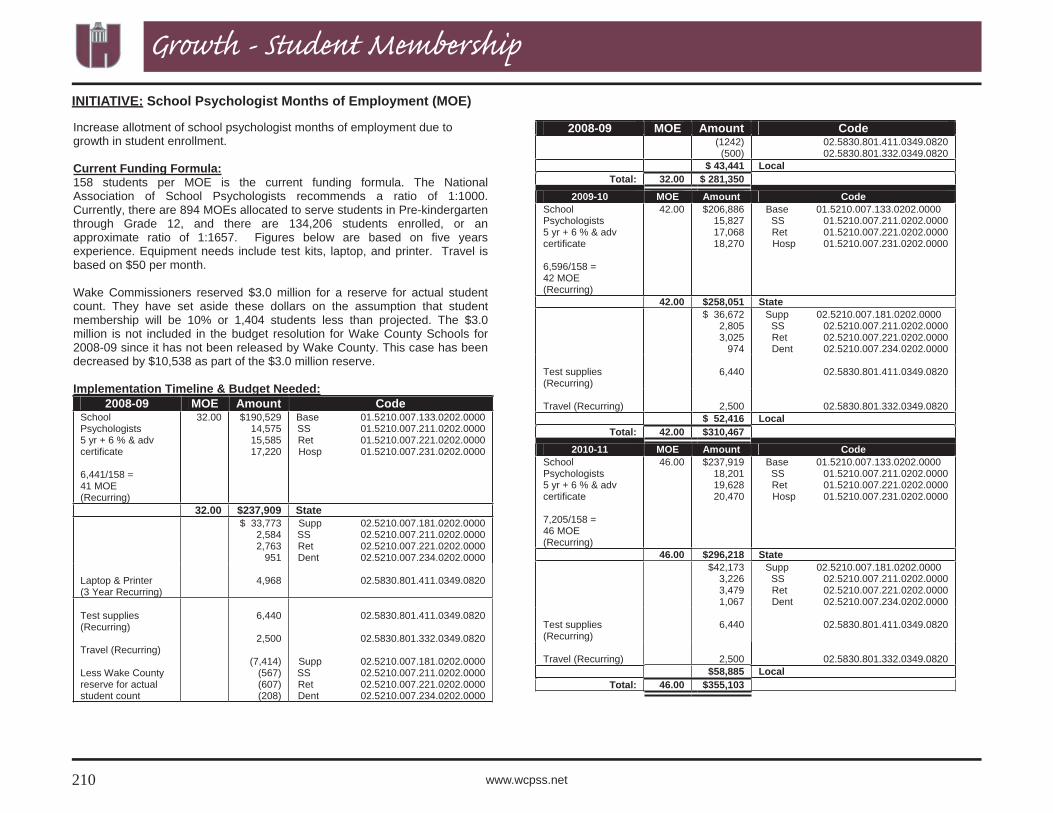
School Psychologist Contracts 209 $43,642 $0.31
School Psychologist 210 $43,441 $0.31
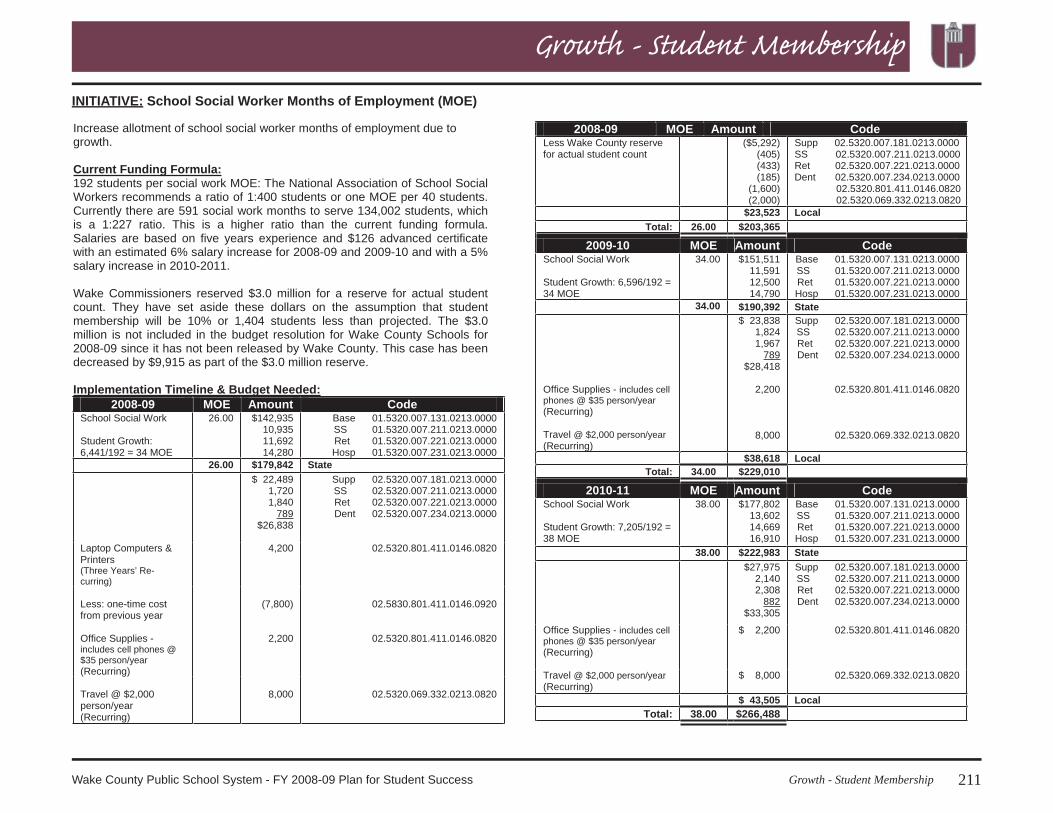
School Social Worker 211 $23,523 $0.17
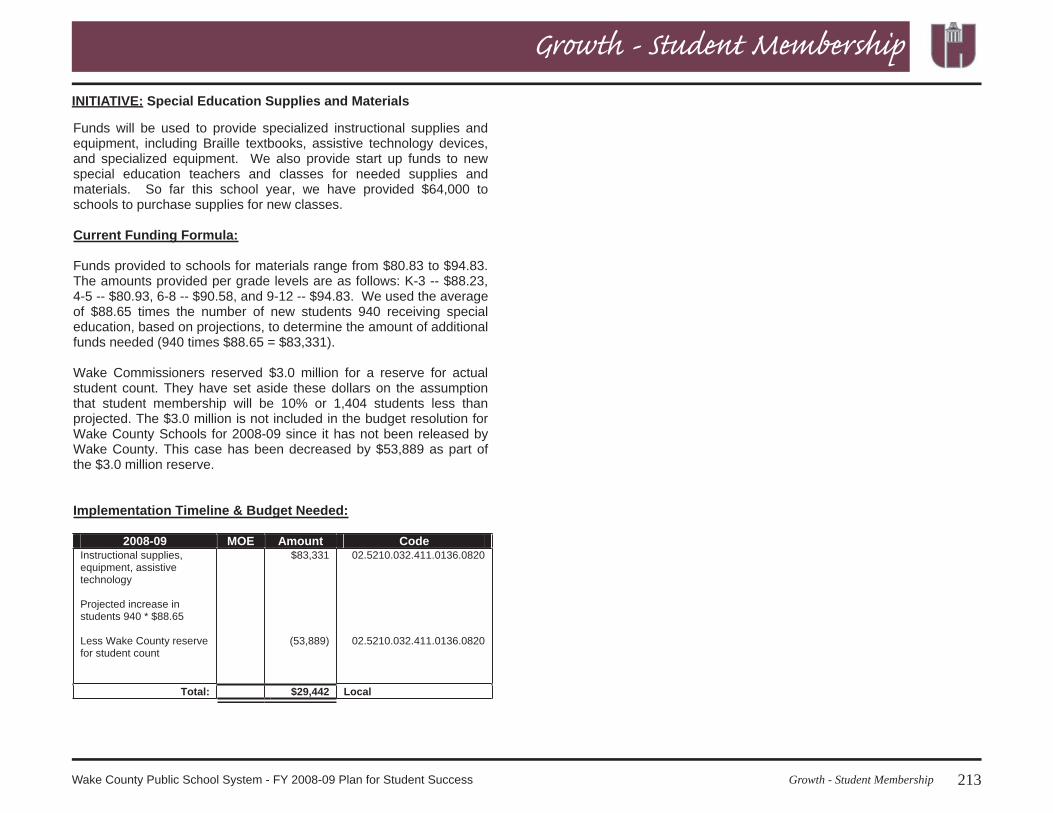
Special Education Supplies & Materials 213 $29,442 $0.21
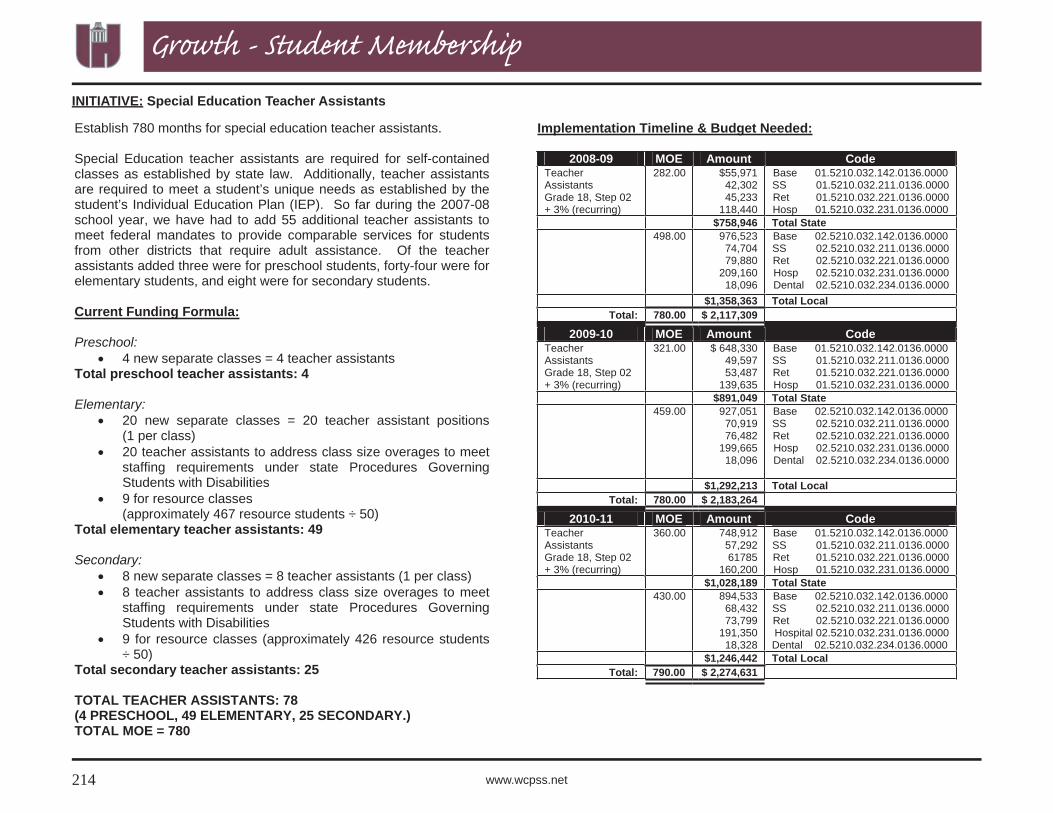
Special Education Teacher Assistants 214 $1,358,363 $9.77
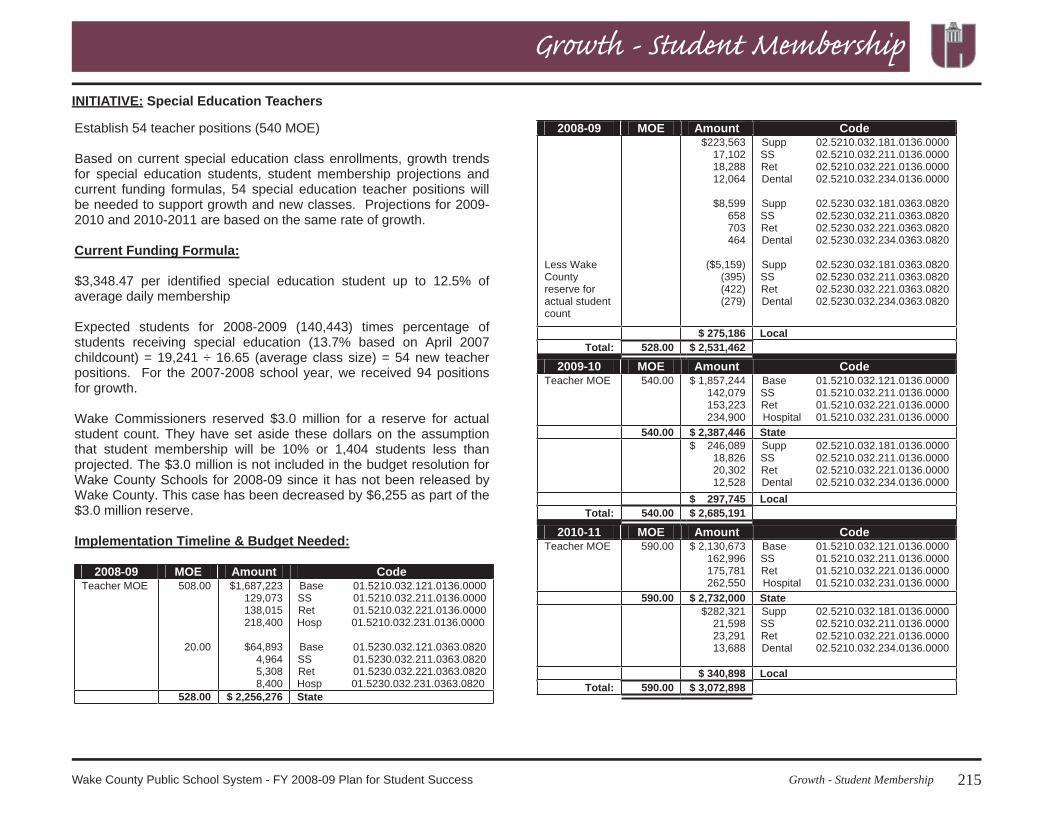
Special Education Teachers 215 $275,186 $1.98
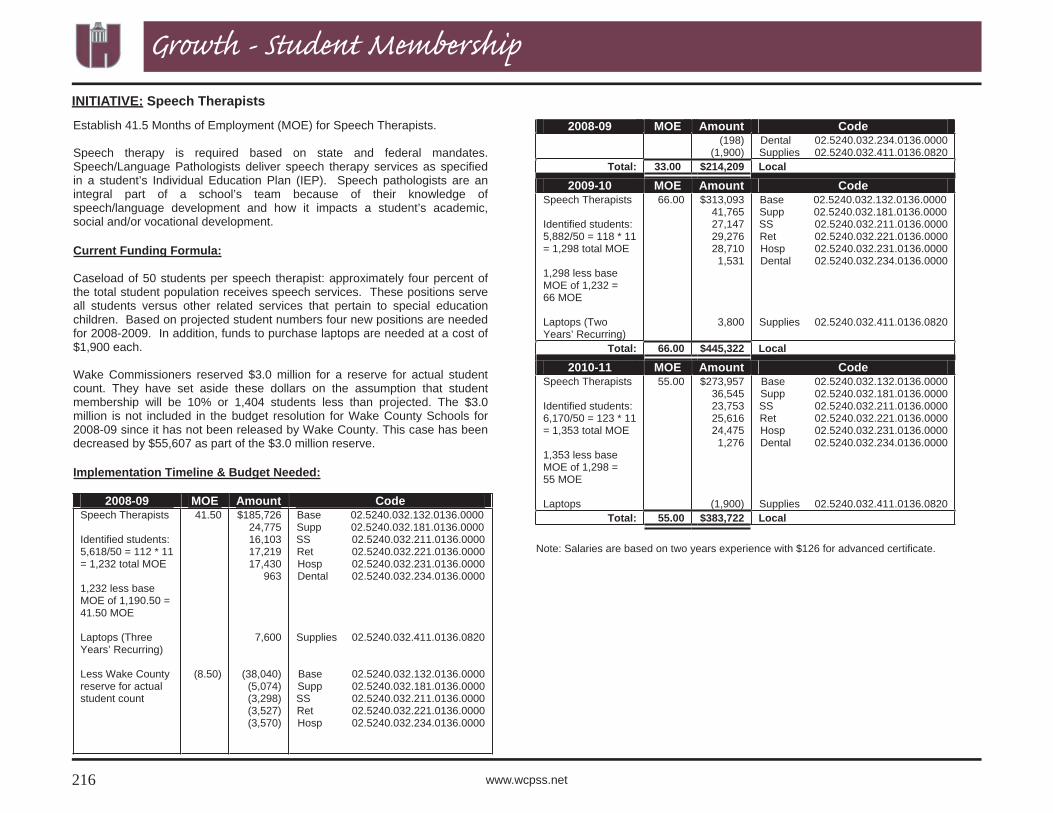
Speech Therapists 216 $214,209 $1.54
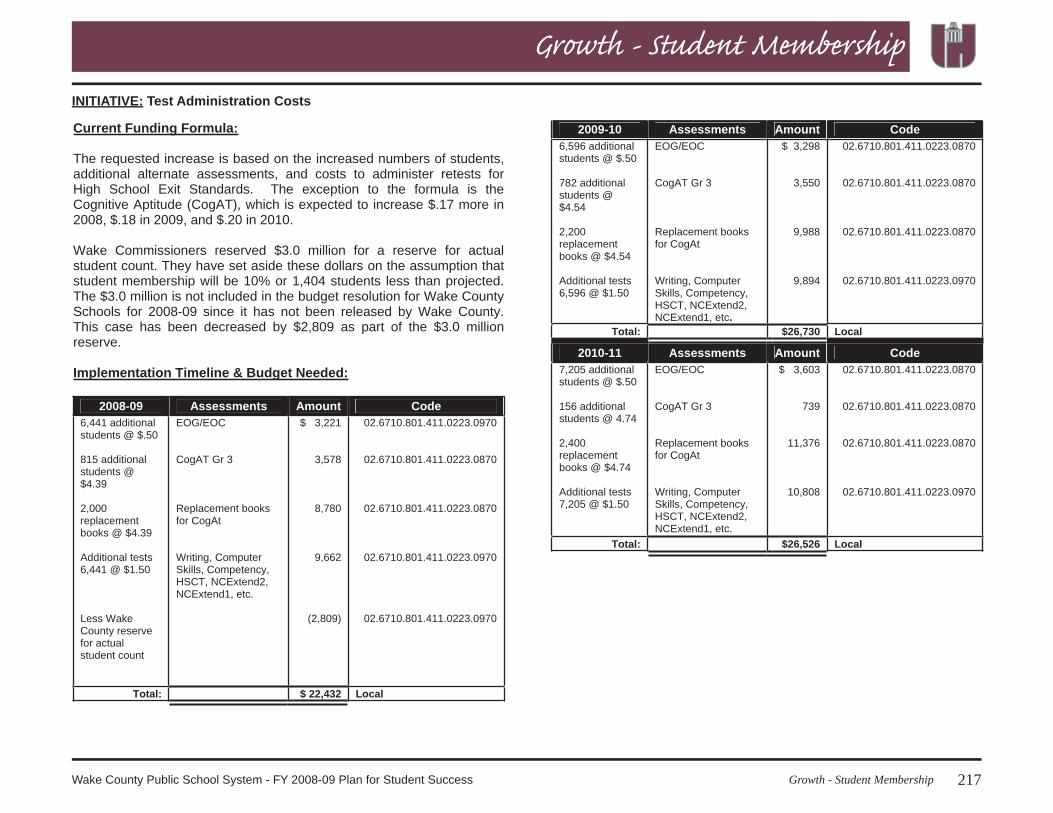
Test Administration Costs 217 $22,432 $0.16
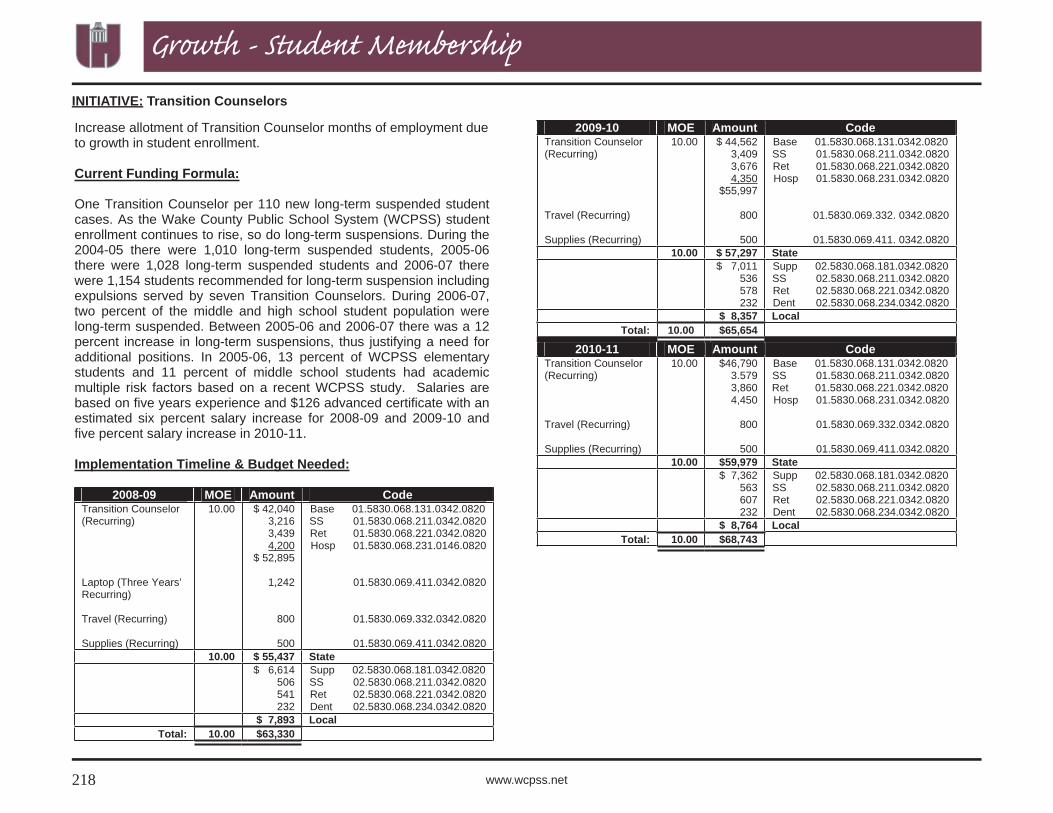
Transition Counselors 218 $7,893 $0.06
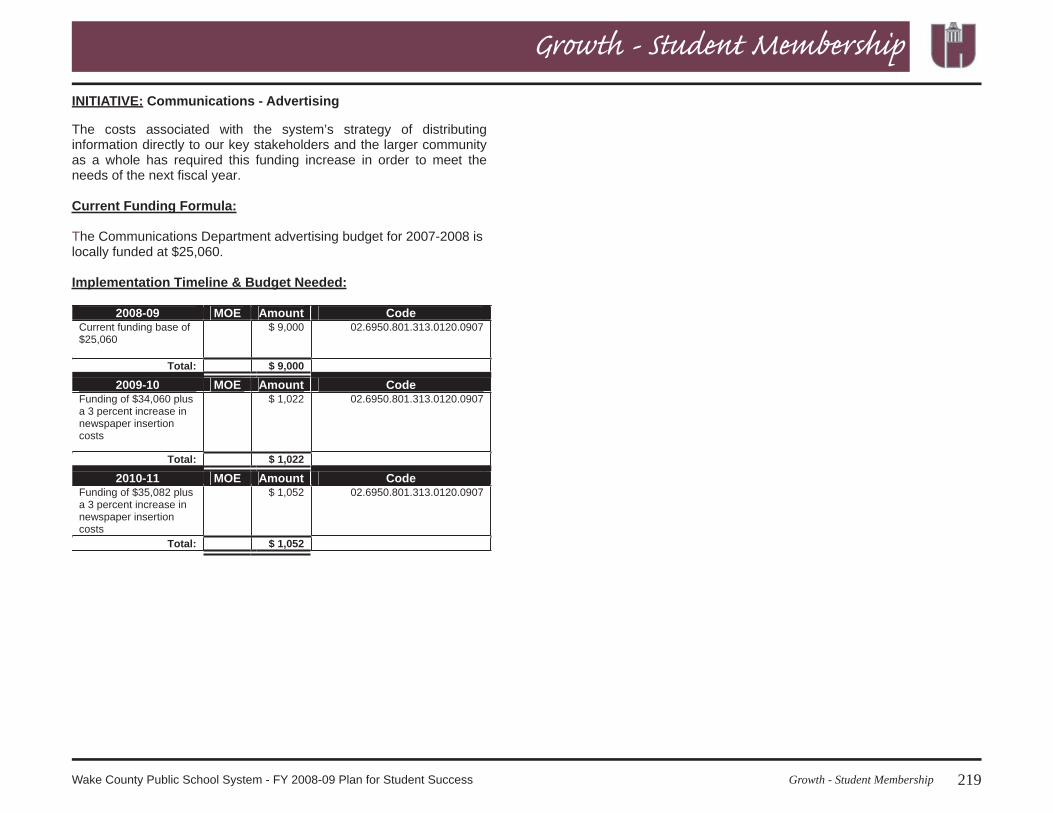
Communications - Advertising 219 $9,000 $0.06
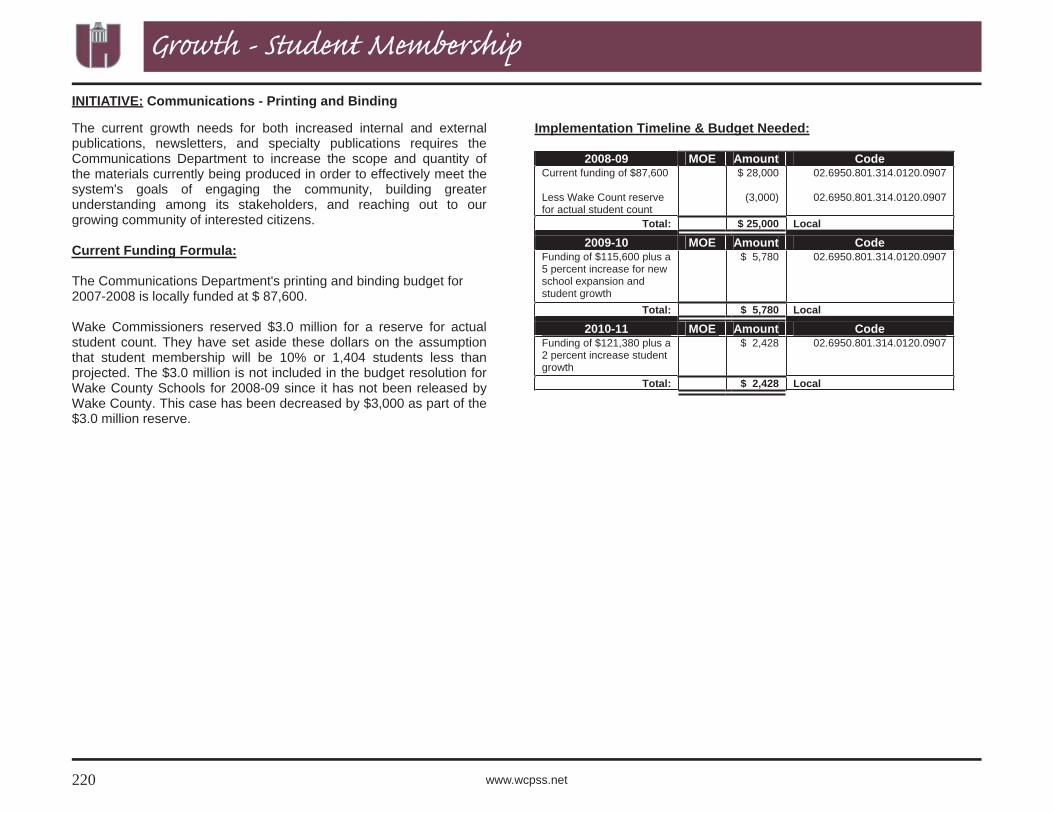
Communications - Printing and Binding 220 $25,000 $0.18
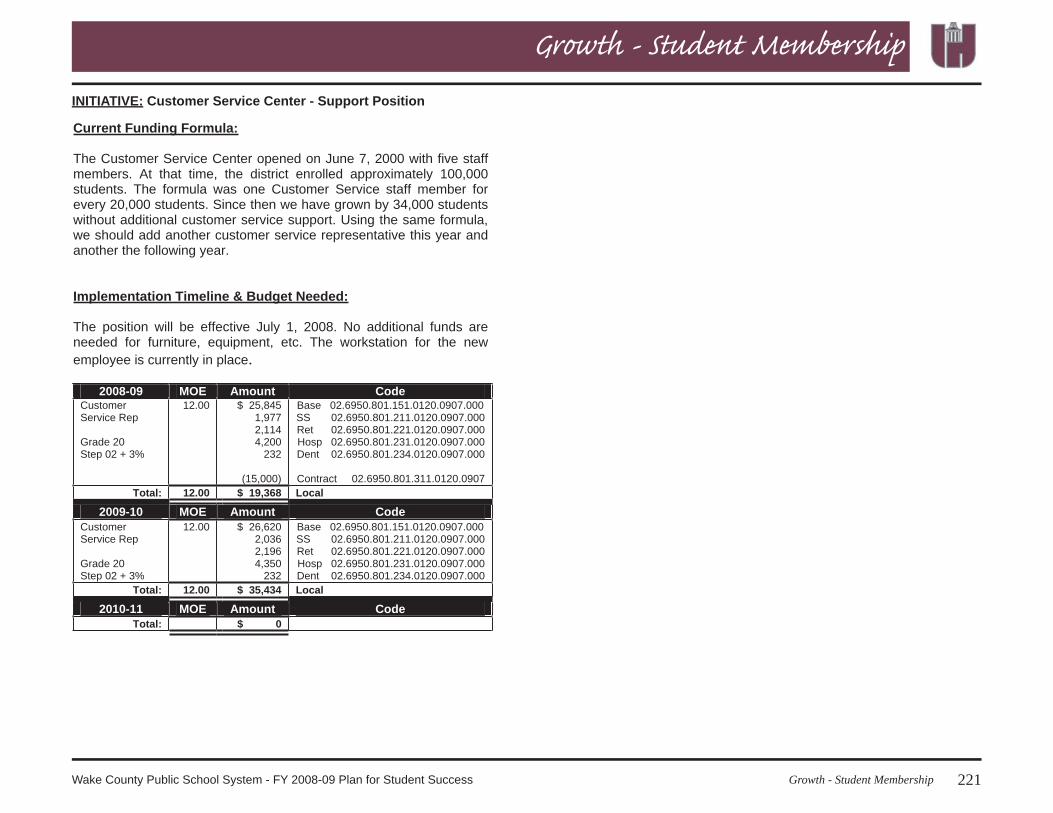
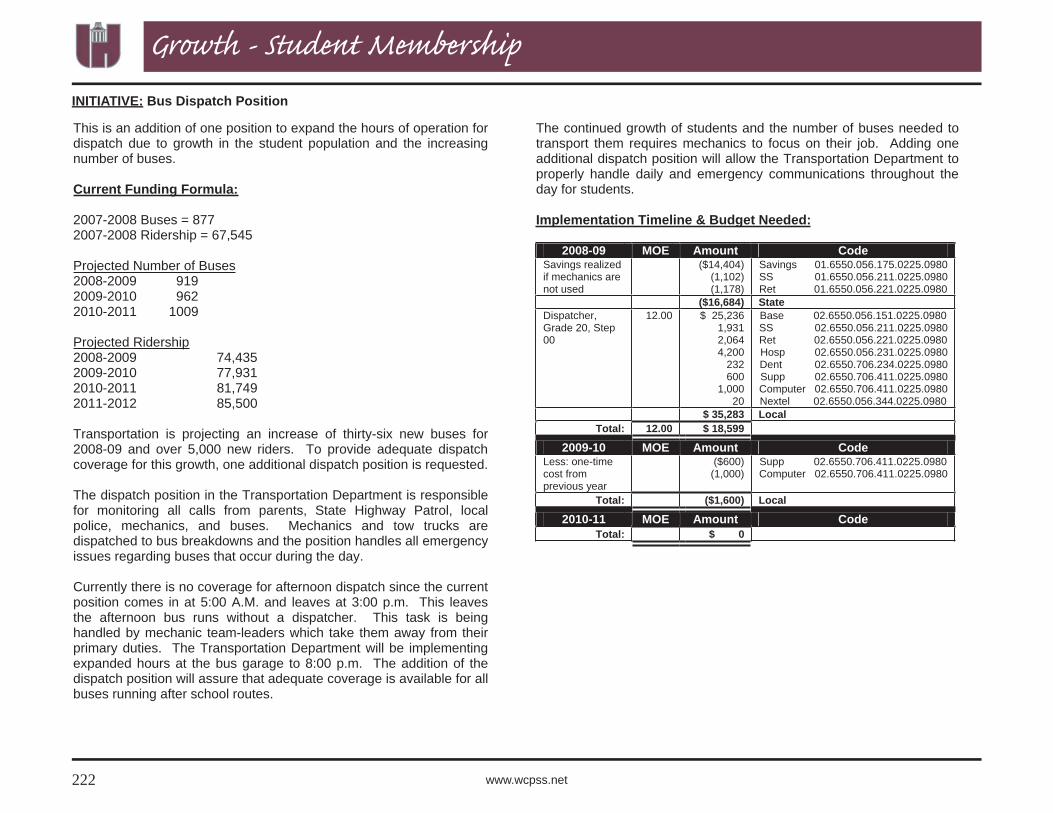
Customer Service Center Support Position 221 $19,368 $0.14
Bus Dispatcher Position 222 $35,283 $0.25
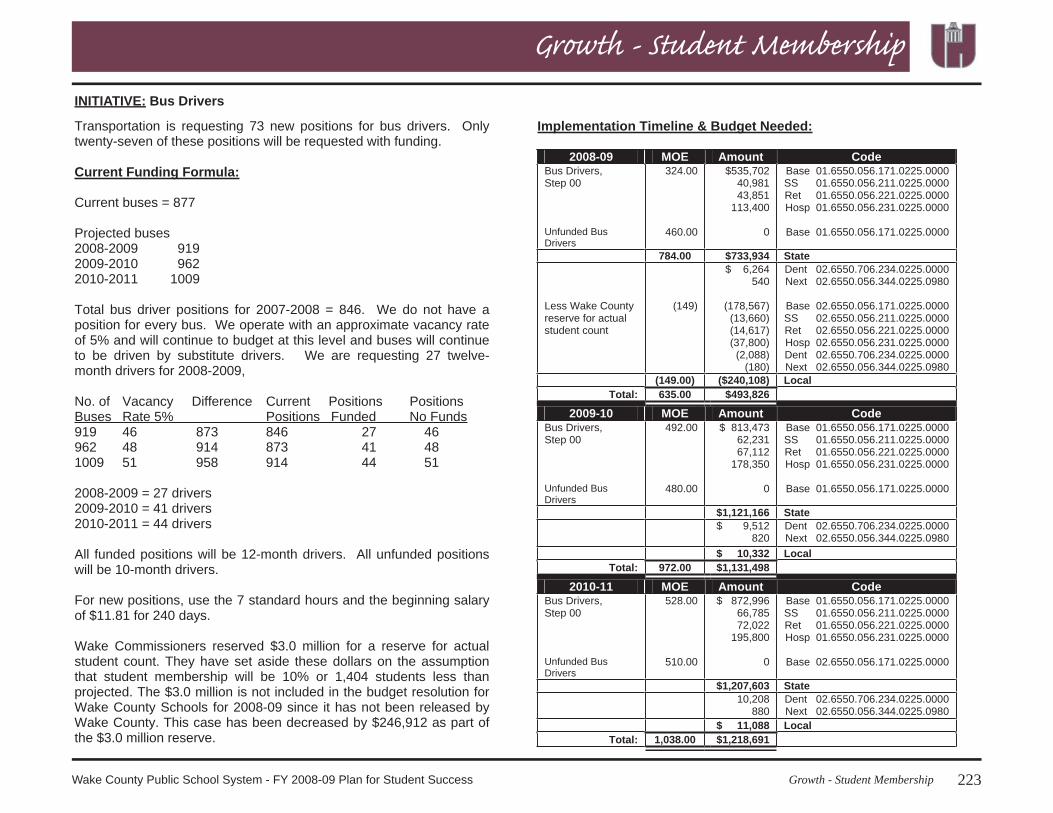
Bus Drivers 223 ($240,108) ($1.73)
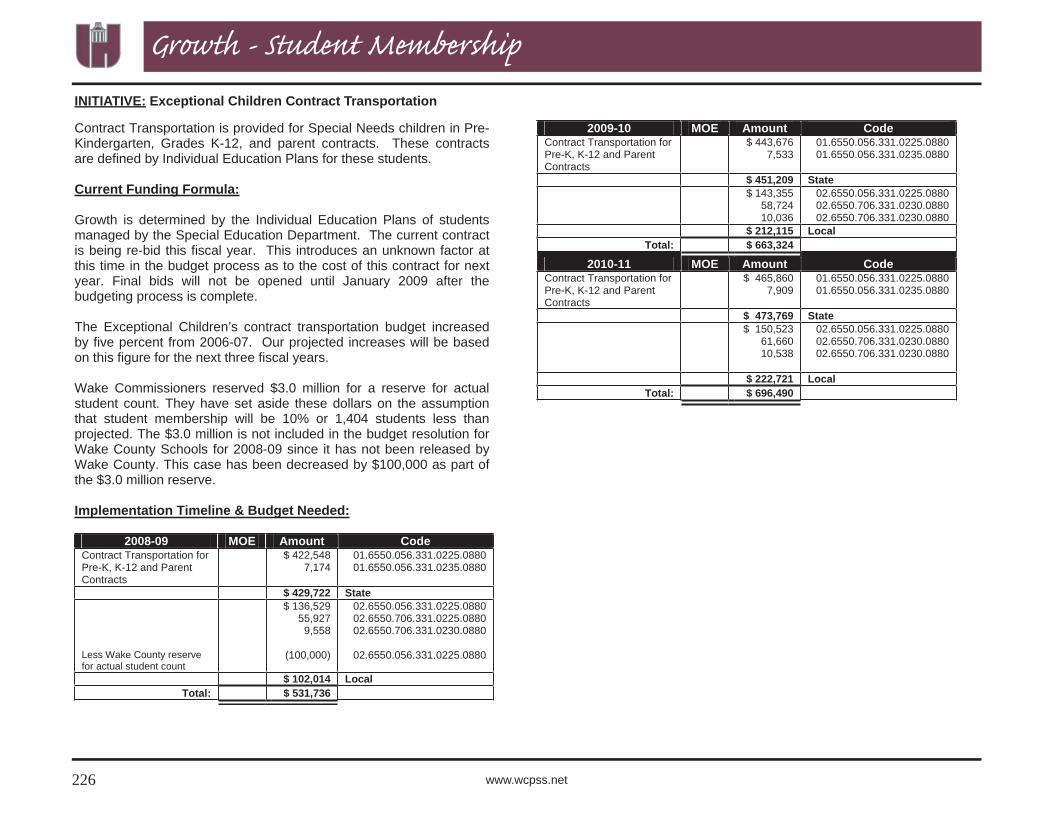
Exceptional Children Contract Trans-portation 226 $102,014 $0.74
1Cases tie to the Curriculum Management Audit recommendations.
25Budget HighlightsWake County Public School System - FY 2008-09 Plan for Student Success
Budget Highlights
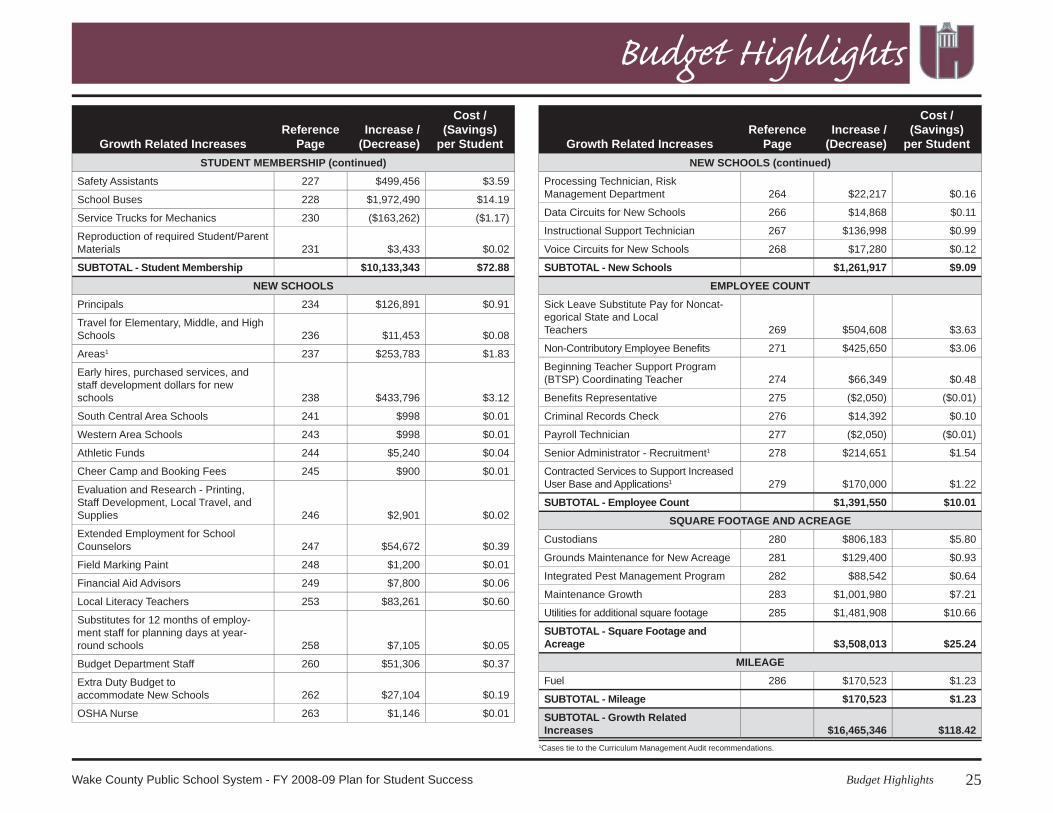
Growth Related IncreasesReference
PageIncrease /
(Decrease)
Cost / (Savings)
per StudentNEW SCHOOLS (continued)
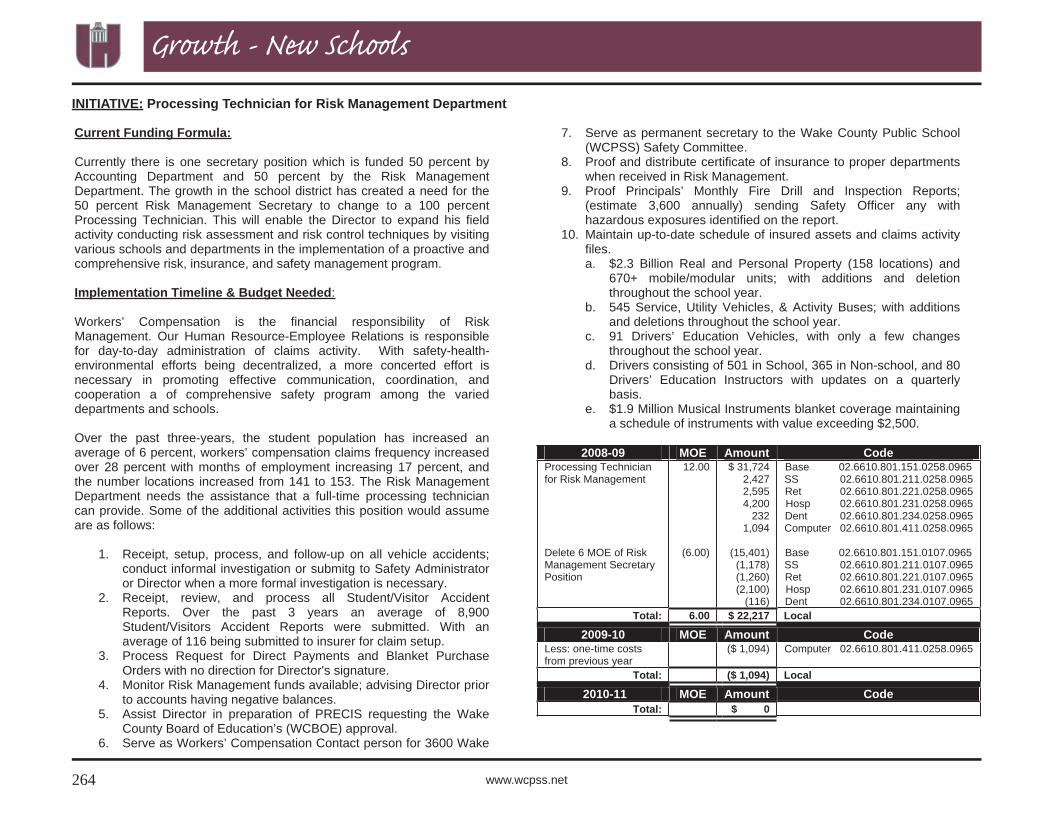
Processing Technician, Risk Management Department 264 $22,217 $0.16
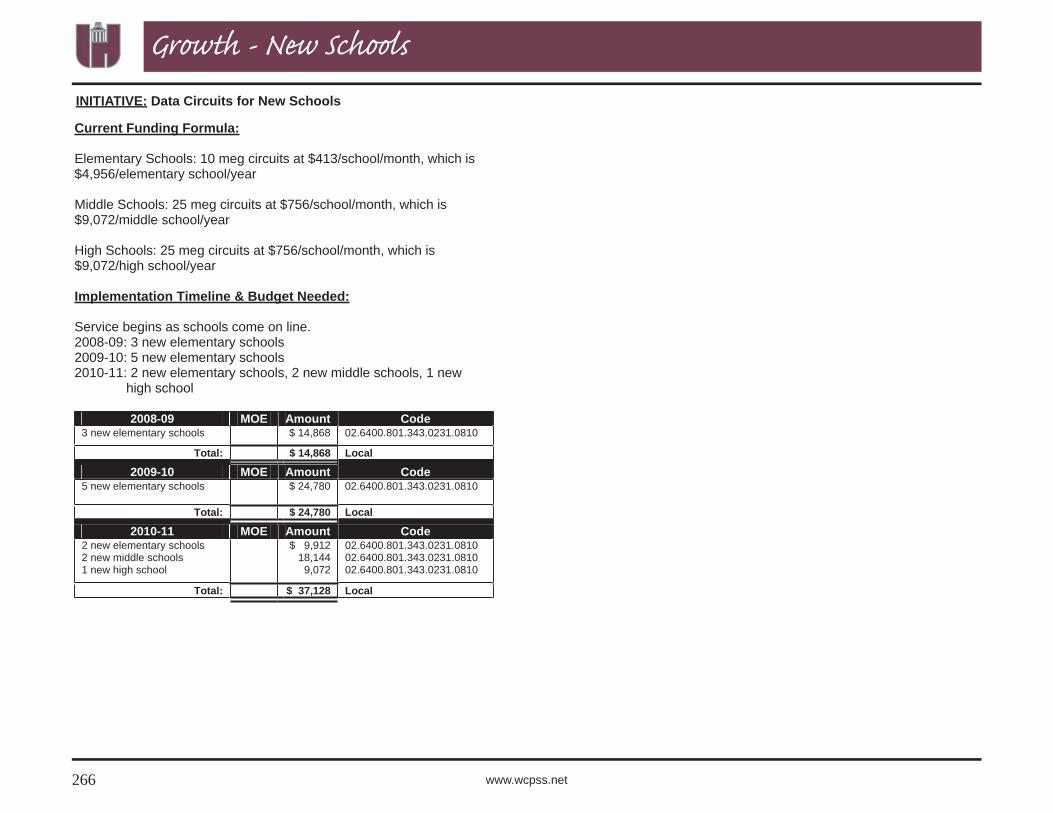
Data Circuits for New Schools 266 $14,868 $0.11
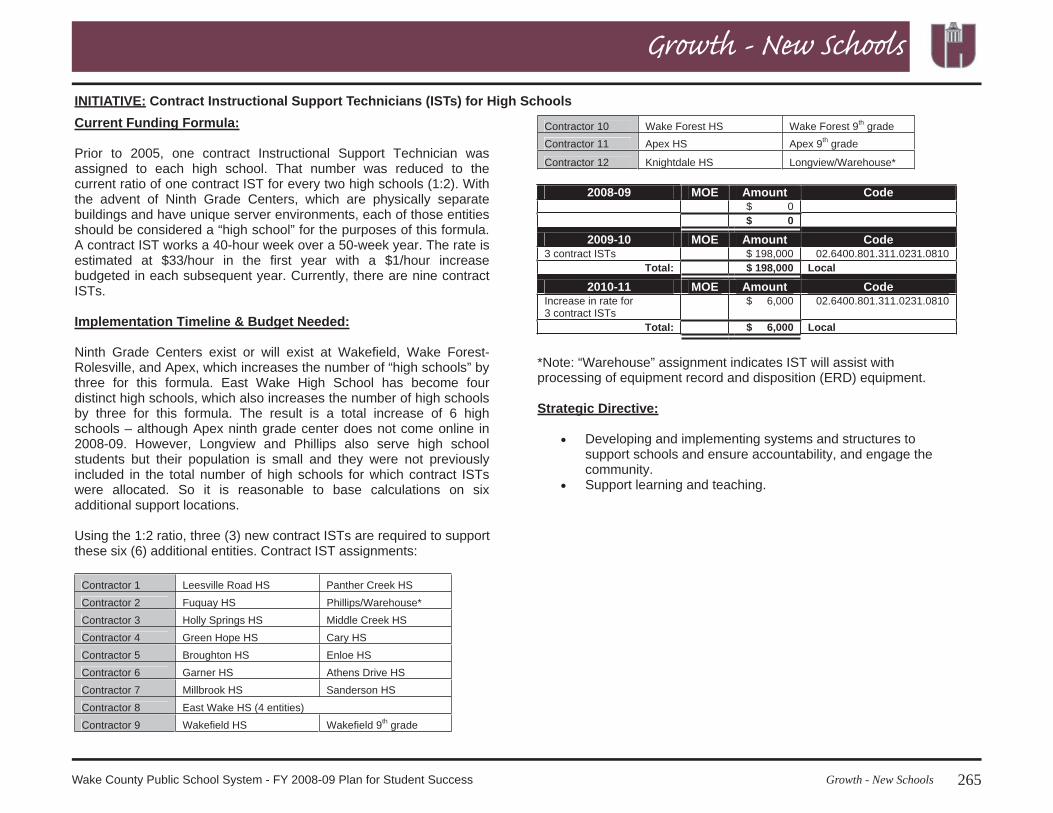
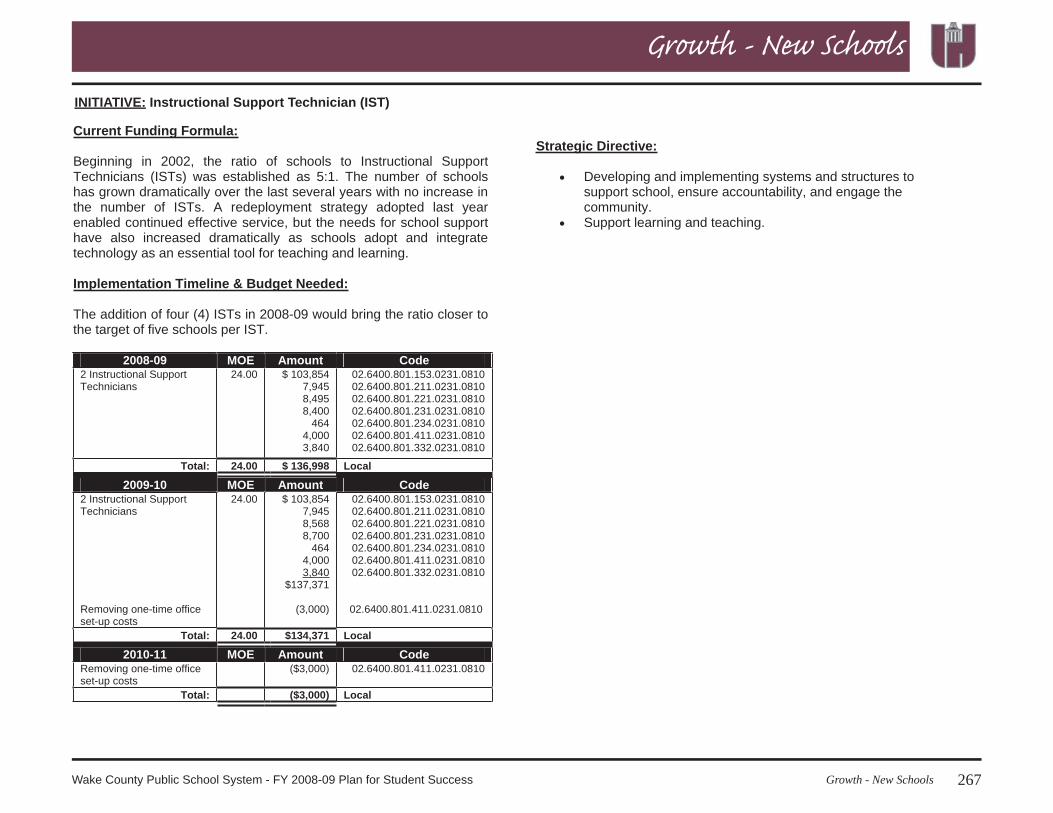
Instructional Support Technician 267 $136,998 $0.99
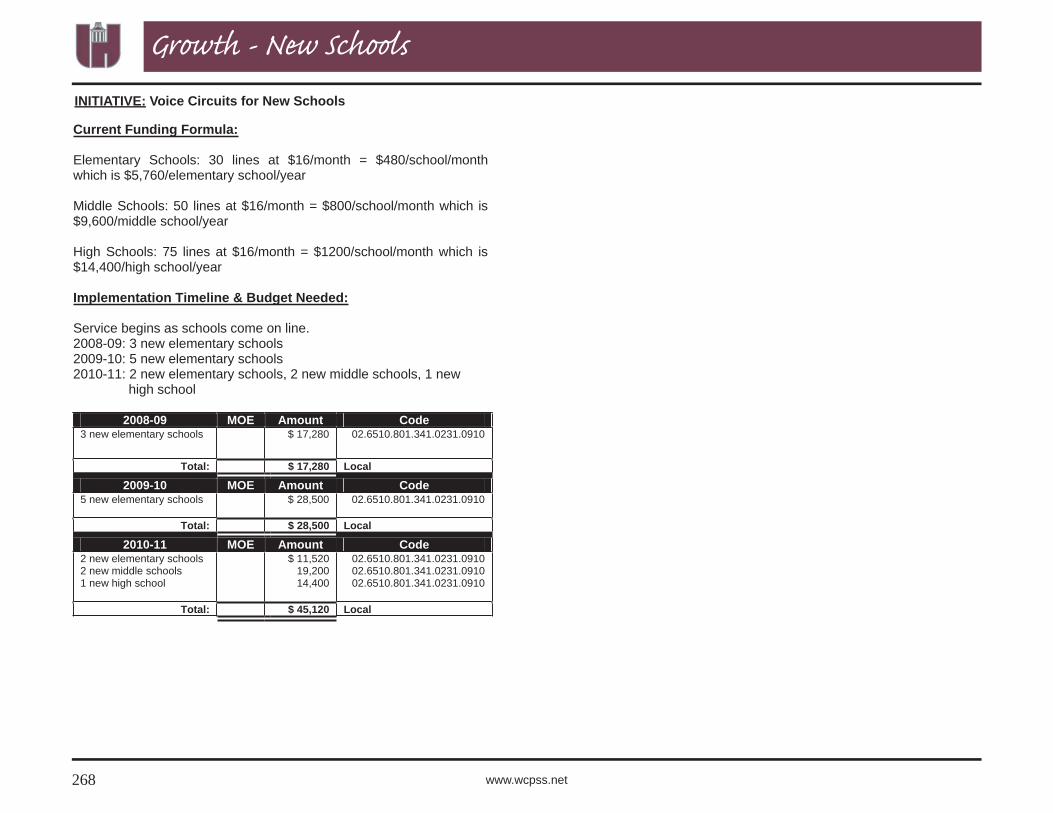
Voice Circuits for New Schools 268 $17,280 $0.12
SUBTOTAL - New Schools $1,261,917 $9.09EMPLOYEE COUNT
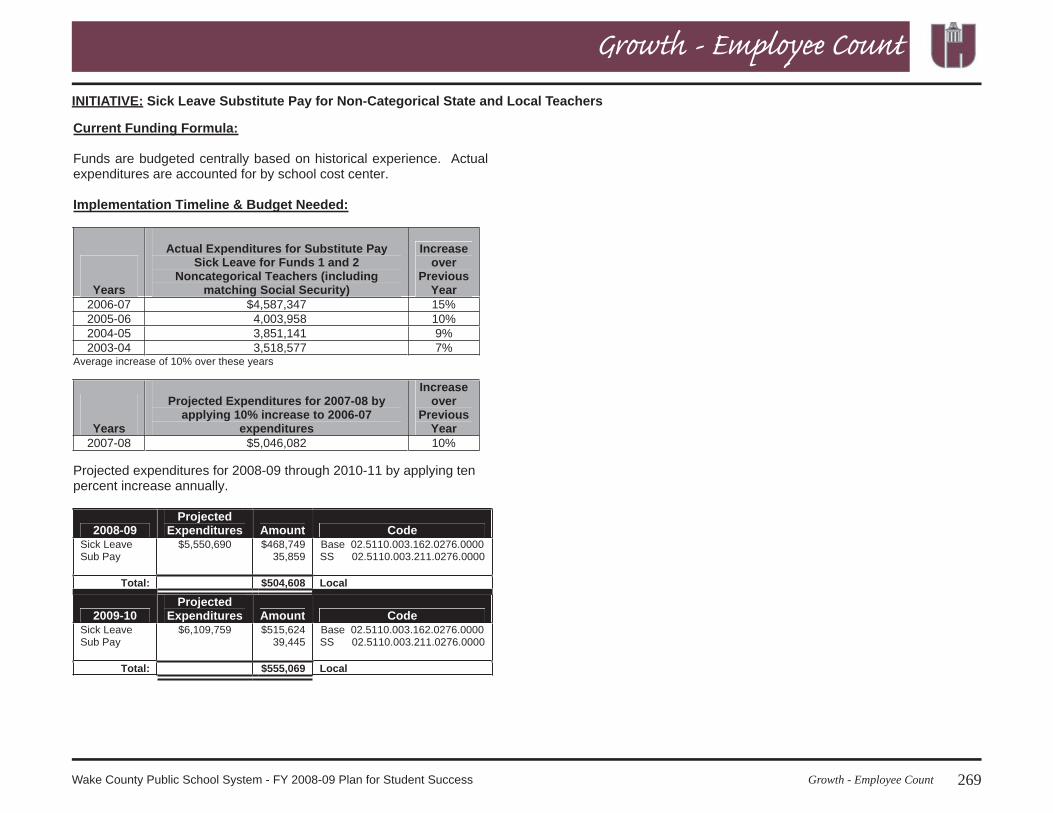
Sick Leave Substitute Pay for Noncat-egorical State and Local Teachers 269 $504,608 $3.63
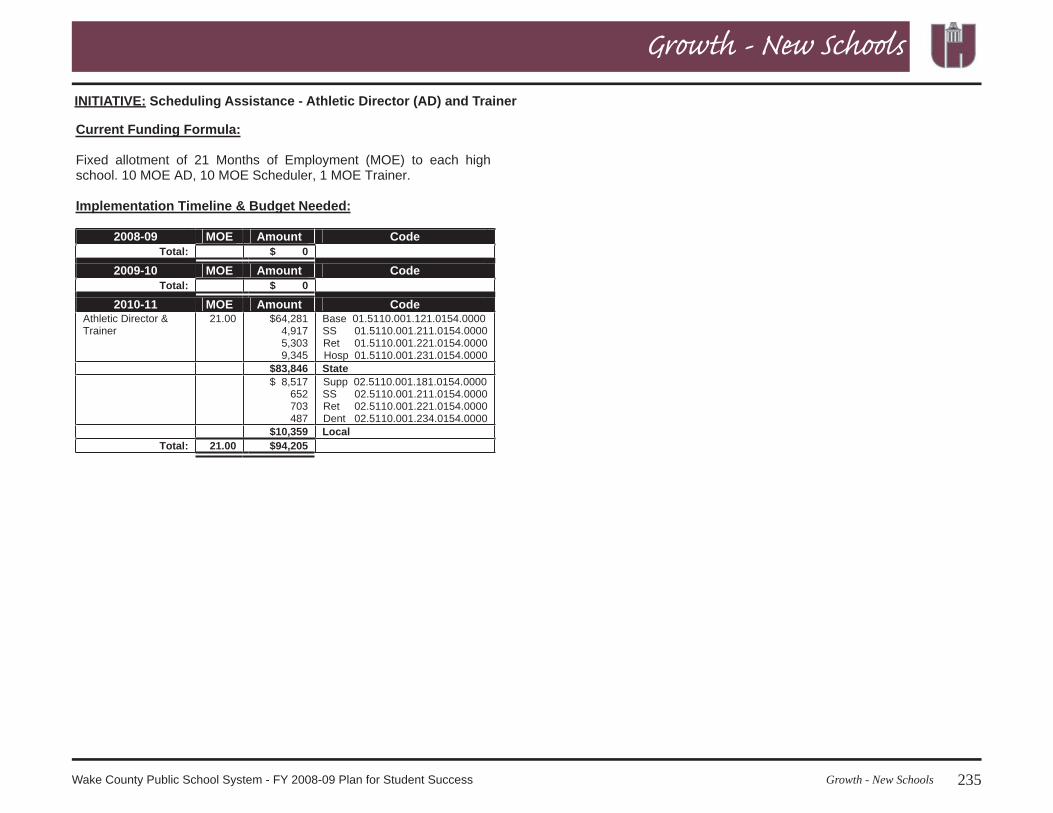
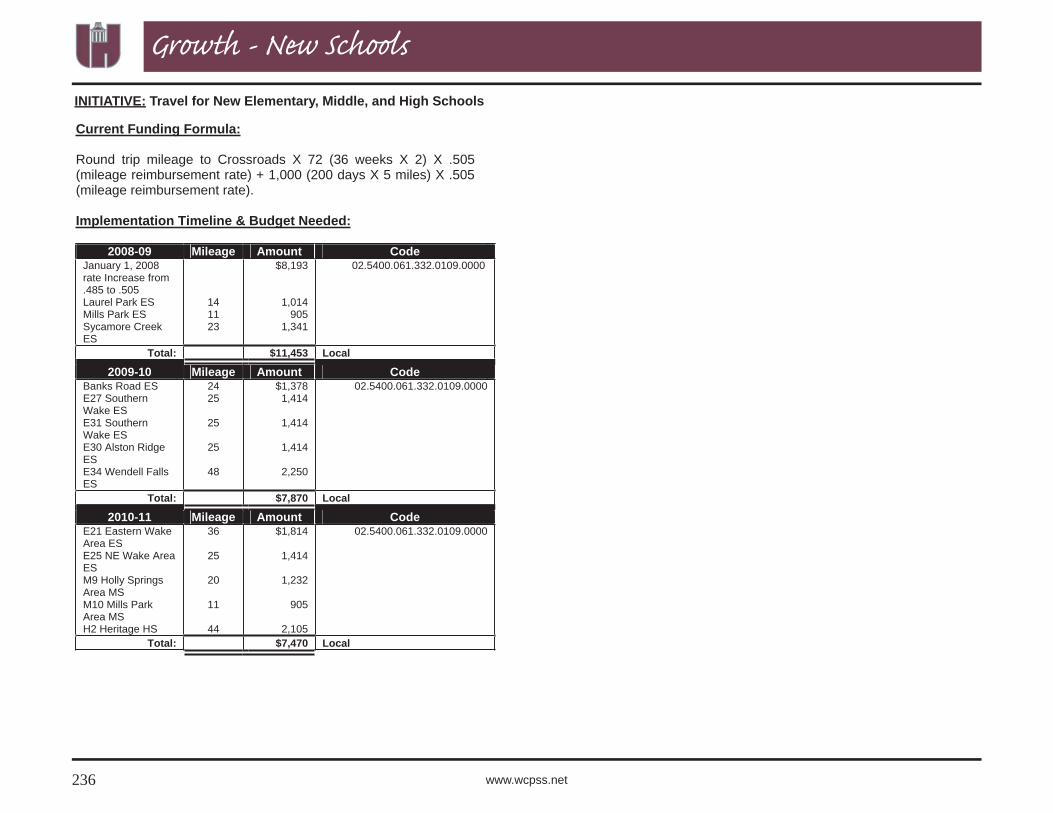
Travel for Elementary, Middle, and High Schools 236 $11,453 $0.08
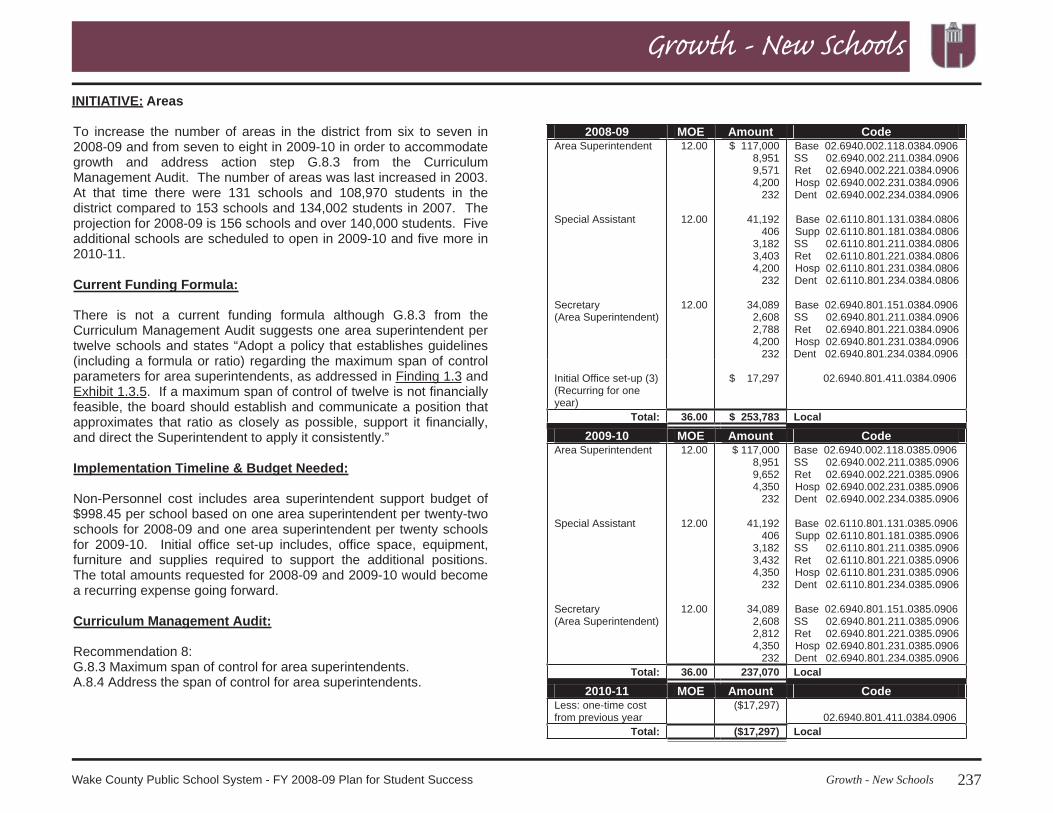
Areas1 237 $253,783 $1.83
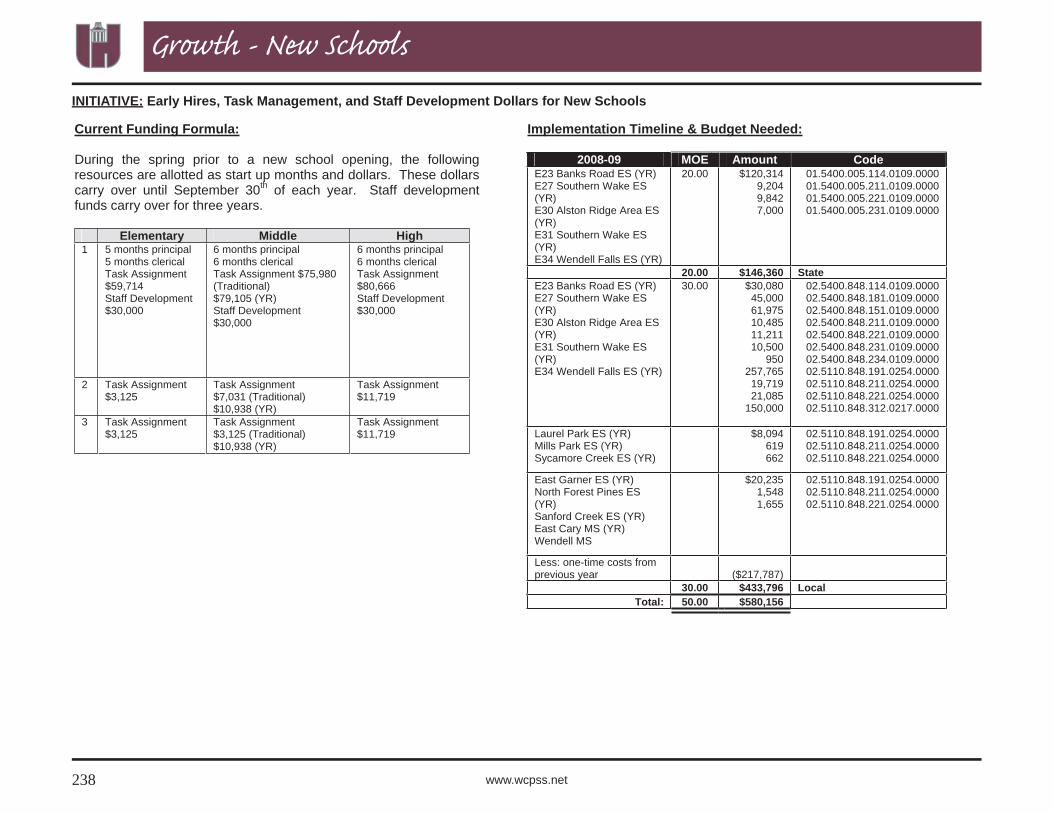
Early hires, purchased services, and staff development dollars for new schools 238 $433,796 $3.12
South Central Area Schools 241 $998 $0.01
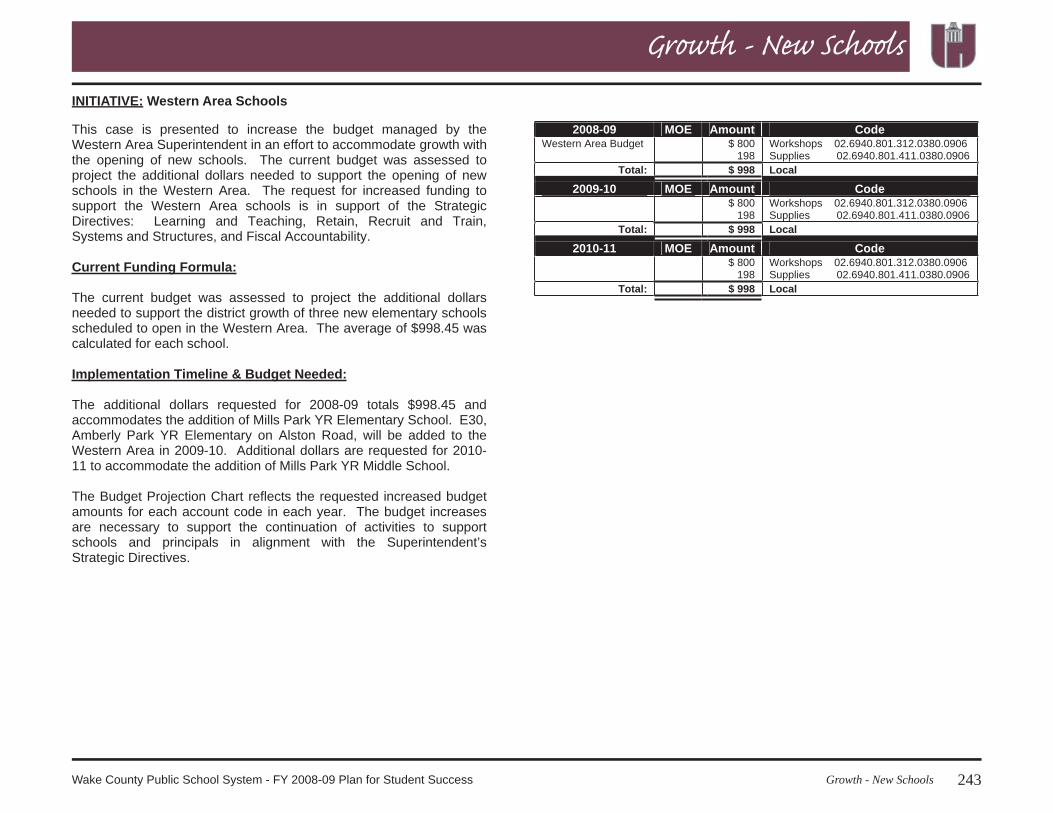
Western Area Schools 243 $998 $0.01
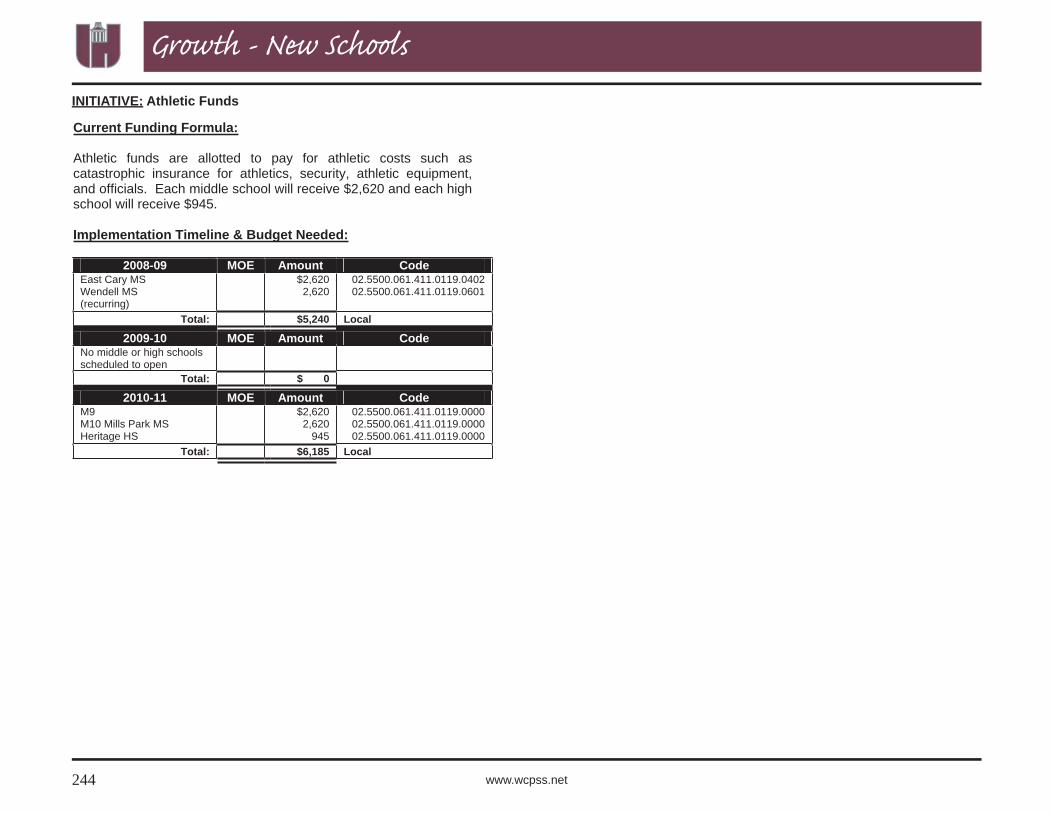
Athletic Funds 244 $5,240 $0.04
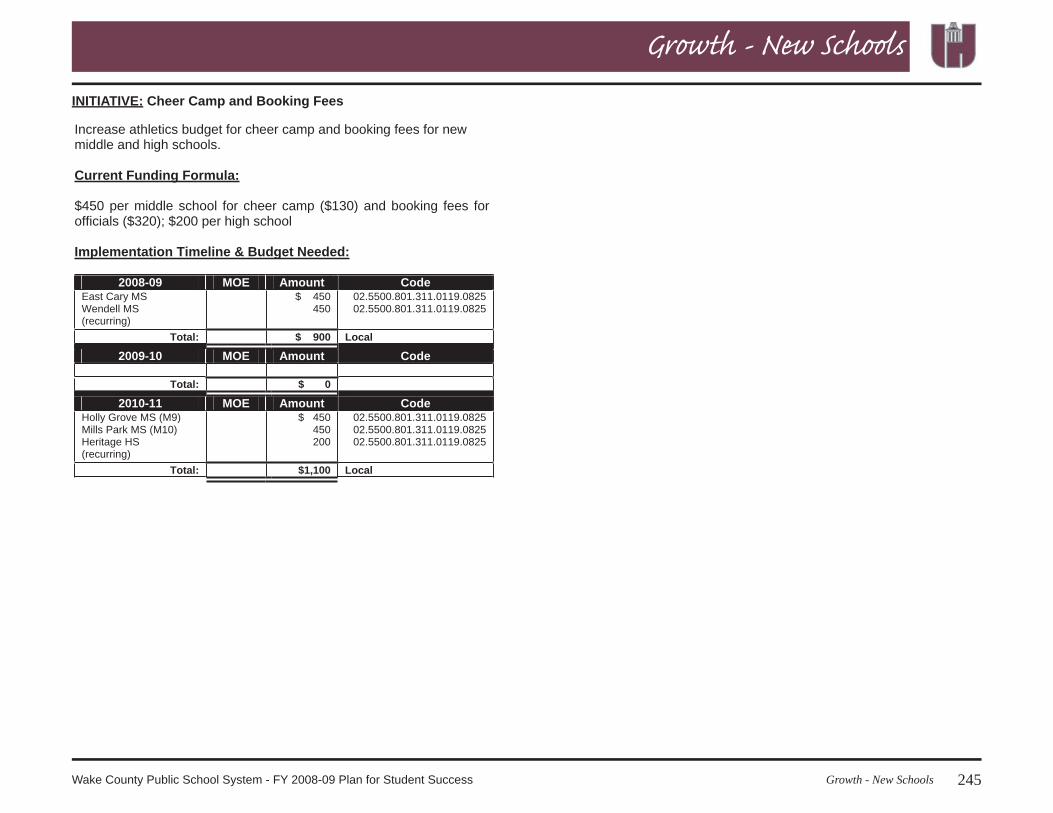
Cheer Camp and Booking Fees 245 $900 $0.01
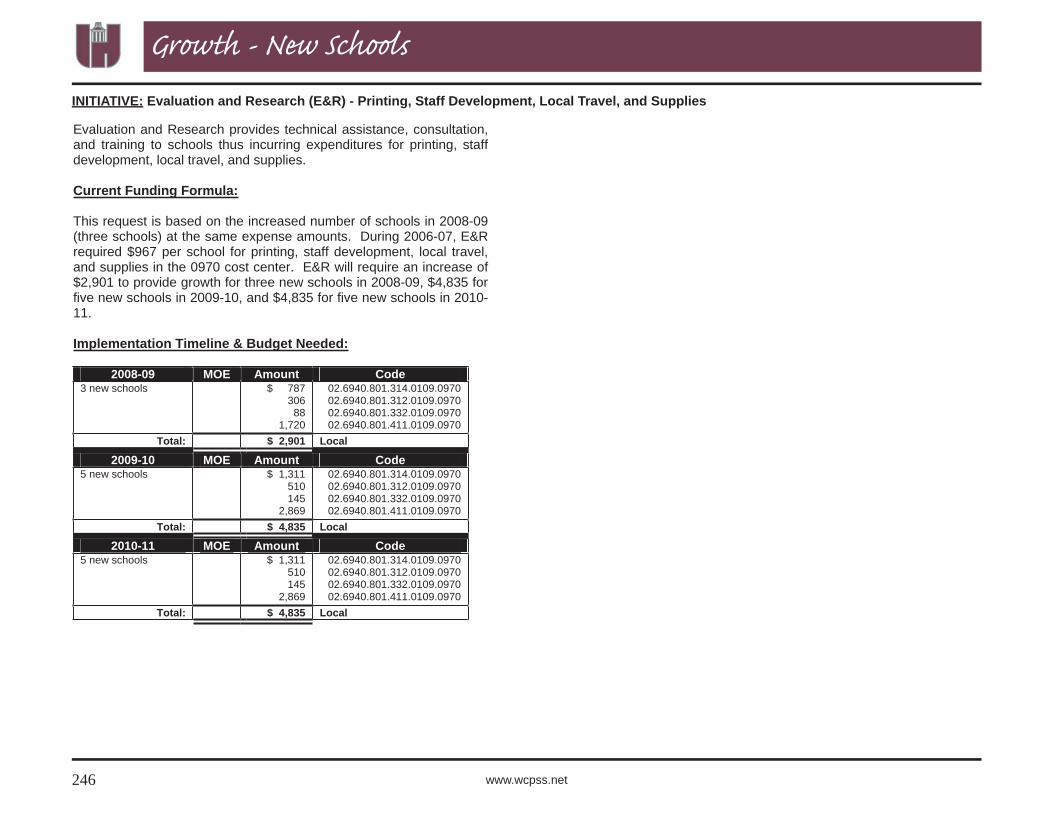
Evaluation and Research - Printing, Staff Development, Local Travel, and Supplies 246 $2,901 $0.02
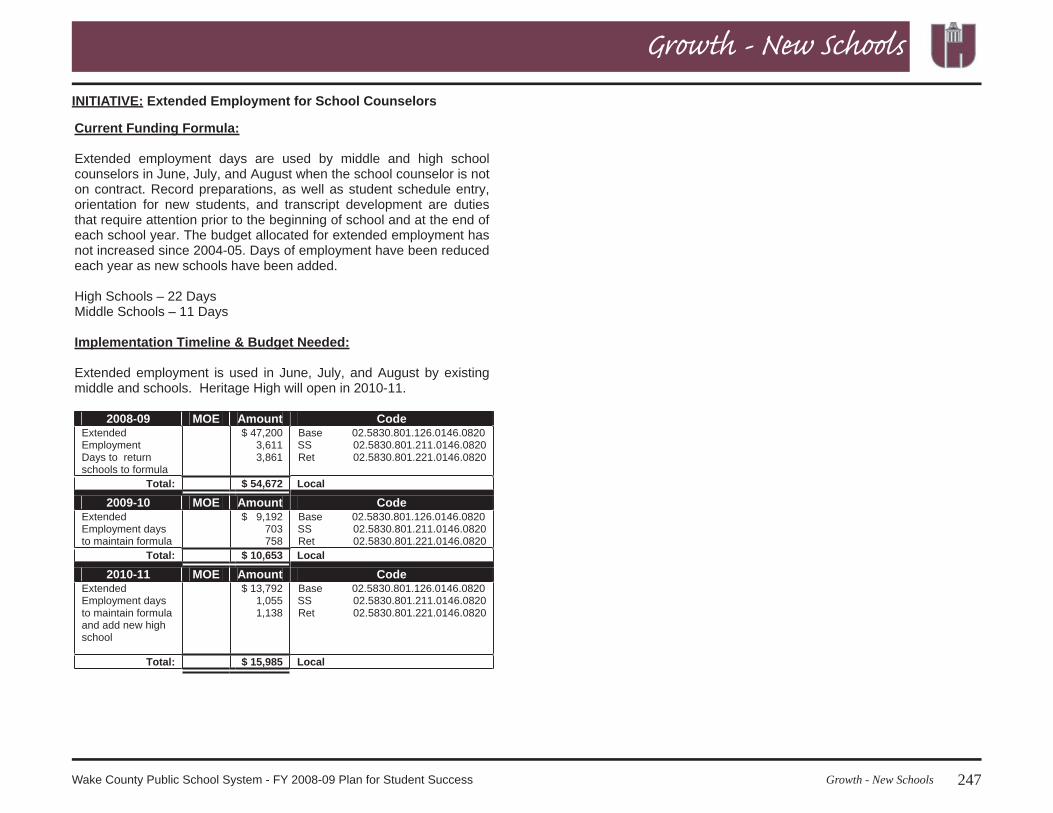
Extended Employment for School Counselors 247 $54,672 $0.39
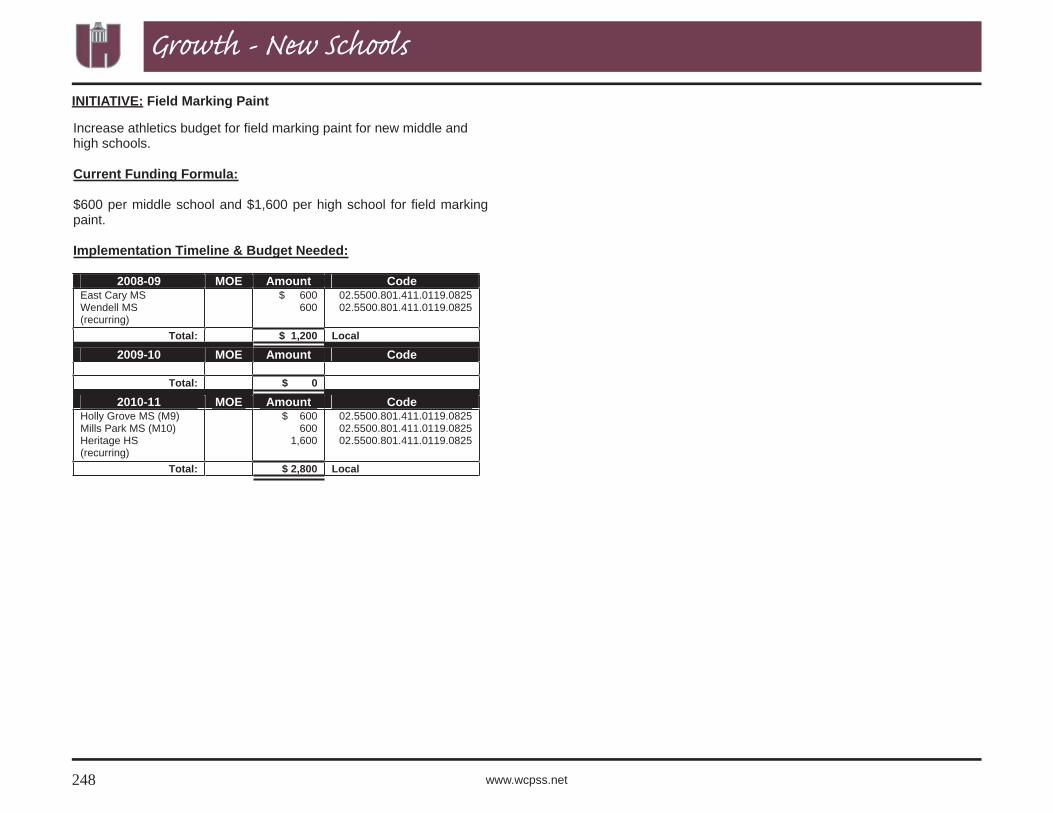
Field Marking Paint 248 $1,200 $0.01
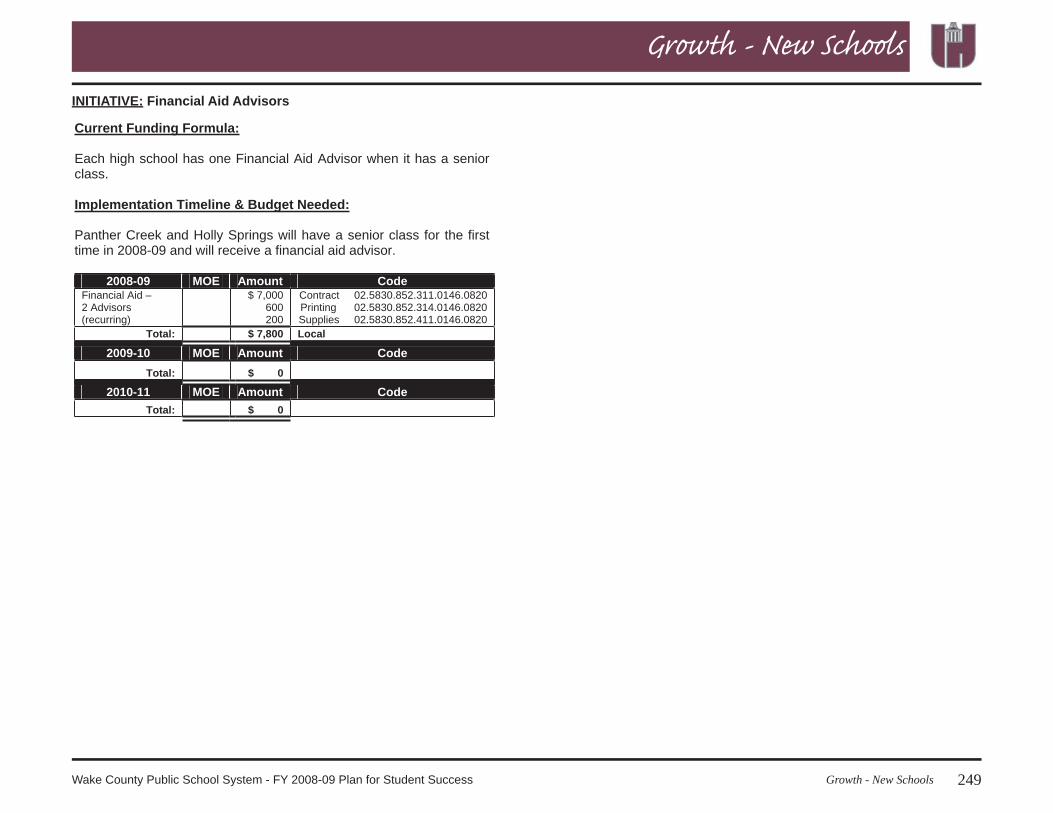
Financial Aid Advisors 249 $7,800 $0.06
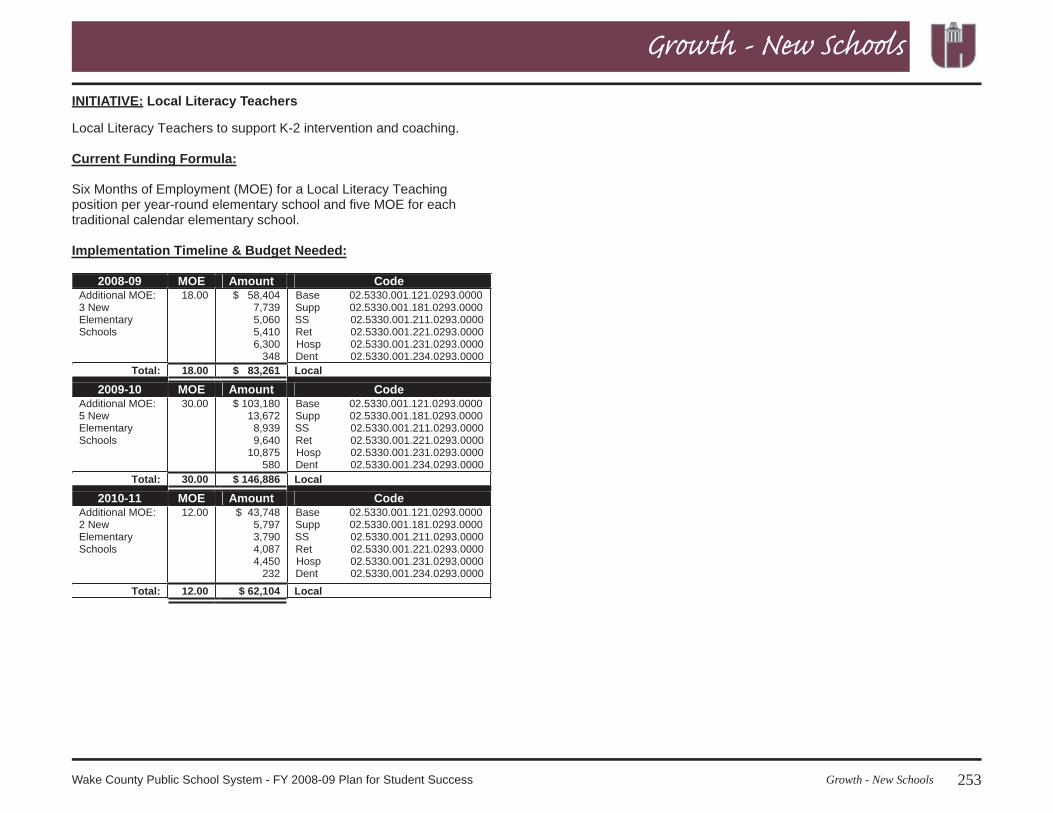
Local Literacy Teachers 253 $83,261 $0.60
Substitutes for 12 months of employ-ment staff for planning days at year-round schools 258 $7,105 $0.05
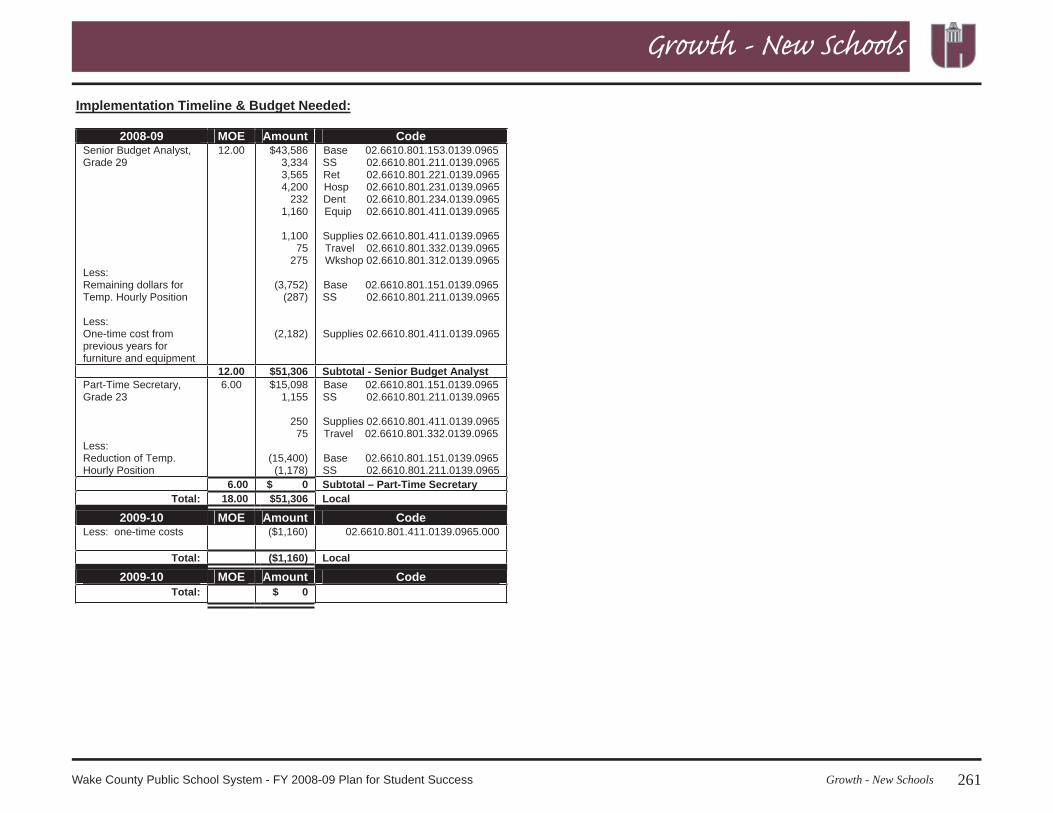
Budget Department Staff 260 $51,306 $0.37
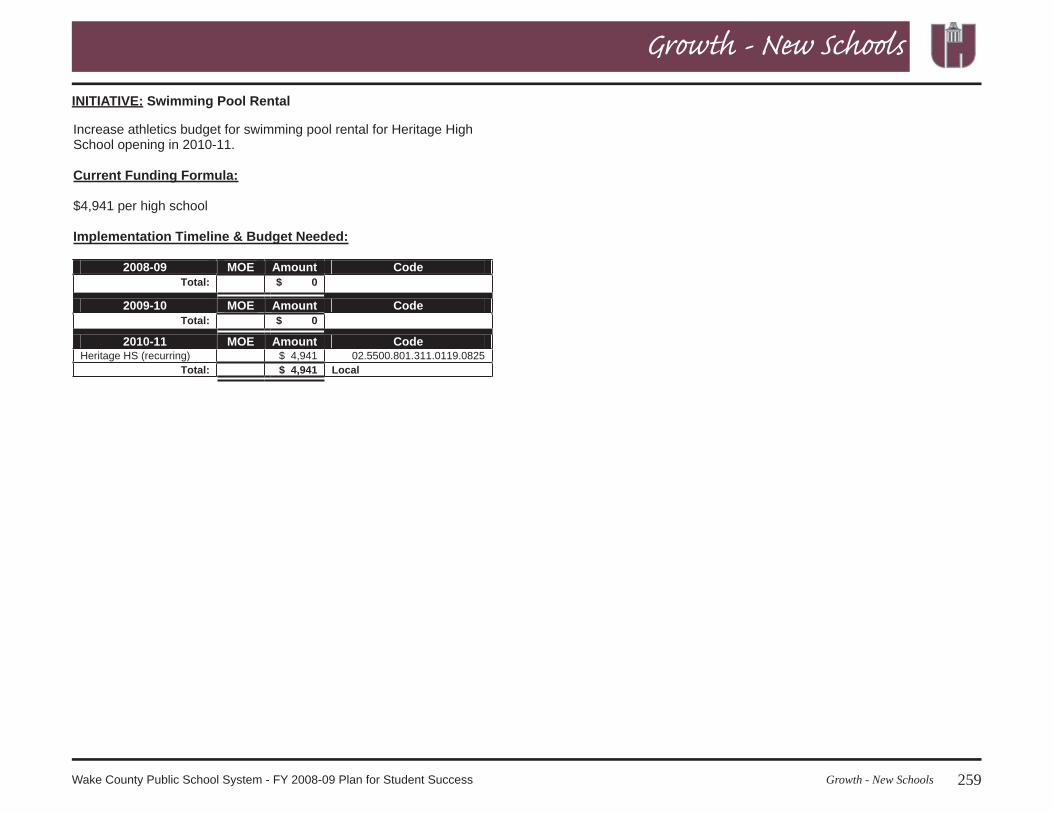
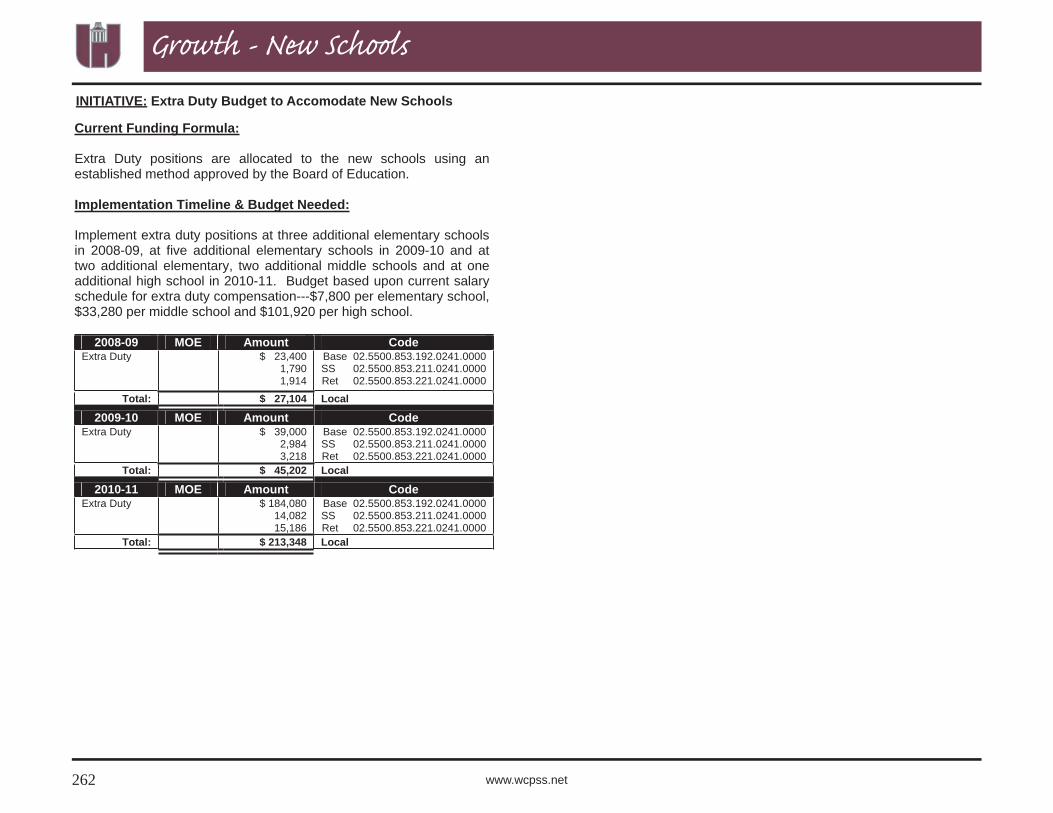
Extra Duty Budget to accommodate New Schools 262 $27,104 $0.19
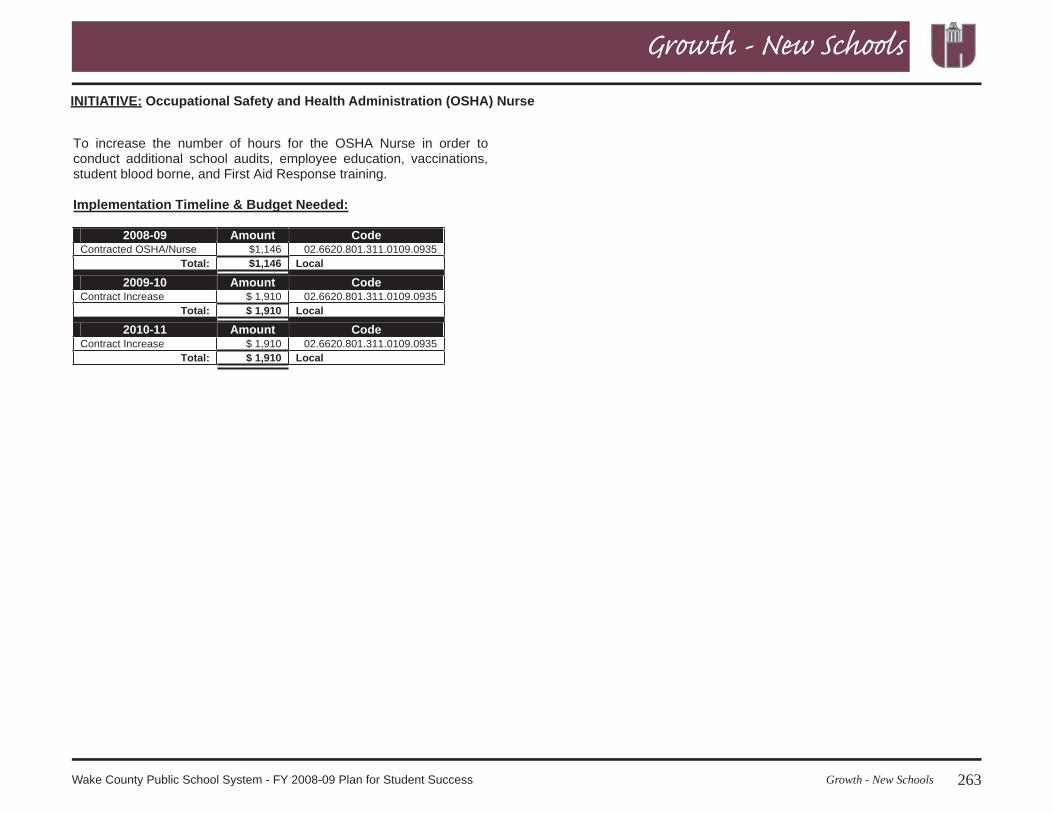
OSHA Nurse 263 $1,146 $0.01
1Cases tie to the Curriculum Management Audit recommendations.
26 www.wcpss.net
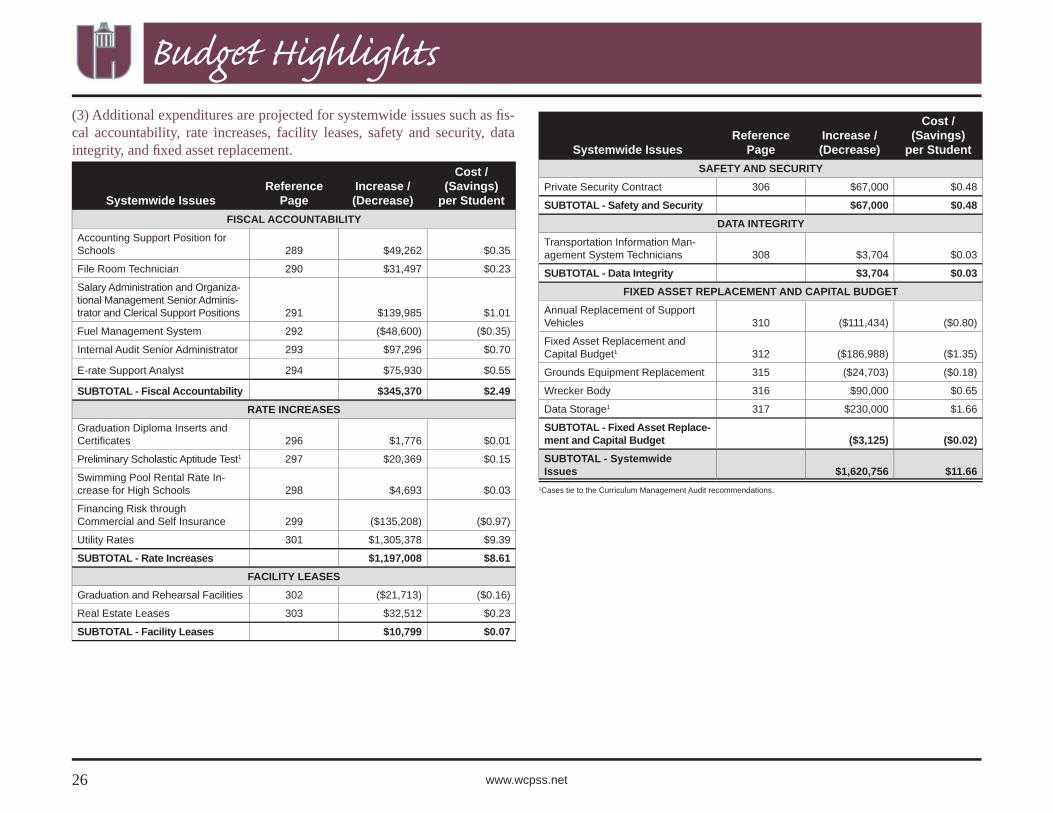
Budget Highlights(3) Additional expenditures are projected for systemwide issues such as fi s-cal accountability, rate increases, facility leases, safety and security, data integrity, and fi xed asset replacement.
Systemwide IssuesReference
PageIncrease / (Decrease)
Cost / (Savings)
per StudentFISCAL ACCOUNTABILITY
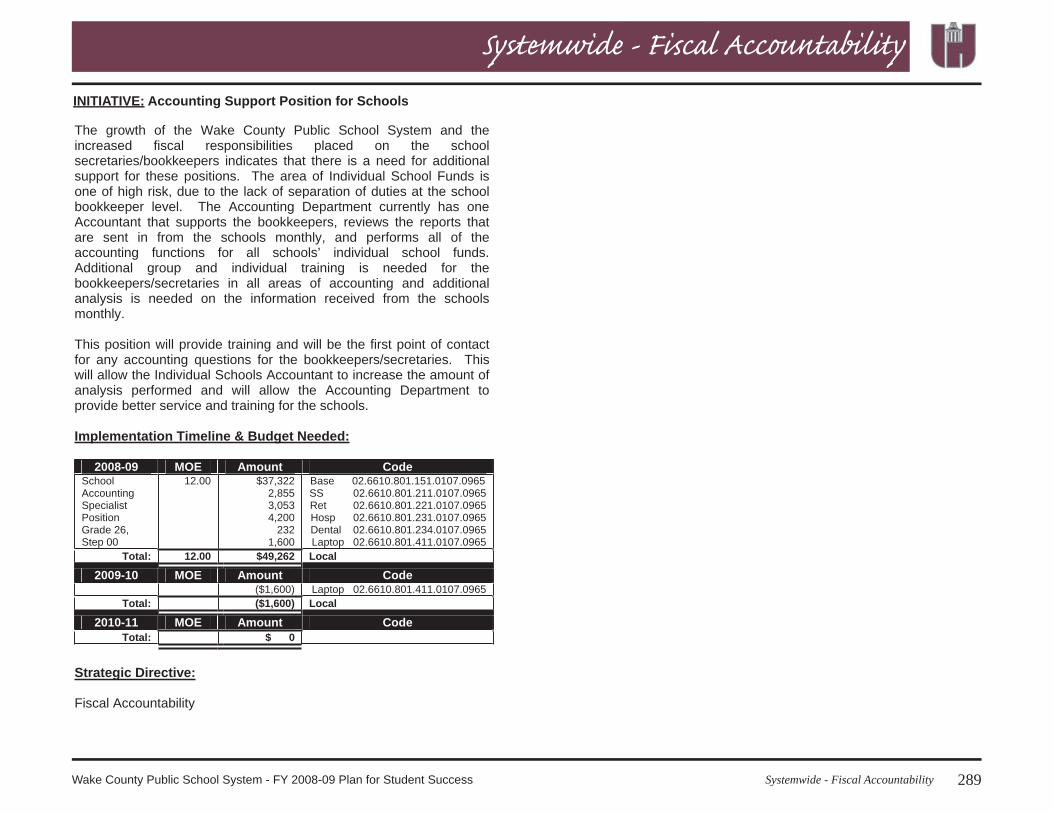
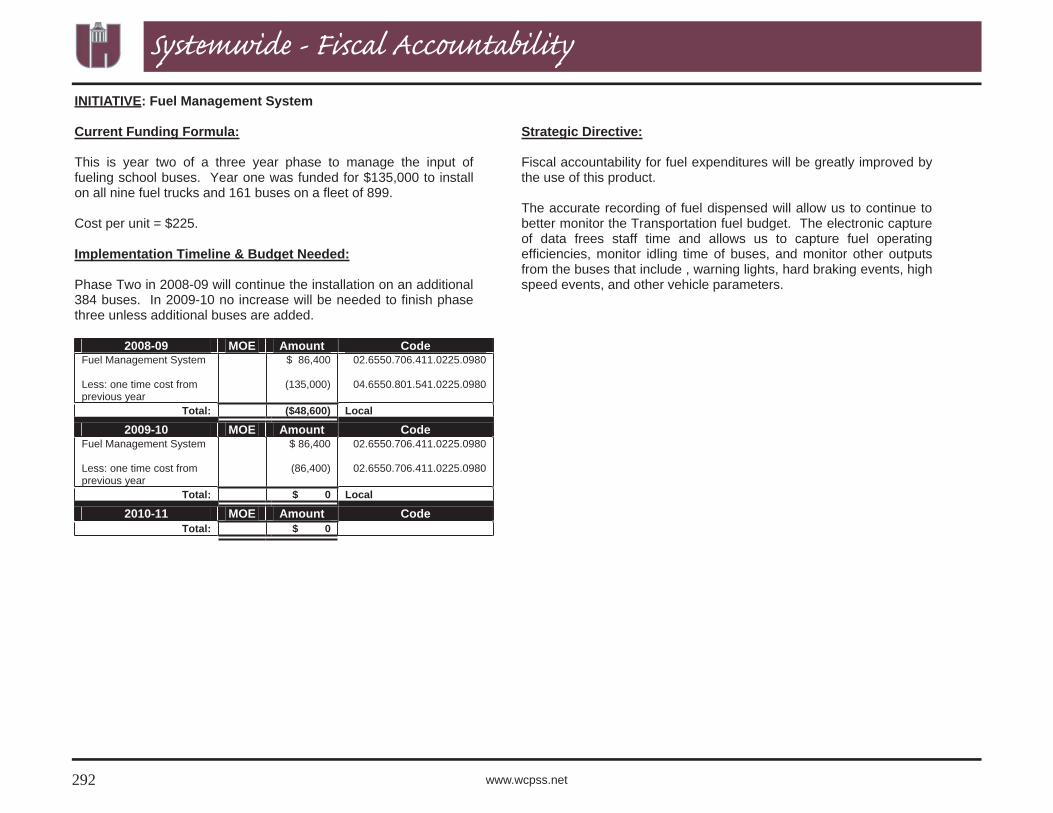
Accounting Support Position for Schools 289 $49,262 $0.35
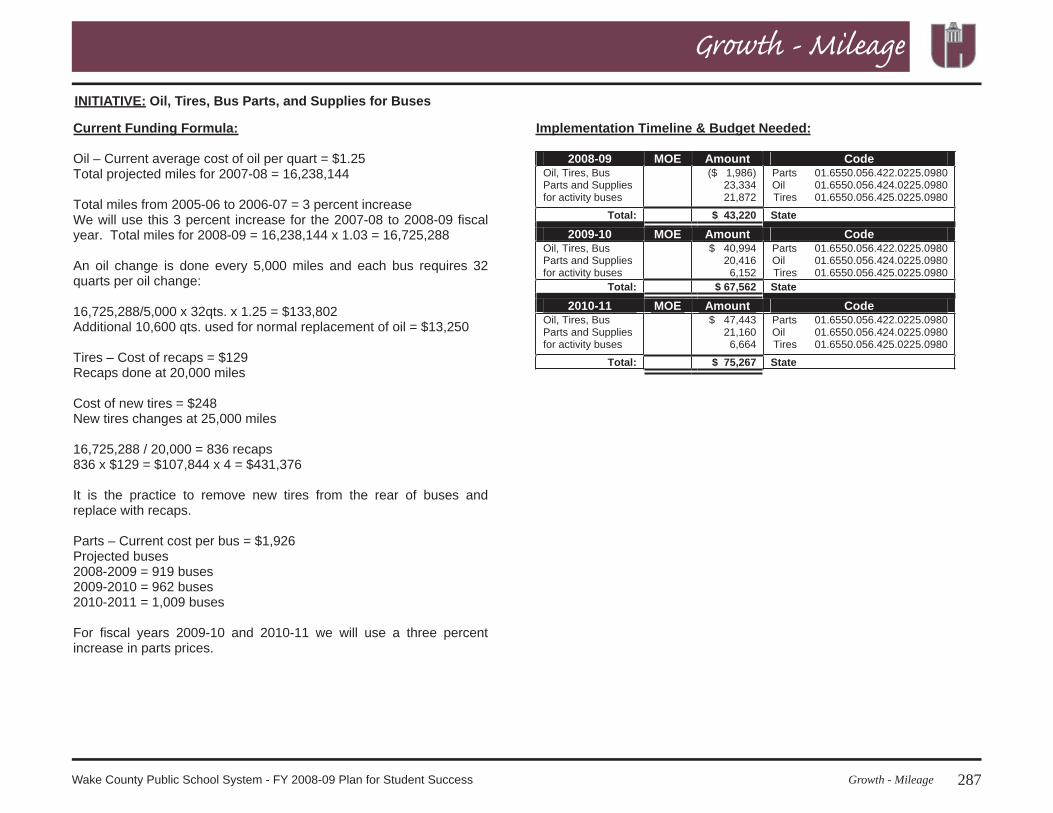
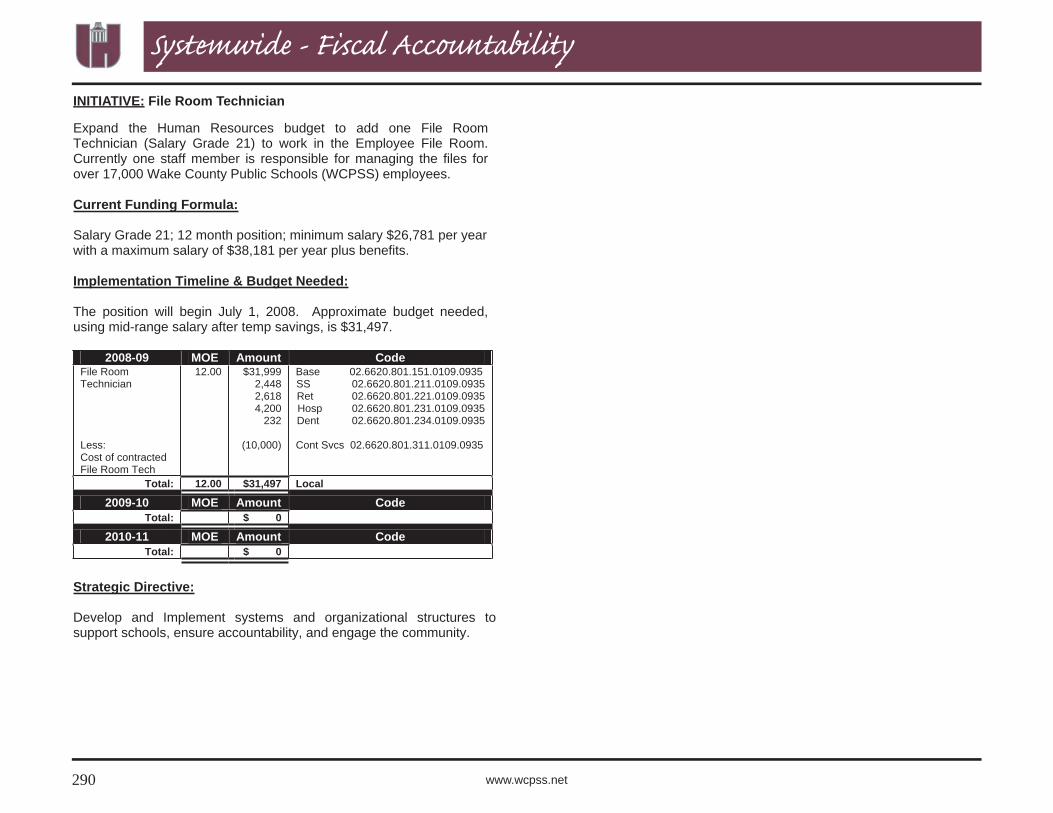
File Room Technician 290 $31,497 $0.23
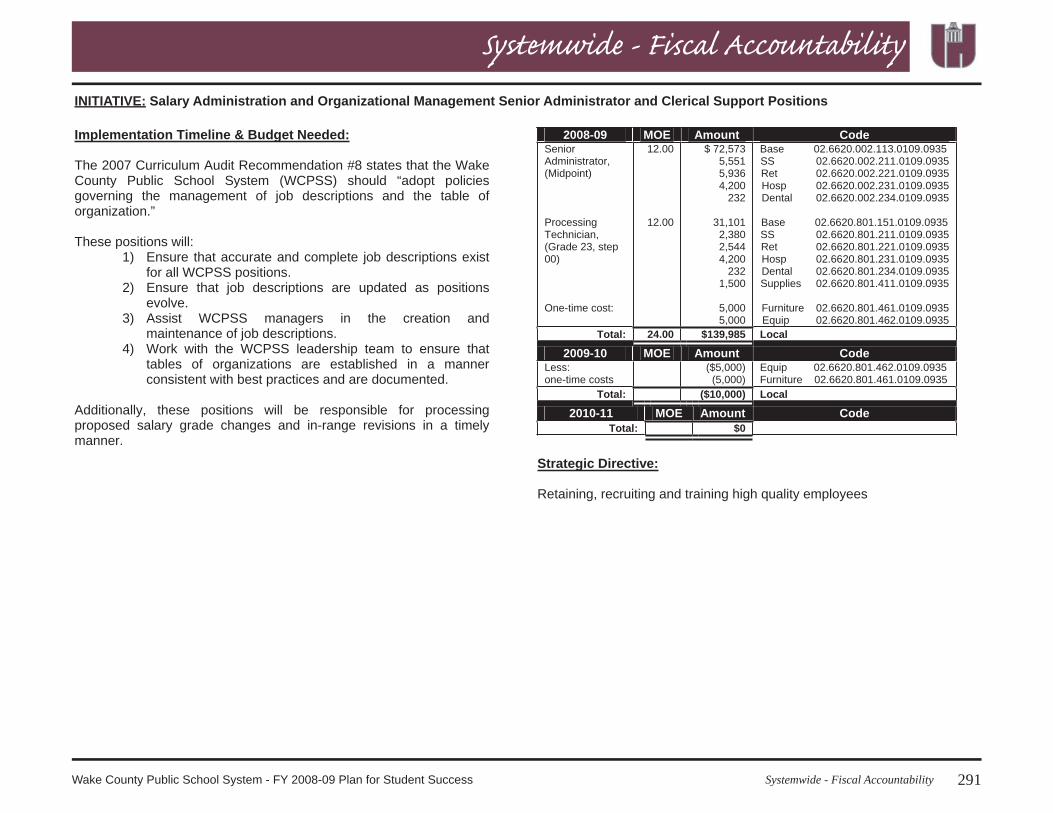
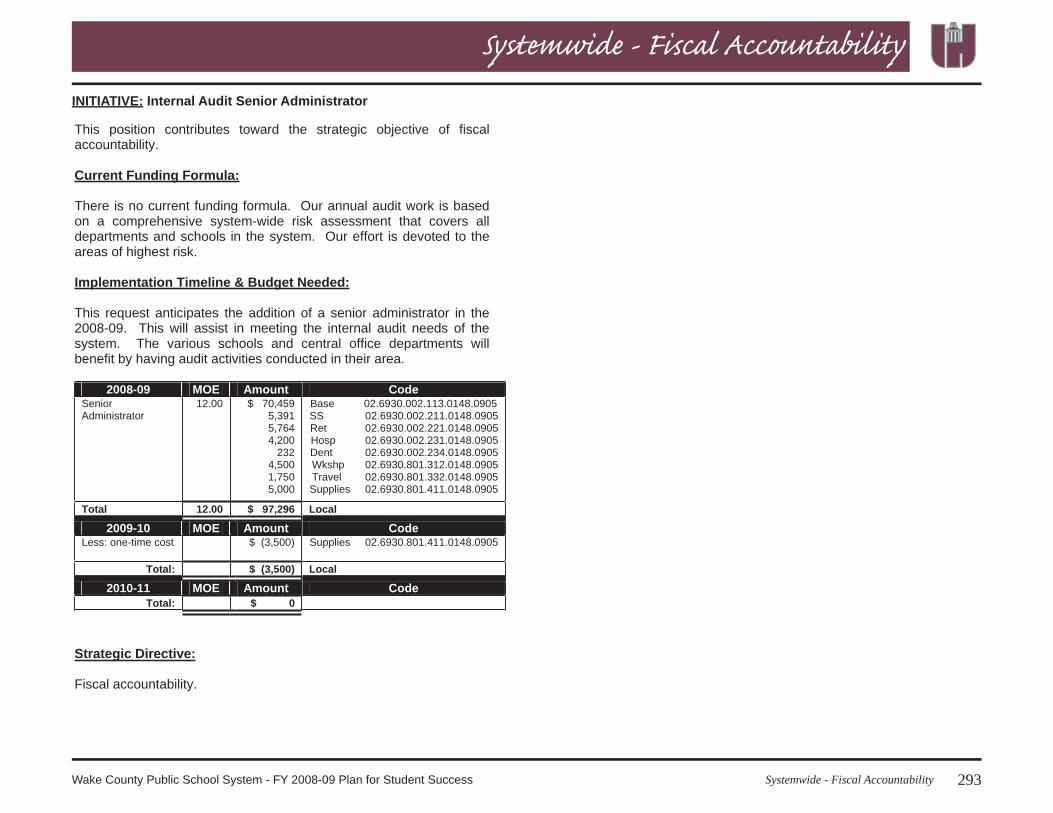
Salary Administration and Organiza-tional Management Senior Adminis-trator and Clerical Support Positions 291 $139,985 $1.01
SUBTOTAL - Fixed Asset Replace-ment and Capital Budget ($3,125) ($0.02)SUBTOTAL - Systemwide Issues $1,620,756 $11.66
1Cases tie to the Curriculum Management Audit recommendations.
27Budget HighlightsWake County Public School System - FY 2008-09 Plan for Student Success
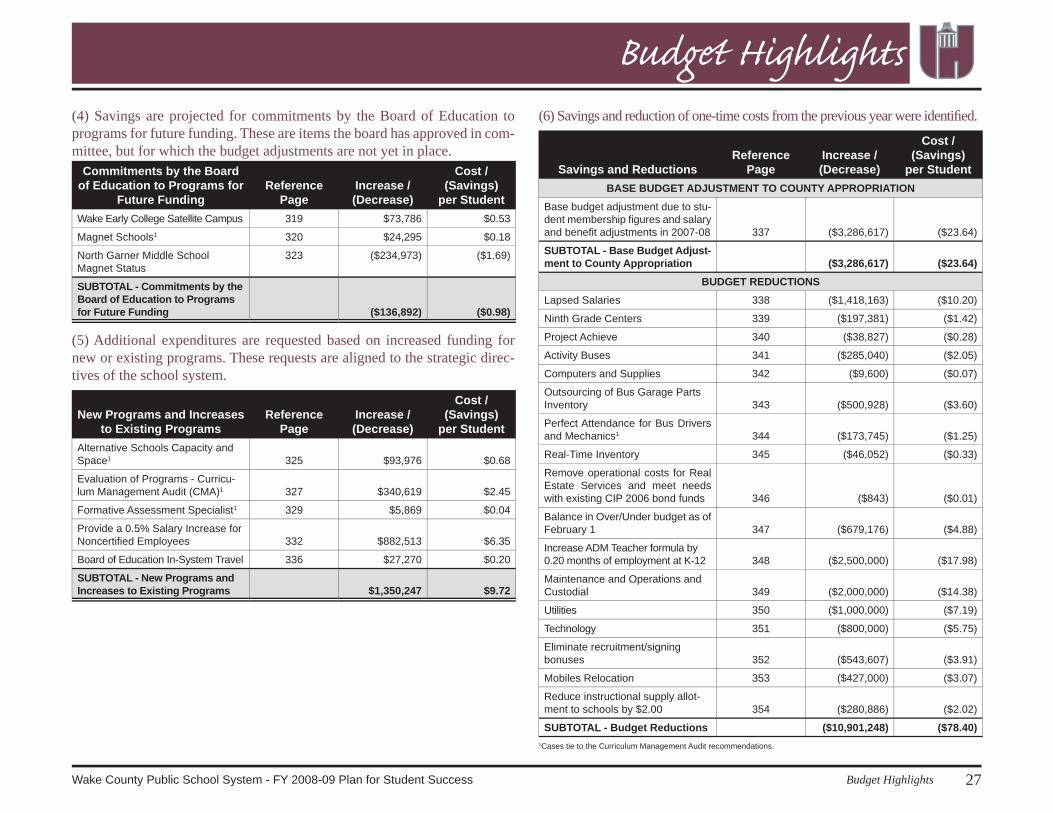
Budget Highlights(4) Savings are projected for commitments by the Board of Education to programs for future funding. These are items the board has approved in com-mittee, but for which the budget adjustments are not yet in place.
Commitments by the Board of Education to Programs for
Future FundingReference
PageIncrease / (Decrease)
Cost / (Savings)
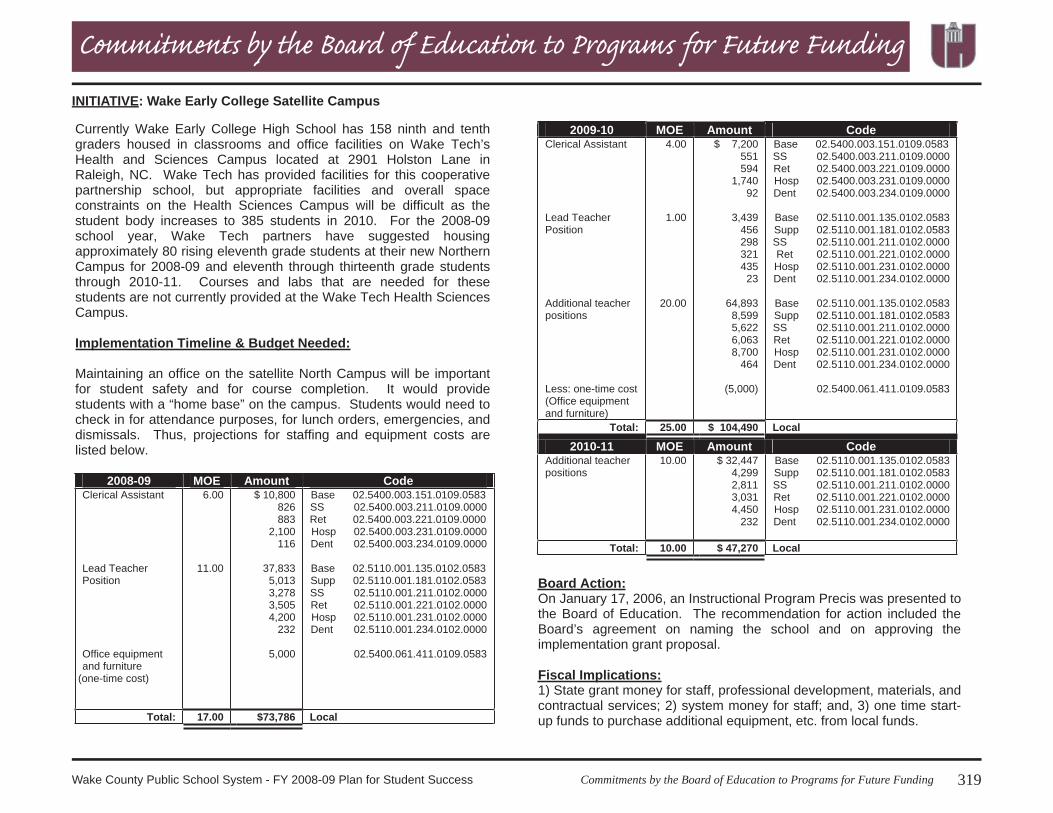
per StudentWake Early College Satellite Campus 319 $73,786 $0.53
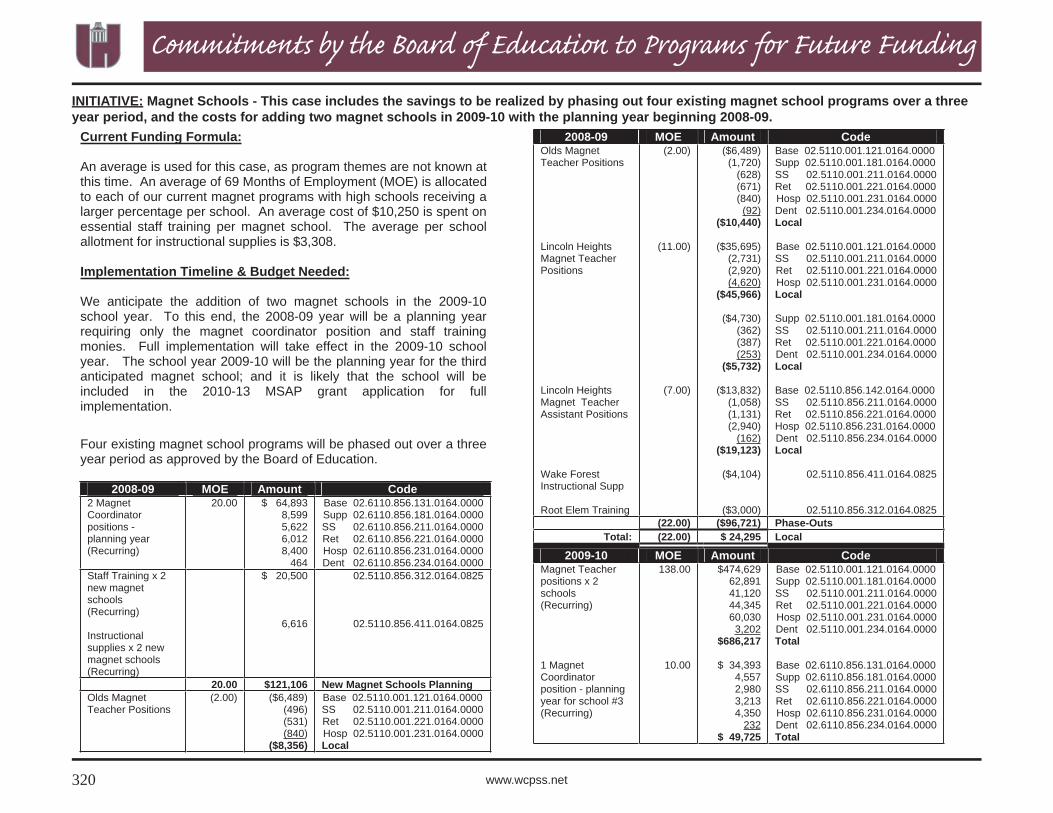
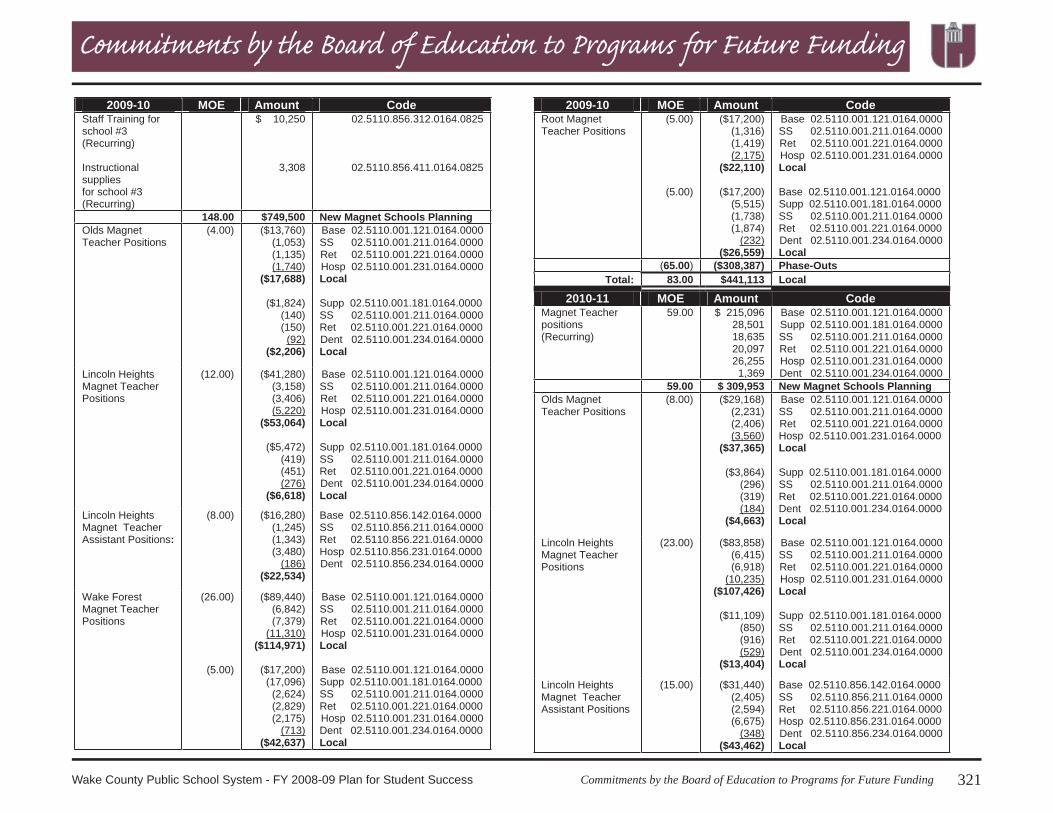
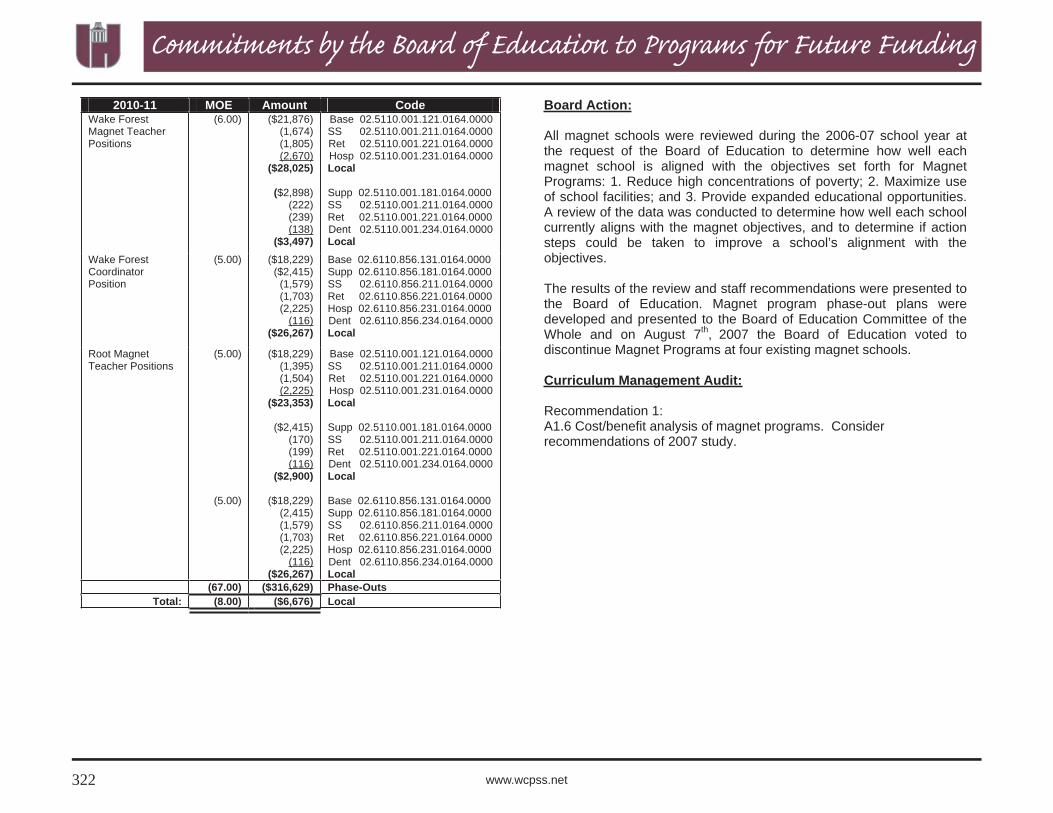
Magnet Schools1 320 $24,295 $0.18
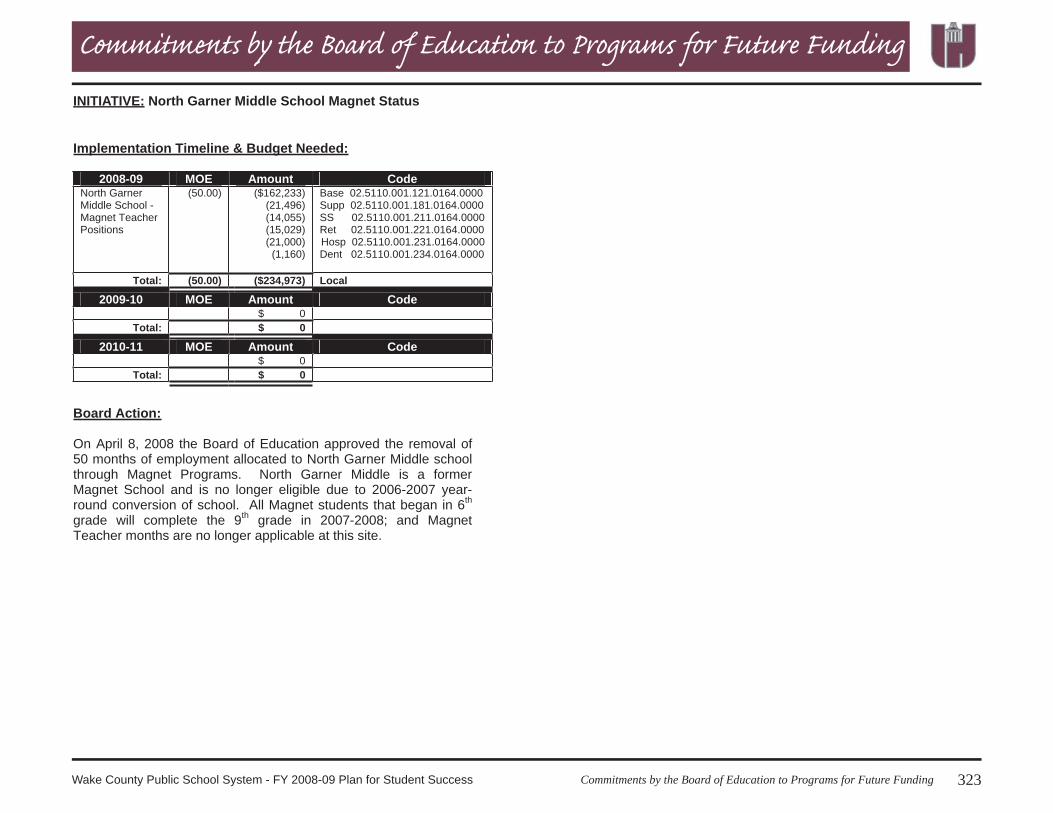
North Garner Middle School Magnet Status
323 ($234,973) ($1.69)
SUBTOTAL - Commitments by the Board of Education to Programs for Future Funding ($136,892) ($0.98)
(5) Additional expenditures are requested based on increased funding for new or existing programs. These requests are aligned to the strategic direc-tives of the school system.
New Programs and Increases to Existing Programs
Reference Page
Increase / (Decrease)
Cost / (Savings)
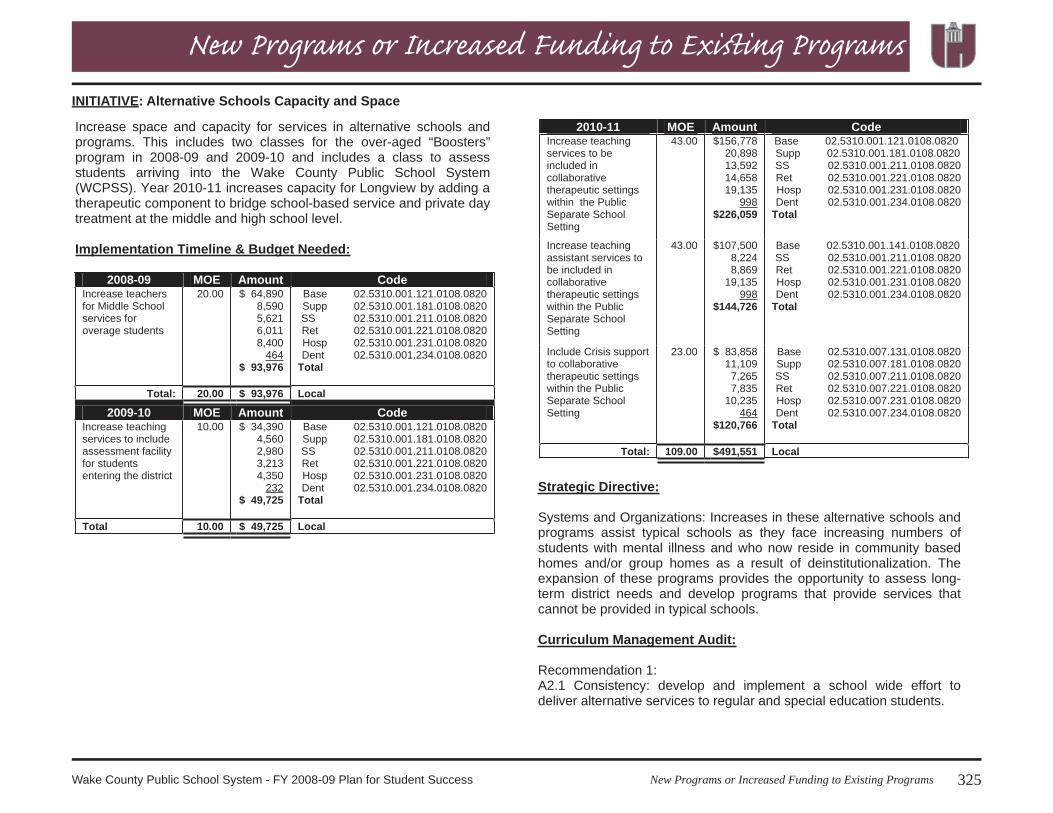
per StudentAlternative Schools Capacity and Space1 325 $93,976 $0.68
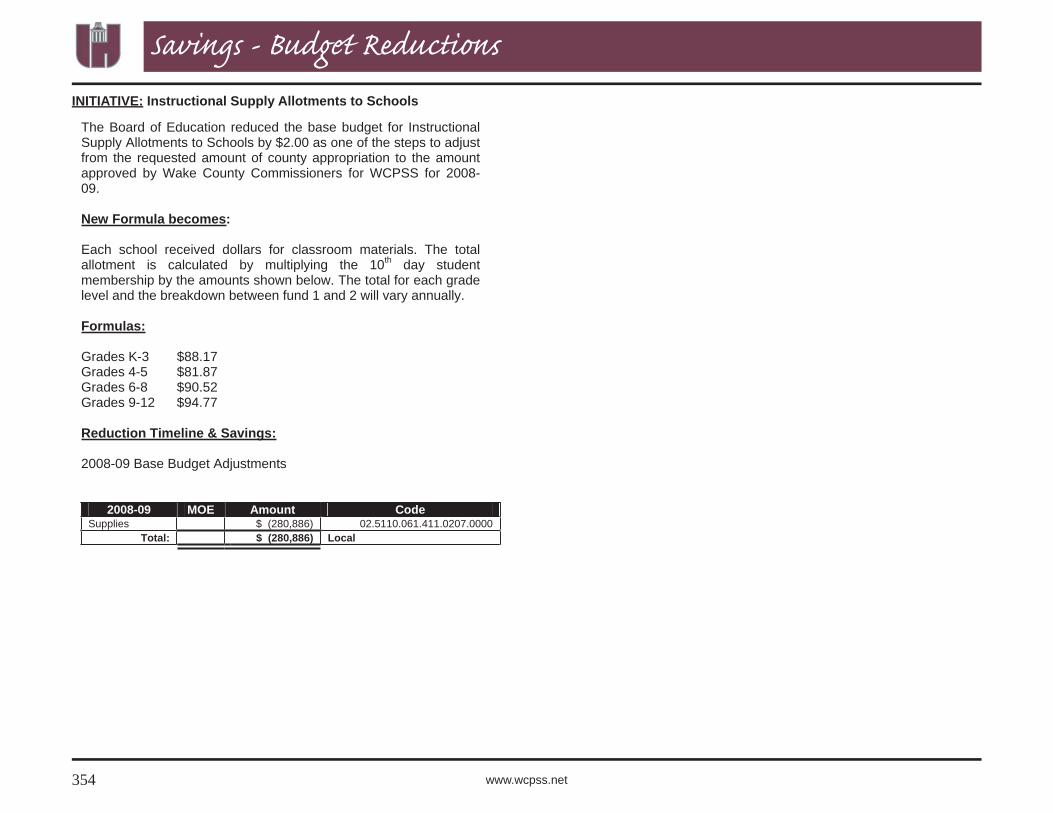
Reduce instructional supply allot-ment to schools by $2.00 354 ($280,886) ($2.02)
SUBTOTAL - Budget Reductions ($10,901,248) ($78.40)1Cases tie to the Curriculum Management Audit recommendations.
28 www.wcpss.net
Budget Highlights
Savings and ReductionsReference
PageIncrease / (Decrease)
Cost / (Savings)
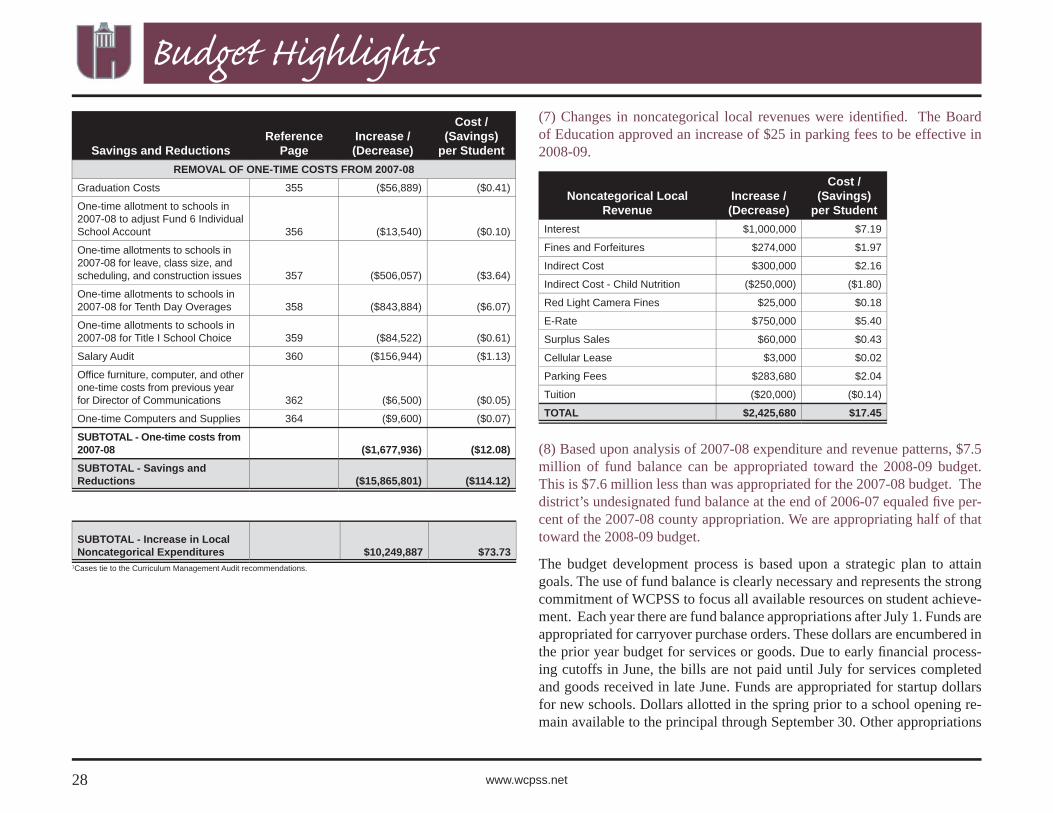
per StudentREMOVAL OF ONE-TIME COSTS FROM 2007-08
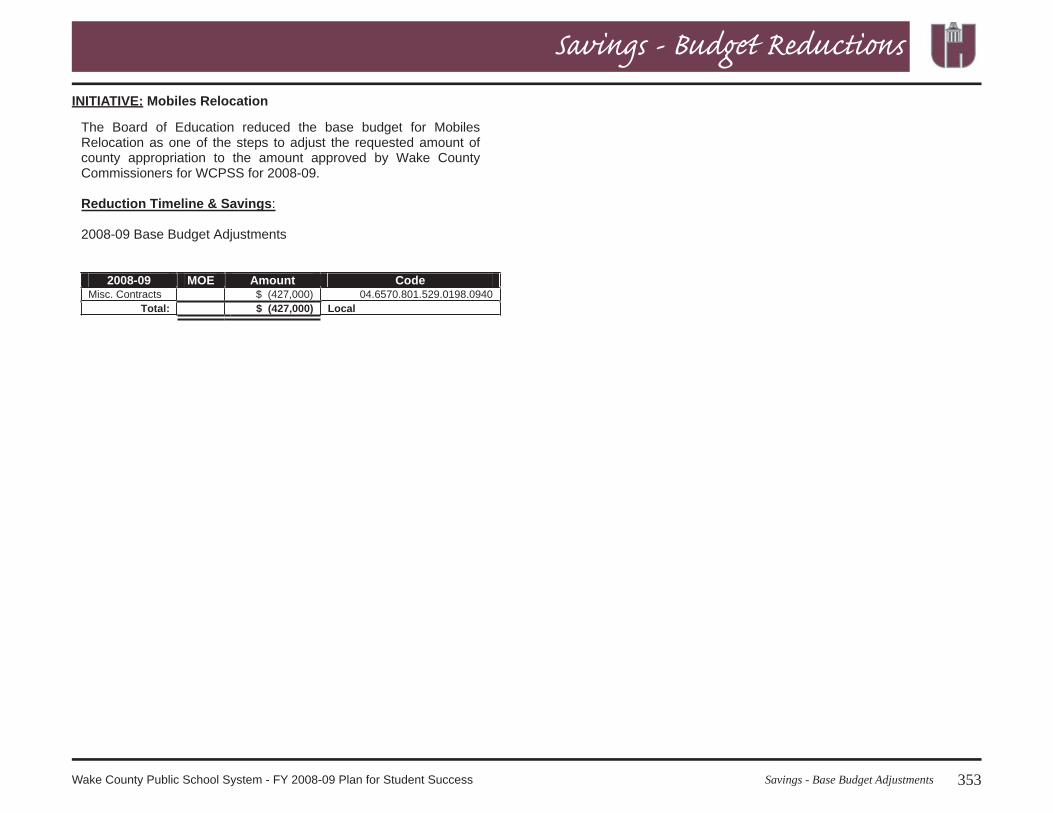
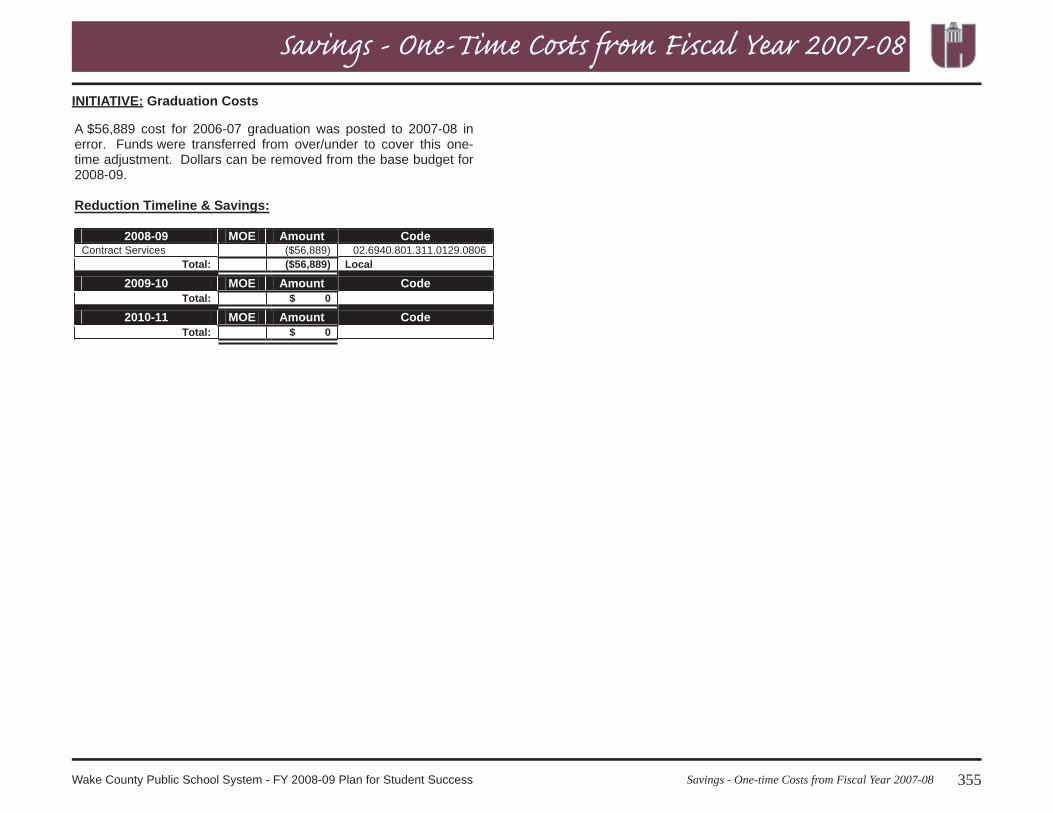
Graduation Costs 355 ($56,889) ($0.41)
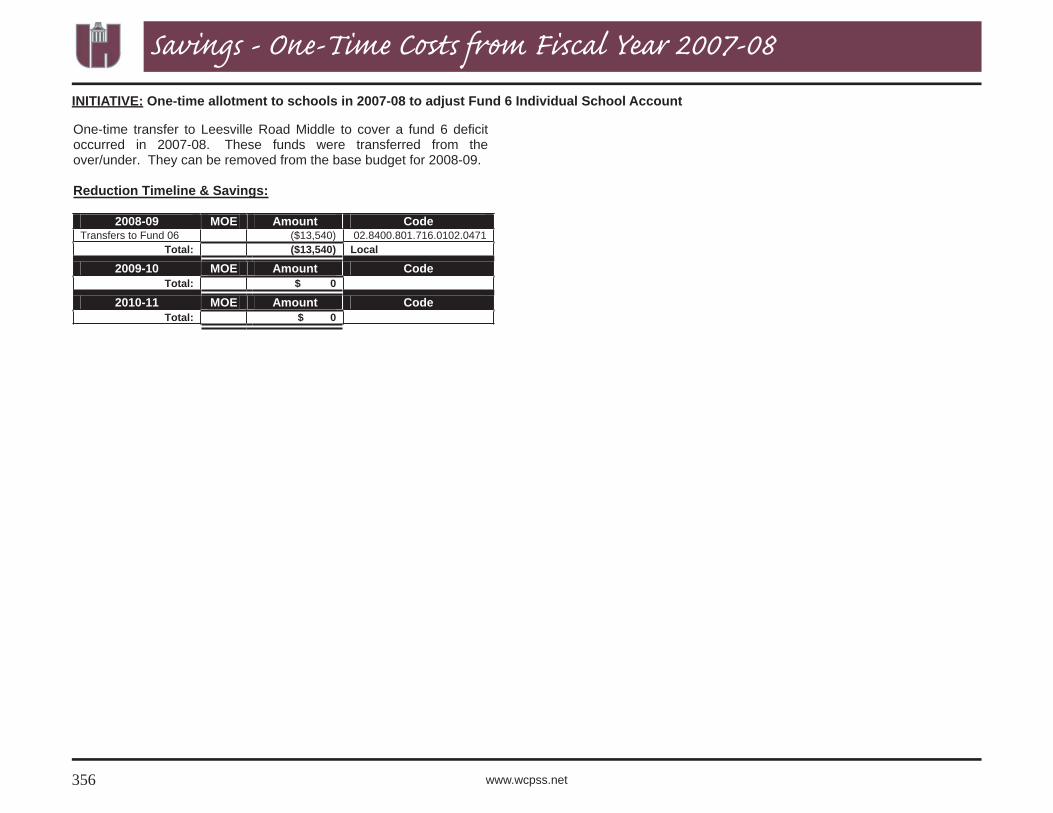
One-time allotment to schools in 2007-08 to adjust Fund 6 Individual School Account 356 ($13,540) ($0.10)
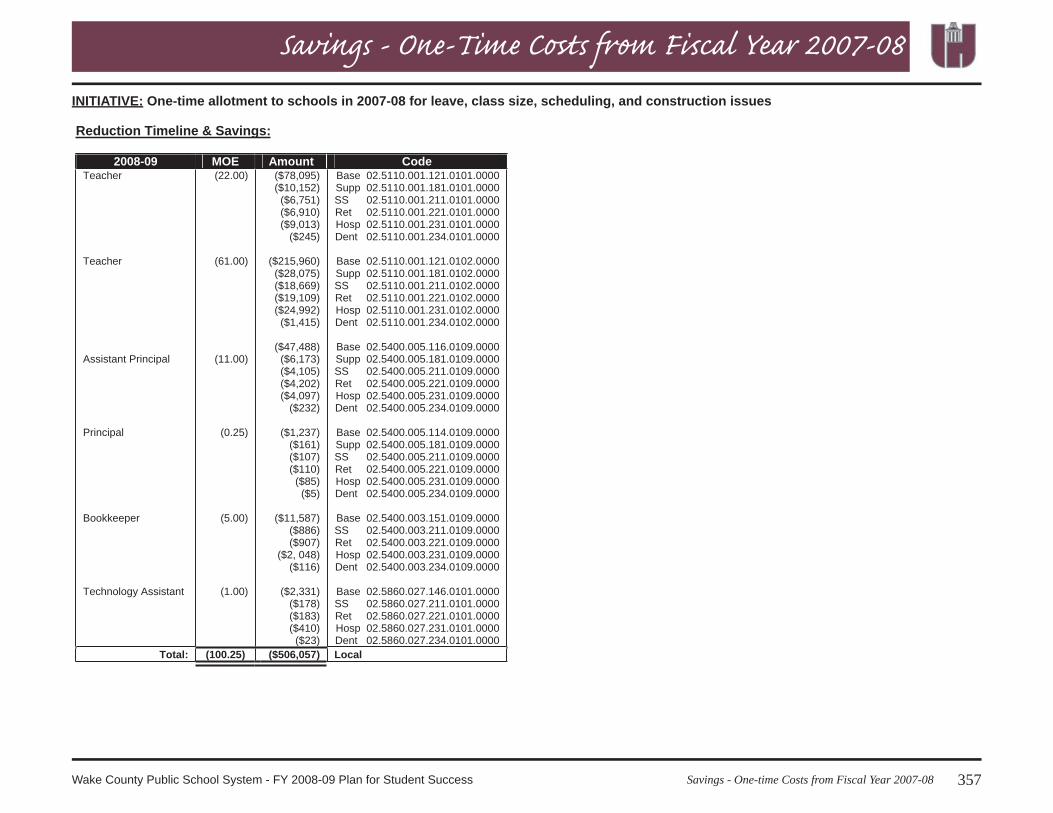
One-time allotments to schools in 2007-08 for leave, class size, and scheduling, and construction issues 357 ($506,057) ($3.64)
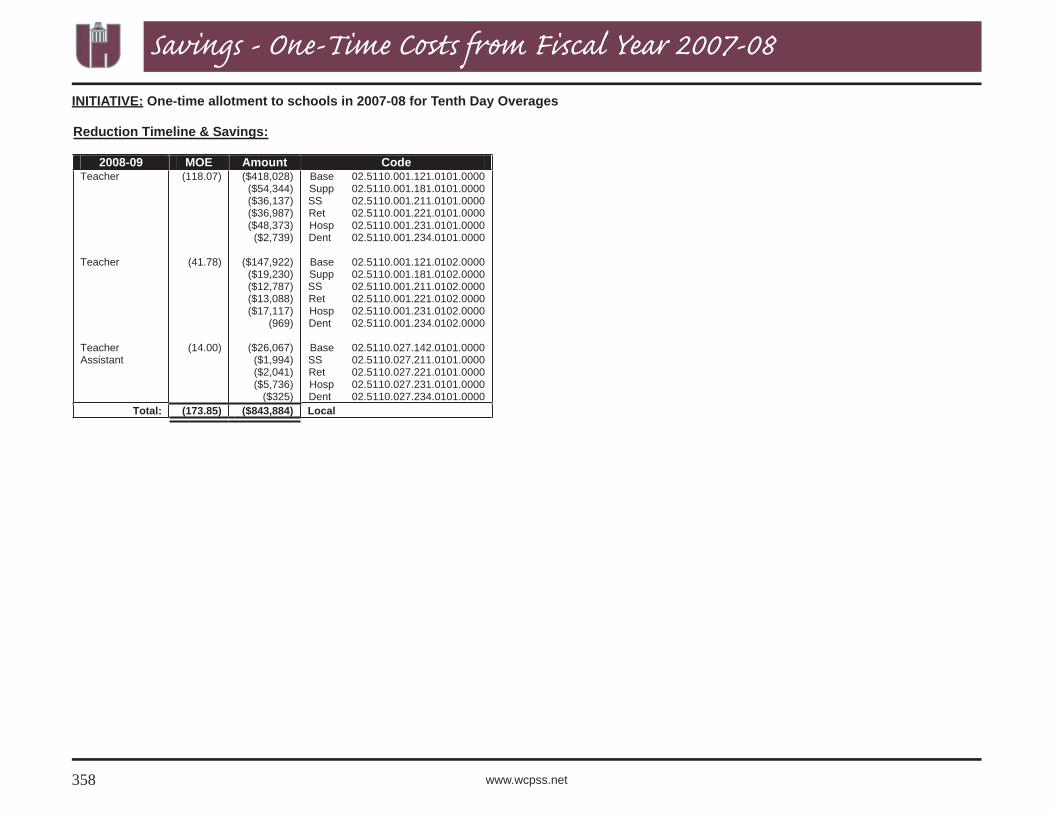
One-time allotments to schools in 2007-08 for Tenth Day Overages 358 ($843,884) ($6.07)
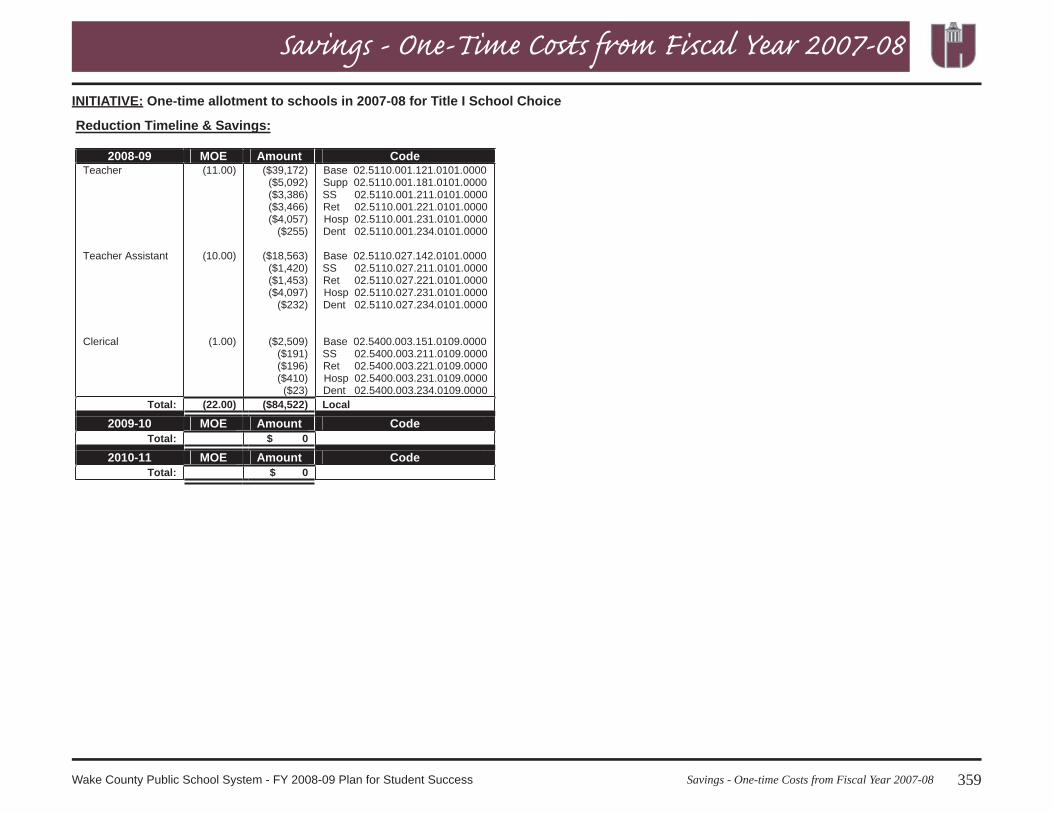
One-time allotments to schools in 2007-08 for Title I School Choice 359 ($84,522) ($0.61)
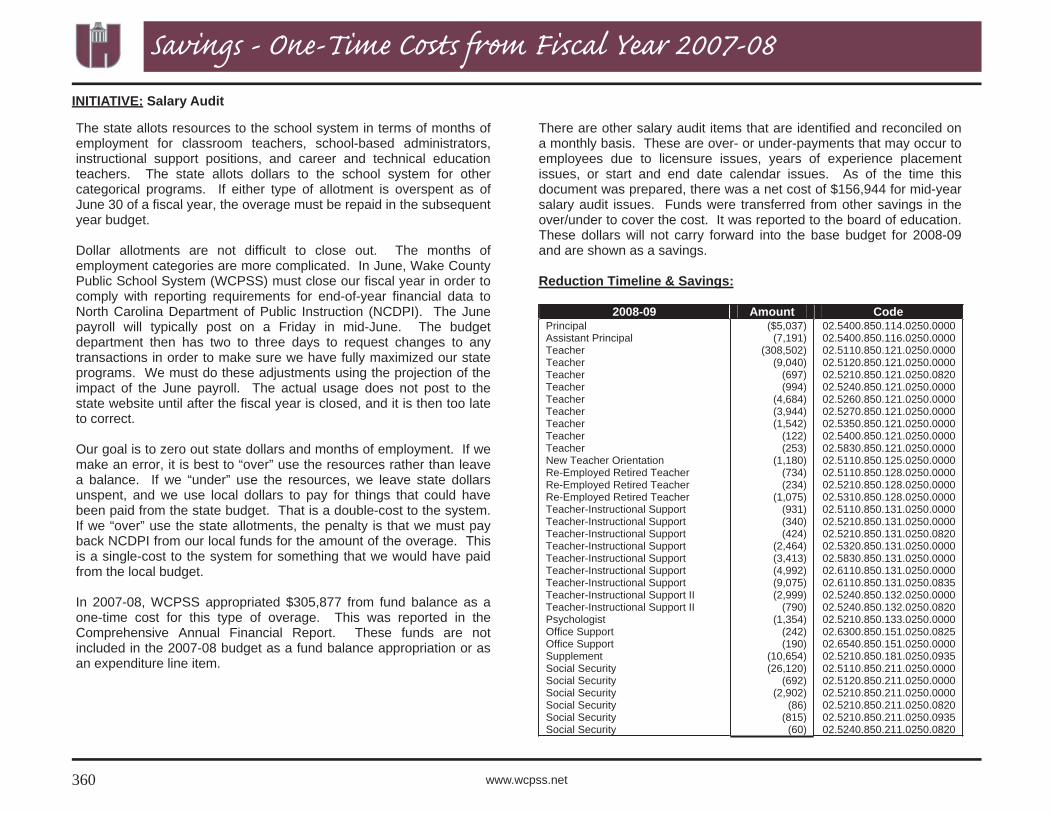
Salary Audit 360 ($156,944) ($1.13)
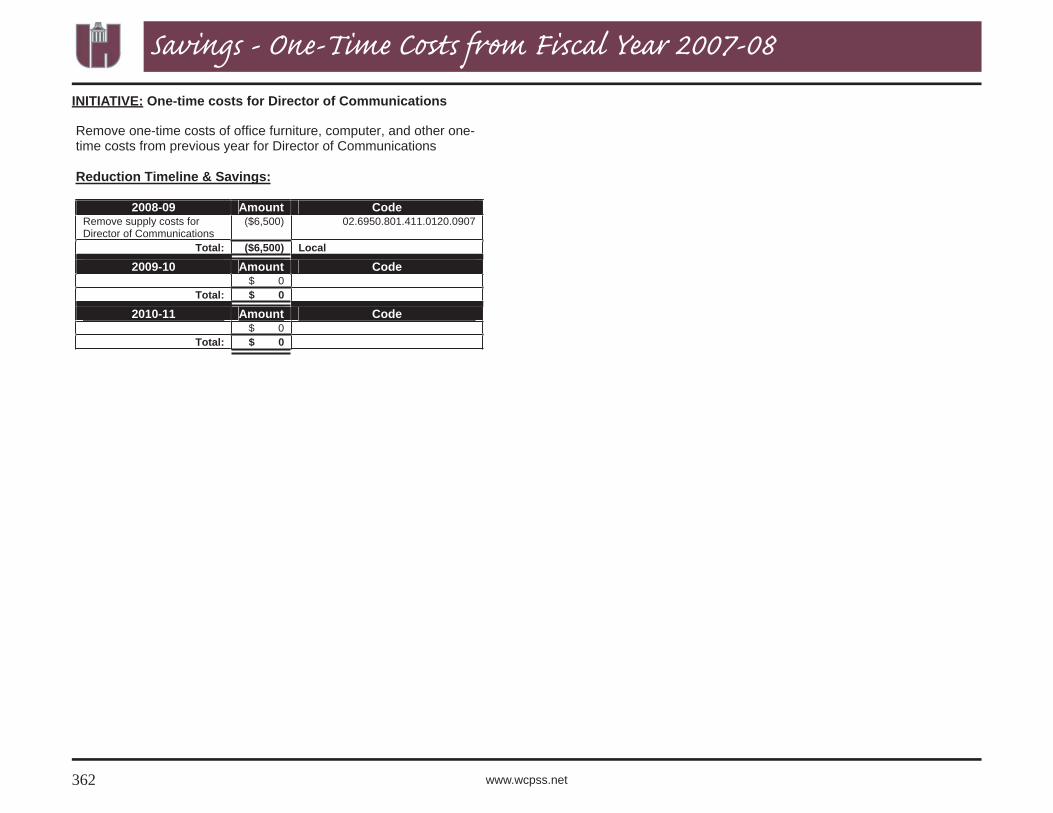
Offi ce furniture, computer, and other one-time costs from previous year for Director of Communications 362 ($6,500) ($0.05)
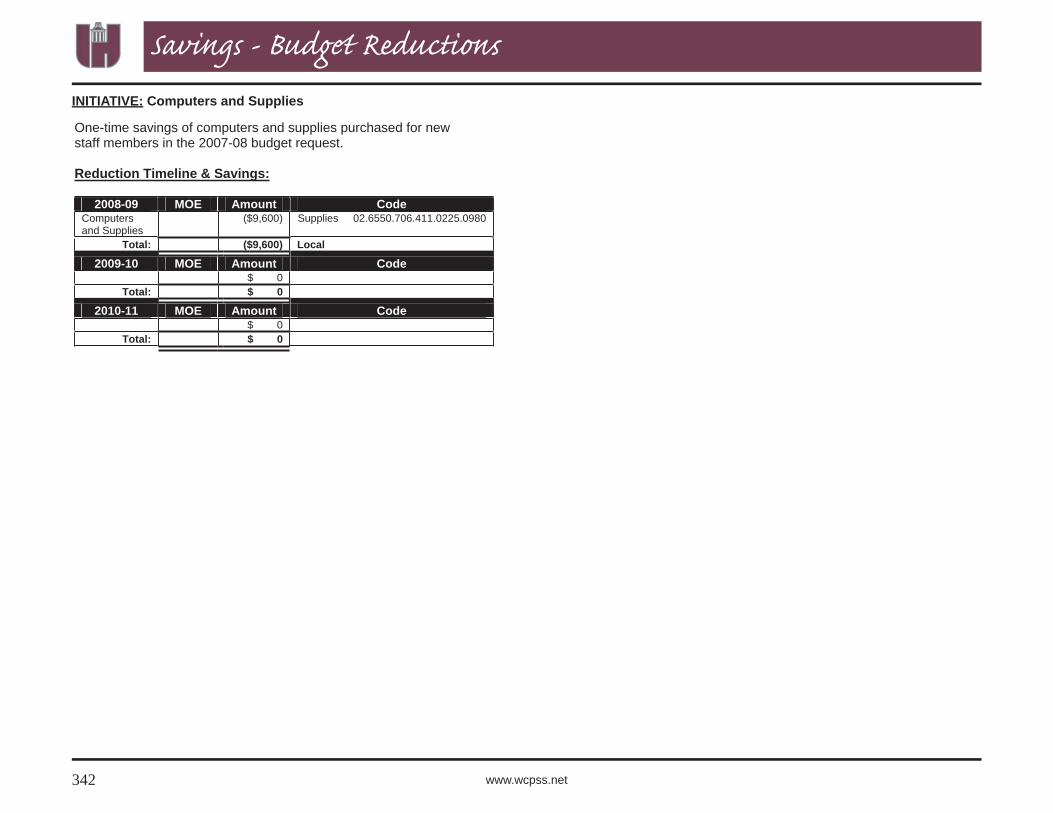
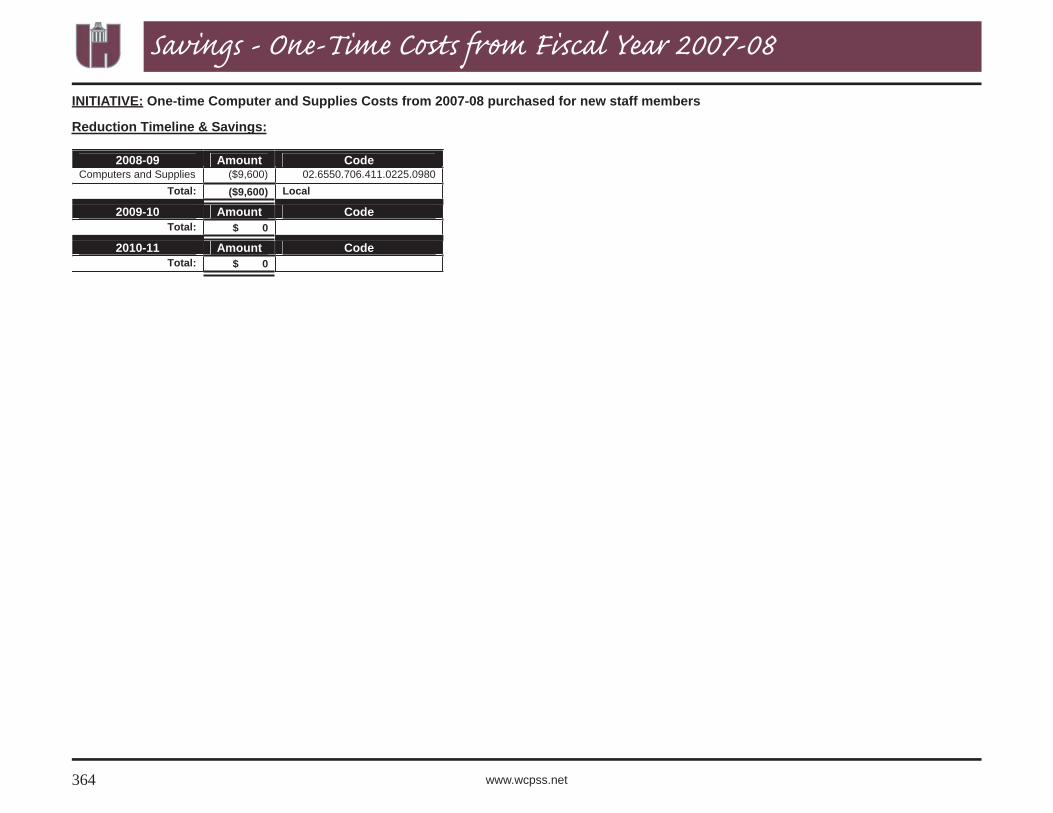
One-time Computers and Supplies 364 ($9,600) ($0.07)
SUBTOTAL - One-time costs from 2007-08 ($1,677,936) ($12.08)SUBTOTAL - Savings and Reductions ($15,865,801) ($114.12)
SUBTOTAL - Increase in Local Noncategorical Expenditures $10,249,887 $73.73
(7) Changes in noncategorical local revenues were identifi ed. The Board of Education approved an increase of $25 in parking fees to be effective in 2008-09.
(8) Based upon analysis of 2007-08 expenditure and revenue patterns, $7.5 million of fund balance can be appropriated toward the 2008-09 budget. This is $7.6 million less than was appropriated for the 2007-08 budget. The district’s undesignated fund balance at the end of 2006-07 equaled fi ve per-cent of the 2007-08 county appropriation. We are appropriating half of that toward the 2008-09 budget.
The budget development process is based upon a strategic plan to attain goals. The use of fund balance is clearly necessary and represents the strong commitment of WCPSS to focus all available resources on student achieve-ment. Each year there are fund balance appropriations after July 1. Funds are appropriated for carryover purchase orders. These dollars are encumbered in the prior year budget for services or goods. Due to early fi nancial process-ing cutoffs in June, the bills are not paid until July for services completed and goods received in late June. Funds are appropriated for startup dollars for new schools. Dollars allotted in the spring prior to a school opening re-main available to the principal through September 30. Other appropriations
1Cases tie to the Curriculum Management Audit recommendations.
29Budget HighlightsWake County Public School System - FY 2008-09 Plan for Student Success
Budget Highlightsare approved by the board for one-time costs such as salary audit, curricu-lum audit, and insurance items. In 2007-08 the additional appropriations for one-time costs totalled 3.5 million. They are not included as estimates for 2008-09. We removed these one-time costs from the revenue and expendi-ture budgets. They are not refl ected in the above charts. There will be car-ryover purchase orders in 2008-09. This fi gure will not be included until fi rst quarter 2008 budget transactions are prepared for the board.
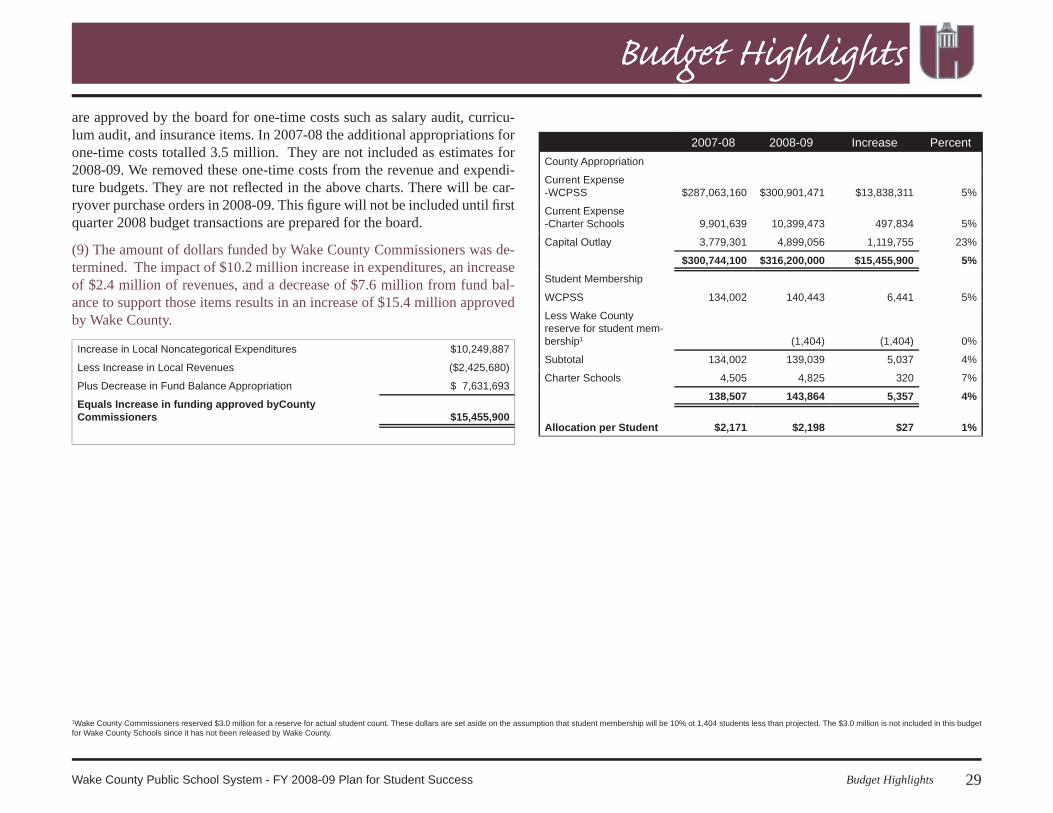
(9) The amount of dollars funded by Wake County Commissioners was de-termined. The impact of $10.2 million increase in expenditures, an increase of $2.4 million of revenues, and a decrease of $7.6 million from fund bal-ance to support those items results in an increase of $15.4 million approved by Wake County.
Increase in Local Noncategorical Expenditures $10,249,887
Less Increase in Local Revenues ($2,425,680)
Plus Decrease in Fund Balance Appropriation $ 7,631,693
Equals Increase in funding approved byCounty Commissioners $15,455,900
Less Wake County reserve for student mem-bership1 (1,404) (1,404) 0%
Subtotal 134,002 139,039 5,037 4%
Charter Schools 4,505 4,825 320 7%
138,507 143,864 5,357 4%
Allocation per Student $2,171 $2,198 $27 1%
1Wake County Commissioners reserved $3.0 million for a reserve for actual student count. These dollars are set aside on the assumption that student membership will be 10% ot 1,404 students less than projected. The $3.0 million is not included in this budget for Wake County Schools since it has not been released by Wake County.
30 www.wcpss.net
Budget Highlights
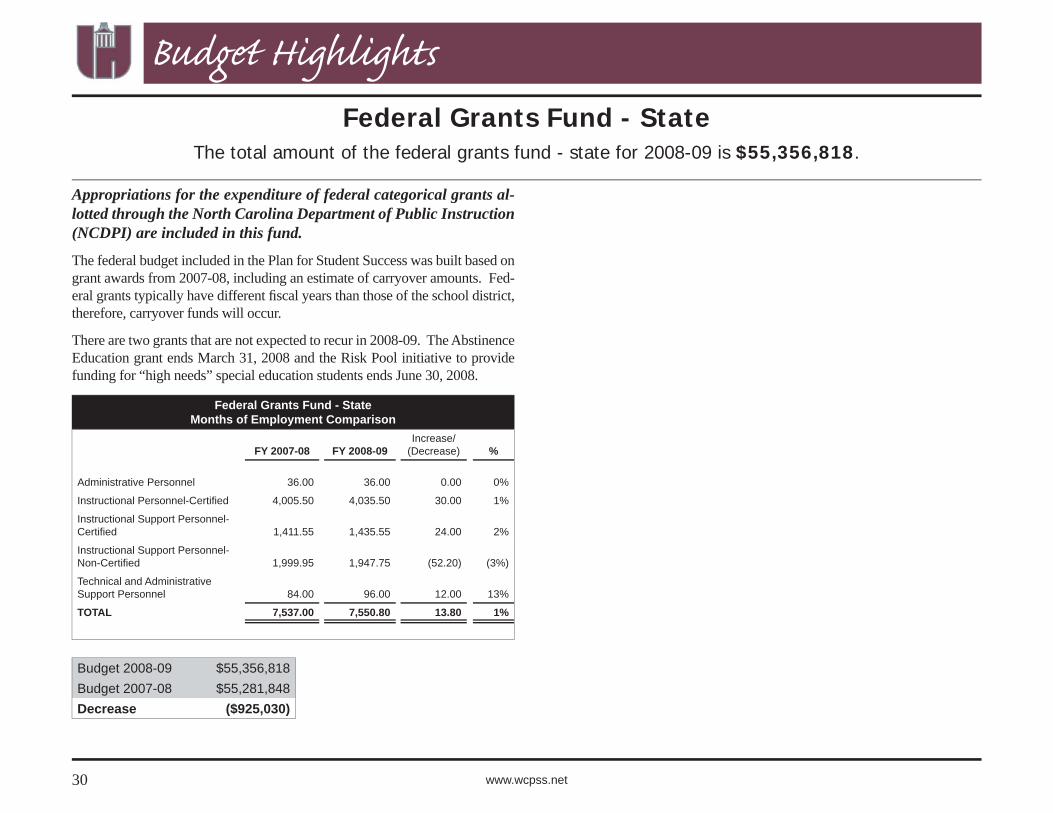
Federal Grants Fund - StateThe total amount of the federal grants fund - state for 2008-09 is $55,356,818.
Appropriations for the expenditure of federal categorical grants al-lotted through the North Carolina Department of Public Instruction (NCDPI) are included in this fund.
The federal budget included in the Plan for Student Success was built based on grant awards from 2007-08, including an estimate of carryover amounts. Fed-eral grants typically have different fi scal years than those of the school district, therefore, carryover funds will occur.
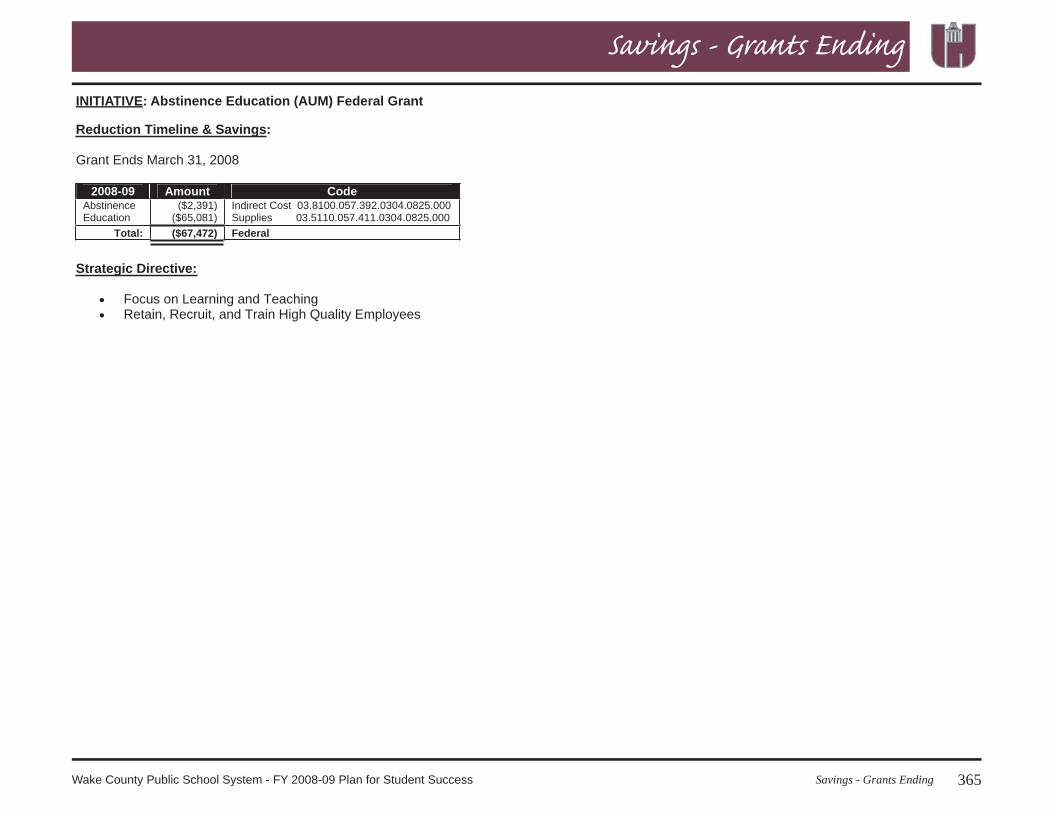
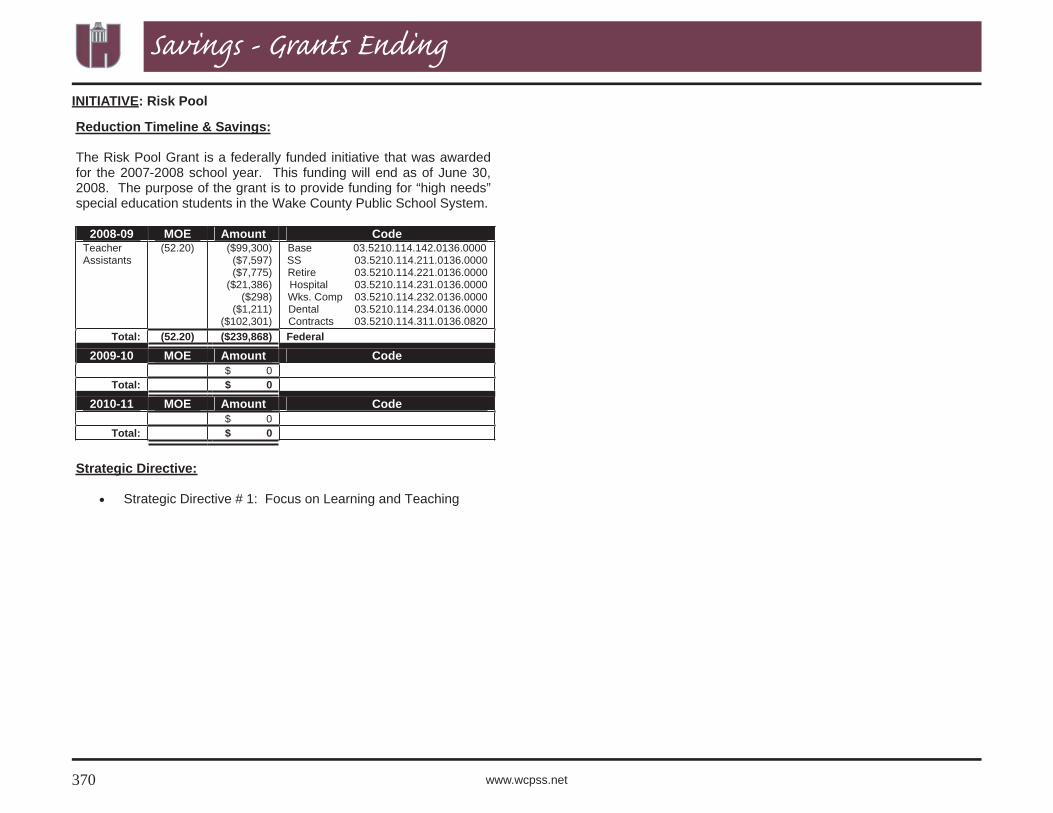
There are two grants that are not expected to recur in 2008-09. The Abstinence Education grant ends March 31, 2008 and the Risk Pool initiative to provide funding for “high needs” special education students ends June 30, 2008.
Federal Grants Fund - StateMonths of Employment Comparison
FY 2007-08 FY 2008-09Increase/
(Decrease) %
Administrative Personnel 36.00 36.00 0.00 0%
Instructional Personnel-Certifi ed 4,005.50 4,035.50 30.00 1%
Instructional Support Personnel-Certifi ed 1,411.55 1,435.55 24.00 2%
Instructional Support Personnel-Non-Certifi ed 1,999.95 1,947.75 (52.20) (3%)
Technical and Administrative Support Personnel 84.00 96.00 12.00 13%
31Budget HighlightsWake County Public School System - FY 2008-09 Plan for Student Success
Budget Highlights
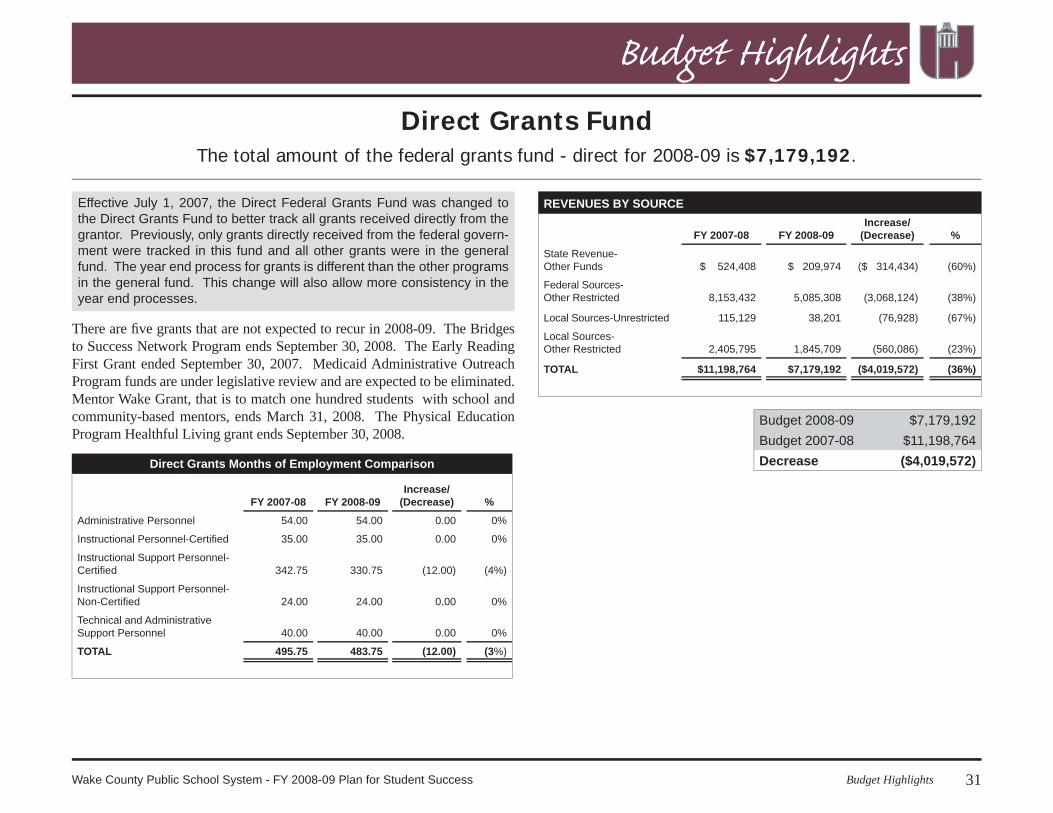
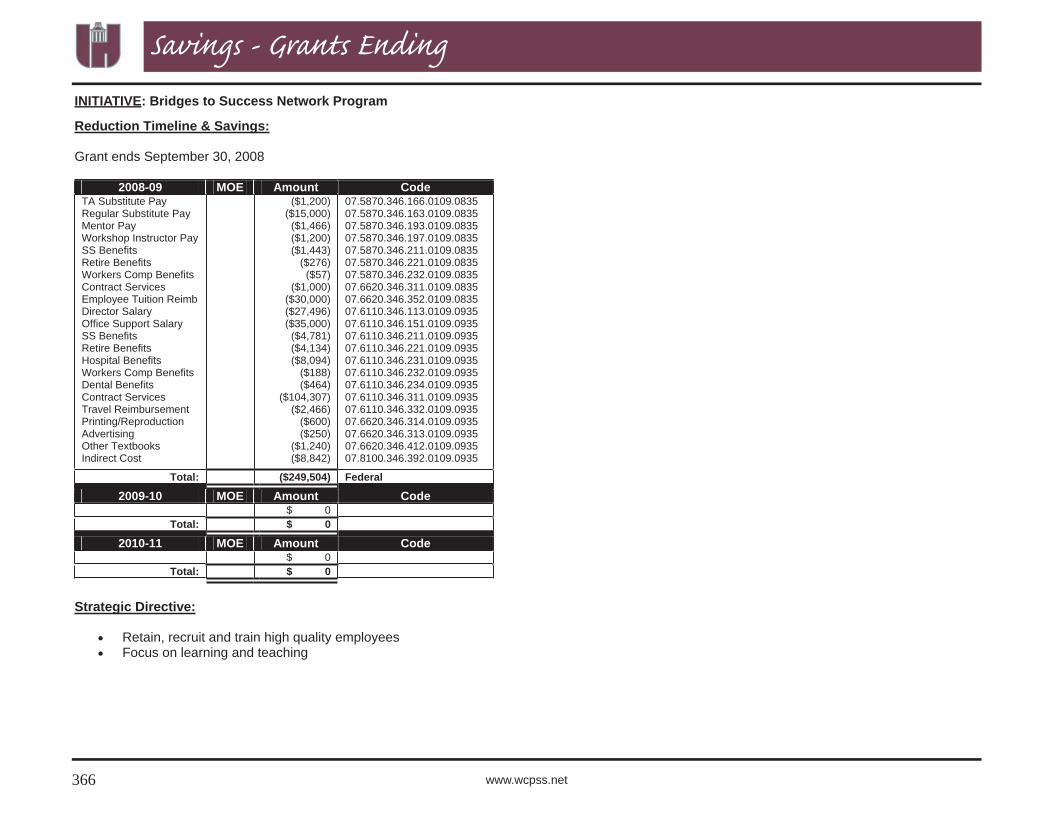
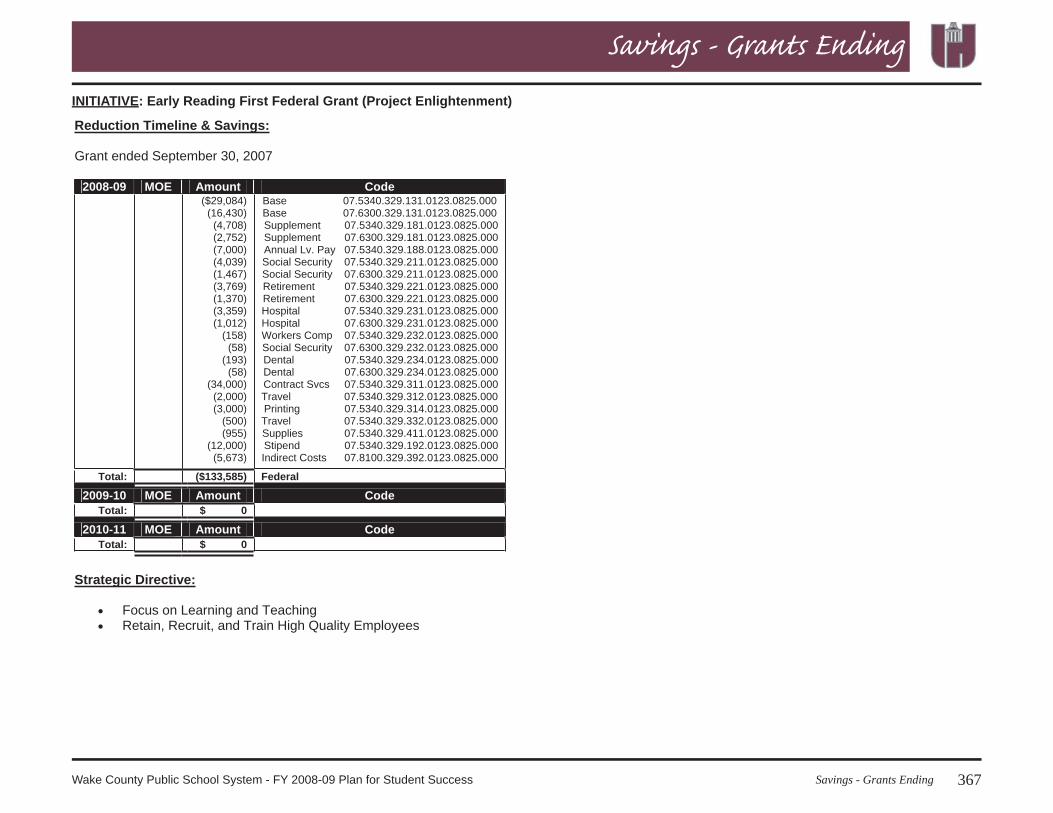
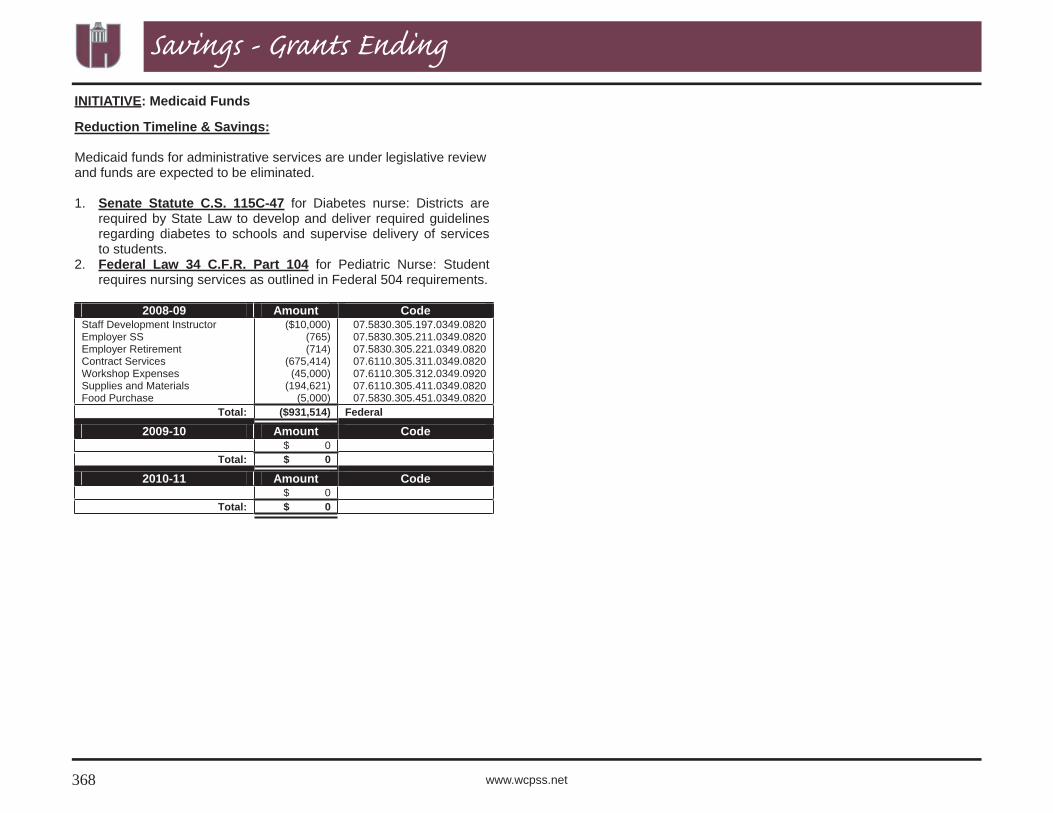
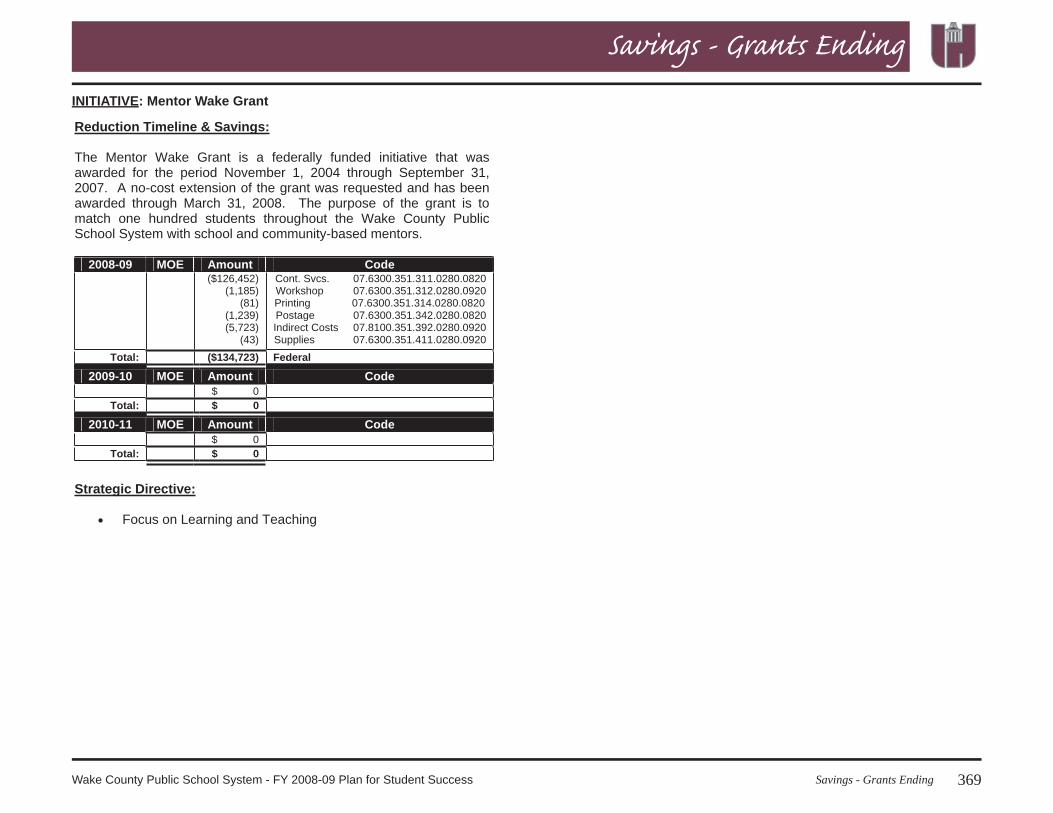
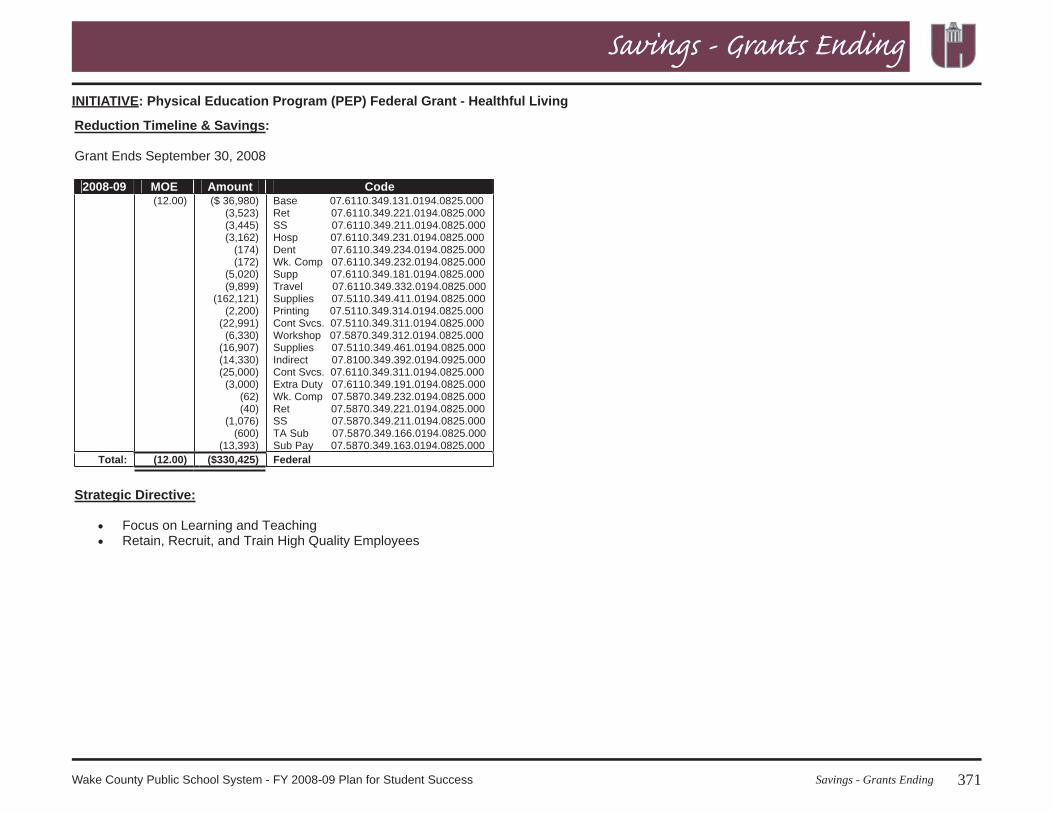
There are fi ve grants that are not expected to recur in 2008-09. The Bridges to Success Network Program ends September 30, 2008. The Early Reading First Grant ended September 30, 2007. Medicaid Administrative Outreach Program funds are under legislative review and are expected to be eliminated. Mentor Wake Grant, that is to match one hundred students with school and community-based mentors, ends March 31, 2008. The Physical Education Program Healthful Living grant ends September 30, 2008.
Direct Grants Months of Employment Comparison
FY 2007-08 FY 2008-09Increase/
(Decrease) %
Administrative Personnel 54.00 54.00 0.00 0%
Instructional Personnel-Certifi ed 35.00 35.00 0.00 0%
Instructional Support Personnel-Certifi ed 342.75 330.75 (12.00) (4%)
Instructional Support Personnel-Non-Certifi ed 24.00 24.00 0.00 0%
Technical and Administrative Support Personnel 40.00 40.00 0.00 0%
TOTAL 495.75 483.75 (12.00) (3%)
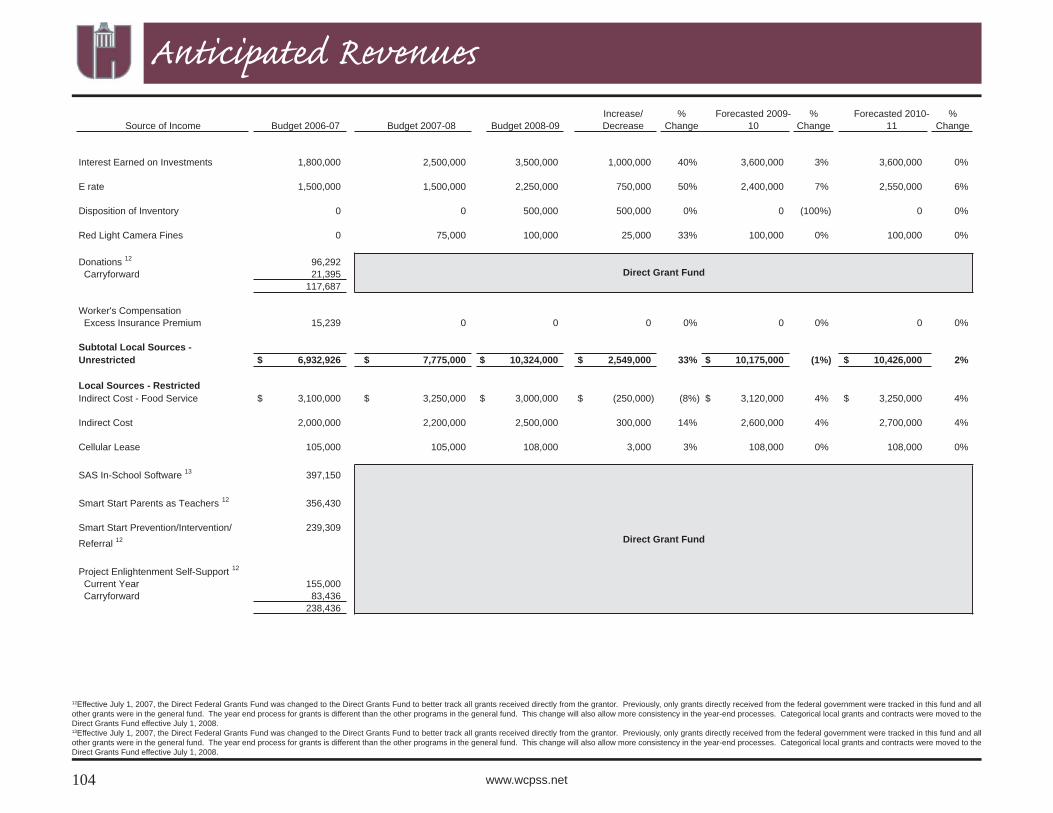
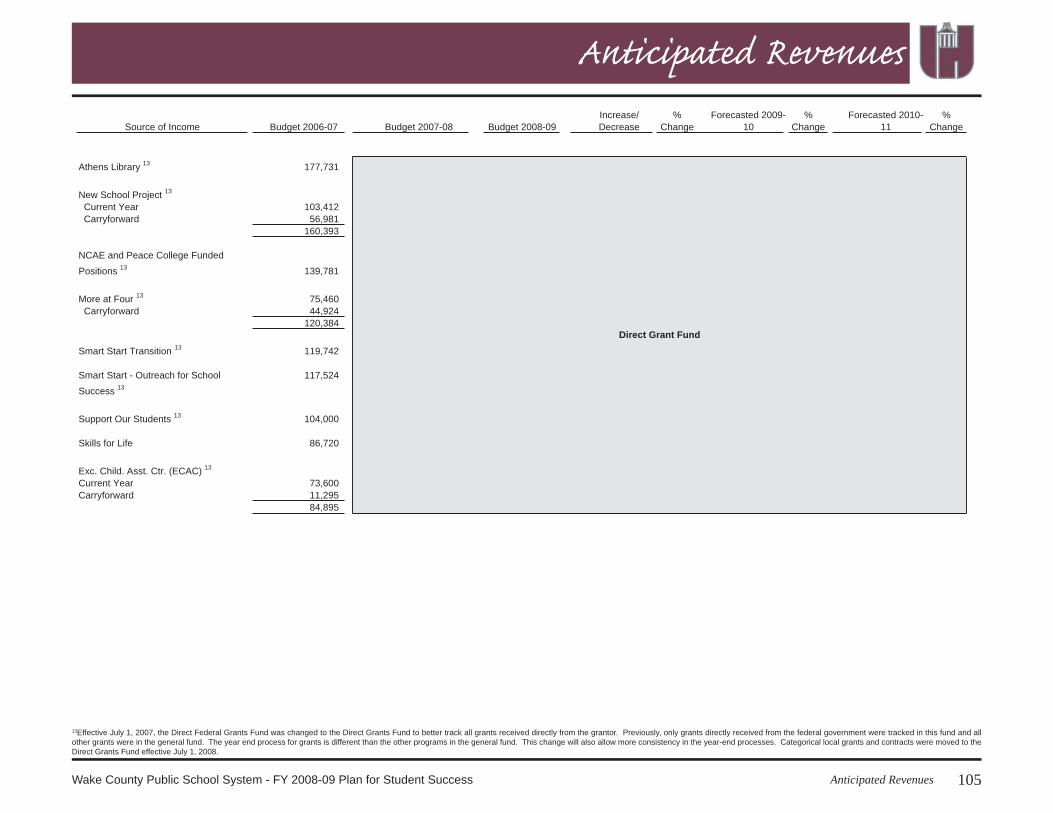
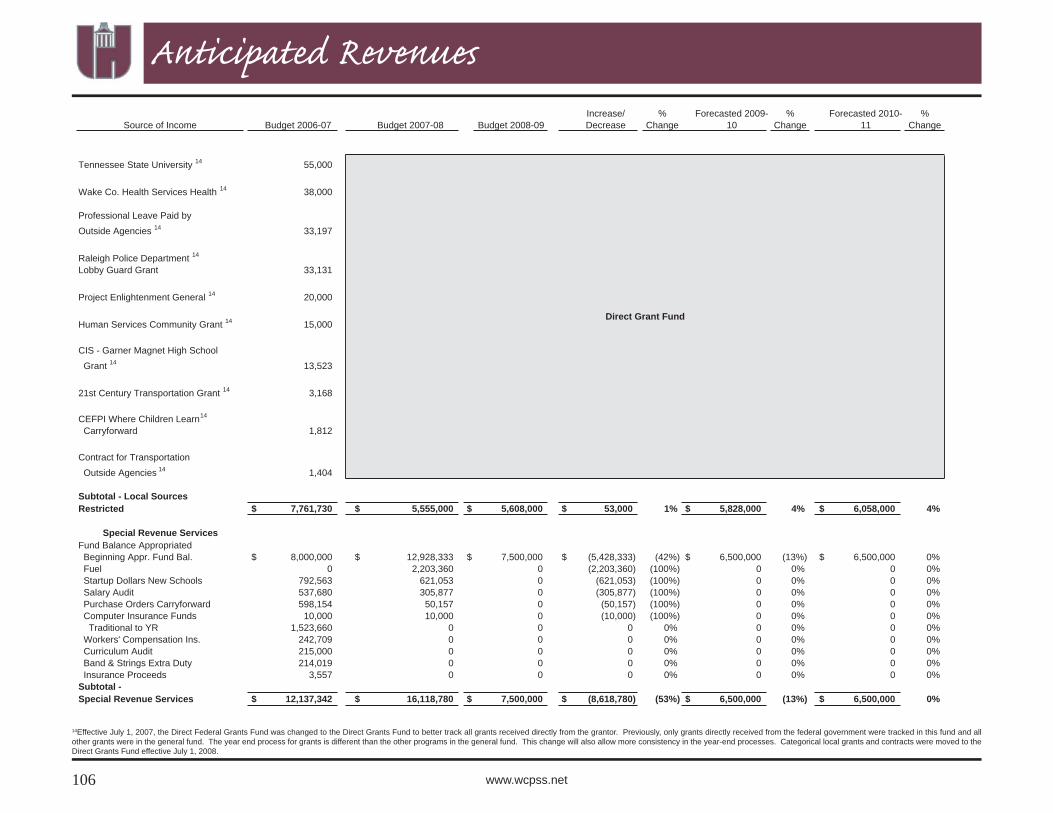
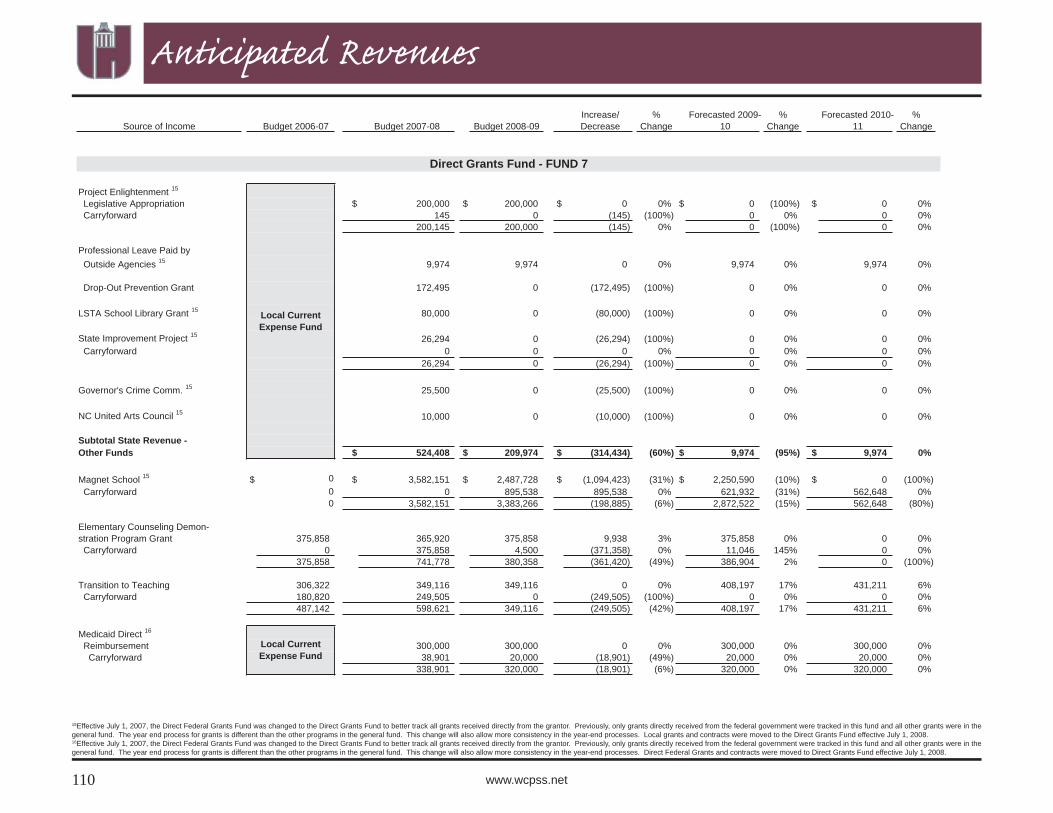
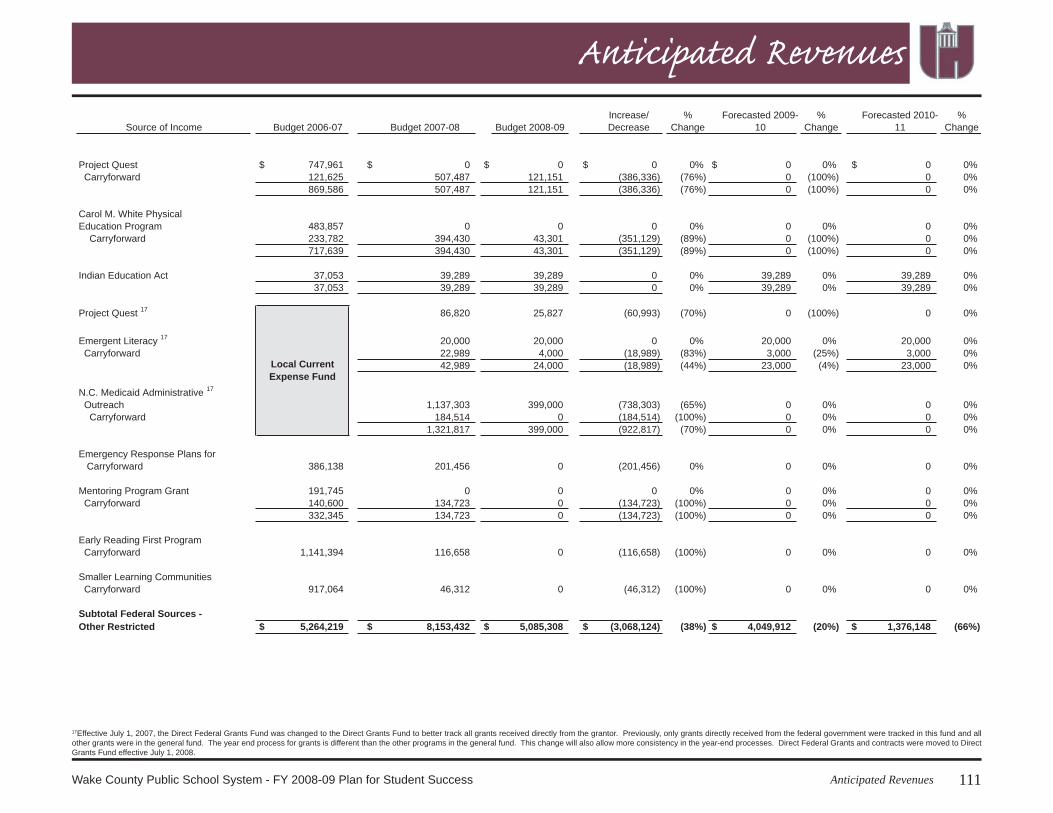
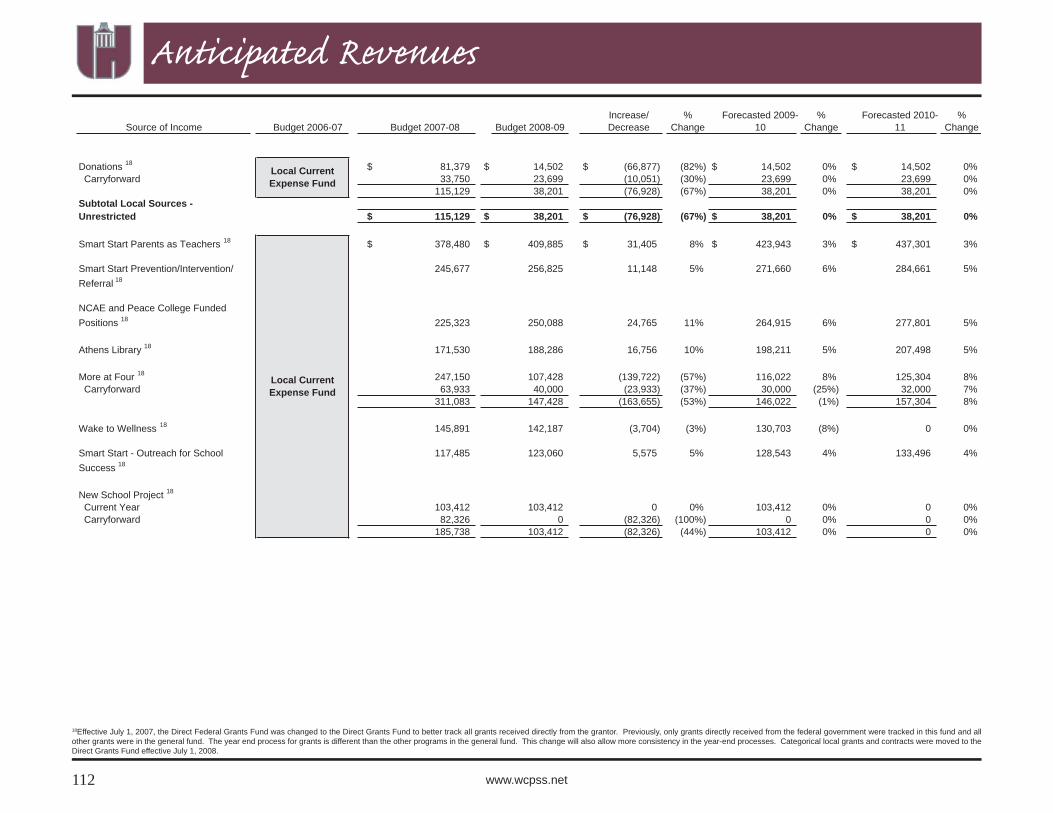
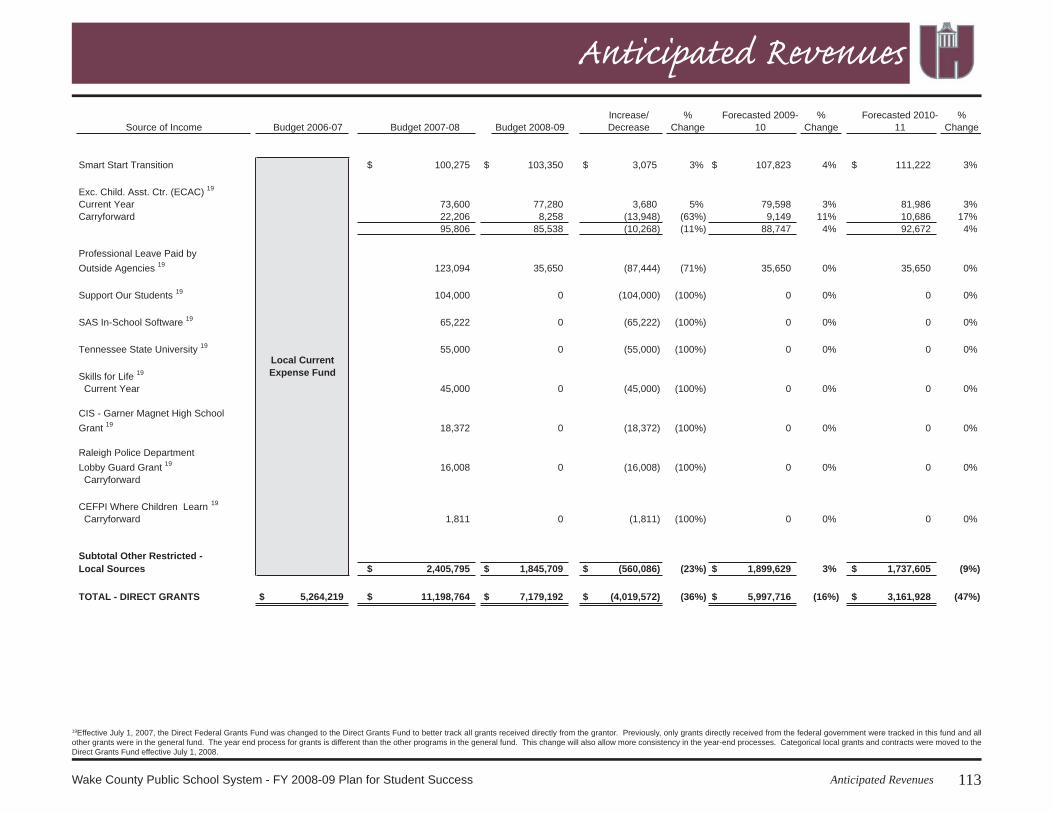
Effective July 1, 2007, the Direct Federal Grants Fund was changed to the Direct Grants Fund to better track all grants received directly from the grantor. Previously, only grants directly received from the federal govern-ment were tracked in this fund and all other grants were in the general fund. The year end process for grants is different than the other programs in the general fund. This change will also allow more consistency in the year end processes.
Direct Grants FundThe total amount of the federal grants fund - direct for 2008-09 is $7,179,192.
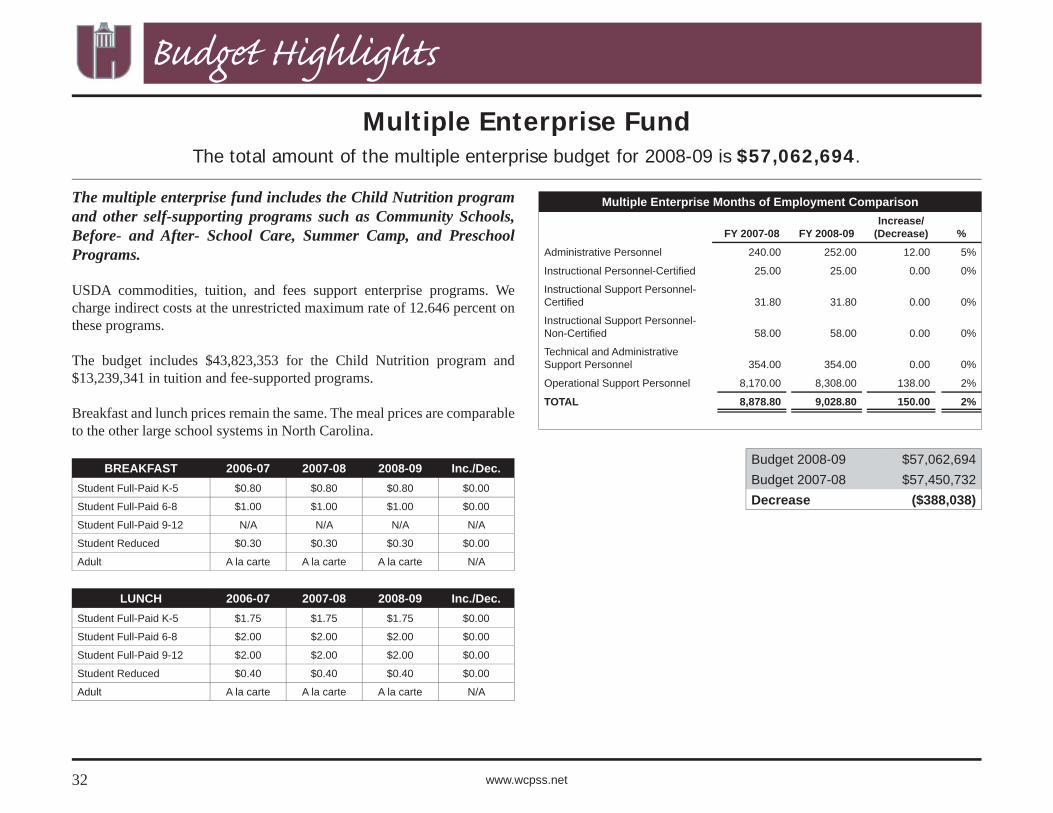
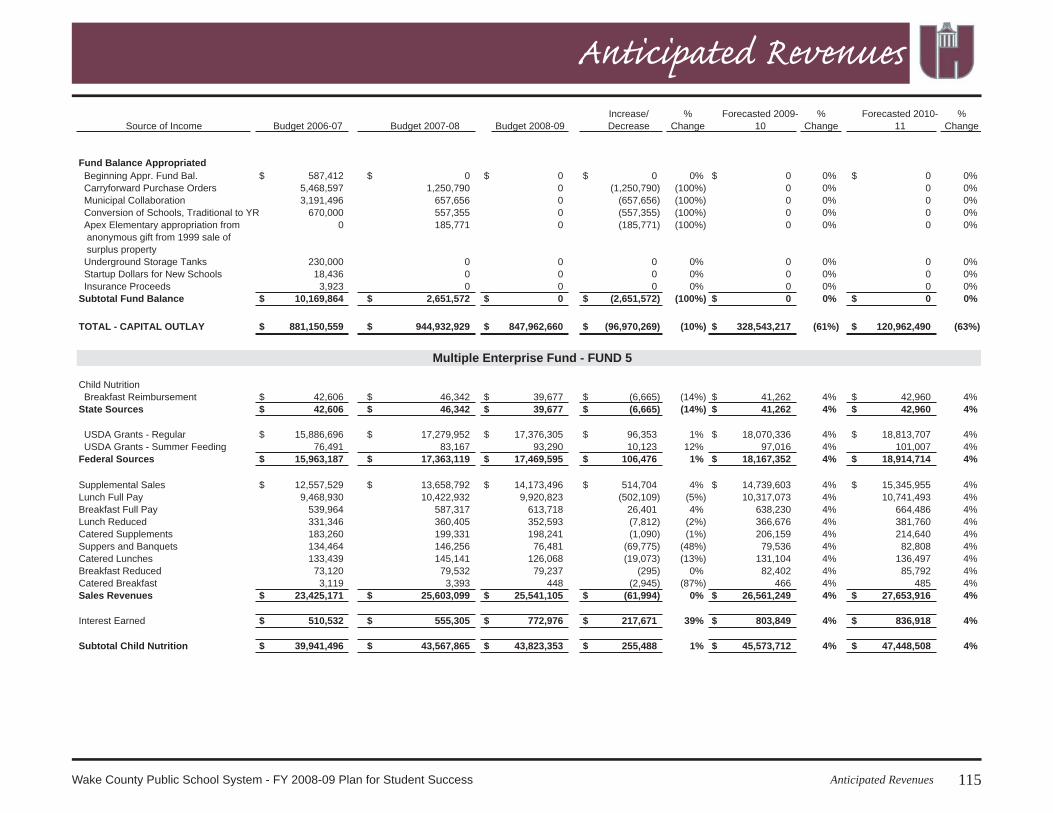
The multiple enterprise fund includes the Child Nutrition program and other self-supporting programs such as Community Schools, Before- and After- School Care, Summer Camp, and Preschool Programs.
USDA commodities, tuition, and fees support enterprise programs. We charge indirect costs at the unrestricted maximum rate of 12.646 percent on these programs.
The budget includes $43,823,353 for the Child Nutrition program and $13,239,341 in tuition and fee-supported programs.
Breakfast and lunch prices remain the same. The meal prices are comparable to the other large school systems in North Carolina.
33Budget HighlightsWake County Public School System - FY 2008-09 Plan for Student Success
Budget Highlights
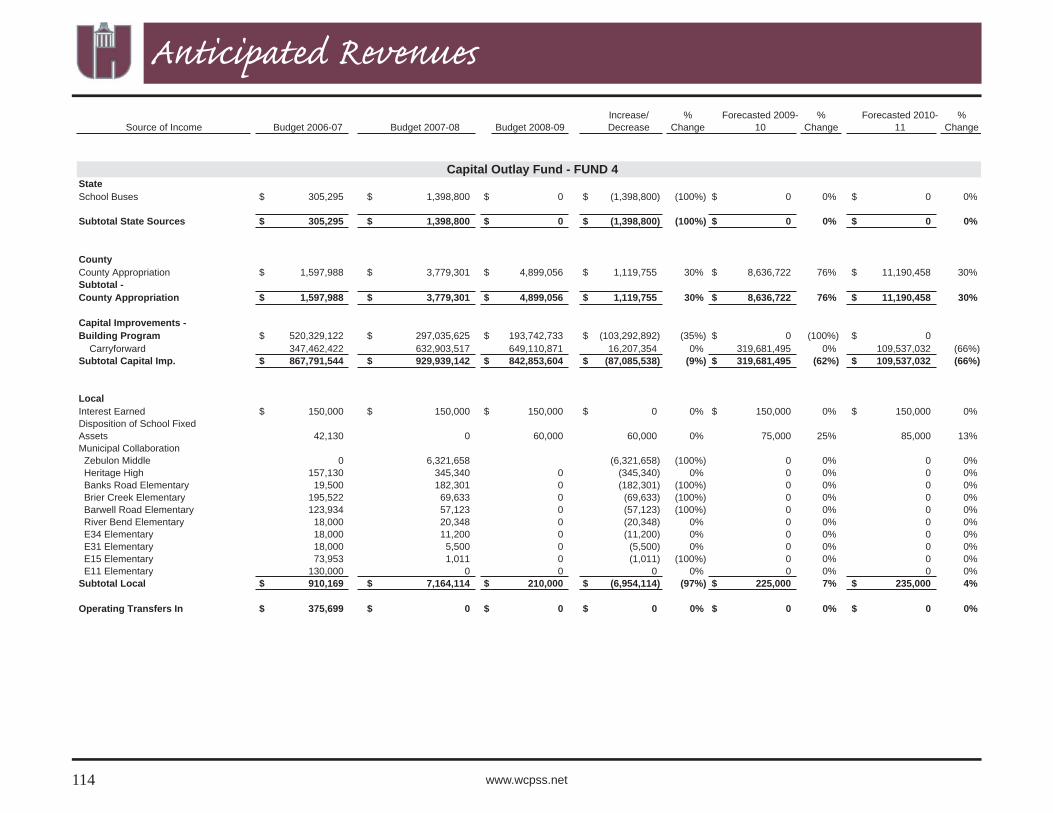
The capital budget contains two parts: (1) Capital Building Fund, and (2) Operating Budget Capital Outlay Fund.
The budget includes $842,853,604 in building program funds, $4,899,056 county appropriation, $150,000 interest earned and $60,000 disposition of school fi xed assets.
Developing the budget based on the school board’s Goal 2008 requires fo-cusing on classroom improvements and coordinating the needs of several departments. WCPSS staff and support personnel provide the services to enhance the education of our children.
Capital Building FundEnrollment in WCPSS is expected to grow to over 154,000 students by the 2010-11 school year - an increase of 28 percent over the 2005-06 school year. This means that more schools and more support facilities for schools will be needed prior to the arrival of these students. Capital funding provided by PLAN 2004 allowed the opening of four elementary schools and two high schools in 2006-07 and will provide six additional elementary school buildings for 2007-08. A new Capital Improvement Plan (CIP) was needed to address enrollment growth from 2007 through 2010. After extensive re-view and discussion of staff proposals, the Board of Education adopted a Capital Improvement Program with a total cost of $1,055,874,837. Key con-siderations in the fi nal CIP were: the limitation of year-round conversion in elementary schools to the level required to generate 3,000 seats to address crowding in 2007-08; conversion of some middle schools to year-round cal-endars in order to generate at least some of the 2,000 additional seats needed in middle schools by 2008-09; and to provide families in elementary and middle school the opportunity to have siblings on the same track. In Novem-ber 2006, Wake County voters approved the bond referendum for CIP 2006, which provides funds for construction of 17 new schools, extensive renova-
Capital Outlay FundThe total amount of the capital outlay budget for 2008-09 is $847,962,660.
tion of 13 existing schools, purchase of land for 13 future schools, purchase of urgently needed technology upgrades, and many other critical projects.
The CIP, or capital building fund, provides adequate classroom space for learning and teaching to serve up to a 35 percent increase in enrollment over fi ve years, and makes some progress on deferred major renovation and life-cycle projects at existing schools to protect student health and safety and maintain adequate instructional environments. The plan also addresses repairs and maintenance projects at nearly 100 schools across the county. These deferred life-cycle replacements involve roofs, air conditioning sys-tems and boiler replacements. To determine renovation needs, WCPSS eval-uates building system life-cycle costs, and projects major renovations on a 40-year cycle. Schools are prioritized based on a facility condition index - a ratio of the cost of work needed at the building divided by the building replacement value.
Operating Capital Outlay Budget The operating capital outlay budget contains funds for minor improvements in schools and administrative buildings. A signifi cant part of the FY 2008-09 budget is dedicated to annual relocation of mobile and modular classroom units needed to accommodate growth across the school system, and for pay-ment of the annual lease cost for these units. The remainder of the operating portion of the capital outlay budget is for fi xed asset replacement and the purchase of 36 new school buses.
We have received an “unqualifi ed” audit opinion each of the last 17 years. An unqualifi ed audit indicates that in the auditor’s opinion, the fi nancial statements present fairly, in all material respects, our fi nancial position in conformity with accounting principles generally accepted in the United State of America.
Our external auditors conducted their audit in accordance with auditing stan-dards generally accepted in the United States of America and the standards applicable to fi nancial audits contained in Government Auditing Standards, issued by the Comptroller General of the United States.
The Wake County Board of Education won the State Treasurer’s Award for Excellence in Accounting and Financial Management in 2005-06 in the cat-egory of School Units with Average Daily Membership (ADM) of 12,000 and over. This award recognized the Wake County Public School System for our innovative approach to responsible fi scal management and improve-ments to our current operations. WCPSS was recognized for the establish-ment of a Fraud Prevention Program, internal control improvements, and implementing a budget manager certifi cation program. These improvements will safeguard the school system’s assets and save money, as well as pro-mote effectiveness and effi ciency. We also received the award in 2004-05 based on our innovative approach to responsible fi scal management and im-provements to current operations. The entry submitted involved signifi cant enhancements in the budgetary process, which highlights requests that are related to growth.
FISCAL ACCOUNTABILITY
The Wake County Public School System has undertaken comprehensive ef-forts in continuing to expand fi scal accountability. The new Chief Business Offi cer (CBO) leadership position was created and fi lled with a CPA who has an MBA and more than 20 years of for-profi t business experience. The CBO, working in conjunction with the Finance Offi cer, Senior Budget Di-rector, and others, has focused on implementation of fraud detection and pre-vention systems, budget management training for staff, negotiation of sole source contracts, enhancements to fi scal transparency, and improvements in fi nancial reporting.
Fraud experts cite setting of the proper tone at the top as one of the most effective methods of fraud prevention. A strong clear tone of integrity, ethi-cal values, and adherence to system policy and practice has been promoted by the superintendent, CBO, and other members of senior management throughout the fi scal year. The ACL software system recommended by the Summerford Accountancy Fraud Vulnerability Audit has been deployed. The system is now being used by Internal Audit and Finance staff in both a proactive and investigatory manner. Internal Audit reports are reviewed on a monthly basis by the superintendent, CBO, and fi nance offi cer to confi rm fi ndings are not extraordinary. Finance staff also use the reports as input into internal training needs. A risk-based internal audit plan was developed to ensure the recently expanded Internal Audit Department deploys resources in a strategic manner.
Fiscal accountability extends beyond the scope of ensuring adherence to policies and practices. Effective use of available budgets is critical. Staff have been challenged to fully negotiate sole source contracts through the contract routing process. Rate amounts are being questioned. Lease buyout amounts have been rejected and renegotiated. Written business justifi ca-tions are requested prior to approval. Quarterly meetings with the six area superintendents and their respective principals have given an outstanding opportunity to focus on utilization of existing funding. Before and after school balances, textbook balances, and community use balances have all been discussed with the principals and area superintendents to ensure that full advantage is taken of existing resources.
For the past 18 years, we have received the Certificate of Excellence in Financial Reporting from both the American School Business Officials (ASBO) and the Government Finance Officers Association (GFOA).
We have also received the Distinguished Budget Presentation Award from the GFOA the past 15 years. This award is the highest form of recognition
in governmental budgeting.
35Budget HighlightsWake County Public School System - FY 2008-09 Plan for Student Success
Budget HighlightsThe expansion of fi scal accountability by WCPSS serves to further strength-en our system. The expansion of fi scal accountability is an ongoing process that must be continued with a strategic approach and a clear strong tone of integrity from the top.
Budget Manager Certifi cation TrainingBudget manager certifi cation training is a requirement to become a budget manager. The training includes information from the following areas:
Accounting – reporting, fi xed assets, and grantsBudget – process, allotments, and conversionsCompensation Services – FLSA, timesheets, and benefi tsFinance – contracts and confl icts of interestPurchasing – procurement cards, warehouse, and purchasing lawRisk Management – liability and workers compensation
A test is given at the end of the training as a measure to ensure budget man-agers are prepared to legally manage school system funds.
Fraud Awareness TrainingFraud awareness training is presented to all principals and most budget man-agers. This training includes fraud statistics, a profi le of typical parties in-volved in fraud, types of fraud, steps to deter and prevent fraud, and how to create a culture of honesty and integrity.
Independent Audit CommitteeThe Independent Audit Committee was established as part of a continuing effort to expand fi scal accountability and increase transparency within the Wake County Public School System. The duties and responsibilities of the Independent Audit Committee are to make recommendations to the Board of Education on the hiring of the external audit fi rm; review the audit, fi nan-cial reports and audit fi ndings; review the recommendations and the man-agement responses in the audit report, as well as review the status of any management corrective actions; provide a communications link between the external auditor, the Board of Education and the Superintendent; and submit periodic reports through the Committee Chair to the Board of Education and
••••••
the Superintendent. The initial committee membership includes CPA’s, an attorney, and business people. As independent professionals with pertinent experience, the independent Audit Committee serves as an additional inter-nal control in its oversight and review of the external fi nancial audit. The Committee also serves to increase the public trust of the Board.
OtherWCPSS established a toll-free fraud hotline. The superintendent sends out a letter annually to all employees emphasizing their part in fi scal account-ability. WCPSS has implemented quarterly reviews with all budget man-agers to make sure they are aware of any issues in their area. Purchasing implemented consecutive invoice numbers and reports are produced on all vendors and invoices in order to catch any discrepancies.
Quality Matters 2001 - A Wake Community Review of the Public’s SchoolsJanuary/February 2001The School Finance Advisory Committee, an independent group of key community leaders, sought to examine the performance of Wake County Public Schools. The fi ve major fi ndings are:
1) Wake County is a good steward of the public’s money2) Wake County spends less than comparable systems3) Maintenance is underfunded4) Wake County schools set and met high standards5) Wake County’s rapid growth presents challenges to our schools
In this committee’s opinion, “Wake County students – despite lower per pupil spending than comparable school districts – are achieving at higher rates more consistently than their peers across the state.”
Citizens Advisory Committee on School Operations September 2001 to February 2003A diverse group of citizens, appointed in equal number by the Board of Education and Board of County Commissioners, was charged with examining the operation and funding of the district and determining the appropriate funding level for the system. In the process, MGT of America conducted an extensive audit of the school system.
36 www.wcpss.net
Budget HighlightsQuality Matters 2002-2004Annually, the Wake Education Partnership convenes an independent group of key business leaders in the community to examine the performance of the school district and report its fi ndings in a report to the community.
Summerford Accountancy, PC 2005-2006The fraud vulnerability assessment found that WCPSS’ internal structure is adequate and operating effectively, but did make recommendations to reduce the opportunity for fraud to be committed in the future.
Comprehensive Independent Curriculum Management Audit 2006-2007The board approved a comprehensive independent curriculum management audit to be performed by International Curriculum Management Audit Center of Phi Delta Kappa International. The audit was based on a business model developed by the accounting fi rm Peat, Marwick, and Mitchell in which generally accepted auditing principles were followed. This audit was to identify barriers and steps that the district needs to take in order to go from “good” to “great”.
37AwardsWake County Public School System - FY 2008-09 Plan for Student Success
Awards
The Government Finance Offi cers Association (GFOA) of the Untied States and Canada presented a Distinguished Budget Presentation Award to the Wake County Public School System, North Carolina for its annual budget for the fi scal year beginning July 1, 2007. In order to receive the award a governmental unit must publish a budget document that meets program criteria as a policy document, as an operations guide, as a fi nancial plan, and as a communication device. This award is valid for a period of one year only.
Government Finance Offi cers Association Award
38 www.wcpss.net
Not es
39Wake County Public School System - FY 2008-09 Plan for Student Success Board of Education
Board of Education
The school system is governed by a nine member Board of Education whose members are elected from nine separate districts in the county and serve staggered four-year terms. The board sets policy and the superintendent and administrative staff manage the system’s day-to-day operation.
The board has budget review authority, but it is not a taxing body and must submit its annual bud-get requests to the Wake County Board of Com-missioners, which controls allocation of funds to the schools. In North Carolina the basic public education program is funded by the state and is augmented with local funds.
Rosa Gill, Chair District 4 - East Raleigh
The schedule for regular board meetings will be established annually by the board. Meetings are held in the boardroom at the system’s Administration Building, 3600 Wake Forest Road, Raleigh. Regular meetings can and usu-ally do include a consent agenda as well as action, information items, and an opportunity for public comments.
Visit the Wake County Public Schools (WCPSS) website for a list of meeting dates and times:
http://www.wcpss.net/Board/
Beverley ClarkVice Chair, District 6
Central Raleigh
Lori MillbergDistrict 1
Northeast Wake County
Horace TartDistrict 2
Southeast Wake County
Anne McLaurinDistrict 5
South Central Raleigh
Kevin HillDistrict 3
North Raleigh
Patti HeadDistrict 7
West Raleigh / Morrisville
Ron MargiottaDistrict 8
Southern Wake County
Eleanor GoetteeDistrict 9
Western Wake County
4
37
82
19 5
6
Board of EducationDistrict Map
40 www.wcpss.net
Board of Education
DISTRICT 4 - EAST RALEIGH
Rosa Gill, Chair
Rosa Gill has served on the Wake County Public School Board of Education for the past eight years and was re-elected to a third term in 2007. She currently serves as chair of the Board. Ms. Gill is a retired state employee with over 21 years of teaching experiences as a high school mathematics instructor and 13 years as an administrator with the North Caro-
lina Division of Motor Vehicles. She is a member of the National School Board Association, NC School Board Association, NC Caucus of Black School Board Members and the National African American School Board Member Association. Ms. Gill serves on the Board of Directors for South-Light (formerly Drug Action), Triangle Child Care Services Association’s Board and the Raleigh-Wake NAACP Board of Directors. She has received numerous community service and leadership awards and honors.
Ms. Gill received her Bachelor of Science degree in Mathematics from Shaw University in Raleigh, NC. She is also a Certifi ed Public Manager, a member of Zeta Phi Beta Sorority, Inc. and Macedonia New Life Church.
Beverley Clark is currently a non-prac-ticing attorney who holds a law degree from Temple University School of Law and a bachelor’s degree from University of Pennsylvania. She has worked for the Nature Conservancy as the organization’s southeast regional attorney and has spent time in private practice. Additionally, Mrs.
Clark served as the project manager of Hawthorne Villa, during which time she supervised the conversion of an old school building into el-derly housing. Prior to being elected to the board, Mrs. Clark worked in conjunction with the school system by serving on the Phase III Bond Building Oversight Committee and the Student Assignment Advisory Committee. Mrs. Clark has also served in leadership capacity on the Friends of North Carolina Museum of Natural Sciences and she has played an active role in the Wake County PTA Council, Wake Educa-tion Partnership, and Communities in Schools. In 2003, she became an individual mentor and continues to provide one-on-one guidance to an NCCU student.
41Wake County Public School System - FY 2008-09 Plan for Student Success Board of Education
Board of Education
DISTRICT 1 -
NORTHEAST WAKE COUNTY
Lori Millberg, Member
Mrs. Millberg is the business administrator for a Raleigh law fi rm for which her husband John is a partner. She began her professional career as an assistant district attorney in Texas, then stayed home with their three children and vol-unteered in schools until the fi rm opened.
She holds a BS in Business Administration from Appalachian State Uni-versity and a law degree from Wake Forest University. She is a member of North Raleigh Church of Christ.
Contact Lori MillbergOffi ce: (919) 850-8865 Email: [email protected]
SCHOOLS BY ELECTION DISTRICT
DISTRICT 2 -
SOUTHEAST WAKE COUNTY
Horace Tart, Member
Mr. Tart is a builder and developer of residential subdivisions. After graduating from Campbell University he taught in Wake County for fi ve years. He has also served in the United States Marine Corps and has been a farmer.
He and his wife Susie have four children and fi ve grandchildren. He is a member of Piney Grove Baptist Church.
Smith ElementaryTimber Drive ElementaryVance ElementaryVandora Springs ElementaryWest Lake ElementaryWest Lake MiddleWillow Springs Elementary
42 www.wcpss.net
Board of Education
DISTRICT 3 - NORTH RALEIGH
Kevin Hill, Member
Kevin L. Hill retired in 2005 from the Wake County Public School System, where he spent his entire career. He taught secondary social studies for 14 years, and served as an assistant principal and principal at elementary, middle, and high schools for 14 years.
While with Wake County, Kevin served as both a teacher mentor and adminis-trative mentor. He is a clinical instructor and interim program coordinator for undergraduate Secondary Social Studies Education at North Carolina State University. Kevin is also a program presenter and social studies methods in-structor with the NC State NC TEACH Program. Kevin is a graduate of three Principals’ Executive Programs and is a program presenter at PEP’s Leader-ship Program for Aspiring Principals. He served as President of the Wake County Division of Principals and Assistant Principals from 2001-2003, and was the Wake County PTA Council Co-Principal of the Year in 2005.
Dr. McLaurin has been a family physician in Wake County since 1978. She worked at Wake Health Services from 1978-1988. She was in private practice for fi ve years. Presently, she is also a Consulting Physician at SAS Health Care, SAS Institute, Cary, NC.
While continuing her practice in the medical fi eld, Dr. McLaurin has been involved with the Wake County Public School System by serving on PTA, tutoring programs, and a member of the School Health Advisory Council.
Contact Anne McLaurinOffi ce: Not Available Email: [email protected]
43Wake County Public School System - FY 2008-09 Plan for Student Success Board of Education
Board of Education
DISTRICT 7 - WEST RALEIGH / MORRISVILLE
Patti Head, Member
Mrs. Head is a longtime community volunteer, including time as a CPR instructor, Bible study leader, school volunteer and member of the Wake Education Partnership’s board of direc-tors prior to her election to the school board.
She graduated with a BS in Biology and teaching certifi cate from Wake Forest University. She and her husband Allan have three children and fi ve grandchildren.
Mr. Ron Margiotta is a retired businessman. He op-erated his own business starting at a young age and continuing for 30 years. His business comprised of Warehousing and Installation Services. He man-aged offi ce staff and sub-contractor fl eets in the New York Metropolitan tri-state area. Mr. Margiotta established and implemented training programs for
Sears and Macy’s employees. He was recognized by Sears as the largest and most respected contractor in the nation.
While continuing his profession in the North East, Mr. Margiotta served as a School Board Member in Northern New Jersey. He was elected for three terms encompass-ing 9 years. He served as President for 6 of those 9 years. He was instrumental in garnering public referendum approval to purchase and establish a Special Education Building & Program. He also helped lead public approval of annual budget refer-endums after 14 consecutive defeats. Mr. Margiotta appointed a committee and hired staff to develop comprehensive system wide Policy Manual. He supervised the recruitment of School Superintendent and Business Administrator. He played an active role in increasing participation in many federal and state educational funding programs. Mr. Margiotta achieved the largest increase in number of high school graduates who went on to two and four year colleges. He received an Appreciation Award for years of dedicated service in Northern New Jersey.
Contact Ron MargiottaOffi ce: (919) 850-8872 Email: [email protected]
SCHOOLS BY ELECTION DISTRICTBrier Creek Elementary Carpenter Elementary Cedar Fork Elementary Green Hope Elementary Green Hope High Hilburn Elementary Jeffreys Grove Elementary
Lead Mine Elementary Leesville Elementary Leesville High Leesville Middle
Morrisville Elementary Stough Elementary York Elementary Apex Elementary
Holly Grove Elementary (@ Holly Springs High)Holly Ridge ElementaryHolly Ridge MiddleHolly Springs ElementaryHolly Springs MiddleHolly Springs High
Lufkin Road MiddleOak Grove ElementaryOlive Chapel ElementaryPanther Creek HighPenny Road ElementarySalem ElementarySalem MiddleTurner Creek Elementary
44 www.wcpss.net
Board of Education
CITIZEN INVOLVEMENT
Speak at School Board Public Hearings
There are two public hearing portions of each board meeting:
Public hearing about items on that night’s agenda (occurs one-hour after the beginning of the meeting). Public hearing about items not on that night’s agenda (follows public hearing for items on the agenda, then continues at the end of the meet-ing if necessary).
Individuals wishing to speak at a board meeting must sign in prior to the beginning of the public hearing.
Speak at Wake County Board of Commissioner’s Meetings
The Board meets on the fi rst and third Mondays of each month (unless changed for holidays or other reasons). The meetings begin at 2:00 p.m., with public comments at 3:00 p.m. A 30-minute sign up period precedes each public comment period.
Contact your Legislators
Contact your legislators regarding additional state funding by visiting the following web address and contacting your representatives:
Mrs. Goettee served as Executive Director of the North Carolina Professional Teaching Standards Commission prior to her election to the school board.
She has thirty years of teaching experience and is a National Board Certi-fi ed Teacher. In addition, she has taught at both Meredith College and North Carolina State University and spent several years in the corporate sector at Progress Energy. She received her Bachelor’s degree at the University of North Carolina at Greensboro and her Master’s at North Carolina State University.
Resources:Months of Employment: 252.00Operating Budget: $2,767,116SCHOOLS
Principals - Teachers - Staff
Resources:Months of Employment: 173,397.93 Operating Budget: $941,762,836
STUDENTS
INSTRUCTIONAL SERVICES
Resources:Months of Employment: 6,816.10Operating Budget: $79,932,329
ADMINISTRATIVE SERVICES
Resources:Months of Employment: 2,346.56Operating Budget: $18,332,179
COMMUNICATIONS
Resources:Months of Employment: 516.00Operating Budget: $5,620,789
AUXILIARY SERVICES
Resources:Months of Employment: 8,050.49Operating Budget: $146,582,508
TECHNOLOGY SERVICES
Resources:Months of Employment: 1,116.00Operating Budget: $20,112,027
ORGANIZATIONAL DEVELOPMENT AND SUPPORT
Resources:Months of Employment: 612.00Operating Budget: $7,869,839
Organization Charts and Strategic Plans 2007-2010Wake County Public School System - FY 2008-09 Plan for Student Success
Organization Charts and Strategic Plans 2007-2010
The Wake County Public School System is the largest system in the state and one of the fastest growing districts in the nation. The system is currently serving more than 134,000 students.
The superintendent functions as the chief administrative offi cer of the school sys-tem and as the chief executive offi cer of the Board of Education. The superinten-dent and his strategy team members set system direction, implement policy, and manage systemwide operations.
The Wake County Public School System
46 www.wcpss.net
Organization Charts and Strategic Plans 2007-2010
WAKE COUNTY PUBLIC SCHOOL SYSTEMS MISSION
GOAL 2008WCPSS is committed to academic excellence. By 2008, 95 percent of students in grades 3 through 12 will be at or above grade level as measured by the State of North Carolina End-of-Grade or Course tests, and all student groups will demonstrate high growth.
In the pursuit of this goal, we will:• Increase challenging educational opportunities for all students.• Increase student participation and success in advanced classes at the high school level.• Increase the percent of 9th grade students graduating from high school within four years.• Recruit, develop, support and retain a highly qualifi ed workforce to ensure student success.• Identify and seek resources necessary to support student success.• Build consensus of support through community collaboration.
SUPERINTENDENT’S MISSION: To create and maintain systems with suffi cient resources for establishing a collaborative, inclusive, and trusting environ-ment for all stakeholders and for providing high quality learning experiences for each student to ensure success in the 21st century.
SUPERINTENDENT’S VISION: A community of caring stakeholders (parents, teachers, administrators, and staff) will successfully work collaboratively with support from the broader community to ensure that every child educated in the Wake County Public School System graduates on time, prepared for the future.
SUPERINTENDENT’S STRATEGIC DIRECTIVES: (1) Focus on learning and teaching.(2) Retain, recruit, and train high quality employees.(3) Develop and implement systems and structures to support schools, ensure accountability and engage the community.(4) Expand fi scal accountability.
The Wake County Public School System will educate each student to be a responsible and productive citizen who can effectively manage future challenges.
47Organization Charts and Strategic Plans 2007-2010Wake County Public School System - FY 2008-09 Plan for Student Success
Organization Charts and Strategic Plans 2007-2010
The Wake County Public School System Administrative Services Division provides a comprehensive suite of business support services for all schools and departments within the system. Business support services include budget, fi nancial processing, fi nancial reporting, purchas-ing, compensation services, benefi ts, human resources, risk management, and information provision. The Administrative Services Division targets to provide a high level of customer service to all school and central service based staff in support of Learning and Teaching. The Division also continues its directive of expanding fi scal accountability throughout the system.
David NeterChief Business Officer
Mark WintersFinance Officer
Terri KimzeySenior Director
Budget
Maurice BoswellAssistant Superintendent
Human Resources
Joan KisterSenior Director
Recruitment andRetention
David HowellSenior Director
Salary andLicensure
Wilma Jenkins-FlytheSenior Director
Staffing andOperations
Christine FavataDirector
Elementary SchoolStaffing
Alice Card-BriggsDirector
Middle School Staffing
Kendra HillSenior Director
EmployeeRelations
Robyn PresleySenior Director
Accounting
Rebecca HargravesSenior Director
Compensation Services
Scott DoolittleSenior Director
Purchasing
Bob SnidemillerDirectorFinance
Jeff KoweekDirector
Employee Entitlements
Teresa Cunningham-BrownDirector
Recruitment and Retention
Curtis GroganDirector
Risk Management
ADMINISTRATIVE SERVICES DIVISIONDavid Neter, Chief Business Officer
Accounting
Budget
Compensation Services
Employee Relations
Finance
Human Resources
Purchasing/Warehouse
Risk Management
The Mission of the Administrative Services Division is to provide and support quality resource management systems.
MISSION STATEMENT
48 www.wcpss.net
Organization Charts and Strategic Plans 2007-2010
DESIRED OUTCOMES MEASURE
Proc
esse
s
Quarterly meetings will be held with Principals, Area Superintendents, and Chiefs to gain input into new information needs and areas for im-provement.Ongoing review and enhancement of Oracle Financial System to auto-matically push key information out to Principals, Area Superintendents, Chiefs, and Leadership team mem-bers.
1.
2.
Evidence meetings are conducted and information is acted upon
IS requests, completion, and feed-back from users
•
•
Rel
atio
nshi
ps
Administrative Services staff will work closely with IS staff in reviewing improvements to Oracle and other Business Information Systems.Administrative Services Administra-tors will develop increased under-standing of the needs of Schools and other Central Services Divisions through attending Central Service Administrator and joint Administra-tor/Principal meetings.
1.
2.
Changes made to Business Systems to improve availability of information to users
Evidence meetings are attended and understanding of client needs increased
•
•
Res
ults
Meet the information and support needs of school and central service based staff supporting our efforts of learning and teaching.
1. Feedback from Principals, school based staff, Area Superintendents, Chiefs, and Central Services staff
•
GOALS ALIGNED WITH STRATEGIC DIRECTIVE #1: Goal 1: Provide information and support to principals, school staff, area superintendents, and central services staff supporting our schools in a timely and accurate manner.
DESIRED OUTCOMES MEASURE
Proc
esse
s
There will be ongoing review of staff retention and turnover data.
There will be ongoing review of staff induction and continuing training op-portunities.
1.
2.
Evidence of periodic review of data and associated action steps
Evidence of periodic review of induc-tion and ongoing training opportuni-ties for staff
•
•
Rel
atio
nshi
ps
Supervisors will work closely with staff to discuss training and career opportunities within the system.Supervisors & staff will take advan-tage of OCIPD and other training programs available.
1.
2.
Evidence of supervisory activity.
eSchools and other training comple-tion records
•
•
Res
ults
Reduction of employee turnover.Effective management of recruitment costs while meeting system needs for new employees.Employees achieve full productivity and continue to develop.
1.2.
3.
Employee retention dataRecruitment costs and results
Evidence of induction and ongoing training opportunities
••
•
GOALS ALIGNED WITH STRATEGIC DIRECTIVE #2: Goal 1: Use employee retention and exit data to drive improvements to overall Administrative Services employee retention. Ensure employee induc- tion and ongoing training opportunities are in place. Apply continuous improvement methods to recruitment process.
STRATEGIC DIRECTIVE #1STRATEGIC DIRECTIVE #1Focus on Learning and Teaching
STRATEGIC DIRECTIVE #2STRATEGIC DIRECTIVE #2Retain, Recruit, and train high quality employees
49Organization Charts and Strategic Plans 2007-2010Wake County Public School System - FY 2008-09 Plan for Student Success
Organization Charts and Strategic Plans 2007-2010
DESIRED OUTCOMES MEASURE
Proc
esse
s
Quarterly meetings will be held with Principals, Area Superintendents, and Chiefs to provide fi nancial infor-mation and review utilization of avail-able funding.Feedback from Citizens Advisory Committees for improvements to the Plan for Student Success will be re-viewed and used.
1.
2.
Evidence meetings are conducted and information is acted upon
Evidence feedback is incorporated into Plan for Student Success
•
•
Rel
atio
nshi
ps
Area Superintendent’s and Chiefs will proactively review budgets with their leadership teams on a regular basis to effectively manage available funding.
1. Evidence budget reviews are taking place
•
Res
ults
Improved resource utilization by schools and central services.Improved fi nancial reporting to the public.
1.
2.
Budget to actual comparisons
Public feedback on fi nancial report-ing
•
•
GOALS ALIGNED WITH STRATEGIC DIRECTIVE #3: Goal 1: Quarterly meetings with Chiefs, Area Superintendent’s, Principals, and Fiscal Administrators to provide budget utilization information and further develop their understanding to manage fi scal re- sources. Engagement of WCPSS stakeholders vis a vis improve- ments in the provision of budget and fi nancial information.
DESIRED OUTCOMES MEASURE
Proc
esse
s
Audit fi ndings will be used to implement and refi ne internal controls.
Budget Managers will receive additional train-ing including an ethics component.
1.
2.
Evidence of audit fi nding review and internal control improvementEvidence training has been received
•
•
Rel
atio
nshi
ps
Area Superintendents, Principals, school based staff, Chiefs, and Central Service Ad-ministrators will be provided timely informa-tion and updates through Blackboard Train-ing, Focus on Finance, Finance Manual, Budget Manager Training, and presentations at Central Services Administrators & Princi-pals meetings.Administrative Services staff will promote a tone at the top of integrity and ethical be-havior. This tone will be used as an example for Area Superintendents, Chiefs, Principals, and other Central Services Administrators.
1.
2.
Evidence publications and presentations have been made
Observations in the work-place and evidence of the promotion integrity and ethi-cal values
•
•
Res
ults
External audit reports will affi rm WCPSS as fi scally sound.Audit reports will confi rm internal controls and refl ect managed risk to the system.A tone at the top of integrity and ethical be-havior will be evident.
1.
2.
3.
Audited Financial State-mentsAudit Reports
Observations in the work-place
•
•
•
GOALS ALIGNED WITH STRATEGIC DIRECTIVE #4: Goal 1: Improve knowledge and application by Budget Managers of pol- icy and procedure. Set a tone at the top of integrity, accuracy and the standard of ethical behavior expected in the WCPSS workplace. Enhancement of internal controls based upon on- going review.
STRATEGIC DIRECTIVE #3STRATEGIC DIRECTIVE #3Develop and Implement Systems and Organizational Structures to Support Schools, Ensure Accountability, and Engage in the Community
Mike BurrissAssistant SuperintendentFacilities & Construction
Eddy AdamsSenior DirectorTransportation
Greg ClarkDirector
General Services
Gary HaithcockDirector
Buildings & Grounds
Bob BittnerDirector
Energy & Physical Plant
Alvin McNeillDirector
Transportation Services
Aaron Springs, Jr.Director
Custodial Services
Laurie MonticelloDirector of Operations
Child Nutrition Services
Christina LighthallSenior Director
Long Range Planning
Maja VoukDirector
Demographics
VacantDirector
Growth Management
Laura EvansDirector
Growth Management
Julia PetlakDirector
GIS
VacantSenior Director
Construction Management
Jyoti SharmaSenior Director
Facility Planning
Sneha AminDirector
EnvironmentalHealth & Safety
Betty ParkerDirector
Real Estate Services
Alex FullerDirector
Program Controls
Sheri GreenDirector
William HartleyDirector
Troy ParkerDirector
The Auxiliary Services Division provides and maintains facilities that are safe, healthy, and supportive of learning and teaching. While our employees will never administer a math or spelling test to students, we believe student performance is enhanced when they arrive at school safely. We are also responsible for ensuring that students are fed a healthy meal, housed in a classroom that is clean and comfort-able, and are in a place where they feel safe and secure.
OperationsThe Mission of the Auxiliary Services Division is to provide quality facilities and
support services to ensure safe, healthy, inviting and optimal learning environments.
MISSION STATEMENT
51Organization Charts and Strategic Plans 2007-2010Wake County Public School System - FY 2008-09 Plan for Student Success
Organization Charts and Strategic Plans 2007-2010
DESIRED OUTCOMES MEASURE
Proc
esse
s Monitor key performance indicators (KPI).Promote “sustainable” business op-erations.Increase percentage of students who eat nutritious meals.
1.
2.
3.
KPI’s identifi ed for each business areaHigh performance schools and pro-cessesParticipation rates
•
•
•
Rel
atio
nshi
ps
Adapt food & transportation support services to support school models and programs.Link classroom curriculum to busi-ness and building practices.Support efforts to reduce time that Board spends on support issues.
1.
2.
3.
Principals’ feedback
Initial evaluation and follow-up
Time spent on facilities issues at Facilities Committee & Board of Education
•
•
•
Res
ults
Performance indicators show con-tinuous improvement.Students observe practices that refl ect what they’ve learned in the classroom.Schools and offi ce environments are healthier.
1.
2.
3.
KPI’s
End of year evaluation
Analysis of absence data
•
•
•
GOALS ALIGNED WITH STRATEGIC DIRECTIVE #1: Goal 1: Business operations fully support learning and teaching.
STRATEGIC DIRECTIVE #1STRATEGIC DIRECTIVE #1Focus on Learning and Teaching
Monitor retention data and reasons for leaving.Recruit suffi cient drivers, mechanics and skilled trades personnel.Identify and implement energy con-servation initiative.Expand Tools for Schools indoor air quality initiative.
1.
2.
3.
4.
Percent retentionNumber of vacant positionsEnergy consumptionSurvey; number of schools
••••
Rel
atio
nshi
ps
Support system-wide salary study.Improve internal and external com-munications.Determine barriers to retention.Review & improve employee induc-tion programs.
1.2.
3.4.
Yes / NoSurveySurveysSurvey / 1 year later survey
••••
Res
ults
Review & improve employee induc-tion programs.Measurable reduction in utilities and/or fuel consumption rates.Improved access to departmental in-formation resources.
1.
2.
3.
Survey / 1 year later surveyConsumption dataSurveys
•••
GOALS ALIGNED WITH STRATEGIC DIRECTIVE #2: Goal 1: Working and learning environments are healthy and sustainable. All employees have the knowledge, skills and abilities needed to perform their jobs.
STRATEGIC DIRECTIVE #2STRATEGIC DIRECTIVE #2Retain, Recruit, and train high quality employees
52 www.wcpss.net
Organization Charts and Strategic Plans 2007-2010
DESIRED OUTCOMES MEASURE
Proc
esse
s
Plan the next phase of capital im-provement program.Develop student assignment plan for 2008-09 school year.Develop long term plans to accom-modate growth.
1.
2.
3.
Evaluate progress
Yes / No
Evaluate progress
•
•
•
Rel
atio
nshi
ps
Develop and monitor action plan to address CFAC report recommenda-tions.Obtain growth and development data from municipalities and provide school information to them.
1.
2.
Report progress on recommenda-tions
Yes / No
•
•
Res
ults
Develop minimized reassignment plan for 2008-09.Increased number of sites banked for future schools.
1.
2.
Comparison of numbers of students reassignedNumber of sites
•
•
GOALS ALIGNED WITH STRATEGIC DIRECTIVE #3: Goal 1: All students learn in high quality school buildings. All schools are healthy as defi ned in WCPSS policy.
STRATEGIC DIRECTIVE #3STRATEGIC DIRECTIVE #3Develop and Implement Systems and Organizational Structures to Support Schools, Ensure Accountability, and Engage in the Community
53Organization Charts and Strategic Plans 2007-2010Wake County Public School System - FY 2008-09 Plan for Student Success
Organization Charts and Strategic Plans 2007-2010
The Wake County Public School System Communications Department serves as a communications resource for all departments and schools within the system. The department utilizes a variety of strategies and tools to effectively communicate with individuals and groups who have an interest in our system including the news media, employees, students, parents, newcomers, members of the community and government entities.
The Mission of the Communications Division is to create and execute communication strategies which enhance community support and understanding of public education, and help achieve system goals.
MISSION STATEMENT
54 www.wcpss.net
Organization Charts and Strategic Plans 2007-2010
DESIRED OUTCOMES MEASURE
Proc
esse
s
Create communication strategies, which build support for, and under-standing of the Curriculum Manage-ment Audit.Align department and division staff to be more responsive to school-based requests for communication assis-tance.
1.
2.
Creation and evaluation of the com-munication plan
Direct contact through informational meetings, feedback from division Chiefs
•
•
Rel
atio
nshi
ps
Create opportunities for communi-cation services staff to build stron-ger, more direct relationships with school-based administrators.Strengthen working relationships be-tween communication services divi-sion staff and other central services departments, which we support.
1.
2.
Schedule all staff members regular school site and principal meeting vis-its
Liaison with key divisions and de-partments to identify opportunities and areas of support
•
•
Res
ults
Establish a marketing program, which expands awareness of and participation in the Adult Education and Online learning programs.
1. Expand the current direct mail pro-gram and launch new marketing initiatives.
•
GOALS ALIGNED WITH STRATEGIC DIRECTIVE #1: Goal 1: To sustain system-wide focus on Learning and Teaching through existing internal communication channels.Goal 2: To create an on-going communication strategy regarding the Curriculum Management Audit and its impact on the system.Goal 3: To continue supporting school-based administrators and central services staff in developing communications strategies and tactics, which support the SIP process.Goal 4: Create a 12 month marketing program for the WCPSS Adult Education & Online Learning programs.
STRATEGIC DIRECTIVE #1STRATEGIC DIRECTIVE #1Focus on Learning and Teaching
DESIRED OUTCOMES MEASURE
Proc
esse
s
Identify professional development opportunities for Communications Services staff.
1. At least one PD opportunity for each staff member
•
Rel
atio
nshi
ps
Extend the team-based PLC process into the Communications Services Division.
1. Creation of a PLC framework for con-tinuous improvement and relation-ships
•
Res
ults
Create and utilize, as needed a new employee orientation packet for new hires.
1. Packets developed and utilized•
GOALS ALIGNED WITH STRATEGIC DIRECTIVE #2: Goal 1: To provide professional development opportunities to all Communication Services staff.Goal 2: Create a new employee orientation packet for the division.Goal 3: Initiate a PLC environment within the Communications Services Division.
STRATEGIC DIRECTIVE #2STRATEGIC DIRECTIVE #2Retain, Recruit, and train high quality employees
COMMUNICATIONS DIVISION - STRATEGIC DIRECTIVES
55Organization Charts and Strategic Plans 2007-2010Wake County Public School System - FY 2008-09 Plan for Student Success
Organization Charts and Strategic Plans 2007-2010
DESIRED OUTCOMES MEASURE
Proc
esse
s
Identify means for regular evaluation of tactical communication effective-ness against key organizational ob-jectives and messages.
1. Develop a baseline measurement pro-cess
•
Rel
atio
nshi
ps
Conduct community-based focus groups around the county to better identify and engage the commu-nity in crucial education issues and understand the barriers/opportuni-ties for the system to build greater awareness and support.
1. Formal report through the CRC•
Res
ults
GOALS ALIGNED WITH STRATEGIC DIRECTIVE #3: Goal 1: Create a process for evaluating the communications strategies developed for the system.Goal 2: Conduct focus group research in conjunction with the E&R Department and the Board’s Community Relations. Goal 3: Committee to identify key issues and messages within the community.
STRATEGIC DIRECTIVE #3STRATEGIC DIRECTIVE #3Develop and Implement Systems and Organizational Structures to Support Schools, Ensure Accountability, and Engage in the Community
DESIRED OUTCOMES MEASURE
Proc
esse
s
Key staff will successfully complete additional fi nancial training to ensure continued fi scal ac-countability.
1. Training conducted•
Rel
atio
nshi
psR
esul
tsGOALS ALIGNED WITH STRATEGIC DIRECTIVE #4: Goal 1: Expand fi scal accountability through the division through addi-tional fi nancial training of key staff.
To achieve our mission, colleagues from the three interdependent parts of Instructional Services — Curriculum and Instruction, Evalu-ation and Research, and Student Support Services — work collaboratively to assist schools to focus on answering three critical ques-tions: (1) What are students expected to learn? (2) Have students learned what is expected? (3) What do we do when students have or have not learned what is expected?
Academically Gifted
Arts Education
Athletics
Counseling & Student Services
Instructional Technology
Magnet Programs
Positive Behavior Support
Prevention Services
Project Enlighten-ment
Special EducationServices
Title 1
Vocational/Career & Technical Education
Dr. Donna HargensChief Academic Officer
Marvin ConnellyAssistant SuperintendentStudent Support Services
David HoldzkomAssistant SuperintendentEvaluation & Research
The Mission of the Instructional Services Division is to work collaboratively with our customers to promote and support effective instruction for all students.
MISSION STATEMENT
57Organization Charts and Strategic Plans 2007-2010Wake County Public School System - FY 2008-09 Plan for Student Success
Organization Charts and Strategic Plans 2007-2010
DESIRED OUTCOMES MEASURE
Proc
esse
s
Defi ne and communicate what students are expected to know (the written curricu-lum) as part of an aligned curriculum management system. Provide an understanding of the Curriculum Management Audit report and recom-mendations as a foundation for the involvement of ISD staff in prioritizing action steps/strategies.Identify, promote and support the implementation and monitoring of strategies/pro-grams and aligned interventions that maximize student achievement and that promote success for under-achieving students.Promote and support the development of, the administration of, and the use of data from formative and summative assessments and program evaluations to inform in-structional decisions.
1.
2.
3.
4.
An explicit written curriculum in a user-friendly, on-line format.
Recommendation team members
Implementation Plans for Recommendation #4 and #5
Program evaluations, effectiveness studies, strategies in school improvement plans, on-line curricular resources/strategiesImproved student achievement
•
•
•
•
•
Rel
atio
nshi
ps
Utilize professional learning communities in the departments within the Instructional Services Division in order to provide for increased collaboration and for continuous improvement in the support of learning and teaching. Create a centralized pyramid of interventions that is data-driven, and support schools in implementing and monitoring a data-driven pyramid of interventions. Par-ticipate in professional development to develop the skills necessary to ensure an understanding of, the implementation of, and the monitoring of professional learning communities.Establish how the work of the Instructional Services Division supports the working condi-tions for teachers in schools.Connect the role of every ISD staff member to Strategic Directive #1 and to the implementation of the Curriculum Management Audit.
1.
2.
3.
4.
Documentation of the positive impact on the work environment in ISD
A Pyramid of InterventionsA reduction in the disproportionality of populations needing servicesThe number of certifi ed professional learning community coaches
List of Teacher Working Conditions survey questions that are impacted by the work of ISDThe change in those survey items from 2006Membership on recommendation teamsDescriptions of roles
•
•••
••••
Res
ults
Utilize professional learning communities in ISD as a way to identify best practices that improve student achievement, and best practices in how to support schools to improve student achievement, maximize the use of instructional time, and use data to inform instructional practices. Provide leadership and support for schools to promote success for under-achieving students. Provide leadership and support for schools in implementing and monitoring a data-driven pyramid of interventions.
1.
2.
3.
Improved achievement for all subgroups on End of Grade and End of Course tests, Im-proved SAT scores, Increased graduation rate, Increased participation in AP courses
Evidence of the support of professional learning communities in schools
Evidence of the use of pyramids of interventions in schools
•
•
•
GOALS ALIGNED WITH STRATEGIC DIRECTIVE #1: Goal 1: Ensure that the Instructional Services Division supports the school improvement planning process and the identifi cation and implementation of practices to improve student achievement. Goal 2: Ensure that the Instructional Services Division supports learning and teaching appropriately.Goal 3: Implement an aligned curriculum management system based on recommendations from the 2007 curriculum management audit.
STRATEGIC DIRECTIVE #1STRATEGIC DIRECTIVE #1Focus on Learning and Teaching
Examine ISD retention data in each department, and develop plans to decrease the rate of attrition if appropriate. Share best practices in the area of employee retention and support.Involve ISD members in the prioritization of actions and in the development of imple-mentation plans for the CMA recommendations.Allocate resources in ISD to schools in order to support the creation of healthy schools and healthy school environments in order to support teachers and stu-dents.Collaborate to develop and implement training systems that promote professional growth, improve job satisfaction, enhance leadership capacity, support best prac-tices, and develop 21st century leadership skills.Develop leadership skills at all levels in ISD needed to work collaboratively with students, parents, and colleagues in order to promote student success.Monitor the effectiveness of the training and professional development.
1.
2.3.
4.
5.
6.
7.
Review of ISD retention data Action taken (if appropriate)List of best practicesPrioritized actions from the CMA report. Implementation plans for recommendations #4 and #5Results of healthy schools process
Leadership training for ISD staff
Time spent in professional collaboration
Results of professional collaboration
••••
•
•
•
•
Rel
atio
nshi
ps
Administer a 360 degree survey to the team of each ISD leadership team member.Develop data systems to assess needs and practices within ISD that enhance teacher quality and support teacher development and retention.
1.2.
360 degree survey data for members of the ISD Leadership TeamList of Teacher Working Conditions survey questions that are impacted by the work of ISDThe change in those survey items from 2006
•••
Res
ults
Implement an induction program for each new ISD employee, which includes an induction packet.Use systematic processes for getting feedback from ISD staff about job satisfaction, work conditions, and support systems.
1.
2.
Increased employee retention rate•
GOALS ALIGNED WITH STRATEGIC DIRECTIVE #2: Goal 1: Ensure that leaders in Instructional Services have an understanding of and the capacity to support healthy schools and to support the retention of high quality employees.Goal 2: Implement an aligned curriculum management system based on recommendations from the 2007 curriculum management audit.
59Organization Charts and Strategic Plans 2007-2010Wake County Public School System - FY 2008-09 Plan for Student Success
Organization Charts and Strategic Plans 2007-2010
STRATEGIC DIRECTIVE #3STRATEGIC DIRECTIVE #3Develop and Implement Systems and Organizational Structures to Support Schools, Ensure Accountability, and Engage in the Community
Participate in the Superintendent’s Advisory Council Summits to build shared knowl-edge, exchange ideas and information and solicit feedback regarding ISD issues.Gather feedback from schools regarding ISD customer service.Work with the Area Superintendents to continue to refi ne the healthy schools pro-cess.Provide data to support the Healthy Schools Process.Based on the needs of schools identify strategies and resources to support the improvement of the health of the school.Collaborate with facilities regarding educational space standards/equipment.Promote increased student participation in magnet schools through the continuous development and implementation of unique programs. Align the work of Instructional Services to support the school improvement plans, the district’s strategic directives, interventions, and year-round schools.Increase ISD long-range planning related to key processes.Use a system of continuous improvement to ensure that decision-making processes are collaborative, data-driven and student-focused.Guide innovation in schools.Align the ISD plan to the strategic directives.Develop implementation plans for Recommendations #4 and #5 that include priori-tized actions.Develop, support, and promote strategies that reduce paperwork, manage student data, and facilitate student assessment/testing, curriculum planning and classroom management.Evaluate the effectiveness of initiatives/programs and progress toward Goal 2008.
1.
2.3.
4.5.
6.7.
8.
9.10.
11.12.13.
14.
15.
Feedback regarding ISD items at the Superintendent’s SummitFeedback to ISD from schools regarding timeliness and quality of servicesDistribution of resourcesIncreased participation in magnet schools
ISD long-range planning documentsISD calendarPrioritized actions related to CMA recommendationsImplementation Plans for Recommendations #4 and #5
Programs evaluations
••••
••••
•
Rel
atio
nshi
ps
Increase/improve communication with the public and parents.Promote student success by supporting the development of the whole child and col-laborating with the school, family, and community.Increase the capacity of parents to understand, support, and participate in decisions related to their child’s education.Align ISD Professional Growth Plans with the strategic directives.Increase school and community involvement to build a consensus of support for magnet school programs.
1.2.
3.
4.5.
Satisfaction results from stakeholders regarding that they are heard in ISD and are better able to participate
ISD Professional Growth PlansIncrease in magnet school participation
•
••
Strategic Directive #3 continued on next page...
60 www.wcpss.net
Organization Charts and Strategic Plans 2007-2010
DESIRED OUTCOMES MEASURE
Res
ults
Develop and implement a systematic plan to build understanding and support for ISD programs and services.Provide information about programs and information regarding school and system performance.Continue to realign the Instructional Services Division structure as needed to sup-port learning and teaching.Convey the ISD structural alignment through the development and dissemination of an ISD organizational chart.
1.
2.
3.
4.
Increased % of schools reporting support from Instructional Services
Increased % of stakeholders reporting an understanding of ISD issues
GOALS ALIGNED WITH STRATEGIC DIRECTIVE #3: Goal 1: Design a work system within Instructional Services that is responsive, accountable, and collaborative with all stakeholders and that is focused on improving student achievement.Goal 2: Implement an aligned curriculum management system based on recommendations from the 2007 curriculum management audit.
61Organization Charts and Strategic Plans 2007-2010Wake County Public School System - FY 2008-09 Plan for Student Success
Require continued training for existing budget managers in ISD to provide information that they need to do their jobs more effectively on a day-to-day basis.Establish and communicate ISD spending protocols.Use internal audit fi ndings to determine areas for additional budget manager training and additional fi nance procedures and internal controls within ISD.Prioritize recommended actions from the curriculum management audit and develop implementation plans for Recommendations #4 and #5.
1.
2.3.
4.
Training for ISD budget managers
ISD spending protocolsAudit responses
Implementation Plans for Recommendation #4 and #5
•
••
•
Rel
atio
nshi
ps
Make available ISD fi nancial reports and information to all stakeholders.Be accountable to stakeholders to use ISD resources to achieve system goals.Discuss regularly with the ISD Leadership team the fi scal implications of decisions, and use that data to inform changes in practice.Ensure that the tone at the top (the ISD Leadership team) refl ects the fi scal integrity and ethical behavior expected from all employees.
1.2.3.
4.
Financial reports
ISD Leadership Team discussions and decisions
Practices that refl ect and support fi scal integrity and ethical behavior
•
•
•
Res
ults
Develop business cases that align with the recommendations from the Curriculum Management Audit and the Superintendent’s strategic directives.Develop ISD spending plans/blueprints that are clear and specifi c, and submitted prior to resource expenditures/allocations.Provide for continuous fi scal support (365 days).Develop job descriptions in ISD to ensure that positions with budget authority clearly state the responsibilities for fi scal accountability that are associated with the posi-tions.Defi ne roles in allocation of funds and accountability within the current organiza-tional structure.
1.
2.
3.4.
5.
ISD Business Cases in the 2008-09 Plan for Student Succes
ISD plans/blueprints for spending
ISD job descriptions
•
•
•
GOALS ALIGNED WITH STRATEGIC DIRECTIVE #4: Goal 1: Effectively and effi ciently leverage human and fi nancial resources in Instructional Services to improve student learning and build trust within the broader community.Goal 2: Implement an aligned curriculum management system based on recommendations from the 2007 curriculum management audit.
62 www.wcpss.net
Organization Charts and Strategic Plans 2007-2010
Bev WhiteChief Technology Officer
Vass JohnsonSenior Director
Network Services
Dawn CastonguaySenior Director
Information Systems
Ernie ReddishSenior Director
Development & Planning
LuAnn HintonSenior Director
Support Services
Kathy MaultsbyDirector
Business Systems
Don OglesbyDirector
Voice Services
William CarrDirector
Operations andBusiness Continuity
Adam AndruchowitzDirector
Student InformationSystems
Lisa BelshaDirector
TechnicalCommunications Services
Lisa LoftonDirector
Customer SupportServices
The Technology Services Division provides technology leadership, support, and services for the Wake County Public School System while effectively and effi ciently managing district-wide information resources and ensuring information security and integrity. The division works diligently to meet the growing technological needs of the school system by providing support for the following:
Technology Services Division: Connecting learners and resources.MISSION STATEMENT
63Organization Charts and Strategic Plans 2007-2010Wake County Public School System - FY 2008-09 Plan for Student Success
Organization Charts and Strategic Plans 2007-2010
DESIRED OUTCOMES MEASURE
Proc
esse
s
Established process and procedure for response to service calls.Software approval process function-ing and provide accurate up-to-date list of approved software provided for schools.Improved process for meeting district business owner needs through tech-nology while capitalizing on existing capabilities.Expand reliable accessible network-delivered services to schools.
1.
2.
3.
4.
Heat tickets reveal consistent re-sponse to service calls in compli-ance with established processes and proceduresProcess for approval of software clearly defi ned; list of approved soft-ware is on Intranet (software.wcpss.net)Documented process communicated to district business ownersMetrics on circuit usage; Heat tick-ets; document services
•
•
•
•
Rel
atio
nshi
ps
Increase collaboration between TSD and other divisions through com-munications and meetings with key business partners.Strategic planning with Offi ce of 21st Century Learning and Technology Contacts for school technology; with key business partners for enterprise systems.TSD staff provide input for improved service to customers.
1.
2.
3.
Stakeholder awareness of TSD as partner in solutions; calendar of meeting dates; documentation of agreementsDocumentation of meetings, discus-sions, and agreements
Documentation of input opportu-nities, suggestions, and resulting changes in processes
•
•
•
Res
ults
Standards and procedures documents accessible and communicated.Warehouse catalog offers users im-proved search and printing capabili-ties.Comprehensive inventory of school PCs. TSD processes, procedures, and doc-umentation published to Intranet and/or BlackBoard sites as appropriate.
1.
2.
3.
4.
Documents posted and record of communicationsNew warehouse catalog application available
Dynamic up-to-date database and documented inventory
Page printouts and statistics on post-ings and page views
•
•
•
•
GOALS ALIGNED WITH STRATEGIC DIRECTIVE #1: Goal 1: Review, maintain, and communicate approved technologies in supporting schools and promoting learning and teaching.
STRATEGIC DIRECTIVE #1STRATEGIC DIRECTIVE #1Focus on Learning and Teaching
DESIRED OUTCOMES MEASURE
Proc
esse
s
Systemic review of TSD staff reten-tion, recruiting, and training.TSD employee recognition process-es implemented.
1.
2.
Documented staff retention, recruit-ing, and training statisticsDocumentation of recognitions
•
•
Rel
atio
nshi
ps
TSD staff will participate in meetings and professional development and team building opportunities.TSD staff professional development library established.
1.
2.
Records of participation
Statistics on circulation of items
•
•
Res
ults
TSD staff will have written profes-sional growth plans, job-related goals, and desk procedures.Updated job descriptions posted on TSD BlackBoard site.
1.
2.
TSD Leadership Team review of writ-ten materials and feedback to staff documentedDocumentation of postings; all TSD job descriptions current
•
•
GOALS ALIGNED WITH STRATEGIC DIRECTIVE #2: Goal 1: Encourage and recognize staff self-improvement and professional growth activities.
STRATEGIC DIRECTIVE #2STRATEGIC DIRECTIVE #2Retain, Recruit, and train high quality employees
Established procedures for response to service calls.Migration plan developed to move from Novell to Windows 2003 serv-ers for all schools.Devised, documented, and implement-ed methods for increasing awareness of and enforcing adherence to electronic data security policy and procedures.Procedures and documentation for software development standardized in a business model
1.
2.
3.
4.
Time to resolution of calls
Written plan and statistics on prog-ress
Documentation; record of communi-cations
Professional services agreement; documented process; statistics on implemented software development projects
•
•
•
•
Rel
atio
nshi
ps
Input elicited from stakeholders on TSD initiatives and processes.Impacted stakeholders have oppor-tunity to assess “Communications Toolbox” and PC Refresh and other products/processes employed to meet their needs.
1.
2.
Records of input opportunities
Survey of stakeholders
•
•
Res
ults
Year One allocation (one-fi fth of cal-culated number) of school PCs in place and functioningComprehensive inventory of enter-prise system equipment, operating systems, applications, and shared data.Improved TSD communications through BlackBoard, Intranet, ar-ticles placed in district publications, presentations, end user documenta-tion, and other venues.Available and reliable central servers and applications.
1.
2.
3.
4.
Statistics on distribution of PCs
Dynamic up-to-date database and website inventory
Record of items communicated and media utilized
Metrics on server and application availability and reliability
•
•
•
•
GOALS ALIGNED WITH STRATEGIC DIRECTIVE #3: Goal 1: Provide reliable applications and systems with secure data through standardized and centralized installation and support.Goal 2: Continually review and enhance the quality and effectiveness of communications with all WCPSS stakeholders with emphasis on pre- planning for all projects and initiatives.
STRATEGIC DIRECTIVE #3STRATEGIC DIRECTIVE #3Develop and Implement Systems and Organizational Structures to Support Schools, Ensure Accountability, and Engage in the Community
DESIRED OUTCOMES MEASURE
Proc
esse
s Review and codifi cation of guidelines for appro-priate utilization of contractors within TSD.Develop and implement plan for increased se-curity in data center environment.
1.
2.
Guidelines; records of TSD utilization of contractorsPlan documentation; record of implementation
•
•
Rel
atio
nshi
ps Meetings provide opportunity to discuss fi scal implications of TSD decisions.Negotiate with vendors to ensure most ad-vantageous pricing and services.
1.
2.
Meeting agendas
Documentation of negoti-ated agreements
•
•
Res
ults
Budget aligned with projects supporting goals and informed by metrics.Oracle Advanced Benefi ts enable improved management of life events impacting fi nan-cials.
1.
2.
Budget documents; metrics documentsBusiness process modifi ca-tions documented
•
•
GOALS ALIGNED WITH STRATEGIC DIRECTIVE #4: Goal 1: Promote and require fi scal accountability through routine communica- tions to staff and ongoing review of business processes.
65Organization Charts and Strategic Plans 2007-2010Wake County Public School System - FY 2008-09 Plan for Student Success
Organization Charts and Strategic Plans 2007-2010
ORGANIZATIONAL DEVELOPMENT AND SUPPORTTerri Cobb, Office of the Superintendent
Terri CobbChief of Staff
Kenneth ProulxSenior Director
Organizational Development& Support
ElizabethColbert
Senior DirectorOCIPD
Steve BinghamDirector
Triangle LeadershipAcademy
Russ SmithSenior Director
Security
Victoria CurtisDirector
Student DueProcess
Pam BrightDirector
Mazie SmithDirector
Office of the Superintendent
Board Relations
Security & Investigations
Office of Continuous
Improvement & Professional
Development
Organizational Development
Student Due Process and
Policy
Triangle Leadership Academy
Organizational Development and Support includes the Security Department, the Offi ce of Continuous Improvement and Professional Development, Student Due Process and Policy, and the Triangle Leadership Academy. The Division supports all areas within the district including the schools, the Board of Education, the Superintendent’s Offi ce, as well as other divisions and departments. The mission of Organizational Development and Support is to advance continuous improvement within district systems and structures that lead to high-quality services for students.
The Mission of Organizational Development and Support is to advance continuous improve-ment within district systems and structures that lead to high-quality services for students.
MISSION STATEMENT
66 www.wcpss.net
Organization Charts and Strategic Plans 2007-2010
DESIRED OUTCOMES MEASURE
Proc
esse
s
Increase knowledge and support of learning communities.Provide and coordinate staff devel-opment opportunities that address the needs of instructional staff.Compile data from school improve-ment plans as needed to support district initiatives.
1.
2.
3.
Meeting agendas
Meeting registration
Surveys (Satisfaction Data)
•
•
•
Rel
atio
nshi
ps
Improved satisfaction with regional monthly SIP Chairs meetings.Collaboration within and across divi-sions to improve the school improve-ment planning processes.Participate in 360 survey.
1.
2.
3.
Consensogram, Multi-voting (Satis-faction Data)Documentation of Collaboration
360 Survey
•
•
•
Res
ults
Incorporate SMART goals in school improvement planning.Provide support for schools by oper-ating as learning communities.Coordinate, support, and provide activities intended to increase knowl-edge and awareness of strategies for implementing learning organiza-tions.
1.
2.
3.
Completed school improvement plans that include SMART goalsDocumentation of activities
Department/Division AgendasEvidence of use of data
•
•
••
GOALS ALIGNED WITH STRATEGIC DIRECTIVE #1: Goal 1: Provide necessary support for schools in implementing the various components of school improvement.Goal 2: Provide support for learning communities within the schools and central services.
DESIRED OUTCOMES MEASURE
Proc
esse
s
Collaborate within and across divisions to improve induction programs.Provide training and testing for teacher assistants to become highly qualifi ed (HQ).Enhance leadership training opportuni-ties for teachers and administrators.Increase trainers’ areas of certifi cation and knowledge in key district initiatives.Promote strategies in all district profes-sional development that is research-based, incorporates national standards, and addresses the needs of the adult learner.
1.
2.
3.
4.
5.
Documentation of planning meetings.Feedback from induction pro-gram participants.
Number of participants.Number of teacher assistants meeting HQ standards.List of leadership training oppor-tunities. Certifi cation of trainers.List of collaborative activities.
•
•
••
•
••
Rel
atio
nshi
ps
Improve satisfaction from participants with professional development activities.Collaborate among departments/division in order to identify leadership training op-portunities. Participate in leadership training opportu-nities by division members.
1.
2.
3.
Satisfaction data from eSchools and other evaluation instru-ments.Registration data from schools.List of available leadership oppor-tunities.
•
••
Res
ults
Identify support needed for employees at various stages in their professional growth.Create and utilize a new employee orien-tation packet in each department.Provide training activities that target needs of district.
1.
2.
3.
Documents generated through training activities. Completed employee packet.
Evaluation.
•
•
•
GOALS ALIGNED WITH STRATEGIC DIRECTIVE #2: Goal 1: To provide training and ongoing support for professional development.Goal 2: To provide support for new employees.
STRATEGIC DIRECTIVE #1STRATEGIC DIRECTIVE #1Focus on Learning and Teaching
STRATEGIC DIRECTIVE #2STRATEGIC DIRECTIVE #2Retain, Recruit, and train high quality employees
ORGANIZATIONAL DEVELOPMENT AND SUPPORT - STRATEGIC DIRECTIVES
67Organization Charts and Strategic Plans 2007-2010Wake County Public School System - FY 2008-09 Plan for Student Success
Organization Charts and Strategic Plans 2007-2010
ORGANIZATIONAL DEVELOPMENT AND SUPPORT - STRATEGIC DIRECTIVES
DESIRED OUTCOMES MEASURE
Proc
esse
s
Provide support for the development, implemen-tation, and maintenance of comprehensive emer-gency operation plans. Provide system-wide support to administrators in efforts to attain safe and orderly environments. Support and enhance leadership development activities for all district employees.Increase long-range planning among depart-ments/division.Align department plans with strategic directives and division plan.Investigate different media for use in the delivery of professional development.
1.
2.
3.
4.
5.
6.
List of activities
Completed plans
Documentation of activitiesEvidence of long-range planningDepartmental plans
Use of different media
•
•
•
•
•
•
Rel
atio
nshi
ps
Increase and enhance communication with inter-nal and external stakeholders.Seek methods to improve activities and support of student due process procedures.Increase support for policy development and tracking.Coordinate, develop, plan and support activities for district administrators. Coordinate, develop, plan and support activities for the Board of Education. Participate in planning and implementation of the Superintendent’s Summits.
1.
2.
3.
4.
5.
6.
Agendas
List of activities
List of documents
Planning activities
Satisfaction data
Flow chart for policy development
•
•
•
•
•
•
Res
ults
Work with other departments to develop sur-veys and maintain results for activities related to professional development, school improvement plans, and learning communities.Compile professional development activities and communicate this information to appropriate stakeholders.Restructure departments under Organizational Development and Support.
1.
2.
3.
Survey results
Compilations of activi-ties
Organizational charts
•
•
•
GOALS ALIGNED WITH STRATEGIC DIRECTIVE #3: Goal 1: To support district professionals and external stakeholders in collaboratively focusing on improving schools.
DESIRED OUTCOMES MEASURE
Proc
esse
s
Participate in activities to increase knowl-edge of best practices for maintaining fi scal accountability.Utilize best practices and current research in supporting fi scal administrators.
1.
2.
Record of activities
List of best practices uti-lized
•
•
Rel
atio
nshi
ps
Include discussions related to strategies for maintaining sound fi scal procedures in indi-vidual and team meetings.Work with fi scal administrators to improve practices and enhance understanding.Provide support for training that will enhance knowledge of district budget managers.
1.
2.
3.
Agendas
Activities
List of practices
•
•
•
Res
ults
Increase effi ciency as demonstrated by audit results.Align strategic plans with budgets.Provide strategies to district budget manag-ers that will enhance effi ciency.Maintain a tone that refl ects integrity and ethi-cal behavior.
1.
2.3.
4.
Audit results
Quarterly reviews
Strategic plans
•
•
•
GOALS ALIGNED WITH STRATEGIC DIRECTIVE #4: Goal 1: Effectively and effi ciently leverage human and fi nancial resourc- es in Organizational Development and Support to improve stu- dent learning and build trust within the broader community.
STRATEGIC DIRECTIVE #3STRATEGIC DIRECTIVE #3Develop and Implement Systems and Organizational Structures to Support Schools, Ensure Accountability, and Engage in the Community STRATEGIC DIRECTIVE #4STRATEGIC DIRECTIVE #4
Expand Fiscal Accountability
68 www.wcpss.net
Ass ignments for Area Superintendents
Durham CountyGranville County
Franklin
County
Nash County
Johnston County
Harnett County
Chatham
County
MAGNET SCHOOL KEYϑ Gifted and Talented
− Center for Spanish Language
λ Creative Arts and Science
‘ Active Learning & Technology
Museums
β International Studies
ϖ Year-Round School
σ Leadership
Integrated Arts
⌧ International Baccalaureate
Montessori
Community Model
University Connection
Centennial Campus
♣ Center for Leadership and Technology
Wake County Public Schools Wake County Public Schools
AREA SUPERINTENDENTS AREA SUPERINTENDENTSAnn Hooker Ann Hooker - Northern Area
Danny BarnesDanny Barnes - Eastern Area
Jonibel WillisJonibel Willis - Central Area
Julye MizelleJulye Mizelle - South Central Area
Kathryn ChontosKathryn Chontos - Western Area
Lloyd GardnerLloyd Gardner - Southern Area
MAP KEYElementary Schools
Middle Schools
High Schools
Special/Optional Schools
Planned Schools - Sites Identifi ed
69Assignments for Area SuperintendentsWake County Public School System - FY 2008-09 Plan for Student Success
East Wake ϖ ..................................................................... (919) 266-8500 2700 Old Milburnie Road, Raleigh, NC 27604 Heritage ϖ ........................................................................ (919) 562-6204 3400 Rogers Road, Wake Forest, NC 27587 River Oaks ....................................................................... (919) 231-5600 4700 New Bern Avenue, Raleigh, NC 27610 Wake Forest - Rolesville ................................................ (919) 554-8440 1800 South Main Street, Wake Forest, NC 27587 Wendell ............................................................................ (919) 365-1666 3409 NC HWY 97, Wendell, 27591 Zebulon ϑ ......................................................................... (919) 404-3630 1000 Shephard School Road, Zebulon, NC 27597
HIGH SCHOOLS
East Wake Campuses 5101 Rolesville Road, Wendell, NC 27591East Wake - Arts, Education and Global Studies ............. (919) 365-2642East Wake - Engineering Systems .................................. (919) 365-2702 East Wake - Health Science ............................................ (919) 365-2652East Wake - Integrated Technology ................................. (919) 365-2657
West Lake ϖ ..................................................................... (919) 662-2300 4500 West Lake Road, Apex, NC 27539 Willow Springs ϖ ............................................................. (919) 557-2770 6800 Dwight Rowland Road, Willow Springs, NC 27592
MIDDLE SCHOOLS
East Garner ⌧ ................................................................. (919) 662-2339 6301 Jones Sausage Road, Garner, NC 27529 Fuquay-Varina ................................................................. (919) 557-2727 109 North Ennis Street, Fuquay-Varina, NC 27526 Holly Ridge ...................................................................... (919) 577-1335 950 Holly Springs Road, Holly Springs, NC 27540 North Garner ϖ ................................................................ (919) 662-2434 720 Powell Drive, Garner, NC 27529 West Lake ϖ ..................................................................... (919) 662-2900 4600 West Lake Road, Cary, NC 27539
HIGH SCHOOLS
Fuquay-Varina ................................................................. (919) 557-2511 201 Bengal Blvd., Fuquay-Varina, NC 27526 Garner ⌧ .......................................................................... (919) 662-2379 2101 Spring Drive, Garner, NC 27529 Holly Springs .................................................................. (919) 577-1444 5329 Cass Holt Road, Holly Springs, NC 27540 Middle Creek ................................................................... (919) 773-3838 123 Middle Creek Park Avenue, Apex, NC 27539
SOUTHERN AREA SCHOOLSLloyd Gardner, Area Superintendent
Contact your Southern Area Superintendent: Offi ce (919) 850-1845 Fax (919) 431-8141 Email: [email protected]
75Budget and Financial PoliciesWake County Public School System - FY 2008-09 Plan for Student Success
Budget and Financial Policies
PUBLIC SCHOOL FINANCING PRIVATE PUBLIC
FUND ACCOUNTING Private sector presents a single, unitary entity for fi nancial reporting purposes. Private sector fi nancial statements are taken as a whole.
Governmental fi nancial reporting focuses on grouping of various funds rath-er than as a whole. Fund accounting is developed from legal compliance and resource limitation issues.
SPENDING FOCUS Private sector focuses on earnings and changes in business’s total net resources. Governments focus on changes in current spendable resources rather than total resources. Government limitation has short-term focus typi-cally on operating budget.
BUDGETARY REPORTING Private sector budgets are simply a fi nancial plan allowing for change and fl ex-ibility during the fi scal year.
Governmental budgets are a system of checks and balances with limited fl exibility. Governments demonstrate compliance with legally adopted budgets through mandated budget-to-actual comparison statements.
Mandate to serve all customersRevenues are pre-determinedPerformance does not drive funding
•••
Plan for growth without ability to fundDivergent stakeholders
•
•
We need good Business Practices, but we are not a Business...
REPORTING ENTITY
The cost of public education in North Carolina is fi nanced primarily by the state, which establishes minimum programs. Local funds, in varying amounts by district, supplement the basic program and are appropriated by local boards of county commissioners. Local boards of education in North Carolina have no tax levying or borrowing authority and are required to maintain accounting records in a uniform format. The budget is prepared on the modifi ed accrual basis of accounting prescribed by legal requirements.
The board is a local education agency empowered by the North Carolina general statutes with the responsibility to oversee and control all activities related to public school educa-tion in Wake County, North Carolina. Because its members are elected by the public and have decision-making authority, the power to designate management, the ability to sig-nifi cantly infl uence operations, and primary accountability for fi scal matters, the board is recognized as a separate government reporting entity, as defi ned by the Governmental Accounting Standards Board (GASB). The board receives funding from county, state, and federal government sources and must comply with the concomitant requirements of those funding entities. While the board receives county funding, the county is not entitled to share in any surpluses nor is it required to fi nance any defi cits.
76 www.wcpss.net
Budget and Financial Policies
WHAT IS A BALANCED BUDGET?
§ 115C-425. Annual balanced budget resolution.
(a) Each local school administrative unit shall operate under an annual balanced budget resolution adopted and administered in accordance with this Article. A budget resolution is balanced when the sum of estimated net revenues and ap-propriated fund balances is equal to appropriations. Appropriated fund balance in any fund shall not exceed the sum of cash and investments minus the sum of liabilities, encumbrances, and deferred revenues arising from cash receipts, as those fi gures stand at the close of the fi scal year next preceding the budget year. The budget resolution shall cover one fi scal year.
(b) It is the intent of this Article that all moneys received and expended by a local school administrative unit should be included in the school budget resolu-tion. Therefore, notwithstanding any other provisions of law, after July 1, 1976, no local school administrative unit may expend any moneys, regardless of their source (including moneys derived from federal, State, or private sources), ex-cept in accordance with a budget resolution adopted pursuant to this Article.
(c) Subsection (b) of this section does not apply to funds of individual schools, as defi ned in G.S. 115C-448. (1975, c. 437, s. 1; 1981, c. 423, s. 1; 1993, c. 179, s. 1.)
The North Carolina School Budget and Fiscal Control Act mandates a uni-form budget format and the adoption of an annual balanced budget resolu-tion by July 1st each year.
Budgets are adopted on a basis consistent with Generally Accepted Account-ing Principles (GAAP), except for revenues and expenditures of the debt service fund. The debt service fund, which is included in the budget of the capital projects fund, and the enterprise fund, which is budgeted on the modifi ed accrual basis. Legal provisions confl ict with GAAP in that there is no authorization for the board to maintain a debt service fund even though the statutes allow continuing contracts for capital outlay purchases.
As required by the statutes, the board maintains encumbrance accounts under which purchase orders, contracts, and other commitments for the expenditure of
funds are recorded in the governmental funds in order to reserve that portion of the applicable appropriation. Outstanding encumbrances at the end of the year do not constitute expenditures and are either charged to an appropriation in the following year or the contractual commitment is cancelled. The encumbrances are reported as reservations of fund balance since the commitments will be fulfi lled through subsequent years’ budget appropriations.
The primary revenue sources for the school system are budgeted allocations and appropriations from the State of North Carolina, Wake County, and the federal government. State budgets are recorded as allotments and are issued or revised by the North Carolina Department of Public Instruction (NCDPI). Grants are recorded in accordance with the grant award notifi cations. These may span multiple fi scal years. Building program budgets are recorded when resolutions have been approved through the Wake County Board of Educa-tion and the Wake County Board of Commissioners. County appropriation revenue is recorded in accordance with the amount approved in the Wake County budget. Other local revenues such as fi nes and forfeitures, interest earned, indirect cost, and fees are budgeted according to projections. These levels are monitored monthly. Any variances are reported to the board of education on a quarterly basis.
State funds are spent on a cash basis. There can be no outstanding purchas-es at year-end. Unexpended funds revert to the state with few exceptions. Local funds are on a modifi ed accrual basis. A limited number of open purchase orders may remain outstanding at year-end. Local revenues less expenditures roll to fund balance annually. Building program projects are on an accrual basis; those purchase orders are allowed to cross fi scal years. Unspent and unencumbered balances roll forward for each project. Out-standing purchase orders are liquidated at year-end in the enterprise fund, however, any balances of revenues over expenditures will carry forward to the next fi scal year for these programs or roll to retained earnings. Unex-pended federal program allocations lapse on the program termination date.
The appropriations in the various funds are formally budgeted and controlled at the functional level. Expenditures may not legally exceed appropriations at the functional level for all of the board’s funds. Subject to the provisions
77Budget and Financial PoliciesWake County Public School System - FY 2008-09 Plan for Student Success
Budget and Financial Policies of the statutes, the board may amend the budget resolution at any time after its adoption. State law also requires that the board and the board of county commissioners approve the transfers to or from the capital outlay fund. By resolution of the board, the superintendent may transfer monies from one appropriation to another within the same fund, subject to certain limitations described below. If such transfers require the board’s approval, they must be reported quarterly.
The board of education may amend the budget resolution at any time after its adoption. The board of education authorizes the superintendent to:
A. Transfer appropriations under the following conditions:
The superintendent may not transfer any amounts between funds or from any contingency appropriation within a fund without board of educa-tion approval.The superintendent may transfer amounts between purposes and be- tween functions within a purpose. A summary of all such transfers must be reported to the board of education quarterly.The superintendent may transfer any amounts in state or federal projects upon prior approval of the appropriate funding agency. If such transfers require board of education approval under other provisions of this res- olution, they must be reported quarterly.
B. Accept appropriations into the budget under the following condi- tions:
The superintendent may accept all state appropriations. A summary of such appropriations must be reported to the board of education quarterly.The superintendent may accept federal appropriations if the application for funding has been approved by the board of education. A summary of such appropriations must be reported to the board of education quar-terly.The superintendent may accept categorical program appropriations if the program has been approved by the board of education. A summary of such appropriations must be reported to the board of education quarterly.The superintendent may accept other appropriations upon prior approval of the board of education.
1.
2.
3.
1.
2.
3.
4.
STATE OF NORTH CAROLINA POLICIES FOR SCHOOL SYSTEM BUDGETS
ARTICLE 31 - THE SCHOOL BUDGET AND FISCAL CONTROL ACT
§ 115C-422. Short title. § 115C-423. Defi nitions. § 115C-424. Uniform system; confl icting laws and local acts superseded.§ 115C-425. Annual balanced budget resolution.§ 115C-426. Uniform budget format.§ 115C-426.1. Vending facilities. § 115C-426.2. Joint planning. § 115C-427. Preparation and submission of budget and budget message.§ 115C-428. Filing and publication of the budget; budget hearing.§ 115C-429. Approval of budget; submission to county commissioners; commissioners’ action on budget.§ 115C-430. Apportionment of county appropriations among local school administrative units.§ 115C-431. Procedure for resolution of dispute between board of educa- tion and board of county commissioners.§ 115C-432. The budget resolution; adoption; limitations; tax levy; fi ling.§ 115C-433. Amendments to the budget resolution; budget transfers.§ 115C-434. Interim budget.§ 115C-435. School fi nance offi cer. § 115C-436. Duties of school fi nance offi cer.§ 115C-437. Allocation of revenues to the local school administrative unit by the county.§ 115C-438. Provision for disbursement of State money.§ 115C-439. Facsimile signatures.§ 115C-440. Accounting system.§ 115C-440.1. Report on county spending on public capital outlay.
The following list of state statutes pertains to school budget and fi scal control fi nancial policies enacted by the state of North Carolina. This information can be found in detail at: http://www.ncleg.net/EnactedLegislation/Statutes/HTML/ByChapter/Chapter_115C.html
School Budget and Fiscal Control Act § 115C-422 through § 115C-452Budget Flexibility § 115C-105.25Distribution of Staff Development Funds § 115C-105.30
•••
78 www.wcpss.net
Budget and Financial Policies § 115C-441. Budgetary accounting for appropriations. § 115C-441.1. Dependent care assistance program. § 115C-442. Fidelity bonds.§ 115C-443. Investment of idle cash. § 115C-444. Selection of depository; deposits to be secured.§ 115C-445. Daily deposits.§ 115C-446. Semiannual reports on status of deposits and investments.§ 115C-447. Annual independent audit.§ 115C-448. Special funds of individual schools.§ 115C-449. Proceeds of insurance claims.§ 115C-450. School food services.§ 115C-451. Reports to State Board of Education; failure to comply with School Budget Act.§ 115C-452. Fines and forfeitures.§ 115C-453 through 115C-457. Reserved for future codifi cation purposes.
§ 115C-105.25 BUDGET FLEXIBILITY
§ 115C-105.30 DISTRIBUTION OF STAFF DEVELOPMENT FUNDS
WAKE COUNTY PUBLIC SCHOOLS BUDGET POLICIES
The Wake County Board of Education has adopted the following policies as a part of the offi cial board policy as it relates to the budget process:
Annual Budget: Board Policy 8100The superintendent shall prepare an annual budget and submit it with a bud-get message to the board no later than April 15.
8100.1 The budget shall comply in all respects with the limitations imposed by law.
8100.2 The budget is a detailed annual operating plan expressed in terms of estimated revenues and expenses, stated in fi nancial terms, for conducting programs and related services in the school system.
8100.3 The budget is a forecast of the projected cost of implementing the goals, objectives, and policies of the board, as well as any needed improve-ments in programs and support services planned by the board.
8100.4 The annual budget process and the resulting budget should serve as a means to improve communication within the school organization and between the school system and the citizens of the school community.
Program Budgeting System: Board Policy 8110The continuing central focus of the board is to improve the learning perfor-mance of individual students. Current levels of achievement will be assessed in comparison to goals and objectives to identify needs or problem areas re-quiring adjusted allocation of resources. Resources will be allocated to areas of greatest need. The performance of programs will be evaluated during the budget year to provide a base for subsequent budget development.
Budget Preparation Procedures: Board Policy 8120Budget planning shall be an integral part of program planning so that the budget may effectively express and implement all programs and activities of the school system. Budget planning shall be a year-round process involving broad participation by administrators, teachers, other personnel throughout the school system, and citizens.
79Budget and Financial PoliciesWake County Public School System - FY 2008-09 Plan for Student Success
Budget and Financial Policies Budget Display: Board Policy 8130On the same day that the budget is submitted to the board, a copy of the budget shall be fi led in the superintendent’s offi ce where it shall remain avail-able for public inspection until the budget resolution is adopted.
Budget Hearings: Board Policy 8140The board shall hold at least one public hearing on the proposed budget prior to fi nal action.
Budget Submission to County Commissioners: Board Policy 8150Upon receiving the budget from the superintendent and following the public hearing authorized by law, the board shall consider the budget, make such changes therein as it deems advisable, and submit the entire budget as ap-proved by the board of education to the board of county commissioners not later than May 15, or such later date as may be fi xed by the board of county commissioners.
Commissioners’ Budget Action: Board Policy 8160The commissioners shall complete action on the school budget on or before July 1, or such later date as may be agreeable to the board of education. The commissioners shall determine the amount of county revenues to be appropriated in the county budget ordinance to the school system for the budget year. The board of county commissioners may, in its discretion, allo-cate part or all of its appropriation by purpose, function, or project as defi ned in the uniform budget format.
Resolution of Budget Dispute: Board Policy 8161Resolution of disputes between the board and the commissioners shall be accomplished in accordance with law.
Adoption of Budget Resolution: Board Policy 8170Adoption of the budget resolution shall be in accordance with the provision of state law.
8170.1 After the board of county commissioners has made its appropriations to the school system, the board of education shall adopt a budget resolution making appropriations for the budget year in such sums as the board deems suffi cient and proper.
8170.2 The budget resolution shall conform to the uniform budget format established by the State Board of Education.
Budget Transfers and Amendments: Board Policy 8180Budget transfers or amendments to the budget resolution, when deemed nec-essary by administration or the board, shall be carried out in accordance with the provisions of state law and provisions of the adopted budget resolution.
Interim Budget: Board Policy 8190In case the adoption of the budget resolution is delayed until after July 1, the board shall make interim appropriations for the purpose of paying salaries and the usual ordinary expenses of the school system for the interval be-tween the beginning of the fi scal year and the adoption of the budget resolu-tion. Interim appropriations so made and expended shall be charged to the proper appropriations on the budget resolution.
CASH MANAGEMENT POLICIES AND PRACTICESCash temporarily idle during the year is invested in the North Carolina Volun-tary Short-term Investment Fund (STIF), the North Carolina Capital Manage-ment Trust (NCCMT), and a Jumbo Money Market account. In addition, other bank accounts that the school maintains earn interest. The statutes authorize the board to invest in obligations of the United States, obligations of any agen-cy of the United States if payment of interest and principal of such obligations is fully guaranteed by the United States; obligations of North Carolina; bonds and notes of any North Carolina local government public authority, subject to certain restrictions; shares of any savings and loan association organized under the laws of this state and shares in any federal savings and loan association organized under the laws of this state, to the extent that the investment is fully insured by the United States or an agency thereof or by any mutual deposit guaranty association authorized by the state; certain other federal agencies; and any form of investment allowed by law to the state treasurer.
INTERFUND TRANSACTIONSQuasi-external transactions are accounted for as revenues and expenditures or expenses. Transactions that constitute reimbursements to a fund for ex-penditures/expenses, initially made from that fund that are properly appli-cable to another fund, are recorded as expenditures/expenses in the reim-bursing fund and as reductions of expenditures/expenses in the fund that is reimbursed. All other interfund transactions, except quasi-external transac-tions and reimbursements, are reported as transfers.
80 www.wcpss.net
Fund BalanceThe North Carolina School Budget and Fiscal Control Act restricts appro-priation of fund balance or fund equity to an amount not to exceed the sum of cash and investments minus the sum of liabilities, encumbrances, and deferred revenues as these amounts stand at the close of the fi scal year pre-ceding the budget year.
Fund Balance is created from excess revenues over expenditures. This can be a combination of collections/revenues being higher than budget and ac-tual expenditures being lower than budget.
Fund balance is comprised of several different categories:
Reserved Fund Balance:The portion of fund balance that refl ects fi nancial assets that are not avail-able for spending. Reserved Fund Balance categories include:
Reserves required for special projectsReserves required for self insuranceReserves required for encumbrancesReserves required by state statuteReserves required for inventories
Unreserved Fund Balance:That portion of fund balance that refl ects expendable, available fi nancial resources. Unreserved Fund Balance categories include:
Designated for fl exible benefi ts planDesignated amounts used to balance the annual budgetUndesignated Fund Balance – operating and capital components
It is the Undesignated Fund Balance contained within the Unreserved Fund Bal-ance that can be utilized by the Board of Education during the year. Categories of Board of Education usage of the Undesignated Fund Balance typically include:
Emergency situations requiring cash fl owFunding of one time costs not included in the annual budget (e.g. curriculum audit).
•••••
•••
••
The Board of Education is required to discuss and vote on any use of Undes-ignated Fund Balance during the public portion of its meetings. Opinions vary about how much of an unreserved undesignated fund balance is neces-sary. Two years ago, then Superintendent McNeal established a Finance Ad-visory Committee that included business professionals from Wake County and Wake County Government management staff. The committee discussed WCPSS maintaining a six percent Undesignated Fund balance of the follow-ing year’s county appropriation.
The University of North Carolina at Chapel Hill Institute of Government produced a document in the late 1980’s with information on fund balance for local governments and school systems. The article states that school systems do not need Unreserved Undesignated Fund balances as large as lo-cal governments because the school systems are not taxing authorities. The article states smaller school systems should have an Undesignated Fund bal-ance of eight percent of general expenditures. The article further states that larger school systems such as WCPSS should maintain Undesignated Fund balances in the range of six percent of total general expenditures.
Two years ago, Wake County Public School Systems (WCPSS) staff and Wake County staff discussed using six percent of the following year’s coun-ty appropriation to target as the Unreserved Undesignated Fund Balance to be maintained. No formal action was taken by the Board of Education based upon this discussion.
On December 4, 2007 the Wake County Public School System Board of Education adopted an Undesignated Operating Fund Balance Policy. The policy provides guidelines to the amount of Undesignated Operating Fund Balance that can be accumulated and also guides the amount that can be used towards funding a future year’s budget. The adoption of this policy is another example of the System’s efforts in its directive to expand fi scal accountability.
81Fund BalanceWake County Public School System - FY 2008-09 Plan for Student Success
Fund Balance
2005-06 2006-07 2007-08 2008-09
FUND BALANCE
CURRENT EXPENSE
Appropriated July 1 $7,000,000 $8,000,000 $12,928,333 $7,500,000
TOTAL APPROPRIATED $15,951,591 $22,307,206 $18,770,352 $7,500,000
Undesignated Fund Balance $22,882,367 $15,647,406 $18,972,0001
COUNTY APPROPRIATIONTOTALCounty Appropriation $254,376,000 $275,827,000 $300,744,100 $316,200,000
% Increase 8% 8% 9% 5%
Undesignated Fund Balance as a percent of subsequent year County Appropriation 8.3% 5.2% 6.0%
8101 Undesignated Operating Fund Balance
As the recipient of Wake County funds allocated for use in local public education, the Wake County Board of Education has the responsibility to use these funds ef-fi ciently and wisely. The Board of Education maintains an Undesignated Operating Fund Balance to address emergency funding needs and other generally one-time costs not included in the annual budget. In addition, the Board of Education may use Undesignated Operating Fund Balance as a funding source for the annual bud-get. Any use of the Undesignated Operating Fund Bal-ance requires action by the Board in a public meeting. Management of the Undesignated Operating Fund Bal-ance is one component of effectively managing Wake County appropriated funds.
As a good business practice, the Board of Education sets the following limits on the Undesignated Operating Fund Balance:
The Board targets maintenance of an Undesignat-ed Operating Fund Balance no greater than 6% of the subsequent year’s county appropriation.
The Board will return to Wake County any Undes-ignated Operating Fund Balance in excess of the specifi ed 6% target on an annual basis.
The Board will not use more than 50% of its July 1st Undesignated Operating Fund Balance to pro-vide funding to the following year’s annual budget.
•
•
•
1Our goal is to maintain an undesignated fund balance at 6% of the subsequent year’s county appropriation. We are projecting an undesignated fund balance of $18.9 million for June 30, 2008 based on a county appropriation of $316.2 million for 2008-09.
82 www.wcpss.net
Budget Process
OPERATING BUDGET
The Plan for Student Success represents the 2008-09 fi nancial plan for the Wake County Public School System (WCPSS). This document culminates a dy-namic process involving input from many groups. Budget development is a year-round process which begins in the fall and continues until the budget reso-lution is adopted by the Wake County Board of Edu-cation. Participation at all levels is evident in this ongoing process.
Schools and central services departments develop strategic plans and request budget needs to support the plans. The superintendent’s strategy team devel-ops the Superintendent’s Plan for Student Success, and prioritizes all requests based on the system’s goals, mission, and the delicate balance between in-structional and supporting service needs. The board holds a public hearing as it considers the plan, and fi nally the board of education submits its Plan for Student Success to the county commissioners by May 15 of each year.
The county commissioners must adopt a budget res-olution, which includes the county appropriation for the school system, by June 30th. If full funding of the board of education’s plan for student success is not approved, the budget must be adjusted accord-ingly.
The board of education adopts a budget resolution for implementation by July 1st. Copies of the budget resolution shall be fi led with the superintendent, the school fi nance offi cer, and the county fi nance offi cer.
We continuously seek ways for the citizens of Wake County to receive more for their dollars. Many adjustments were made by the superintendent and strategy team during the development of this plan.
BUDGET GUIDELINES
Each division develops a strategic plan for the next three years. Annual performance plans follow the strategic plans. In order to prepare the budget re-quest for 2008-09, 2009-10, and 2010-11, each di-vision costs out the items necessary to support the strategic plan. Savings and costs are identifi ed.
School-based budgets are formula-driven. The 2008-09 school-based budgets are estimated based on projected student membership, staffi ng levels, and square footage. Principals communicate with their area superintendent if there are suggestions for formula adjustments from the school level. Area Superintendents will incorporate budget items from the school level in their budget requests. Four major steps are taken to determine what did and did not go into the budget:
We continuously seek ways for the citizens of Wake County to receive more for their dollars.
Goal 2008
Board Strategies
Superintendent’s Performance Goals
School-Based/Departmental Strategic
Plans
Annual Performance Plan
Budget Development/Costing
Financial Management
Annual Performance Against
Community Goal
Prepare for Next Cycle
STEP #1: Examine Expenditures to determine the costs necessary to support Strategic Plans.
83Budget ProcessWake County Public School System - FY 2008-09 Plan for Student Success
Budget Process
State Sources Estimated state revenues from programs were included by applying the current state allotment formulas to projected growth fi gures for student membership, staff levels and the number of sites, plus adjustments for salary increases and employer matching benefi t rate fl uctuations. Actual state funding levels are not available until the legislature concludes its ses-sion. This can be as late as the fall. State allotments are funded on a formula basis. The State funds schools with three basic types of allotments.
Position Allotments: The State allots positions to a local school system for a specifi c purpose. The local school system pays whatever is required to hire certifi ed teachers and other educators, based on the State Salary Schedule, without being limited to a specifi c dollar amount. Each local school system will have a different average salary based on the certifi ed personnel’s experience and education. Position allotments are teachers, school building administration and instructional support personnel, and career and technical education.Dollar Allotments: Local school systems can hire employees or pur-chase goods for a specifi c purpose, but the local school system must operate within the allotted dollar amount. Examples of dollar allotments are teacher assistants, textbooks, central offi ce administration and class-room materials/supplies/equipment.Categorical Allotments: Local school systems may use this funding to purchase all services necessary to address the needs of a specifi c popula-tion or service. The local school system must operate within the allot-ted funds. These funds may be used to hire personnel such as teachers, teacher assistants, and instructional support personnel or to provide a service such as transportation, staff development, or to purchase sup-plies and materials. Examples of categorical funding are: at risk student services, children with disabilities, noninstructional support personnel, and transportation.
Local Sources Accounting staff estimated revenue levels for fi nes and for-feitures and interest earned based on historical collections, projected inter-est rates, and cash fl ow. Fines and forfeitures from the traffi c light camera
1.
2.
3.
Salary and Benefi t Issues: The legislative liason consults with legislative fi nancial analysts and the North Carolina Department of Public Instruction (NCDPI) staff to determine adjustments that may occur in salary and employ-er matching benefi t rates. These adjustments applied in the Plan for Student Success are estimates that are subject to change based on General Assembly action(s).
Growth Issues: Requests are included for months of employment (MOE) and dollars needed due to student membership, number and type of schools, number of staff, square footage, acreage, mileage, and number of facilities. Startup dollars were budgeted for early hires, purchased services, and staff development for schools that will be opening or expanding grade levels in the summer of 2009.
Systemwide Increases: Requests are included for fi scal accountability, rate increases, facility leases, safety and security, data integrity, fi xed asset re-placement and capital budget.
Commitments by the Board of Education: Adjustments are included for changes to programs committed to by the Board of Education during 2007-08 to be effective in 2008-09, 2009-10, or 2010-11. These are items the board has approved, but for which costs or savings are not yet in place.
New Programs or Increased Funding to Existing Programs: Requests are included for any new programs or expansions to existing programs in terms of months of employment and dollars. All increases requested support the system’s strategic plan. Changes to current allotment formulas were consid-ered in this category.
Savings and Reduction of One-Time Costs from the Previous Year: One-time costs from 2007-08 were eliminated. Savings from the previous year were identifi ed. Elimination of one-time costs will be included as a reduc-tion in the budget. As part of our fi nancial management process, programs are reviewed monthly to determine expenditure patterns that may vary from budget. Any material differences are reported to the Board of Education on a quarterly basis in the “over/under” document. The savings on the “over/un-der”, if recurring, will appear as reductions in the subsequent year budget.
STEP #2: Examine Revenues available to pay for costs requested.
84 www.wcpss.net
Budget Process program were also estimated. Indirect cost revenues were estimated based on the number of grants and self-supporting programs projected and the es-timated expenditures in these programs Indirect cost rates were charged on expenditures in the enterprise fund and on grants at 3.674% restricted and 12.6460% unrestricted. The Board of Education approved an increase of $25 in parking fees for 2008-09.
Direct Sources: Federal grants operate on various cycles and were pro-jected using historical information, state planning allotments, formulas, and consultation with grants area within the Wake County Public School Sys-tem. Actual levels of grant funding are typically not awarded until the fall. If a grant is formula-driven, budget managers projected fl uctuations in the revenue for the next three years based on the populations served and the re-quirements of the grant. If grants are considered competetive in nature and the budget manager was fairly certain the grant will be rewarded, an estimate of the revenue was included. For grants that cross fi scal years, estimates of the amount of carryforward revenues were included that support the cost of the grant from one grant cycle to the next. Indirect cost rates of 3.674% restricted and 12.6460% unrestricted were also included.
Enterprise Sources Enterprise budgets were based on the projected fees that will be collected. Tuition-driven programs were budgeted at approxi-mately the same level as the current year. School-based budgets were estab-lished at the same level as 2007-08. Because the amount of dollars included in the budget would impact the Plan for Student Success, budget managers were required to also provide information if there were any tuition or fee increases in enterprise funds.
STEP #3: Determine how much Fund Balance can be requested based on board policy.
8101 Undesignated Operating Fund Balance
As the recipient of Wake County funds allocated for use in local public edu-cation, the Wake County Board of Education has the responsibility to use these funds effi ciently and wisely. The Board of Education maintains an Undesignated Operating Fund Balance to address emergency funding needs
STEP #4: Determine request for County Appropriation from Wake County Commissioners.
The remaining balance will determine the amount that the Wake County Pub-lic School System can request from Wake County Commissioners. In the end there will be a residual cost that the Superintendent and Board of Education must determine how to fund. This is typically the most controversial issue in the process.
and other generally one-time costs not included in the annual budget. In addition, the Board of Education may use Undesignated Operating Fund Balance as a funding source for the annual budget. Any use of the Undes-ignated Operating Fund Balance requires action by the Board in a public meeting. Management of the Undesignated Operating Fund Balance is one component of effectively managing Wake County appropriated funds. As a good business practice, the Board of Education sets the following limits on the Undesignated Operating Fund Balance:
The Board targets maintenance of an Undesignated Operating Fund Bal-ance no greater than 6% of the subsequent year’s county appropriation.The Board will return to Wake County any Undesignated Operating Fund Balance in excess of the specifi ed 6% target on an annual basis.The Board will not use more than 50% of its July 1st Undesignated Op-erating Fund Balance to provide funding to the following year’s annual budget.
•
•
•
85Budget ProcessWake County Public School System - FY 2008-09 Plan for Student Success
Budget Process
Sep Oct Nov Dec Jan Feb March Apr May Jun Jul Aug
Departments prepare, review, and revise budget requests for the subsequent year. School-based tuition budgets for the current year are adjusted based on actual participation.
Superintendent and Strategy Team members prepare balanced budget request and deliver the Superintendent’s Plan for Student Success to the Board of Education. NCDPI releases planning allotments.
Public hearing on the budget and Board of Education work sessions.
Board of Education submits budget to county commissioners.
Board of Education adopts budget resolution.
Record carryforward balances and adjust state and federal programs to initial allotments and award notifications. Planning
allotments for personnel are released to the schools.
BUDGET PROCESS CALENDAR
THE BUDGET CYCLE
Plan for the Future
ImplementPrograms
AllocateResources
Decide on Recommended
Programs
DevelopAlternatives
IdentifyConstraints
DistinguishEducation
Programs & Support Services
DetermineEducational/
Support Services Goals & Objectives
Assess System Needs
Monitor & Evaluate Programs
BUDGET ACTIVITIES DURING FY 2007-08 TO PREPARE BUDGET FOR FY 2008-09
September 13 Present initial timeline for development of the Superintendent’s Plan for Student Success to the Leadership Team. Present refi nements to the process for this coming year and set expectations regarding the development of cases.
September 26 Review budget process and budget instructions at Principals’ Meeting(s).
October 3 Review budget process, budget instructions, and due dates for strate-gic plans at Central Services’ Meeting.
November 16 Electronic versions of all cases and strategic plans must be emailed to [email protected].
December Budget staff processes all budget requests. Review of all business cases turned in by all divisions.
January 10 Present unbalanced budget to the Leadership Team
March 4 Deliver the Superintendent’s Plan for Student Success to the Board of Education
April 22 Board of Education approves the Plan for Student Success.
May 15 Deliver the Board of Education’s Plan for Student Success to the coun-ty commissioners.
June 17 Adopt an interim budget resolution.
July 15 Adopted a budget resolution.
86 www.wcpss.net
Budget Process
CAPITAL BUDGETThe Capital Improvement Program (CIP) 2006 was the culmination of a long planning process in which important planning goals were identifi ed and a series of scenarios were used to explore the implications of various strategies for accommodating projected enrollment growth. The following paragraphs describe the most important points in the process.
Enrollment in Wake County Public School System (WCPSS) is expected to grow to 154,244 students by the 2010-11 school year, an increase of 33,740 students over the 2005-06 school year. This means that more schools and more support facilities for schools will be needed prior to the arrival of these students.
Capital funding provided by PLAN 2004 allowed the opening of four el-ementary schools and two high schools in 2006-07 and six additional el-ementary schools in 2007-08.
CIP 2006: A Blueprint for Excellence was developed to address capital needs from 2007 through 2010 and to acquire land needed for new schools in 2011, 2012, and 2013.
In September 2005, the Board of Education and the Board of County Com-missioners jointly adopted a set of planning assumptions. Assumptions ad-dressed 21 key issues, which included:
Elimination of the backlog of deferred major renovation projects and deferred life-cycle replacement projects by 2015;Reduction of the percentage of students in mobile/modular units, includ-ing modular schools (but not including swing space for renovations) to no more than eight percent by 2012;Reduction in crowding, as measured by the utilization of permanent seats, to 95 percent in elementary and middle schools and 97.5 percent in high schools by 2015;A fi ve-year replacement cycle for school technology;Consideration of multi-track year-round calendars for all future elemen-tary and middle schools as part of a comprehensive facilities plan;
•
•
•
••
Utilization of high-end projections for calculating long-range student enrollment (+one percent for the fi rst fi ve years, +1.5 percent for the next fi ve years, and + two percent for succeeding years) and an annual review of projections versus actual enrollment.
In December 2005, fi ve scenarios were presented with costs through 2010 ranging from $1.559 billion to $2.291 billion and costs through 2015 rang-ing from $4.247 billion to $5.593 billion. Some attributes of these scenarios were:
Base costs per school were estimated using a 12 percent infl ation “Ka-trina effect” recommended by a consultant;Costs beyond 2010 were not included in the 2007-10 subtotals;Mobile unit and utilization targets as specifi ed in the planning assump-tions were achieved;The estimated cost for existing facilities’ renovations was $428.5 mil-lion, based upon generic models that utilized building age and square footage;Costs were estimated at intervals (2007, 2010, 2012, 2015) rather than annually;Standard (655 capacity) single-track elementary schools were utilized in the two most expensive scenarios.
In February 2006, three new scenarios were presented to narrow down the op-tions and focus discussion on a few key issues. Costs were estimated for a three year CIP (all expenditures that would be needed for fi scal years 2007-09) and ranged from $1.375 billion to $1.975 billion. These costs included construction of schools that would open after 2010 but needed to be bid in 2009. Some at-tributes of these scenarios were:
Lower base costs for schools resulted from elimination of the “Katrina ef-fect” infl ation in favor of the fi ve percent infl ation identifi ed in the Septem-ber 2005 planning assumptions and revisions to facilities’ designs; Only large (800 student single-track capacity) elementary schools were uti-lized; Revisions were made to cost estimates for existing school renovation/re-placement projects based upon more detail data from site visits and project
•
•
••
•
•
•
•
•
•
87Budget ProcessWake County Public School System - FY 2008-09 Plan for Student Success
Budget Process evaluations, and inclusion of all systemwide life-cycle projects, increasing the total estimate for existing school projects from $428 million to $528 million;Start-up funding for land and design of future CIP projects was included;Only minimal progress was made toward the mobile unit and utilization targets adopted in September 2005.
In April 2006, staff prepared a recommendation for a capital improvement program for fi scal years 2007-09. The recommendation was based upon a more detailed study of the instructional impact of the potential conversion of elementary and middle schools from single-track to multi-track calendars and consideration of student assignment implications and potential family dis-ruption generated by conversion. The staff recommendation included lim-ited conversion of most elementary schools, with the goal of adding 7,000 seats to elementary capacity. All future elementary and middle schools were anticipated to be multi-track year-round schools. Recommended funding of projects at existing schools and support facilities was reduced to keep the total CIP cost as low as possible. This required that some projects be deferred to a subsequent CIP.
In May 2006, after extensive review and discussion of staff proposals, the Board of Education adopted a Capital Improvement Program with a total cost of $1,055,874,837. Key considerations in the fi nal CIP were: the limitation of year-round conversion in elementary schools to that level required to gener-ate 3,000 seats to address crowding in 2007-08; conversion of some middle schools to year-round calendars in order to generate at least some of the 2,000 additional seats needed in middle schools by 2008-09; and to provide families in elementary and middle school the opportunity to have siblings on the same track.
In November 2006, voters approved a referendum authorizing the sale of bonds to fund CIP 2006. Staff immediately began awarding contracts and work proceeded throughout 2007. In 2008, three new elementary schools will open, to be followed by seven more elementary schools, a middle school, and a high school in 2009.
••
The CIP provides adequate classroom space for learning and teaching to serve a 35 percent increase in enrollment over fi ve years (from 120,504 stu-dents in September 2005 to 162,371 students) and makes some progress on deferred major renovation and life cycle projects at existing schools to protect student health and safety and maintain adequate instructional envi-ronments.
In Fall 2007, enrollment growth slowed slightly. If growth continues at a slower rate, CIP 2006 may provide suffi cient classroom space to accom-modate growth through 2011 or it may enable the school district to reduce the number of mobile and modular classrooms and serve more students in permanent space.
IMPACT OF CAPITAL IMPROVEMENT ON THE OPERATING BUDGET
The capital improvement programs over the past two decades have provided the new and renovated school buildings to accommodate the ever-increasing enrollment of the Wake County Public School System. These new buildings must be operated and maintained, so the annual operating budgets must be increased in proportion to the increased square footage of building space.
The operating budget is impacted in the areas of: utilities, custodial services, grounds maintenance, pest management, building maintenance and repair, solid waste disposal, supplies, and community use.
Operation of elementary and middle schools on a multi-track, year-round calendar increases the operating and maintenance cost, because the build-ings are used for twelve months instead of 10 months each year.
Business cases have been developed to detail the increased operation and maintenance costs of new and enlarged buildings – operating on both tradi-tional and year-round calendars.
88 www.wcpss.net
Budget Administ ration and Management Process Budget administration and management is the process of monitoring expen-ditures during the fi scal year to ensure that they do not exceed authorized amounts and that they are used for intended, proper, and legal purposes. The management of the budget is accomplished in a variety of ways: reconciling budget transactions on an ongoing basis, reviewing expenditure patterns, tracking revenue receipts, monitoring projected fi nancial status at yearend, reconciling exception reports, and reporting to the board and public on fi scal operations.
During the preparation of the budget, the document itself serves as the ve-hicle for planning and resource allocation decisions. After the board adopts the budget, it then becomes the major fi scal management tool for administer-ing and controlling expenditures.
ORGANIZATION
The decision-making authority is based on an organizational structure of pri-mary and secondary budget managers and school improvement teams. All principals and Leadership Team members are primary budget managers. Prin-cipals may establish assistant principals as secondary budget managers. Lead-ership Team members may establish senior directors and directors as primary budget managers. Leadership Team members may establish central services senior administrators or administrators as secondary budget managers.
All budget managers are responsible for assuring and maintaining the ac-curacy of account coding, spending funds appropriately, and adhering to timelines for recording and expending funds. Budget managers must com-plete 1.5 days of Finance Certifi cation Training before signature authority is established. Additional classes are offered to provide instructions for enter-ing data directly into the computer system, as well as how to navigate the fi nancial system to inquire on accounts.
The overall spending and revenue plans are coordinated by central services to maintain total expenditures within available revenues. District level coordination is also exercised over position control of months of employment in areas such as classroom teachers, instructional support, and non-instructional support.
However, budgetary allocations to cost centers are provided in line item amounts and decisions on how to allocate these monies are made at the school site or departmental level.
EXPENDITURE CONTROL AND APPROVALS
For management control purposes, the budget is arranged into cost centers. There is one cost center for every school and for each Leadership Team member. Budget managers are responsible for the management of fi scal resources approved by the board for each of the cost centers. In areas of central monitoring of positions, the Chief Business Offi cer is the budget manager. Thus, every expenditure appropriation in the budget is assigned to a budget manager who is accountable for the proper expenditure of funds.
Each budget manager is authorized to approve the expenditure of funds within their respective cost centers provided that funds are expended in ac-cordance with purchasing procedures and legal requirements. Primary bud-get managers must sign budget transfer requests and budget amendments.
ENCUMBRANCE CONTROL
Encumbrances are obligations in the form of purchase orders, contracts, or salary commitments chargeable to an appropriation and for which part of the appropriation is reserved. The purpose for the encumbrance of funds is to insure that obligations are recognized as soon as commitments are made. The fi nancial system, therefore, recognizes actual expenditures as well as those that are planned or anticipated. This prevents the inadvertent over-spending of the budget.
Encumbrances in the State Public School Fund and Direct Grants Fund lapse at fi scal year-end, and the transactions are cancelled. Encumbrances in the Local Current Expense Fund and Capital Outlay Fund that are related to long term projects are carried over to the next fi scal year. These amounts are reserved in the fund balance and are appropriated at the beginning of the next fi scal year. All other encumbrances lapse at the end of the fi scal year-end the transactions are cancelled.
89Budget Administration and Management ProcessWake County Public School System - FY 2008-09 Plan for Student Success
Budget Administ ration and Management Process TRANSFERS
The budget is a spending plan based upon a series of assumptions. Rarely will all of the actual expenditures equal the detailed budget estimates as adopted. Adjustments to individual items may become necessary. Funds can be transferred from one account to another within the guidelines of the particular funding source. If circumstances or variables change from those defi ned in the Plan for Student Success, budget transfers are submitted to realign fi nancial resources, including documentation to explain why the re-alignment is necessary.
AMENDMENTS
Primary budget managers submit budget amendments when new funds need to be added to the budget or if funds need to be removed from the budget. Revenues not included in the adopted budget must be approved for accep-tance by the board of education.
FUNDS CHECKING
The Oracle Financial System is currently confi gured to monitor available funds at the program level, with separate subtotals monitored for salary/ben-efi t accounts and purchased services/supply/equipment accounts. Available balances must exist in non-personnel accounts at the account code level be-fore spending can occur. At the school level, available balances must exist at the program level for staff development and supply budgets before spending can occur.
MANAGEMENT INFORMATION AND REPORTING
The Wake County Public School System (WCPSS) uses the Oracle Financial System to manage human and fi nancial resources. Oracle has an interactive, on-line budgetary control system that provides real-time data on individual accounts. The system includes a general ledger, payroll, and voucher system that provides detailed historical transactions. Summary and detail reports can be submitted by budget manager for their area of responsibility at any time. Monthly reports are provided to Wake County. The reports produced from
the computer system are designed to meet internal and external needs of the district. Reports are available for revenue as well as expenditure accounts. The district prepares a Comprehensive Annual Financial Report (CAFR) to report the results of operations. The CAFR includes such reports as a com-bined balance sheet for all fund types and a combined statement of revenues, expenditures, and changes in fund balances for all governmental funds.
QUARTERLY FINANCIAL REVIEWS
The chief business offi cer, fi nance offi cer, and senior director of budget meet with each chief and with the area assistant superintendents and their prin-cipals on a quarterly basis to review human and fi nancial data. Internal controls and risks are also discussed each quarter. Budget managers are required to present information on the following:
A detailed review of any positions that have been vacant longer than 180 days and discussion regarding closure of positions.A review of staff development funding utilization.A discussion of unspent funds for the prior fi scal year and related specifi c changes for the current fi scal year that the budget manager has planned.Any planned re-purposing of funding within their respective areas for the current fi scal year.Actions taken during the previous quarters to utilize additional funding provided to their divisions through the prior year’s Adopted Plan for Student Success.Any processes that are in place for leadership within their divisions to review budget, encumbrance, and/or expenditure information on a regu-lar basis between quarterly reviews.Review a listing of all budget lines in Oracle within the respective area. Discussion of all business cases submitted for the upcoming fi scal year.
FRAUD HOTLINEThe Internal Audit Department provides a fraud hotline for anonymous com-plaints. That number is 1-866-674-4872.
•
••
•
•
•
••
90 www.wcpss.net
Not es
91District and Financial StructureWake County Public School System - FY 2008-09 Plan for Student Success
DISTRICT LEGAL AUTHORITY
The Wake County Public School System (WCPSS) is one comprehensive school district serving the entire county. At the helm of the school system is the Board of Education and its Superintendent. They are committed to providing the highest possible quality of education to Wake County students, while maintaining fi scal responsibility and accountability. The board con-sists of nine members, elected in districts by the public, who serve staggered four-year terms. The superintendent is selected by the board and serves as chief executive offi cer of the school system. The board is responsible for setting policy and the superintendent and administrative staff manage the system’s day-to-day operations. In North Carolina, the basic public educa-tion program is funded by the state and is augmented with local funds. The board has budget review authority but it is not a taxing body and must sub-mit its annual budget requests to the Wake County Board of Commissioners, which controls allocation of funds to the schools.
FINANCE STRUCTURE
In 1975, the General Assembly enacted a law requiring a uniform account-ing system for all local school administrative units effective July 1, 1976. The minimum requirements for the account code structure consist of four dimensions. The dimensions are: fund, purpose, program, and object.
The Wake County Public School System has adopted a budget-coding sys-tem, which incorporates the uniform chart of accounts of the State Board of Education with three additional dimensions. These dimensions are: level, cost center, and future use.
As of July 1, 2007, the North Carolina Department of Public Instruction (NCDPI) enacted signifi cant changes to the uniform chart of accounts. These changes exploded the account code structure in a more detailed man-ner. Historical data comparisons at a specifi c code level will have to be re-built from 2007-08 forward. The purpose of such detail is to enable manage-ment at the school and system levels to make informed decisions regarding the utilization of limited resources to provide the most effective educational programs for students and to do so as effi ciently as possible.
There are seven dimensions in the 23-digit coding scheme used in the budget: fund, purpose, program, object, level, cost center, and future use. The seven dimensions occur in a fi xed sequence. This dimension classifi es expendi-tures and revenues into groups so that meaningful analyses can be made.
No single dimension used alone would provide enough information for ac-countability and responsive management. By relating a specifi c expenditure to all dimensions, complete accountability is realized and more information is available to management.
Describes a plan of activity or a funding for a particular activity.
The service or commodity obtained as the result of a specifi c expenditure.
Level codes are not required by NCDPI. They are created at the Wake County Public Schools to provide greater detail such as depart-
mental or project costs.
Specifi es the school or central services division of the school system at which the expenditure is to be incurred.
Fund
An independent fi scal accounting entity with a self-balancing set of accounts comprised of assets, liabilities, fund equity, revenues,
and expenditures or expenses. Fund ac-counting segregates funds according
to their intended purpose and is used to aid management in demonstrat-ing compliance with fi nance-related
legal and contractual provisions.
PurposeDescribes the purpose for which
the activity exists or the type of balance sheet account.
Program
Obj ect
Level
Cost Center
Dist rict and Financial Structure
92 www.wcpss.net
Dist rict and Financial Structure
BASIS OF PRESENTATION - FUND ACCOUNTING
The accounts of the board are organized on the basis of funds, each of which is considered a separate accounting entity. The operations of each fund are accounted for with a separate set of self-balancing accounts comprised of assets, liabilities, fund equity, revenues, and expenditures or expenses. Fund accounting segregates funds according to their intended purpose and is used to aid management in demonstrating compliance with fi nance-related legal and contractual provisions.
The Board’s budgets are adopted as required by the North Carolina General Statutes. Annual budgets are adopted for all funds except for the individual schools’ special revenue funds, as required by the North Carolina General Statutes. No budget is required by state law for individual school funds.
THE BUDGET INCLUDES THE FOLLOWING FUNDS:
State Public School Fund:Appropriations for the current operating expenses of the public school sys-tem from monies made available to the local school administrative unit by the State Board of Education. These funds are expended according to the provisions of the statutes. This is a special revenue fund.
Local Current Expense Fund:The board’s primary operating fund used to account for all fi nancial resourc-es of the board except those required to be accounted for in another fund. These appropriations shall be funded by monies made available by the board of county commissioners, and other noncategorical revenues such as interest earned, indirect cost, fi nes and forfeitures, e-rate, cell tower leases, tuitions, and fees. This is a general fund.
Federal Grant Fund - State:Appropriations for the expenditure of federal categorical grants made by
the Department of Public Instruction (NCDPI). These appropriations are categorical in nature; i.e., programs and services for children of low-income families; programs and services designed to eliminate the effects of previous discriminatory practices, etc. This is a special revenue fund.
Capital Outlay Fund:The capital outlay fund accounts for the acquisition of fi xed assets or con-struction of major capital projects not being fi nanced by the enterprise fund. Capital projects are funded by Wake County appropriations, by the proceeds of Wake County bonds issued for the construction of public schools, and by certain state assistance. This is a capital projects fund.
Multiple Enterprise Fund:This is an enterprise fund that accounts for the operations of the board’s child nutrition services program. The board’s intent is that the costs, in-cluding depreciation, of providing food services to the individual schools be partially recovered by user charges. Other enterprise accounts are included, such as before and after school care, community use of schools, community schools, and preschool programs.
Direct Grant Fund:The direct grant fund includes programs fully supported by an external fund-ing source such as a direct state, local, or federal grant or contract.
PURPOSE CODES
Purpose means the reason for which something exists or is used. Purpose includes the activities or actions that are performed to accomplish the objec-tives of a local school administrative unit. For budgeting and accounting purposes, expenditures are classifi ed into fi ve categories:
The “purpose dimension” has four digits and is broken down into a function level at the second digit and, where appropriate, into a sub-function level at the third digit.
5000’sInstructional
Services
6000’sSystemwide
Support Svcs.
7000’sAncillary Services
8000’sNon-Programmed
Charges
9000’sCapital Outlay
01State Public School Fund
02Local Current Expense Fund
03Federal Grant
Fund
04Capital
Outlay Fund
05Multiple
Enterprise Fund
07Direct Grant
Fund
93District and Financial StructureWake County Public School System - FY 2008-09 Plan for Student Success
Dist rict and Financial Structure PROGRAM CODES
A program code is a plan of activities or funding designed to accomplish a predetermined objective. This dimension of program report codes allows the unit a framework for classifying expenditures by program to determine cost.
OBJECT CODES
The object code indicates the service or commodity obtained as a result of a specifi c expenditure. Seven major object categories are used in the Chart of Accounts:
These broad categories are subdivided to obtain more detailed information about objects of expenditures.
LEVEL CODES
For schools and instructional programs, the level code specifi es the subject area in the school for which the expenditure is proposed. Central Services level codes typically indicate departments.
COST CENTER CODES
The cost center code specifi es the school or central services division of the school system at which the expenditure is to be incurred. Central Services divisions also have cost centers in an 0800 series that indicates expenditures
made centrally on behalf of schools. Examples: substitutes for a workshop sponsored by curriculum and instruction, custodial supplies purchased cen-trally, etc. Central Services cost centers in the 0900 series indicate central costs.
THE BUDGET DOES NOT INCLUDE THE FOLLOWING FUND:
Expendable Trust Fund:The expendable trust fund is used to account for the revenues and expendi-tures of the activity funds of the individual schools. The primary revenue sources include funds of the various clubs and organizations, receipts from athletic events, proceeds from various fund-raising activities, and private donations. The primary expenditures are for instructional programs, athlet-ics, and club activities. School activity funds are administered by the indi-vidual schools but are under the supervision and control of the board.
DEBT OBLIGATION
In North Carolina, school systems do not tax directly. School systems re-quest local funding from the County Commissioners. County Commission-ers assess property taxes and assume any debt.
Legal provisions confl ict with Generally Accepted Accounting Principles (GAAP) in that there is no authorization for the Board to maintain a debt service fund even though the statutes allow continuing contracts for capital outlay purchases. In accordance with governmental accounting and fi nan-cial reporting standards, the Board maintains its accounts and prepares its budgetary reports on the legally prescribed (non-GAAP) basis and maintains suffi cient supplemental records to permit presentation of the fi nancial state-ments in conformity with GAAP. Under the legally prescribed budgetary (non-GAAP) basis, all amounts otherwise shown in the debt service fund are included in the capital projects’ fund; therefore an annual budget is not adopted for the debt service fund.
200’sEmployer
Provided Benefi ts
300’sPurchased Services
400’sSupplies & Materials
500’sCapital Outlay
600’sReserved for Future Use
100’sSalaries
700’sTransfers
001-299State & Federal
Funds; NCDPI defi ned
300-399Federal Grants not allotted by NCDPI
400-499State Grants - Funds not allotted by NCDPI
500-599Local Grants and
Donations
600-699Local Special
Revenue Sources
700-799Tuition or Fee Funded
Programs
800-899Local Cost Centers
94 www.wcpss.net
Budget Res olution
95Budget ResolutionWake County Public School System - FY 2008-09 Plan for Student Success
Budget Res olution
96 www.wcpss.net
Budget Res olution
97Budget ResolutionWake County Public School System - FY 2008-09 Plan for Student Success
Budget Res olution
98 www.wcpss.net
The Anticipated Revenue schedules are a comparison of three years of budget by funding source, plus two years of forecasted revenues. Governmental fi nancial reporting focuses on grouping of various funds rather than as a whole. Fund accounting is developed from legal compliance and resource limitation issues. Data is presented for each fund to show all sources of revenue. In public sector accounting, budgeted revenues represent an authorization to spend funds.
1 Conversions are situations where schools transfer resources between funding allotment categories in accordance with General Statute 115C-105.25. These requests are approved by NCDPI on a year-by year basis. Conversions for 2008-09 will be recorded after July 1, 2008. The 2007-08 fi gures refl ect conversions processed through January 2008.2 The 2008-09 fi gures include substitute reimbursements for a 12-month time period. The 2007-08 fi gures include allotments for an 8-month time period. Allotments for January-April will not be recorded until released by NCDPI.
Anticipated Revenues
Source of Income Budget 2006-07 Budget 2007-08 Budget 2008-09Increase/Decrease
99Anticipated RevenuesWake County Public School System - FY 2008-09 Plan for Student Success
Anticipated Revenues
3Textbooks were budgeted as a state sources in the local Local Current Expense fund in 2006-07.4 Textbook budgets for 2008-09 were “advanced” to schools on February 1, 2008. NCDPI allows this to occur so orders can be placed and books can be delivered prior to schools opening in July 2008. Therefore, the 2007-08 budget is overstated by $9.4 mil-lion due to the advance.5 Conversions are situations where schools transfer resources between funding allotment categories in accordance with General Statute 115c-105.25. These requests are approved by NCDPI on a year-by year basis. Conversions for 2008-09 will be recorded after July 1, 2008. The 2007-08 fi gures refl ect conversions processed through January 2008.
Source of Income Budget 2006-07 Budget 2007-08 Budget 2008-09Increase/Decrease
6 Conversions are situations where schools transfer resources between funding allotment categories in accordance with General Statute 115c-105.25. These requests are approved by NCDPI on a year-by year basis. Conversions for 2008-09 will be recorded after July 1, 2008. The 2007-08 fi gures refl ect conversions processed through January 2008.
Source of Income Budget 2006-07 Budget 2007-08 Budget 2008-09Increase/Decrease
101Anticipated RevenuesWake County Public School System - FY 2008-09 Plan for Student Success
Anticipated Revenues
7 Conversions are situations where schools transfer resources between funding allotment categories in accordance with General Statute 115c-105.25. These requests are approved by NCDPI on a year-by year basis. Conversions for 2008-09 will be recorded after July 1, 2008. The 2007-08 fi gures refl ect conversions processed through January 2008.8 Textbook funds for 2006-07 are shown as a state source in the Local Current Expense Fund. Effective July 1, 2007, NCDPI allowed districts to report Textbook budgets in the State Public School Fund.
Source of Income Budget 2006-07 Budget 2007-08 Budget 2008-09Increase/Decrease
TOTAL - STATE $ 629,027,715 $ 718,563,148 $ 756,833,757 $ 38,270,609 5% $ 822,987,472 9% $ 888,345,448 8%
Other State AllocationsTextbooks 8
Current Year Allotment $ 8,313,535 Less: Adv Spending 2006 (4,455,282) Textbooks - Advance 8,794,726 Carryforward 4,257,545 Conversions 7 (2,949,024)
13,961,500
Local Current Expense Fund - FUND 2
State Public School Fund
102 www.wcpss.net
Anticipated Revenues
9 Effective July 1, 2007, the Direct Federal Grants Fund was changed to the Direct Grants Fund to better track all grants received directly from the grantor. Previously, only grants directly received from the federal government were tracked in this fund and all other grants were in the general fund. The year end process for grants is different than the other programs in the general fund. This change will also allow more consistency in the year-end processes. All state grants have moved to Direct Grants Fund effec-tive July 1, 2008.10 Effective July 1, 2007, the Direct Federal Grants Fund was changed to the Direct Grants Fund to better track all grants received directly from the grantor. Previously, only grants directly received from the federal government were tracked in this fund and all other grants were in the general fund. The year end process for grants is different than the other programs in the general fund. This change will also allow more consistency in the year-end processes. Medicaid budgets have moved to the Direct Grants Fund effective July 1, 2008.
Source of Income Budget 2006-07 Budget 2007-08 Budget 2008-09Increase/Decrease
%Change
Forecasted 2009-10
%Change
Forecasted 2010-11
%Change
Mobile Source Emission 9
Reduction Carryforward 100,000
State Improvement Project 9 60,000 Carryforward 32,680
12Effective July 1, 2007, the Direct Federal Grants Fund was changed to the Direct Grants Fund to better track all grants received directly from the grantor. Previously, only grants directly received from the federal government were tracked in this fund and all other grants were in the general fund. The year end process for grants is different than the other programs in the general fund. This change will also allow more consistency in the year-end processes. Categorical local grants and contracts were moved to the Direct Grants Fund effective July 1, 2008.13Effective July 1, 2007, the Direct Federal Grants Fund was changed to the Direct Grants Fund to better track all grants received directly from the grantor. Previously, only grants directly received from the federal government were tracked in this fund and all other grants were in the general fund. The year end process for grants is different than the other programs in the general fund. This change will also allow more consistency in the year-end processes. Categorical local grants and contracts were moved to the Direct Grants Fund effective July 1, 2008.
Source of Income Budget 2006-07 Budget 2007-08 Budget 2008-09Increase/Decrease
105Anticipated RevenuesWake County Public School System - FY 2008-09 Plan for Student Success
Anticipated Revenues
13Effective July 1, 2007, the Direct Federal Grants Fund was changed to the Direct Grants Fund to better track all grants received directly from the grantor. Previously, only grants directly received from the federal government were tracked in this fund and all other grants were in the general fund. The year end process for grants is different than the other programs in the general fund. This change will also allow more consistency in the year-end processes. Categorical local grants and contracts were moved to the Direct Grants Fund effective July 1, 2008.
Source of Income Budget 2006-07 Budget 2007-08 Budget 2008-09Increase/Decrease
%Change
Forecasted 2009-10
%Change
Forecasted 2010-11
%Change
Athens Library 13 177,731
New School Project 13
Current Year 103,412 Carryforward 56,981
160,393
NCAE and Peace College FundedPositions 13 139,781
More at Four 13 75,460 Carryforward 44,924
120,384
Smart Start Transition 13 119,742
Smart Start - Outreach for School 117,524Success 13
Support Our Students 13 104,000
Skills for Life 86,720
Exc. Child. Asst. Ctr. (ECAC) 13
Current Year 73,600Carryforward 11,295
84,895
Direct Grant Fund
106 www.wcpss.net
Anticipated Revenues
14Effective July 1, 2007, the Direct Federal Grants Fund was changed to the Direct Grants Fund to better track all grants received directly from the grantor. Previously, only grants directly received from the federal government were tracked in this fund and all other grants were in the general fund. The year end process for grants is different than the other programs in the general fund. This change will also allow more consistency in the year-end processes. Categorical local grants and contracts were moved to the Direct Grants Fund effective July 1, 2008.
Source of Income Budget 2006-07 Budget 2007-08 Budget 2008-09Increase/Decrease
%Change
Forecasted 2009-10
%Change
Forecasted 2010-11
%Change
Tennessee State University 14 55,000
Wake Co. Health Services Health 14 38,000
Professional Leave Paid by Outside Agencies 14 33,197
Raleigh Police Department 14
Lobby Guard Grant 33,131
Project Enlightenment General 14 20,000
Human Services Community Grant 14 15,000
CIS - Garner Magnet High School Grant 14 13,523
21st Century Transportation Grant 14 3,168
CEFPI Where Children Learn14
Carryforward 1,812
Contract for Transportation Outside Agencies 14 1,404
TOTAL - FEDERAL $ 53,321,754 $ 56,281,848 $ 55,356,818 $ (925,030) (2%) $ 58,711,448 6% $ 61,728,840 5%
110 www.wcpss.net
Anticipated Revenues
15Effective July 1, 2007, the Direct Federal Grants Fund was changed to the Direct Grants Fund to better track all grants received directly from the grantor. Previously, only grants directly received from the federal government were tracked in this fund and all other grants were in the general fund. The year end process for grants is different than the other programs in the general fund. This change will also allow more consistency in the year-end processes. Local grants and contracts were moved to the Direct Grants Fund effective July 1, 2008.16Effective July 1, 2007, the Direct Federal Grants Fund was changed to the Direct Grants Fund to better track all grants received directly from the grantor. Previously, only grants directly received from the federal government were tracked in this fund and all other grants were in the general fund. The year end process for grants is different than the other programs in the general fund. This change will also allow more consistency in the year-end processes. Direct Federal Grants and contracts were moved to Direct Grants Fund effective July 1, 2008.
Source of Income Budget 2006-07 Budget 2007-08 Budget 2008-09Increase/Decrease
111Anticipated RevenuesWake County Public School System - FY 2008-09 Plan for Student Success
Anticipated Revenues
17Effective July 1, 2007, the Direct Federal Grants Fund was changed to the Direct Grants Fund to better track all grants received directly from the grantor. Previously, only grants directly received from the federal government were tracked in this fund and all other grants were in the general fund. The year end process for grants is different than the other programs in the general fund. This change will also allow more consistency in the year-end processes. Direct Federal Grants and contracts were moved to Direct Grants Fund effective July 1, 2008.
Source of Income Budget 2006-07 Budget 2007-08 Budget 2008-09Increase/Decrease
18Effective July 1, 2007, the Direct Federal Grants Fund was changed to the Direct Grants Fund to better track all grants received directly from the grantor. Previously, only grants directly received from the federal government were tracked in this fund and all other grants were in the general fund. The year end process for grants is different than the other programs in the general fund. This change will also allow more consistency in the year-end processes. Categorical local grants and contracts were moved to the Direct Grants Fund effective July 1, 2008.
Source of Income Budget 2006-07 Budget 2007-08 Budget 2008-09Increase/Decrease
Wake to Wellness 18 145,891 142,187 (3,704) (3%) 130,703 (8%) 0 0%
Smart Start - Outreach for School 117,485 123,060 5,575 5% 128,543 4% 133,496 4% Success 18
New School Project 18
Current Year 103,412 103,412 0 0% 103,412 0% 0 0% Carryforward 82,326 0 (82,326) (100%) 0 0% 0 0%
185,738 103,412 (82,326) (44%) 103,412 0% 0 0%
Local Current Expense Fund
Local Current Expense Fund
113Anticipated RevenuesWake County Public School System - FY 2008-09 Plan for Student Success
Anticipated Revenues
19Effective July 1, 2007, the Direct Federal Grants Fund was changed to the Direct Grants Fund to better track all grants received directly from the grantor. Previously, only grants directly received from the federal government were tracked in this fund and all other grants were in the general fund. The year end process for grants is different than the other programs in the general fund. This change will also allow more consistency in the year-end processes. Categorical local grants and contracts were moved to the Direct Grants Fund effective July 1, 2008.
Source of Income Budget 2006-07 Budget 2007-08 Budget 2008-09Increase/Decrease
Object means the service or commodity obtained as a result of a specifi c expenditure.
Seven major object categories are used in our Chart of Accounts: (1) Salaries, (2) Employee Benefi ts, (3) Purchased Services, (4) Supplies and Materials, (5) Capital Outlay, (6) Other Objects, and (7) Transfers.
The North Carolina Association of School Business Offi cers (NCASBO) and the North Carolina Department of Public In-struction (NCDPI) approved a chart of accounts conversion that was effective July 1, 2007. There is not a one-to-one correlation with these chart changes. In many cases, there is an explosion of the chart from one old account to many new accounts. Due to this, we have lost comparability of historical data.
119Budget by Object Code - Operating BudgetWake County Public School System - FY 2008-09 Plan for Student Success
Budget by Obj ect Code - Operating Budget
1Costs fl uctuate between assistant principal and other assistant principal assignment dependent on the number of interns each year.2Each high school with a Board of Education approved program for JROTC is provided months of employment from categorical Federal funds. The number of months allotted is dependent upon the contractual agreement with the branch of service sponsoring the ROTC program. In addition, high schools in the program typically convert additional regular education ADM teacher months to supplement the JROTC program. Conversions must be submitted on a year-by-year basis in accordance with state law. 2008-09 fi gures will be amended to show conversions/transfers from Teacher to JROTC Teacher as they are processed after July 1, 2008.3Schools can convert months of employment to extended contract months in accordance with school improvement plans. These conversions allow principals to employ staff outside the 10 month contract period (Ex: July, during track-out, or June).4Costs fl uctuate within instructional personnel certifi ed categories dependent on the number of interim teachers, foreign exchange teachers, and re-employed retired teachers each year.5Schools submit conversions in accordance with General Statute 115C-105.25 Budget Flexibility. One of the most common conversions at the elementary level is the conversion of vacant teacher assistant positions to teacher positions. The conversion ratio is 2 teacher assistants to 1 teacher. 2007-08 data refl ects approximately $5 million for these items. Conversions for 2008-09 will be recorded after July 1, 2008.6There is no allotment for technology assistants at the school level. In accordance with fl exibility within allotment formulas, schools may request conversions from clerical or teacher assistant positions to technology assistants. The 2007-08 fi gures include the cost of approximately 33 positions for these conversions. Conversions for 2008-09 will be recorded after July 1, 2008.
7Substitute pay for staff development absences fl uctuates from year to year dependent on carryover balances of state and grant funding. School-based training budgets are initially established in a nonpersonnel workshop expense account. Expenditures are monitored at a rollup level. At the end of the fi scal year, transfers are processed to align budget to the distribution of the expenditures between substitute pay, stipends, and workshop expenses.
121Budget by Object Code - Operating BudgetWake County Public School System - FY 2008-09 Plan for Student Success
Budget by Obj ect Code - Operating Budget
8Substitute pay for staff development absences fl uctuates from year to year dependent on carryover balances of state and grant funding. School-based training budgets are initially established in a nonpersonnel workshop expense account. Expenditures are monitored at a rollup level. At the end of the fi scal year, transfers are processed to align budget to the distribution of the expenditures between substitute pay, stipends, and workshop expenses.9Intervention resources are allotted based on teacher months of employment. Schools may request conversion of the months to tutor dollars based on the needs at individual sites. The 2007-08 fi gures include those conversions to tutor dollars. Conversions for 2008-09 will be recorded after July 1, 2008.10Employer’s retirement cost is projected to increase from 7.83% to 8.18% of salaries.11Retirement cost for re-employed retired teachers will be transferred from regular retirement cost once the number of re-employed retirees is determined after July 1, 2008.12Hospitalization cost are projected to increase from $4,097 to $4,200 per year for full-time employees.
13Substitute pay for staff development absences fl uctuates from year to year dependent on carryover balances of state and grant funding. School-based training budgets are initially established in a nonpersonnel workshop expense account. Expenditures are monitored at a rollup level. At the end of the fi scal year, transfers are processed to align budget to the distribution of the expenditures between substitute pay, stipends, and workshop expenses.14Schools receive an allotment for classroom materials and supplies. They have fl exibility to spend these funds in other object codes such as library books, postage, travel, fi eld trips, tutors, and mobile communications. 2007-08 fi gures include transfers to fi eld trips at the school level. 2008-09 transfers will be recorded after July 1, 2008.
Object Code State Local Federal Total
FY 2008-09
FY 2007-08 TotalIncrease/Decrease
PercentChange
SALARIES AND EMPLOYER PROVIDED TOTAL $946,947,423 $706,505,057 $262,080,102 $44,692,019 $1,013,277,178 $66,329,755 7%
123Budget by Object Code - Operating BudgetWake County Public School System - FY 2008-09 Plan for Student Success
Budget by Obj ect Code - Operating Budget
15There is a reduction in the base budget from 2007-08 due to actual student membership being lower than anticipated when the 2007-08 budget was prepared.16In accordance General Statute 105C-105.25 textbook dollars and career and technical education teacher months can be converted to and from supply accounts based on school improvement plans. 2007-08 fi gures include these transfers. 2008-09 conver-sions will be recorded after July 1, 2008.17On February 1st of each year, we advance the textbook allotment for the subsequent year to each school so books can be ordered and arrive by July. 2007-08 textbook fi gures include the 2008-09 advance of $9.4 million. 18Schools receive an allotment for classroom materials and supplies. They have fl exibility to spend these funds in other object codes such as library books, postage, travel, fi eld trips, tutors, and mobile communications. 2007-08 fi gures include transfers to fi eld trips at the school level. 2008-09 transfers will be recorded after July 1, 2008.
School and Office Supplies $49,291,518 $20,974,151 $13,278,508 $2,393,138 $36,645,797 ($12,645,721) (26%)4% 3% 3% 3% 3%
SUPPLIES AND MATERIALS
124 www.wcpss.net
Budget by Obj ect Code - Operating Budget
19Municipal collaboration funds are contributed each year by cities, counties and towns to pay for a portion of particular capital projects. Unspent funds are reserved in fund balance at the end of each fi scal year. They are appropriated as approved by the board the subsequent year for the project specifi ed. 2007-08 fi gures include municipal collaboration funds. 2008-09 dollars will be recorded pending board action after July 1, 2008.
Object Code State Local Federal Total
FY 2008-09
FY 2007-08 TotalIncrease/Decrease
PercentChange
Fuel for Facilities $262,324 $227,600 $227,600 ($34,724) (13%)Repair Parts, Materials, and Related Labor, Grease, and Anti-Freeze $6,875,005 $1,515,228 $4,550,720 $6,065,948 ($809,057) (12%)Gas/Diesel Fuel $8,147,422 $4,071,454 $3,063,226 $7,134,680 ($1,012,742) (12%)Oil $139,833 $145,444 $11,323 $156,767 $16,934 12% Tires and Tubes $817,087 $747,017 $64,921 $811,938 ($5,149) (1%)
Furniture and Equipment-Inventoried- Federal Programs Only $437,706 $12,500 $439,315 $451,815 $14,109 3% Computer Equipment-Inventoried- Federal Programs Only $1,879,440 $5,000 $1,492,543 $1,497,543 ($381,897) (20%)
CAPITAL OUTLAY TOTAL $15,171,980 $285,954 $5,632,446 $279,769 $6,198,169 ($8,973,811) (59%)1% 0% 1% 0% 1%
Transfers to Individual School Fund $13,540 $0 ($13,540) (100%)Transfers to Charter Schools $10,025,007 $10,525,245 $10,525,245 $500,238 5% TRANSFERS TOTAL $10,038,547 $0 $10,525,245 $0 $10,525,245 $486,698 5%
1% 0% 3% 0% 1%
GRAND TOTAL $1,192,643,175 $757,083,408 $389,126,458 $78,096,721 $1,224,306,587 $31,663,412 3% 100% 100% 100% 100% 100%
1Percent change includes salary increases for non-certifi ed employees beyond legislated increases that will be distributed to affected purposed codes if funding is approved.2Percent change includes evaluation of programs - Curriculum Management Audit.3Percent change includes recurring funds to increase the number of areas in the district from six to seven in 2008-09 in response to action steps in the Curriculum Managment Audit.4Decrease includes $4.0 million that is being removed from the base budget from 2007-08 due to budget savings from student membership coming in lower than projected.5Percent decrease is due to removal of one-time adjustments in 2007-08 for a school’s Fund 6 account.
Budget by Purpose Code - Operating Budget
127Staff AllotmentsWake County Public School System - FY 2008-09 Plan for Student Success
MONTHS OF EMPLOYMENT
The staff budget schedules on the next several pages are displayed in terms of “months” rather than full-time equivalent positions due to the way we al-lot and track the human resources of the school system. Months of employ-ment are allotted for staffi ng each year. Principals can use these months for full-time or part-time employees on 9, 10, 11, or 12-month contracts. They may also use individual months or groups of months to hire temporary work-ers during critical times. In Wake County Public School System (WCPSS), controlling the hiring process within a budget of months is called “position control.”
ALLOTMENT PROCESSThe allotment process for 2008-09 begins in March 2008. Much work must occur during the spring so that staff will be in place when schools open in July and August. Over 80 percent of the school system’s operating budget is spent on salaries and benefi ts. Quick and accurate communication is important dur-ing this process.
WCPSS has an interactive website on the intranet that allows principals to view allotments by category for each school. It also provides an area for cal-culating “what-if” scenarios. Data in the allotment website is the basis for positions entered as months of employment into the Oracle human resource and fi nancial system. Once positions are entered into Oracle, the posting, recruiting, hiring, and paying processes can occur.
The allotment process begins once the Board of Education adopts the stu-dent assignment plan. The growth management department establishes stu-dent membership projections by school and grade. These are entered into the allotment website. Principals have a three-day period to review the stu-dent membership fi gures on their site and discuss any concerns with Growth Management. Revisions to projections are entered into the website at the end of that week. The projection fi gures will not change after that date.
Once the student projections are entered into the allotment website, the months of employment for regular Average Daily Member-ship (ADM) teachers and teacher assistants are displayed according to formulas built into the website. Months of Employment (MOE) in curriculum and auxiliary ser-vices areas are provided by bud-get managers in those central ser-vices departments. The budget department aligns the positions in Oracle to these months by site. Position numbers are added for schools that are projected to in-crease in numbers. End dates are assigned to position numbers for schools that are projected to decrease in numbers. Budget staff consults with human resource administrators and principals when determining posi-tion numbers that must be end dated. Regular ADM teacher, teacher assis-tant, curriculum and instruction months, and clerical months will be adjusted later based on the actual tenth day student membership. Therefore, princi-pals use the data on the website for these categories as a planning tool.
Principals are cautious when hiring for the regular ADM teacher and teacher assistant positions due to the “reconciliation” of months that will occur on the tenth day of school. If the principal hires more staff than the school earns on the tenth day, then one of four steps occurs:
ALTERNATIVES FOR OVER-STAFFING
School requests a conversion. School charges months to the individual school account in fund 6.School reorganizes; employees are moved to another school that has vacancies.Areas superintendent requests funding for a one-time exception at a school. These are reported to the Board of Education quarterly on the over/under report.
1.2.3.4.
Over 80 percent of the school system’s operating budget is spent on salaries and benefits.
Staff Allot ments
128 www.wcpss.net
Staff Allot mentsNo reserve of months is held at the central level to cover “overages” that might occur. This is intentional. We provide the maximum amount of resources to schools at the beginning of the school year. Holding reserves that might be re-leased at a later time would disrupt the organization of classes at each site.
If a principal determines that the student membership at a school will likely be signifi cantly higher than the planning fi gures loaded by growth management, then additional months of employment can be added for teachers and teacher assistants. These are labeled as “self-allotted” months of employment on the website and Oracle and fall under the same reconciliation process on the tenth day of school as the other positions.
There are other administrative, instructional, and support categories of allot-ments on the website other than regular ADM teachers and teacher assistants. These include: Principal, assistant principal, clerical, custodians, child nutrition, media specialist, curriculum and instruction, academically gifted, magnet, Title I, English as a Second Language, grants, Title V, local literacy, at-risk, special education, intervention, counselor, speech, psychologist, social work, and Stu-dent Assistant Program (SAP) coordinators. Budget managers in central offi ce departments are “allotters” of these categories. Allotters use the adjusted plan-ning allotments loaded by growth management to provide months of employ-ment for each category by school. These months are loaded into the allotment website and balanced to position numbers in Oracle. Months on the website in these categories are an authorization to hire staff.
FLEXIBILITY
Flexibility among categories of positions is important to meet the unique needs at each site. The state allows limited fl exibility among categories in compliance with Section 115C-105.25 of Public School Law of North Carolina. WCPSS al-lows additional fl exibility within locally funded months of employment. There is a service/allotment description page for each allotment category on the web-site. These pages identify if the months may be converted to another category or not.
CONVERSIONS
CONVERSIONS THAT ARE TYPICALLY DONE EACH YEAR BY SCHOOLS:
Conversion of teacher assistant to teacher months (2 to 1 ratio).Conversion of teacher assistant months to technology assistants (1 to 0.83 ratio).Conversion of teachers to teacher assistants in the English as a Second Language Program (1 to 2 ratio).Conversions between assistant principal and teacher months. (1 assistant principal month equates to 1.20 teacher months).Conversions between types of clerical assistants (ratios vary for clerical assistants, media assistants, secretaries, receptionists, registrars, NC Wise data managers, bookkeepers, and lead secretaries).Conversion of Intervention months of employment to tutor and supply dollars.
•••
•
•
•
EFFICIENT AND EFFECTIVE USE OF RESOURCES
There is a reconciliation process for each school based on tenth day student membership. All conversion requests and requests to extend contracts from the end of school through June 30th are due by October 31st. Finance staff provide data to principals at the fi rst quarter review in area superintendent meetings to make sure principals use or convert all months allotted to their site.
129Staff BudgetWake County Public School System - FY 2008-09 Plan for Student Success
The “Staff” and “Analysis of Increase (Decrease) in Months of Employment” shows months of employment that are budgeted. Position control allotments are managed in terms of months rather than positions. Wake County Public School System has employees on 9, 10, 11, and 12 month contract basis. Schools may process conversions from one type of position to another within ABC Transfer Policies. These conversions are for a one-year period only. The effects of the conversions have been removed from the data in this chart. To get a rough estimate of full-time equivalent (FTE) positions divide total month of employment by 10. This will be an estimate because our employees have different contract lengths of 9, 10, 11 or 12 months.
124 months funded by Project Enlightenment Legislative Appropriation.25 months funded by More at Four.322 Months funded by Athens Library, 27 months funded by Outside Agencies, 2 months funded by More at Four, 132.5 months funded by Smart Start program.41.5 months funded by Outreach for School Success
530 months funded by Magnet School, 12 months funded by Transition Teaching, and 12 months funded by Project Quest.630 months funded by Magnet School.756 months funded by Magnet School and 52 months funded by Elementary Counseling Demonstration Program.823 months funded by Project Quest and 12 months funded by Emergent Literacy Grant.
924 months funded by Athens Library.1010 months funded by Garner Magnet High School Grant.11 6 months funded by Magnet School and 42 months funded by Transition to Teaching.
Analysis of Increase (Dec rease) in Months of Employ ment
State Local Federal Enterprise Total
Page
Director and/or SupervisorG 278 Senior administrator for recruitment months 24.00 24.00S 293 Internal audit senior administrator 12.00 12.00S 291 Senior administrator for salary administration and organizational management 12.00 12.00N 335 Senior administrator for community schools 12.00 12.00N 327 Senior administrators for program evaluation - curriculum management audit 36.00 36.00
0.00 84.00 0.00 12.00 96.00
PrincipalG 234 Principal months for schools opening in 2008-09 36.00 36.00G 238 Early hire principal months for schools opening in 2009-10 20.00 5.00 25.00V 357 One-time allotment for leave, class size, scheduling, and construction issues (0.25) (0.25)
56.00 4.75 0.00 0.00 60.75
Assistant PrincipalG 179 Assistant principal months for schools opening in 2008-09 and growth 81.00 13.00 94.00V 339 Assistant principal months for ninth grade center at Cary High School (12.00) (12.00)V 357 One-time allotment for leave, class size, scheduling, and construction issues (11.00) (11.00)
81.00 (10.00) 0.00 0.00 71.00
Assistant SuperintendentG 237 Area superintendent months for growth 12.00 12.00
TeacherG 182 Classroom teacher months for new schools and growth 2,836.00 (192.00) 2,644.00
G 192 Academically gifted teacher months for growth 43.00 43.00G 195 Career and technical education teacher months for growth 270.00 270.00
Administrative Personnel
Instructional Personnel - Certified
Months of Employment
G - GrowthS - SystemwideC - Commitments by BOE to programs for future fundingN - New ProgramV - SavingsT - Grant Savings
133Analysis of Increase (Decrease) in Months of EmploymentWake County Public School System - FY 2008-09 Plan for Student Success
Analysis of Increase (Dec rease) in Months of Employ ment
State Local Federal Enterprise Total
Page
Months of Employment
G - GrowthS - SystemwideC - Commitments by BOE to programs for future fundingN - New ProgramV - SavingsT - Grant Savings
G 199 K-5 Curriculum and instruction teacher months for new schools and growth 207.00 207.00G 196 English as a second language teacher months for growth 87.00 87.00G 253 Local literacy teacher months to support K-2 intervention and coaching for new
elementary schools18.00 18.00
G 215 Special education teacher months for growth 528.00 528.00G 197 Intervention teacher months due to growth 101.00 8.00 109.00G 193 Alternative schools and programs teacher 20.00 20.00G 203 Preschool special education referral and assessment team teacher months 12.00 12.00G 203 Preschool special education referral and assessment team case manager months 12.00 12.00C 320 Phase out magnet teacher positions at Olds Elementary (4.00) (4.00)C 320 Phase out magnet teacher positions at Lincoln Heights Elementary (11.00) (11.00)C 323 Phase out magnet teacher positions at North Garner Middle School (50.00) (50.00)N 325 Alternative school teacher months for Longview 20.00 20.00N 326 ESL Academy teacher months 30.00 30.00V 358 Teacher one-time allotments in 2007-08 for tenth day overages (159.85) (159.85)V 357 Teacher one-time allotments for leave, class size, scheduling, and construction issues (83.00) (83.00)
V 359 Teacher one-time allotments in 2007-08 for Title I school choice (11.00) (11.00)V 340 Project Achieve teacher months (53.50) (53.50)
Instructional Support I - Regular Teacher Pay ScaleG 237 Special assistant to the new area superintendent 12.00 12.00G 274 Beginning Teacher Support Program (BTSP) coordinating teacher 12.00 12.00G 200 Media specialist months for growth 46.00 46.00G 207 School counselor months for growth 120.00 120.00G 211 School social worker months for growth 26.00 26.00G 218 Transition counselor months for growth 10.00 10.00
Instructional Support Personnel - Certified (Teacher Pay Schedule)
134 www.wcpss.net
Analysis of Increase (Dec rease) in Months of Employ ment
State Local Federal Enterprise Total
Page
Months of Employment
G - GrowthS - SystemwideC - Commitments by BOE to programs for future fundingN - New ProgramV - SavingsT - Grant Savings
N 329 Formative assessment specialist 12.00 12.00N 330 Positive Behavior Support (PBS) coaches 24.00 24.00N 320 Magnet coordinator positions 20.00 20.00T 371 Physical Education Program (PEP) months of employment (12.00) (12.00)V 339 Media specialist months for ninth grade center at Cary High School (5.00) (5.00)V 339 Guidance counselor months for ninth grade center at Cary High School (12.00) (12.00)
214.00 27.00 12.00 0.00 253.00
Instructional Support II - Advanced Pay ScaleG 194 Audiologists months for growth 6.00 6.00G 216 Speech therapist months for growth 33.00 33.00G 203 Speech Therapist for preschool special education referral and assessment team 12.00 12.00
0.00 51.00 0.00 0.00 51.00
PsychologistG 203 Psychologist months for preschool special education referral and assessment team 12.00 12.00G 210 School psychologist months for growth 32.00 32.00
32.00 12.00 0.00 0.00 44.00
Lead TeacherC 319 Lead teacher for Wake Early College satellite campus 11.00 11.00
Teacher Assistant - NCLBG 187 Teacher assistant months for new schools and growth 732.00 116.00 848.00G 214 Special education teacher assistant months for growth 282.00 498.00 780.00G 193 Teacher assistant months for elementary alternative services 20.00 20.00C 320 Phase out magnet teacher assistant months at Lincoln Heights Elementary (7.00) (7.00)V 359 Teacher assistant one-time allotment to schools in 2007-08 for Title I school choice (10.00) (10.00)
Instructional Support Personnel - non-Certified
135Analysis of Increase (Decrease) in Months of EmploymentWake County Public School System - FY 2008-09 Plan for Student Success
Analysis of Increase (Dec rease) in Months of Employ ment
State Local Federal Enterprise Total
Page
Months of Employment
G - GrowthS - SystemwideC - Commitments by BOE to programs for future fundingN - New ProgramV - SavingsT - Grant Savings
T 370 Risk pool teacher assistants due to grant ending (52.20) (52.20)V 358 Teacher assistant one-time allotment to schools in 2007-08 for tenth day overages (14.00) (14.00)
1,014.00 603.00 (52.20) 0.00 1,564.80
TherapistG 202 Physical therapist months for growth 21.00 21.00
0.00 21.00 0.00 0.00 21.00
Specialist (School-Based)V 357 Technology assistant one-time allotment to schools in 2007-08 for leave, class size,
scheduling, and construction issues(1.00) (1.00)
0.00 (1.00) 0.00 0.00 (1.00)
MonitorG 227 Safety assistant months for growth 240.00 240.00
Office SupportG 237 Secretary to new area superintendent 12.00 12.00G 221 Customer service representative months for growth 12.00 12.00G 193 Receptionist months for Longview alternative school 5.00 5.00G 260 Part-time secretary for budget department 6.00 6.00G 264 Processing assistant for risk management 6.00 6.00G 185 School-based clerical allotment for growth 175.00 175.00G 238 Early hire lead secretary months for schools opening in 2009-10 25.00 25.00G 185 Lead secretary months for new schools 36.00 36.00G 185 Media assistant months for new schools 36.00 36.00
Technical and Administrative Support Personnel
136 www.wcpss.net
Analysis of Increase (Dec rease) in Months of Employ ment
State Local Federal Enterprise Total
Page
Months of Employment
G - GrowthS - SystemwideC - Commitments by BOE to programs for future fundingN - New ProgramV - SavingsT - Grant Savings
G 185 NC Wise data manager months for new schools 36.00 36.00C 319 Clerical assistant months for Wake Early College satellite campus 6.00 6.00N 331 Program support months for Title I - supplemental education services 12.00 12.00N 327 Evaluation assistant for curriculum management audit 12.00 12.00V 357 Bookkeeper one-time allotment to schools in 2007-08 for leave, class size, scheduling,
and construction issues(5.00) (5.00)
S 291 Processing technician for salary administration and organizational management 12.00 12.00
S 289 School accounting specialist 12.00 12.00S 290 File room technician for human resources 12.00 12.00S 294 E-rate support analyst 12.00 12.00V 359 Clerical one-time allotment to schools in 2007-08 for Title I school choice (1.00) (1.00)V 339 Clerical assistant months for nine grade center at Cary High School (10.00) (10.00)
283.00 116.00 12.00 0.00 411.00
Administrative Specialist (Central Support)G 260 Senior budget analyst for budget department 12.00 12.00G 267 Instructional support technician (IST) months for growth 24.00 24.00
0.00 36.00 0.00 0.00 36.00
Subtotal - Technical and Administrative Support Personnel 283.00 152.00 12.00 0.00 447.00
DriverG 223 Bus drivers months for growth 784.00 (149.00) 635.00G 224 Child nutrition driver for new schools and growth 12.00 12.00
784.00 (149.00) 0.00 12.00 647.00
CustodianG 280 Custodial staff for additional square footage 60.00 60.00
60.00 0.00 0.00 0.00 60.00
Operational Support Personnel
137Analysis of Increase (Decrease) in Months of EmploymentWake County Public School System - FY 2008-09 Plan for Student Success
Analysis of Increase (Dec rease) in Months of Employ ment
State Local Federal Enterprise Total
Page
Months of Employment
G - GrowthS - SystemwideC - Commitments by BOE to programs for future fundingN - New ProgramV - SavingsT - Grant Savings
Cafeteria WorkerG 224 Child nutrition cashier/assistant months for new schools and growth 54.00 54.00
0.00 0.00 0.00 54.00 54.00
Skilled TradesG 282 Master craftsman for integrated pest management 12.00 12.00G 283 Buyer months for additional square footage 12.00 12.00G 283 Maintenance procurement specialist months for additional square footage 24.00 24.00G 283 Facility maintenance technicial months for additional square footage 36.00 36.00G 283 Craftsman plumber months for additional square footage 12.00 12.00G 283 Craftsman electrical months for additional square footage 12.00 12.00G 283 Craftsman HVAC months for additional square footage 12.00 12.00G 222 Bus dispatch months for growth 12.00 12.00G 224 Child nutrition assistant managers for new schools and growth 36.00 36.00S 308 Transportation Information Management System (TIMS) technician months 24.00 24.00V 343 Mechanic months due to outsourcing parts inventory (36.00) (36.00)V 343 Team leader parts months due to outsourcing parts inventory (12.00) (12.00)
(24.00) 132.00 0.00 36.00 144.00
ManagerG 280 Area custodial manager 48.00 48.00G 280 Regional custodial manager 12.00 12.00G 283 Planner 12.00 12.00G 224 CNS Managers for new schools and growth 36.00 36.00
60.00 12.00 0.00 36.00 108.00
Subtotal - Operational Support Personnel 880.00 (5.00) 0.00 138.00 1,013.00
Total 6,371.50 987.90 1.80 150.00 7,511.20
138 www.wcpss.net
Analysis of Increase (Dec rease) in Months of Employ ment
State Local Federal Enterprise Total
Page
Months of Employment
G - GrowthS - SystemwideC - Commitments by BOE to programs for future fundingN - New ProgramV - SavingsT - Grant Savings
G Growth 6,437.00 1,218.00 - 138.00 7,793.00S Systemwide 24.00 72.00 - - 96.00C Board of Education Commitments - (55.00) - - (55.00)N New Program 12.00 88.00 66.00 12.00 178.00V Savings and Reductions (101.50) (335.10) - - (436.60)T Grant Adjustments - - (64.20) - (64.20)
Total 6,371.50 987.90 1.80 150.00 7,511.20
139Statement of Revenues, Expenditures, and Changes in Fund BalanceWake County Public School System - FY 2008-09 Plan for Student Success
June 30, 2004 June 30, 2005 June 30, 2006Total
GovernmentalFunds
TotalGovernmental
Funds
TotalGovernmental
Funds General FundState Public School Fund
Capital Projects Fund
Non-MajorFunds
TotalGovernmental
FundsBeginning Fund Balance $46,158,369 $48,444,938 $44,401,592 $42,649,307 $10,578,201 $47,856 $53,275,364
REVENUES: County $377,094,820 $375,627,080 $478,606,100 $274,229,013 $228,000,190 $502,229,203 State $464,651,464 $500,863,537 $552,196,750 $4,281,656 $617,488,130 $616,328 $622,386,114 Federal $41,278,288 $46,268,755 $50,736,486 $206,119 $49,189,526 $49,395,645 Other Local $16,859,222 $20,164,127 $31,844,275 $19,929,868 $1,407,990 $780 $21,338,638 Total Revenues $899,883,794 $942,923,499 $1,113,383,611 $298,646,656 $617,488,130 $230,024,508 $49,190,306 $1,195,349,600
Total Expenditures $898,522,319 $946,557,066 $1,104,766,472 $305,115,725 $617,488,130 $235,271,474 $49,238,162 $1,207,113,491
Excess (deficiency) of revenues over expenditures $1,361,475 ($3,633,567) $8,617,139 ($6,469,069) ($5,246,966) ($47,856) ($11,763,891)
June 30, 2007
Statement of Revenues , Expenditures , and Changes in Fund Balance
140 www.wcpss.net
Statement of Revenues , Expenditures , and Changes in Fund Balance
June 30, 2004 June 30, 2005 June 30, 2006Total
GovernmentalFunds
TotalGovernmental
Funds
TotalGovernmental
Funds General FundState Public School Fund
Capital Projects Fund
Non-MajorFunds
TotalGovernmental
Funds
June 30, 2007
OTHER FINANCING SOURCES (USES): Installment purchase obligation issued $1,932,850 $1,932,850 Transfers in $4,033,616 $10,429,873 $4,439,068 $375,699 $4,814,767 Transfers out ($3,976,078) ($10,429,873) ($375,699) ($4,439,068) ($4,814,767) Capitalized leases $244,494Total Other Financing Sources (Uses) $244,494 $57,538 $4,063,369 ($2,130,519) $1,932,850
Increase in reserve for inventories $680,600 ($467,317) $256,633 $84,903 $84,903
Ending Fund Balance Reserved for: Inventories $3,961,583 $3,494,266 $3,750,899 $3,835,802 $3,835,802 Encumbrances $4,014,730 $2,748,791 $6,066,751 $50,156 $1,250,790 $1,300,946 By state statute $5,457,104 $3,425,162 $1,340,256 $1,871,626 $1,871,626 Special projects $2,921,481 $1,204,706 $1,778,337 $1,020,096 $649,402 $1,669,498 Restricted contributions $724,971 $2,678,503 $3,504,190 $986,803 $986,803 Self-insurance $3,458,684 $4,185,973 $4,883,883 $4,720,980 $4,720,980 Debt service $184,618 $116,966 $47,856 Unreserved: Designated for flexible benefits plan $297,902 $379,295 $433,413 $567,832 $567,832 Designated for subsequent year's expenditures $15,214,081 $9,687,401 $8,587,412 $12,928,333 $12,928,333 Undesignated $12,209,784 $16,480,529 $22,882,367 $15,333,685 $313,721 $15,647,406Ending Fund Balance $48,444,938 $44,401,592 $53,275,364 $40,328,510 $3,200,716 $43,529,226
Note: Data excludes school Trust Fund.
141Capital Improvement Plan (CIP)Wake County Public School System - FY 2008-09 Plan for Student Success
In the year 2000, the Wake County Public School System (WCPSS) had 97,853 students, including an increase of about 2,800 students. For 2006, WCPSS and county planners projected a student population of 127,513 stu-dents, but the actual enrollment was 128,072 – growth of more than 7,500 students. In 2007, actual enrollment was 134,002, an increase of 5,930 ad-ditional students. The face of growth has changed in Wake County. Families seeking a good quality of life and a good education for their children have found what they are looking for here, but they are coming in greater numbers than ever before. The result has been crowded campuses, long lines, mobile units, and a great deal of ingenuity in each of our schools as WCPSS em-ployees have worked to overcome the challenge.
In 1999, the Wake County Board of Education and Wake County Board of Commissioners developed a comprehensive building program fi nanced by bonds that would have required an increase in the property tax rate. Howev-er, Wake County voters rejected the bond referendum that year. The school board and county commissioners went back before the voters the following year with a smaller building program requiring no tax increase: PLAN 2000. This time, Wake County citizens supported the bonds.
Another bond referendum was held in 2003 to support the PLAN 2004 building program. It also called for no tax increases, and was approved by the voters. In both cases, compromises had to be made to hold down the cost of the building program, with some needed renovations and new schools be-ing deferred. Despite the passage of PLAN 2000, the failure of the 1999 ref-erendum interrupted the building of schools. No new schools were opened in 2001. At the same time, our student population growth was beginning to accelerate. WCPSS grew by 3,500 students in 2001, 3,000 in 2002, and
then there was a huge jump to 4,600 in 2003. This was well ahead of county planners’ projections, and the question was whether that growth was just an aberration. In 2004, WCPSS grew by 5,100 students, in 2005 by almost 6,500, and in 2006 by 7,500. The PLAN 2004 building program simply was not designed to respond to so many new students. At the same time, steep infl ation in construction costs meant that PLAN 2004 was running out of money ahead of schedule. Some school renovation projects that were origi-nally part of PLAN 2004 were delayed in order to implement a “crowding solution” for 2005. WCPSS opened three modular campuses in order to give three schools an early start before their permanent buildings were ready, and brought the number of temporary classrooms systemwide above 1,000 (with another hundred coming soon).
A year earlier than originally planned, the school board and county com-missioners presented a new school building program to Wake County voters in November 2006, and the voters approved the referendum by 53 to 47 percent. The Blueprint for Excellence 2006 builds new schools, identifi es land for future building programs, renovates existing schools, and provides needed technology upgrades. For the fi rst time since 1999, Wake citizens were asked to approve a property tax increase to fund the Blueprint. In an effort to keep that tax increase low and make optimal use of school facilities, 22 elementary and middle schools transitioned to the multi-track year-round calendar in the 2007-08 school year. Wake County has changed dramatically in the last few years. It is the fastest growing county in the state, adding 22,000 people each year. WCPSS has added more than 29,000 students to the system since 2002. The challenge, moving forward, is for our school system to respond to that growth, while keeping the focus on our students’ academic needs.
WHAT WILL THE CAPITAL IMPROVEMENT PLAN PROVIDE?
The new $1.056 billion building program, Blueprint for Excellence 2006, is primarily fi nanced through the $970 million school construction bond program. The Blueprint covers four main areas: construction and crowding solutions, land banking, renovations, and technology; and represents an in-vestment in the future of Wake County’s children, schools, and community.
The Capital Improvement Plan builds new schools, identifies land for future building programs, reno-
vates existing schools, and provides needed technology upgrades.
Capital Improvement Plan (CIP)
142 www.wcpss.net
Capital Improvement Plan (CIP)CONSTRUCTION AND CROWDING SOLUTIONS: Wake County classrooms are crowded: Teachers are holding class in closets and workrooms, and are not always able to give students the individual attention they need; lunch in some schools is starting at 10:15 a.m.; and mobile units are overtaking play fi elds and parking lots. In addition to the existing crowding, the Wake Coun-ty Public School System is expected to gain 27,000 new students by 2011.
With these things in mind, the Capital Improvement Plan (CIP) will build 17 new schools, easing crowding for current teachers and students and providing classrooms for the thousands of additional students moving into the county. Eleven elementary schools, four middle schools and two high schools will open between 2008 and 2011.
YEAR-ROUND SCHOOLS: In order to reduce projected crowding in the 2007-08 and 2008-09 school years, the Board of Education voted in May 2006 to gain at least 3,000 elementary school seats by converting 19 elementary schools from a traditional to a year-round calendar for 2007-08. The ac-tual gain achieved through optimizing the year-round use of the 19 schools was about 3,700 seats. Another 1,000 middle school seats were gained through the conversion of three middle schools to year-round. Schools on the multi-track year-round calendar can serve 20-33 percent more students than schools on the traditional calendar because at any given time, one of four groups is out on break. For every three schools on the year-round calen-dar, that is one less school that WCPSS needs to build.
NINTH GRADE CENTERS: To help with crowding at high schools, WCPSS added two ninth-grade centers in 2007. One of the centers in particular is a great example of WCPSS’ innovative solutions for providing classrooms: WCPSS has retrofi tted a former Winn-Dixie in Wake Forest for Wakefi eld High’s ninth-graders. In addition, Wake Forest-Rolesville High is using the modular campus at the DuBois Center, and Millbrook High is using the mo-bile/modular units already on campus from its earlier renovation project.
LAND BANKING: Signs advertising new developments are evident all over the county. With the availability of suitable land shrinking and the cost of land skyrocketing, it is wise to buy land now for future use. That is why the
CIP includes funding for land and design start up for 13 future schools - seven elementary, four middle, and two high - to open in 2011- 2013. Ideally, WCPSS wants to purchase property further ahead, but this is a good start.
RENOVATIONS: Older schools need renovation to ensure they are quality places for teachers to teach and children to learn. This CIP covers major renovations at 13 schools: Aversboro Elementary, Bugg Elementary, Cary High, East Millbrook Middle, East Wake High, Enloe High, Lacy Elemen-tary, Lynn Road Elementary, Martin Middle, Poe Elementary, Root Elemen-tary, Smith Elementary, and Wilburn Elementary. Renovations range from replacing or renovating 40 year-old classrooms to addressing traffi c safety issues to making areas accessible to those with disabilities.
The plan also addresses repairs and maintenance projects at nearly 100 schools across the county. These deferred life-cycle replacements involve roofs, air conditioning systems, boiler replacements, etc. - things one typi-cally does not think about until they stop working. To determine renova-tion needs, WCPSS looks at building system life-cycle replacements and a 40-year major renovation cycle. Schools are prioritized based on a facility condition index, a ratio of the cost of work needed at the building divided by the building replacement value.
TECHNOLOGY: The bond is enabling WCPSS to implement a technology replacement and upgrade program. A signifi cant number of the computers used by students and teachers in Wake County schools are old and outdat-ed. They cannot run much of the current instructional software; they run so slowly that students are frustrated trying to use them; they frequently break down and are out of service until repairs can be made; or teachers are fearful of using them due to other performance issues. A systematic replacement of these computers will enable student and teacher access to the wealth of technology resources and online information available to support learning and teaching in Wake County schools.
143Capital Improvement Plan (CIP)Wake County Public School System - FY 2008-09 Plan for Student Success
Capital Improvement Plan (CIP)
MILLS PARK ELEMENTARY LAUREL PARK ELEMENTARY SYCAMORE CREEK ELEMENTARY
Project Summary
Construction of a new three-story 800 student capacity elementary school derived from the E-15 and E-18 elementary designs. The main fl oor will consist of K-1 students with K-1 classrooms, 2 self contained classrooms (self contained suite), 1 CCR, 1 general support and all support facili-ties. The second fl oor will accommodate 2nd & 3rd grade classrooms. The third fl oor will ac-commodate 4th & 5th grade classrooms.
OBJECTTOTAL
PROJECTEDDesign $ 1,476,388
Construction 21,537,692
Miscellaneous Contracts 624,920
Furniture / Equipment 1,990,657
Library Books 318,131
Savings 0
TOTAL $ 25,947,788
Total Acres 20
New/Total Square Footage 103,769
Project Summary
Renovation of existing industrial building “Be-spak” for Laurel Park Elementary School. Con-struction will provide a new second fl oor at an existing high-bay space. Space will also be pro-vided for auto, bus traffi c, and parking. Outdoor space will also be provided for the physical edu-cation program.
OBJECTTOTAL
PROJECTEDDesign $ 1,238,448
Construction 17,314,902
Miscellaneous Contracts 327,911
Furniture / Equipment 1,952,103
Library Books 312,409
Savings 0
TOTAL $ 21,145,773
Total Acres 15.63
New/Total Square Footage 111,365
Project Summary
Sycamore Creek Elementary School is a new, larger elementary prototype adapted from the Cedar Fork design by Small Kane Architecture. However, it has been changed to re-confi gure (from prototype design) the classroom wings to a two story arrangement that will wrap around a courtyard. It also includes reduced classrooms sizes and corridor widths.
OBJECTTOTAL
PROJECTEDDesign $ 1,231,819
Construction 20,496,824
Miscellaneous Contracts 518,634
Furniture / Equipment 2,138,202
Library Books 314,383
Savings 0
TOTAL $ 24,699,862
Total Acres 17.24
New/Total Square Footage 103,348
144 www.wcpss.net
Not es
145Historical Comparison of Expenditures Per Pupil (excluding Child Nutrition)Wake County Public School System - FY 2008-09 Plan for Student Success
EXPENDITURES PER PUPIL
(1) Current Expense Expenditures
Current expense expenditures are all expenditures connected with the daily operation of the more than two thousand schools of the state.
The amount of current ex-pense expenditures, being closely tied to the number of students, are more stable.
(2) Capital Expense Expenditures*
Capital expense expenditures consist of all disbursements made for the construction of new build-ing and grounds, reconstruction or repair of old buildings, and the ac-quisition of equipment with a life-time greater than a year.
The amount of capital expense expenditures fl uctuates con-siderably from year to year.
*Charts included on the next page will not display Capital Expense Expendi-tures.
•
•
The North Carolina Department of Public Instruction (NCDPI) publishes information about the fi nancing of public education. The current expense expendi-tures obtained from fi nancial records submitted dur-ing the year, and electronic records obtained from the Local Education Agency (LEA) fi les at the close of each fi scal year. Although the contents of the latter transmission are not audited, they are an accurate ac-counting of revenues and expenditures by each LEA for the preceding fi scal year. By legislative mandate, long-term debts of school systems (debt service) are a part of the county budget and controlled by the com-missioners of the 100 counties.
A key statistic, per pupil expenditure by source of funds, is calculated annually by the Department of Public In-struction as a guide for local school administrators, legislators, and the general public. They include all disburse-ments necessary for the daily operation of the public schools. Capital expenditures for new buildings and grounds, existing building renovations, and miscellaneous equipment purchases are excluded, as are community service programs, Head Start, adult education, and inter/intro fund transfers.
The expenditure data contained in this section has three distinct funding sources. The fi rst two, state and federal, are the amounts spent for education from the budgets of state and federal governments respectively. The local ex-penditures, on the other hand, are not synonymous with the amounts expended by local county governments. All expenditures not funded by the state or the federal governments are regarded as local expenditures. As such, they include all funds supplied from local governments and other local sources.
Tables on the following page exclude all expenditures connected with child nutrition activities. Since the expendi-tures students make in purchasing their lunches are not funded by the state or federal governments, they are regard-ed as part of the local expenditures. In some contexts, however, there is a need to bring the local expenditures as close to the amounts spent by local governments as possible. These tables are designed to respond to that need.
Hist orical Comparison of Expenditures Per Pupil (ex cluding Child Nutrition)
146 www.wcpss.net
Hist orical Comparison of Expenditures Per Pupil (ex cluding Child Nutrition)
The data in this tables comes from Selected Financial Data displayed by the NC Department of Public Instruction at www.ncpublicschools.org/fbs/resources/data.
WAKE COUNTY PUBLIC SCHOOL SYSTEM Per Pupil Expenditures (excluding Child Nutrition)
AVERAGE DAILY MEMBERSHIP CURRENT EXPENSES APPROPRIATION & TAXES
Year
Number of
Districts
Number of
ADM Rank State Federal Local TotalCounty Appropriation &
Wake County Public School System - Current and Historical Per Pupil Expenditures
“How do we Measure Up” - Wake County compared to State Averages and Largest 5 LEA’s
WAKE COUNTY vs. STATE AVERAGES
Source of Funds WCPSS State Avg. Difference
State 4,887 5,271 (384)
Federal 381 562 (180)
Local 2,253 1,750 503
TOTAL 7,521 7,582 (61)
The Wake County Public School System fell below the state average in state and federal expenditures.
Average Daily Membership is the sum of the number of days in membership for all students in individual school units, divided by the number of school days in the term. The North Carolina Department of Public Instruction (NCDPI) uses average membership fi gures for statistical comparisons and allotment projections. This is different than actual student membership data used in the remainder of the document.
The data in this table comes from the Statistical Profi le published annually by the North Carolina Department of Public Instruction.
147Membership TrendsWake County Public School System - FY 2008-09 Plan for Student Success
The Offi cial Fall 2007 20th Day Membership for WCPSS was 134,002, including 65,680 elementary students, 29,975 middle school students, and 38,347 high school students. Student membership projections were developed in the Fall of 2007-08 by DeJong Inc. through a contract with the Wake County Planning Department. The pro-jections extend ten years. The net increase for 2008-09 is projected to be 6,441 students or 4.8 percent. The DeJong projections estimate that the school system should expect an enrollment of 214,296 in the 2017-18 school year. Projections are provided by grade level for long-term facility and budget planning.
SCHOOL YEAR HISTORICAL PROJECTEDPERCENT INCREASE
2004-2005 114,068 4.7
2005-2006 120,504 5.6
2006-2007 128,072 6.3
2007-2008 134,002 4.6
2008-2009 140,443 4.82009-2010 147,039 4.7
2010-2011 154,244 4.9
2011-2012 161,320 4.6
2012-2013 169,354 5.0
2013-2014 177,803 5.0
2014-2015 186,769 5.0
2015-2016 195,735 4.8
2016-2017 204,788 4.6
2017-2018 214,296 5.0
Historical and Projected Enrollment2004 - 2018
214,296
114,068
140,443
0
50,000
100,000
150,000
200,000
250,000
2004
-05
2005
-06
2006
-07
2007
-08
2008
-09
2009
-10
2010
-11
2011
-12
2012
-13
2013
-14
2014
-15
2015
-16
2016
-17
2017
-18
Stu
dent
s
Membership Growth - FY 2004 - 2009Grade Level
2004-2005 Actual
2005-2006 Actual
2006-2007 Actual
2007-2008 Actual
2008-2009 Estimated
K - 5 54,756 58,249 62,395 65,680 69,079
6 - 8 26,712 27,759 29,031 29,975 31,512
9 - 12 32,600 34,496 36,646 38,347 39,852
TOTAL 114,068 120,504 128,072 134,002 140,443
Membership Trends
20th Day Membership - Special Education StudentsSchool Year Based on December 1 As a percent of 20th Day
2004-05 17,278 15.1%
2005-06 17,834 14.8%
2006-07 18,209 14.2%
2007-08 18,187 13.6%
2008-09 18,653 13.3%
20th Day Membership - English as a Second Language StudentsSchool Year Based on October 1 As a percent of 20th Day
2004-05 5,594 4.9%
2005-06 5,868 4.9%
2006-07 6,087 4.8%
2007-08 6,864 5.1%
2008-09 7,269 5.2%
Membership - Based on Month 1 (20th Day)2004-05 2005-06 2006-07 2007-08 2008-09
114,068 120,504 128,072 134,002 140,443
148 www.wcpss.net
Counties with the LARGEST School Districts in North Carolina
CountyTax Rate2007-08
Tax Rate2006-07
Tax Rate2005-06
Tax Rate2004-05
Cumberland $0.8800 $0.8800 $0.8800 $0.8800
Mecklenburg $0.8387 $0.8189 $0.8368 $0.7567
Forsyth $0.6960 $0.6660 $0.6660 $0.7080
Guilford $0.6914 $0.6615 $0.6428 $0.6184
Wake $0.6780 $0.6340 $0.6040 $0.6040
Counties in North Carolina that SURROUND Wake County
CountyTax Rate2007-08
Tax Rate2006-07
Tax Rate2005-06
Tax Rate2004-05
Vance $0.9200 $0.9200 $0.9200 $0.9000
Durham $0.8340 $0.8090 $0.8090 $0.7900
Franklin $0.8225 $0.7900 $0.7900 $0.7900
Johnston $0.7800 $0.7800 $0.7800 $0.7800
Chatham $0.6170 $0.5970 $0.5970 $0.6464
Granville $0.7550 $0.7000 $0.7000 $0.6350
Harnett $0.7350 $0.7350 $0.7350 $0.7350
Wake $0.6780 $0.6340 $0.6040 $0.6040
Wake County, North Carolina Tax Rate: $0.6780
As reported in the North Carolina Association of County Commissioners website: www.ncacc.org/taxrate.htm
As reported in the Wake County, North Carolina, Comprehensive Annual Financial Report for the year ended June 30, 2007.
Wake County Assessed Value and Actual Value of Taxable Property(1)
Notes:(1) All taxable property is subject to the county-wide tax. Most property in unincorporated areas is subject to special district taxes. The County’s property tax is levied each July 1 on the assessed value listed as of the prior January 1 for all real and personal property located in the County except for certain registered motor vehicles which are assessed anc collected throughout the year. Assessed valuations are established by the Board of County Commissioners at 100% of estimated market value for real property and 100% of actual value for personal property. Public service company property is certifi ed by the State of North Carolina at 100% of actual value, with no distinction between real and personal property values.(2) Per $1,000 of value.
Tax Data
149Tax DataWake County Public School System - FY 2008-09 Plan for Student Success
Tax Data
As reported in the Wake County, North Carolina, Comprehensive Annual Financial Report for the year ended June 30, 2007.
Wake County Historical Comparison of Property Tax Levies and Collections
Collected within the Fiscal Year of the Levy Total Collections to Date
Fiscal Year Ended June 30th
Taxes Levied for the Fiscal Year(Original Levy) Adjustments
Undesignated Fund Balance as a percent of subsequent year County Appropriation 5.2% 6.5% 8.3% 5.2% 6.0%
1Our goal is to maintain undesignated fund balance at 6% of the subsequent year’s county appropriation. We are projecting an undesignated fund balance of $18,972,000 for June 30, 2008 based on a county appropriation of $316,200,000 for 2008-09.
County App ropriation and Fund Balance Hist ory
151County Appropriation and Fund Balance HistoryWake County Public School System - FY 2008-09 Plan for Student Success
County App ropriation and Fund Balance Hist ory
$14,183,203
$22,427,174
$15,951,591
$22,307,206
$18,770,351
0
5,000,000
10,000,000
15,000,000
20,000,000
25,000,000
2004 2005 2006 2007 2008
History of Appropriated Fund Balance
$12,209,784
$16,480,529
$22,882,367
$15,647,406
$18,972,000
0
5,000,000
10,000,000
15,000,000
20,000,000
25,000,000
2004 2005 2006 2007 2008
History of Undesignated (not appropriated) Fund Balance
152 www.wcpss.net
ENROLLMENT
Student membership projections for Wake County used to prepare the Plan for Student Success total 140,443 students (excluding 4,825 students pro-jected to be enrolled in charter schools). The net increase in students for 2008-09 from 2007-08 tenth day is projected to be 6,441 students or 4.8 percent.
Wake County Commissoners reserved funds for 1,404 students as contin-gency for actual student count. Growth cases in the local budget were adjust-ed for this and were based on a projection of 139,039 students for WCPSS.
SALARY INCREASES AND EMPLOYER MATCHING BENEFIT RATES
The Wake County Public School Systems legislative liason consults with leg-islative fi nancial analyst and North Carolina Department of Public Instruction (NCDPI) staff to estimate adjustments in salary and employer matching ben-efi t rates. The rates applied in the Plan for Student Success will be estimates that are subject to change based on General Assembly action.
Salary increases for certifi ed employees are estimated at six percent average increase. Salary increases for central offi ce administrative staff and noncer-tifi ed employees are estimated at three percent increase. Increases for the Board of Education member fees are estimated at fi ve percent.
The local budget was adjusted to estinated raises of 2.69% for school level administrators, 3% for certifi ed school level staff and the minimum of 2.75% or $1,100 for noncertifi ed staff. These were the lastest fi gures available when the local budget was adjusted to the actual county appropiation.
2007-08(Current Year)
2008-09 2009-10 2010-11
Salary Increases (State)Certifi ed Staff including School Level Administrators
Local Adjustment
Noncertifi ed Staff and Central Services Administrators
1 per 18 ADM (LEA Class Size Avg is 21)1 per 22 ADM (LEA Class Size Avg is 26)1 per 21 ADM (LEA Class Size Avg is 26)1 per 24.5 ADM (LEA Class Size Avg is 26)1 per 26.64 ADM (LEA Class Size Avg is 29)
1 per county or based on sub-agreements
-----------------------------------------------------------------------------Calculations based on 10th day student membership. All students in kindergarten throughGrade 12 are reported. Pre-school students are not included. Distributed through self-allotmentuntil the day prior to Day 1 for Traditional Calendar schools. MOE unearned on 10th dayremoved from payroll or charged to individual school Fund 6.
All elementary schools receive an allotment of Curriculum and Instruction Months of Employment on a formula basis (1 MOE to 13.75 students). C&I months of employment are used to fund Instructional Resource Teachers, and Specialists in Art, Music, and Physical Education. Instructional Resource Teachers provide communication between C&I and the school staff. They support the classroom teacher in implementing best instructional practices. They also coordinate and conduct targeted staff development. Specialists are generally scheduled for 45 minute periods with 10 minutes in between for materials preparation. The optimum number of classes per week is 27. The maximum number of classes per week should be no more than 30.
All traditional schools receive 5 MOE. Year round schools receive 6 MOE.
154 www.wcpss.net
Budget ary Ass umptionsSTATE / LOCAL ALLOTMENT FORMULAS
CATEGORY BASIS OF ALLOTMENT
PROGRAM 001 - CLASSROOM TEACHERS (continued)Middle School Instrumental Music (band and/or strings)
Months are allotted for Instructional Resource Teachers (6 months for year-round and 5 months for modifi ed/traditional) and months are allotted for dance, instrumental, music, and/or band.
Fixed allotment: 10 MOE to middle schools12 MOE to year round middle schools
Fixed allotment of 21 MOE to each high school. 10 MOE Athletic Director, 10 MOE Scheduling Assistance, 1 MOE Athletic Trainer.
Year-round elementary schools receive 10 MOEs for an intersession teacher and 10 MOEs for an intersession teacher assistant. It will probably be necessary for these staff members to follow a calendar developed by the school similar to track 5 or to follow the traditional calendar.
PROGRAM 002 - CENTRAL OFFICE ADMINISTRATIONCentral Offi ce Administration FY 2008-09 initial allotment is .26% higher than FY 2007-08 initial allotment.
PROGRAM 003 - NON-INSTRUCTIONAL SUPPORT PERSONNELNoninstructional Support Personnel----------------------------------WCPSS Formula:Clerical
$263.23 per ADM; $6,000 per Textbook Commission member for Clerical Assistants.----------------------------------------------------------------------------Base allotments:Elementary: 44 MOE (12 MOE Lead Secretary, 12 MOE NCWise Data Manager, 10 MOE Media Assistant, 10 MOE Clerical)
Middle School: 68 MOE (12 MOE Lead Secretary, 12 MOE NCWise Data Manager, 12 MOE Bookkeeper, 12 MOE Guidance As-sistant, 10 MOE Media Assistant, 10 MOE Receptionist)
High School: 99 MOE (12 MOE Lead Secretary, 12 MOE NCWise Data Manager, 12 MOE Bookkeeper, 12 MOE Registrar, 11 MOE Secretary, 40 MOE Clerical Assistant)
10th Day K-12 Student Membership Adjustments to Base (only if positive): Elementary: Integer(((K+ Grade 1+ Grade 2 + Grade 3 + Grade 4 + Grade 5)-500)/35)
Other: Year-round schools adjusted 4 MOEDue to small size, Longview, Redirection, River Oaks, East Wake School of Health Science, East Wake School of Integrated Tech-nology, and Wake Early College have total allotment of 24 MOE, and Phillips has a base of 30 MOE.
155Budgetary AssumptionsWake County Public School System - FY 2008-09 Plan for Student Success
Budget ary Ass umptionsSTATE / LOCAL ALLOTMENT FORMULAS
CATEGORY BASIS OF ALLOTMENT
PROGRAM 003 - NON-INSTRUCTIONAL SUPPORT PERSONNEL (continued)Custodian Services Elementary: 16,000 net cleanable sq feet per custodian.
Middle: 18,000 net cleanable sq feet per custodian.
High: 19,000 net cleanable sq feet per custodian.
PROGRAM 005 - SCHOOL BUILDING ADMINISTRATIONSchool Building Administration
1 per school with at least 100 ADM or at least 7 state paid teachers.1 month per 80 in ADM.--------------------------------------------------------------------------------
12 MOE per school
Elementary Schools:
If your projected student count is: Then your AP allotment is:
000-899 11 MOE Traditional/12MOE Year Round
900-1099 16.5 MOE Traditional/18 MOE Year Round
1100+ 22 MOE Traditional/24 MOE Year Round
Middle Schools:
If your projected student count is: Then your AP allotment is:
000-699 12 MOE
700-949 24 MOE
950-1399 29 MOE Traditional / 30 MOE Year-Round
1400+ 36 MOE
High Schools:
If your projected student count is: Then your AP allotment is:
Base Allotment 18 MOE
1650-2399 48 MOE
2400+ 60 MOE
156 www.wcpss.net
Budget ary Ass umptionsSTATE / LOCAL ALLOTMENT FORMULAS
CATEGORY BASIS OF ALLOTMENT
PROGRAM 007 - INSTRUCTIONAL SUPPORTInstructional Support--------------------------------WCPSS Formula:Media Specialist
Counselors
1 per 200.10 in ADM. --------------------------------------------------------------------------------Traditional/Modifi ed Calendar Year Round Calendar150-824: 10 MOE 150-899: 12 MOE825-999: 15 MOE 900-1074: 18 MOE1000-1499: 20 MOE 1075-1574: 22 MOE Elem, 24 MOE Mid1500-1999: 25 MOE 2000-2499: 30 MOE Over 2500: 35 MOE
The distribution process is based on projected enrollment using the following guidelines:
Elementary Schools
Traditional / Modifi ed Calendar Year-Round Calendar*
Number of Students MOEs Number of Students MOEs
0-823 10 0-1098 12
823-1000 15 1099-1333 17
Over 1000 20 Over 1333 22
Year round allocation is based on ¾ of the student planning allotment for traditional/modifi ed calendar schools.
Middle Schools
Traditional / Modifi ed Calendar Year-Round Calendar*
Number of Students MOEs Number of Students MOEs
1-400 10 0-533 12
401-849 20 534-1132 22
850-1249 30 1133-1666 34
1250-1549 40 1667-2065 42
Over 1549 50 Over 2065 52
157Budgetary AssumptionsWake County Public School System - FY 2008-09 Plan for Student Success
Budget ary Ass umptionsSTATE / LOCAL ALLOTMENT FORMULAS
CATEGORY BASIS OF ALLOTMENT
PROGRAM 007 - INSTRUCTIONAL SUPPORT (continued)Counselors
Psychologists
Social Workers
*Year round allocation is based on ¾ of the student planning allotment for traditional/modifi ed calendar schools.
High Schools• 1 - 1849 students - 10 MOEs per grade level (plus 2 additional MOE’s for the Dean of Student Services)• 1850 – 2249 students – 10 additional MOEs• 2250 – 2649 students – 10 additional MOEs• 2650 – 3049 students – 10 additional MOEs
To keep pace with student population increases, add one psychologist MOE per 158 new students. Most Psychologists are as-signed to 2 or 3 schools, with consideration of the following variables:• Level (Elementary or Secondary)• School enrollment• Calendar• Proximity of assigned schools• Psychologist continuity at school• Number of separate special education classes
The allotment formula provides approximately one MOE per 191 students in pre-K through grade 8, although our alternative programs have a more concentrated staffi ng pattern. All middle schools are assigned a part-time social worker, and high needs elementary schools are assigned part time social workers, with central offi ce “on-call” service to the remaining elementary schools. No social workers are assigned to our high schools except for alternative programs. However, at our regular high schools SAP’s fulfi ll some social work functions, and they may request assistance from our central offi ce based social work staff, as needed, for court attendance situations.
158 www.wcpss.net
Budget ary Ass umptionsSTATE / LOCAL ALLOTMENT FORMULAS
CATEGORY BASIS OF ALLOTMENT
PROGRAM 012 - DRIVER EDUCATIONDriver Education $245.05 per 9th grade ADM. Includes private, charter, and federal schools.
PROGRAM 013 - CAREER TECHNICAL EDUCATION - MONTHS OF EMPLOYMENT (MOE)Career Technical Education-MOE(LIMITED FLEXIBILITY-Salary Increase)----------------------------------WCPSS Formula:
Base of 50 months of employment per LEA with remainder distributed based on ADM in grades 8-12.
--------------------------------------------------------------------------------CTE months of employment are allotted by the state to WCPSS based on ADM at grades 8-12. The WCPSS formula for deter-mining the MOE allocation to each secondary school is based on the total school enrollment with consideration of the number of students enrolled in CTE courses, along with selected specifi c need factors. Expected class enrollment will range between 16 and 26 students in each class, depending upon the content area, grade level, and safety issues. All fulltime CTE teachers should be assigned a full class load plus a planning period, and they must teach within their CTE licensure area. Schools may be allotted up to three CTE specialists to support the regular CTE instructional program: Career Development Coordinator - Purpose Code 5830 (HS and MS); Special Populations Coordinator - Purpose Code 5220 (HS only); Career Academy Coordinator - Purpose Code 6120 (eligible HS only). Principals may not substitute job descriptions or purpose codes without prior approval from the CTE Director. Each fully enrolled middle and high school is allotted a Career Development Coordinator for the 2008-09 school year. CDCs also serve as their school’s VoCATS Testing Coordinator. Middle school CDCs may be assigned teaching responsibilities within their CTE licensure area for up to 50% of their workday. High school CDCs are not assigned regular teaching responsibili-ties. Each fully enrolled high school is allotted a Special Populations Coordinator for the 2008-09 school year.
PROGRAM 014 - CAREER TECHNICAL EDUCATION PROGRAM SUPPORTCareer Technical Education Program Support $10,000 per LEA with remainder distributed based on ADM in grades 8-12 ($33.15).
PROGRAM 015 - SCHOOL TECHNOLOGYSchool Technology $6.77 per ADM.
PROGRAM 027 - TEACHER ASSISTANTSTeacher Assistants----------------------------------WCPSS Formula:
Year Round
$1,032.19 per K-3 ADM.--------------------------------------------------------------------------------Calculations based on 10th day student membership. All students in kindergarten through Grade 3 are reported. Pre- school stu-dents are not included. Distributed through self-allotment until the day prior to Day 1 for Traditional Calendar schools. Unearned MOE after 10th day removed or charged to individual school Fund 6.
$3,350.81 per funded child count. Child count is comprised of the lesser of the December 1 handicapped child count or 12.5% of the allotted ADM.
Base of $52,698 per LEA; remainder distributed based on December 1 child count of ages 3, 4, and PreK-5, ($2,765.74) per child.
--------------------------------------------------------------------------------The current audiologist-to-school ratio is approximately one audiologist to every 25 schools. Assignment of audiologists to schools is based on needs, as determined by the total number of students with documented hearing loss and the average number of an-nual school-based hearing assessments, taking into consideration geographic proximity of schools. Target caseload numbers are established based on SDPI guidelines, taking into consideration the number of students with educationally signifi cant hearing loss who have IEP’s or 504 plans and the type and amount of equipment that is required per school.
Currently, there are 17.5 occupational therapy positions assigned across the schools. The number of schools assigned to any given therapist is based on the following factors:
Factor Weight Points
# of students requiring occupational therapy services and amount of time on IEP’s
# of re-evaluations required during the school year
# of initial referrals (historically)
#of special education programs
Elementary/middle/high school
Year-round vs. Traditional
Therapist continuity at school
Proximity of assigned schools
3X
1X
2X
2X
1X
1X
1X
1X
High=3; Med.=2; Low=1
High=3; Med.=2; Low=1
Elem.=3; Mid.=2; High=1
1 to 3 based on type of program
Elem.=3; Mid.=2; High=1
Yr-Round=2; Trad.=1
1
1
160 www.wcpss.net
Budget ary Ass umptionsSTATE / LOCAL ALLOTMENT FORMULAS
CATEGORY BASIS OF ALLOTMENT
PROGRAM 032 - CHILDREN WITH DISABILITIES (continued)Physical Therapist
Special Education Services
Speech/Language Therapy Services
Currently 9.5 (FTE) physical therapists are employed in the Wake County Public School System, including a Lead Physical Thera-pist who divides her time between administrative/supervisory duties and services for specifi c students. Schools are assigned to PT’s by the Lead Physical Therapist based on a regional/proximity, number of students with IEP or 504 plan at school, severity of student needs as well as consideration of other factors that might impact student success. The time spent at each school is determined by the needs of the students with IEP’s and 504 plans which specify intervention by a physical therapist, evaluation and re-evaluation requests, and IEP/504 team meetings.
Personnel is allotted based upon ratios as outlined in Policies Governing Programs and Services for Children with Disabilities, Ex-ceptional Children Division, Section NC1508, Class size: school age and preschool. Special adjustments may be made to assure the provision of a Free Appropriate Public Education (FAPE).
The school assignments of speech/language pathologists are based on the number and severity-level of identifi ed students. The severity-level based on evaluation scores results in a point system. The evaluation scores/points of each student receiving speech therapy at a school are added together for a school total. The following is the formula used to determine the amount of time allot-ment to a school:
The size and number of self-contained classrooms within a school is also a determining factor since they often require additional time for evaluations and IEP meetings.
PROGRAM 033 - ABC INCENTIVE AWARDABC Incentive Award Not included in planning.
PROGRAM 034 - ACADEMICALLY OR INTELLECTUALLY GIFTED STUDENTSAcademically or Intellectually Gifted Students----------------------------------WCPSS Formula:
$1,083.32 per child for 4% of ADM.--------------------------------------------------------------------------------Complete annual student identifi cation.MOE are determined and distributed according to the number of identifi ed AG students in a school.
PROGRAM 035 - CHILD NUTRITIONChild Nutrition Elementary: 20 meal equivalents per labor hour
Middle: 22-24 meal equivalents per labor hourHigh: 22-24 meal equivalents per labor hourA meal equivalent equals: (#breakfasts divided by 2)+(#snacks divided by 3) +(# lunches)+($ amount of supplemental sales di-vided by $2.23) based on a daily average.
PROGRAM 050 - ELEMENTARY TITLE I TEACHERSElementary Title I Teachers A LEA must allocate Title I funds to participating school attendance areas or schools, in rank order, on the basis of the total number
of children from low-income families in each area or school.
161Budgetary AssumptionsWake County Public School System - FY 2008-09 Plan for Student Success
Budget ary Ass umptionsSTATE / LOCAL ALLOTMENT FORMULAS
CATEGORY BASIS OF ALLOTMENT
PROGRAM 054 - ENGLISH AS A SECOND LANGUAGEEnglish as a Second Language
----------------------------------WCPSS Formula:
Base of a teacher assistant ($27,145); remainder based 50% on number of funded LEP students ($351.28) and 50% on an LEA’s concentration of LEP students ($3,583.40).--------------------------------------------------------------------------------Annual review of identifi ed ESL students being served in the program. Examination of WCPSS locator to identify LEP students. Teacher:Student ratio determined by dividing projected ESL/targeted LEP students on locator and applying local MOE formulas.
PROGRAM 056 - TRANSPORTATIONTransportation Based on an effi ciency rated formula and local operating plans. The initial allotment is 80% of planning.
PROGRAM 061 - CLASSROOM MATERIALS / INSTRUCTIONAL SUPPLIES AND EQUIPMENTClassroom Materials/ Instructional Supplies and Equip-ment----------------------------------WCPSS Formula:
$59.04 per ADM plus $2.69 per ADM in grades 8 and 9 for PSAT Testing.
--------------------------------------------------------------------------------Each school receives dollars for classroom materials. The total allotment is calculated by multiplying 10th day student membership by the amounts shown below. The total for each grade level and the breakdown between fund 01 and 02 will vary annually.
Each middle school will receive $2,620 and each high school will receive $945.
Each school receives $6.17 per 10th day student count.
Each middle and high school will receive $1,000 to pay for the repair of school-owned band instruments.
(Round trip mileage to Crossroads x 72 trips) x .505 (current mileage reimbursement rate) + (200 days x 5 miles) x .505 (current mileage reimbursement rate).
PROGRAM 063 - CHILDREN WITH SPECIAL NEEDSGroup Homes
Developmental Day Care (3-20)
Community Residential Centers
Approved applications.
To be allotted in revision.
To be allotted in revision.
162 www.wcpss.net
Budget ary Ass umptionsSTATE / LOCAL ALLOTMENT FORMULAS
CATEGORY BASIS OF ALLOTMENT
PROGRAM 068 / 069 - AT RISK STUDENT SERVICES / ALTERNATIVE SCHOOLSAt-Risk Student Services/ Alternative Schools
----------------------------------WCPSS Formula:In School Suspension Teachers
Communities In Schools
Each LEA receives the dollar equivalent of one resource offi cer ($37,838) per high school. Of the remaining funds, 50% is distrib-uted based on ADM ($73.53 per ADM) and 50% is distributed based on number of poor children, per the Federal Title I Low Income poverty data ($371.35 per poor child). Each LEA receives a minimum of the dollar equivalent of two teachers and two instructional support personnel ($226,978). --------------------------------------------------------------------------------
This allotment covers the teachers of in-school suspension in the middle schools. It is funded through PRC 069. Conversion only allowed to ISS TA MOEs.
This allotment provides some of the positions for coordinators of Communities in Schools programs at Brentwood, Hunter, Millbrook, Wilburn, and Poe Elementary Schools, and Daniels, East Millbrook, East Wake, Mt. Vernon, and Zebulon Middle Schools, and Gar-ner High School. These are paid from PRC 069.
Minimum Competency Teacher
Alternative High School Programs
These positions are allotted based on the number of students with more than 4 academic risk factors.
This allotment includes positions for alternative programs at East Wake High and Phillips High. It is funded through PRC 068.
PROGRAM 072 - IMPROVING STUDENT ACCOUNTABILITYImproving Student Accountability----------------------------------WCPSS Formula:Accelerated Learning Program
High School Intervention Coordinators
Challenged Schools
Not included in planning.--------------------------------------------------------------------------------
2007-08 allotments are based on the number of Level I and II students for ALP during the 06-07 school year. ALP is allotted to elementary and middle schools and alternative schools serving elementary and middle school students. Months are allotted on the basis of 1 MOE for every 13 students scoring Level I and II in grades 3-8. The maximum allotment is 20 MOE. Additional allotments may be made based upon re-rostered 06-07 EOG results after the 20th day. Months will not be taken away.
One ten-month position for each high school. A half-time position for alternative sites.
Allotted to schools with 30% or more of their students on free/reduced meals based on the F&R enrollment projections from Growth Management after the student assignment plan is fi nalized. The allotments will be revised, if needed, in October 2007. No months are taken away.
PROGRAM 130 - TEXTBOOKSTextbooks $67.85 per ADM in grades K-12.
PROGRAM 301 - ROTCROTC ROTC MOE provided from categorical Federal funds, for each high school with a Board of Education approved program. The num-
ber of months allotted is dependent upon the contractual agreement with the branch of service sponsoring the ROTC program.
PROGRAM 856 - MAGNET PROGRAM - LOCALMagnet Program – Local----------------------------------WCPSS Formula: Magnet Positions
--------------------------------------------------------------------------------Program magnet schools receive positions based on theme. In most cases, magnet allotments will be the same from year-to-year. Magnet programs will look to align resources throughout the 2008-09 school year to achieve program alignment and equity as in-structed by the curriculum audit. “One Year Only” allotment will not be renewed for the 2009-10 school year.
163Budgetary AssumptionsWake County Public School System - FY 2008-09 Plan for Student Success
Budget ary Ass umptions FEDERAL GRANT DESCRIPTIONS AND ALLOTMENT FORMULAS
Grant Term TypeLiquidation
Period Description Formula
PROGRAM 017 - CAREER TECHNICAL EDUCATION - BASIC GRANT12 months
expires 6/30Formula No To assist in developing the academic, vocational and technical skills
of students who elect to enroll in vocational and technical education programs that will prepare them for occupations requiring other than a baccalaureate or advanced degree.
Seventy percent (70%) of available funds are allotted based on the child population in poverty ages 5-17 ($54.97 per count). Thirty per-cent (30%) of available funds are allotted based on the age 5-17 popu-lation ($3.86 per count).
PROGRAM 026 - HOMELESS CHILDREN27 months
expires 9/30Formula 90-day Funds to help LEAs meet the special education needs of homeless
childrenTotal funding to LEAs/Charter Schools is negotiated based on avail-able funds.
PROGRAM 044 - IDEA VI-B CAPACITY BUILDING AND IMPROVEMENT (SLIVER)27 months
expires 9/30Formula 90-day Special education programs for handicapped children ages 3 to 21. Allotment is based on the December 2006, IDEA Title VI-B head count
($15.53 per count) and adjusted for a minimum allocation of $1,000.
PROGRAM 048 - SAFE AND DRUG-FREE SCHOOLS 27 months
expires 9/30Formula 90-day Funds to prevent violence and to implement prevention, early identifi -
cation, intervention drug programs and safe schools. Sixty percent (60%) of available funds are based on relative amounts such agencies received under Part A of Title I for the preceding fi scal year. Forty percent (40%) of available funds are based on ADM ($1.52 per ADM), including private schools.
PROGRAM 049 - IDEA TITLE VI-B PRE-SCHOOL HANDICAPPED 27 months
expires 9/30Formula 90-day Special education programs for handicapped children ages 3-5. Base Payment – Each LEA shall receive a base amount equal to a pro-
portional share of 75% of the FY 1997-98 IDEA VI-B Preschool Grant as calculated using the December 1996 head count.
Funds Remaining After Base – Eighty-fi ve percent (85%) is distrib-uted based on ADM ($0.52 per ADM), including private schools and 15% distributed based on December 2006, free lunch count ($0.25 per count).
PROGRAM 050 - TITLE I –BASIC/NEGLECTED AND DELINQUENT27 months
expires 9/30Formula 90-day Supplemental funds to provide special help to educationally deprived
children, ages 5-17 reach high academic standards. Poverty based formula based on funding levels as calculated by the U.S. Department of Education.
PROGRAM 057 - ABSTINENCE EDUCATIONexpires 12/31 Formula 90-day Provide abstinence education focusing on those groups which are
most likely to bear children out-of-wedlock. LEAs will be notifi ed when additional information is received from the Federal Government.
PROGRAM 059 - TITLE V27 months
expires 9/30Formula 90-day Funds for targeted assistance programs to enhance student perfor-
mance.Sixty percent (60%) of available funding is based on ADM ($.94 per ADM), including private schools. Forty percent (40%) of funding is based on the December 2005, free lunch count ($1.63 per count).
164 www.wcpss.net
Budget ary Ass umptionsFEDERAL GRANT DESCRIPTIONS AND ALLOTMENT FORMULAS
Grant Term TypeLiquidation
Period Description Formula
PROGRAM 060 - IDEA VI-B HANDICAPPED27 months
expires 9/30Formula 90-day Special education programs for handicapped children ages 3 to 21. Base Payment – Each LEA shall receive a base amount equal to a
proportional share of 75% of the FY 1999-00 IDEA Title VI-B grant as calculated using the December 1998 head count.
Funds Remaining After Base – Eighty-fi ve percent (85%) is distributed based on ADM ($95.28 per ADM), including private schools and 15% distributed based on December 2006, free lunch count ($45.91 per count).
PROGRAM 064 - LEARN AND SERVE AMERICA12 months
expires 6/30Competitive No Meet the unmet human, educational, environmental, and public safety
needs of the United States, without displacing existing workers; and re-new the ethic of civic responsibility and the spirit of community through-out the United States.
PROGRAM 103 - IMPROVING TEACHER QUALITY27 months
expires 9/30Formula 90-day Combines the Eisenhower Professional Development State Grants,
Class-Size Reduction and a state administered program (Teacher Quality Enhancement) into one program that focuses on preparing, training, and recruiting high-quality teachers.
Hold Harmless Base Allotment – LEAs receive the amount they were entitled to receive in FY 2001-02 for the former Eisenhower Profes-sional Development and Class Size Reduction Programs.
Remaining Funds Available After Hold Harmless – Eighty percent (80%) of the available funds are based on child population in poverty ages 5-17 ($63.45 per count). Twenty percent (20%) of the available funds are allotted based on the age 5-17 population ($2.60 per count).
PROGRAM 104 - LANGUAGE ACQUISITION27 months
expires 9/30Formula 90-day Assists school districts in teaching English to limited English profi cient
students and in helping these students meet the same challenging State standards required of all other students
The available funds are allotted based on Limited English Profi cient Student Head Count ($82.06 per count). A LEA’s/Charter’s allotment must be at least $10,000 to receive funding or a consortia must be formed.
PROGRAM 105 - TITLE I – SCHOOL IMPROVEMENT27 months
expires 9/30Competitive 90-day New School Improvement grant to schools identifi ed for school im-
provement, corrective action and restructuring.
PROGRAM 107 - EDUCATIONAL TECHNOLOGY 27 months
expires 9/3050% Formula 90-day Consolidates the current Technology Literacy Challenge Fund (TLCF)
and Technology Innovation Challenge Grant programs into a single State formula grant program to support the integration of educational technology into classrooms to improve learning and teaching.
The available funds are allotted based on each LEA’s/Charter’s propor-tionate share of funds under Part A of Title I for the current year. This allotment is based on the FY 2007-08 planning allocation for Title I.
PROGRAM 111 - ENGLISH LANGUAGE ACQUISITION, SIGNIFICANT INCREASE27 months
expires 9/30Formula 90-day Assists school districts in teaching English to limited English profi cient
students and in helping these students meet the same challenging State standards required of all other students.
The funds are available to any LEA/Charter having a signifi cant in-crease of at least 4% in the immigrant count compared to the average of the two previous years. The funding factor per 2007-08 immigrant count is $487.09.
165Budgetary AssumptionsWake County Public School System - FY 2008-09 Plan for Student Success
Budget ary Ass umptions
ALLOTMENT CATEGORY ABC TRANSFER POLICY
ABC Incentive Award No transfers are allowed.
Academically or Intellectually Gifted Stu-dents
Funds can be transferred to other categories if in a school’s improvement plan and if all aca-demically or intellectually gifted students are appropriately served. Funds may be trans-ferred into this category.
At Risk Student Services / Alternative Programs and Schools
Funds are available from July 1 – August 31 of the next fi scal year.
Funds cannot be transferred out of this category.Funds can be transferred into this category.
Central Offi ce Administration Funds cannot be transferred into this category. Funds can be transferred out for any other purpose.
Children with DisabilitiesIncludes Behavioral Support
Funds may not be transferred out of this category.
Transfers to textbooks are allowed if included in a school’s improvement plan.
Classroom TeachersThe state does not allot dollars to hire teach-ers. The State will pay the salary cost of the State paid teachers that a local system employs.
Funds can only be transferred for classroom materials /instructional supplies/equipment, exceptional children teachers, at-risk teachers, or textbooks. Funds transferred are based on the statewide average salary for teachers in-cluding fringe benefi ts.
Driver’s Education No transfers are allowed.
Improving Student AccountabilityFunds are available from July 1 – August 31 of the next fi scal year.
Funds may not be transferred out of this category.Funds may be transferred in from any category.
Instructional Support PersonnelThe State does not allot dollars for this cat-egory. The State will pay the salary cost of the State paid positions a local system em-ploys.
Funds can be transferred for any purpose. Can be used for teachers in any grade without a transfer. Funds are based on the statewide average salary for instructional support includ-ing fringe benefi ts.
Intervention/Assistance Team Funding No transfers are allowed.
ALLOTMENT CATEGORY ABC TRANSFER POLICY
Limited English Profi ciency No transfers are allowed.
Noninstructional Support PersonnelIncludes clerical, custodians, and substi-tutes.
Transfers are allowed only for teachers (any grade) if in a school’s improvement plan. Three percent (3%) of these funds may be transferred for staff development. No other transfers are allowed.
School Technology Funds are available until expended.
No transfers are allowed.
School Building AdministrationThe State does not allot dollars for this cat-egory. The State will pay the salary cost of the State paid positions a local system em-ploys.
Funds can be transferred for any purpose. Funds transferred are based on the statewide average salary for principals including fringe benefi ts and assistant principals including fringe benefi ts. Waivers for placement of princi-pals on the salary schedule for low-performing schools must be approved by the State Board.
Staff DevelopmentFunds are available July 1 – December 31 of the next fi scal year.
Funds can be transferred for any purpose. LEAs must allot 75% of funds to schools.
Teacher Assistants Transfers allowed only for teachers in grades K-3 if in a school’s improvement plan. Posi-tions must be vacant to transfer. Grade place-ment may be waived if in a school’s improve-ment plan to serve students primarily in grades K-3 when the personnel are assigned to an el-ementary school to serve the whole school.
Textbooks Transfer to Classroom Materials/ Instructional Supplies/ Equipment are allowed if included in a school’s improvement plan. No other trans-fers are allowed. LEAs will not have to obtain a waiver to purchase off the State-adopted list.
Transportation Funds can be transferred. Transfers will im-pact effi ciency ratings.
Career and Technical Education Funds can be transferred between vocational education categories. Limited transfers for other purposes are based on promulgated rules established by the State Board to comply with federal regulations.
ABC TRANSFER POLICIES
166 www.wcpss.net
Student achievement in the Wake County Public School System has been improving for the last several years. As required by law, students in WCPSS in grades three through eight are tested annually in reading and mathematics. The charts below show the achievement in reading and math for students in Grades 3-8 from Spring 2003 to Spring 2007.
For students in Grades 3-5, while there has been some year to year variation, the overall trend for these grades has been slightly positive. Moreover, by tracking along the diagonal of the data table, it may be observed that cohorts of students post gains for each grade. That is, there was a larger percentage of students in Grade 4 in 2004 reading at or above grade level than was true for the same cohort, when they were in Grade 3 in 2003.
A similar pattern can be seen for students in Grades 6-8 in reading the chart. It is interesting to note that there is a drop in the percentage of students reading at or above grade level in Grade 6, as compared to the same cohort of students when they were in Grade 5. However, by the end of Grade 8, this drop has been largely made up.
EOG Reading Trends by Grade Level, Spring 2000-2007, Grades 3-5
6th grade (2007 n = 9408) 7th grade (2007 n = 9412) 8th grade (2007 n = 9406)
EOG READING - GRADES 3 THROUGH 5 EOG READING - GRADES 6 THROUGH 8
Student Achievement
167Student AchievementWake County Public School System - FY 2008-09 Plan for Student Success
Student AchievementIn 2005-06, the State Board of Education reset the passing levels for mathematics tests in Grades 3-8. Whereas in prior years, the percentage of WCPSS students scoring at or above grade level in mathematics was similar to the outcomes seen for reading, in 2005-06, the percentage of students passing the mathematics tests fell substantially. As shown in the charts below, the percentage of students by grade level passing the mathematics tests is currently lower than percentages passing reading tests. However, there were increases at each grade level in 2006-07.
EOG Math Trends by Grade Level, Spring 2000-2007, Grades 3-5
0%
10%
20%
30%
40%
50%
60%
70%
80%
90%
100%
perc
enta
ge a
t lev
el II
I or I
V
2006 78.1% 76.1% 73.6%
2007 79.5% 79.0% 76.6%
3rd Grade (2007 n =10032) 4th Grade (2007 n = 9828) 5th Grade (2007 n = 9355)
EOG Math Trends by Grade Level, Spring 2000-2007, Grades 6-8
0%
10%
20%
30%
40%
50%
60%
70%
80%
90%
100%
perc
enta
ge a
t lev
el II
I or I
V2005-06 73.7% 73.0% 72.3%
2006-07 74.4% 73.5% 73.7%
6th Grade (2007 n =9418) 7th Grade (2007 n = 9414) 8th Grade (2007 n =9410)
EOG MATH - GRADES 3 THROUGH 5 EOG MATH - GRADES 6 THROUGH 8
168 www.wcpss.net
Student Achievement
EOC Results by Subject, 2003-2007
0%
10%
20%
30%
40%
50%
60%
70%
80%
90%
100%
2002-03 74.3% 85.5% 61.6% 89.2%
2003-04 74.1% 88.7% 65.8% 92.5%
2004-05 74.2% 87.4% 67.2% 92.0%
2005-06 73.7% 88.1% 73.0% 68.3% 91.0% 69.6%
2006-07 75.6% 73.8% 74.2% 75.4% 79.9% 72.8% 74.2%
Algebra I Algebra II Biology Chemistry Civics & Economics English I Geometry Physical
Science Physics U.S.History
In high schools, students do not take End of Grade (EOG) tests, but students in selected courses take End of Course (EOC) tests. As can be seen in the next chart, there was improvement in the percent of students passing chemistry, physics, and physical science tests from 2002-03 to 2005-06, while biology has remained relatively fl at since 2002-03. Scores on the two new EOCs introduced in 2005-06 (US History and Civics and Economics) increased in 2006-07, while the three math EOCs along with English I were new tests in 2006-07.
Note: Tests in Algebra I, Algebra II, English I, and Geometry were new in 2006-07. Chemistry, Physical Science, and Physics were not given in 2006-07. Civics & Economics and U. S. History were new tests in 2005-06.
169Changes in Standards / ExpectationsWake County Public School System - FY 2008-09 Plan for Student Success
Pre ABC's 1995-96 1996-97 1997-98 1998-99 1999-00 2000-01 2001-02
2000 Summit: 2001 Summit: 2002 Summit:
FED
ERA
L IN
ITIA
TIVE
SW
CPS
S IN
ITIA
TIVE
S
JANUARY 2002 President Bush signs NCLB legislation into law.
ABCs implementation begins for schools w/K-8.Model includes growth and performance. Assistance teams formed. 1st ABCs report submitted to General Assembly in August 1997.
High Schools ABCs model implemented. Incentive bonuses paid to teachers in Expected or Exemplary Growth schools.
Continued modification of high school model. Some alternative schools added to ABCs.
1999 Summit: Readers to Achievers
The PLC root - Serge's (1990) work on learning organization in the corporate world.
1998 Summit: Achieving New Horizons
Computer skills test at Grade 8 added to performance composite.
A course of study is required for entering 9th graders.
SBE approved new achievement levels in mathematics.
STA
TE IN
ITIA
TIVE
S
Hord, Dufour, and Eaker (1998) used the term Professional Learning Community
Prior to 1992, schools had participated in CAT testing in selected grades.
1992-1993 - First use of End of Grade Tests in Grades 3-8.
1998 Wake County Board of Education adopts Goal 2003
General Assembly passes ABC's legislation. 10 school systems pilot the ABC's
APRIL 1999 SBE approves Student Accountability Standards requiring that students demonstrate proficiency at Grades 3, 5, 8. Alternative Schools were added to the model.
Schools of Distinction were required to make at least expected growth.
GOAL 2003 95% of students in 3-8 will be at or above grade level.
Getting It Right from the Start
Taking Off the Mask - Quality, Confidence and Results in Public Education.
Continual Improvement and use of data Demings PDSA (Plan, Do, Study, Act) Cycle
Investing in the GoalResources, Resolve and Quality Public Schools
MAY 2000 SBE approves using prediction formulas for 10 end-of-course tests (bringing the K-8 and 9-12 models into alignment). An alternative Assessment Portfolio for students with disabilities was added.
EOC prediction formulas for 10 EOCs implemented, bringing the high school/elem-middle school models into alignment.
Changes in Standards / Expect ations
170 www.wcpss.net
Changes in Standards / Expect ations2002-03 2003-04 2004-05 2005-06 2006-07 07-08 to 09-10 10-11 to 12-13 2013-2014
New standards for math.New standards for English I, Algebra I, Geometry, and Algebra II.
2007-2008 New Standards for Biology, Physics, and Physical Science.
2001-06 NWREL and SERVE develop the professional learning team model.
HIGH FIVE. Goal=100% Graduation by 2013
Superintendent Burns focuses on Learning
PLCs become cornerstone of 5 - year mission of High Five to improve high schools.
SPRING 2007 Science assessments will be pilot-tested. End-of-Grade Science Assessments for Grades 5 & 8 must be implemented to meet NCLB requirements. (Scores will not be part of AYP calculations.) New Core Curriculum for HS is approved.
AUGUST 2006 SBE approves Guiding Mission and Five Goals New exit standards for entering 9th
Science assessments will be pilot tested.
SEPTEMBER 2007 NCLB will be reauthorized.
#4 Fiscal Accountability
2008 - 2009 New Core Course of Study for High Schools for entering 9th graders.
STA
TE IN
ITIA
TIVE
SFE
DER
AL
INIT
IATI
VES
WC
PSS
INIT
IATI
VES
2007 - 2008 New standards for reading
ABCs 91-day rule was changed to 90-days. 98% participated for elem/mid schools was changed to 95%. Provisions of NCLB were added to the ABC's model. AYP became the "closing the gap" component. Honor School of Excellence category was added. US History was withdrawn from the model.ELP used only for students transferring into a NC high school.
Journey to 2008 Successful Teachers, Successful Students
5 school systems and 5 corporate sponsors create
BEGINNING IN 06-07, new exit standards for 9th graders. New standards in math.
SPRING 2006 Science assessments were field-tested state-wide.
The SBE approved increasing the weight of the dropout component for 04-05. New rules were applied for alternative schools. Writing results in Grades 4, 7, 10 were not included in ABCs.
95% of students (3-12) will be at or above grade level and demonstrate high growth.
Supt. Burns' 4 Strategic Directives
#1 Teaching and Learning
#2 Retain, Recruit, and Train#3 Systems and Structures
Many Voices, Smart Choices - Charting the Future of the Public Schools
Board of Education approves Goal 2008
Planning, Processes, and Possibilities
Goal - 100% graduating.
Proficiency targets for AYP (under NCLB) increased.SBE approved new growth standards and formulas for implementation in 05-06. Reading results for 6th grade were not included in growth calculations.
Formulas for calculating growth (expected and high) are new this year. US History and Civics and Economics are again included along with 4th, 7th, and 10th grade. The Most Improved School category is removed.
June 2014 According to NCLB, every child in America is proficient.
90% completing college, tech prep or college university prep course of study.
80% meeting course requirements for UNC system admission.
171Revenue by Source History - Operating BudgetWake County Public School System - FY 2008-09 Plan for Student Success
*Local revenues include fi nes and forfeitures, indirect cost, interest earned on investments, E-Rate, tuition and parking fees, cellular lease, and categorical programs.
Revenue by Source History - Operating Budget2003-04 2004-05 2005-06 2006-07 2007-08 2008-09
State County Appropriation Federal Local * Fund Balance
172 www.wcpss.net
Object means the service or commodity obtained as a result of a specifi c expenditure. Seven major object categories are used in our Chart of Accounts: (1) Salaries, (2) Employee Benefi ts, (3) Purchased Services,, (4) Supplies and Materials, (5) Capital Outlay, (6) Other Objects, and (7) Transfers. These broad categories are subdivided to obtain more detailed information about objects of expenditure. The Uniform Chart of Accounts structure, in accordance with state law, determines which object codes are available for use.
Budget by Obj ect Code Hist ory - Operating Budget
173Staff HistoryWake County Public School System - FY 2008-09 Plan for Student Success
The Staff History shows months of employment that are budgeted. Position control and allotments are managed in terms of months rather than positions. The Wake County Public School System has employees on 9, 10, 11, and 12 month contracts basis. Schools may process conversions from one type of position to another within ABC Transfer Policies. These conversions are for a one-year period only. The effects of the conversions have been removed from the data in this chart. To get a rough estimate of full-time equivalent (FTE) positions divide total months of employment by 10. This will not be completely accurate because our employees have different contract lengths of 9, 10, 11, or 12 months.
Wake County is consistently ranked as one of the best places in the United States in which to live, work and raise a family. Home to the internationally-acclaimed Research Triangle Park, the area provides a world-class combina-tion of economic vitality, educational opportunity, environmental quality and community quality-of-life. This area is among the fastest growing counties in the nation. A well-rounded combination of business and industry, higher education, historic preservation, arts and culture, and trees, green ways and lakes offers Wake County residents a quality lifestyle with excellent job and educational opportunities.
Wake County’s twelve municipalities include Apex, Cary, Fuquay-Varina, Garner, Holly Springs, Knightdale, Morrisville, Raleigh, Rolesville, Wake For-est, Wendell, and Zebu-lon. Raleigh is the state capital and county seat. The county is governed by a seven-member Wake County Board of Commissioners, who
are elected for four-year terms. Raleigh’s proximity to both the Blue Ridge Mountains and Atlantic Coast offer an abundance of recreation options. In less than four hours, skiers and snowboarders can enjoy a day on the slopes, or bask in the warm sun along the coast. Raleigh’s temperate climate also offers golfers year-round opportunities to improve their swing.
Hiking, biking, and fi shing are popular activities in the metro areas as well. Raleigh has been called the “park with a city in it” thanks to its award-winning parks, green ways and open space spread throughout the city and Wake Coun-ty. Raleigh and the Triangle area also actively support the arts and are home to a full-range of cultural attractions including some of the most renowned museums in the Southeast. The BTI Center for the Performing Arts is one of the best in the country and has a venue for national touring companies, in ad-
dition to locally produced plays and attractions. The concert hall is home to the North Carolina Symphony and features world class performers in both clas-sical and popular productions. Raleigh and its surrounding communities host many smaller community centers, which offer endless cultural opportunities as well. During the summer, the Triangle takes advantage of North Carolina’s moderate weather and hosts performances in outdoor theaters, parks, and gar-dens.
POPULATION
Wake County, is the largest county in the State of North Carolina. It boasts a total population of 786,522 (2006 estimate by the US Census Bureau). The increase from 2000, when the total population was 627,846, is 20 percent. The median age of Wake County residents is 34.6, according to the 2006 American Community Survey. Other data retrieved from the US Census Bureau, 2000 Census, provides the following profi le of general population characteristics of Wake County.
Population projections suggest that this trend is likely to continue. Pro-jections for 2008 suggest Wake County’s Popula-tion will near 854,592. Wake County is expected to pass one million resi-dents in 2013, and by 2030 Wake County is expected to have near-ly doubled its current population, reaching 1,484,484. The popula-tion density is 950 people per square mile. Wake County projects there are 91 newcomers per day in the county.
SUBJECT NO. %
Total Population 2006 786,522 100
Sex
Male 390,206 49.6
Female 396,316 50.4
Age
Under 5 years 60,332 7.7
18 years and over 585,565 74.4
65 years and over 60,127 7.6
Race
White 538,590 68.5
Black/African American 157,427 20.0
American Indian and Alaska Native 2,398 .30
Asian 35,134 4.5
Native Hawaiian 348 0.0
Some other Race 40,024 5.1
Two or more Races 12,601 1.6
Hispanic/Latino (of any race) 62,674 8.0
Falls Lake Source: http://ncparks.gov/Visit/parks/fala/main.php
Wake County Demographics
175Wake County DemographicsWake County Public School System - FY 2008-09 Plan for Student Success
Wake County Demographics HOUSING
Just as Wake County’s population has grown tremendously over the last 24 years, so has its housing supply. Between 1980 and 2000, the U.S. Census Bureau estimates that Wake County added more than 145,000 housing units to its housing stock. Wake County more than doubled its housing stock in only 20 years. In 2006, Wake County had an estimated 325,712 units. As in the case of population growth, much of this increase in the housing stock was driven by municipal growth. The biggest urban areas, Raleigh and Cary, add-ed the most new units, but many of the smaller towns grew faster, particularly Holly Springs, Morrisville, Knightdale, and Apex. only Garner increased its housing supply at a slower rate than in unicorporated Wake County.
2006 Housing units: 325,712 * 2006 Vacancy rate: 9.5% * 2007 Average residential property value: $186,410**2006 Average household size: 2.58 people/household * 2006 Housing density: 392 units/sq. mile****2007 January Residential average property value: $186,410** (County)*2006 American Community Survey**Wake County Revenue Department**** N.C. State Demographer
GEOGRAPHIC FACTS
The size of the County is 549,000 acres, or 860 sq. miles, or 2,212 sq. ki-lometers. From east to west, it measures 46 miles. From north to south, it measures 39 miles. The highest point in the County, about 540 feet above sea level, is a quarter of a mile north of Leesville. The lowest point in the County, about 160 feet above sea level, is a half of a mile southeast of Shot-well, where Marks Creek fl ows into Johnston County. The geographic cen-ter of Wake County is in Raleigh, near Broughton High School. The County is considered to be in a transitional zone between the Piedmont uplands and the coastal plain and, therefore, within the fall zone. The Neuse River and its tributaries drain about 80 percent of the County, and the southwestern part is drained by tributaries of the Cape Fear River. The stream network generally fl ows in a southeasterly direction.
ECONOMY
Wake County has witnessed high population growth due to its strong job market and rising levels of income. Job growth throughout the Triangle has benefi ted the residents of Wake County.
Wake County has experienced a relatively steady rise in per capita income over the last 45 years. Unlike population and housing growth, per capita income growth has been relatively linear. Income levels were rising at a slightly increased rate between 1959 and 1989 (from $4,400 to $5,700 every ten years) but fell off slightly between 1989 and 1999 (an increase of only $3,900).
On a countywide level, the median household income trend is very similar to that shown for per capita income, with a relatively linear growth pattern, and a slight slowing of growth between 1989 and 1999. According to the Ameri-can Community Survey, by 2006 median household income was $60,903, and the median family income was $78,369.
Despite the rise in per capita and median household incomes, Wake County had more people in poverty in 2000 than 1990. By 2006, the American Com-munity Survey estimated that 69,224 (9.1 percent) Wake County Residents were in poverty. Poverty numbers based on population within households.
With the infl ux of new residents and rising incomes, employment has changed signifi cantly since 1990. These changes are not only in rising lev-els of employment, but also structural changes in the employment industries and occupations of Wake County residents and in the industries and occupa-tions of workers employed in Wake County.
Agriculture, retail trade and wholesale trade all declined in total employ-ment numbers between 1990 and 2000. The biggest increases were in pro-fessional services, health care, and construction.
176 www.wcpss.net
Wake County Demographics
2006 Median family income: $78,369*2006 Median household income: $60,903*2006 Population below poverty line: 69,224 (9.1%)*Dec. 2007 Employment: 416,817 employees*** 2007 Unemployment rate: 3.5%***2006-07 Tax base components: 28% Commercial**; 72% Residential*** 2006 U.S. Census Bureau**Wake County Revenue Department*** Employment Security Commission of North Carolina
EDUCATION
School enrollments for Grades K-12 have increased signifi cantly since the mid-1970s. From 1975 through 2005, WCPSS added more than 66,000 new students, more than double its 1975 enrollment. Enrollment increases were modest until the mid-1980s, but have grown rapidly since that time. Be-tween 2003 and 2007, WCPSS saw enrollment increase by more than 29,541 students.
Wake County has also seen growth in Charter School enrollments. By the 2007-08 academic year, Wake County had 13 charter schools with a 20th
day membership of 5,319 students. This was nearly a 350-student increase over the previous academic year with one less charter school. Wake County also had a high number of residents enrolled in college or graduate school. According to the 2006 American Community Survey, Wake County had an estimated 63,910 residents enrolled in higher education in 2006.
2007-08 WCPSS membership: 134,0022007-08 Number of WCPSS schools: 153; number of charter schools: 132006 Adult population with high school or higher degree: 89.9%*2008-09 WCPSS 20th-Day student projection: 140,4432006 Adult population with B.A. or higher: 45.6% * 2007 Wake Tech enrollment: 57,000* 2006 U.S. Census Bureau
TRANSPORTATION
The number of drivers on Wake County roads has increased signifi cantly since 1990, and by the end of 2007, nearly 706,000 vehicles were registered in the county. One of the main sources of traffi c is people commuting to and from work. As the population increases, more people need to commute to and from work. Although a number of transportation modes exist, such as driving, carpooling, public transportation, biking and walking, the most common choice for commuting to work is driving alone. This tendency has increased over time.
2007 Registered vehicles: 706,0002006 Commuters who drive alone: 325,175 drivers (85.6%)*2006 Average commute time: 23.4 minutes*2006 Commuters taking public transportation: 1.3%*2006 Commuters carpooling: 10.7%*2006 Commuters walking: 1.4%*2006 Residents who worked from home: 21,606** 2006 U.S. Census Bureau
Principal Employers of Wake County
39,103
15,000
10,800
7,219 7,1005,000 4,500 4,300 3,697 3,500
0
5,000
10,000
15,000
20,000
25,000
30,000
35,000
40,000
45,000
Employees
State of North Carolina Wake County Public Schools International Business Machines (IBM)North Carolina State University WakeMed Health and Hospitals GlaxoSmithKlineSecuritas Security Rex Healthcare Wake County GovernmentSAS Institute, Inc.
177Wake County DemographicsWake County Public School System - FY 2008-09 Plan for Student Success
Things to Do within the Municipalities of Wake CountyFuquay-Varina is an endearing town where you can shop at Bos-tic and Wilson Antiques & Interiors or enjoy a good meal at the Gold Leaf Tea Room.
Holly Springs is home to one of the areas most successful mi-crobrewries and the Holly Springs Library and Cultural Center.
Apex: Visit the circa-1914 Apex Union Depot, dine at Peak City Grill and Bar and experience First Fridays downtown.
Cary is the summer home of the N.C. Symphony and the state’s only pro-soccer team, the Caroli-na RailHawks. Visit downtown for a mix of restaurants and specialty shops.
Morrisville is near the airport and Research Triangle Park and offers out-let shopping, wine tastings, orchid classes and action sports.
Wake Forest: Stroll through Wake Forest’s shops and art galleries dotting the historic downtown commercial district.
Rolesville's Fantasy Lake Scuba Park attacts more than its share of scu-ba divers for training and certifi cation.
Zebulon is home to AA Baseball’s Carolina Mudcats and neighborhoods of Victorian Craftsman and Colonial Revival style homes.
Wendell: A shopping trip to Kannon’s or Mortex Factory Outlet is a must on the Wendell to-do list.
Knightdale: There’s more than one reason to head to Knightdale, but not a better tasting one than Knightdale Seafood & Bar-B-Q.
Garner offers oysters at Sunny Side Too Oyster Bar, shopping at White Oak Crossing, and golf at Eagle Ridge.
Raleigh is home to the Carolina Hurricanes. Pick up tickets from October to April and visit the RBC center to enjoy an ice hockey game.
Raleigh
178 www.wcpss.net
Not es
179Growth - Student MembershipWake County Public School System - FY 2008-09 Plan for Student Success
INITIATIVE: Assistant Principals
Current Funding Formula:
The 2007-08 allotments were calculated using the following bands. This is a phase-in until funding is approved for the proposed formula.
Elementary Schools:If your projected student count is: Then your AP allotment is: 000-899 11 MOE Trad/12 MOE YR 900-1099 16.5 MOE Trad/18 MOE YR 1100+ 24 MOE
Middle Schools:If your projected student count is: Then your AP allotment is: 000-699 12 MOE 700-949 24 MOE 950-1399 29 MOE 1400+ 36 MOE
High Schools:If your projected student count is: Then your AP allotment is: Base Allotment 18 MOE 1650-2399 48 MOE 2400+ 60 MOE
Wake Commissioners reserved $3.0 million for a reserve for actual student count. They have set aside these dollars on the assumption that student membership will be 10% or 1,404 students less than projected. The $3.0 million is not included in the budget resolution for Wake County Schools for 2008-09 since it has not been released by Wake County. This case has been decreased by 26 months of employment, or $204,861 as part of the $3.0 million reserve.
Implementation Timeline & Budget Needed:
It is too early to know the student count by school for each of the next three years. Therefore, we are projecting the assistant principal months by applying the months per Average Daily Membership (ADM) from 2007-08 to the projected student membership for the next three years. Months will be allotted to schools each year by applying the phase-in formula above to the projected student membership for each school.
2008-09 MOE Amount Code 81.00 $ 440,721
33,71536,05134,020
Base 01.5400.005.116.0109.0000 SS 01.5400.005.211.0109.0000 Ret 01.5400.005.221.0109.0000 Hosp 01.5400.005.231.0109.0000
$ 544,507 State 39.00
(26.00)
$ 212,199 117,480
25,22026,96816,380
2,760(141,466)
(25,454) (12,769) (13,654) (10,920)
(598)
Base 02.5400.005.116.0109.0000 Supp 02.5400.005.181.0109.0000 SS 02.5400.005.211.0109.0000 Ret 02.5400.005.221.0109.0000 Hosp 02.5400.005.231.0109.0000 Dental 02.5400.005.234.0109.0000 Base 02.5400.005.116.0109.0000 Supp 02.5400.005.181.0109.0000 SS 02.5400.005.211.0109.0000 Ret 02.5400.005.221.0109.0000 Hosp 02.5400.005.231.0109.0000 Dental 02.5400.005.234.0109.0000
Additional AP Months – ProjectedStudents = 140,443
Less Wake County reserve for actual student membership
13.00 $196,146 Local Total: 120.00 $740,653
2009-10 MOE Amount Code 82.00 $ 472,894
36,17639,01435,670
Base 01.5400.005.116.0109.0000 SS 01.5400.005.211.0109.0000 Ret 01.5400.005.221.0109.0000 Hosp 01.5400.005.231.0109.0000
$ 583,754 State 62.00 $ 357,554
149,47238,78741,83026,970
3,312
Base 02.5400.005.116.0109.0000 Supp 02.5400.005.181.0109.0000 SS 02.5400.005.211.0109.0000 Ret 02.5400.005.221.0109.0000 Hosp 02.5400.005.231.0109.0000 Dental 02.5400.005.234.0109.0000
Additional AP Months – ProjectedStudents = 147,039
$ 617,295 Local Total: 144.00 $1,201,679
Growth - Student Membership
180 www.wcpss.net
Growth - Student Membership
2010-11 MOE Amount Code 90.00 $ 544,950
41,68944,95840,050
Base 01.5400.005.116.0109.0000 SS 01.5400.005.211.0109.0000 Ret 01.5400.005.221.0109.0000 Hosp 01.5400.005.231.0109.0000
$ 671,647 State 68.00 $ 411,740
172,22044,67348,17730,260
3,634
Base 02.5400.005.116.0109.0000 Supp 02.5400.005.181.0109.0000 SS 02.5400.005.211.0109.0000 Ret 02.5400.005.221.0109.0000 Hosp 02.5400.005.231.0109.0000 Dental 02.5400.005.234.0109.0000
Additional AP Months – ProjectedStudents = 154,244
$ 710,704 Local Total: 158.00 $1,382,351
181Growth - Student MembershipWake County Public School System - FY 2008-09 Plan for Student Success
Growth - Student Membership
INITIATIVE: Classroom Materials, Instructional Supplies, and Equipment
Wake Commissioners reserved $3.0 million for a reserve for actual student count. They have set aside these dollars on the assumption that student membership will be 10% or 1,404 students less than projected. The $3.0 million is not included in the budget resolution for Wake County Schools for 2008-09 since it has not been released by Wake County. This case has been decreased by $47,125 as part of the $3.0 million reserve.
Implementation Timeline & Budget Needed:
2008-09 Increase in Students Amount Code
ClassroomMaterials,InstructionalSupplies, and Equipment
6,441.00 $364,239 State 01.5110.061.411.0207.0000
6,441.00 $364,239 State ClassroomMaterials,InstructionalSupplies, and Equipment
Less Wake County reserve for actual studentmembership
(1,404.00)
$223,243
(47,125)
Local 02.5110.061.411.0207.0000
Local 02.5110.061.411.0207.0000
(1,404.00) $176,118 Local Total: 5,037.00 $540,357
2009-10 Increase in Students Amount Code
ClassroomMaterials,InstructionalSupplies, and Equipment
6,596.00 $371,934 State 01.5110.061.411.0207.0000
6,596.00 $371,934 State ClassroomMaterials,InstructionalSupplies, and Equipment
$227,959 Local 02.5110.061.411.0207.0000
$227,959 Local Total: 6,596.00 $599,893
2010-11 Increase in Students Amount Code
ClassroomMaterials,InstructionalSupplies, and Equipment
7,205.00 $410,351 State 01.5110.061.411.0207.0000
7,205.00 $410,351 State ClassroomMaterials,InstructionalSupplies, and Equipment
$244,763 Local 02.5110.061.411.0207.0000
$244,763 Local Total: 7,205.00 $655,114
182 www.wcpss.net
Growth - Student Membership
INITIATIVE: Classroom Teachers
Current Funding Formula:
Calculations are based on 10th day student membership. All students in Kindergarten through Grade 12 are reported. Pre-school students are not included.
High School:Integer((Grade9+Grade10+Grade11+Grade 12)/2.4)
Wake Commissioners reserved $3.0 million for a reserve for actual student count. They have set aside these dollars on the assumption that student membership will be 10% or 1,404 students less than projected. The $3.0 million is not included in the budget resolution for Wake County Schools for 2008-09 since it has not been released by Wake County. This case has been decreased by $129,341 as part of the $3.0 million reserve.
Implementation Timeline & Budget Needed:
2008-09 MOE Amount Code ADMTeacher Months
2,806.00
30.00
$ 9,104,516 696,495744,749
1,178,520$11,724,280
$ 97,340 7,4467,962
12,600$ 125,348
Base 01.5110.001.121.0101.0000 SS 01.5110.001.211.0101.0000 Ret 01.5110.001.221.0101.0000 Hosp 01.5110.001.231.0101.0000 Total – Program 001
Base 01.5110.008.121.0101.0000 SS 01.5110.008.211.0101.0000 Ret 01.5110.008.221.0101.0000 Hosp 01.5110.008.231.0101.0000 Total – Program 008
2,836.00 $11,849,628 State
Less Wake County reserve for actual student count
267.00
(459.00)
$ 866,324 1,321,161
167,342178,936112,140
71,293$ 2,717,196
$ 12,898 987
1,055696
$ 15,636
$158,989(275,583)
(8,919)(9,537)20,580
(14,871)$(129,341)
Base 02.5110.001.121.0101.0000 Supp 02.5110.001.181.0101.0000 SS 02.5110.001.211.0101.0000 Ret 02.5110.001.221.0101.0000 Hosp 02.5110.001.231.0101.0000 Dent 02.5110.001.234.0101.0000 Total – Program 001
Supp 02.5110.008.181.0101.0000 SS 02.5110.008.211.0101.0000 Ret 02.5110.008.221.0101.0000 Dent 02.5110.008.234.0101.0000 Total – Program 008
Base 02.5110.001.121.0101.0000 Supp 02.5110.001.181.0101.0000 SS 02.5110.001.211.0101.0000 Ret 02.5110.001.221.0101.0000 Hosp 02.5110.001.231.0101.0000 Dent 02.5110.001.234.0101.0000 Total – Reduction
(192.00) $2,603,491 Local Total: 2,644.00 $14,453,119
183Growth - Student MembershipWake County Public School System - FY 2008-09 Plan for Student Success
Growth - Student Membership
2009-10 MOE Amount Code ADMTeacher Months
2,843.00
50.00
$ 9,778,042 748,020806,689
1,236,705$12,569,456
$171,96713,15514,18721,750
$ 221,059
Base 01.5110.001.121.0101.0000 SS 01.5110.001.211.0101.0000 Ret 01.5110.001.221.0101.0000 Hosp 01.5110.001.231.0101.0000 Total – Program 001
Base 01.5110.008.121.0101.0000 SS 01.5110.008.211.0101.0000 Ret 01.5110.008.221.0101.0000 Hosp 01.5110.008.231.0101.0000 Total – Program 008
2,893.00 $12,790,515 State 1,295,615
99,115106,888
065,958
$ 1,567,576
$ 22,786 1,7431,8801,160
$ 27,569
Supp 02.5110.001.181.0101.0000 SS 02.5110.001.211.0101.0000 Ret 02.5110.001.221.0101.0000 Hosp 02.5110.001.231.0101.0000 Dent 02.5110.001.234.0101.0000 Total – Program 001
Supp 02.5110.008.181.0101.0000 SS 02.5110.008.211.0101.0000 Ret 02.5110.008.221.0101.0000 Dent 02.5110.008.234.0101.0000 Total – Program 008
$ 1,595,145 Local Total: 2,893.00 $14,385,660
2010-11 MOE Amount Code ADMTeacher Months
3,093.00
20.00
$ 11,169,771 854,488921,506
1,376,385$14,322,150
$ 72,226 5,5255,9598,900
$ 92,610
Base 01.5110.001.121.0101.0000 SS 01.5110.001.211.0101.0000 Ret 01.5110.001.221.0101.0000 Hosp 01.5110.001.231.0101.0000 Total – Program 001
Base 01.5110.008.121.0101.0000 SS 01.5110.008.211.0101.0000 Ret 01.5110.008.221.0101.0000 Hosp 01.5110.008.231.0101.0000 Total – Program 008
3,113.00 $14,414,760 State 1,480,022
113,222122,102
071,758
$ 1,787,104
$ 9,570 732790464
$ 11,556
Supp 02.5110.001.181.0101.0000 SS 02.5110.001.211.0101.0000 Ret 02.5110.001.221.0101.0000 Hosp 02.5110.001.231.0101.0000 Dent 02.5110.001.234.0101.0000 Total – Program 001
Supp 02.5110.008.181.0101.0000 SS 02.5110.008.211.0101.0000 Ret 02.5110.008.221.0101.0000 Dent 02.5110.008.234.0101.0000 Total – Program 008
$ 1,798,660 Local Total: 3,113.00 $16,213,420
184 www.wcpss.net
Growth - Student Membership
INITIATIVE: Contracted Services for Schools
Current Funding Formula:
Local - $6.17 per 10 day student count
Wake Commissioners reserved $3.0 million for a reserve for actual student count. They have set aside these dollars on the assumption that student membership will be 10% or 1,404 students less than projected. The $3.0 million is not included in the budget resolution for Wake County Schools for 2008-09 since it has not been released by Wake County. This case has been decreased by $8,663 as part of the $3.0 million reserve.
Implementation Timeline & Budget Needed:
2008-09 Increase in Students Amount Code Local K-12
Less Wake County reserve for actual student count
6,441
(1,404)
$39,741
(8,663)
02.5110.061.311.0109.0000
02.5110.061.311.0109.0000
Total: $31,078 Local
2009-10 Increase in Students Amount Code Local K-12 6,596 $40,697 02.5110.061.311.0109.0000
Total: $40,697 Local
2010-11 Increase in Students Amount Code Local K-12 7,205 $44,455 02.5110.061.311.0109.0000
Total: $44,455 Local
185Growth - Student MembershipWake County Public School System - FY 2008-09 Plan for Student Success
Growth - Student Membership
INITIATIVE: School-Based Clerical Allotment
Current Funding Formula:
Base Allotments
Elementary: 44 MOE (12 MOE Lead Secretary, 12 MOE NC Wise Data Manager, 10 MOE Media Assistant, 10 MOE Clerical Assistant)
Middle: 68 MOE (12 MOE Lead Secretary, 12 MOE NC Wise Data Manager, 12 MOE Bookkeeper, 12 MOE Guidance Assistant, 10 MOE Media Assistant, 10 MOE Receptionist)
10th Day K-12 Membership Adjustments to Base (only if positive)
Elementary: One month of employment per 35 students for schools in excess of 500 students. Partial months are rounded down.
Middle: One month of employment per 35 students for schools in excess of 800 students. Partial months are rounded down.
High: One month of employment per 35 students for schools in excess of 1,200 students. Partial months are rounded down.
Other
Year round schools are adjusted by 4 MOE.
Due to small size, Longview, Mount Vernon Redirection, River Oaks, and Wake Early College have a total allotment of 24 MOE and Phillips has a base of 30 MOE.
Implementation Timeline & Budget Needed:
2008-09 MOE Amount Code Laurel Park ES Mills Park ES Sycamore Creek ES
187Growth - Student MembershipWake County Public School System - FY 2008-09 Plan for Student Success
Growth - Student Membership
INITIATIVE: Teacher AssistantsWCPSS Formula:Calculations based on 10th day student membership. All students in Kindergarten through Grade 3 are reported. Pre-school students are not included. Distributions are through self-allotment until the day prior to Day 1 for traditional calendar schools. Unearned Months of Employment (MOE) after 10th day are removed or charged to individual schools Fund 6 accounts.
Base 01.5110.027.142.0101.0000 SS 01.5110.027.211.0101.0000 Ret 01.5110.027.221.0101.0000 Hosp 01.5110.027.231.0101.0000
732.00 $1,930,840 State 116.00 $ 215,632
16,49617,63948,72019,674
Base 02.5110.027.142.0101.0000 SS 02.5110.027.211.0101.0000 Ret 02.5110.027.221.0101.0000 Hosp 02.5110.027.231.0101.0000 Dent 02.5110.027.234.0101.0000
Base 01.5110.027.142.0101.0000 SS 01.5110.027.211.0101.0000 Ret 01.5110.027.221.0101.0000 Hosp 01.5110.027.231.0101.0000
670.00 $1,822,850 State 21.00 $ 39,037
2,9863,2219,135
15,544
Base 02.5110.027.142.0101.0000 SS 02.5110.027.211.0101.0000 Ret 02.5110.027.221.0101.0000 Hosp 02.5110.027.231.0101.0000 Dent 02.5110.027.234.0101.0000
Base 01.5110.027.142.0101.0000 SS 01.5110.027.211.0101.0000 Ret 01.5110.027.221.0101.0000 Hosp 01.5110.027.231.0101.0000
613.00 $1,673,902 State 0.00 $ 14,222 Dent 02.5110.027.234.0101.0000 0.00 $ 14,222 Local
Total: 613.00 $1,688,124
188 www.wcpss.net
Growth - Student Membership
INITIATIVE: Textbooks for Elementary, Middle, and High Schools
Current Funding Formula:
The distribution of textbook funds to each school is based on the total student count at each school. The allocation in 2007-08 is $67.00 per student.
Implementation Timeline & Budget Needed:
2008-09 Increase in Students Amount Code Textbooks 6,441 $403,340 01.5110.130.412.0277.0000
Total: 6,441 $403,340 State
2009-10 Increase in Students Amount Code Textbooks 6,596 $441,932 01.5110.130.412.0277.0000
Total: 6,596 $441,932 State
2010-11 Increase in Students Amount Code Textbooks 7,205 $482,735 01.5110.130.412.0277.0000
Total: 7,205 $482,735 State
189Growth - Student MembershipWake County Public School System - FY 2008-09 Plan for Student Success
Growth - Student Membership
INITIATIVE: Charter SchoolsCurrent Funding Formula: In accordance with § 115C-238.29H...... If a student attends a charter school, the local school administrative unit in which the child resides shall transfer to the charter school an amount equal to the per pupil local current expense appropriation to the local school administrative unit for the fi scal year. The amount transferred under this subsection that consists of revenue derived from supplemental taxes shall be transferred only to a charter school located in the tax district for which these taxes are levied and in which the student resides.
Implementation Timeline & Budget Needed:2007-08 Amount Amount Total
Estimated Expenditures to Charter Schools $ 9,901,639 Estimated Expenditures to Charter Schools $ 123,367 $ 10,025,006
2008-09Estimated County Appropriation as of July 1, 2008
Less: Portion of county appropriation for capital outlay
$316,200,000
(4,899,056)
Estimated fi nes and forfeitures as of July 1, 2008 $3,974,000
Estimated current expense county appropriation 311,300,944
Projected Student Membership WCPSS Charter Schools
County Appropriation per student
140,4434,825
145,268
$ 2,142.94
Projected Student Membership WCPSS Charter Schools
Fines and forfeitures per student
140,443 4,825
145,268
$ 27.36
Estimated Expenditures to Charter Schools
Increase from Previous Year
$ 10,399,697
$ 497,834
Estimated Expenditures to Charter Schools
Increase from Previous Year
$ 125,772
$ 2,405
$ 10,471,691
$ 500,239
Change due to increase in county appropriationChange due to increase in students
Adjustment for Wake County reserve for actual student count
$ 66,429 $ 371,629
$ 59,776
Change due to increase in fi nes and forfeituresChange due to increase in students
$ 13,286 ($ 4,658)
($6,222)
$ 79,715 $ 366,970
$ 53,554
$ 497,834 $ 8,627 $ 500,239
2009-10Estimated County Appropriation as of July 1, 2008
Less: Portion of county appropriation for capital outlay
$ 345,922,694
(8,636,722)
Estimated fi nes and forfeitures as of July 1, 2008 $ 4,075,000
Estimated current expense county appropriation 337,285,972
Projected Student Membership WCPSS Charter Schools
County Appropriation per Student
147,039 4,997
152,036
$ 2,218.41
Projected Student Membership WCPSS Charter Schools
Fines and forfeitures per Student
147,039 4,997
152,036
$ 26.80
190 www.wcpss.net
Growth - Student Membership
2009-10 Amount Amount TotalEstimated Expenditures to Charter Schools
Increase from Previous Year
$ 11,085,651
$ 745,954
Estimated Expenditures to Charter Schools
Increase from Previous Year
$ 133,934
$ 1,940
$ 11,219,585
$ 747,894
Change due to increase in county appropriationChange due to increase in students
$ 854,056 ($ 108,101)
Change due to increase in fi nes and forfeituresChange due to increase in students
$ 1,380 ($ 1,380)
$ 857,375 ($ 109,481)
$ 745,954 $ 1,940 $ 747,894
2010-11Estimated County Appropriation as of July 1, 2009
Less: Portion of county appropriation for capital outlay
$373,359,809
(11,190,458)
Estimated fi nes and forfeitures as of July 1, 2009 $ 4,176,000
Estimated current expense county appropriation 362,169,351
Projected Student Membership WCPSS Charter Schools
County Appropriation per Student
152,444 5,154
157,598
$ 2,298.06
Projected Student Membership WCPSS Charter Schools
Fines and forfeitures per Student
152,444 5,154
157,598
$ 26.50
Estimated Expenditures to Charter Schools
Increase from Previous Year
$11,844,191
$ 758,540
Estimated Expenditures to Charter Schools
Increase from Previous Year
$ 136,570
$ 2,636
$ 11,980,761
$ 761,176
Change due to increase in county appropriationChange due to increase in students
$ 813,773 ($ 55,232)
Change due to increase in fi nes and forfeituresChange due to increase in students
$ 3,303 ($ 667)
$ 817,076($ 55,900)
$ 758,540 $ 2,636 $ 761,176
The Wake County Public School System (WCPSS) sent confi rmation letters to each charter school to get a projected student count for the current year and next three years. The data returned from the charter schools is provided below.
191Growth - Student MembershipWake County Public School System - FY 2008-09 Plan for Student Success
Growth - Student Membership
CHARTER SCHOOL VERIFICATION LETTERS
School 2007-08 2008-09 2009-10 2010-11
Casa EsperanzaCentral ParkChathamCross CreekCommunity PartnersEast Wake AcademyExplorisFranklinGrandfatherHealth Start AcademyHopeKestrel HeightsMagellanMaureen Joy CharterOrangePacePreeminentProvisions AcademyQuestRaleigh Charter HighResearch TriangleRocky Mount PreparatorySparcSterlingTorchlightVanceVoyagerWoods
Academically Gifted (AG) Teacher Months for new schools and increased Months of Employment (MOE) at existing schools.
Current Funding Formula:
State Formula: $1,083.32 per child for 4 percent of ADM
WCPSS Formula: MOE are determined and distributed according to a complete annual student identification of AG students in a school. Approximately 17% of Wake County student population is identified as Academically Gifted.
Wake Commissioners reserved $3.0 million for a reserve for actual student count. They have set aside these dollars on the assumption that student membership will be 10% or 1,404 students less than projected. The $3.0 million is not included in the budget resolution for Wake County Schools for 2008-09 since it has not been released by Wake County. This case has been decreased by $12,508 as part of the $3.0 million reserve.
Base 01.5260.034.121.0143.0000 SS 01.5260.034.211.0143.0000 Ret 01.5260.034.221.0143.0000 Hosp 01.5260.034.231.0143.0000
$ 364,289 State $ 37,679
2,8823,1091,810
Supp 02.5260.034.181.0143.0000 SS 02.5260.034.211.0143.0000 Ret 02.5260.034.221.0143.0000 Dent 02.5260.034.234.0143.0000
$ 45,480 LocalTotal: 78.00 $ 409,769
193Growth - Student MembershipWake County Public School System - FY 2008-09 Plan for Student Success
Growth - Student Membership
INITIATIVE: Alternative Schools and Programs
Increase the number of students served in alternative schools and programs.
Current Funding Formula:
No funding formula exists. This growth plan is part of a three year plan to increase programming and physical capacity at alternative schools and programs.
Implementation Timeline & Budget Needed:
Add two classrooms at the elementary level Add .5 receptionist at Longview (all other alternative schools and
programs currently employ a receptionist)
2008-09 MOE Amount Code Increaseteachers for elementary services
20.00 $ 64,893 8,5995,6226,0128,400
464$ 93,990
Base 02.5310.001.121.0108.0000 Supp 02.5310.001.181.0108.0000 SS 02.5310.001.211.0108.0000 Ret 02.5310.001.221.0108.0000 Hosp 02.5310.001.231.0108.0000 Dental 02.5310.001.234.0108.0000 Total
Increase TAs for elementary alternativeservices Grade 18 Step 02 + 3%
20.00 $ 39,218 3,0003,2088,400
464$ 54,290
Base 02.5310.027.142.0108.0000 SS 02.5310.027.211.0108.0000 Ret 02.5310.027.221.0108.0000 Hosp 02.5310.027.231.0108.0000 Dental 02.5310.027.234.0108.0000 Total
Base 02.5400.003.151.0109.0000 SS 02.5400.003.211.0109.0000 Ret 02.5400.003.221.0109.0000 Hosp 02.5400.003.231.0109.0000 Dental 02.5400.003.234.0109.0000 Total
Total: 45.00 $163,040 Local
2009-10 MOE Amount Code $ 0
2010-11 MOE Amount Code $ 0
Curriculum Management Audit:
Recommendation 1: A1.7 Develop strategies to reduce high school failure / drop out
194 www.wcpss.net
Growth - Student Membership
INITIATIVE: Audiologists
Establish 6 MOE for Audiologists
Audiology is a required related service according to state and federal law. Audiologists identify and manage the classroom amplification needed by hearing impaired students, and support regular and special education classroom teachers in meeting the educational needs of hearing impaired students. In addition, audiologists participate in Child Find, conduct audio logical evaluations and help teachers understand and manage varying degrees of hearing loss and amplification.
Current Funding Formula:
The funding formula for audiology services, based on recommendations from the North Carolina Department of Public Instruction, is one (1) audiologist per 25,000 students plus one audiologist per 75 students with an identified hearing loss. The formula used last year was one audiologist per 18,000 students plus one audiologist for every 100 students. This formula was based on an average of the recommended formulas from the American Speech and Hearing Association (ASHA) and the Department of Public Instruction.
We would require 5.7 positions to serve our projected student population of 140,443 and 5.5 positions to serve our projected 412 students with hearing impairments for a total of 11.2 positions. We currently have 9 positions. We will need to add 2 positions to meet our current staffing needs. In 2005-2006, we requested two positions but received no new positions, in 2006-2007, we requested three positions and received a .5 position, and in 2007-2008 we requested 3 positions and received a .6 position. In addition, we are requesting funds to purchase laptops for these new positions.
Base 02.5250.032.132.0136.0820 Supp 02.5250.032.181.0136.0820 SS 02.5250.032.211.0136.0820 Ret 02.5250.032.221.0136.0820 Hosp 02.5250.032.231.0136.0820 Dental 02.5250.032.234.0136.0820 Total
Base 02.5250.032.132.0136.0820 Supp 02.5250.032.181.0136.0820 SS 02.5250.032.211.0136.0820 Ret 02.5250.032.221.0136.0820 Hosp 02.5250.032.231.0136.0820 Dental 02.5250.032.234.0136.0820
Base 02.5250.032.132.0136.0820 Supp 02.5250.032.181.0136.0820 SS 02.5250.032.211.0136.0820 Ret 02.5250.032.221.0136.0820 Hosp 02.5250.032.231.0136.0820 Dental 02.5250.032.234.0136.0820
Total: 14.00 $103,275 Local
195Growth - Student MembershipWake County Public School System - FY 2008-09 Plan for Student Success
Growth - Student Membership
INITIATIVE: Career and Technical Education (CTE) Months of Employment (MOE)
Current Funding Formula:
State Formula: A base allotment of 50 MOE are provided to each Local Educational Agency (LEA). Additionally, NC Department of Public Instruction distributes the remaining MOE based on ADM in grades 8-12. The average percentage increase from 2005-06 to 2006-07 and 2006-07 to 2007-08 is five percent of base MOE. CTE base allotted months for 2007-08 is as follows:
WCPSS Formula: Allocation to schools is based on the total school enrollment with consideration of the number of students enrolled in CTE courses.
2007-08 MOEState Allotment Months to be paid from lapsed salaries Local Months
5,391.845.16
12.00
5,409.00 Base Allotment Central Services positions for Instructional Specialists, School-to-Career Coordinator, VoCats Coordinator and Business Alliance Coordinator
(81.00)
5,328.00 Base Allotment to Schools
Implementation Timeline & Budget Needed:
2008-09 MOE Amount Code Additional MOE at existing schools:
Base MOE 5391.84 * 5% = 270 MOE
270.00 $ 876,058 67,01871,662
113,400
Base 01.5120.013.121.0180.0000 SS 01.5120.013.211.0180.0000 Ret 01.5120.013.221.0180.0000 Hosp 01.5120.013.231.0180.0000
270.00 $ 1,128,138 State
$116,0818,8809,4956,264
Supp 02.5120.013.181.0180.0000 SS 02.5120.013.211.0180.0000 Ret 02.5120.013.221.0180.0000
Dent 02.5120.013.234.0180.0000 $ 140,720 Local
Total: 270.00 $ 1,268,858
2009-10 MOE Amount Code Additional MOE at existing schools:
Base MOE 5661.84 * 5% = 283 MOE
283.00 $ 963,015 73,67179,449
121,800
Base 01.5120.013.121.0180.0000 SS 01.5120.013.211.0180.0000 Ret 01.5120.013.221.0180.0000 Hosp 01.5120.013.231.0180.0000
283.00 $ 1,237,935 State
$ 127,604 9,762
10,5276,496
Supp 02.5120.013.181.0180.0000 SS 02.5120.013.211.0180.0000 Ret 02.5120.013.221.0180.0000 Dent 02.5120.013.234.0180.0000
$ 154,389 Local Total: 283.00 $1,392,324
2010-11 MOE Amount Code Additional MOE at existing schools: M9M10 Mills Park H2 Heritage
Months to be paid from lapsed salaries:
Base MOE 5941.84 * 5% = 296 MOE
120.00
48.0048.00
100.00
(20.00)
$ 1,079,127
82,55389,028
131,720
Base 01.5120.013.121.0180.0000
SS 01.5120.013.211.0180.0000 Ret 01.5120.013.221.0180.0000 Hosp 01.5120.013.231.0180.0000
296.00 $ 1,382,428 State$ 142,989
10,93911,797
6,867
Supp 02.5120.013.181.0180.0000 SS 02.5120.013.211.0180.0000 Ret 02.5120.013.221.0180.0000 Dent 02.5120.013.234.0180.0000
$ 172,592 LocalTotal: 296.00 $ 1,555,020
196 www.wcpss.net
Growth - Student Membership
INITIATIVE: English as a Second Language (ESL) Teacher Months of Employment (MOE)
Current Funding Formula:
Annual review of identified ESL students occurs. Teacher:Student ratio at an ESL designated school is determined by dividing projected ESL funding by the number of identified ESL students on locator. (Average ESL teacher to student ratio 1:47).
Implementation Timeline & Budget Needed:
2008-09 MOE Amount Code Base positions 2007-2008: 1,854.00
2007-2008 ESL Student population: 6,823 X 6% increase due to growth= 7,232 Increased ESL student population: 409 divided by 1:47 ESL Teacher to student ratio = 8.7 positions for a total of 87 MOE
87.00 $ 282,285 21,59523,09136,540
Base 01.5270.054.121.0132.0000 SS 01.5270.054.211.0132.0000 Ret 01.5270.054.221.0132.0000 Hosp 01.5270.054.231.0132.0000
87.00 $ 363,511 State $ 37,404
2,8613,0602,018
Supp 02.5270.054.181.0132.0000 SS 02.5270.054.211.0132.0000 Ret 02.5270.054.221.0132.0000 Dent 02.5270.054.234.0132.0000
$ 45,343 LocalTotal: 87.00 $ 408,854
2009-10 MOE Code Base positions 2008-2009: 1,941.00
2007-2008 ESL Student population: 7,232 X 6% increase due to growth=7,666 Increased ESL student population: 434 divided by 1:47 ESL Teacher to student ratio = 9.2 positions for a total of 92 MOE
92.00 $ 316,419 24,20626,10540,020
Base 01.5270.054.121.0132.0000 SS 01.5270.054.211.0132.0000 Ret 01.5270.054.221.0132.0000 Hosp 01.5270.054.231.0132.0000
$ 406,750 State $ 41,927
3,2073,4592,134
Supp 02.5270.054.181.0132.0000 SS 02.5270.054.211.0132.0000 Ret 02.5270.054.221.0132.0000 Dent 02.5270.054.234.0132.0000
$ 50,727 LocalTotal: 92.00 $ 457,477
2010-11 MOE Amount Code Base positions2009-2010: 2,037.00
2007-2008 ESL Student population: 7,666 X 6% increase due to growth=8,126 Increased ESL student population: 460 divided by 1:47 ESL Teacher to student ratio = 9.8 positions for a total of 98 MOE
98.00 $ 357,279 27,33229,47643,610
Base 01.5270.054.121.0132.0000 SS 01.5270.054.211.0132.0000 Ret 01.5270.054.221.0132.0000 Hosp 01.5270.054.231.0132.0000
98.00 $ 457,697 State $ 47,341
3,6223,9062,274
Supp 02.5270.054.181.0132.0000 SS 02.5270.054.211.0132.0000 Ret 02.5270.054.221.0132.0000 Dent 02.5270.054.234.0132.0000
$ 57,143 Local Total: 98.00 $ 514,840
197Growth - Student MembershipWake County Public School System - FY 2008-09 Plan for Student Success
Growth - Student Membership
INITIATIVE: Intervention Months of Employment (MOE)
Elementary and middle schools are allocated Months of Employment (MOE) to provide supplemental math, reading, and language arts instruction to Level I and II students in grades three through eight.
Current Funding Formula:Initial allotments are based on the number of Level I and II students for the Accelerated Learning Program (ALP) during the previous school year. The total number of Level I and II students in grades three through eight for 2006-07 school year was 15,685. This was 26.3 percent of the students with valid tests. We anticipate an increase in the percent of Level I and II students due to the re-norming of the end-of-grade (EOG) reading spring 2008 assessments.
In 2007-08, the Wake County Public School System (WCPSS) received a state allotment of $158.64 per student who scored at Level I and II on either reading or mathematics EOG tests in grades three through eight. Months are allotted on the basis of one MOE for every 13 students scoring Level I and II in grades three through eight. The maximum initial allotment is 20 MOE. Additional allotments may be made based upon rerostered EOG results after the tenth day.
Growth request for 2008-09 MOE is based on anticipated growth in Level I and II students; approximately 2,661 times $158.64 per student = $422,141 divided by one state teacher month of employment $4,178 = 101 MOE.
Additional local MOE requested for Challenged Schools are allotted to elementary and middle schools with a free/reduced population of 30 percent or more schools are determined eligible based on spring projections from the Office of Growth Management.
Year Round (YR) schools use months of employment to provide remediation and/or support for students who need to catch up during the intersession or track-out period.
In order to equitably distribute resources and to align intervention efforts, intervention months of employment will be allotted to schools from the pool of state ALP, local Challenged School MOE’s, and Intersession MOE’s.
Implementation Timeline & Budget Needed:Composite score improvement reported by the North Carolina Department of Public Instruction (NCDPI) from 2005-06 to 2006-07, was 1.1 percent. Projections are assuming that percent of Level I and II students decrease one percent in 2009-10, and one percent in 2010-11.
2008-09 MOE Amount Code Teacher-Intervention
101.00 $ 327,711 25,07026,80742,420
Base 01.5330.072.121.0103.0000 SS 01.5330.072.211.0103.0000Ret 01.5330.072.221.0103.0000Hosp 01.5330.072.231.0103.0000
Base 02.5330.072.121.0103.0000 Supp 02.5330.072.181.0103.0000SS 02.5330.072.211.0103.0000Ret 02.5330.072.221.0103.0000Hosp 02.5330.072.231.0103.0000Dental 02.5330.072.234.0103.0000
$ 68,507 Local Total: 16.00 $ 139,246
198 www.wcpss.net
Growth - Student Membership
Curriculum Management Audit:Recommendation 1: A1.5 Oversee all reports, budgets, plans, assessments, programs, and interventions to ascertain the equitable treatment of all students.
2010-11 MOE Amount Code Teacher-Intervention
12.00 $ 43,336 3,3153,5755,340
Base 01.5330.072.121.0103.0000 SS 01.5330.072.211.0103.0000Ret 01.5330.072.221.0103.0000Hosp 01.5330.072.231.0103.0000
199Growth - Student MembershipWake County Public School System - FY 2008-09 Plan for Student Success
Growth - Student Membership
INITIATIVE: K-5 Curriculum and Instruction Months of Employment (MOE)
K-5 Curriculum and Instruction Months of Employment provide teachers for music, visual art, physical education, and other instructional personnel.
Current Funding Formula:
Elementary is based on 1:13.75 Grades 6-12 allocations are not formula driven, but determined by elective needs.
Wake Commissioners reserved $3.0 million for a reserve for actual student count. They have set aside these dollars on the assumption that student membership will be 10% or 1,404 students less than projected. The $3.0 million is not included in the budget resolution for Wake County Schools for 2008-09 since it has not been decreased by Wake County. This case has been decreased by $249,073 as part of the $3.0 million reserve.
Less Wake County reserve for actual student membership
260.00
(53.00)
$ 843,612 111,781
73,08878,151
109,2006,032
(171,967) (22,786) (14,899) (15,931) (22,260)
(1,230)
Base 02.5110.001.121.0155.0000 Supp 02.5110.001.181.0155.0000 SS 02.5110.001.211.0155.0000 Ret 02.5110.001.221.0155.0000 Hosp 02.5110.001.231.0155.0000 Dent 02.5110.001.234.0155.0000
Base 02.5110.001.121.0155.0000 Supp 02.5110.001.181.0155.0000 SS 02.5110.001.211.0155.0000 Ret 02.5110.001.221.0155.0000 Hosp 02.5110.001.231.0155.0000 Dent 02.5110.001.234.0155.0000
Base 01.5110.001.121.0155.0000 SS 01.5110.001.211.0155.0000 Ret 01.5110.001.221.0155.0000 Hosp 01.5110.001.231.0155.0000
246.00 $1,139,103 StateLess: 2009-10 Base 5266 = 251 MOE
5.00 $ 18,057 120,106
10,56911,398
2,2255,823
Base 02.5110.001.121.0155.0000 Supp 02.5110.001.181.0155.0000 SS 02.5110.001.211.0155.0000 Ret 02.5110.001.221.0155.0000 Hosp 02.5110.001.231.0155.0000
Dent 02.5110.001.234.0155.0000 5.00 $ 168,178 Local
Total: 251.00 $1,307,281
200 www.wcpss.net
Growth - Student Membership
INITIATIVE: Media Specialists
Current Funding Formula:
Media Specialists needed for growth based on current funding formulas; new schools require a media specialist to run the media program at each site.
Traditional Year Round 150-824: 10 MOE 825-999: 15 MOE 1000-1499: 20 MOE 1500-1999: 25 MOE 2000-2499: 30 MOE Over 2500: 35 MOE
201Growth - Student MembershipWake County Public School System - FY 2008-09 Plan for Student Success
Growth - Student Membership
INITIATIVE: Occupational Therapists
Current Funding Formula:
Approximately 10 percent of identified special education students (18,716) receive occupational therapy. Currently approximately 1,900 students receive occupational therapy services. Based on current projections, approximately 1,966 students will require occupational therapy services during the 2008-09 school year.
At an average caseload of 45 students, we need a total of 437 occupational therapy months to serve these students. We currently have 394 months available to provide direct services. We are requesting a ratio change to the state maximum for 1:50. Therefore, we require no additional positions for 2008-09, nineteen months for 2009-10, and 21 months for 2010-11.
In 2005-06, we requested seven positions and received two positions, in 2006-07, we requested five positions and received two positions, and in 2007-08 we requested fourteen positions and received three positions. In addition, we are requesting funds to purchase laptops for the new positions in 2009-10 and 2010-11.
Base 02.5220.032.145.0136.0820 Supp 02.5220.032.181.0136.0820 SS 02.5220.032.211.0136.0820 Ret 02.5220.032.221.0136.0820 Hosp 02.5220.032.231.0136.0820 Dental 02.5220.032.234.0136.0820 Total
Base 02.5220.032.145.0136.0820 Supp 02.5220.032.181.0136.0820 SS 02.5220.032.211.0136.0820 Ret 02.5220.032.221.0136.0820 Hosp 02.5220.032.231.0136.0820 Dental 02.5220.032.234.0136.0820
Total: 21.00 $ 114,356 Local
202 www.wcpss.net
Growth - Student Membership
INITIATIVE: Physical Therapists
Current Funding Formula:
Approximately four percent of identified special education students (18,716) receive physical therapy services. Based on current projections, approximately 786 students will require physical therapy services during the 2008-09 school year. To reach caseloads of 50 students per physical therapist; as outlined in state Procedures Governing Students with Disabilities, we need a total of 157 months.
The current base MOE for 2007-08 is 131 months. We are requesting 26 additional physical therapy months for the 2008-2009 school year based on zero to four years of experience. In addition, we are requesting funds to purchase laptops for these new positions at a cost of $1,900 each.
Wake Commissioners reserved $3.0 million for a reserve for actual student count. They have set aside these dollars on the assumption that student membership will be 10% or 1,404 students less than projected. The $3.0 million is not included in the budget resolution for Wake County Schools for 2008-09 since it has not been released by Wake County. This case has been decreased by $29,712 as part of the $3.0 million reserve.
Implementation Timeline & Budget Needed:
2008-09 MOE Amount Code Physical Therapist
Identifiedstudents served: 786/50*10 MOE = 157 less base of 131 = 26 MOE
Laptops(one time cost)
26.00 $ 105,181 9,7298,7919,400
10,920603
5,700
Base 02.5840.032.145.0136.0820 Supp 02.5840.032.181.0136.0820 SS 02.5840.032.211.0136.0820 Ret 02.5840.032.221.0136.0820 Hosp 02.5840.032.231.0136.0820 Dental 02.5840.032.234.0136.0820
Supplies 02.5840.032.411.0136.0820
2008-09 MOE Amount Code Less Wake County reserve for actual studentmembership
(5.00) ($20,227) (1,871)(1,691)(1,808)(2,100)
(116) (1,899)
Base 02.5840.032.145.0136.0820 Supp 02.5840.032.181.0136.0820 SS 02.5840.032.211.0136.0820 Ret 02.5840.032.221.0136.0820 Hosp 02.5840.032.231.0136.0820 Dental 02.5840.032.234.0136.0820 Supplies 02.5840.032.411.0136.0820
Total: 21.00 $ 120,612 Local
2009-10 MOE Amount Code Physical Therapist
Identifiedstudents served: 825/50*10 MOE = 165 less base of 157 = 8 MOE
Laptops(one time cost)
8.00 $ 34,305 3,1732,8673,0923,480
186
1,900
Base 02.5840.032.145.0136.0820 Supp 02.5840.032.181.0136.0820 SS 02.5840.032.211.0136.0820 Ret 02.5840.032.221.0136.0820 Hosp 02.5840.032.231.0136.0820 Dental 02.5840.032.234.0136.0820
Supplies 02.5840.032.411.0136.0820
Total: 8.00 $ 49,003 Local
2010-11 MOE Amount Code Physical Therapist
Identifiedstudents served: 867/50*10 MOE = 173 less base of 165 = 8 MOE
Laptops(one time cost)
8.00 $ 36,020 3,3323,0103,2473,560
186
1,900
Base 02.5840.032.145.0136.0820 Supp 02.5840.032.181.0136.0820 SS 02.5840.032.211.0136.0820 Ret 02.5840.032.221.0136.0820 Hosp 02.5840.032.231.0136.0820 Dental 02.5840.032.234.0136.0820
Supplies 02.5840.032.411.0136.0820
Total: 8.00 $ 51,255 Local
203Growth - Student MembershipWake County Public School System - FY 2008-09 Plan for Student Success
Growth - Student Membership
INITIATIVE: Preschool Special Education Referral and Assessment Team
As per state and federal law, the school system must engage in Special Education Child Find activities for eligible children ages three to twenty-one. Prior to 2005 the assessment responsibility of children ages three to five fell to the Department of Health and Human Services through the old Developmental Evaluation Center evaluation center. Since 2005 the Department of Health and Human Services has changed its priorities and no longer assesses children age’s three to five, thus placing greater responsibility on the public schools. Preschool Services’ referrals have increased to 1,566 in 2005–06 and to 1,695 in 2006–07. Preschool Services has assessment teams to process and evaluate the children suspected of having a need for special education services. Each assessment team is expected to process 160 children in a school year. These teams are staffed with a case manager, teacher, speech therapist, psychologist, social worker, and an occupational therapist, physical therapist, and audiologist, depending on referral concerns.
Currently we have nine teams who are able to process 1,440 children. We need additional teams to keep up with growth. The result of not having enough staff to fully fund the appropriate level of services is that mandated timelines for providing services are not met. As reported to us by the Department of Public Instruction in recent monitoring activities on Continuous Improvement Performance Plan Indicator 12, we must develop a plan to increase our percentage of serving children who received early intervening services as infants or toddlers and who continue to be eligible for services by their 3rd
birthday. An additional team will assist us in responding to this requirement as outlined by the Department of Public Instruction. Funding for this assessment team is being requested. The team will be assigned to the Shaw University project, which will require funding for furniture, technology, mileage, and supplies. An additional team is also requested for each of the next two years reflecting the expected growth of 110 children per year.
Implementation Timeline & Budget Needed:
2008-09 MOE Amount Code Teacher(recurring)
Case Manager (recurring)
SpeechTherapist(recurring)
12.00
12.00
12.00
$38,940$5,160$3,374$3,607$4,200
$232$55,513
$38,940$5,160$3,374$3,607$4,200
$232$55,513
$53,700$7,164$4,656$4,978$4,200
$232$74,930
Base 02.5230.032.121.0363.0820 Supp 02.5230.032.181.0363.0820 SS 02.5230.032.211.0363.0820 Ret 02.5230.032.221.0363.0820 Hosp 02.5230.032.231.0363.0820 Dental 02.5230.032.234.0363.0820 Total
Base 02.5230.032.121.0363.0820 Supp 02.5230.032.181.0363.0820 SS 02.5230.032.211.0363.0820 Ret 02.5230.032.221.0363.0820 Hosp 02.5230.032.231.0363.0820 Dental 02.5230.032.234.0363.0820 Total
Base 02.5240.032.132.0363.0820 Supp 02.5240.032.181.0363.0820 SS 02.5240.032.211.0363.0820 Ret 02.5240.032.221.0363.0820 Hosp 02.5240.032.231.0363.0820 Dental 02.5240.032.234.0363.0820 Total
Psychologist (recurring)
12.00 $53,700 $9,252$4,816$5,150$4,200
$232$77,350
Base 02.5230.032.133.0363.0820 Supp 02.5230.032.181.0363.0820 SS 02.5230.032.211.0363.0820 Ret 02.5230.032.221.0363.0820 Hosp 02.5230.032.231.0363.0820 Dental 02.5230.032.234.0363.0820 Total
Base 02.5230.032.121.0363.0820 Supp 02.5230.032.181.0363.0820 SS 02.5230.032.211.0363.0820 Ret 02.5230.032.221.0363.0820 Hosp 02.5230.032.231.0363.0820 Dental 02.5230.032.234.0363.0820 Total
Base 02.5230.032.121.0363.0820 Supp 02.5230.032.181.0363.0820 SS 02.5230.032.211.0363.0820 Ret 02.5230.032.221.0363.0820 Hosp 02.5230.032.231.0363.0820 Dental 02.5230.032.234.0363.0820 Total
SpeechTherapist(recurring)
Audiologist(recurring)
12.00
6.00
$56,928$7,596$4,936$5,324$4,350
$232$79,366
$28,464$3,798$2,468$2,661$2,175
$116$39,682
Base 02.5240.032.132.0363.0820 Supp 02.5240.032.181.0363.0820 SS 02.5240.032.211.0363.0820 Ret 02.5240.032.221.0363.0820 Hosp 02.5240.032.231.0363.0820 Dental 02.5240.032.234.0363.0820 Total
Base 02.5250.032.132.0363.0820 Supp 02.5250.032.181.0363.0820 SS 02.5250.032.211.0363.0820 Ret 02.5250.032.221.0363.0820 Hosp 02.5250.032.231.0363.0820 Dental 02.5250.032.234.0363.0820 Total
Social Worker (recurring)
6.00 $29,850$4,710$2,644$2,851$2,175
$116$42,346
Base 02.5820.032.131.0363.0820 Supp 02.5820.032.181.0363.0820 SS 02.5820.032.211.0363.0820 Ret 02.5820.032.221.0363.0820 Hosp 02.5820.032.231.0363.0820 Dental 02.5820.032.234.0363.0820 Total
Base 02.5230.032.133.0363.0820 Supp 02.5230.032.181.0363.0820 SS 02.5230.032.211.0363.0820 Ret 02.5230.032.221.0363.0820 Hosp 02.5230.032.231.0363.0820 Dental 02.5230.032.234.0363.0820 Total
OccupationalTherapist(recurring)
Physical Therapist(recurring)
Workshop Exp Staff Mileage Printing(recurring)
Supplies – assessmentmaterials(recurring)
6.00
6.00
$24,293$2,247$2,030$2,190$2,175
$116$33,051
$24,293$2,247$2,030$2,190$2,175
$116$33,051
$2,000$7,000$1,000
$5,000
Base 02.5220.032.145.0363.0820 Supp 02.5220.032.181.0363.0820 SS 02.5220.032.211.0363.0820 Ret 02.5220.032.221.0363.0820 Hosp 02.5220.032.231.0363.0820 Dental 02.5220.032.234.0363.0820 Total
Base 02.5840.032.145.0363.0820 Supp 02.5840.032.181.0363.0820 SS 02.5840.032.211.0363.0820 Ret 02.5840.032.221.0363.0820 Hosp 02.5840.032.231.0363.0820 Dental 02.5840.032.234.0363.0820 Total
205Growth - Student MembershipWake County Public School System - FY 2008-09 Plan for Student Success
Growth - Student Membership
2010-11 MOE Amount Code Teacher(recurring)
Case Manager (recurring)
12.00
12.00
$43,752$5,796$3,790$4,088$4,450
$232$62,108
$43,752$5,796$3,790$4,088$4,450
$232$62,108
Base 02.5230.032.121.0363.0820 Supp 02.5230.032.181.0363.0820 SS 02.5230.032.211.0363.0820 Ret 02.5230.032.221.0363.0820 Hosp 02.5230.032.231.0363.0820 Dental 02.5230.032.234.0363.0820 Total
Base 02.5230.032.121.0363.0820 Supp 02.5230.032.181.0363.0820 SS 02.5230.032.211.0363.0820 Ret 02.5230.032.221.0363.0820 Hosp 02.5230.032.231.0363.0820 Dental 02.5230.032.234.0363.0820 Total
Psychologist (recurring)
12.00 $60,348 $10,392
$5,412$5,836$4,450
$232$86,670
Base 02.5230.032.133.0363.0820 Supp 02.5230.032.181.0363.0820 SS 02.5230.032.211.0363.0820 Ret 02.5230.032.221.0363.0820 Hosp 02.5230.032.231.0363.0820 Dent 02.5230.032.234.0363.0820 Total
SpeechTherapist(recurring)
12.00 $60,348 $8,052$5,233$5,643$4,450
$232$83,958
Base 02.5240.032.132.0363.0820 Supp 02.5240.032.181.0363.0820 SS 02.5240.032.211.0363.0820 Ret 02.5240.032.221.0363.0820 Hosp 02.5240.032.231.0363.0820 Dental 02.5240.032.234.0363.0820 Total
INITIATIVE: Printing and Reproduction Costs for Evaluation and Research
Current Funding Formula:
We anticipate an increase of $1.00 per additional student due to the increased need for printing and translations.
Wake Commissioners reserved $3.0 million for a reserve for actual student count. They have set aside these dollars on the assumption that student membership will be 10% or 1,404 students less than projected. The $3.0 million is not included in the budget resolution for Wake County Schools for 2008-09 since it has not been released by Wake County. This case has been decreased by $1,404 as part of the $3.0 million reserve.
Implementation Timeline & Budget Needed:
2008-09 MOE Amount Code 6,441 additional students @ $1 each
207Growth - Student MembershipWake County Public School System - FY 2008-09 Plan for Student Success
Growth - Student Membership
INITIATIVE: School Counselors
Current Funding Formula:
The American School Counselor Association recommends 1:250 as the appropriate ratio for school counselors to students. The current funding formula used in the Wake County Public School System (WCPSS) yields school counselor-to-student ratios that significantly fall short of the national recommendations.
Elementary Schools – current ratio 1:557 Middle Schools – current ratio 1:345 High Schools – current ratio 1:320
WCPSS distribution guidelines:
Elementary Schools – current ratio 1:557
Year round allocation is based on ¾ of the student planning allotment for traditional/modified calendar schools.
Middle Schools – current ratio 1:345
Year round allocation is based on ¾ of the student planning allotment for traditional/modified calendar schools.
High Schools – current ratio 1:320
Wake Commissioners reserved $3.0 million for a reserve for actual student count. They have set aside these dollars on the assumption that student membership will be 10% or 1,404 students less than projected. The $3.0 million is not included in the budget resolution for Wake County Schools for 2008-09 since it has not been released by Wake County. This case has been decreased by $26,048 as part of the $3.0 million reserve.
High School 1,680/320 = 5.2* 10 MOE Total Growth: 52 MOE
$ 128,097 9,799
10,5684,037
Supp 02.5830.007.181.0146.0000 SS 02.5830.007.211.0146.0000 Ret 02.5830.007.221.0146.0000 Dent 02.5830.007.234.0146.0000
Note: Salary based on Masters - 5yr + $126 for advance certificate + 6%
$ 152,501 Local Total: 174.00 $ 1,173,528
209Growth - Student MembershipWake County Public School System - FY 2008-09 Plan for Student Success
Growth - Student Membership
INITIATIVE: School Psychologist Contracts
Increase amount of contracted services for school psychology due to growth in student enrollment.
Current Funding Formula:
School Psychology continues to be a growing need for the Wake County Public School System (WCPSS). Contracted psychologists are a cost effective way of decreasing the ratio of students evaluatedto psychologist and permits allocated employed psychologists to perform comprehensive service to assigned schools. Psychological evaluations must be completed within a 90-day timeline per the Individuals with Disabilities Education Act (IDEA). Contracted psychologists provide these evaluations and meet this legally required timeline. We are expecting a 6 percent increase in students requiring testing for 2008-09.
Current funding for this is $57,106 (local) and $40,000 (Medicaid). Medicaid funds have been reduced in 2007-08 and are in jeopardy of further reductions or elimination in 2008-09. Amounts requested reflect replacing Medicaid funding with local funding plus anticipated growth.
Wake Commissioners reserved $3.0 million for a reserve for actual student count. They have set aside these dollars on the assumption that student membership will be 10% or 1,404 students less than projected. The $3.0 million is not included in the budget resolution for Wake County Schools for 2008-09 since it has not been released by Wake County. This case has been decreased by $1,213 as part of the $3.0 million reserve.
Implementation Timeline & Budget Needed:
Funding increase requested each year to meet expected increase in student growth.
INITIATIVE: School Psychologist Months of Employment (MOE)
Increase allotment of school psychologist months of employment due to growth in student enrollment.
Current Funding Formula:158 students per MOE is the current funding formula. The National Association of School Psychologists recommends a ratio of 1:1000. Currently, there are 894 MOEs allocated to serve students in Pre-kindergarten through Grade 12, and there are 134,206 students enrolled, or an approximate ratio of 1:1657. Figures below are based on five years experience. Equipment needs include test kits, laptop, and printer. Travel is based on $50 per month.
Wake Commissioners reserved $3.0 million for a reserve for actual student count. They have set aside these dollars on the assumption that student membership will be 10% or 1,404 students less than projected. The $3.0 million is not included in the budget resolution for Wake County Schools for 2008-09 since it has not been released by Wake County. This case has been decreased by $10,538 as part of the $3.0 million reserve.
2009-10 MOE Amount Code School Psychologists 5 yr + 6 % & adv certificate
6,596/158 = 42 MOE (Recurring)
42.00 $206,886 15,827 17,068 18,270
Base 01.5210.007.133.0202.0000 SS 01.5210.007.211.0202.0000 Ret 01.5210.007.221.0202.0000 Hosp 01.5210.007.231.0202.0000
42.00 $258,051 State $ 36,672
2,805 3,025
974
Supp 02.5210.007.181.0202.0000 SS 02.5210.007.211.0202.0000 Ret 02.5210.007.221.0202.0000 Dent 02.5210.007.234.0202.0000
Test supplies (Recurring)
6,440 02.5830.801.411.0349.0820
Travel (Recurring) 2,500 02.5830.801.332.0349.0820 $ 52,416 Local
Total: 42.00 $310,467
2010-11 MOE Amount Code School Psychologists 5 yr + 6 % & adv certificate
7,205/158 = 46 MOE (Recurring)
46.00 $237,919 18,201 19,628 20,470
Base 01.5210.007.133.0202.0000 SS 01.5210.007.211.0202.0000 Ret 01.5210.007.221.0202.0000 Hosp 01.5210.007.231.0202.0000
46.00 $296,218 State $42,173
3,226 3,479 1,067
Supp 02.5210.007.181.0202.0000 SS 02.5210.007.211.0202.0000 Ret 02.5210.007.221.0202.0000 Dent 02.5210.007.234.0202.0000
Test supplies (Recurring)
6,440 02.5830.801.411.0349.0820
Travel (Recurring) 2,500 02.5830.801.332.0349.0820 $58,885 Local
Total: 46.00 $355,103
211Growth - Student MembershipWake County Public School System - FY 2008-09 Plan for Student Success
Growth - Student Membership
INITIATIVE: School Social Worker Months of Employment (MOE)
Increase allotment of school social worker months of employment due to growth.
Current Funding Formula:192 students per social work MOE: The National Association of School Social Workers recommends a ratio of 1:400 students or one MOE per 40 students. Currently there are 591 social work months to serve 134,002 students, which is a 1:227 ratio. This is a higher ratio than the current funding formula. Salaries are based on five years experience and $126 advanced certificate with an estimated 6% salary increase for 2008-09 and 2009-10 and with a 5% salary increase in 2010-2011.
Wake Commissioners reserved $3.0 million for a reserve for actual student count. They have set aside these dollars on the assumption that student membership will be 10% or 1,404 students less than projected. The $3.0 million is not included in the budget resolution for Wake County Schools for 2008-09 since it has not been released by Wake County. This case has been decreased by $9,915 as part of the $3.0 million reserve.
Office Supplies - includes cell phones @ $35 person/year(Recurring)
(7,800)
2,200
02.5830.801.411.0146.0920
02.5320.801.411.0146.0820
Travel @ $2,000 person/year (Recurring)
8,000 02.5320.069.332.0213.0820
2008-09 MOE Amount Code Less Wake County reserve for actual student count
($5,292) (405) (433) (185)
(1,600) (2,000)
Supp 02.5320.007.181.0213.0000 SS 02.5320.007.211.0213.0000 Ret 02.5320.007.221.0213.0000 Dent 02.5320.007.234.0213.0000 02.5320.801.411.0146.0820 02.5320.069.332.0213.0820
$23,523 Local Total: 26.00 $203,365
2009-10 MOE Amount Code School Social Work
Student Growth: 6,596/192 = 34 MOE
34.00 $151,511 11,591 12,500 14,790
Base 01.5320.007.131.0213.0000 SS 01.5320.007.211.0213.0000 Ret 01.5320.007.221.0213.0000 Hosp 01.5320.007.231.0213.0000
34.00 $190,392 State
Office Supplies - includes cell phones @ $35 person/year (Recurring)
Travel @ $2,000 person/year(Recurring)
$ 23,838 1,824 1,967
789$28,418
2,200
8,000
Supp 02.5320.007.181.0213.0000 SS 02.5320.007.211.0213.0000 Ret 02.5320.007.221.0213.0000 Dent 02.5320.007.234.0213.0000
02.5320.801.411.0146.0820
02.5320.069.332.0213.0820
$38,618 LocalTotal: 34.00 $229,010
2010-11 MOE Amount Code School Social Work
Student Growth: 7,205/192 = 38 MOE
38.00 $177,802 13,602 14,669 16,910
Base 01.5320.007.131.0213.0000 SS 01.5320.007.211.0213.0000 Ret 01.5320.007.221.0213.0000 Hosp 01.5320.007.231.0213.0000
38.00 $222,983 State $27,975
2,140 2,308
882$33,305
Supp 02.5320.007.181.0213.0000 SS 02.5320.007.211.0213.0000 Ret 02.5320.007.221.0213.0000 Dent 02.5320.007.234.0213.0000
Office Supplies - includes cell phones @ $35 person/year(Recurring)
$ 2,200 02.5320.801.411.0146.0820
Travel @ $2,000 person/year(Recurring)
$ 8,000 02.5320.069.332.0213.0820
$ 43,505 LocalTotal: 38.00 $266,488
212 www.wcpss.net
Growth - Student Membership
INITIATIVE: Special Education Contract Services
As we use state funds mostly for positions, we are not able to utilize these funds to contract for services required through a student’s Individual Education Plan (IEP). These services include interpreting services, evaluation services and specialized programs for students with significant emotional and behavior issues or those who have been long-term suspended. These services are required by federal law.
Current Funding Formula:
We currently have $4,284,765 obligated for contract services in 2007-08 and 18,716 identified special education students. To determine the amount of increase needed, we used the per pupil amount $228.94 times the number of new students 940 based on projections. This equates to an additional $215,204 for contract services in 2008-09 (940 x $228.94 = $215,204) according to the formula. No dollars are requested for 2008-09 pending renegotiation of all contracts.
Implementation Timeline & Budget Needed:
2008-09 MOE Amount Code Contract Services $ 0
Total: $ 0
2009-10 MOE Amount Code Contract Services
Projected increase in students: 963 * $228.94
$ 220,469 02.5210.032.311.0136.0820
Total: $ 220,469 Local
2010-11 MOE Amount Code Contract Services
Projected increase in students: 1,052 * $228.94
$ 240,845 02.5210.032.311.0136.0820
Total: $ 240,845 Local
213Growth - Student MembershipWake County Public School System - FY 2008-09 Plan for Student Success
Growth - Student Membership
INITIATIVE: Special Education Supplies and Materials
Funds will be used to provide specialized instructional supplies and equipment, including Braille textbooks, assistive technology devices, and specialized equipment. We also provide start up funds to new special education teachers and classes for needed supplies and materials. So far this school year, we have provided $64,000 to schools to purchase supplies for new classes.
Current Funding Formula:
Funds provided to schools for materials range from $80.83 to $94.83. The amounts provided per grade levels are as follows: K-3 -- $88.23, 4-5 -- $80.93, 6-8 -- $90.58, and 9-12 -- $94.83. We used the average of $88.65 times the number of new students 940 receiving special education, based on projections, to determine the amount of additional funds needed (940 times $88.65 = $83,331).
Wake Commissioners reserved $3.0 million for a reserve for actual student count. They have set aside these dollars on the assumption that student membership will be 10% or 1,404 students less than projected. The $3.0 million is not included in the budget resolution for Wake County Schools for 2008-09 since it has not been released by Wake County. This case has been decreased by $53,889 as part of the $3.0 million reserve.
Establish 780 months for special education teacher assistants.
Special Education teacher assistants are required for self-contained classes as established by state law. Additionally, teacher assistants are required to meet a student’s unique needs as established by the student’s Individual Education Plan (IEP). So far during the 2007-08 school year, we have had to add 55 additional teacher assistants to meet federal mandates to provide comparable services for students from other districts that require adult assistance. Of the teacher assistants added three were for preschool students, forty-four were for elementary students, and eight were for secondary students.
Current Funding Formula:
Preschool: 4 new separate classes = 4 teacher assistants
Total preschool teacher assistants: 4
Elementary: 20 new separate classes = 20 teacher assistant positions
(1 per class) 20 teacher assistants to address class size overages to meet
staffing requirements under state Procedures Governing Students with Disabilities
9 for resource classes (approximately 467 resource students ÷ 50)
Total elementary teacher assistants: 49
Secondary: 8 new separate classes = 8 teacher assistants (1 per class) 8 teacher assistants to address class size overages to meet
staffing requirements under state Procedures Governing Students with Disabilities
9 for resource classes (approximately 426 resource students ÷ 50)
Total secondary teacher assistants: 25
TOTAL TEACHER ASSISTANTS: 78 (4 PRESCHOOL, 49 ELEMENTARY, 25 SECONDARY.) TOTAL MOE = 780
Base 01.5210.032.142.0136.0000 SS 01.5210.032.211.0136.0000 Ret 01.5210.032.221.0136.0000 Hosp 01.5210.032.231.0136.0000
$758,946 Total State 498.00 976,523
74,70479,880
209,16018,096
Base 02.5210.032.142.0136.0000 SS 02.5210.032.211.0136.0000 Ret 02.5210.032.221.0136.0000 Hosp 02.5210.032.231.0136.0000 Dental 02.5210.032.234.0136.0000
Base 01.5210.032.142.0136.0000 SS 01.5210.032.211.0136.0000 Ret 01.5210.032.221.0136.0000 Hosp 01.5210.032.231.0136.0000
$891,049 Total State 459.00 927,051
70,91976,482
199,66518,096
Base 02.5210.032.142.0136.0000 SS 02.5210.032.211.0136.0000 Ret 02.5210.032.221.0136.0000 Hosp 02.5210.032.231.0136.0000 Dental 02.5210.032.234.0136.0000
Base 01.5210.032.142.0136.0000 SS 01.5210.032.211.0136.0000 Ret 01.5210.032.221.0136.0000 Hosp 01.5210.032.231.0136.0000
$1,028,189 Total State 430.00 894,533
68,43273,799
191,35018,328
Base 02.5210.032.142.0136.0000 SS 02.5210.032.211.0136.0000 Ret 02.5210.032.221.0136.0000 Hospital 02.5210.032.231.0136.0000 Dental 02.5210.032.234.0136.0000
$1,246,442 Total LocalTotal: 790.00 $ 2,274,631
215Growth - Student MembershipWake County Public School System - FY 2008-09 Plan for Student Success
Growth - Student Membership
INITIATIVE: Special Education Teachers
Establish 54 teacher positions (540 MOE)
Based on current special education class enrollments, growth trends for special education students, student membership projections and current funding formulas, 54 special education teacher positions will be needed to support growth and new classes. Projections for 2009-2010 and 2010-2011 are based on the same rate of growth.
Current Funding Formula:
$3,348.47 per identified special education student up to 12.5% of average daily membership
Expected students for 2008-2009 (140,443) times percentage of students receiving special education (13.7% based on April 2007 childcount) = 19,241 ÷ 16.65 (average class size) = 54 new teacher positions. For the 2007-2008 school year, we received 94 positions for growth.
Wake Commissioners reserved $3.0 million for a reserve for actual student count. They have set aside these dollars on the assumption that student membership will be 10% or 1,404 students less than projected. The $3.0 million is not included in the budget resolution for Wake County Schools for 2008-09 since it has not been released by Wake County. This case has been decreased by $6,255 as part of the $3.0 million reserve.
Implementation Timeline & Budget Needed:
2008-09 MOE Amount Code Teacher MOE 508.00
20.00
$1,687,223129,073138,015218,400
$64,8934,9645,3088,400
Base 01.5210.032.121.0136.0000 SS 01.5210.032.211.0136.0000 Ret 01.5210.032.221.0136.0000 Hosp 01.5210.032.231.0136.0000
Base 01.5230.032.121.0363.0820 SS 01.5230.032.211.0363.0820 Ret 01.5230.032.221.0363.0820 Hosp 01.5230.032.231.0363.0820
528.00 $ 2,256,276 State
2008-09 MOE Amount Code
Less Wake County reserve for actual student count
$223,563 17,10218,28812,064
$8,599658703464
($5,159) (395)(422)(279)
Supp 02.5210.032.181.0136.0000 SS 02.5210.032.211.0136.0000 Ret 02.5210.032.221.0136.0000 Dental 02.5210.032.234.0136.0000
Supp 02.5230.032.181.0363.0820 SS 02.5230.032.211.0363.0820 Ret 02.5230.032.221.0363.0820 Dental 02.5230.032.234.0363.0820
Supp 02.5230.032.181.0363.0820 SS 02.5230.032.211.0363.0820 Ret 02.5230.032.221.0363.0820 Dental 02.5230.032.234.0363.0820
Base 01.5210.032.121.0136.0000 SS 01.5210.032.211.0136.0000 Ret 01.5210.032.221.0136.0000 Hospital 01.5210.032.231.0136.0000
590.00 $ 2,732,000 State $282,321
21,59823,29113,688
Supp 02.5210.032.181.0136.0000 SS 02.5210.032.211.0136.0000 Ret 02.5210.032.221.0136.0000 Dental 02.5210.032.234.0136.0000
$ 340,898 LocalTotal: 590.00 $ 3,072,898
216 www.wcpss.net
Growth - Student Membership
INITIATIVE: Speech Therapists
Establish 41.5 Months of Employment (MOE) for Speech Therapists.
Speech therapy is required based on state and federal mandates. Speech/Language Pathologists deliver speech therapy services as specified in a student’s Individual Education Plan (IEP). Speech pathologists are an integral part of a school’s team because of their knowledge of speech/language development and how it impacts a student’s academic, social and/or vocational development.
Current Funding Formula:
Caseload of 50 students per speech therapist: approximately four percent of the total student population receives speech services. These positions serve all students versus other related services that pertain to special education children. Based on projected student numbers four new positions are needed for 2008-2009. In addition, funds to purchase laptops are needed at a cost of $1,900 each.
Wake Commissioners reserved $3.0 million for a reserve for actual student count. They have set aside these dollars on the assumption that student membership will be 10% or 1,404 students less than projected. The $3.0 million is not included in the budget resolution for Wake County Schools for 2008-09 since it has not been released by Wake County. This case has been decreased by $55,607 as part of the $3.0 million reserve.
Base 02.5240.032.132.0136.0000 Supp 02.5240.032.181.0136.0000 SS 02.5240.032.211.0136.0000 Ret 02.5240.032.221.0136.0000 Hosp 02.5240.032.231.0136.0000 Dental 02.5240.032.234.0136.0000
Supplies 02.5240.032.411.0136.0820
Base 02.5240.032.132.0136.0000 Supp 02.5240.032.181.0136.0000 SS 02.5240.032.211.0136.0000 Ret 02.5240.032.221.0136.0000 Hosp 02.5240.032.234.0136.0000
Base 02.5240.032.132.0136.0000 Supp 02.5240.032.181.0136.0000 SS 02.5240.032.211.0136.0000 Ret 02.5240.032.221.0136.0000 Hosp 02.5240.032.231.0136.0000 Dental 02.5240.032.234.0136.0000
Base 02.5240.032.132.0136.0000 Supp 02.5240.032.181.0136.0000 SS 02.5240.032.211.0136.0000 Ret 02.5240.032.221.0136.0000 Hosp 02.5240.032.231.0136.0000 Dental 02.5240.032.234.0136.0000
Supplies 02.5240.032.411.0136.0820 Total: 55.00 $383,722 Local
Note: Salaries are based on two years experience with $126 for advanced certificate.
217Growth - Student MembershipWake County Public School System - FY 2008-09 Plan for Student Success
Growth - Student Membership
INITIATIVE: Test Administration Costs
Current Funding Formula:
The requested increase is based on the increased numbers of students, additional alternate assessments, and costs to administer retests for High School Exit Standards. The exception to the formula is the Cognitive Aptitude (CogAT), which is expected to increase $.17 more in 2008, $.18 in 2009, and $.20 in 2010.
Wake Commissioners reserved $3.0 million for a reserve for actual student count. They have set aside these dollars on the assumption that student membership will be 10% or 1,404 students less than projected. The $3.0 million is not included in the budget resolution for Wake County Schools for 2008-09 since it has not been released by Wake County. This case has been decreased by $2,809 as part of the $3.0 million reserve.
Implementation Timeline & Budget Needed:
2008-09 Assessments Amount Code 6,441 additional students @ $.50
815 additional students @ $4.39
2,000replacementbooks @ $4.39
Additional tests 6,441 @ $1.50
Less Wake County reserve for actual student count
EOG/EOC
CogAT Gr 3
Replacement books for CogAt
Writing, Computer Skills, Competency, HSCT, NCExtend2, NCExtend1, etc.
$ 3,221
3,578
8,780
9,662
(2,809)
02.6710.801.411.0223.0970
02.6710.801.411.0223.0870
02.6710.801.411.0223.0870
02.6710.801.411.0223.0970
02.6710.801.411.0223.0970
Total: $ 22,432 Local
2009-10 Assessments Amount Code 6,596 additional students @ $.50
782 additional students @ $4.54
2,200replacementbooks @ $4.54
Additional tests 6,596 @ $1.50
EOG/EOC
CogAT Gr 3
Replacement books for CogAt
Writing, Computer Skills, Competency, HSCT, NCExtend2, NCExtend1, etc.
$ 3,298
3,550
9,988
9,894
02.6710.801.411.0223.0870
02.6710.801.411.0223.0870
02.6710.801.411.0223.0870
02.6710.801.411.0223.0970
Total: $26,730 Local
2010-11 Assessments Amount Code 7,205 additional students @ $.50
156 additional students @ 4.74
2,400replacementbooks @ $4.74
Additional tests 7,205 @ $1.50
EOG/EOC
CogAT Gr 3
Replacement books for CogAt
Writing, Computer Skills, Competency, HSCT, NCExtend2, NCExtend1, etc.
$ 3,603
739
11,376
10,808
02.6710.801.411.0223.0870
02.6710.801.411.0223.0870
02.6710.801.411.0223.0870
02.6710.801.411.0223.0970
Total: $26,526 Local
218 www.wcpss.net
Growth - Student Membership
INITIATIVE: Transition Counselors
Increase allotment of Transition Counselor months of employment due to growth in student enrollment.
Current Funding Formula:
One Transition Counselor per 110 new long-term suspended student cases. As the Wake County Public School System (WCPSS) student enrollment continues to rise, so do long-term suspensions. During the 2004-05 there were 1,010 long-term suspended students, 2005-06 there were 1,028 long-term suspended students and 2006-07 there were 1,154 students recommended for long-term suspension including expulsions served by seven Transition Counselors. During 2006-07, two percent of the middle and high school student population were long-term suspended. Between 2005-06 and 2006-07 there was a 12 percent increase in long-term suspensions, thus justifying a need for additional positions. In 2005-06, 13 percent of WCPSS elementary students and 11 percent of middle school students had academic multiple risk factors based on a recent WCPSS study. Salaries are based on five years experience and $126 advanced certificate with an estimated six percent salary increase for 2008-09 and 2009-10 and five percent salary increase in 2010-11.
Base 01.5830.068.131.0342.0820 SS 01.5830.068.211.0342.0820 Ret 01.5830.068.221.0342.0820 Hosp 01.5830.068.231.0342.0820
01.5830.069.332.0342.0820
01.5830.069.411.0342.0820 10.00 $59,979 State
$ 7,362 563607232
Supp 02.5830.068.181.0342.0820 SS 02.5830.068.211.0342.0820 Ret 02.5830.068.221.0342.0820 Dent 02.5830.068.234.0342.0820
$ 8,764 Local Total: 10.00 $68,743
219Growth - Student MembershipWake County Public School System - FY 2008-09 Plan for Student Success
Growth - Student Membership
INITIATIVE: Communications - Advertising
The costs associated with the system’s strategy of distributing information directly to our key stakeholders and the larger community as a whole has required this funding increase in order to meet the needs of the next fiscal year.
Current Funding Formula:
The Communications Department advertising budget for 2007-2008 is locally funded at $25,060.
Implementation Timeline & Budget Needed:
2008-09 MOE Amount Code Current funding base of $25,060
$ 9,000 02.6950.801.313.0120.0907
Total: $ 9,000
2009-10 MOE Amount Code Funding of $34,060 plus a 3 percent increase in newspaper insertion costs
$ 1,022 02.6950.801.313.0120.0907
Total: $ 1,022
2010-11 MOE Amount Code Funding of $35,082 plus a 3 percent increase in newspaper insertion costs
$ 1,052 02.6950.801.313.0120.0907
Total: $ 1,052
220 www.wcpss.net
Growth - Student Membership
INITIATIVE: Communications - Printing and Binding
The current growth needs for both increased internal and external publications, newsletters, and specialty publications requires the Communications Department to increase the scope and quantity of the materials currently being produced in order to effectively meet the system's goals of engaging the community, building greater understanding among its stakeholders, and reaching out to our growing community of interested citizens.
Current Funding Formula:
The Communications Department's printing and binding budget for 2007-2008 is locally funded at $ 87,600.
Wake Commissioners reserved $3.0 million for a reserve for actual student count. They have set aside these dollars on the assumption that student membership will be 10% or 1,404 students less than projected. The $3.0 million is not included in the budget resolution for Wake County Schools for 2008-09 since it has not been released by Wake County. This case has been decreased by $3,000 as part of the $3.0 million reserve.
Implementation Timeline & Budget Needed:
2008-09 MOE Amount Code Current funding of $87,600
Less Wake Count reserve for actual student count
$ 28,000
(3,000)
02.6950.801.314.0120.0907
02.6950.801.314.0120.0907
Total: $ 25,000 Local
2009-10 MOE Amount Code Funding of $115,600 plus a 5 percent increase for new school expansion and student growth
$ 5,780 02.6950.801.314.0120.0907
Total: $ 5,780 Local
2010-11 MOE Amount Code Funding of $121,380 plus a 2 percent increase student growth
$ 2,428 02.6950.801.314.0120.0907
Total: $ 2,428 Local
221Growth - Student MembershipWake County Public School System - FY 2008-09 Plan for Student Success
Growth - Student Membership
INITIATIVE: Customer Service Center - Support Position
Current Funding Formula:
The Customer Service Center opened on June 7, 2000 with five staff members. At that time, the district enrolled approximately 100,000 students. The formula was one Customer Service staff member for every 20,000 students. Since then we have grown by 34,000 students without additional customer service support. Using the same formula, we should add another customer service representative this year and another the following year.
Implementation Timeline & Budget Needed:
The position will be effective July 1, 2008. No additional funds are needed for furniture, equipment, etc. The workstation for the new employee is currently in place.
2008-09 MOE Amount Code CustomerService Rep
Grade 20 Step 02 + 3%
12.00 $ 25,845 1,9772,1144,200
232
(15,000)
Base 02.6950.801.151.0120.0907.000 SS 02.6950.801.211.0120.0907.000 Ret 02.6950.801.221.0120.0907.000 Hosp 02.6950.801.231.0120.0907.000 Dent 02.6950.801.234.0120.0907.000
Contract 02.6950.801.311.0120.0907 Total: 12.00 $ 19,368 Local
2009-10 MOE Amount Code CustomerService Rep
Grade 20 Step 02 + 3%
12.00 $ 26,620 2,0362,1964,350
232
Base 02.6950.801.151.0120.0907.000 SS 02.6950.801.211.0120.0907.000 Ret 02.6950.801.221.0120.0907.000 Hosp 02.6950.801.231.0120.0907.000 Dent 02.6950.801.234.0120.0907.000
Total: 12.00 $ 35,434 Local
2010-11 MOE Amount Code Total: $ 0
222 www.wcpss.net
Growth - Student Membership
INITIATIVE: Bus Dispatch Position
This is an addition of one position to expand the hours of operation for dispatch due to growth in the student population and the increasing number of buses.
Transportation is projecting an increase of thirty-six new buses for 2008-09 and over 5,000 new riders. To provide adequate dispatch coverage for this growth, one additional dispatch position is requested. The dispatch position in the Transportation Department is responsible for monitoring all calls from parents, State Highway Patrol, local police, mechanics, and buses. Mechanics and tow trucks are dispatched to bus breakdowns and the position handles all emergency issues regarding buses that occur during the day.
Currently there is no coverage for afternoon dispatch since the current position comes in at 5:00 A.M. and leaves at 3:00 p.m. This leaves the afternoon bus runs without a dispatcher. This task is being handled by mechanic team-leaders which take them away from their primary duties. The Transportation Department will be implementing expanded hours at the bus garage to 8:00 p.m. The addition of the dispatch position will assure that adequate coverage is available for all buses running after school routes.
The continued growth of students and the number of buses needed to transport them requires mechanics to focus on their job. Adding one additional dispatch position will allow the Transportation Department to properly handle daily and emergency communications throughout the day for students.
Implementation Timeline & Budget Needed:
2008-09 MOE Amount Code Savings realized if mechanics are not used
($14,404) (1,102)(1,178)
Savings 01.6550.056.175.0225.0980 SS 01.6550.056.211.0225.0980 Ret 01.6550.056.221.0225.0980
($16,684) State Dispatcher,Grade 20, Step 00
12.00 $ 25,236 1,9312,0644,200
232600
1,00020
Base 02.6550.056.151.0225.0980 SS 02.6550.056.211.0225.0980 Ret 02.6550.056.221.0225.0980 Hosp 02.6550.056.231.0225.0980 Dent 02.6550.706.234.0225.0980 Supp 02.6550.706.411.0225.0980 Computer 02.6550.706.411.0225.0980 Nextel 02.6550.056.344.0225.0980
$ 35,283 Local Total: 12.00 $ 18,599
2009-10 MOE Amount Code Less: one-time cost from previous year
Total bus driver positions for 2007-2008 = 846. We do not have a position for every bus. We operate with an approximate vacancy rate of 5% and will continue to budget at this level and buses will continue to be driven by substitute drivers. We are requesting 27 twelve-month drivers for 2008-2009,
All funded positions will be 12-month drivers. All unfunded positions will be 10-month drivers.
For new positions, use the 7 standard hours and the beginning salary of $11.81 for 240 days.
Wake Commissioners reserved $3.0 million for a reserve for actual student count. They have set aside these dollars on the assumption that student membership will be 10% or 1,404 students less than projected. The $3.0 million is not included in the budget resolution for Wake County Schools for 2008-09 since it has not been released by Wake County. This case has been decreased by $246,912 as part of the $3.0 million reserve.
Implementation Timeline & Budget Needed:
2008-09 MOE Amount Code Bus Drivers, Step 00
Unfunded Bus Drivers
324.00
460.00
$535,70240,98143,851
113,400
0
Base 01.6550.056.171.0225.0000 SS 01.6550.056.211.0225.0000 Ret 01.6550.056.221.0225.0000 Hosp 01.6550.056.231.0225.0000
Base 01.6550.056.171.0225.0000
784.00 $733,934 State
Less Wake County reserve for actual student count
(149)
$ 6,264 540
(178,567) (13,660) (14,617) (37,800)
(2,088)(180)
Dent 02.6550.706.234.0225.0000 Next 02.6550.056.344.0225.0980
Base 02.6550.056.171.0225.0000 SS 02.6550.056.211.0225.0000 Ret 02.6550.056.221.0225.0000 Hosp 02.6550.056.231.0225.0000 Dent 02.6550.706.234.0225.0000 Next 02.6550.056.344.0225.0980
(149.00) ($240,108) Local Total: 635.00 $493,826
2009-10 MOE Amount Code Bus Drivers, Step 00
Unfunded Bus Drivers
492.00
480.00
$ 813,473 62,23167,112
178,350
0
Base 01.6550.056.171.0225.0000 SS 01.6550.056.211.0225.0000 Ret 01.6550.056.221.0225.0000 Hosp 01.6550.056.231.0225.0000
Base 01.6550.056.171.0225.0000
$1,121,166 State $ 9,512
820Dent 02.6550.706.234.0225.0000 Next 02.6550.056.344.0225.0980
$ 10,332 Local Total: 972.00 $1,131,498
2010-11 MOE Amount Code Bus Drivers, Step 00
Unfunded Bus Drivers
528.00
510.00
$ 872,996 66,78572,022
195,800
0
Base 01.6550.056.171.0225.0000 SS 01.6550.056.211.0225.0000 Ret 01.6550.056.221.0225.0000 Hosp 01.6550.056.231.0225.0000
Base 02.6550.056.171.0225.0000
$1,207,603 State 10,208
880Dent 02.6550.706.234.0225.0000 Next 02.6550.056.344.0225.0980
$ 11,088 Local Total: 1,038.00 $1,218,691
224 www.wcpss.net
Growth - Student Membership
INITIATIVE: Child Nutrition Services (CNS)
Current Funding Formula:
The 2008-09 budget is based on historical revenue and expenditure patterns. The CNS budget is driven by revenue required per student for a balanced budget. The 2008-2009 funding formula is based on 140,443 students attending Wake County Public School System (WCPSS). With 140,443 attending WCPSS, the required revenue per student will be $312.
2009-10 Budget divided by 147,039 students = $310/student 2010-11 Budget divided by 154,244 students = $308/student
The three-year proposed budget reflects a reduction in revenue per student required for a CNS balanced budget. The reduction is the result of fixed CNS expenditures being amortized over a larger student population.
Each new elementary/middle school has a full time manager, assistant manager, full-time cashier/assistant, and a part-time cashier/assistant. New high schools are staffed with a manager, assistant manager, two part-time cashier/assistants, and four full-time cashier/assistants. Total Months of Employment (MOE) for year-round elementary schools are 42 and 60 MOEs for traditional high schools.
Implementation Timeline & Budget Needed:
Projected labor, shown in the table, is for staffing the new schools projected to open during the next three years. MOEs are subject to change based upon the number of year round schools. Some expense line items increased due to expected enrollment growth each year. The audited FC-1A was used to determine percentages for all revenue codes, therefore, some revenue codes were decreased in 2008-2009. Revenue codes in 2009-10 and 2010-11 were increased due to anticipated student enrollment growth.
Base 05.7200.035.176.0140.000 SS 05.7200.035.211.0140.000 Ret 05.7200.035.221.0140.000 Hosp 05.7200.035.231.0140.000 Dental 05.7200.035.234.0140.000
CNS Assistant Managers
48.00 99,632 7,6218,219
17,400928
Base 05.7200.035.175.0140.000 SS 05.7200.035.211.0140.000 Ret 05.7200.035.221.0140.000 Hosp 05.7200.035.231.0140.000 Dental 05.7200.035.234.0140.000
CNSCashier/Assistant
72.00 137,535 10,521
7,56417,400
928
Base 05.7200.035.174.0140.000 SS 05.7200.035.211.0140.000 Ret 05.7200.035.221.0140.000 Hosp 05.7200.035.231.0140.000 Dental 05.7200.035.234.0140.000
Expenses: 1,144,399
46,335 450
6,998 459,331 92,847
Labor/BenefitsContracted Services Mobile Telephone Supplies and Materials FoodIndirect Cost
Total: 168.00 $1,750,360 EnterpriseRevenues:
1,585697,758
27,678410,333566,107
12,9703,055
30,874
State Reimbursement USDA Grant Breakfast Sales Lunch Sales Supplemental Sales Catered Meals/Snacks Suppers/Banquets Interest
Total: $1,750,360 Enterprise
It is anticipated that additional high schools will implement the “scatter” system lunch model. Sufficient funds are included in the operating budget for additional equipment that may be required to satisfactorily implement the system at additional schools.
Base 05.7200.035.176.0140.000 SS 05.7200.035.211.0140.000 Ret 05.7200.035.221.0140.000 Hosp 05.7200.035.231.0140.000 Dental 05.7200.035.234.0140.000
CNS Assistant Managers
58.00 124,001 9,486
10,23022,250
1,160
Base 05.7200.035.175.0140.000 SS 05.7200.035.211.0140.000 Ret 05.7200.035.221.0140.000 Hosp 05.7200.035.231.0140.000 Dental 05.7200.035.234.0140.000
CNSCashier/Assistant
112.00 220,361 16,85712,66031,150
1,624
Base 05.7200.035.174.0140.000 SS 05.7200.035.211.0140.000 Ret 05.7200.035.221.0140.000 Hosp 05.7200.035.231.0140.000 Dental 05.7200.035.234.0140.000
Expenses: 1,209,398
47,725 450
464 7,208
473,111 136,439
Labor/BenefitsContracted Services MarketingMobile Telephone Supplies and Materials FoodIndirect Cost
Total: 228.00 $1,874,795 EnterpriseRevenues:
1,697747,362
29,645439,504606,352
13,8933,274
33,068
State Reimbursement USDA Grant Breakfast Sales Lunch Sales Supplemental Sales Catered Meals/Snacks Suppers/Banquets Interest
Total: $1,874,795 Enterprise
1
1 The scatter service lunch model refers to providing food service lines in various locations on the school property while food is prepared in one central kitchen on the campus. The new high school prototype includes food service lines near the kitchen as well as additional food service/dining space on each of the other fl oors. Equipment for transporting and holding cooked foods and a freight elevator for trash disposal are examples of additional equipment that are required for this system.
226 www.wcpss.net
Growth - Student Membership
INITIATIVE: Exceptional Children Contract Transportation
Contract Transportation is provided for Special Needs children in Pre- Kindergarten, Grades K-12, and parent contracts. These contracts are defined by Individual Education Plans for these students.
Current Funding Formula:
Growth is determined by the Individual Education Plans of students managed by the Special Education Department. The current contract is being re-bid this fiscal year. This introduces an unknown factor at this time in the budget process as to the cost of this contract for next year. Final bids will not be opened until January 2009 after the budgeting process is complete.
The Exceptional Children’s contract transportation budget increased by five percent from 2006-07. Our projected increases will be based on this figure for the next three fiscal years.
Wake Commissioners reserved $3.0 million for a reserve for actual student count. They have set aside these dollars on the assumption that student membership will be 10% or 1,404 students less than projected. The $3.0 million is not included in the budget resolution for Wake County Schools for 2008-09 since it has not been released by Wake County. This case has been decreased by $100,000 as part of the $3.0 million reserve.
Implementation Timeline & Budget Needed:
2008-09 MOE Amount Code Contract Transportation for Pre-K, K-12 and Parent Contracts
227Growth - Student MembershipWake County Public School System - FY 2008-09 Plan for Student Success
Growth - Student Membership
INITIATIVE: Safety Assistants
This is a request for twenty additional safety assistants for Exceptional Children Transportation.
Current Funding Formula:
There is no formula for these positions since they are hired on an as-needed basis for Exceptional Children when the child’s Individual Education Plan (IEP) requires a safety assistant. These positions were moved to Transportation in 2006-07. The beginning number of positions was 103. By year end, an additional eight positions were requested, bringing our total positions to 111. During budgeting for 2007-2008, 12 positions were requested. As of November, 2007 all but one of these positions is filled. This is a growth rate of seven percent and eleven percent respectively. It is expected that additional positions will be needed during the current 2007-2008 school year.
Since there is no way to tie these positions to student growth, we will use last years request plus the addition of positions seen during last school year. We are requesting twenty additional positions for 2008-09 and each year thereafter.
Implementation Timeline & Budget Needed:
20 @ 12 months 10.52 x 7 hrs x 240 x 20 = $353,472
Base 02.6550.706.147.0136.0880 Overtime 02.6550.706.199.0136.0880 SS 02.6550.706.211.0136.0880 Ret 02.6550.706.221.0136.0880 Hosp 02.6550.706.231.0136.0880 Dent 02.6550.706.234.0136.0880
Base 02.6550.706.147.0136.0880 Overtime 02.6550.706.199.0136.0880 SS 02.6550.706.211.0136.0880 Ret 02.6550.706.221.0136.0880 Hosp 02.6550.706.231.0136.0880 Dent 02.6550.706.234.0136.0880
Base 02.6550.706.147.0136.0880 Overtime 02.6550.706.199.0136.0880 SS 02.6550.706.211.0136.0880 Ret 02.6550.706.221.0136.0880 Hosp 02.6550.706.231.0136.0880 Dent 02.6550.706.234.0136.0880
Total: 240.00 $ 529,737 Local
228 www.wcpss.net
Growth - Student Membership
INITIATIVE: School Buses
This request is for the purchase of thirty-six new school buses.
Current Funding Formula:
Ridership @ 53 percent 81 students per bus Estimated cost per bus $75,865
Transportation will request nine bus credits in 2007-08 from the Department of Public Instruction (DPI). Ten of the parked status buses are mini buses and are not feasible to use with our three-tier delivery system. These buses are being subtracted from the available bus inventory. To make sure that there are sufficient buses in place for 2009-10, seven new buses will be ordered in 2007-08 and then an additional thirty-six buses will be ordered in 2008-09. This is a combination of the twenty-one buses needed for 2008-09 and half the number needed for 2009-10. Additional loaner buses will be requested each year to complete the number of required buses.
Due to the state procurement timeframe for ordering capital outlay buses, orders created in July of a new fiscal year are not delivered until April of that same fiscal year. This is a nine to ten month lead time for delivery.
Wake Commissioners reserved $3.0 million for a reserve for actual student count. They have set aside these dollars on the assumption that student membership will come in 10% or 1,404 students less than projected. The $3.0 million is not included in the budget resolution for Wake County Schools for 2008-09 since it has not been released by Wake County. This case has been decreased by 10 buses, or $758,650 as part of the $3.0 million reserve.
Implementation Timeline & Budget Needed:
2008-09 MOE Amount Code Thirty-six new buses
Less Wake County reserve for actual student count
$ 2,731,140
(758,650)
04.6550.801.551.0225.0880
04.6550.801.551.0225.0880
Total: $ 1,972,490 Local
2009-10 MOE Amount Code Forty-six new school buses
Less: one-time cost from prior year
$ 3,489,790
(2,731,140)
04.6550.801.551.0225.0880
Total: ($ 758,650) Local
2010-11 MOE Amount Code Forty-six new school buses
Less: one-time cost from prior year
$ 3,489,790
(3,489,790)
04.6550.801.551.0225.0880
Total: $ 0 Local
229Growth - Student MembershipWake County Public School System - FY 2008-09 Plan for Student Success
Growth - Student Membership
Strategic Directive:
Safe and efficient delivery of students to school has a positive affect on learning and teaching.
As the population of Wake County Public Schools continues to grow, it is the goal of the Transportation Department to guarantee there are sufficient buses available to transport students to school in a timely manner.
230 www.wcpss.net
Growth - Student Membership
INITIATIVE: Service Trucks for Mechanics
This request is for two service trucks for bus garage mechanics.
Current Funding Formula:
North Carolina State Board Policy: “Service Trucks – These service vehicles are used by the garage mechanics to access the fleet for maintenance and service. The buses are typically staged at schools or other parking facilities mid-day and are available for routine inspections and minor servicing. A local board may add a service truck to the state replacement schedule if the ratio of buses operated per service truck inventory exceeds 25.”
Current service trucks = 32 Adding an additional two trucks will bring our ratio to 1:27 buses per service trucks.
# of buses # service trucks ratio2008-2009 930 34 1:27 2009-2010 984 36 1:27 2010-2011 1,039 38 1:27
Two trucks will be added per year for 2009-10 and 2010-11 to handle the growth in buses.
Implementation Timeline & Budget Needed:
2008-09 MOE Amount Code Two Service Trucks for Mechanics
Other vehicles, fuel truck, fork lift, and service trucks
$ 37,500
(200,762)
04.6550.801.551.0225.0980
Total: ($163,262) Local
2009-10 MOE Amount Code Two Service Trucks for Mechanics
Less: one time cost from previous year
$ 37,500
(37,500)
04.6550.801.551.0225.0980
Total: $ 0 Local
2010-11 MOE Amount Code Two Service Trucks for Mechanics
Less: one time cost from previous year
$ 37,500
(37,500)
04.6550.801.551.0225.0980
Total: $ 0 Local
Strategic Directive:
Service trucks are necessary to allow mechanics to respond to bus mechanical emergencies. Safe and timely delivery of students to school assists in learning and teaching.
231Growth - Student MembershipWake County Public School System - FY 2008-09 Plan for Student Success
Growth - Student Membership
INITIATIVE: Reproduction of required Student and Parent Materials
Current Funding Formula:
22 cents per student handbook; 66 cents per parent materials
Supplies: Printer color cartridge sets @ $1,000 per set; plus $500 for additional materials needed due to added growth.
Wake Commissioners reserved $3.0 million for a reserve for actual student count. They have set aside these dollars on the assumption that student membership will be 10% or 1,404 students less than projected. The $3.0 million is not included in the budget resolution for Wake County Schools for 2008-09 since it has not been released by Wake County. This case has been decreased by $309 as part of the $3.0 million reserve.
Implementation Timeline & Budget Needed:
2008-09 Amount Code Reproduction
StudentHandbooks6441 * .22 cents
Extra Student Handbooks- New Schools(250/school) * 3 750 * .22 cents
Parent Materials 1000 * .66 cents
Supplies
Less Wake County reserve for actual student count
$ 1,417
165
660
1,500
(309)
02.6300.801.314.0218.0905
02.6300.801.314.0218.0905
02.6300.801.314.0218.0905
02.6300.801.411.0218.0905
02.6300.801.314.0218.0905
Total: $ 3,433 Local
2009-10 Amount Code Reproduction
StudentHandbooks6596 * .22 cents
Extra Student Handbooks- New Schools(250/school) * 5 1250 * .22 cents
Parent Materials 1000 * .66 cents
Supplies
$ 1,451
275
660
1,500
02.6300.801.314.0218.0905
02.6300.801.314.0218.0905
02.6300.801.314.0218.0905
02.6300.801.411.0218.0905 Total: $ 3,886 Local
2010-11 Amount Code Reproduction
StudentHandbooks7205 * .22 cents
Extra Student Handbooks- New Schools(250/school) * 5 1250 * .22 cents
Parent Materials 1000 * .66 cents
Supplies
$ 1,585
275
660
1,500
02.6300.801.314.0218.0905
02.6300.801.314.0218.0905
02.6300.801.314.0218.0905
02.6300.801.411.0218.0905 Total: $ 4,020 Local
Strategic Directives:
Develop and implement systems and organizational structures to supportschools, ensure accountability, and engage the community.
232 www.wcpss.net
Growth - New Schools
INITIATIVE: 12-Month Position Allotments and 2-Month Teaming Allotments for Year-Round Middle Schools
Current Funding Formula:
12 months for 12 month positions at year-round middle schools 2 months for middle school teaming
Implementation Timeline & Budget Needed:
2008-09 MOE Amount Code Total: $ 0
2009-10 MOE Amount Code Total: $ 0
2010-11 MOE Amount Code Year-round Teacher
M9 – 14 MOE M10 – 14 MOE
28.00 $ 126,072 11,66110,53711,36312,460
650
Base 02.5110.001.121.0105.0000 Supp 02.5110.001.181.0105.0000 SS 02.5110.001.211.0105.0000 Ret 02.5110.001.221.0105.0000 Hosp 02.5110.001.231.0105.0000 Dent 02.5110.001.234.0105.0000
Total: 28.00 $ 172,743 Local
233Growth - New SchoolsWake County Public School System - FY 2008-09 Plan for Student Success
Growth - New Schools
INITIATIVE: Middle School Teaming
Current Funding Formula:
Fixed allotment: 10 MOE to middle schools
Implementation Timeline & Budget Needed:
2008-09 MOE Amount Code Total: $0
2009-10 MOE Amount Code Total: $0
2010-11 MOE Amount Code Middle School Teaming
20.00 $ 61,220 4,6835,0518,900
Base 01.5110.001.121.0154.0000 SS 01.5110.001.211.0154.0000 Ret 01.5110.001.221.0154.0000 Hosp 01.5110.001.231.0154.0000
20.00 $ 79,854 State $ 8,112
621669464
Supp 02.5110.001.181.0154.0000 SS 02.5110.001.211.0154.0000 Ret 02.5110.001.221.0154.0000 Dent 02.5110.001.234.0154.0000
$ 9,866 Local Total: 20.00 $89,720
234 www.wcpss.net
Growth - New Schools
INITIATIVE: Principals
Current Funding Formula:
Each school with 100 or more pupils in final Average Daily Membership (ADM) and/or seven or more full-time equivalent state allotted/paid teachers, unrounded, (based on prior year sixth pay period) is entitled to twelve months of employment for a principal. Year-round schools, multi-track organizational patterns, and other sub-urbanization patterns developed within the existing framework of an established campus are not automatically entitled to additional months of employment.
Implementation Timeline & Budget Needed:
2008-09 MOE Amount Code Principals – Laurel Park ES, Mills Park ES, Sycamore Creek ES
235Growth - New SchoolsWake County Public School System - FY 2008-09 Plan for Student Success
Growth - New Schools
INITIATIVE: Scheduling Assistance - Athletic Director (AD) and Trainer
Current Funding Formula:
Fixed allotment of 21 Months of Employment (MOE) to each high school. 10 MOE AD, 10 MOE Scheduler, 1 MOE Trainer.
Implementation Timeline & Budget Needed:
2008-09 MOE Amount Code Total: $ 0
2009-10 MOE Amount Code Total: $ 0
2010-11 MOE Amount Code Athletic Director & Trainer
21.00 $64,281 4,9175,3039,345
Base 01.5110.001.121.0154.0000 SS 01.5110.001.211.0154.0000 Ret 01.5110.001.221.0154.0000 Hosp 01.5110.001.231.0154.0000
$83,846 State $ 8,517
652703487
Supp 02.5110.001.181.0154.0000 SS 02.5110.001.211.0154.0000 Ret 02.5110.001.221.0154.0000 Dent 02.5110.001.234.0154.0000
$10,359 Local Total: 21.00 $94,205
236 www.wcpss.net
Growth - New Schools
INITIATIVE: Travel for New Elementary, Middle, and High Schools
Current Funding Formula:
Round trip mileage to Crossroads X 72 (36 weeks X 2) X .505 (mileage reimbursement rate) + 1,000 (200 days X 5 miles) X .505 (mileage reimbursement rate).
Implementation Timeline & Budget Needed:
2008-09 Mileage Amount Code January 1, 2008 rate Increase from .485 to .505 Laurel Park ES Mills Park ES Sycamore Creek ES
141123
$8,193
1,014905
1,341
02.5400.061.332.0109.0000
Total: $11,453 Local
2009-10 Mileage Amount Code Banks Road ES E27 Southern Wake ES E31 Southern Wake ES E30 Alston Ridge ESE34 Wendell Falls ES
2425
25
25
48
$1,3781,414
1,414
1,414
2,250
02.5400.061.332.0109.0000
Total: $7,870 Local
2010-11 Mileage Amount Code E21 Eastern Wake Area ES E25 NE Wake Area ESM9 Holly Springs Area MS M10 Mills Park Area MS H2 Heritage HS
36
25
20
11
44
$1,814
1,414
1,232
905
2,105
02.5400.061.332.0109.0000
Total: $7,470 Local
237Growth - New SchoolsWake County Public School System - FY 2008-09 Plan for Student Success
Growth - New Schools
INITIATIVE: Areas
To increase the number of areas in the district from six to seven in 2008-09 and from seven to eight in 2009-10 in order to accommodate growth and address action step G.8.3 from the Curriculum Management Audit. The number of areas was last increased in 2003. At that time there were 131 schools and 108,970 students in the district compared to 153 schools and 134,002 students in 2007. The projection for 2008-09 is 156 schools and over 140,000 students. Five additional schools are scheduled to open in 2009-10 and five more in 2010-11.
Current Funding Formula:
There is not a current funding formula although G.8.3 from the Curriculum Management Audit suggests one area superintendent per twelve schools and states “Adopt a policy that establishes guidelines (including a formula or ratio) regarding the maximum span of control parameters for area superintendents, as addressed in Finding 1.3 and Exhibit 1.3.5. If a maximum span of control of twelve is not financially feasible, the board should establish and communicate a position that approximates that ratio as closely as possible, support it financially, and direct the Superintendent to apply it consistently.”
Implementation Timeline & Budget Needed:
Non-Personnel cost includes area superintendent support budget of $998.45 per school based on one area superintendent per twenty-two schools for 2008-09 and one area superintendent per twenty schools for 2009-10. Initial office set-up includes, office space, equipment, furniture and supplies required to support the additional positions. The total amounts requested for 2008-09 and 2009-10 would become a recurring expense going forward.
Curriculum Management Audit:
Recommendation 8: G.8.3 Maximum span of control for area superintendents. A.8.4 Address the span of control for area superintendents.
2008-09 MOE Amount Code Area Superintendent
Special Assistant
Secretary (Area Superintendent)
12.00
12.00
12.00
$ 117,000 8,9519,5714,200
232
41,192406
3,1823,4034,200
232
34,0892,6082,7884,200
232
Base 02.6940.002.118.0384.0906 SS 02.6940.002.211.0384.0906 Ret 02.6940.002.221.0384.0906 Hosp 02.6940.002.231.0384.0906 Dent 02.6940.002.234.0384.0906
Base 02.6110.801.131.0384.0806 Supp 02.6110.801.181.0384.0806 SS 02.6110.801.211.0384.0806 Ret 02.6110.801.221.0384.0806 Hosp 02.6110.801.231.0384.0806 Dent 02.6110.801.234.0384.0806
Base 02.6940.801.151.0384.0906 SS 02.6940.801.211.0384.0906 Ret 02.6940.801.221.0384.0906Hosp 02.6940.801.231.0384.0906 Dent 02.6940.801.234.0384.0906
Initial Office set-up (3) (Recurring for one year)
$ 17,297 02.6940.801.411.0384.0906
Total: 36.00 $ 253,783 Local
2009-10 MOE Amount Code Area Superintendent
Special Assistant
Secretary (Area Superintendent)
12.00
12.00
12.00
$ 117,000 8,9519,6524,350
232
41,192406
3,1823,4324,350
232
34,0892,6082,8124,350
232
Base 02.6940.002.118.0385.0906 SS 02.6940.002.211.0385.0906 Ret 02.6940.002.221.0385.0906 Hosp 02.6940.002.231.0385.0906 Dent 02.6940.002.234.0385.0906
Base 02.6110.801.131.0385.0906 Supp 02.6110.801.181.0385.0906 SS 02.6110.801.211.0385.0906 Ret 02.6110.801.221.0385.0906 Hosp 02.6110.801.231.0385.0906 Dent 02.6110.801.234.0385.0906
Base 02.6940.801.151.0385.0906 SS 02.6940.801.211.0385.0906 Ret 02.6940.801.221.0385.0906Hosp 02.6940.801.231.0385.0906 Dent 02.6940.801.234.0385.0906
Total: 36.00 237,070 Local
2010-11 MOE Amount Code Less: one-time cost from previous year
($17,297) 02.6940.801.411.0384.0906
Total: ($17,297) Local
238 www.wcpss.net
Growth - New Schools
INITIATIVE: Early Hires, Task Management, and Staff Development Dollars for New Schools
Current Funding Formula:
During the spring prior to a new school opening, the following resources are allotted as start up months and dollars. These dollars carry over until September 30th of each year. Staff development funds carry over for three years.
Elementary Middle High1 5 months principal
5 months clerical Task Assignment $59,714Staff Development $30,000
6 months principal 6 months clerical Task Assignment $75,980 (Traditional) $79,105 (YR) Staff Development $30,000
6 months principal 6 months clerical Task Assignment $80,666Staff Development $30,000
2 Task Assignment $3,125
Task Assignment $7,031 (Traditional) $10,938 (YR)
Task Assignment $11,719
3 Task Assignment $3,125
Task Assignment $3,125 (Traditional) $10,938 (YR)
Task Assignment $11,719
Implementation Timeline & Budget Needed:
2008-09 MOE Amount Code E23 Banks Road ES (YR) E27 Southern Wake ES (YR) E30 Alston Ridge Area ES (YR) E31 Southern Wake ES (YR) E34 Wendell Falls ES (YR)
20.00 $146,360 State E23 Banks Road ES (YR) E27 Southern Wake ES (YR) E30 Alston Ridge Area ES (YR) E31 Southern Wake ES (YR) E34 Wendell Falls ES (YR)
Less: one-time costs from previous year ($217,787)
30.00 $433,796 Local Total: 50.00 $580,156
239Growth - New SchoolsWake County Public School System - FY 2008-09 Plan for Student Success
Growth - New Schools
2009-10 MOE Amount Code E21 Eastern Wake Area ES (YR) E25 NE Wake Area ES (YR) M9 Holly Springs Area MS (YR) M10 Mills Park Area MS (YR) H2 Heritage HS
$393,225 Less: one-time costs from previous year ($769,728)
16.00 ($376,503) Local Total: 24.00 ($310,095)
240 www.wcpss.net
Growth - New Schools
INITIATIVE: Eastern Area Schools
To increase the budget managed by the Eastern Area Superintendent in an effort to accommodate anticipated growth with the opening of new schools.
Current Funding Formula:
An average amount of $998.45 per school is used to project the additional dollars required to support the district growth of new schools scheduled to open.
Implementation Timeline & Budget Needed:
In applying the funding formula, the average amount of $998.45 is multiplied by the number of schools projected to open in 2008-09, 2009-10, and 2010-11. The projected increases were included in the appropriate budget codes
241Growth - New SchoolsWake County Public School System - FY 2008-09 Plan for Student Success
Growth - New Schools
INITIATIVE: South Central Area Schools
To increase the budget managed by the area superintendent overseeing South Central Wake schools to accommodate 26 schools, instead of 25 schools, for the next three years.
Current Funding Formula:
The current funding formula was based on analysis of the south central area account codes for 25 schools. In an effort to cover the addition of one school in 2008-09 (Laurel Park Elementary), an increase in funding is needed. The current allocations for supplies/materials, travel, reproduction, workshops, etc. do not take into account additional expenses for the additional school.
Implementation Timeline & Budget Needed:
The additional budget increase will cover expenses for the opening/addition of Laurel Park Elementary. These include: materials and supplies for area meetings, principals’ staff development activities, School Improvement Plan meetings, area assistant principals’ meetings, Professional Learning Community and Facilitative Leadership activities, professional leadership training materials, and travel.
The Budget Projection Chart reflects the requested budget increases for each account code. These are strictly based on growth and allows operations and continuous support at a comparable level.
2008-09 MOE Amount Code Dollars for Laurel Park Elementary School
Supplies 02.6110.801.411.0383.0806 Total: $ 998 Local
2009-10 MOE Amount Code Total: $ 0
2010-11 MOE Amount Code Total: $ 0
242 www.wcpss.net
Growth - New Schools
INITIATIVE: Southern Area Schools
To increase the budget managed by the Southern Area Superintendent in an effort to accommodate anticipated growth with the opening of new schools.
Current Funding Formula:
An average amount of $998.45 per school is used in the calculations and budget planning process to project the additional dollars needed to support the district growth of new schools scheduled to open. In applying the funding formula, the average amount of $998.45 was multiplied by the number of schools projected to open in 2008-09, 2009-10, 2010-11, and the projected increases were included in the appropriate budget codes.
Implementation Timeline & Budget Needed:
The number of new schools to open in the Southern Area for each respective year will be multiplied by $998.45 to arrive at the additional funding amount to be budgeted to the accounts listed.
243Growth - New SchoolsWake County Public School System - FY 2008-09 Plan for Student Success
Growth - New Schools
INITIATIVE: Western Area Schools
This case is presented to increase the budget managed by the Western Area Superintendent in an effort to accommodate growth with the opening of new schools. The current budget was assessed to project the additional dollars needed to support the opening of new schools in the Western Area. The request for increased funding to support the Western Area schools is in support of the Strategic Directives: Learning and Teaching, Retain, Recruit and Train, Systems and Structures, and Fiscal Accountability.
Current Funding Formula:
The current budget was assessed to project the additional dollars needed to support the district growth of three new elementary schools scheduled to open in the Western Area. The average of $998.45 was calculated for each school.
Implementation Timeline & Budget Needed:
The additional dollars requested for 2008-09 totals $998.45 and accommodates the addition of Mills Park YR Elementary School. E30, Amberly Park YR Elementary on Alston Road, will be added to the Western Area in 2009-10. Additional dollars are requested for 2010-11 to accommodate the addition of Mills Park YR Middle School.
The Budget Projection Chart reflects the requested increased budget amounts for each account code in each year. The budget increases are necessary to support the continuation of activities to support schools and principals in alignment with the Superintendent’s Strategic Directives.
Athletic funds are allotted to pay for athletic costs such as catastrophic insurance for athletics, security, athletic equipment, and officials. Each middle school will receive $2,620 and each high school will receive $945.
Implementation Timeline & Budget Needed:
2008-09 MOE Amount Code East Cary MS Wendell MS (recurring)
INITIATIVE: Evaluation and Research (E&R) - Printing, Staff Development, Local Travel, and Supplies
Evaluation and Research provides technical assistance, consultation, and training to schools thus incurring expenditures for printing, staff development, local travel, and supplies.
Current Funding Formula:
This request is based on the increased number of schools in 2008-09 (three schools) at the same expense amounts. During 2006-07, E&R required $967 per school for printing, staff development, local travel, and supplies in the 0970 cost center. E&R will require an increase of $2,901 to provide growth for three new schools in 2008-09, $4,835 for five new schools in 2009-10, and $4,835 for five new schools in 2010-11.
247Growth - New SchoolsWake County Public School System - FY 2008-09 Plan for Student Success
Growth - New Schools
INITIATIVE: Extended Employment for School Counselors
Current Funding Formula:
Extended employment days are used by middle and high school counselors in June, July, and August when the school counselor is not on contract. Record preparations, as well as student schedule entry, orientation for new students, and transcript development are duties that require attention prior to the beginning of school and at the end of each school year. The budget allocated for extended employment has not increased since 2004-05. Days of employment have been reduced each year as new schools have been added.
High Schools – 22 Days Middle Schools – 11 Days
Implementation Timeline & Budget Needed:
Extended employment is used in June, July, and August by existing middle and schools. Heritage High will open in 2010-11.
2008-09 MOE Amount Code ExtendedEmployment Days to return schools to formula
$ 47,200 3,6113,861
Base 02.5830.801.126.0146.0820 SS 02.5830.801.211.0146.0820 Ret 02.5830.801.221.0146.0820
Total: $ 54,672 Local
2009-10 MOE Amount Code ExtendedEmployment days to maintain formula
$ 9,192 703758
Base 02.5830.801.126.0146.0820 SS 02.5830.801.211.0146.0820 Ret 02.5830.801.221.0146.0820
Total: $ 10,653 Local
2010-11 MOE Amount Code ExtendedEmployment days to maintain formula and add new high school
$ 13,792 1,0551,138
Base 02.5830.801.126.0146.0820 SS 02.5830.801.211.0146.0820 Ret 02.5830.801.221.0146.0820
Total: $ 15,985 Local
248 www.wcpss.net
Growth - New Schools
INITIATIVE: Field Marking Paint
Increase athletics budget for field marking paint for new middle and high schools.
Current Funding Formula:
$600 per middle school and $1,600 per high school for field marking paint.
Implementation Timeline & Budget Needed:
2008-09 MOE Amount Code East Cary MS Wendell MS(recurring)
Each large high school is allotted a ten month position for a High School Intervention Coordinator. Small learning community high schools and alternative schools receive one five month position each.
Implementation Timeline & Budget Needed:
2008-09 MOE Amount Code Total: $ 0
2009-10 MOE Amount Code Total: $ 0
2010-11 MOE Amount Code Intervention Coordinator-Heritage High
251Growth - New SchoolsWake County Public School System - FY 2008-09 Plan for Student Success
Growth - New Schools
INITIATIVE: In-School Suspension (ISS) Teachers
Current Funding Formula:
12 Months of Employment (MOE) for each Year-Round Middle School (East Cary will open with sixth grade only; therefore, six month allotment the first year).
10 MOE for each Traditional Middle School.
Implementation Timeline & Budget Needed:
2008-09 MOE Amount Code Total: $ 0
2009-10 MOE Amount Code Total: $ 0
2010-11 MOE Amount Code State(2 new middle schools)
24.00 $ 87,504 6,6947,2198,900
Base 01.5310.069.121.0147.0000 SS 01.5310.069.211.0147.0000 Ret 01.5310.069.221.0147.0000 Hosp 01.5310.069.231.0147.0000
24.00 $ 110,317 State $ 11,592
887956464
Supp 02.5310.069.181.0147.0000 SS 02.5310.069.211.0147.0000 Ret 02.5310.069.221.0147.0000 Dental 02.5310.069.234.0147.0000
$ 13,899 Local Total: 24.00 $ 124,216
252 www.wcpss.net
Growth - New Schools
INITIATIVE: Instrument Repair
Current Funding Formula:
The instrument repair budget is designed to pay for the repair of school owned band instruments. Each middle school and high school will receive $1,000.
Implementation Timeline & Budget Needed:
2008-09 Amount Code No middle or high schools scheduled to open
Total: $ 0
2009-10 Amount Code No middle or high schools scheduled to open
Total: $ 0
2010-11 Amount Code Holly Springs Area MS Mills Park Area MS Heritage HS
$1,0001,0001,000
02.5110.061.311.0215.0000
Total: $3,000 Local
253Growth - New SchoolsWake County Public School System - FY 2008-09 Plan for Student Success
Growth - New Schools
INITIATIVE: Local Literacy Teachers
Local Literacy Teachers to support K-2 intervention and coaching.
Current Funding Formula:
Six Months of Employment (MOE) for a Local Literacy Teaching position per year-round elementary school and five MOE for each traditional calendar elementary school.
Implementation Timeline & Budget Needed:
2008-09 MOE Amount Code Additional MOE: 3 New Elementary Schools
18.00 $ 58,404 7,7395,0605,4106,300
348
Base 02.5330.001.121.0293.0000 Supp 02.5330.001.181.0293.0000 SS 02.5330.001.211.0293.0000 Ret 02.5330.001.221.0293.0000 Hosp 02.5330.001.231.0293.0000 Dent 02.5330.001.234.0293.0000
Total: 18.00 $ 83,261 Local
2009-10 MOE Amount Code Additional MOE: 5 New Elementary Schools
30.00 $ 103,180 13,672
8,9399,640
10,875580
Base 02.5330.001.121.0293.0000 Supp 02.5330.001.181.0293.0000 SS 02.5330.001.211.0293.0000 Ret 02.5330.001.221.0293.0000 Hosp 02.5330.001.231.0293.0000Dent 02.5330.001.234.0293.0000
Total: 30.00 $ 146,886 Local
2010-11 MOE Amount Code Additional MOE: 2 New Elementary Schools
12.00 $ 43,748 5,7973,7904,0874,450
232
Base 02.5330.001.121.0293.0000 Supp 02.5330.001.181.0293.0000 SS 02.5330.001.211.0293.0000 Ret 02.5330.001.221.0293.0000 Hosp 02.5330.001.231.0293.0000 Dent 02.5330.001.234.0293.0000
Total: 12.00 $ 62,104 Local
254 www.wcpss.net
Growth - New Schools
INITIATIVE: Minimum Competency Teachers
Current Funding Formula:
Allotments are linked to the multiple risk factor rankings with base positions distributed accordingly.
Implementation Timeline & Budget Needed:
2008-09 MOE Amount Code Total: $ 0
2009-10 MOE Amount Code Total: $ 0
2010-11 MOE Amount Code Heritage High School
20.00 $ 64,890 4,9645,3538,900
Base 01.5330.069.121.0192.0000 SS 01.5330.069.211.0192.0000 Ret 01.5330.069.221.0192.0000 Hosp 01.5330.069.231.0192.0000
20.00 $ 84,107 State 8,590
657709464
Supp 02.5330.069.181.0192.0000 SS 02.5330.069.211.0192.0000 Ret 02.5330.069.221.0192.0000 Dental 02.5330.069.234.0192.0000
$ 10,420 LocalTotal 20.00 $ 94,527
255Growth - New SchoolsWake County Public School System - FY 2008-09 Plan for Student Success
Growth - New Schools
INITIATIVE: NovaNet Teachers
Current Funding Formula:
10 Months of Employment (MOE) for each high school.
Implementation Timeline & Budget Needed:
2008-09 MOE Amount Code No new schools
Total: $ 0
2009-10 MOE Amount Code No new schools
Total: $ 0
2010-11 MOE Amount Code Heritage High School
10.00 $ 32,445 2,4822,6764,450
Base 01.5310.069.121.0175.0000 SS 01.5310.069.211.0175.0000 Ret 01.5310.069.221.0175.0000 Hosp 01.5310.069.231.0175.0000
10.00 $ 42,053 State $ 4,295
329354232
Supp 02.5310.069.181.0175.0000 SS 02.5310.069.211.0175.0000 Ret 02.5310.069.221.0175.0000 Dental 02.5310.069.234.0175.0000
$ 5,210 LocalTotal: 10.00 $ 47,263
256 www.wcpss.net
Growth - New Schools
INITIATIVE: Online Media Resources
Current Funding Formula:
Online resources and library automation support to empower students to become self-directed learners.
Senior Budget Analyst: One Senior Budget Analyst for Conversions and Allotments. One Senior Budget Analyst for Grants and Self-Supporting Programs. The heavy workload associated with each of these areas is seasonal and does not overlap.
We are requesting this position so that the processing time for transactions can be reduced and the efficiency of the department can be increased. Transactions that typically have a two-day turnaround time currently have a six-day turnaround time due to increased volume and fiscal accountability procedures.
Adding a new position will also provide stability to the system in that we will have two individuals processing conversions, allotments; enterprise funds, and grant transactions for the entire Wake County Public School System, whereas now we have one in each role.
We are using some of the funds from the temporary hourly position that we are removing from the budget in 2008-09 towards this position. Most of the dollars were used to offset the clerical position we are requesting.
Half-Time Secretary: Currently there is no secretarial position in the Budget Department.
Over the past three years, student population has increased an average of six percent and the number of schools has increased from 132 schools to 154 schools. The considerable growth of this district has increased the clerical activities within the budget department. These duties would only require a part-time employee.
The responsibilities this position would assume include:
Payroll Daily verification of budget entries Ordering Supplies Reconciliation of Budget’s budget Preparing Board and Quarterly Review Packets Preparing meeting materials Updating codes into Oracle Filing and setting up files Preparing correspondence Work orders Retrieving and sorting the mail
We are requesting this position so that the processing time for transactions can be reduced and the efficiency of the department can be increased. Transactions typically have a two-day turnaround time currently have a six-day turnaround time due to increased volume and fiscal accountability procedures.
We are using the dollars for the temporary hourly position that we are removing from the budget in 2008-09 and allocating the dollars towards this clerical position.
261Growth - New SchoolsWake County Public School System - FY 2008-09 Plan for Student Success
Less:One-time cost from previous years for furniture and equipment
12.00 $43,586 3,3343,5654,200
2321,160
1,10075
275
(3,752)(287)
(2,182)
Base 02.6610.801.153.0139.0965 SS 02.6610.801.211.0139.0965 Ret 02.6610.801.221.0139.0965 Hosp 02.6610.801.231.0139.0965 Dent 02.6610.801.234.0139.0965 Equip 02.6610.801.411.0139.0965
INITIATIVE: Extra Duty Budget to Accomodate New Schools
Current Funding Formula:
Extra Duty positions are allocated to the new schools using an established method approved by the Board of Education.
Implementation Timeline & Budget Needed:
Implement extra duty positions at three additional elementary schools in 2008-09, at five additional elementary schools in 2009-10 and at two additional elementary, two additional middle schools and at one additional high school in 2010-11. Budget based upon current salary schedule for extra duty compensation---$7,800 per elementary school, $33,280 per middle school and $101,920 per high school.
2008-09 MOE Amount Code Extra Duty $ 23,400
1,7901,914
Base 02.5500.853.192.0241.0000 SS 02.5500.853.211.0241.0000 Ret 02.5500.853.221.0241.0000
Total: $ 27,104 Local
2009-10 MOE Amount Code Extra Duty $ 39,000
2,9843,218
Base 02.5500.853.192.0241.0000 SS 02.5500.853.211.0241.0000 Ret 02.5500.853.221.0241.0000
Total: $ 45,202 Local
2010-11 MOE Amount Code Extra Duty $ 184,080
14,08215,186
Base 02.5500.853.192.0241.0000 SS 02.5500.853.211.0241.0000 Ret 02.5500.853.221.0241.0000
Total: $ 213,348 Local
263Growth - New SchoolsWake County Public School System - FY 2008-09 Plan for Student Success
Growth - New Schools
INITIATIVE: Occupational Safety and Health Administration (OSHA) Nurse
To increase the number of hours for the OSHA Nurse in order to conduct additional school audits, employee education, vaccinations, student blood borne, and First Aid Response training.
INITIATIVE: Processing Technician for Risk Management Department
Current Funding Formula:
Currently there is one secretary position which is funded 50 percent by Accounting Department and 50 percent by the Risk Management Department. The growth in the school district has created a need for the 50 percent Risk Management Secretary to change to a 100 percent Processing Technician. This will enable the Director to expand his field activity conducting risk assessment and risk control techniques by visiting various schools and departments in the implementation of a proactive and comprehensive risk, insurance, and safety management program.
Implementation Timeline & Budget Needed:
Workers’ Compensation is the financial responsibility of Risk Management. Our Human Resource-Employee Relations is responsible for day-to-day administration of claims activity. With safety-health-environmental efforts being decentralized, a more concerted effort is necessary in promoting effective communication, coordination, and cooperation a of comprehensive safety program among the varied departments and schools.
Over the past three-years, the student population has increased an average of 6 percent, workers’ compensation claims frequency increased over 28 percent with months of employment increasing 17 percent, and the number locations increased from 141 to 153. The Risk Management Department needs the assistance that a full-time processing technician can provide. Some of the additional activities this position would assume are as follows:
1. Receipt, setup, process, and follow-up on all vehicle accidents; conduct informal investigation or submitg to Safety Administrator or Director when a more formal investigation is necessary.
2. Receipt, review, and process all Student/Visitor Accident Reports. Over the past 3 years an average of 8,900 Student/Visitors Accident Reports were submitted. With an average of 116 being submitted to insurer for claim setup.
3. Process Request for Direct Payments and Blanket Purchase Orders with no direction for Director's signature.
4. Monitor Risk Management funds available; advising Director prior to accounts having negative balances.
5. Assist Director in preparation of PRECIS requesting the Wake County Board of Education’s (WCBOE) approval.
6. Serve as Workers’ Compensation Contact person for 3600 Wake
7. Serve as permanent secretary to the Wake County Public School (WCPSS) Safety Committee.
8. Proof and distribute certificate of insurance to proper departments when received in Risk Management.
9. Proof Principals’ Monthly Fire Drill and Inspection Reports; (estimate 3,600 annually) sending Safety Officer any with hazardous exposures identified on the report.
10. Maintain up-to-date schedule of insured assets and claims activity files.a. $2.3 Billion Real and Personal Property (158 locations) and
670+ mobile/modular units; with additions and deletion throughout the school year.
b. 545 Service, Utility Vehicles, & Activity Buses; with additions and deletions throughout the school year.
c. 91 Drivers’ Education Vehicles, with only a few changes throughout the school year.
d. Drivers consisting of 501 in School, 365 in Non-school, and 80 Drivers’ Education Instructors with updates on a quarterly basis.
e. $1.9 Million Musical Instruments blanket coverage maintaining a schedule of instruments with value exceeding $2,500.
2008-09 MOE Amount Code Processing Technician for Risk Management
Delete 6 MOE of Risk Management Secretary Position
12.00
(6.00)
$ 31,724 2,4272,5954,200
2321,094
(15,401) (1,178)(1,260)(2,100)
(116)
Base 02.6610.801.151.0258.0965 SS 02.6610.801.211.0258.0965 Ret 02.6610.801.221.0258.0965 Hosp 02.6610.801.231.0258.0965 Dent 02.6610.801.234.0258.0965 Computer 02.6610.801.411.0258.0965
Base 02.6610.801.151.0107.0965 SS 02.6610.801.211.0107.0965 Ret 02.6610.801.221.0107.0965 Hosp 02.6610.801.231.0107.0965 Dent 02.6610.801.234.0107.0965
Total: 6.00 $ 22,217 Local
2009-10 MOE Amount Code Less: one-time costs from previous year
($ 1,094) Computer 02.6610.801.411.0258.0965
Total: ($ 1,094) Local
2010-11 MOE Amount Code Total: $ 0
265Growth - New SchoolsWake County Public School System - FY 2008-09 Plan for Student Success
Growth - New Schools
INITIATIVE: Contract Instructional Support Technicians (ISTs) for High SchoolsCurrent Funding Formula:
Prior to 2005, one contract Instructional Support Technician was assigned to each high school. That number was reduced to the current ratio of one contract IST for every two high schools (1:2). With the advent of Ninth Grade Centers, which are physically separate buildings and have unique server environments, each of those entities should be considered a “high school” for the purposes of this formula. A contract IST works a 40-hour week over a 50-week year. The rate is estimated at $33/hour in the first year with a $1/hour increase budgeted in each subsequent year. Currently, there are nine contract ISTs.
Implementation Timeline & Budget Needed:
Ninth Grade Centers exist or will exist at Wakefield, Wake Forest-Rolesville, and Apex, which increases the number of “high schools” by three for this formula. East Wake High School has become four distinct high schools, which also increases the number of high schools by three for this formula. The result is a total increase of 6 high schools – although Apex ninth grade center does not come online in 2008-09. However, Longview and Phillips also serve high school students but their population is small and they were not previously included in the total number of high schools for which contract ISTs were allocated. So it is reasonable to base calculations on six additional support locations.
Using the 1:2 ratio, three (3) new contract ISTs are required to support these six (6) additional entities. Contract IST assignments:
2010-11 MOE Amount Code Increase in rate for 3 contract ISTs
$ 6,000 02.6400.801.311.0231.0810
Total: $ 6,000 Local
*Note: “Warehouse” assignment indicates IST will assist with processing of equipment record and disposition (ERD) equipment.
Strategic Directive:
Developing and implementing systems and structures to support schools and ensure accountability, and engage the community. Support learning and teaching.
266 www.wcpss.net
Growth - New Schools
INITIATIVE: Data Circuits for New Schools
Current Funding Formula:
Elementary Schools: 10 meg circuits at $413/school/month, which is $4,956/elementary school/year
Middle Schools: 25 meg circuits at $756/school/month, which is $9,072/middle school/year
High Schools: 25 meg circuits at $756/school/month, which is $9,072/high school/year
Implementation Timeline & Budget Needed:
Service begins as schools come on line. 2008-09: 3 new elementary schools 2009-10: 5 new elementary schools 2010-11: 2 new elementary schools, 2 new middle schools, 1 new high school
267Growth - New SchoolsWake County Public School System - FY 2008-09 Plan for Student Success
Growth - New Schools
INITIATIVE: Instructional Support Technician (IST)
Current Funding Formula:
Beginning in 2002, the ratio of schools to Instructional Support Technicians (ISTs) was established as 5:1. The number of schools has grown dramatically over the last several years with no increase in the number of ISTs. A redeployment strategy adopted last year enabled continued effective service, but the needs for school support have also increased dramatically as schools adopt and integrate technology as an essential tool for teaching and learning.
Implementation Timeline & Budget Needed:
The addition of four (4) ISTs in 2008-09 would bring the ratio closer to the target of five schools per IST.
2008-09 MOE Amount Code 2 Instructional Support Technicians
Developing and implementing systems and structures to support school, ensure accountability, and engage the community. Support learning and teaching.
268 www.wcpss.net
Growth - New Schools
INITIATIVE: Voice Circuits for New Schools
Current Funding Formula:
Elementary Schools: 30 lines at $16/month = $480/school/month which is $5,760/elementary school/year
Middle Schools: 50 lines at $16/month = $800/school/month which is $9,600/middle school/year
High Schools: 75 lines at $16/month = $1200/school/month which is $14,400/high school/year
Implementation Timeline & Budget Needed:
Service begins as schools come on line. 2008-09: 3 new elementary schools 2009-10: 5 new elementary schools 2010-11: 2 new elementary schools, 2 new middle schools, 1 new high school
Projected Expenditures for 2007-08 by applying 10% increase to 2006-07
expenditures
Increase over
Previous Year
2007-08 $5,046,082 10%
Projected expenditures for 2008-09 through 2010-11 by applying ten percent increase annually.
2008-09 Projected
Expenditures Amount Code Sick Leave Sub Pay
$5,550,690 $468,749 35,859
Base 02.5110.003.162.0276.0000 SS 02.5110.003.211.0276.0000
Total: $504,608 Local
2009-10 Projected
Expenditures Amount Code Sick Leave Sub Pay
$6,109,759 $515,624 39,445
Base 02.5110.003.162.0276.0000 SS 02.5110.003.211.0276.0000
Total: $555,069 Local
270 www.wcpss.net
Growth - Employ ee Count
INITIATIVE: New Teacher Orientation
Current Funding Formula:
All newly certified teachers (local and state) who have never taught before or taught less than six months, are eligible for up to three extra days of employment for orientation and classroom preparation. This includes lateral entry teachers that are newly certified and have never taught before. If the teacher does not have zero years on his or her license due to non-teaching experience being credited, then the Salary Administration Section must approve the new teacher orientation funding. The teacher is to be paid appropriately for the teacher’s certification level and years of service.
Eligible Teachers must be paid from pay code object 125 for the additional days of employment. The state will pay up to three days of training per eligible teacher based on the teacher’s daily rate of pay. The School Allotments Section will allot funds beginning in March based on the number of eligible teachers paid, not to exceed three days per teacher. Once the number of participants and additional days of service are identified, your regular classroom teacher position allotment will be increased. The three additional new teacher orientation days must be completed by April 30th. Any new teachers hired after this date should go through orientation with the new teachers for the next fiscal year.
Historical data on cost: 2006-07 $115,902 plus matching benefits 2005-06 $122,924 plus matching benefits 2004-05 $109,698 plus matching benefits 2003-04 $ 81,479 plus matching benefits
Current data on cost: Estimated expenditures for 2007-08 based on rate so far this year: $126,880 plus matching benefits
Increase for 2008-09, 2009-10, and 2010-11 are based on an estimated increase of 4.8 percent over 2007-08 estimated cost.
Implementation Timeline & Budget Needed:
2008-09 Amount Code New Teacher Orientation (Est. increase of 4.8%)
$ 6,090 466498
Base 01.5110.001.125.0154.0000 SS 01.5110.001.211.0154.0000 Ret 01.5110.001.221.0154.0000
Total: $7,054 State
2009-10 Amount Code New Teacher Orientation (Est. increase of 4.8%)
$ 6,383 488526
Base 01.5110.001.125.0154.0000 SS 01.5110.001.211.0154.0000 Ret 01.5110.001.221.0154.0000
Total: $7,397 State
2010-11 Amount Code New Teacher Orientation (Est. increase of 4.8%)
$ 6,689 512552
Base 01.5110.001.125.0154.0000 SS 01.5110.001.211.0154.0000 Ret 01.5110.001.221.0154.0000
Total: $7,753 State
271Growth - Employee CountWake County Public School System - FY 2008-09 Plan for Student Success
Growth - Employ ee Count
INITIATIVE: Non-Contributory Employee Benefi ts
Current Funding Formula:
Funds are budgeted centrally based on historical experience.
Implementation Timeline & Budget Needed:
To project increases for longevity pay, bonus leave payoff, short term disability payment, annual leave payoff, and mentor pay stipend.
INITIATIVE: Staff Development for Elementary, Middle, and High Schools
Current Funding Formula:
The distribution of staff development funds to each school is based on the total months of employment of all positions at each school. The allocation in 2007-08 is $4.27 per month of employment (this equates to $42.70 per 10-month position and $51.24 per 12-month position). The average yearly increase in total months of employment is six percent.
Implementation Timeline & Budget Needed:
2008-09 MOE Amount Code Laurel Park ES Mills Park ES Sycamore Creek ES
Based on 9,310.00 months of employment
$39,754 01.5110.028.312.0217.0000
Total: $39,754 State
2009-10 MOE Amount Code Banks Road ES E27 Southern Wake ES E31 Southern Wake ES E30 Alston Ridge ES E34 Wendell Falls ES
Based on 9,868.00 months of employment
$42,136 01.5110.028.312.0217.0000
Total: $42,136 State
2010-11 MOE Amount Code E21 Eastern Wake Area ESE25 NE Wake Area ES M9 Holly Springs Area MSM10 Mills Park Area MS H2 Heritage HS
Based on 10,460.00 months of employment
$44,664 01.5110.028.312.0217.0000
Total: $44,664 State
273Growth - Employee CountWake County Public School System - FY 2008-09 Plan for Student Success
Growth - Employ ee Count
INITIATIVE: Teacher Assistants as Substitutes (Regular Education)
Current Funding Formula:
This provision gives Principals the flexibility to assign classroom teacher assistants as substitute teachers for teachers who are absent. When a teacher assistant assigned to a classroom acts as a substitute teacher in that classroom during the ten-month employment period, he/she shall be paid for that service the same as the daily salary of an entry-level teacher with an a Certificate for every day he/she serves as a substitute. Teacher Assistants as Substitutes are paid $138.37 per day.
- While savings may be an incentive, instructional continuity in the classroom should be the first priority. Therefore, a teacher assistant may not be assigned to substitute for more than ten (10) consecutive workdays for one teacher without prior approval from Human Resources. There will be no replacements for regular education or grant-funded teacher assistants who serve as substitute teachers.
- Teacher assistants may not substitute in schools other than the schools to which they are assigned.
- Use of funds to pay a teacher assistant as substitute teachers will be monitored according to these guidelines.
- Unauthorized use of a teacher assistant as substitute teachers will result in charging the schools’ Fund 6 accounts.
- Clerical assistants, media assistants, and other office personnel may not be paid as substitute teachers.
Implementation Timeline & Budget Needed:
Expenditures are difficult to project. Increases each year are due to increased numbers of teacher assistants due to increased student membership, increase in rate of pay per day, and the availability of regular substitutes. There was an unusual increase in 2006-07 that is currently being researched. To build this case for 2008-09, we are using the average increase from the previous three years of 18 percent.
Projected Expenditures for 2007-08 by applying 36% increase to 2006-07
Expenditures Increase Over Previous Year
2007-08 $1,024,836 18%
2008-09 Projection Amount Code TA’s as Subs
$1,209,306 $159,260 12,18313,027
Base 01.5110.027.167.0276.0000 SS 01.5110.027.211.0276.0000 Ret 01.5110.027.221.0276.0000
Total: $184,470 State
2009-10 Projection Amount Code TA’s as Subs
$1,426,981 $187,813 14,36815,494
Base 01.5110.027.167.0276.0000 SS 01.5110.027.211.0276.0000 Ret 01.5110.027.221.0276.0000
Total: $217,675 State
2010-11 Projection Amount Code TA’s as Subs
$1,683,838 $221,619 16,95418,284
Base 01.5110.027.167.0276.0000 SS 01.5110.027.211.0276.0000 Ret 01.5110.027.221.0276.0000
Total: $256,857 State
274 www.wcpss.net
Growth - Employ ee Count
INITIATIVE: Beginning Teacher Support Program (BTSP) Coordinating Teacher
To increase the retention rate for outstanding teachers, in accordance with the Wake County Public School System (WCPSS) strategic directives—focus on learning and teaching; retaining, recruiting, and training high quality employees; implementing organizational structures that support schools; and fiscal accountability. As the student growth spiral continues to draw more beginning teachers into WCPSS, this position is mission critical to teacher retention. BTSP Coordinating Teachers provide direct and indirect support services to new teachers and their mentors and as a result, they enhance teacher retention. Considering national estimates of the average cost for replacing one teacher at $15,000, providing an additional BTSP coordinating teacher would reduce turnover and the resulting high costs of teacher replacement.
Current Funding Formula:
With a total of approximately 2,000 beginning teachers (as defined by the North Carolina Department of Public Instruction (NCDPI)), teachers in years one, two, and three) in WCPSS for the 2007-2008 school year, the current ratio of Human Resource BTSP coordinating teachers to beginning teachers is 1:667. In order to maintain and improve the WCPSS teacher turnover rate (10.03 percent) attained in 2006-07, BTSP coordinating teachers provide the following intensive services: at least two school-based visits per year at every WCPSS school; beginning teacher inductions and regular support to struggling BTs; new teacher orientation; and frequent, ongoing communication with, and training for, BTs, mentors and mentor coordinators. BT coordinating teachers also provide extensive training (45 hours) to mentors. In addition, they promote higher retention by maintaining close monitoring of the following data: mentor stipends and assignments; NCDPI and No Child Left Behind (NCLB) licensure requirements; BTSP yearly requirements; system-wide mentor support statistics; and three-day pay for BTs.
Implementation Timeline & Budget Needed:
This new position will be effective June 1st based on the year-round calendar schools. The first-year budget requirements would be $66,349.73
2008-09 MOE Amount Code BTSPCoordinatingTeacher
12.00 $ 41,280 6,9093,6863,942
2324,200
6002,0002,5001,000
Base 02.6620.801.131.0109.0935 Supp 02.6620.801.181.0109.0935 SS 02.6620.801.211.0109.0935 Ret 02.6620.801.221.0109.0935 Dental 02.6620.801.234.0109.0935 Hosp 02.6620.801.231.0109.0935 Supplies 02.6620.801.411.0109.0935 Computer 02.6620.801.411.0109.0935 Furniture 02.6620.801.461.0109.0935 Mileage 02.5870.801.312.0109.0935
275Growth - Employee CountWake County Public School System - FY 2008-09 Plan for Student Success
Growth - Employ ee Count
INITIATIVE: Benefi ts Representative
In an effort to maintain sufficient resources to support learning and teaching and fiscal accountability, the statistics below will provide further information regarding the request of a benefits representative.
Summary of Benefits Workload Statistics Wake County Public School System and Other School Districts
District Benefit Staff District
Employees
Ratio of Benefit Staff to
Employees
Wake 4.5 16,703 1:3712
Mecklenburg 11 16,325 1:1434
Cumberland 3 6,713 1:2238
Forsyth 6 7,138 1:1785
Durham 4 4,600 1:1150
Average w/o Wake 6 8,694 1:1449
Statistical data collected from payroll and human resources departments for the school year ending 2006-2007. 50% Benefits Representative is responsibility for assisting new employees with payroll/enrollment forms/benefits presentation at our new employee orientation.
Current Funding Formula:
None. Proposed formula is 1:2250 employees per benefits representative. Presently the workload is 1:3712.
Implementation Timeline & Budget Needed:
2008-09 MOE Amount Code Remove one-time costs from 2007-08
($2,050) 02.6610.801.411.0195.0965
Total: ($2,050) Local
2009-10 MOE Amount Code BenefitsRepresentative
12.00 $ 31,101 2,3792,5664,350
2321,000
600
Base 02.6610.801.151.0195.0965 SS 02.6610.801.211.0195.0965 Ret 02.6610.801.221.0195.0965 Hosp 02.6610.801.231.0195.0965 Dental 02.6610.801.234.0195.0965 Computer 02.6610.801.411.0195.0965 Supplies 02.6610.801.411.0195.0965
N.C.G.S. 115C-332 required the Board of Education to adopt a policy pertaining to Criminal Record Checks. As a result of the law our Board approved policy 2303/3003/4003 Criminal Record Checks states, “criminal record checks will be conducted on applicants and/or newly hired employees, including substitutes.” The effect of the population growth will have an enormous effect on the number of criminal record checks that will be required to run. Not providing funding for action that is required by the Board per state law puts us in jeopardy of not complying with state and board mandates.
Implementation Timeline & Budget Needed:
2008-09 Amount Code Criminal Record Checks
$14,392 Contract Svcs. 02.6620.801.311.0109.0935
Total: $14,392 Local
2009-10 Amount Code Criminal Record Checks
$6,474 Contract Svcs. 02.6620.801.311.0109.0935
Total: $6,474 Local
2010-11 Amount Code Criminal Record Checks
$6,476 Contract Svcs. 02.6620.801.311.0109.0935
Total: $6,476 Local
277Growth - Employee CountWake County Public School System - FY 2008-09 Plan for Student Success
Growth - Employ ee Count
INITIATIVE: Payroll Technician
In an effort to maintain sufficient resources to support learning and teaching and fiscal accountability, the statistics below will provide further information regarding the request of an additional payroll technician.
Summary Payroll Workload Statistics Wake County Public School System (WCPSS) and Other School Districts
DistrictPayroll
StaffDistrict
Employees
Ratio of Payroll Staff to
Employees
AutomatedPayroll System
Wake 8 16,703 1:2088 Yes
Mecklenburg 15 16,325 1:1088 Yes
Cumberland 7 6,713 1:959 Yes
Forsyth 8 7,138 1:892 Yes
Average w/o Wake 10 10,059 1:1006 N/A
Source: WCPSS Payroll and Peer District fact sheets. Statistical data collected from payroll and human resources departments for the school year ending 2006-2007. These statistics only include full-and part-time employees. WCPSS PR Technicians also support wage payment for 4,400+ substitute teachers.
Current Funding Formula:
1:1850 per payroll technician. WCPSS advances in technology allows for larger workloads than other school districts.
Implementation Timeline & Budget Needed:
2008-09 MOE Amount Code Remove one-time costs from 2007-08
Base 02.6610.801.151.0195.0965 SS 02.6610.801.211.0195.0965 Ret 02.6610.801.221.0195.0965 Hosp 02.6610.801.231.0195.0965 Dental 02.6610.801.234.0195.0965 Computer 02.6610.801.411.0195.0965 Supplies 02.6610.801.411.0195.0965
Total: 12.00 $ 42,228 Local
2010-11 MOE Amount Code Less: one-time costs from previous year
To ensure that a highly qualified and diverse pool of candidates is available to meet the growing needs of the school system. As the student growth trend arches upward, along with higher academic expectations, more exemplary teachers are needed in the Wake County Public School System (WCPSS). The Senior Administrator for Recruitment will play a key role in marketing WCPSS to potential teachers, providing intensive follow-up to candidates, and working with school-based administrators and candidates in finding the best candidates for each vacancy. This role fully supports the strategic directives of focusing on teaching and learning, recruiting high quality employees, and implementing structures that support schools.
Current Funding Formula:
With a total of approximately 1,200 to 1,500 (1,297 in 2007-08 and 1,491 in 2006-2007) new teachers hired annually, the current ratio of Human Resources recruiting administrators to newly hired professional staff is 1:650 to 1:750.
Currently, recruitment teams consisting of other Human Resource (HR) Administrators, Principals, and Beginning Teacher Support Program (BTSP) Coordinating Teachers are being used to support our recruitment efforts. With two additional recruiting administrators, the level of follow-up, communication, and relationship building would be improved and could have a positive impact on recruiting a higher number of highly qualified teachers. Sixty percent of new teachers hired are from out-of-state. Consequently the number of out-of-state recruitment events have also increased and so have the number of week-long trips that recruiting administrators are expected to participate.
Increased competition in the form of higher signing bonuses and differentiated pay for critical needs teachers from out-of-state, neighboring, and other North Carolina school districts has resulted in a much more challenging environment for recruitment. North Carolina’s low annual production of certified teachers (2,500 – 3,000 statewide) and increased demand (10,000 – 12,500 statewide) has also contributed to recruitment challenges. Currently, WCPSS participates
in more than 200 recruitment fairs in 35 states and sponsors two major system-wide recruitment fairs in order to attract adequate numbers of highly qualified, certified teachers to our burgeoning school system. Two additional recruiters would also provide the resources needed to continue to provide the level of support that will attract highly qualified teachers to our district and to work effectively with Principals as it relates to their hiring needs. The curriculum audit addressed the need to attract more minority teachers to the school district. With two additional recruiting administrators a strategic diversity recruitment plan could be implemented to focus on the audit concerns surrounding the need to recruit more minority teachers.
Implementation Timeline & Budget Needed:
This new position will be effective June 1, 2008, based on the needs of year-round calendar schools. The first-year budget requirements would be $214,651.00
Curriculum Management Audit:
Recommendation 1: A1.9 Develop incentives to attract minority and male teachers.
279Growth - Employee CountWake County Public School System - FY 2008-09 Plan for Student Success
Growth - Employ ee Count
INITIATIVE: Contracted Services to Support Increased User Base and Applications
Implementation Timeline & Budget Needed:
Demand for additional support in both Oracle and NC WISE areas will increase in 2008-09 based on increased number of users, increased number of applications supported, and increased complexity of utilization.
New or significantly modified, expanded, or enhanced applications to be supported include Project Enlightenment, Bus Matrix, Data Warehouse, SpecEd Transportation, On-line Report Card, Electronic Transcripts, Self Service, Gifts to the System, Warehouse Catalog, Oracle Expedition Integration, Oracle Maximo Integration, Oracle PRISM Integration, Oracle Provisioning, Oracle security for users, Payroll reconciliation, SIP, STARS, and Athena replacement.
Each application has a unique set of users, which has also increased as applications have gone from pilot to production. The functionality and complexity of the applications and the users’ service requests have increased as proficiency increases. The support skill sets required span business and school applications making it more efficient to pool the contracted services.
Custodial staff for additional square footage. 2008-09 958,530 SF 2009-10 907,849 SF 2010-11 763,045 SF
Current Funding Formula:
This requirement was funded for the current year at $1.50 per square foot.
Implementation Timeline & Budget Needed:
Part of growth dollars will be used to fund implementation of regional custodial services. We expect to replicate the great success we had with implementation of regional maintenance. We will start with one region and then add regions in later years as funding allows. The goal is five regions.
2008-09 MOE Amount Code RegionalCustodialManager
Area Custodial Manager
Custodians
12.00
48.00
60.00
$ 39,683
149,296
114,88523,24624,85642,000
237,646
Base 01.6540.003.176.0264.0830
Base 01.6540.003.176.0264.0830
Base 01.6540.003.173.0264.0830 SS 01.6540.003.211.0264.0830 Ret 01.6540.003.221.0264.0830 Hosp 01.6540.003.231.0264.0830 Cont Svcs. 01.6540.003.325.0264.0830
Base 01.6540.003.173.0264.0830 SS 01.6540.003.211.0264.0830 Ret 01.6540.003.221.0264.0830 Hosp 01.6540.003.231.0264.0830 Cont Svcs. 01.6540.003.325.0264.0830
This requirement was funded for the current year at $1,294 per acre. The formula originally reflected a cost based on 66 percent of the acreage being maintained. This year the rate is based on 100 percent of the acreage. Therefore the cost per acre dropped the equivalent 34 percent. The bottom-line amount did not change but the formula was simplified.
Implementation Timeline & Budget Needed:
Grounds maintenance includes: mowing grass, trimming shrubbery, storm water maintenance, plant beds, trash removal from grounds, minor fence repairs, minor pavement repairs, playgrounds and leaf removal.
SQ FT TOTAL 19,389,090 20,083,478 21,023,967 21,866,979
SQ FT increase from previous year ---- 694,388 940,489 843,012
$/SQ FT Labor & Materials 0.032 0.032 0.032 0.032
Increase of Costs $22,220 $30,095 $26,976
Implementation Timeline & Budget Needed:
We request funds to add one Master Craftsman-IPM position due to the increase in square footage. No new positions have been added to address the work load for the past five years. The level of service has dropped as the technicians are spread over more areas to serve. The Schoolchildren’s Health Act requires the implementation of an IPM Program at all school facilities. The IPM Program consists of utilizing various non-chemical methods and devices to control the pest population on a regular and on-going basis. Successful implementation requires the expertise of a licensed pest control technician to continuously monitor conditions and take corrective actions at each school. The cost of the service is very labor dependent. The limited use of chemicals minimizes supply costs.
Additionally, due to the increased days of occupancy at year-round schools, each technician must spend more time at these schools than in previous years. To maintain the level of service required by the Schoolchildren’s Health Act, additional personnel and supplies are needed each year.
2008-09 MOE Amount Code One Master Craftsman –IPM, Grade 26
12.00 $ 37,616 2,8783,0774,200
232
24,3741,000
15,165
Base 02.6580.802.175.0222.0830 SS 02.6580.802.211.0222.0830 Ret 02.6580.802.221.0222.0830 Hosp 02.6580.802.231.0222.0830 Dental 02.6580.802.234.0222.0830
Supplies 02.6580.802.411.0243.0930 Training 02.6580.802.312.0243.0930 Vehicle 04.6580.801.551.0243.0930
283Growth - Square Footage and AcreageWake County Public School System - FY 2008-09 Plan for Student Success
Growth - Square Foot age and Acreage
INITIATIVE: Maintenance Growth
Traditional Year-Round2008-09 526,932 SF 431,598 SF 2009-10 343,001 SF 564,848 SF 2010-11 147,637 SF 615,408 SF
Current Funding Formula:
This requirement was funded for the current year at $1.04 per square foot. This year the cost, if broken out separately between traditional and year round, is statistically the same as using the average.
Some of the increased funding will be used to implement a more efficient material purchasing system. There are over 140 people with purchasing cards in Maintenance and Operations (M&O). This has been necessary in the past to obtain parts and materials to complete assigned tasks. The time used by these individuals to make purchases is lost time in maintenance. New square footage requires more maintenance, which requires more materials, which requires more purchasing. One way to handle this growth would be with more maintenance personnel. Another would be to eliminate non-maintenance tasks for existing maintenance personnel. Therefore, this growth request includes new purchasing positions to absorb some of the purchasing tasks being done by maintenance personnel. Additional benefits include better accountability, additional time for existing purchasing personnel to handle growth of instructional supplies and potentially provide some space in the warehouse. New personnel would be funded by and dedicated to Maintenance and Operations, but would be supervised by the Purchasing Department. This initiative is supported by the Senior Directors of M&O and Purchasing.
Base 02.6580.802.175.0229.0965 SS 02.6580.802.211.0229.0965 Ret 02.6580.802.221.0229.0965 Hosp 02.6580.802.231.0229.0965 Dent 02.6580.802.234.0229.0965
Base 02.6580.802.175.0229.0965 SS 02.6580.802.211.0229.0965 Ret 02.6580.802.221.0229.0965 Hosp 02.6580.802.231.0229.0965 Dent 02.6580.802.234.0229.0965
04.6580.801.551.0109.0830
Base 02.6580.802.176.0288.0830 SS 02.6580.802.211.0288.0830 Ret 02.6580.802.221.0288.0830 Hosp 02.6580.802.231.0288.0830 Dent 02.6580.802.234.0288.0830
Base 02.6580.802.175.0410.0830 SS 02.6580.802.211.0410.0830 Ret 02.6580.802.221.0410.0830 Hosp 02.6580.802.231.0410.0830 Dent 02.6580.802.234.0410.0830
Base 02.6580.802.175.0406.0830 SS 02.6580.802.211.0406.0830 Ret 02.6580.802.221.0406.0830 Hosp 02.6580.802.231.0406.0830 Dent 02.6580.802.234.0406.0830
Base 02.6580.802.175.0440.0830 SS 02.6580.802.211.0440.0830 Ret 02.6580.802.221.0440.0830 Hosp 02.6580.802.231.0440.0830 Dent 02.6580.802.234.0440.0830
Base 02.6580.802.175.0296.0830 SS 02.6580.802.211.0296.0830 Ret 02.6580.802.221.0296.0830 Hosp 02.6580.802.231.0296.0830 Dent 02.6580.802.234.0296.0830
Base 02.6580.802.175.0296.0830 SS 02.6580.802.211.0296.0830 Ret 02.6580.802.221.0296.0830 Hosp 02.6580.802.231.0296.0830 Dent 02.6580.802.234.0296.0830
Base 02.6580.802.175.0296.0830 SS 02.6580.802.211.0296.0830 Ret 02.6580.802.221.0296.0830 Hosp 02.6580.802.231.0296.0830 Dent 02.6580.802.234.0296.0830
Contracts 02.6580.802.325.0109.0830 Total: $793,566 Local
285Growth - Square Footage and AcreageWake County Public School System - FY 2008-09 Plan for Student Success
Growth - Square Foot age and Acreage
INITIATIVE: Utilities for additional square footage
Traditional Year-Round2008-09 526,932 SF 431,598 SF 2009-10 343,001 SF 564,848 SF 2010-11 147,637 SF 615,408 SF
Current Funding Formula:
This requirement was funded for the current year at $1.52 per square foot for electrical, natural gas, water, sewer, storm water, fuel oil, and solid waste. Based on the previous fiscal year, the Year-Round schools cost an additional eight cents per square foot for electricity. The cost per square foot is statistically the same for the other utilities.
This request is for diesel fuel for school buses and activity buses. The opening of three new elementary schools, the additional runs for students who chose to remain in traditional schools, and normal expected growth increases miles for the buses. Rising fuel prices due to oil markets is affecting the daily cost of fuel with a current increase of 21% from July to November.
Current Funding Formula:
2005-06 Total miles =15,291,182 2006-07 Total miles = 15,765,188 2007-08 projected miles = 16,238,144 2008-09 projected miles = 16,238,144 * 1.03 = 16,725,288
Total miles from 2005-06 to 2006-07 = 3 percent increase. We will use this three percent as the projected increase in miles for years 2009-10 and 2010-11.
Total projected miles = 16,725,288/ 6.6 and multiplied by average cost of fuel. Projected State average = $2.67. This average will be increased to $2.85 for 2009-10 and 2010-11.
Price of fuel is in constant flux. This request is based on the best information available at the time. The continuing rise and fall of oil prices is an outside factor that is not controllable by the Wake County Public School System (WCPSS).
Implementation Timeline & Budget Needed:
2008-09 Amount Code Fuel for school buses and activity buses
287Growth - MileageWake County Public School System - FY 2008-09 Plan for Student Success
Growth - Mileage
INITIATIVE: Oil, Tires, Bus Parts, and Supplies for Buses
Current Funding Formula:
Oil – Current average cost of oil per quart = $1.25 Total projected miles for 2007-08 = 16,238,144
Total miles from 2005-06 to 2006-07 = 3 percent increase We will use this 3 percent increase for the 2007-08 to 2008-09 fiscal year. Total miles for 2008-09 = 16,238,144 x 1.03 = 16,725,288
An oil change is done every 5,000 miles and each bus requires 32 quarts per oil change:
16,725,288/5,000 x 32qts. x 1.25 = $133,802 Additional 10,600 qts. used for normal replacement of oil = $13,250
Tires – Cost of recaps = $129 Recaps done at 20,000 miles
Cost of new tires = $248 New tires changes at 25,000 miles
16,725,288 / 20,000 = 836 recaps 836 x $129 = $107,844 x 4 = $431,376
It is the practice to remove new tires from the rear of buses and replace with recaps.
Parts – Current cost per bus = $1,926 Projected buses 2008-2009 = 919 buses 2009-2010 = 962 buses 2010-2011 = 1,009 buses
For fiscal years 2009-10 and 2010-11 we will use a three percent increase in parts prices.
Implementation Timeline & Budget Needed:
2008-09 MOE Amount Code Oil, Tires, Bus Parts and Supplies for activity buses
($ 1,986) 23,33421,872
Parts 01.6550.056.422.0225.0980 Oil 01.6550.056.424.0225.0980 Tires 01.6550.056.425.0225.0980
Total: $ 43,220 State
2009-10 MOE Amount Code Oil, Tires, Bus Parts and Supplies for activity buses
$ 40,994 20,416
6,152
Parts 01.6550.056.422.0225.0980 Oil 01.6550.056.424.0225.0980 Tires 01.6550.056.425.0225.0980
Total: $ 67,562 State
2010-11 MOE Amount Code Oil, Tires, Bus Parts and Supplies for activity buses
$ 47,443 21,160
6,664
Parts 01.6550.056.422.0225.0980 Oil 01.6550.056.424.0225.0980 Tires 01.6550.056.425.0225.0980
Total: $ 75,267 State
288 www.wcpss.net
Not es
289Systemwide - Fiscal AccountabilityWake County Public School System - FY 2008-09 Plan for Student Success
Systemwide - Fiscal Accountability
INITIATIVE: Accounting Support Position for Schools
The growth of the Wake County Public School System and the increased fiscal responsibilities placed on the school secretaries/bookkeepers indicates that there is a need for additional support for these positions. The area of Individual School Funds is one of high risk, due to the lack of separation of duties at the school bookkeeper level. The Accounting Department currently has one Accountant that supports the bookkeepers, reviews the reports that are sent in from the schools monthly, and performs all of the accounting functions for all schools’ individual school funds. Additional group and individual training is needed for the bookkeepers/secretaries in all areas of accounting and additional analysis is needed on the information received from the schools monthly.
This position will provide training and will be the first point of contact for any accounting questions for the bookkeepers/secretaries. This will allow the Individual Schools Accountant to increase the amount of analysis performed and will allow the Accounting Department to provide better service and training for the schools.
Base 02.6610.801.151.0107.0965 SS 02.6610.801.211.0107.0965 Ret 02.6610.801.221.0107.0965 Hosp 02.6610.801.231.0107.0965 Dental 02.6610.801.234.0107.0965 Laptop 02.6610.801.411.0107.0965
Expand the Human Resources budget to add one File Room Technician (Salary Grade 21) to work in the Employee File Room. Currently one staff member is responsible for managing the files for over 17,000 Wake County Public Schools (WCPSS) employees.
Current Funding Formula:
Salary Grade 21; 12 month position; minimum salary $26,781 per year with a maximum salary of $38,181 per year plus benefits.
Implementation Timeline & Budget Needed:
The position will begin July 1, 2008. Approximate budget needed, using mid-range salary after temp savings, is $31,497.
2008-09 MOE Amount Code File Room Technician
Less:Cost of contracted File Room Tech
12.00 $31,999 2,4482,6184,200
232
(10,000)
Base 02.6620.801.151.0109.0935 SS 02.6620.801.211.0109.0935 Ret 02.6620.801.221.0109.0935 Hosp 02.6620.801.231.0109.0935 Dent 02.6620.801.234.0109.0935
Cont Svcs 02.6620.801.311.0109.0935
Total: 12.00 $31,497 Local
2009-10 MOE Amount Code Total: $ 0
2010-11 MOE Amount Code Total: $ 0
Strategic Directive:
Develop and Implement systems and organizational structures to support schools, ensure accountability, and engage the community.
291Systemwide - Fiscal AccountabilityWake County Public School System - FY 2008-09 Plan for Student Success
Systemwide - Fiscal Accountability
INITIATIVE: Salary Administration and Organizational Management Senior Administrator and Clerical Support Positions
Implementation Timeline & Budget Needed:
The 2007 Curriculum Audit Recommendation #8 states that the Wake County Public School System (WCPSS) should “adopt policies governing the management of job descriptions and the table of organization.”
These positions will: 1) Ensure that accurate and complete job descriptions exist
for all WCPSS positions. 2) Ensure that job descriptions are updated as positions
evolve.3) Assist WCPSS managers in the creation and
maintenance of job descriptions. 4) Work with the WCPSS leadership team to ensure that
tables of organizations are established in a manner consistent with best practices and are documented.
Additionally, these positions will be responsible for processing proposed salary grade changes and in-range revisions in a timely manner.
Base 02.6620.002.113.0109.0935 SS 02.6620.002.211.0109.0935 Ret 02.6620.002.221.0109.0935 Hosp 02.6620.002.231.0109.0935 Dental 02.6620.002.234.0109.0935
Base 02.6620.801.151.0109.0935 SS 02.6620.801.211.0109.0935 Ret 02.6620.801.221.0109.0935 Hosp 02.6620.801.231.0109.0935 Dental 02.6620.801.234.0109.0935 Supplies 02.6620.801.411.0109.0935
Retaining, recruiting and training high quality employees
292 www.wcpss.net
Systemwide - Fiscal Accountability
INITIATIVE: Fuel Management System
Current Funding Formula:
This is year two of a three year phase to manage the input of fueling school buses. Year one was funded for $135,000 to install on all nine fuel trucks and 161 buses on a fleet of 899.
Cost per unit = $225.
Implementation Timeline & Budget Needed:
Phase Two in 2008-09 will continue the installation on an additional 384 buses. In 2009-10 no increase will be needed to finish phase three unless additional buses are added.
2008-09 MOE Amount Code Fuel Management System
Less: one time cost from previous year
$ 86,400
(135,000)
02.6550.706.411.0225.0980
04.6550.801.541.0225.0980
Total: ($48,600) Local
2009-10 MOE Amount Code Fuel Management System
Less: one time cost from previous year
$ 86,400
(86,400)
02.6550.706.411.0225.0980
02.6550.706.411.0225.0980
Total: $ 0 Local
2010-11 MOE Amount Code Total: $ 0
Strategic Directive:
Fiscal accountability for fuel expenditures will be greatly improved by the use of this product.
The accurate recording of fuel dispensed will allow us to continue to better monitor the Transportation fuel budget. The electronic capture of data frees staff time and allows us to capture fuel operating efficiencies, monitor idling time of buses, and monitor other outputs from the buses that include , warning lights, hard braking events, high speed events, and other vehicle parameters.
293Systemwide - Fiscal AccountabilityWake County Public School System - FY 2008-09 Plan for Student Success
Systemwide - Fiscal Accountability
INITIATIVE: Internal Audit Senior Administrator
This position contributes toward the strategic objective of fiscal accountability.
Current Funding Formula:
There is no current funding formula. Our annual audit work is based on a comprehensive system-wide risk assessment that covers all departments and schools in the system. Our effort is devoted to the areas of highest risk.
Implementation Timeline & Budget Needed:
This request anticipates the addition of a senior administrator in the 2008-09. This will assist in meeting the internal audit needs of the system. The various schools and central office departments will benefit by having audit activities conducted in their area.
2008-09 MOE Amount Code SeniorAdministrator
12.00 $ 70,459 5,3915,7644,200
2324,5001,7505,000
Base 02.6930.002.113.0148.0905 SS 02.6930.002.211.0148.0905 Ret 02.6930.002.221.0148.0905 Hosp 02.6930.002.231.0148.0905 Dent 02.6930.002.234.0148.0905 Wkshp 02.6930.801.312.0148.0905 Travel 02.6930.801.332.0148.0905 Supplies 02.6930.801.411.0148.0905
The E-rate Support Analyst will be dedicated to all aspects of applying for and receiving funding through the Federal E-rate program. Duties will include tracking of eligible expenses throughout the year and responding to inquiries about the program. In addition to maintaining the required paperwork for E-rate compliance, the E-rate Support Analyst will be alerted for areas in which applications could be made for additional discounts thereby potentially increasing the amount of money the district receives. Based on current E-rate funding and regulations, it is anticipated that beginning in the second year this position would make it possible to significantly increase the districts E-rate receipts.
Implementation Timeline & Budget Needed:
E-rate provides discounts or rebates to assist schools and libraries in obtaining affordable telecommunications, internet access and internal connections. With this position, it would be possible to identify, research, and file for discounts on eligible services other than the ones traditionally utilized.
2008-09 MOE Amount Code E-rate Support Analyst Supplies and office set-up
One-Time Cost
12.00 $ 60,000 4,5904,9084,200
232
2,000
Base 02.6400.801.151.0231.0910 SS 02.6400.801.211.0231.0910 Ret 02.6400.801.221.0231.0910 Hosp 02.6400.801.231.0231.0910 Dent 02.6400.801.234.0231.0910
Supp 02.6400.801.411.0231.0910 Total: 12.00 $ 75,930 Local
2009-10 MOE Amount Code Less:one-time cost from previous year
($2,000) Supp 02.6400.801.411.0231.0910
Total: ($2,000) Local
2010-11 MOE Amount Code Total: $ 0
Strategic Directive:
Expand fiscal accountability.
295Systemwide - Fiscal AccountabilityWake County Public School System - FY 2008-09 Plan for Student Success
Systemwide - Fiscal Accountability
INITIATIVE: Oracle Advanced Benefi ts
Current Funding Formula:
No formula exists as this is a one-time expenditure for implementation of additional Oracle functionality.
The implementation of Oracle Advanced Benefits functionality would enable Self-Service enrollment and Service Center functionality which would allow end-user input for greater accuracy and increased user-friendly environment.
Developing and implementing systems and structures to support schools, ensure accountability, and engage the community.
Expand fiscal accountability.
296 www.wcpss.net
INITIATIVE: Graduation Diploma Inserts and Certifi cates
Current Funding Formula:
The school system pays $1.75 for diplomas or certificates for each graduating senior. It will cost approximately $14,277 for 8,158 certificates and diplomas for students in nineteen schools in 2008.
Implementation Timeline & Budget Needed:
The cost for diplomas and certificates will increase in 2009 due to the first senior classes graduating from Holly Springs High School and Panther Creek High School. In 2009 and 2010, there will be approximately 8,918 students graduating from twenty-one schools. It is estimated diplomas and certificates will increase to approximately $1.80 in 2009 and $1.85 by 2010. Therefore, the estimated costs for diplomas and certificates in 2009 are $16,053 and $16,498 in 2010. In 2011 approximately 75 seniors will graduate from Wake Early College of Health and Science. This will bring the approximate number of graduates to 8,993. At an estimated cost of $1.90 per certificate and diploma; the 2011 cost for diplomas and certificates will be approximately $17,087.
2008-09 Amount Code $1.80 x 8,918 students
Less prior year costs:
$16,053
(14,277)
02.6940.801.411.0129.0806
Total: $ 1,776 Local
2009-10 Amount Code $1.85 x 8,918 students
Less prior year costs:
$16,498
(16,053)
02.6940.801.411.0129.0806
Total: $ 445 Local
2010-11 Amount Code $1.85 x 8,993 students (75 from Wake Early College of Heath and Sciences
Less prior year costs:
$17,087
(16,498)
02.6940.801.411.0129.0806
Total: $ 589 Local
Strategic Directive:
Develop and maintain systems and organizational structures to support school, ensure accountability, and engage the community.
Systemwide - Rate Increases
297Systemwide - Rate IncreasesWake County Public School System - FY 2008-09 Plan for Student Success
INITIATIVE: Preliminary Scholastic Aptitude Test (PSAT)
To administer the Preliminary Scholastic Aptitude Test (PSAT) in Grade 10 and to continue to administer the assessment for one year in Grade 11
Current Funding Formula:
State Law G.S. 115C-274.18 requires every student in Grade 8 – 10 who has completed Algebra I to be given the opportunity to take the PSAT at public expense.
Implementation Timeline & Budget Needed:
For the 2008-2009 school year only, Wake County would need to ensure that all students in Grade 11 who had not had the opportunity to take the PSAT would be given the opportunity to take the test at public expense.
2008-09 Amount Code $ 20,896 01.6710.061.311.0223.0970 $ 20,896 State
$20,369 02.6710.801.311.0223.0970
11th grade 8,863 X $13= $115,219 Less: Base (Fund 1) ($38,954) Less: Base (Fund 2) ($35,000) $41,265
$20,369 Local Total: $41,265
2009-10 Amount Code $2,122 01.6710.061.311.0223.0970 $2,122 State
$28,567 02.6710.801.311.0223.0970
10th grade 10,422 X $14= $145,908Less: Base (Fund 1) ($59,850) Less: Base (Fund 2) ($55,369) $30,689
$28,567 Local Total: $30,689
2010-11 Amount Code $3,564 01.6710.061.311.0223.0970 $3,564 State
$1,630 02.6710.801.311.0223.0970
10th grade 10,793 X $14= $151,102Less: Base (Fund 1) ($61,972) Less: Base (Fund 2) ($83,936) $ 5,194
$1,630 Local Total: $5,194
Strategic Directive:
Strategic Directive I is “Focus on learning and teaching.”
In WCPSS the PSAT testing of 11th grade students is provided by public funds. We propose to move PSAT to 10th grade. For one year, this would require testing in both 10th and 11th grade students. Local funds are used to supplement the state allotment for this test.
In order to increase the number of students who are in challenging courses, Central Services departments are directed to ensure support for learning and teaching. The end result of moving the PSAT to Grade 10 will be to increase Scholastic Assessment Test (SAT) scores and increase the number of students in all subgroups that participate in Advanced Placement Courses.
Curriculum Audit:
Recommendation 5: Evaluation – “…provide data for decision making at all levels of the system…” Recommendation 3: Governance – “…establish a framework for accountability regarding curriculum management and related functions of the district.” Recommendation 2: Consistency – “…attain improved internal system connectivity in order to realize the strategic direction for the school system.”
Systemwide - Rate Increases
298 www.wcpss.net
Systemwide - Rate Increases
INITIATIVE: Swimming Pool Rental for High Schools
Current Funding Formula:
$4,941 for each of our 19 high schools
Rate is expected to increase by five percent to $5,188 per high school. Athletically, East Wake is considered one school. Alternative schools do not have athletic programs, therefore, they have no swimming pool rental fees.
The sport of swimming and diving is one of the most popular sports in the Wake County Public School System. Swimming pools are not included in our building plans for schools. In order to provide the sport of swimming, we must pay for the increased costs associated with the rental of the pools.
Develop and implement systems and structures to support schools, ensure accountability and engage the community.
299Systemwide - Rate IncreasesWake County Public School System - FY 2008-09 Plan for Student Success
Systemwide - Rate Increases
INITIATIVE: Financing Risk through Commercial and Self Insurance
Current Funding Formula:Analysis of past ten-year loss experience, increase in exposure units (employees, students, real and personal property sites and values, vehicles) and current market conditions.
Liability Insurance(General Liability, School District and Educators' legal Liability, Employer Benefits Liability, Law Enforcement Professional Liability, and Excess Umbrella)Budget Code 02.6610.801.371.0258.0965.000: The estimated premium for 2008-09 will reduce by 30 percent or -$266,537 due to competitive bid process, reduction in loss trends over past five years. The estimates premium is projected to increase ten percent for the 2009-10 and 2010-11 Fiscal Years. This projection is based on current insurance market condition, annual increases in student population of six percent, and ten-year loss experience of 66 percent.
Property Insurance (Real and personal Property, Boiler and Machinery, and Musical Instruments): Budget Code 02.6610.801.373.0258.0965.000: It projected that the 2008-09 Fiscal Year will include increases in modular/mobile classrooms, three new elementary schools opening with new/renovated construction. However, with Property Insurance Loss Ratio under ten percent the past five years. Thus reducing budget for 2008-09 by 18 percent or ($178,282) with projected increases for 2009-10 and 2010-11 by 15 percent each year.
Vehicle Liability Insurance (Excluding Drivers' Education which is State Funded) Budget Code: 02.6610.801.372.0258.0965.000: Based on ten-year loss ratio of 42 percent, the 2008-09 premium will reduce by 30 percent or ($59,625) with projected increases for 2009-10 of nine percent and for 2010-11 of ten percent.
Workers' Compensation Self-Insurance(Covers employees paid form local, federal, and enterprise funds) Budget Code 02.6610.801.232.0258.0865.000: It is estimated that cost will increase based on increase in number of employees, medical act inflation to be offset by savings as a result of loss control and comprehensive safety program yielding a net annual increase in expenditures of one percent of 2008-09 and three percent for 2009-10, and two percent for 2010-11.
300 www.wcpss.net
Systemwide - Rate Increases
Scholastic Accident Insurance(High School Athletics, Blanket Field Trips, Middle School Catastrophe) Budget Code 02.6610.801.378.0258.0865.000: Based on loss experience, competitive bid process, voluntary accident insurance offered to parents of the Wake County Public School Systems (WCPSS) students, the 2008-09 projected premium will reduce by nine percent or ($9,218) with projected increases of six percent for 2009-2010 and ten percent for 2010-11.
Adult Volunteers Accident Insurance(coverage first provided for the 2007-2008 Fiscal Year to properly cover accidental injury to volunteers of the WCPSS) Budget Code 02.7300.801.379.0258.0865.000: It is estimated the premium for 2008-2009 will increase by $3,696 with projected increases of ten percent for Fiscal Years 2009-2010 and 2010-2011.
Fidelity Bond Insurance PremiumBudget Code 02.6610.801.375.0258.0965.000: Last year reported no loss in the past nine years. For 2007-08 there is potential for two or three claims. It is estimated that annual premiums will increase at a rate of ten percent for 2008-09; 2009-10; and 2010-11; with budgeted increases of $280; $307; and $338 respectively.
301Systemwide - Rate IncreasesWake County Public School System - FY 2008-09 Plan for Student Success
Systemwide - Rate Increases
INITIATIVE: Utility Rate Increases
Current Funding Formula:
Projected increases are obtained from utility companies or consumer price indexes. Current estimates range from three percent to ten percent.
Electricity 3% Natural Gas 6% Water 9% Fuel Oil 10% Solid Waste 5%
Develop and implement systems and organizational structures to support schools, ensure accountability, and engage the community.
Facility operation has a significant impact on the classroom-learning environment. A classroom must have utilities in order to operate.
302 www.wcpss.net
Systemwide - Facility Leases
INITIATIVE: Graduation and Rehearsal Facilities
Implementation Timeline & Budget Needed:
Currently the school system rents a facility for graduation ceremonies and rehearsals for each high school in the district. Prior to the 2009 graduations were held at Reynolds Coliseum, The Progress Energy Center for the Performing Arts, and Broughton High School Gymnasium. The cost was approximately $92,213. In 2009, we will no longer use Reynolds Coliseum and will return to the new Raleigh Convention Center and the Progress Energy Center for the Performing Arts. The estimated cost for graduation 2009 will be $71,200 netting a savings of $21,213 for 2009. By calculating a 10 percent increase for 2010 and 2011 the estimated cost will be approximately $78,320 and $86,152 respectively.
2008-09 MOE Amount Code Savings for Graduation and Rehearsal Facilities prior to 2009
($21,713) 02.6940.801.311.0129.0806
Total: ($21,713) Local
2009-10 MOE Amount Code Class of 2010 Graduation Facilities Costs
$ 7,120 02.6940.801.311.0129.0806
Total: $ 7,120 Local
2010-11 MOE Amount Code Class of 2011 Graduation Facilities Costs
$ 7,732 02.6940.801.311.0129.0806
Total: $ 7,732 Local
Strategic Directive:
Develop and maintain systems and organizational structures to support school, ensure accountability, and engage the community.
303Systemwide - Facility LeasesWake County Public School System - FY 2008-09 Plan for Student Success
Systemwide - Facility Leases
INITIATIVE: Real Estate LeasesThere are several elements included in the increased budget request for the 2008-09 fiscal year. The Bannister Properties Lease, the Crossroads Lease, and the Peakway Lease or alternate will continue to increase in accordance with the Board of Education approved contracts, for fiscal year 2008-09.
Current Funding Formula:
The Bannister Property (warehouse) is a recurring lease for the next year and expected to renew for two more years. The warehouse is used to stage furniture and equipment for installation in new mobile/modular classrooms and new schools. The Peakway (parking) Lease is a recurring lease for the next year and is expected to renew for two more years. The parking lot serves as a regional bus parking and fueling area. Both leases are expected to increase by a modest inflation factor of three to five percent.
The Dubois lease and Wakefield 9th Grade Center lease address student capacity. The rate will increase per year by a modest inflation rate factor of 3 to 5 percent. The Moore Square parking lease is an annual recurring lease and the Wake Forest-Rolesville High additional parking lease will end in 2008.
The Crossroads lease and Town of Garner lease address administrative functions. The Crossroads lease will increase annually per the contract and contains a two percent utility contingency for additional hours usage. The Town of Garner lease is $1 per year.
Implementation Timeline & Budget Needed:
Administrative and Instructional Leases (separated by bold line)
Less: one-time cost from previous year (1,879,707) 02.6570.801.311.0318.0940
Total: $ 43,269 Local
Strategic Directive:
Develop and implement systems and structures to support schools, ensure accountability and engage the community.
305Systemwide - Facility LeasesWake County Public School System - FY 2008-09 Plan for Student Success
Systemwide - Facility Leases
INITIATIVE: Leases for Mobile / Modular UnitsLeases for the current and future inventory of mobile and modular units that provides additional capacity for school campuses are paid from the capital outlay budget. The projected increase in the number of units continues to rise as school assignment and growth needs are addressed. The fixed lease rate is established in several multi-year rental contracts with the various suppliers of the units.
Current Funding Formula:
The 2007-08 fiscal year capital outlay budget of $2,097,916 includes $1,290,104 for lease payments of 270 classroom units, eight toilet units, and three multi-purpose room buildings. The remainder addresses relocations of units not funded by the Capital Improvement Plan (CIP) 2006 bonds and not driven by growth or capacity needs.
Implementation Timeline & Budget Needed:
Projected increases in lease payments due to the addition of 100 classrooms in mobiles or group in modulars per year will add $531,516 per year to the budget.
These costs are based on an estimate of 48 individual classrooms that are comprised into modular units leased at $8,273.25 per classroom unit and 56 single units at $2,400 per classroom unit.
2008-09 MOE Amount Code Mobile Units $ 0
Total: $ 0
2009-10 MOE Amount Code Mobile Units $ 531,516 04.6570.801.529.0198.0940
Total: $ 531,516 Local
2010-11 MOE Amount Code Mobile Units $ 531,516 04.6570.801.529.0198.0940
Total: $ 531,516 Local
The CIP 2006 capital bond plan funds the design and general construction associated with placing the classroom units on the selected site. The balance of the budget is utilized to relocate units not associated with student growth or able to be addressed with CIP 2006 capital bond funds.
Strategic Directive:
Focus on learning and teaching.
306 www.wcpss.net
Systemwide - Safet y and Sec urity
INITIATIVE: Private Security ContractTwo-year contract to provide security services for several school sites will expire in August 2008-09 budget year. The proposed increase will guarantee a continued level of high quality security services.
Current Funding Formula:
The current two year contract will expire on August 9, 2008. This increase will ensure that a high quality of security services will improve and continue. The increase includes a three percent increase in hourly rates ($39,000), which is desperately needed to retain current officers. Additionally, it is recommended to fund three field supervisor positions (two for 2008-09 and one for 2009-10) to ensure proper supervision and maintain quality control for all site security personnel (approximately 40 officers daily).
Implementation Timeline & Budget Needed:
2008-09 MOE Amount Code 3% rate increase and addition of two supervisors
$67,000 02.6850.801.311.0210.0805
Total: $67,000 Local
2009-10 MOE Amount Code Additional field supervisor $28,000 02.6850.801.311.0210.0805
Total: $28,000 Local
2010-11 MOE Amount Code 3% estimated increase and new officer for new high school
$74,000 02.6850.801.311.0210.0805
Total: $74,000 Local
Strategic Directive:
Developing and implementing systems and structures to support schools, ensure accountability, and engage the community.
Continuity of services and supervision structure will strongly support schools and ensure accountability while they attain safe and secure learning environments.
307Systemwide - Safety and SecurityWake County Public School System - FY 2008-09 Plan for Student Success
Systemwide - Safet y and Sec urity
To provide funding for the addition of one full-time School Resource Officer (SRO) for Longview High School in 2008-09 and an additional School Resource Officer for Heritage High in 2010-11.
Current Funding Formula:
Currently, all school resource officers assigned to high schools are funded via State Funds for At-Risk Students at a rate of $37,838 per officer. Longview School and Mary Phillips High previously have shared a full-time officer. It is recommended that each school be assigned a full-time school resource officer for 2008-09. Projections are also made for the opening of Heritage High in 2010.
Implementation Timeline & Budget Needed:
2008-09 MOE Amount Code Contracted School Resource Officer for Longview High School
2010-11 MOE Amount Code Contracted School Resource Officer for Heritage High School
$37,838 01.5850.069.311.0210.0805
Total: $37,838 State
Strategic Directive:
Developing and implementing systems and structures to support schools, ensure accountability, and engage the community.
Community policing and school resource officers provide a system and structure that are vital in the support of schools attaining a safe and secure learning environment and engages the community by teaming with local law enforcement.
INITIATIVE: School Resource Offi cers (SRO)
308 www.wcpss.net
Systemwide - Data Integrity
INITIATIVE: Transportation Information Management System (TIMS) Technicians
The Transportation Information Management System (TIMS) is the computer software that is used by the Transportation Department to route all buses for the school district. The request is to add two dedicated TIMS Technicians to assist in data verification and integrity.
Current Funding Formula:
One TIMS Technician for 285 Exceptional Children (EC) contract cars and buses. There are no TIMs Technicians for the 899 school buses. Bus Team Leaders are currently utilized to assist in routing buses.
The Institute of Transportation Research and Education (ITRE) at North Carolina State University (NCSU) recommends one full time TIMs Technician per 100 buses. 919 buses/100 = 9 full time positions.
TIMS is used by the Wake County Public School System (WCPSS) to route 877 buses for 2007-08. This translates into 4,565 runs per day with 60,474 (am and pm) stops. In addition, there are 2,045 special needs stops tracked in TIMs. WCPSS is transporting 70,000 students.
The 2008-09 school year will see an increase of 40 buses adding a minimum of 100 additional runs per day. On the chart below is bus routing and staffing data from other school districts within the state:
Number of Buses
Students Transported
TIMSTechnicians
Charlotte-Mecklenburg 1,250 86,595 9 Durham County 276 28,000 5 Cumberland County 500 30,000 7
Base 01.6550.056.175.0225.0980 SS 01.6550.056.211.0225.0980 Ret 01.6550.056.221.0225.0980 Hosp 01.6550.056.231.0225.0980
$ 89,433 State 464 Dental 02.6550.706.234.0225.0980
TIMs Technician,Grade 23, Step 10
24.00
$ 464 Local Total: 24.00 $ 89,897
2010-11 MOE Amount Code $ 71,747
5,4895,9198,900
Base 01.6550.056.175.0225.0980 SS 01.6550.056.211.0225.0980 Ret 01.6550.056.221.0225.0980 Hosp 01.6550.056.231.0225.0980
$ 92,055 State $ 464 Dental 02.6550.706.234.0225.0980
TIMs Technician,Grade 23, Step 10
24.00
$ 464 Local Total: 24.00 $ 92,519
Strategic Directive:The validity of the TIMs routing data is critical in assisting the Wake County Public School System to provide the State of North Carolina with accurate student counts and efficient bus routing for the transportation funding formula. The addition of these two positions will ensure that we are fiscally accountable for securing all appropriate funding for WCPSS.
309Systemwide - Fixed Asset Replacement and Captial Budget Wake County Public School System - FY 2008-09 Plan for Student Success
Systemwide - Fixed Ass et Replacement and Capital Budget
INITIATIVE: Forklift Replacement
Replace liquid propane forklift with an electric unit to meet environmental regulations.
Current Funding Formula:
The current units are becoming a maintenance burden due to their age and safety concerns. Work place air quality standards require we eliminate LP gas fumes from the work environment. Industry replacement is recommended at 10 years. Currently, one lift is 12 years old and has maintenance issues. Another will reach replacement age in the fiscal year 2010-11.
Implementation Timeline & Budget Needed:
2008-09 MOE Amount Code Forklift Replacement
Less: one-time cost from previous year
$ 28,430
($28,430)
04.6610.801.541.0229.0965
Total: $ 0 Local
2009-10 MOE Amount Code Less: one-time cost from previous year
04.6580.801.551.0114.0930 Subtotal: $ 495,000 Less: one-time cost from previous year
(307,555)
Local Total: $187,445
311Systemwide - Fixed Asset Replacement and Captial Budget Wake County Public School System - FY 2008-09 Plan for Student Success
Systemwide - Fixed Ass et Replacement and Capital Budget
Strategic Directive:Develop and implement systems and organizational structures to support schools, ensure accountability, and engage the community.
Vehicles are key for support functions to respond to maintenance requests, emergencies, and school staff requirements. Any delay in maintenance or central office support will impact the classroom.
Repairs on these vehicles are nearing or exceeding the value of the vehicles and dependability has been dramatically reduced. The criteria used to determine the timeline for vehicle replacement is a combination of age (10 years), mileage (100,000 miles), safety, condition, repair cost history and functionality. Wake County Government currently attempts to replace vehicles on a four-year cycle.
2010-11 Year Model EstimateE&PPE&PPE&PPE&PPE&PPGS SECURITY E&PPE&PPPURCHASING E&PPPURCHASING E&PPPURCHASING PURCHASING SECURITY E&PPB&G EHASE&PPE&PPE&PPGS E&PPE&PP
04.6580.801.551.0114.0930 Subtotal: $ 571,000 Less: one-time cost from previous year
(495,000)
Local Total: $ 76,000
312 www.wcpss.net
Systemwide - Fixed Ass et Replacement and Capital Budget
INITIATIVE: Fixed Asset Replacement and Capital Budget
Provide design, construction, furniture, and operational equipment funding for the renovation and replacement of Curriculum, Administrative, and Support Services spaces or the design, construction, and furnishing of leased spaces per the long-range administrative space needs assessment and Facility Master Plan, 2001 through 2010, dated Sept. 2002, revised 9/04 and 9/07.
Current Funding Formula:None. Project estimates are based on projected needs and prior budget year expenditures for recurring types of projects.
Implementation Timeline & Budget Needed:
Administrative Buildings The Facility Master Plan, performed by Heery International, Inc., identified a need for an additional 72,000 SF of administrative office spaces by the end of 2010. This projection is based on and revised during interviews with the Superintendent’s Leadership Team. Since 2002, 54,700 additional square footage has been leased and furnished.
CRII 2005-11 Lease 28,000 sf River Oaks Condos 9,100 sf Facilities Desgin & Const. 17,600 sf
The lease for Crossroads expires in 2011. An analysis of existing administrative space and properties owned by the Board was performed in 2007 by Staubach Companies. They recommended consolidation of the sites into a newly purchased building and up fitting the space for all three major administrative services, (3600 Wake Forest Road, Crossroads, and Noble Road). Existing properties could be sold to offset the capital costs of the new space in 2011. Planning and analysis of the consolidation project needs to begin in 2009-10, for construction to start in 2010-11 prior to the end of the Crossroads lease.
Wake Early College Wake Early College’s use of some Wake Technical Colleges’ WakeMed campus spaces will require relocation to a new capital building planned by Wake Technical College in 2009. Space planning and negotiations for uses in the new facility will start in 2008. Facility Modifications at Schools Minor capital construction projects are not included in the long-range capital bond program. These funds provide or replace existing program spaces. Project applications are submitted per Board Policy 7240: A Facilities Modification Form shall be submitted to the facilities planning office for review and approval by the assistant superintendent of Facilities or his/her designee when requesting alterations to facilities in the school system including but not limited to; structural/physical changes to interior spaces, changes in use of spaces, changes to exterior buildings, location of equipment exterior to buildings and changes or modifications to the property or playfields.
School Capital Funds The long-range capital bond program is developed using strict criteria for new capacity, renovations, and systemwide planned replacement projects. It does not address unplanned, urgent needs. The 2007-08 Plan for Student Success does not contain funds for unplanned, urgent needs and such requests. If funded, it would be requested from undesignated fund balance. Typical per year costs for these projects have averaged more than $700,000.
Current capital bond funds from PLAN 2000 or PLAN 2004 have addressed urgent capital project needs in the Deferred Maintenance or Modernization project codes within the bond program. Those funds are exhausted and those projects will be closed in 2007-08. CIP 2006 does not have undesignated project funds available to address urgent health and safety needs if they arise after development of the bond projects. New funds are needed in 2009-10.
313Systemwide - Fixed Asset Replacement and Captial Budget Wake County Public School System - FY 2008-09 Plan for Student Success
Systemwide - Fixed Ass et Replacement and Capital Budget
2008-09 Amount Code Admin. Bldg -Relocation of offices/cubicles
Central Services Complex -Relocate Computer Lab to Bldg. A
Capital funds are guided and prioritized by all four strategic directives. New educational programs that require a capital investment are supported through capital funding. Employees require safe, healthy work environments. By providing long range planning for the capital administrative needs of the district, systems and support functions can provide the services needed for our schools. Finally, planning and finding creative yet fiscal conservative solutions to those challenges is necessary because of the challenges capital budgets face.
1. Focus on Teaching and Learning 2. Retain, Recruit, and Train High Quality Employees 3. Develop and implement systems and organizational
structures to support schools, ensure accountability, and engage the community.
4. Expand fiscal accountability.
315Systemwide - Fixed Asset Replacement and Captial Budget Wake County Public School System - FY 2008-09 Plan for Student Success
Systemwide - Fixed Ass et Replacement and Capital Budget
INITIATIVE: Grounds Equipment Replacement
Current Funding Formula:This requirement was funded at $99,000 last year.
2009-10 Amount Code Mini-Excavator(New - work areas too small for other equipment)
2 Tractors(Replace CY1969 tractors)
4 Mowers (Replace CY2004 mowers)
Less: one-time cost from previous year
$ 40,000
40,000
32,000
(90,000)
04.6580.801.541.0288.830
04.6580.801.541.0288.830
04.6580.801.541.0288.830
Total: $ 38,000 Local
2010-11 Amount Code Three 5-ton tilt trailers (Replace CY1970 trailers)
2 Aerators (Replace CY2000 aerators)
Less: one-time cost from previous year
$ 23,100
10,000
(112,000)
04.6580.801.541.0288.830
04.6580.801.541.0288.830
Total: ($ 78,900) Local
Strategic Directive:
Develop and implement systems and organizational structures to support schools, ensure accountability, and engage the community.
Grounds equipment is critical for support functions to respond to maintenance requests, emergencies, and school staff requirements. Any delay in maintenance or central office support will impact the classroom.
Repairs on these pieces of equipment are nearing or exceeding the value of the equipment and dependability has been dramatically reduced. The criteria used to determine the timeline for equipment replacement is a combination of age (four years and up), safety, condition, repair cost history, and functionality.
We have seen a significant decline in contractor response for emergency snow removal contracts. Therefore we have decided to add plows to a couple of dump trucks in an effort to help minimize any contractor shortfalls during a snow storm.
316 www.wcpss.net
Systemwide - Fixed Ass et Replacement and Capital Budget
INITIATIVE: Wrecker Body
Wreckers to tow school buses are part of the State of North Carolina’s yearly rotating replacement plan.
Current Funding Formula:
The State of North Carolina maintains a listing of all vehicles used for transportation of children and maintenance of school buses. Once a certain mileage level is reached and State funding is available, these vehicles are replaced by the State.
For 2008-09, Wake County Public Schools will receive a wrecker replacement. This replacement is a chassis only. Local Education Associations are required by the State to buy the body and boom for a wrecker when the State replaces the chassis.
Implementation Timeline & Budget Needed:
2008-09 MOE Amount Code Wrecker Body $ 90,000 04.6550.801.551.0225.0980
Total: $ 90,000 Local
2009-10 MOE Amount Code Less:one-time cost from previous year
($90,000) 04.6550.801.551.0225.0980
Total: ($90,000) Local
2010-11 MOE Amount Code Total: $ 0
Strategic Directive:
Safety and security of towed school buses affects students and the general public.
When towing buses on highways, Wake County Public Schools must ensure that buses receive no further damage and that public safety is implemented by using the proper equipment.
317Systemwide - Fixed Asset Replacement and Captial Budget Wake County Public School System - FY 2008-09 Plan for Student Success
Systemwide - Fixed Ass et Replacement and Capital Budget
INITIATIVE: Data Storage
Implementation Timeline & Budget Needed:
District data must be secure, accessible and reliable. Capacity planning by the Technology Services Division (TSD) indicates a need for increased and improved storage capability. The existing EMC enterprise storage platforms, DMX and Clarion, must be expanded and updated to meet the requirements of a growing application pool and dependence on readily available historic data.
Developing and implementing systems and structures to support schools, ensure accountability, and engage the community.
Curriculum Audit:
Recommendation 5: Evaluation – “…provide data for decision making at all levels of the system…” Recommendation 3: Governance – “…establish a framework for accountability regarding curriculum management and related functions of the district.” Recommendation 2: Consistency – “…attain improved internal system connectivity in order to realize the strategic direction for the school system.”
318 www.wcpss.net
Not es
319Commitments by the Board of Education to Programs for Future FundingWake County Public School System - FY 2008-09 Plan for Student Success
INITIATIVE: Wake Early College Satellite Campus
Currently Wake Early College High School has 158 ninth and tenth graders housed in classrooms and office facilities on Wake Tech’s Health and Sciences Campus located at 2901 Holston Lane in Raleigh, NC. Wake Tech has provided facilities for this cooperative partnership school, but appropriate facilities and overall space constraints on the Health Sciences Campus will be difficult as the student body increases to 385 students in 2010. For the 2008-09 school year, Wake Tech partners have suggested housing approximately 80 rising eleventh grade students at their new Northern Campus for 2008-09 and eleventh through thirteenth grade students through 2010-11. Courses and labs that are needed for these students are not currently provided at the Wake Tech Health Sciences Campus.
Implementation Timeline & Budget Needed:
Maintaining an office on the satellite North Campus will be important for student safety and for course completion. It would provide students with a “home base” on the campus. Students would need to check in for attendance purposes, for lunch orders, emergencies, and dismissals. Thus, projections for staffing and equipment costs are listed below.
2008-09 MOE Amount Code Clerical Assistant
Lead Teacher Position
Office equipment and furniture
(one-time cost)
6.00
11.00
$ 10,800 826883
2,100116
37,8335,0133,2783,5054,200
232
5,000
Base 02.5400.003.151.0109.0583 SS 02.5400.003.211.0109.0000 Ret 02.5400.003.221.0109.0000 Hosp 02.5400.003.231.0109.0000 Dent 02.5400.003.234.0109.0000
Base 02.5110.001.135.0102.0583 Supp 02.5110.001.181.0102.0583 SS 02.5110.001.211.0102.0000 Ret 02.5110.001.221.0102.0000 Hosp 02.5110.001.231.0102.0000 Dent 02.5110.001.234.0102.0000
02.5400.061.411.0109.0583
Total: 17.00 $73,786 Local
2009-10 MOE Amount Code Clerical Assistant
Lead Teacher Position
Additional teacher positions
Less: one-time cost (Office equipment and furniture)
4.00
1.00
20.00
$ 7,200 551594
1,74092
3,439456298321435
23
64,8938,5995,6226,0638,700
464
(5,000)
Base 02.5400.003.151.0109.0583 SS 02.5400.003.211.0109.0000 Ret 02.5400.003.221.0109.0000 Hosp 02.5400.003.231.0109.0000 Dent 02.5400.003.234.0109.0000
Base 02.5110.001.135.0102.0583 Supp 02.5110.001.181.0102.0583 SS 02.5110.001.211.0102.0000 Ret 02.5110.001.221.0102.0000 Hosp 02.5110.001.231.0102.0000 Dent 02.5110.001.234.0102.0000
Base 02.5110.001.135.0102.0583 Supp 02.5110.001.181.0102.0583 SS 02.5110.001.211.0102.0000 Ret 02.5110.001.221.0102.0000 Hosp 02.5110.001.231.0102.0000 Dent 02.5110.001.234.0102.0000
Base 02.5110.001.135.0102.0583 Supp 02.5110.001.181.0102.0583 SS 02.5110.001.211.0102.0000 Ret 02.5110.001.221.0102.0000 Hosp 02.5110.001.231.0102.0000 Dent 02.5110.001.234.0102.0000
Total: 10.00 $ 47,270 Local
Board Action:On January 17, 2006, an Instructional Program Precis was presented to the Board of Education. The recommendation for action included the Board’s agreement on naming the school and on approving the implementation grant proposal.
Fiscal Implications:1) State grant money for staff, professional development, materials, and contractual services; 2) system money for staff; and, 3) one time start-up funds to purchase additional equipment, etc. from local funds.
Commitments by the Board of Education to Programs for Future Funding
320 www.wcpss.net
INITIATIVE: Magnet Schools - This case includes the savings to be realized by phasing out four existing magnet school programs over a three year period, and the costs for adding two magnet schools in 2009-10 with the planning year beginning 2008-09.
Current Funding Formula:
An average is used for this case, as program themes are not known at this time. An average of 69 Months of Employment (MOE) is allocated to each of our current magnet programs with high schools receiving a larger percentage per school. An average cost of $10,250 is spent on essential staff training per magnet school. The average per school allotment for instructional supplies is $3,308.
Implementation Timeline & Budget Needed:
We anticipate the addition of two magnet schools in the 2009-10 school year. To this end, the 2008-09 year will be a planning year requiring only the magnet coordinator position and staff training monies. Full implementation will take effect in the 2009-10 school year. The school year 2009-10 will be the planning year for the third anticipated magnet school; and it is likely that the school will be included in the 2010-13 MSAP grant application for full implementation.
Four existing magnet school programs will be phased out over a three year period as approved by the Board of Education.
Base 02.6110.856.131.0164.0000 Supp 02.6110.856.181.0164.0000 SS 02.6110.856.211.0164.0000 Ret 02.6110.856.221.0164.0000 Hosp 02.6110.856.231.0164.0000 Dent 02.6110.856.234.0164.0000
Staff Training x 2 new magnet schools(Recurring)
Instructionalsupplies x 2 new magnet schools (Recurring)
$ 20,500
6,616
02.5110.856.312.0164.0825
02.5110.856.411.0164.0825
20.00 $121,106 New Magnet Schools Planning Olds Magnet Teacher Positions
(2.00) ($6,489) (496)(531)(840)
($8,356)
Base 02.5110.001.121.0164.0000 SS 02.5110.001.211.0164.0000 Ret 02.5110.001.221.0164.0000 Hosp 02.5110.001.231.0164.0000 Local
Lincoln Heights Magnet Teacher Assistant Positions
Wake Forest Instructional Supp
Root Elem Training
(2.00)
(11.00)
(7.00)
($6,489) (1,720)
(628)(671)(840)
(92) ($10,440)
($35,695) (2,731)(2,920)(4,620)
($45,966)
($4,730) (362)(387)(253)
($5,732)
($13,832) (1,058)(1,131)(2,940)
(162)($19,123)
($4,104)
($3,000)
Base 02.5110.001.121.0164.0000 Supp 02.5110.001.181.0164.0000 SS 02.5110.001.211.0164.0000 Ret 02.5110.001.221.0164.0000 Hosp 02.5110.001.231.0164.0000 Dent 02.5110.001.234.0164.0000 Local
Base 02.5110.001.121.0164.0000 SS 02.5110.001.211.0164.0000 Ret 02.5110.001.221.0164.0000 Hosp 02.5110.001.231.0164.0000 Local
Supp 02.5110.001.181.0164.0000 SS 02.5110.001.211.0164.0000 Ret 02.5110.001.221.0164.0000 Dent 02.5110.001.234.0164.0000 Local
Base 02.5110.856.142.0164.0000 SS 02.5110.856.211.0164.0000 Ret 02.5110.856.221.0164.0000 Hosp 02.5110.856.231.0164.0000 Dent 02.5110.856.234.0164.0000 Local
2009-10 MOE Amount Code Magnet Teacher positions x 2 schools(Recurring)
1 Magnet Coordinator position - planning year for school #3 (Recurring)
138.00
10.00
$474,62962,89141,12044,34560,030
3,202$686,217
$ 34,393 4,5572,9803,2134,350
232$ 49,725
Base 02.5110.001.121.0164.0000 Supp 02.5110.001.181.0164.0000 SS 02.5110.001.211.0164.0000 Ret 02.5110.001.221.0164.0000 Hosp 02.5110.001.231.0164.0000 Dent 02.5110.001.234.0164.0000 Total
Base 02.6110.856.131.0164.0000 Supp 02.6110.856.181.0164.0000 SS 02.6110.856.211.0164.0000 Ret 02.6110.856.221.0164.0000 Hosp 02.6110.856.231.0164.0000 Dent 02.6110.856.234.0164.0000 Total
Commitments by the Board of Education to Programs for Future Funding
321Commitments by the Board of Education to Programs for Future FundingWake County Public School System - FY 2008-09 Plan for Student Success
Commitments by the Board of Education to Programs for Future Funding
2009-10 MOE Amount Code Staff Training for school #3(Recurring)
Instructionalsuppliesfor school #3 (Recurring)
$ 10,250
3,308
02.5110.856.312.0164.0825
02.5110.856.411.0164.0825
148.00 $749,500 New Magnet Schools Planning Olds Magnet Teacher Positions
(4.00) ($13,760) (1,053)(1,135)(1,740)
($17,688)
($1,824) (140)(150)
(92) ($2,206)
Base 02.5110.001.121.0164.0000 SS 02.5110.001.211.0164.0000 Ret 02.5110.001.221.0164.0000 Hosp 02.5110.001.231.0164.0000 Local
Supp 02.5110.001.181.0164.0000 SS 02.5110.001.211.0164.0000 Ret 02.5110.001.221.0164.0000 Dent 02.5110.001.234.0164.0000 Local
Lincoln Heights Magnet Teacher Positions
(12.00) ($41,280) (3,158)(3,406)(5,220)
($53,064)
($5,472) (419)(451)(276)
($6,618)
Base 02.5110.001.121.0164.0000 SS 02.5110.001.211.0164.0000 Ret 02.5110.001.221.0164.0000 Hosp 02.5110.001.231.0164.0000 Local
Supp 02.5110.001.181.0164.0000 SS 02.5110.001.211.0164.0000 Ret 02.5110.001.221.0164.0000 Dent 02.5110.001.234.0164.0000 Local
Lincoln Heights Magnet Teacher Assistant Positions:
(8.00) ($16,280) (1,245)(1,343)(3,480)
(186)($22,534)
Base 02.5110.856.142.0164.0000 SS 02.5110.856.211.0164.0000 Ret 02.5110.856.221.0164.0000 Hosp 02.5110.856.231.0164.0000 Dent 02.5110.856.234.0164.0000
Wake Forest Magnet Teacher Positions
(26.00)
(5.00)
($89,440) (6,842)(7,379)
(11,310)($114,971)
($17,200) (17,096)
(2,624)(2,829)(2,175)
(713)($42,637)
Base 02.5110.001.121.0164.0000 SS 02.5110.001.211.0164.0000 Ret 02.5110.001.221.0164.0000 Hosp 02.5110.001.231.0164.0000 Local
Base 02.5110.001.121.0164.0000Supp 02.5110.001.181.0164.0000 SS 02.5110.001.211.0164.0000 Ret 02.5110.001.221.0164.0000 Hosp 02.5110.001.231.0164.0000 Dent 02.5110.001.234.0164.0000 Local
Base 02.5110.001.121.0164.0000 SS 02.5110.001.211.0164.0000 Ret 02.5110.001.221.0164.0000 Hosp 02.5110.001.231.0164.0000 Local
Base 02.5110.001.121.0164.0000 Supp 02.5110.001.181.0164.0000 SS 02.5110.001.211.0164.0000 Ret 02.5110.001.221.0164.0000 Dent 02.5110.001.234.0164.0000 Local
(65.00) ($308,387) Phase-Outs Total: 83.00 $441,113 Local
Base 02.5110.001.121.0164.0000 Supp 02.5110.001.181.0164.0000 SS 02.5110.001.211.0164.0000 Ret 02.5110.001.221.0164.0000 Hosp 02.5110.001.231.0164.0000 Dent 02.5110.001.234.0164.0000
Base 02.5110.001.121.0164.0000 SS 02.5110.001.211.0164.0000 Ret 02.5110.001.221.0164.0000 Hosp 02.5110.001.231.0164.0000 Local
Supp 02.5110.001.181.0164.0000 SS 02.5110.001.211.0164.0000 Ret 02.5110.001.221.0164.0000 Dent 02.5110.001.234.0164.0000 Local
Lincoln Heights Magnet Teacher Positions
(23.00) ($83,858) (6,415)(6,918)
(10,235)($107,426)
($11,109) (850) (916) (529)
($13,404)
Base 02.5110.001.121.0164.0000 SS 02.5110.001.211.0164.0000 Ret 02.5110.001.221.0164.0000 Hosp 02.5110.001.231.0164.0000 Local
Supp 02.5110.001.181.0164.0000 SS 02.5110.001.211.0164.0000 Ret 02.5110.001.221.0164.0000 Dent 02.5110.001.234.0164.0000 Local
Lincoln Heights Magnet Teacher Assistant Positions
(15.00) ($31,440) (2,405)(2,594)(6,675)
(348)($43,462)
Base 02.5110.856.142.0164.0000 SS 02.5110.856.211.0164.0000 Ret 02.5110.856.221.0164.0000 Hosp 02.5110.856.231.0164.0000 Dent 02.5110.856.234.0164.0000 Local
322 www.wcpss.net
Commitments by the Board of Education to Programs for Future Funding
2010-11 MOE Amount Code Wake Forest Magnet Teacher Positions
(6.00) ($21,876) (1,674)(1,805)(2,670)
($28,025)
($2,898) (222)(239)(138)
($3,497)
Base 02.5110.001.121.0164.0000 SS 02.5110.001.211.0164.0000 Ret 02.5110.001.221.0164.0000 Hosp 02.5110.001.231.0164.0000 Local
Supp 02.5110.001.181.0164.0000 SS 02.5110.001.211.0164.0000 Ret 02.5110.001.221.0164.0000 Dent 02.5110.001.234.0164.0000 Local
Wake Forest Coordinator Position
(5.00) ($18,229) ($2,415)
(1,579)(1,703)(2,225)
(116)($26,267)
Base 02.6110.856.131.0164.0000 Supp 02.6110.856.181.0164.0000 SS 02.6110.856.211.0164.0000 Ret 02.6110.856.221.0164.0000 Hosp 02.6110.856.231.0164.0000 Dent 02.6110.856.234.0164.0000 Local
Root Magnet Teacher Positions
(5.00)
(5.00)
($18,229) (1,395)(1,504)(2,225)
($23,353)
($2,415) (170)(199)(116)
($2,900)
($18,229) (2,415)(1,579)(1,703)(2,225)
(116) ($26,267)
Base 02.5110.001.121.0164.0000 SS 02.5110.001.211.0164.0000 Ret 02.5110.001.221.0164.0000 Hosp 02.5110.001.231.0164.0000 Local
Supp 02.5110.001.181.0164.0000 SS 02.5110.001.211.0164.0000 Ret 02.5110.001.221.0164.0000 Dent 02.5110.001.234.0164.0000 Local
Base 02.6110.856.131.0164.0000 Supp 02.6110.856.181.0164.0000 SS 02.6110.856.211.0164.0000 Ret 02.6110.856.221.0164.0000 Hosp 02.6110.856.231.0164.0000 Dent 02.6110.856.234.0164.0000 Local
(67.00) ($316,629) Phase-Outs Total: (8.00) ($6,676) Local
Board Action:
All magnet schools were reviewed during the 2006-07 school year at the request of the Board of Education to determine how well each magnet school is aligned with the objectives set forth for Magnet Programs: 1. Reduce high concentrations of poverty; 2. Maximize use of school facilities; and 3. Provide expanded educational opportunities. A review of the data was conducted to determine how well each school currently aligns with the magnet objectives, and to determine if action steps could be taken to improve a school’s alignment with the objectives.
The results of the review and staff recommendations were presented to the Board of Education. Magnet program phase-out plans were developed and presented to the Board of Education Committee of the Whole and on August 7th, 2007 the Board of Education voted to discontinue Magnet Programs at four existing magnet schools.
Curriculum Management Audit:
Recommendation 1: A1.6 Cost/benefit analysis of magnet programs. Consider recommendations of 2007 study.
323Commitments by the Board of Education to Programs for Future FundingWake County Public School System - FY 2008-09 Plan for Student Success
Commitments by the Board of Education to Programs for Future Funding
INITIATIVE: North Garner Middle School Magnet Status
Implementation Timeline & Budget Needed:
2008-09 MOE Amount Code North Garner Middle School - Magnet Teacher Positions
Base 02.5110.001.121.0164.0000 Supp 02.5110.001.181.0164.0000 SS 02.5110.001.211.0164.0000 Ret 02.5110.001.221.0164.0000 Hosp 02.5110.001.231.0164.0000 Dent 02.5110.001.234.0164.0000
Total: (50.00) ($234,973) Local
2009-10 MOE Amount Code $ 0
Total: $ 0
2010-11 MOE Amount Code $ 0
Total: $ 0
Board Action:
On April 8, 2008 the Board of Education approved the removal of 50 months of employment allocated to North Garner Middle school through Magnet Programs. North Garner Middle is a former Magnet School and is no longer eligible due to 2006-2007 year- round conversion of school. All Magnet students that began in 6th
grade will complete the 9th grade in 2007-2008; and Magnet Teacher months are no longer applicable at this site.
324 www.wcpss.net
Not es
325New Programs or Increased Funding to Existing ProgramsWake County Public School System - FY 2008-09 Plan for Student Success
New Programs or Increased Funding to Exist ing Programs
INITIATIVE: Alternative Schools Capacity and Space
Increase space and capacity for services in alternative schools and programs. This includes two classes for the over-aged “Boosters” program in 2008-09 and 2009-10 and includes a class to assess students arriving into the Wake County Public School System (WCPSS). Year 2010-11 increases capacity for Longview by adding a therapeutic component to bridge school-based service and private day treatment at the middle and high school level.
Implementation Timeline & Budget Needed:
2008-09 MOE Amount Code Increase teachers for Middle School services for overage students
20.00 $ 64,890 8,5905,6216,0118,400
464$ 93,976
Base 02.5310.001.121.0108.0820 Supp 02.5310.001.181.0108.0820 SS 02.5310.001.211.0108.0820 Ret 02.5310.001.221.0108.0820 Hosp 02.5310.001.231.0108.0820 Dent 02.5310.001.234.0108.0820
Total
Total: 20.00 $ 93,976 Local
2009-10 MOE Amount Code Increase teaching services to include assessment facility for students entering the district
10.00 $ 34,390 4,5602,9803,2134,350
232$ 49,725
Base 02.5310.001.121.0108.0820 Supp 02.5310.001.181.0108.0820 SS 02.5310.001.211.0108.0820 Ret 02.5310.001.221.0108.0820 Hosp 02.5310.001.231.0108.0820 Dent 02.5310.001.234.0108.0820
Total
Total 10.00 $ 49,725 Local
Strategic Directive:
Systems and Organizations: Increases in these alternative schools and programs assist typical schools as they face increasing numbers of students with mental illness and who now reside in community based homes and/or group homes as a result of deinstitutionalization. The expansion of these programs provides the opportunity to assess long-term district needs and develop programs that provide services that cannot be provided in typical schools.
Curriculum Management Audit:
Recommendation 1: A2.1 Consistency: develop and implement a school wide effort to deliver alternative services to regular and special education students.
2010-11 MOE Amount Code Increase teaching services to be included in collaborativetherapeutic settings within the Public Separate School Setting
43.00 $156,778 20,89813,59214,65819,135
998$226,059
Base 02.5310.001.121.0108.0820 Supp 02.5310.001.181.0108.0820 SS 02.5310.001.211.0108.0820 Ret 02.5310.001.221.0108.0820 Hosp 02.5310.001.231.0108.0820 Dent 02.5310.001.234.0108.0820
Total
Increase teaching assistant services to be included in collaborativetherapeutic settings within the Public Separate School Setting
43.00 $107,5008,2248,869
19,135998
$144,726
Base 02.5310.001.141.0108.0820 SS 02.5310.001.211.0108.0820 Ret 02.5310.001.221.0108.0820 Hosp 02.5310.001.231.0108.0820 Dent 02.5310.001.234.0108.0820
Total
Include Crisis support to collaborative therapeutic settings within the Public Separate School Setting
23.00 $ 83,858 11,109
7,2657,835
10,235464
$120,766
Base 02.5310.007.131.0108.0820 Supp 02.5310.007.181.0108.0820 SS 02.5310.007.211.0108.0820 Ret 02.5310.007.221.0108.0820 Hosp 02.5310.007.231.0108.0820 Dent 02.5310.007.234.0108.0820
Total
Total: 109.00 $491,551 Local
326 www.wcpss.net
New Programs or Increased Funding to Exist ing Programs
INITIATIVE: English as a Second Language (ESL) Academy
Implementation Timeline & Budget Needed:
2008-09 MOE Amount Code Additional MOE:
(recurring) 30.00 $ 97,340
12,8988,433
9,017 12,600
696
Base 03.5270.104.121.0132.0000 Supp 03.5270.104.181.0132.0000 SS 03.5270.104.211.0132.0000 Ret 03.5270.104.221.0132.0000 Hosp 03.5270.104.231.0132.0000 Dent 03.5270.104.234.0132.0000
Total: 30.00 $ 140,984 Federal
2009-10 MOE Amount Code Total: $ 0
2010-11 MOE Amount Code Total: $ 0
Strategic Directive:
Nearly a third (31 percent) of ninth grade Limited English Proficient (LEP) students in Wake County Public Schools (WCPSS) are currently over age for their grade level (compared to 7 percent of the entire ninth grade population), and have an average age of 17. Anecdotal data collected from WCPSS teachers suggests that students remaining in ninth grade at the age of 17 are destined to either dropout or age-out. In fact, of the 40 ESL high school teachers polled (representing 306 years of teaching experience), they could recall only one 17 year old student who managed to graduate before reaching the age of 21. In order to assist in alleviating this problem, the ESL Department proposes hiring three additional teachers who will work with this group of at-risk students within the ESL Academy. The Academy will be based at three centrally located high schools which currently have the highest concentration of LEP students (Cary HS, Garner HS, and Millbrook HS). A course of study for the ESL Academy will be created using the latest research on such programs available from the Center of Applied Linguistics, the NC Standard Courses of Study, along with certain features of the numerous programs currently operating within the state of North Carolina.
Curriculum Management Audit:
Recommendation 1 challenges WCPSS educators to eliminate the achievement gap between ethnic and socioeconomic groups as well as provide equal access to comparable programs, services, and opportunities to impact student success. Through intensive language development, our department hopes to:
Improve graduation rates for LEP students Improve test scores for LEP students—including Adequate Yearly
Progress (AYP) for LEPs, End of Course examinations, and Annual Measure of Achievement Objectives Decrease drop-out rates for LEP students who have fallen below grade level
Legal Implications (in any):
The ESL Academy is consistent with the demands of No Child Left Behind (NCLB), which requires that LEP students have the same access to North Carolina’s Standard Course of Study as their English speaking peers. (Also see the case Lau vs. Nichols.) The ESL Academy will insure that this happens.
327New Programs or Increased Funding to Existing ProgramsWake County Public School System - FY 2008-09 Plan for Student Success
New Programs or Increased Funding to Exist ing Programs
INITIATIVE: Evaluation of Programs - Curriculum Management Audit (CMA)
Implementation Timeline & Budget Needed:Program Evaluation activities: three new staff persons—a director of program evaluation and two senior administrators—would be hired to design a plan for implementing the CMA recommendations. These people would create a systematic plan for evaluation that would require that E&R staff, working with program staff, would begin in the first year of the program: create logic models that describe the program’s activities and goals, identify the data sources and sets needed to measure the program’s implementation and effectiveness, and begin to collect data. The data collection activates would be continued into the second year, providing management feedback of a formative nature. In the third year, E&R staff will conduct a full, formal evaluation, including cost/benefit analyses.
Grade/Course evaluation: the CMA indicated that all instructional programs, including “regular” grade level instruction in all subjects, be evaluated. Such evaluations would enhance consistency of grade level instruction across the district and within individual schools. In order to carry out this recommendation, E&R seeks to add three senior administrators to design and carry out these evaluations. It is unlikely that all evaluations will be conducted annually but this team will create a plan and schedule for evaluations and begin implementing the plan. This evaluation team will be assisted by one evaluation assistant.
Designing/Conducting Training: The CMA assigns responsibility to E&R for the development of training programs in data use and evaluation strategies for all principals, teachers, and other district staff. In order to design and produce the needed training materials, we propose to hire two senior administrators to carry out this training function.
Contact Services: In order to ensure that the evaluation design planning represents the start of the art, including issues related to cost/benefit analysis, we propose to seek contacted assistance for review of staff work at crucial stages of the design of the evaluation planning. These contact services will not be required after the first year.
Finally, one time and recurring costs are required to provide computers, furniture and travel or the staff members proposed here.
2008-09 MOE Amount Code Senior Administrator Band 3, 100%
Strategic Directive 1 is a focus on learning and teaching.
Curriculum Management Audit:
Recommendation 5: A5.3 Establish E&R as a clearinghouse for all assessments and evaluations. A5.4 Assign responsibility for developing and implementing student and program assessment to the E&R Department.
The Curriculum Management Audit Recommendation 5 calls for the establishment of the Evaluation & Research Department as the clearinghouse for all evaluations and assessments; for the E&R Department to provide training on data use for all teachers and administrators; and to evaluate all programs undertaken in the district. These recommendations cannot be implemented without additional resources.
329New Programs or Increased Funding to Existing ProgramsWake County Public School System - FY 2008-09 Plan for Student Success
New Programs or Increased Funding to Exist ing Programs
INITIATIVE: Formative Assessment Specialist
This position will provide technical expertise and support for formative assessments and technical support to schools, central staff, and item writings in the School Accountability team within Evaluation and Research (E&R). The increased number of schools and students assessed with formative assessments and the development of new items and assessments increases the need for this role. The use of formative assessments is encouraged by professional learning communities which are an integral part of the Superintendent’s Strategic Directives. Blue Diamond assessments have been expanded into more elementary, middle, and high schools. These assessments are linked to key courses for new graduation requirements. This specialist will conduct training, provide ongoing technical support, proof new items, and analyze and report data.
Implementation Timeline & Budget Needed:
Strategic Directive:
Number 1: Teaching and learning Number 3: Systems development
Curriculum Management Audit:
Recommendation 5: A5.4 Assign responsibility for developing and implementing student and program assessment to E&R.
Base 01.6720.024.131.0227.0870 SS 01.6720.024.211.0227.0870 Ret 01.6720.024.221.0227.0870 Hosp 01.6720.024.231.0227.0870
12.00 $ 49,300 State $ 4,867
372398232
Supp 02.6720.024.181.0227.0870 SS 02.6720.024.211.0227.0870 Ret 02.6720.024.221.0227.0870 Dental 02.6720.024.234.0227.0870
$ 5,869 Local Total: 12.00 $ 55,169
2009-10 MOE Amount Code Total: $ 0
2010-11 MOE Amount Code Total: $ 0
330 www.wcpss.net
New Programs or Increased Funding to Exist ing Programs
INITIATIVE: Positive Behavior Support (PBS)In 2004, the Superintendent appointed a committee to address concerns regarding the increasing number of disciplinary incidents throughout the System. This committee recommended implementing PBS as a system-wide initiative. The mission of the PBS team is to empower teachers and other adults with the skills needed to improve overall classroom and school climate in order to achieve higher academic performance for all students
Implementation Timeline & Budget Needed:The team of six PBS coaches work with seventy-two schools. There are currently 24 additional schools on the implementation list for the 2008-09 school year. Coaches provide training and support to 12 schools each and there is a need for an additional two positions to support the remaining schools in this critical school improvement process. The Superintendent’s goal is to implement PBS in all schools within three years.
2008-09 MOE Amount Code 2 PBS Coaches(Recurring)
24.00 $ 108,000 12,960
9,2539,8958,400
464
Base 03.6110.103.131.0328.0820 Supp 03.6110.103.181.0328.0820 SS 03.6110.103.211.0328.0820 Ret 03.6110.103.221.0328.0820 Hosp 03.6110.103.231.0328.0820 Dent 03.6110.103.234.0328.0820
Total: 24.00 $ 148,972 Federal
2009-10 MOE Amount Code Total: $ 0
2010-11 MOE Amount Code Total: $ 0
Strategic Directive:Focus on learning and teaching: A school-wide Positive Behavior Support system can enhance a school’s capacity to adopt and sustain effective practices for all students. Quality instructional time is impacted when students display inappropriate behaviors and disrupt learning. The expected impact of PBS in meeting this strategic directive:
Reduce discipline incidents and suspensions. Improve school climate and academic success for all students. Increase staff morale and retention. Improve student attendance. Improve EOC/EOG test scores.
Curriculum Management Audit:
Recommendation 1: Opportunity In order to eliminate the achievement gap, we also must eliminate the short-term/long-term suspension gap. Just as students are taught academic subjects, they must be taught common expectations for behavior, given the opportunity to practice these behaviors, and be reinforced when they are successful. The overriding goal of PBS is to ensure that all students are successful learners in a positive and productive school environment.
Legal Implications (in any):
Senate Bill 906 = (H1032) 115C-391.1(a). March 24, 2005 A BILL TO BE ENTITLED AN ACT TO CLARIFY THE PERMISSIBLE USE OF SECLUSION AND RESTRAINT IN PUBLIC SCHOOLS AND TO PROVIDE FOR TRAINING IN MANAGEMENT OF STUDENT BEHAVIOR. The General Assembly of North Carolina enacts: SECTION 1. Chapter 115C of the General Statutes is amended by adding a new section to read:
"§ 115C-391.1. Permissible use of seclusion and restraint.
(A) It is the policy of the State of North Carolina to:
(1) Promote safety and prevent harm to all students, staff, and visitors in the public schools.
(2) Treat all public school students with dignity and respect in the delivery of discipline, use of physical restraints or seclusion, and use of reasonable force as permitted by law.
(3) Provide school staff with clear guidelines about what constitutes use of reasonable force permissible in North Carolina public schools.
(4) Improve student achievement, attendance, promotion, and graduation rates by employing positive behavioral interventions to address student behavior in a positive and safe manner.
(5) Promote retention of valuable teachers and other school personnel by providing appropriate training in prescribed procedures, which address student behavior in a positive and safe manner.
331New Programs or Increased Funding to Existing ProgramsWake County Public School System - FY 2008-09 Plan for Student Success
New Programs or Increased Funding to Exist ing Programs
INITIATIVE: Title I - Supplemental Educational Services
Implementation Timeline & Budget Needed:
Provide support services for implementing Supplemental Educational Services in up to eight Title I schools.
2008-09 MOE Amount Code Program Support Grade 24 Step 02 + 3%
12.00 $ 33,840 2,5892,7684,200
232
Base 03.6300.050.151.0324.925 SS 03.6300.050.211.0324.925 Ret 03.6300.050.221.0324.925 Hosp 03.6300.050.231.0324.925 Dental 03.6300.050.234.0324.925
Total: 12.00 $ 43,629 Federal
2009-10 MOE Amount Code Total: $ 0
2010-11 MOE Amount Code Total: $ 0
Strategic Directive:
Develop and implement systems and structures to support schools, ensure accountability, and engage the community.
Organizing and monitoring Supplemental Educational Services for eight schools is labor intensive in that records of eligible and serviced students must be maintained, communication with providers must be regular and timely, and monthly attendance and invoice reconciliation must be maintained.
Curriculum Management Audit:
Recommendation 1: OPPORTUNITYMeet students' needs equitably and eliminate the achievement gap
Recommendation 8: ORGANIZATIONClarify roles and responsibilities and increase effectiveness
332 www.wcpss.net
New Programs or Increased Funding to Exist ing Programs
INITIATIVE: Provide a 1% Salary Increase for Non-Certifi ed EmployeesImplementation Timeline & Budget Needed:
Adjust the salary schedules and ranges to provide a 0.5% salary increase.
Employees Affected: Teacher assistants, bus drivers, cafeteria employees, custodians, trades workers, office support personnel, technology staff, central office administrators, transliterators, interpreters, occupational therapists and physical therapists.
New Programs or Increased Funding to Exist ing Programs
INITIATIVE: Term Life Insurance
Offer Employer Paid Basic Group Term Life to eligible full-time employees. Employees pay for additional spouse and/or child(ren).
Implementation Timeline & Budget Needed:
Eligibility is available to the following Wake County Public School System (WCPSS) employees:
Employees enrolled in the Teachers’ and State Employees’ Retirement System.
Permanent full-time employees working 30 hours or more per week.
Employees who are in a job-share position.
Effective Date: 1/1/2009 Rates Guarantee: 3 years Benefit Amount: $10,000 Term Life Rate per employee: $.07 per $1000 or $.70 per employee per month AD&D Rate per employee: $.01 per $1000 or $.10 per employee per month Term Life/AD&D Total $.08 per $1000 or $.80 per employee per month Number of employees: 17,743 Basic Life Monthly: $ 14,194.40 Total Basic Annual Cost: $170,332.80Recurring
Employee Cost for Additional Basic Group Term Life
Effective Date: 1/1/2009 Guarantee Rate: 3 years Spouse Rate per $1000
Other general information:Portability Included; Retirees covered
Guaranteed Issue AmountEmployee $150,000
2008-09 Amount Code $ 0
Total: $ 0
2009-10 Amount Code ER Term Life $ 170,333 02.6610.801.235.0109.0965
Total: $ 170,333 Local
2010-11 Amount Code ER Life Insurance $ 15,000 02.6610.801.235.0109.0965
Total: $ 15,000 Local
Strategic Directive:
Retain, recruit, and train high quality employees.
Competitive benefits package are a necessary component in retention and recruitment of high quality employees
335New Programs or Increased Funding to Existing ProgramsWake County Public School System - FY 2008-09 Plan for Student Success
New Programs or Increased Funding to Exist ing Programs
INITIATIVE: Community Schools Resource Specialist - Senior Administrator
This position will work with principals, area superintendents, and departments to maximize realized benefits to schools participating in Community Schools - Community Use by establishing standards for, and coordinating and managing expenditures of, schools’ budgets.
Current Funding Formula:
Community Services currently operates as an Enterprise Fund.
Implementation Timeline & Budget Needed:
Funding can be reallocated from contract services and additional funding is projected for 2009-11. No additional equipment needs to be purchased since this position will utilize a current workstation used by a Community Services temporary employee.
Add position of Senior Administrator, Community Schools Resource Specialist as of July 1st. This aligns the position with the departmental goal of providing a more timely response and additional assistance to school principals to maximize realized benefits to schools participating in the Community Schools Community Use program.
2008-09 MOE Amount Code Senior Administrator Community Schools Resource Specialist
12.00 $ 60,000 4,5904,9084,200
232
Base 05.7100.704.113.0121.0907 SS 05.7100.704.211.0121.0907 Ret 05.7100.704.221.0121.0907 Hosp 05.7100.704.231.0121.0907 Dent 05.7100.704.234.0121.0907
Total: 12.00 $ 73,930 Enterprise
2009-10 MOE Amount Code Total: $ 0
2010-11 MOE Amount Code Total: $ 0
336 www.wcpss.net
New Programs or Increased Funding to Exist ing Programs
INITIATIVE: Board of Education In-System Travel
To fund 500 miles per month of in-system travel for 9 board members at the current IRS mileage rate of 50.5 cent per mile.
Retaining, recruiting, and training highly quality employees – and developing and implementing systems and organizational structures to support schools, ensure accountability and engage the community.
337Savings - Budget ReductionsWake County Public School System - FY 2008-09 Plan for Student Success
Savings - Budget Reductions
INITIATIVE: Base budget reduction due to student membership fi gures and salary and benefi t adjustments in 2007-08
The 2008-09 Superintendent’s Plan for Student Success is based on a lower starting figure than the $300,744,100 appropriated by Wake County for 2007-08. There are $6.6 million dollars in base budget reductions included in the 2008-09 Plan for Student Success. These are identified on page 27 of the document.
The $15.9M line item reduction on page 19 includes the decrease of $3.3 million directly attributable to actual student membership figures and salary and benefit adjustments being different than projected in the beginning budget.
Pay increase savings $ 1.8 m Teacher positions savings $ 1.2 m Teacher assistant position savings $ 1.0 m Supplementary pay/dental savings $ 0.5 m School supplies/copier/travel savings $ 0.1 m Retirement/hospitalization cost $(1.3 m) Net reduction to base $ 3.3 m
There are two primary reasons the $3.3 million figure is different than the $6.4 million calculated by Wake County staff. The first is the county’s calculation does not adjust for the $1.3 million additional cost for matching benefits rate. The second is the county’s calculation assumes that all local dollars requested are based on a per student calculation. This is not the case. Many of the growth and system-wide cases are tied to other variables such as number of schools, square footage, acreage, mileage, employee count, and inflationary factors.
The 2007-08 Wake County Public School System budget was based upon student growth projections provided by DeJong, Inc., through a contract with the Wake County Government Planning Department, of 8,014 additional students. Actual enrollment at the beginning of 2007-08 did indeed turn out to be some 2,000 fewer students than projected by DeJong, Inc. The 2008-09 base budget has been adjusted accordingly.
Reduction Timeline & Savings:
2008-09 MOE Amount Code Base budget adjustment ($3,286,617) 02.8200.801.399.0109.0000
Total: ($3,286,617) Local
2009-10 MOE Amount Code Total: $ 0
2010-11 MOE Amount Code Total: $ 0
338 www.wcpss.net
Savings - Budget Reductions
INITIATIVE: Lapsed SalariesDuring 2007-08, we budgeted the following positions to be paid from lapsed salaries:
38 teacher assistants 38 bus drivers 35 regular education teachers 0.5 career and technical teachers 29 custodians 20 clerical positions 8 accelerated learning teachers 17 instructional support positions 10 special education teachers 3 assistant principals 3 central services administrators 201.5 total positions or 2,168 months of employment
Based on data gathered through January 2008, we can increase the number of months to be paid from lapsed salaries.
Classroom Teachers paid in program code 001: As of January 2008, there are 1,048 months, or approximately 105 teacher positions vacant in program 001 for classroom teachers. This is 1.5 percent of the months in this program code. As the system grows, the number of positions budgeted from lapsed salaries should also adjust each year, assuming our vacancy ratios remain stable. For 2008-09, we recommend increasing the number of teacher positions in this program code to be paid from lapsed salaries from 35 positions, or 350 months of employment to 700 months or 70 positions. This is midway between the amount budgeted from a lapse in this year’s salaries and the amount of current vacant months.
Custodian Positions paid in program code 003: As of January 2008, there are 256 months or approximately 21 custodial positions vacant. This is 0.3 percent of the months allotted for custodial positions. Historically, we have budgeted 29 custodians from lapsed salary dollars. Based on current vacancy rates, we recommend reducing this to 20 positions or 240 months of employment to be paid by lapsed salary dollars.
Clerical Positions paid in program code 003: As of January 2008, there are 255 months or approximately 25 clerical positions vacant. This is 2.6 percent of the months allotted for clerical school-based support. For 2008-09, we recommend increasing the number of clerical support positions paid from lapsed salaries from 20 positions or 200 months to 25 positions or 250 months of employment.
Reduction Timeline & Savings:
2008-09 MOE Amount Code Increase Teachers to be paid from lapsed salaries by 350 months
DecreaseCustodians to be paid from lapsed salaries by 108 months
Increase school-based Clerical Support to be paid from lapsed salaries by 50 months
($1,071,350) (141,957)
(99,818) (99,248)
(147,000) (8,120)
($1,560,493)
200,76315,05816,42237,800
2,088$272,131
($92,945) (7,102)(7,594)
(21,000) (1,160)
($129,801)
Base 02.5110.001.121.0101.0000 Supp 02.5110.001.181.0101.0000 SS 02.5110.001.211.0101.0000 Ret 02.5110.001.221.0101.0000 Hosp 02.5110.001.231.0101.0000 Dent 02.5110.001.234.0101.0000 Total - Local
Base 01.6540.003.173.0264.0000 SS 01.6540.003.211.0264.0000 Ret 01.6540.003.221.0264.0000 Hosp 01.6540.003.231.0264.0000 Dent 01.6540.003.234.0264.0000 Total – State
Base 02.5400.003.151.0109.0000 SS 02.5400.003.211.0109.0000 Ret 02.5400.003.221.0109.0000 Hosp 02.5400.003.231.0109.0000 Dent 02.5400.003.234.0109.0000 Total - Local
Total: ($1,418,163)
2009-10 MOE Amount Code $ 0
Total: $ 0
2010-11 MOE Amount Code $ 0
Total: $ 0
339Savings - Budget ReductionsWake County Public School System - FY 2008-09 Plan for Student Success
Savings - Budget Reductions
INITIATIVE: Ninth Grade Centers
To remove additional Months of Employment (MOE) for personnel added to provide adequate support to the students and staff assigned to offsite 9th Grade Centers. The offsite ninth grade center at Cary High School will no longer exist in 2008-09.
Current Funding Formula:
Any high school that establishes a 9th Grade Center located off site from the main campus will need the following additional MOE to adequately support the students and staff for the duration of the centers’ existence.
12 MOE Assistant Principal 12 MOE Guidance Counselor 10 MOE Clerical Assistant 5 MOE Media Specialist
Cary High School established an off-campus 9th grade center previously, so a growth case was prepared for their additional MOE prior to the opening of that center. Cary High School’s off-campus 9th
grade center will cease to exist after the 2007-08 school year, therefore the additional MOE will need to be deleted from the budget/allotment, as indicated.
Implementation Timeline & Budget Needed:
2008-09 MOE Amount Code Assistant Principal Cary High School
(12.00) ($52,944) (11,256)
(4,146)(4,434)(4,200)
(232)
Base 02.5400.005.116.0109.0000 Supp 02.5400.005.181.0109.0000 SS 02.5400.005.211.0109.0000 Ret 02.5400.005.221.0109.0000 Hosp 02.5400.005.231.0109.0000 Dent 02.5400.005.234.0109.0000
(12.00) ($77,212) Subtotal GuidanceCounselorCary High School
(12.00) ($46,080) (7,488)(4,098)(4,382)(4,200)
(232)
Base 02.5830.007.131.0146.0000 Supp 02.5830.007.181.0146.0000 SS 02.5830.007.211.0146.0000 Ret 02.5830.007.221.0146.0000 Hosp 02.5830.007.231.0146.0000 Dent 02.5830.007.234.0146.0000
(12.00) ($66,480) Subtotal Clerical Assistant Cary High School
(10.00) ($20,570) (1,574)(1,683)(4,200)
(232)
Base 02.5400.003.151.0109.0000 SS 02.5400.003.211.0109.0000 Ret 02.5400.003.221.0109.0000 Hosp 02.5400.003.231.0109.0000 Dent 02.5400.003.234.0109.0000
(10.00) ($ 28,259) Subtotal Media Specialist Cary High School
(5.00) ($17,695) (2,433)(1,540)(1,646)(2,100)
(116)
Base 02.5810.007.131.0170.0000 Supp 02.5810.007.181.0170.0000 SS 02.5810.007.211.0170.0000 Ret 02.5810.007.221.0170.0000 Hosp 02.5810.007.231.0170.0000 Dent 02.5810.007.234.0170.0000
($25,430) Subtotal Total (39.00) ($ 197,381) Local
340 www.wcpss.net
Savings - Budget Reductions
INITIATIVE: Project Achieve
Reduction Timeline & Savings:
There are currently 32 Project Achieve schools; to maintain equitable distribution of MOE’s, the 11 schools receiving Project Achieve Teacher months are being removed.
Base 01.5330.069.121.0111.0000 Sub Pay 01.5330.069.162.0111.0000 TA Sub 01.5330.069.167.0111.0000 SS 01.5330.069.211.0111.0000 Retire 01.5330.069.221.0111.0000 Hospital 01.5330.069.231.0111.0000 State
Supp 02.5330.069.181.0111.0000 SS 02.5330.069.211.0111.0000 Retire 02.5330.069.221.0111.0000 Dental 02.5330.069.231.0111.0000 Local
Total: (53.50) ($438,544)
2009-10 MOE Amount Code Total: $ 0
2010-11 MOE Amount Code Total: $ 0
Strategic Directive:
Focus on Learning and Teaching Retain, Recruit, and Train High Quality Employees
341Savings - Budget ReductionsWake County Public School System - FY 2008-09 Plan for Student Success
Savings - Budget Reductions
INITIATIVE: Activity Buses
It has been determined that additional activity buses are not needed in the 2008-09 school year. None of the current activity buses meets the mileage or age requirement for replacement.
Reduction Timeline & Savings:
2008-09 Amount Code Activity Buses for Schools ($285,040) 04.6550.801.551.0225.0880
Total: ($285,040) Local
2009-10 Amount Code Total: $ 0
2010-11 Amount Code Total: $ 0
Strategic Directive:
Fiscal Accountability
342 www.wcpss.net
Savings - Budget Reductions
INITIATIVE: Computers and Supplies
One-time savings of computers and supplies purchased for new staff members in the 2007-08 budget request.
Reduction Timeline & Savings:
2008-09 MOE Amount Code Computersand Supplies
($9,600) Supplies 02.6550.706.411.0225.0980
Total: ($9,600) Local
2009-10 MOE Amount Code $ 0
Total: $ 0
2010-11 MOE Amount Code $ 0
Total: $ 0
343Savings - Budget ReductionsWake County Public School System - FY 2008-09 Plan for Student Success
Savings - Budget Reductions
INITIATIVE: Outsourcing of Bus Garage Parts Inventory
The Wake County Public School System (WCPSS) will outsource its parts room inventory in the bus garage. This endeavor will create an immediate influx of cash for the purchase of the existing inventory and let the WCPSS bus maintenance operation focus on their core business of repairing buses.
Reduction Timeline & Savings:A Request for Proposal (RFP) will be developed to provide WCPSS with a range of potential vendors. While a cost savings is the goal of WCPSS, it is expected that this proposal will result in an overall net increase in the first years of implementation. Until more data has been gathered, we are projecting a 10 percent increase over last year’s expenditures for parts, oil, supplies, and tires.
In addition to the savings to be realized by the one-time purchase of the parts inventory, four (4) positions will be cut from the parts room.
We are very early in this process and trying to project three years’ costs with no data is not feasible.
2008-09 MOE Amount Code Outsourcing of parts room inventory
Estimated Savings on positions
(48.00)
$ 221,665
(142,383) (10,892) (11,647) (16,800)
01.6550.056.422.0225.0980
Base 01.6550.056.175.0225.0980 SS 01.6550.056.211.0225.0980 Ret 01.6550.056.221.0225.0980 Hosp 01.6550.056.231.0225.0980
Outsourcing of the garage inventory will provide Wake County Public Schools the fiscal accountability needed for an inventory that continues to grow in size and complexity.
Redefining current staff responsibilities to focus on bus maintenance repairs and accountability of the Oracle Financials instead of the State BSIP program will allow us to reduce our need to add additional personnel to maintain two computer systems. Increased knowledge and cross training of staff to understand WCPSS Financials will enhance our in-house fiscal accountability.
344 www.wcpss.net
Savings - Budget Reductions
INITIATIVE: Perfect Attendance for Bus Drivers and Mechnics
It has been determined that the payment of a monthly perfect attendance bonus does not have any affect on retaining or recruiting of employees.
Absences for mechanics have not decreased and are above industry standards based on data gathered by the Senior Administrator in Maintenance. Absences for bus drivers remain consistent with no significant decreases recorded.
The real-time inventory was determined to be a system that could not meet the required integration with the State Transportation reporting system.
Funds were repurposed during the year to provide contract dollars for TransPar, a Transportation consulting firm that is assisting the Transportation Department in reviewing inventory issues and exploring the option of outsourcing
346 www.wcpss.net
Savings - Budget Reductions
INITIATIVE: Remove Operational Costs for Real Estate Services and meet needs with Existing Capital Improvement Plan (CIP) 2006 bond funds
Remove operational costs for Real Estate Services and meet needs with existing Capital Improvement Plan (CIP) 2006 bond funds.
Reduction Timeline & Savings:
Real Estate Services positions and administrative needs can be met from the CIP 2006 Program Management bond funds. These small adjustments will better align program costs.
2008-09 Amount Code Operational costs for Real Estate Services
($843) 02.6570.801.411.0318.0940
Total: ($843) Local
2009-10 Amount Code Total: $ 0
2010-11 Amount Code Total: $ 0
Strategic Directive:
Develop and implement systems and structures to support schools, ensure accountability and engage the community.
347Savings - Budget ReductionsWake County Public School System - FY 2008-09 Plan for Student Success
Savings - Budget Reductions
INITIATIVE: Balance in Over/Under Budget as of February 1, 2008
The fiscal year for the school system begins July 1st of each year. There is a budget resolution approved for funding by the board of education as of July 1st. Many budget adjustments occur throughout the year. State budgets are adjusted for decisions made by the General Assembly. Grants and contracts are adjusted based on funding awards. Carryover balances are recorded for categorical programs that cross fiscal years. Building program projects are recorded and adjusted based on funding resolutions approved by Wake County Commissioners and Wake County Board of Education. Budgets are adjusted for position and dollar conversions at the school level. All changes to the budget are reported to the Board of Education on a quarterly basis.
There may also be changes to the local budget due to changes in variables that were in place when the budget was created. When this occurs, costs may come in higher or lower than originally anticipated. If there are savings that occur in the local noncategorical budget, the dollars are transferred from the budgeted account to an “over/under” account. In the “over/under” account, no dollars can be spent. The funds are sequestered and will become fund balance at yearend. If costs are higher than anticipated in the local noncategorical budget, funds are transferred out of the “over/under” account into the budget line item needed. All savings and costs are reported to the board on a quarterly basis. If there were a time that cost variances exceed savings, a reallocation of costs from another line item, or a fund balance appropriation would need to be approved by the board of education.
At the time this document was prepared, there was a net savings in the over/under of $3,965,793. These dollars are in the base budget for 2007-08, but will not be needed in the base budget for 2008-09. Therefore, it shows as a savings in this document from one year to the next. The figure of $3,286,617 is shown as a base budget reduction on page 375. The net of $679,176 is shown here.
Reduction Timeline & Savings:
2008-09 MOE Amount Code Balance in Over/Under ($679,176) 02.8200.801.399.0109.0000
Total: ($679,176) Local
2009-10 MOE Amount Code Total: $ 0
2010-11 MOE Amount Code Total: $ 0
348 www.wcpss.net
The Board of Education reduced the base budget for ADM Teachers as one of the steps to adjust the requested amount of county appropriation to the amount approved by Wake County Commissioners for WCPSS for 2008-09.
New Formula becomes:
Calculations based on 10th day student membership. All students in kindergarten through grade 12 are reported. Pre-school students are not included. Distributed through self-allotment until the day prior to Day 1 for Traditional calendar schools. MOE unearned on 10th day removed from payroll or charged to individual school Fund 6.
Middle School – Integer((Grade6+Grade7+Grade8)/22.7)*10
High School – Integer((Grade9+Grade10+Grade11+Grade12)/2.42)
Reduction Timeline & Savings:
2008-09 Base Budget Adjustments
2008-09 MOE Amount Code ADM Teacher $ (1,718,562) Base 02.5110.001.121.0101.0000 (232,006) Supp 02.5110.001.181.0101.0000 (149,218) SS 02.5110.001.211.0101.0000 (159,556) Ret 02.5110.001.221.0101.0000 (228,060) Hosp 02.5110.001.231.0101.0000 (12,598) Dent 02.5110.001.234.0101.0000
Total: $ (2,500,000) Local
INITIATIVE: Increase ADM Teacher formula by 0.20 months of employment K-12
Savings - Budget Reductions
349Savings - Base Budget AdjustmentsWake County Public School System - FY 2008-09 Plan for Student Success
The Board of Education reduced the base budget for Maintenance and Operations based on spending patterns in 2007-08 as one of the steps to adjust from the requested amount of county appropriation to the amount approved by Wake County Commissioners for WCPSS for 2008-09.
The board of Education reduced the base budget for the Utilities based on spending patterns in 2007-08 as one of the steps to adjust form the requested amount of county appropriation to the amount approved by Wake County Commissioners for WCPSS for 2008-09.
Reduction Timeline & Savings:2008-09 Base Budget Adjustments
2008-09 MOE Amount Code Public Utilities – Natural Gas (750,000) 02.6530.802.322.0203.0980
Public Utilities – Water & Sewer (250,000) 02.6530.802.323.0203.0980
Total: (1,000,000) Local
INITIATIVE: Utilities
Savings - Budget Reductions
351Savings - Base Budget AdjustmentsWake County Public School System - FY 2008-09 Plan for Student Success
The Board of Education reduced the base budget for the Technology Division based on spending patterns in 2007-08 as one of the steps to adjust from the requested amount of county appropriation to the amount approved by Wake County Commissioners for WCPSS for 2008-09.
The Board of Education eliminated the base budget for the Recruiting and Signing Bonuses as one of the steps to adjust from the requested amount of county appropriation to the amount approved by the Wake County Commissioners for WCPSS for 2008-09.
Reduction Timeline & Savings:
2008-09 Base Budget Adjustments
2008-09 MOE Amount Code Bonuses $ (457,543) Base 02.5110.858.183.0154.0000 (4,000) SS 02.5110.858.211.0154.0000 (35,003) Ret 02.5110.858.221.0154.0000 (306) Base 02.5110.858.183.0154.0820 (37,428) SS 02.5110.858.211.0154.0820 (327) Ret 02.5110.858.221.0154.0820
Total: $ (534,607) Local
INITIATIVE: Recruiting and Signing Bonuses
Savings - Budget Reductions
353Savings - Base Budget AdjustmentsWake County Public School System - FY 2008-09 Plan for Student Success
The Board of Education reduced the base budget for Mobiles Relocation as one of the steps to adjust the requested amount of county appropriation to the amount approved by Wake County Commissioners for WCPSS for 2008-09.
The Board of Education reduced the base budget for Instructional Supply Allotments to Schools by $2.00 as one of the steps to adjust from the requested amount of county appropriation to the amount approved by Wake County Commissioners for WCPSS for 2008-09.
New Formula becomes:
Each school received dollars for classroom materials. The total allotment is calculated by multiplying the 10th day student membership by the amounts shown below. The total for each grade level and the breakdown between fund 1 and 2 will vary annually.
INITIATIVE: Instructional Supply Allotments to Schools
Savings - Budget Reductions
355Savings - One-time Costs from Fiscal Year 2007-08Wake County Public School System - FY 2008-09 Plan for Student Success
Savings - One-Time Costs fr om Fiscal Year 2007-08
INITIATIVE: Graduation Costs
A $56,889 cost for 2006-07 graduation was posted to 2007-08 in error. Funds were transferred from over/under to cover this one-time adjustment. Dollars can be removed from the base budget for 2008-09.
Savings - One-Time Costs fr om Fiscal Year 2007-08
INITIATIVE: One-time allotment to schools in 2007-08 to adjust Fund 6 Individual School Account
One-time transfer to Leesville Road Middle to cover a fund 6 deficit occurred in 2007-08. These funds were transferred from the over/under. They can be removed from the base budget for 2008-09.
Reduction Timeline & Savings:
2008-09 MOE Amount Code Transfers to Fund 06 ($13,540) 02.8400.801.716.0102.0471
Total: ($13,540) Local
2009-10 MOE Amount Code Total: $ 0
2010-11 MOE Amount Code Total: $ 0
357Savings - One-time Costs from Fiscal Year 2007-08Wake County Public School System - FY 2008-09 Plan for Student Success
Savings - One-Time Costs fr om Fiscal Year 2007-08
INITIATIVE: One-time allotment to schools in 2007-08 for leave, class size, scheduling, and construction issues
Base 02.5110.001.121.0101.0000 Supp 02.5110.001.181.0101.0000 SS 02.5110.001.211.0101.0000 Ret 02.5110.001.221.0101.0000 Hosp 02.5110.001.231.0101.0000 Dent 02.5110.001.234.0101.0000
Base 02.5110.001.121.0102.0000 Supp 02.5110.001.181.0102.0000 SS 02.5110.001.211.0102.0000 Ret 02.5110.001.221.0102.0000 Hosp 02.5110.001.231.0102.0000 Dent 02.5110.001.234.0102.0000
Base 02.5400.005.116.0109.0000 Supp 02.5400.005.181.0109.0000 SS 02.5400.005.211.0109.0000 Ret 02.5400.005.221.0109.0000 Hosp 02.5400.005.231.0109.0000 Dent 02.5400.005.234.0109.0000
Base 02.5400.005.114.0109.0000 Supp 02.5400.005.181.0109.0000 SS 02.5400.005.211.0109.0000 Ret 02.5400.005.221.0109.0000 Hosp 02.5400.005.231.0109.0000 Dent 02.5400.005.234.0109.0000
Base 02.5400.003.151.0109.0000 SS 02.5400.003.211.0109.0000 Ret 02.5400.003.221.0109.0000 Hosp 02.5400.003.231.0109.0000 Dent 02.5400.003.234.0109.0000
Base 02.5860.027.146.0101.0000 SS 02.5860.027.211.0101.0000 Ret 02.5860.027.221.0101.0000 Hosp 02.5860.027.231.0101.0000 Dent 02.5860.027.234.0101.0000
Total: (100.25) ($506,057) Local
358 www.wcpss.net
Savings - One-Time Costs fr om Fiscal Year 2007-08
INITIATIVE: One-time allotment to schools in 2007-08 for Tenth Day Overages
Base 02.5110.001.121.0101.0000 Supp 02.5110.001.181.0101.0000 SS 02.5110.001.211.0101.0000 Ret 02.5110.001.221.0101.0000 Hosp 02.5110.001.231.0101.0000 Dent 02.5110.001.234.0101.0000
Base 02.5110.001.121.0102.0000 Supp 02.5110.001.181.0102.0000 SS 02.5110.001.211.0102.0000 Ret 02.5110.001.221.0102.0000 Hosp 02.5110.001.231.0102.0000 Dent 02.5110.001.234.0102.0000
Base 02.5110.027.142.0101.0000 SS 02.5110.027.211.0101.0000 Ret 02.5110.027.221.0101.0000 Hosp 02.5110.027.231.0101.0000 Dent 02.5110.027.234.0101.0000
Total: (173.85) ($843,884) Local
359Savings - One-time Costs from Fiscal Year 2007-08Wake County Public School System - FY 2008-09 Plan for Student Success
Savings - One-Time Costs fr om Fiscal Year 2007-08
INITIATIVE: One-time allotment to schools in 2007-08 for Title I School Choice
Reduction Timeline & Savings:
2008-09 MOE Amount Code Teacher
Teacher Assistant
Clerical
(11.00)
(10.00)
(1.00)
($39,172) ($5,092) ($3,386) ($3,466) ($4,057)
($255)
($18,563) ($1,420) ($1,453) ($4,097)
($232)
($2,509) ($191)($196)($410)
($23)
Base 02.5110.001.121.0101.0000 Supp 02.5110.001.181.0101.0000 SS 02.5110.001.211.0101.0000 Ret 02.5110.001.221.0101.0000 Hosp 02.5110.001.231.0101.0000 Dent 02.5110.001.234.0101.0000
Base 02.5110.027.142.0101.0000 SS 02.5110.027.211.0101.0000 Ret 02.5110.027.221.0101.0000 Hosp 02.5110.027.231.0101.0000 Dent 02.5110.027.234.0101.0000
Base 02.5400.003.151.0109.0000 SS 02.5400.003.211.0109.0000 Ret 02.5400.003.221.0109.0000 Hosp 02.5400.003.231.0109.0000 Dent 02.5400.003.234.0109.0000
Total: (22.00) ($84,522) Local
2009-10 MOE Amount Code Total: $ 0
2010-11 MOE Amount Code Total: $ 0
360 www.wcpss.net
Savings - One-Time Costs fr om Fiscal Year 2007-08
INITIATIVE: Salary Audit
The state allots resources to the school system in terms of months of employment for classroom teachers, school-based administrators, instructional support positions, and career and technical education teachers. The state allots dollars to the school system for other categorical programs. If either type of allotment is overspent as of June 30 of a fiscal year, the overage must be repaid in the subsequent year budget.
Dollar allotments are not difficult to close out. The months of employment categories are more complicated. In June, Wake County Public School System (WCPSS) must close our fiscal year in order to comply with reporting requirements for end-of-year financial data to North Carolina Department of Public Instruction (NCDPI). The June payroll will typically post on a Friday in mid-June. The budget department then has two to three days to request changes to any transactions in order to make sure we have fully maximized our state programs. We must do these adjustments using the projection of the impact of the June payroll. The actual usage does not post to the state website until after the fiscal year is closed, and it is then too late to correct.
Our goal is to zero out state dollars and months of employment. If we make an error, it is best to “over” use the resources rather than leave a balance. If we “under” use the resources, we leave state dollars unspent, and we use local dollars to pay for things that could have been paid from the state budget. That is a double-cost to the system. If we “over” use the state allotments, the penalty is that we must pay back NCDPI from our local funds for the amount of the overage. This is a single-cost to the system for something that we would have paid from the local budget.
In 2007-08, WCPSS appropriated $305,877 from fund balance as a one-time cost for this type of overage. This was reported in the Comprehensive Annual Financial Report. These funds are not included in the 2007-08 budget as a fund balance appropriation or as an expenditure line item.
There are other salary audit items that are identified and reconciled on a monthly basis. These are over- or under-payments that may occur to employees due to licensure issues, years of experience placement issues, or start and end date calendar issues. As of the time this document was prepared, there was a net cost of $156,944 for mid-year salary audit issues. Funds were transferred from other savings in the over/under to cover the cost. It was reported to the board of education. These dollars will not carry forward into the base budget for 2008-09 and are shown as a savings.
Reduction Timeline & Savings:
2008-09 Amount Code PrincipalAssistant Principal TeacherTeacherTeacherTeacherTeacherTeacherTeacherTeacherTeacherNew Teacher Orientation Re-Employed Retired Teacher Re-Employed Retired Teacher Re-Employed Retired Teacher Teacher-Instructional Support Teacher-Instructional Support Teacher-Instructional Support Teacher-Instructional Support Teacher-Instructional Support Teacher-Instructional Support Teacher-Instructional Support Teacher-Instructional Support II Teacher-Instructional Support II Psychologist Office Support Office Support SupplementSocial Security Social Security Social Security Social Security Social Security Social Security
361Savings - One-time Costs from Fiscal Year 2007-08Wake County Public School System - FY 2008-09 Plan for Student Success
Savings - One-Time Costs fr om Fiscal Year 2007-08
Social Security Social Security Social Security Social Security Social Security Social Security Social Security Social Security Social Security Social Security Social Security RetirementRetirementRetirementRetirementRetirementRetirementRetirementRetirementRetirementRetirementRetirementRetirementRetirementRetirementRetirementRetirementRetirementRetirementRetirementRetirementRetirementRetirementHospitalizationHospitalizationDentalDental
Subtotal: ($462,821) Less: One-time appropriation from fund balance in 2007-08
$305,877
Total Equals: Funds transferred from over/under audit to salary audit for one-time costs in 2007-08
($156,944) Local
362 www.wcpss.net
Savings - One-Time Costs fr om Fiscal Year 2007-08
INITIATIVE: One-time costs for Director of Communications
Remove one-time costs of office furniture, computer, and other one-time costs from previous year for Director of Communications
Reduction Timeline & Savings:
2008-09 Amount Code Remove supply costs for Director of Communications
($6,500) 02.6950.801.411.0120.0907
Total: ($6,500) Local
2009-10 Amount Code $ 0
Total: $ 0
2010-11 Amount Code $ 0
Total: $ 0
363Savings - One-time Costs from Fiscal Year 2007-08Wake County Public School System - FY 2008-09 Plan for Student Success
Savings - One-Time Costs fr om Fiscal Year 2007-08
INITIATIVE: Municipal Collaboration Projects
Reduction Timeline & Savings:
To remove budget for municipal collaboration projects for E-22, Banks Road Elementary, Brier Creek Elementary, E-15, Morrisville Elementary, E-5, and Heritage High.
Unspent balances contributed by other municipalities are reserved in fund balance. They will be appropriated for these projects in future years as approved by the Board of Education.
Focus on Learning and Teaching Retain, Recruit, and Train High Quality Employees
368 www.wcpss.net
Savings - Grants Ending
INITIATIVE: Medicaid Funds
Reduction Timeline & Savings:
Medicaid funds for administrative services are under legislative review and funds are expected to be eliminated.
1. Senate Statute C.S. 115C-47 for Diabetes nurse: Districts are required by State Law to develop and deliver required guidelines regarding diabetes to schools and supervise delivery of services to students.
2. Federal Law 34 C.F.R. Part 104 for Pediatric Nurse: Student requires nursing services as outlined in Federal 504 requirements.
2008-09 Amount Code Staff Development Instructor Employer SS Employer Retirement Contract Services Workshop Expenses Supplies and Materials Food Purchase
369Savings - Grants EndingWake County Public School System - FY 2008-09 Plan for Student Success
Savings - Grants Ending
INITIATIVE: Mentor Wake Grant
Reduction Timeline & Savings:
The Mentor Wake Grant is a federally funded initiative that was awarded for the period November 1, 2004 through September 31, 2007. A no-cost extension of the grant was requested and has been awarded through March 31, 2008. The purpose of the grant is to match one hundred students throughout the Wake County Public School System with school and community-based mentors.
The Risk Pool Grant is a federally funded initiative that was awarded for the 2007-2008 school year. This funding will end as of June 30, 2008. The purpose of the grant is to provide funding for “high needs” special education students in the Wake County Public School System.
2008-09 MOE Amount Code TeacherAssistants
(52.20) ($99,300) ($7,597) ($7,775)
($21,386) ($298)
($1,211) ($102,301)
Base 03.5210.114.142.0136.0000 SS 03.5210.114.211.0136.0000 Retire 03.5210.114.221.0136.0000 Hospital 03.5210.114.231.0136.0000 Wks. Comp 03.5210.114.232.0136.0000 Dental 03.5210.114.234.0136.0000 Contracts 03.5210.114.311.0136.0820
Total: (52.20) ($239,868) Federal
2009-10 MOE Amount Code $ 0
Total: $ 0
2010-11 MOE Amount Code $ 0
Total: $ 0
Strategic Directive:
Strategic Directive # 1: Focus on Learning and Teaching
371Savings - Grants EndingWake County Public School System - FY 2008-09 Plan for Student Success
Savings - Grants Ending
INITIATIVE: Physical Education Program (PEP) Federal Grant - Healthful Living
Reduction Timeline & Savings:
Grant Ends September 30, 2008
2008-09 MOE Amount Code (12.00) ($ 36,980)
(3,523)(3,445)(3,162)
(174)(172)
(5,020)(9,899)
(162,121) (2,200)
(22,991) (6,330)
(16,907) (14,330)
(25,000) (3,000)
(62)(40)
(1,076)(600)
(13,393)
Base 07.6110.349.131.0194.0825.000 Ret 07.6110.349.221.0194.0825.000 SS 07.6110.349.211.0194.0825.000 Hosp 07.6110.349.231.0194.0825.000 Dent 07.6110.349.234.0194.0825.000 Wk. Comp 07.6110.349.232.0194.0825.000 Supp 07.6110.349.181.0194.0825.000 Travel 07.6110.349.332.0194.0825.000 Supplies 07.5110.349.411.0194.0825.000 Printing 07.5110.349.314.0194.0825.000 Cont Svcs. 07.5110.349.311.0194.0825.000 Workshop 07.5870.349.312.0194.0825.000 Supplies 07.5110.349.461.0194.0825.000 Indirect 07.8100.349.392.0194.0925.000 Cont Svcs. 07.6110.349.311.0194.0825.000 Extra Duty 07.6110.349.191.0194.0825.000 Wk. Comp 07.5870.349.232.0194.0825.000 Ret 07.5870.349.221.0194.0825.000 SS 07.5870.349.211.0194.0825.000 TA Sub 07.5870.349.166.0194.0825.000 Sub Pay 07.5870.349.163.0194.0825.000
Total: (12.00) ($330,425) Federal
Strategic Directive:
Focus on Learning and Teaching Retain, Recruit, and Train High Quality Employees
372 www.wcpss.net
INITIATIVE: Carryover Startup Dollars for New Schools
The state allots resources to the school system in terms of months of employment for classroom teachers, school-based administrators, instructional support positions, and career and technical education teachers. The state allots dollars to the school system for other categorical programs. If either type of allotment is overspent as of June 30th of a fiscal year, the overage must be repaid in the subsequent year budget.
Dollar allotments are not difficult to close out. The months of employment categories are more complicated. In June, Wake County Public School System (WCPSS) must close our fiscal year in order to comply with reporting requirements for end-of year financial data to North Carolina Department of Public Instruction (NCDPI). The June payroll will typically post on a Friday in mid-June. The budget department then has two to three days to request changes to any transactions in order to make sure we have fully maximized our state programs. We must do these adjustments using the projection of the impact of the June payroll. The actual usage does not post to the state website until after the fiscal year is closed, and it is too late to then correct.
Our goal is to zero out state dollars and months of employment. If we make an error, it is best to “over” use the resources rather than leave a balance. If we “under” use the resources, we leave state dollars unspent, and we use local dollars to pay for things that could have been paid from the state budget. That is a double-cost to the system. If we “over” use the state allotments, the penalty is that we must pay back NCDPI from our local funds for the amount of the overage. This is a single-cost to the system for something that we would have paid from the local budget.
In 2007-08, WCPSS appropriated $305,877 from fund balance as a one-time cost for this type of overage. This was reported in the Comprehensive Annual Financial Report. These funds are not included in the 2007-08 budget as a fund balance appropriation or as an expenditure line item.
There are other salary audit items that are identified and reconciled on a monthly basis. These are over- or under-payments that may occur to employees due to licensure issues, years of experience placement issues, or start and end date calendar issues. As of the time this document was prepared, there was a net cost of $156,944 for mid-year salary audit issues. Funds were transferred from other savings in the over/under to cover the cost. It was reported to the board of education. These dollars will not carry forward into the base budget for 2008-09 and are shown as a savings.
Reduction Timeline & Savings:
2008-09 Amount Code See Salary Audit Case for detailed information ($462,821)
Subtotal: ($462,821) Less: One-time appropriation from fund balance in 2007-08 $156,944Total Equals: Funds transferred from over/under audit to salary audit for one-time costs in 2007-08 ($305,877) Local
Savings - Fund Balance App ropriation Iss ues
373Savings - Fund Balance Appropriation IssuesWake County Public School System - FY 2008-09 Plan for Student Success
Savings - Fund Balance App ropriation Iss ues
INITIATIVE: Carryforward Purchase Orders
Reduction Timeline & Savings:
To remove one-time budgets for carryover purchase orders from 2006-07.
375Savings - Fund Balance Appropriation IssuesWake County Public School System - FY 2008-09 Plan for Student Success
Savings - Fund Balance App ropriation Iss ues
INITIATIVE: Municipal Collaboration Projects
Reduction Timeline & Savings:
To remove budget for municipal collaboration projects for E-22, Banks Road Elementary, Brier Creek Elementary, E-15, Morrisville Elementary, E-5, and Heritage High.
Unspent balances contributed by other municipalities are reserved in fund balance. They will be appropriated for these projects in future years as approved by the Board of Education.
TMACThreat Management Through Assessment and Counseling
TMHTrainable mentally handicapped
TPAThird Party Administrator
TOWSRFTest of Silent Word Reading Fluency
TPCTeacher Parent Consultant
TRATechnology Resource Associates, Inc.
TRTTechnology Resource Teacher
TSDTechnology Services Division
TTFTransition Training Facilitator
UERSUniform Education Reporting System
UPSUninterruptible Power Supply
USDAUnited States Department of Agriculture
WADEWilson Assessment of Decoding and Encoding
383AcronymsWake County Public School System - FY 2008-09 Plan for Student Success
AcronymsWANWide Area Network
WCBOEWake County Board of Education
WCPSSWake County Public School System
WCSOWake County Sherriff’s Offi ce
WEPWake Education Partnership
WISTWord Identifi cation and Spelling Test
YRYear Round
384 www.wcpss.net
Not es
385GlossaryWake County Public School System - FY 2008-09 Plan for Student Success
Gloss ary
ABC FlexibilityIn 1996, the General Assembly approved a law to give the State Board of Education the authority to implement the ABCs. The ABCs assign more responsibility at the school building level and allow schools fl exibility to use funds as they are most needed at the school.
ABC Incentive AwardTo provide funding in the form of bonuses to teachers and teacher assistants that meet or exceed the expected levels of performance in accordance with the ABCs of Public Education Program.
ABCs of Public EducationThe ABCs of Public Education is a program created by the NC Department of Education to ensure that local school districts are providing a good, basic education to all students. The ABCs has been developing since 1995, and was fi rst implemented in schools K-8. A high school model was introduced in the next year. Some features of the program have always been present although there have been modifi cations to the program virtually every year.
The ABCs measures two different standards:The Growth StandardThe Performance Standard
Academically Gifted (AG)The Academically Gifted program provides an appropriately challenging educational program for students who perform, or show potential for performing, at remarkably high levels of accomplishment when compared to others of their age, experience or environment.
Accelerated Learning Program (ALP)This program includes the development of an individualized learning plan for each student and extended learning time. The ALP will use North Carolina Standard Course of Study in English Language Arts and Mathematics as the basis for its curriculum.
Accrual BasisA basis of accounting in which transactions are recognized at the time they are incurred, as opposed to when cash is received or spent.
Ad Valorem TaxesCommonly referred to as property taxes, are levied on both real and property according to the property’s valuation and the tax rate.
AllotTo divide an appropriation into amounts which may be encumbered or expended during an allotment period.
Allotted ADMAllotted ADM for each LEA is the higher of the fi rst two months total projected ADM for the current year or the higher of the fi rst two months total prior year ADM.
AllotmentAllocation of state and federal funds to Local Education Agencies.
Appropriated Fund BalanceAppropriated fund balance in any fund shall not exceed the sum of cash and investments minus the sum of liabilities, encumbrances, and deferred revenues, as those fi gures stated at the close of the fi scal year next preceding the budget year.
AppropriationA legal authorization to incur obligations and to make expenditures for spe-cifi c purposes. An appropriation is usually limited in amount and as to the time when it may be expended.
Assessed RatioThe ratio at which the tax rate is applied to the tax base.
Assessed ValuationThe valuation set upon real estate and certain personal property by the assessor as a basis for levying property taxes.
AssetResources owned or held by a government, which have monetary value.
386 www.wcpss.net
Gloss aryAttritionA method of achieving a reduction in personnel by not refi lling the positions vacated through resignation, reassignment, transfer, retirement, or means other than layoffs.
Available (Undesignated) Fund BalanceFunds remaining from the prior year which are available for appropriation and expenditure in the current year.
Average Daily Attendance (ADA)Attendance is the presence of a student on days when school is in ses-sion. A student is counted as present only when he/she is actually at school, present at another activity sponsored by the school as part of the school’s program, or personally supervised by a member of staff. The total number of days of attendance for all students divided by the total number of school days in a given period gives the average daily attendance.
Average Daily Membership (ADM)The sum of the number of days in membership for all students in individual school units, divided by the number of school days in the term. Allotments for each LEA will be made on the basis of the higher of the fi rst two months total projected ADM for the current year or the higher of the fi rst two months total prior year ADM.
Base BudgetCost of continuing existing levels of service in the current budget year.
Behavioral SupportA service provided to a special group of students with a variety of problems and circumstances. To be certifi ed as a Behavioral Support class member, each student must fi t all of the following criteria: be under 18, have been diagnosed as emotionally, mentally, or neurologically handicapped, have a history of violent or assaultive behavior against self or others, not already be receiving services appropriate to the child’s needs, and have been involved with juvenile court, or institutionalized.
BondA long-term I.O.U. or promise to pay. It is a promise to repay a specifi ed amount of money (the face amount of the bond) on a particular date (the maturity date). Bonds are primarily used to fi nance capital projects.
Bond Refi nancingThe payoff and re-issuance of bonds, to obtain better interest rates and/or bond conditions.
BudgetA plan proposed by a board of education for raising and spending money for specifi ed school programs, functions, activities, or objectives during a fi scal year.
Budget AmendmentThe primary budget manager would submit a budget amendment when new funds need to be added to the budget or if funds need to be removed from the budget.
Budget ResolutionA resolution adopted by a board of education that appropriates revenues for specifi ed school programs, functions, activities, or objectives during a fi scal year.
Budget TransferThe primary budget manager would submit a budget transfer when funds are transferred between level codes within program.
Budget YearThe fi scal year for which a budget is proposed and a budget resolution is adopted.
Budgetary BasisThis refers to the basis of accounting used to estimate fi nancing sources and uses in the budget. This generally takes one of three forms: GAAP, cash, or modifi ed accrual.
387GlossaryWake County Public School System - FY 2008-09 Plan for Student Success
Gloss aryBudgetary ControlThe control or management of a government in accordance with the approved budget for the purpose of keeping expenditures within the limitations of available appropriations and resources.
Capital AssetsAssets of signifi cant value and having a useful life of several years. Capital assets are also called fi xed assets.
Capital BudgetThe appropriation of bonds or operating revenue for improvements to facili-ties, and other infrastructure.
Capital ImprovementExpenditures related to the acquisition, expansion or rehabilitation of an element of the government’s physical plant; sometimes referred to as infrastructure.
Capital OutlayFixed assets, which have a value of $5,000 or more and have a useful economic lifetime of more than one year.
Capital Outlay FundAppropriations for:a. The acquisition of real property for school purposes, including but
not limited to school sites, playgrounds, athletic fi elds, administrative headquarters, and garages.
b. The acquisition, construction, reconstruction, enlargement, renovations, or replacement of buildings and other structures, including but not limited to buildings for classrooms and laboratories, physical and vocational educational purposes, libraries, auditoriums, gymnasiums, administrative offi ces, storage, and vehicle maintenance.
c. The acquisition or replacement of furniture and furnishings, instructional apparatus, data-processing equipment, business machines, and similar items of furnishings and equipment.
d. The acquisition of school buses as additions to the fl eet.e. The acquisition of activity buses and other motor vehicles.f. Such other objects of expenditure as may be assigned to the capital
outlay fund by the uniform budget format.The cost of acquiring or constructing a new building, or reconstructing, enlarging or renovation of existing building, shall include the cost of all real property and interests in real property, and all plants, works, appurtenances, structures, facilities, furnishings, machinery, and equipment necessary or useful in connection therewith; fi nance charges, the cost of plans, specifi cations, studies, reports, and surveys, legal expenses, and all other costs necessary or incidental to the construction, reconstruction, enlargement or renovation.
Capital ProjectMajor construction, acquisition, or renovation activities, which add value to a government’s physical assets or signifi cantly increase their useful life. Also called capital improvements.
CarryoverFunds appropriated but unspent in the fi rst fi scal year which are brought forward for expenditure in the succeeding fi scal year(s).
Cash BasisA basis of accounting in which a transaction is recognized only when cash is increased or decreased.
Categorical AllotmentsLocal school systems may use this funding to purchase all services necessary to address the needs of a specifi c population or service. The local school system must operate within the allotted funds. These funds may be used to hire personnel such as teachers, teacher assistants, and instructional support personnel or to provide a service such as transportation, staff development, or to purchase supplies and materials. Examples: At Risk Student Services, Transportation, Children with Disabilities.
Categorical FundsA dollar allotment which may be used to fund positions and/or other support such as supplies, materials, etc. for that particular program.
388 www.wcpss.net
Gloss aryCategorical GrantsA grant received from another governmental unit to be used or expended on specifi c programs.
Category I ProjectAcquisition of real property and acquisition, construction, reconstruction, enlargement, renovations, or replacement of buildings and other structures for school system purposes.
Category II ProjectAcquisition or replacement of furniture, furnishings, and equipment.
Category III ProjectAcquisition of school buses, activity buses, and other motor vehicles.
Catalog of Federal Domestic Assistance NumbersA number that is assigned to each federal program for which a grant is awarded. The Catalog of Federal Domestic Assistance contains information for all federal grant programs such as grant authorization, who is eligible to apply, etc.
Charter SchoolsA public school operated by a group of parents, teachers, and/or community members as a semi-autonomous school of choice within a school district operating under a “charter” with the State Board of Education. The fi nal approval on all charters is granted by the State Board of Education. In addi-tion, the charter school must sign a contract with the local board of education laying out the relationship between the charter school and the local board of education. Charter schools are designed to give signifi cant autonomy to individual schools and in turn hold these schools accountable for results.
Co-Curricular Instructional ProgramsExperiences comprised of a group of school-sponsored activities, under the guidance or supervision of qualifi ed adults, designed to provide opportunities for pupils to participate in such experiences on an individual basis, in small groups, or in large groups at school events, public events or a combination of these for such purposes as motivation, enjoyment, and improvement of skills. In practice, participation usually is not required and credit is not given.
Community ServicesActivities that are not directly related to the provision of education for pupils. These include such services as community recreation programs, civic activities, public libraries, programs of custody and care of children, and community welfare activities provided by the local school administrative unit for the community as a whole or some segment of the community.
ContingencyA budgetary reserve set aside for emergencies or unforeseen expenditures not otherwise budgeted.
Contractual ServicesServices rendered to a government by private fi rms, individuals, or other governmental agencies. Examples include utilities, rent, maintenance agreements, and professional consulting services.
Cost Center CodeThe cost center code consists of four numerical digits and specifi es the school, central offi ce department, or central offi ce division of the school sys-tem at which the expenditure is to be incurred.
Current ExpenseThose expenditures of a recurring nature covering services, supplies, equipment, and payments to individuals or other agencies.
Debt ServiceThe cost of paying principal and interest on borrowed money according to a predetermined payment schedule.
Dedicated TaxA tax levied to support a specifi c government program or purpose.
389GlossaryWake County Public School System - FY 2008-09 Plan for Student Success
Gloss aryDefi citThe excess of an entity’s liabilities over its assets or the excess of expenditures or expenses over revenues during a single accounting period.
DepartmentThe basis organizational unit of government which is functionally unique in its delivery of services.
Development-related FeesThose fees and charges generated by building, development and growth in a community. Included are building and street permits, development review fees, and zoning, platting and subdivision fees.
DisbursementThe expenditures of monies from an account.
Discretionary GrantsGrants awarding funds following a competitive review process on a national level. Proposals are reviewed and scored by knowledgeable individuals outside the federal government. Awards are then made to the highest-scoring proposals. There are eligibility requirements for discretionary grant competitions which limit who may compete for a grant.
Distinguished Budget Presentation Awards ProgramA voluntary awards program administered by the Government Finance Offi cers Association to encourage governments to prepare effective budget documents.
Dollar AllotmentsLocal school systems can hire employees or purchase goods for a specifi c purpose, but the local school system must operate within the allotted dollar amount. Examples: Textbooks, Central Offi ce Administration, Teacher Assistants.
Dollar per ADMLEA’s Initial Allotment divided by the allotted ADM for that LEA. Charter Schools receive an amount equal to the state funded dollars per ADM for the LEA in which the school is located or (for new charters) in which the student was previously enrolled.
Dollars per HeadcountFunds generated for school-aged children with special needs divided by the LEA’s April 1 total headcount (not capped). Charter Schools receive an amount equal to the LEA’s state funded dollars per headcount for the LEA in which the child was identifi ed.
DropoutA student who leaves school before graduation or completion of a program of study for any reason except death or transfer to another school. Students drop out of school for many reasons - academic failure, discipline problems, employment, illness, marriage, family instability, and/or dislike of school.
Electronic Management of Assessments, Resources, and CurriculumElectronic management of assessments, resources, and curriculum. It is an instructional management software application developed by the Curriculum and Instruction Department and the Technology Services Division of the WCPSS. The tool is designed to assist teachers in recording and using assessment information to make instructional decisions and differentiate instruction for students. Presently it is used in 36 elementary schools. The software includes a data collection component, web-based elementary report card and links to a variety of resources that assist teachers in the development of lesson plans and assessments. It is to be made available to all elementary school teachers in 2006-07. This software was developed as a result of a recommendation of the Paperwork Reduction Committee.
Employee (or Fringe) Benefi tsContributions made by a government to meet commitments or obligations for employee fringe benefi ts. Included are the government’s share of costs for Social Security and the various pension, medical, and life insurance plans.
EncumbranceThe commitment of appropriated funds to purchase an item or service. To encumber funds means to set aside or commit funds for a specifi ed future expenditure.
390 www.wcpss.net
Gloss aryEnd-of-Course (EOC)The End-of-Course tests are designed to measure students’ knowledge and skills in 10 high school courses in terms of the NC Standard Course of Study, and to determine the extent to which the students are prepared for coursework at the next higher level of study in that subject.
End-of-Grade (EOG)The End-of-Grade tests are designed to measure student achievement of the knowledge and skills of the North Carolina Course of Study for students in grades three through eight.
EnrollmentRepresents the number of pupils registered in the state’s public schools. Once a pupil is initially counted in the enrollment fi gure, he/she remains in that count throughout the school year. Students transferring to the North Carolina public school system from another state or from non-public schools are added to enrollment. Enrollment is not reduced by transfers, withdraw-als, deaths, or midyear graduations. The end of the year enrollment thus shows a higher count than the actual number of students in school. Final enrollment, therefore, should not be compared to fi rst month enrollment.
EntitlementPayments to which local governmental units are entitled, pursuant to an allocation formula determined by the agency providing the monies, usually the state or the federal government.
Entitlement GrantsState grants made in accordance with a formula based on the number of children or students to be served, or on the amount of federal or state money available.
ESEAElementary and Secondary Education Act of 1965. This Act was amended by the Improving America Schools Act 1994.
ExpenditureThe payment of cash on the transfer of property or services for the purpose of acquiring an asset, service, or settling a loss.
ExpenseCharges incurred (whether paid immediately or unpaid) for operations, maintenance, interest, or other charges.
Federal Grant FundAppropriations for the expenditure of federal categorical grants made by the Department of Public Instruction and other federal grants allocated directly to the local school administrative unit. These appropriations are categorical in nature; i.e., programs and services for children of low income families, programs and services designed to eliminate the effects of previous discriminatory practices, etc.
Fiscal PolicyA government’s policy with respect to revenues, spending, and debt management as these relate to government services, programs, and capital investment. Fiscal policy provides an agreed-upon set of principles for the planning and programming of government budgets and their funding.
Fiscal YearThe annual period for the compilation of fi scal operations. The fi scal year begins on July 1 and ends on June 30.
Fixed AssetsAssets of long-term character that are intended to continue to be held or used, such as land, buildings, machinery, furniture, and other equipment.
Formula GrantsState grants made in accordance with a formula based on the number of children or students to be served, or on the amount of federal or state money available.
Full-Time EmployeeFull-time employee is one whose regular workweek is thirty or more hours.
391GlossaryWake County Public School System - FY 2008-09 Plan for Student Success
Gloss aryFull-Time Equivalent (FTE)Sum of part-time positions employed when added together equate to a full-time position used within classifi cation. Example: Two one-half time positions equate to one full-time equivalent position.
FunctionA group of related activities aimed at accomplishing a major service or regulatory program for which a government is responsible.
Function CodeThe function code consists of four numeric digits and describes the purpose for which the activity exists or the type of balance sheet account.
FundAn independent fi scal and accounting entity consisting of cash and other resources together with all related liabilities, obligations, reserves, and equities which are segregated by appropriate accounting techniques for the purpose of carrying on specifi c activities or attaining certain objectives in accordance with established legal regulations, restrictions, or limitations.
Fund BalanceThe excess of the assets of a fund over its liabilities and reserves at the beginning or ending of a fi scal year.
Fund Code The fund consists of two numeric digits. The fund is an independent fi scal and accounting entity with a self-balancing set of accounts. The funding code indicates whether state, federal, or local monies are involved.
Future Use CodeThe future use code consists of three numerical digits for future expansion.
Generally Accepted Accounting PrinciplesGenerally Accepted Accounting Principles. Uniform minimum standards for fi nancial accounting and recording, encompassing the conventions, rules, and procedures that defi ne accepted accounting principles.
General Obligation (G.O.) BondThis type of bond is backed only by the full faith, credit and taxing power of the government.
GoalA statement of broad direction, purpose or intent based on the needs of the community. A goal is general and timeless.
Goal 2008On November 5, 2003, the Wake County Board of Education adopted Goal 2008 aligning its efforts towards achieving the goal and carrying out its mission:
“WCPSS is committed to academic excellence. By 2008, 95 percent of students in grades 3 through 12 will be at or above grade level as measured by the State of North Carolina End-of-Grade or Course tests, and all student groups will demonstrate high growth.
In pursuit of this goal, we will:• Increase challenging educational opportunities for all students.• Increase student participation and success in advanced classes at the high school level.• Increase the percent of 9th grade students graduating from high school within four years.• Recruit, develop, support and retain a highly qualifi ed workforce to ensure student success.• Identify and seek resources necessary to support student success.• Build a consensus of support through community collaboration.”
392 www.wcpss.net
Gloss aryMissionThe Wake County Public School System will educate each student to be a responsible and productive citizen who can effectively manage future challenges.
BackgroundAn eighteen-month community effort led to the development of Goal 2008. More than 1,850 citizens offered priorities, changes and goals for the future through the Voices and Choices community meetings across Wake County. Orage Quarles, the publisher of the News and Observer, and Lynne Garrison, vice-president of corporate communications for Blue Cross and Blue Shield of North Carolina, co-chaired the Voices and Choices project. The results were announced and synthesized during the 2003 Wake Education Summit, attended by more than 850 community, business and parent leaders.
The Wake County Board of Education, working with the school system administration and consulting with the Wake County Board of Commissioners and county staff, worked for six months to fi nalize Goal 2008. The new goal includes grades three through twelve. High academic growth is expected among all groups of students. Advanced and struggling students alike are expected to receive the quality of instruction and resources they deserve in order to make the most of their opportunity for success.
Central to all of WCPSS’s strategies is community partnership and collaboration. It was noted when the goal was set that it will take a high level of community involvement, openness, and support for the Wake County Public School System to meet the challenge it has embraced.
Grade Level Profi ciencyPerformance standards, called achievement levels, are one way that scores on the North Carolina End-of-Course Tests are reported. Students that score at or above level III are considered to be grade level profi cient. Listed below are the four achievement levels:
Level I: Student performing at this level do not have suffi cient mastery of knowledge and skills of the course to be successful at a more advanced level in the content area.
Level II: Students performing at this level demonstrate inconsistent mastery of knowledge and skills of the course and are minimally
•
•
prepared to be successful at a more advanced level in the content area.
Level III: Students performing at this level consistently demonstrate mastery of the course subject matter and skills and are well prepared for a more advanced level in the content area.
Level IV: Students performing at this level consistently perform in a superior manner clearly beyond that required to be profi cient in the course subject matter and skills and are very well prepared for a more advanced level in the content area.
GrantA contribution by a government or other organization to support a particular function. Grants may be classifi ed as either operational or capital, depending upon the grantee.
Growth StandardStudents should achieve at least a year of academic gain for every year of school attendance. The Growth Standard measures the degree to which this happens. Various formulas and measurements have been used to calculate growth and, over the course of the ABCs, these have been modifi ed. Essentially, however, here’s how the process works: A growth prediction is made at the beginning of the school year based on the prior year’s test scores in reading and mathematics. This prediction is then compared with the actual growth by subtracting predicted from actual. If the difference is 0 or greater than the growth standard is met. If the difference is a minus number, then the school has failed to achieve the growth target.
Teachers, teacher assistants and principals receive bonus payments if the school in which they work meet the growth standard. A larger bonus is awarded to those who work in schools that meet the high growth standard.
•
•
393GlossaryWake County Public School System - FY 2008-09 Plan for Student Success
Gloss ary
Handicapped (Children with Disabilities)Mentally retarded, hearing impaired, deaf, speech/language impaired, visually handicapped, autistic, behaviorally/emotionally disturbed, orthopedically impaired, other health impaired, traumatic brain injury, deaf-blind, multi-handicapped, or specifi c learning disabled students who need special education and related services.
HeadcountThis term refers to the process of actually counting the number of pupils who are defi ned as Children with Special Needs or Limited English Profi cient. For federal purposes, children with special needs include only the handicapped. For state purposes, children with special needs include handicapped and pregnant students.
The federal government requires headcounts of children with special needs who have been properly identifi ed, are receiving special education and related services on the headcount day, and have an individual education plan (IEP) or an individualized family service plan (IFSP). The December 1 IDEA Title VI-B Handicapped headcount includes those children ages 3-21 who are being served by LEAs, Charter Schools, or state-operated programs. State law requires an adjusted headcount on April 1 of children ages 5-20 who are being served by LEAs or Charter Schools and ages 3 to Pre-K 5 for Preschool handicapped funds. The April headcount includes additions or deletions to the December 1 headcounts and is used for state funding purposes.
Highly Qualifi ed TeachersElementary school teachers must hold at least a bachelor’s degree, be fully certifi ed/licensed, and demonstrate academic competence in each core area taught (i.e., pass PRAXIS II) by June 30, 2006.
Middle and high school teachers must hold at least a bachelor’s degree, be fully certifi ed/licensed, and demonstrate academic competence in each core
area taught. To be academically competent, teachers must achieve one of the following: hold undergraduate major or equivalent (24 semester hours), pass licensing exam, hold advanced degree or licensure in subject, hold Na-tional Board of Professional Teaching Standards Certifi cation in subject, or complete a competency assessment (option for currently employed teach-ers only) by June 30, 2006.
Teacher assistants paid with Title I funds, hired on or after January 2002, must hold an associate degree, have completed two years of college or have completed a formal academic assessment.
NOTE: According to the NC Department of Public Instruction (NCDPI), federal offi cials have given each state the opportunity to request an extension of the June 30, 2006 deadline. NCDPI has requested the extension. Our information at the time of this publication is that we will not be informed about the status of the extension request until early August 2006.
HourlyAn employee who fi lls a temporary or short-term position. Such employees provide contingency staffi ng for government operations during peak workloads or to address temporary staffi ng needs. Hourly employees are paid on a per-hour basis and receive limited benefi ts.
Hours WorkedThe time for which an employee is entitled to compensation under the FLSA. Compensation is required for the time an employee is required to be on duty, on the employer’s premises or at a prescribed workplace, and for the time the employee is “suffered or permitted” to work, whether or not the employee is requested to do so. Hours worked can include idle time and time spent in incidental activities, as well as in productive labor. For example, if an employer permits an employee to continue working after the end of a shift, the additional hours would be part of hours worked.
394 www.wcpss.net
Gloss ary
I.A.S.A.Improving America Schools Act of 1994 which reauthorizes the Elementary and Secondary Education Act of 1965.
I.D.E.AIndividuals with Disabilities Education Act replaced the EHA Education of Handicapped Act for Title VI-B. Includes Title VI-B and Title VI-B Preschool Handicapped.
Indirect CostA cost necessary for the functioning of the organization as a whole, but which cannot be directly assigned to one service.
InfrastructureThe physical assets of a government.
Initial AllotmentsThe allocation of state and federal funds to LEAs occurring after adjournment of the General Assembly.
Instructional PersonnelInstructional personnel means all classroom teachers, librarians, and also instructional assistants. Counselors who regularly teach any part of the day will be judged to be full-time instructional personnel.
Instructional ProgramsActivities dealing directly with the teaching of pupils, or the interaction between teacher and pupils. Teaching may be provided for pupils in school classroom, in another location such as a home or hospital, and in other learning situations such as those involving co-curricular activities. It may also be provided through some other approved medium such as television, radio, telephone, and correspondence. Included here are the activities of
aides or assistants of any type (clerks, graders, teaching machines, etc.) which directly assist in the instructional process.
Instructional SupportCertifi ed personnel who implement locally designed initiatives which provide services to students who are at risk of school failure as well as the students’ families. It is the intent of the General Assembly that the positions must be used fi rst for counselors, then for social workers and other personnel which have a direct instructional relationship to students or teachers to help reduce violence in the public schools.
Interfund TransfersThe movement of monies between funds of the same governmental entity.
Intergovernmental RevenueFunds received from federal, state and other local government sources in the form of grants, shared revenues, and payments in lieu of taxes.
Interim BudgetIn case the adoption of the budget resolution is delayed until after July 1, the board of education shall make interim appropriations for the purpose of paying salaries and the usual ordinary expenses of the school administrative unit for the interval between the beginning of the fi scal year and the adoption of the budget resolution.
Internal Service ChargesThe charges to user departments for internal services provided by another government agency, such as processing, or insurance funded from a central pool.
395GlossaryWake County Public School System - FY 2008-09 Plan for Student Success
Gloss ary
Lapsing AppropriationAn appropriation made for a certain period of time, generally for the budget year. At the end of the specifi ed period, any unexpected or unencumbered balance lapses or ends, unless otherwise provided by law.
Level CodeThe level code consists of four numerical digits. For schools and instructional programs, the level code specifi es the grade or subject area in the school for which an expenditure is proposed.
LevyTo impose taxes for the support of government activities.
Line-item BudgetA budget prepared along departmental lines that focuses on what is to be bought.
Local Current Expense Fund Appropriations for the current operating expenses of the local school administrative unit other than appropriations included in the state public school fund and the federal grant fund. These appropriations shall be funded by moneys made available to the local school administrative unit by the board of county commissioners, supplemental taxes levied by or on behalf of the local school administrative unit, state money disbursed directly to the local school administrative unit, and other monies made available or accruing to the local school administrative unit for current operating expenses of the public school system.
Materials and SuppliesExpendable materials and operating supplies necessary to conduct departmental operations.
Medicaid – Administrative OutreachAdministrative and outreach services provide an infrastructure in support and the provision of direct services.
Medicaid – Direct ServicesDefi ned in N.C. as evaluation and therapy services in the areas of: occupational therapy, physical therapy, speech therapy, psychological services and audiological services. These are provided directly to students and are documented on their IEP’s.
Modifi ed AccrualThe basis of budgeting for the school system. Expenditures are recognized when encumbered and revenues are recognized when collected.
Modifi ed Zero-Based BudgetingA technique that enables management to identify and analyze what is going to be done, set goals and objectives, make operating decisions, and evaluate work loads and responsibilities during the budgeting process. In zero-base budgeting the entire budget request (current and expansion) can be viewed as a series of supplemental requests to a zero base. The process starts with consideration of impacts, consequences, and levels of service desired. Priorities are fi xed among programs and activities.
Months of EmploymentA unit of employment corresponding to a calendar month. The state allots a certain number of months of employment which can be assigned to a position, or a portion of a position, at the discretion of the LEA. Months of employment pertain to all position allotments which include Vocational Education and School Building Administration. Example: If an LEA is allotted 100 months of employment, that LEA can hire 10 Vocational Education teachers for 10
396 www.wcpss.net
Gloss arymonths; or 8 teachers for 12 months and 1 teacher for 4 months; or any other combination which equals 100 months. Each allotment category must be reviewed for any special restrictions.
Multiple Enterprise FundThe enterprise fund accounts for the operations of the Board’s child nutrition services program, tuition programs, and print shop. The intent is that the costs, including depreciation, of providing food services, tuition programs, and print shop services to the individual schools be partially recovered by user charges.
No Child Left BehindThe federal government instituted the No Child Left Behind legislation, which was signed into law by President Bush in January 2002. The legislation’s primary goal is to insure that ALL students are profi cient in reading, math-ematics, and science by 2014. The law holds states, school districts, and schools accountable for the education of all students and has a variety of different accountability measures.
For StudentsStudent achievement is analyzed by sub-group. There are 10 sub-groups, or targets, that are expected to move incrementally toward the 100% goal. The scores of students in these sub-groups, based on race or ethnicity and risk conditions (limited English profi ciency, disabilities, and poverty) are ana-lyzed separately for reading, mathematics and one other academic indicator (typically, graduation rates for high schools and attendance for elementary and middle schools). If any one sub-group in a school fails to attain the ap-propriate percentage of members profi cient, then the school has failed to achieve Adequate Yearly Progress (AYP) toward the 100% goal.
Each state has the opportunity to establish such conditions as the number of days a student must be enrolled in order for his/her scores to be included, or the size of the sub-group. Thus, comparison from state to state is not pos-
sible. Schools that receive federal funds through Title I, the largest federal program for support of students from poor families, may be sanctioned if they fail to achieve AYP. If, however, a school is not a Title I school, then the sanctions do not apply. Districts can also be sanctioned if the district, as a whole, fails to achieve AYP.
A primary difference between NCLB and the state’s ABCs program is that NCLB does not calculate growth, focusing only on performance. In addition, NCLB does not use average student scores, as ABCs does, in determining the progress of sub-populations. In addition, NCLB does not offer any re-wards or incentives for meeting AYP.
For TeachersNCLB also requires that districts report the number of teachers who fail to achieve Highly Qualifi ed Status. This is in addition to regular state licensure standards and essentially requires that teachers spend the majority of their time teaching in areas/subjects for which they are fully licensed.
North Carolina Course of Study Graduation RequirementsFour Courses of Study2000-2001 One of the 4 graduation courses of study was required of each student en-tering the ninth grade:
• Career Preparation• College Technical Preparation• College University Preparation• Occupational Course of Study
New Exit Standards2006-2007Students (entering the ninth grade) who are following the Career Preparation, College Technical Preparation, or College/University Preparation Course of Study shall meet the following exit standards:• Graduation Project• Scoring at profi ciency (level III or above) on 5 End-of-Course Assessments: English I U. S. History Biology
397GlossaryWake County Public School System - FY 2008-09 Plan for Student Success
Gloss ary Civics and Economics Algebra I
State Board Approves Framework for Core Course of Study (December 8, 2006)2008-2009Students (entering the ninth grade) will follow the proposed core course of study framework. This change will replace the current course of study. Graduates in the Class of 2011 would be the last class to follow the old framework. The new core framework requires a 21 unit core course of study that will include a four-unit endorsement in a specialty area of their choice.
The new core course of study will require:• 4 units of English• 4 units of mathematics• 3 units of science• 3 units of social studies• 2 units of a second language• 1 unit of health/physical education• an endorsement of at least four units in one of the following areas: Career-Technical Education, Arts Education, JROTC, Advanced Placement/IB, Second Language or other (The endorsement is in addition to the 17 specifi ed core courses.)
NCWiseThe North Carolina Windows of Information for Students Education is the new student information system being implemented by the Department of Public Instruction across the State.
Noninstructional SupportSupport positions and nonpersonnel dollars that do not have a direct instructional relationship, such as clerical assistants and custodians.
Non-Programmed ChargesConduit-type (outgoing transfers) payments to other local school administra-tive units or other administrative units in the state or in another state, and transfers from one fund to another fund in the local school administrative unit.
Object CodesThe object code indicates the service or commodity obtained as a result of a specifi c expenditure. Seven major object categories are used in the Chart of Accounts: 100 Salaries 200 Employee Benefi ts 300 Purchased Services 400 Supplies and Materials 500 Capital Outlay 600 Other Objects 700 Transfers
These broad categories are subdivided to obtain more detailed information about objects of expenditures. A three-digit serial number is used to provide detailed information.
Object of ExpenditureAn expenditure classifi cation, referring to the lowest and most detailed level of classifi cation, such as electricity, offi ce supplies, asphalt, and furniture.
ObjectiveSomething to be accomplished in specifi c, well-defi ned, and measurable terms and that is achievable within a specifi c time frame.
ObligationsAmounts which a government may be legally required to meet. They include not only actual liabilities, but also encumbrances not yet paid.
Operating ExpensesThe cost for personnel, materials, and equipment required for a department to function.
398 www.wcpss.net
Gloss aryOperating RevenueFunds that the government receives as income to pay for ongoing operations. It includes such items as taxes, fees from specifi c services, interest earnings, and grant revenues. Operating revenues are used to pay for day-to-day services.
Purchasing and ContractPurchasing and Contract - State agency that controls purchasing supplies and equipment.
Parent Notifi cationWCPSS must provide annual report cards on school performance and teacher quality, as well as information about public school choice options, to parents and the public – giving parents more information than they’ve ever had before.
The report card merges NCLB info with the NC School’s Report Card, and will be available at www.ncreportcards.org.
Part-time EmployeePart-time employee means an employee who works at least one-half of the hours worked by full-time employees in that class of work provided that it is not less than twenty hours per week.
Pay-as-you-go BasisA term used to describe a fi nancial policy by which capital outlays are fi nanced from current revenues rather than through borrowing.
Pay LevelA level between 4-52 found in the NC Public School Personnel State Salary Schedule which corresponds to the actual monthly or annual salary (not including salary supplements) based on the individual’s position and classifi cation. For each position and within each administrator classifi cation, there are several levels.
Pay PeriodThere are twelve pay periods per fi scal year corresponding to the twelve calendar months. The fi rst pay period for the fi scal year is designated as “01” which refers to July, with the designation of “12” for June. The pay period designation correlates to the calendar month in which payment is made.
Performance IndicatorsSpecifi c quantitative and qualitative measures of work performed as an objective of specifi c departments or programs.
Performance MeasureData collected to determine how effectively or effi ciently a program is at achieving its objectives.
Performance StandardThe performance standard is a calculation of the percent of all tests taken in the school that are at or above grade level. Since every test score is considered to be either at or below “grade level” or “profi cient”, it is relatively easy to count all of the tests with profi cient-level scores and then fi gure out what percent of tests these represent.
Schools that attain specifi c levels of profi ciency may be awarded honor titles. For example, a School of Excellence is a school that reached its growth target AND in which 90 percent of tests were at the profi cient level. Similarly, a School of Distinction is one which reached its growth goal AND has at least 80 percent of tests at the profi cient level.
Since fi rst implementation, the ABCs program has been altered and modifi ed to include alternative schools, as well as being changed to fi t better with the federal No Child Left Behind accountability program.
Permanent EmployeePermanent employee means an employee who is either: (a) employed with the expectation of permanent employment, to fi ll a position that is to be permanent if present needs and funds continue; or (b) employed, for at least six full consecutive monthly pay periods within one contract, to replace one or more employees who are on leave of absence without pay. Permanent employees may be employed in a full-time or part-time status.
399GlossaryWake County Public School System - FY 2008-09 Plan for Student Success
Gloss aryPer Pupil AllotmentAn allocation based on a per student basis as determined by the board of education. All dollar amounts are established by grade level and are based on the current year twentieth-day enrollment fi gures.
Per Pupil ExpenditureThe annual current expenditures divided by the fi nal average daily membership for the year.
Planning Allotments The tentative allocation of state and federal funds to LEAs to provide information for budgeting purposes. These allotments occur during March preceding the fi scal year for which the initial allotment will be made.
PositionPositions equate to the full-time equivalent individuals that can be assigned for the employment period represented by the allotment category. For example, a position in the classroom teacher allotment represents an employment period of 10 months, and in the principal allotment category 12 months. The number of full-time equivalent individuals that can be employed is limited to the number of months associated with the positions allotted by the state.
Position AllotmentsThe State allots positions to a local school system for a specifi c purpose. The local school system pays whatever is required to hire certifi ed teachers and other educators, based on the State Salary Schedule, without being limited to a specifi c dollar amount. Each local school system will have a different average salary based on the certifi ed personnel’s experience and education. Example: Teachers, School Building Administration, Instructional Support Personnel.
Primary Budget ManagerThe primary budget managers are all principals and cabinet members. Cabinet members may choose to establish central offi ce administrators as primary budget manager.
Prior-Year EncumbrancesObligations from previous fi scal years in the form of purchase orders, contracts or salary commitments which are chargeable to an appropriation, and for which a part of the appropriation is reserved. They cease to be encumbrances when the obligations are paid or otherwise terminated.
ProgramA group of related activities performed by one or more organizational units for the purpose of accomplishing a function for which the government is responsible.
Program BudgetA budget which allocates money to the functions or activities of a government rather than to specifi c items of cost or to specifi c departments.
Program CodeThe program code consists of three numeric digits. The program describes a plan of activity or a funding for a particular activity. This code allows the unit a framework for classifying expenditures by program to determine cost. For a complete listing of the program codes, please refer to the NC Public Schools Uniform Chart of Accounts.
Program EnhancementPositions allotted for art, music, physical education, dance, drama, and foreign language. Also used to reduce class size.
Program Performance BudgetA method of budgeting whereby the services provided are broken down in identifi able service programs or performance units. A unit can be a department, a division, or a workgroup. Each program has an identifi able service or output and objectives to effectively provide the service. The effectiveness and effi ciency of providing the service by the program report is measured by performance indicators.
Program Revenue (Income)Revenues earned by a program, including fees for services, license and permit fees, and fi nes.
Projected Average Daily MembershipThe process of comparing prior year and current year best continuous three of fi rst four months Average Daily Membership for the coming year. This is the basis of state allotment for many items.
Public School ChoiceA Title I school that doesn’t make AYP for two years in a row is identifi ed for school improvement (SI). The following year, the school must offer transfer
400 www.wcpss.net
Gloss aryoptions to all parents of students in that school, and continue offering choic-es until it makes AYP two years in a row. The district can’t use crowding as a reason for not offering school choice.
WCPSS may designate the schools of choice, but the receiving schools: 1) must not be identifi ed for school improvement, 2) must not be identifi ed as persistently dangerous, 3) must have higher academic performance than the sending school, and 4) may not be new schools.
PurposeA broad statement of the goals, in terms of meeting public service needs, that a department is organized to meet.
Purpose CodePurpose means the reason for which something exists or is used. Purpose includes the activities or actions that are performed to accomplish the objectives of a local school administrative unit. The purpose code consists of four numerical digits and is broken down into a function level at the second digit and, where appropriate, into a sub-function level at the third digit. The fourth digit of the purpose code is not in use at this time expect in rare cases and will be indicated in the chart of accounts.
Reading FirstProgram focuses on implementing proven method of early reading instruc-tion in classrooms. States and districts receive support to apply scientifi cally based reading research and the proven instructional and assessment tools consistent with this research to ensure that all children learn to read well by the end of third grade.
ReserveAn account used either to set aside budgeted revenues that are not required for expenditure in the current budget year or to earmark revenues for a specifi c future purpose.
ReservesReserves are credit balances which record the segregation of assets for some future use and which are, therefore, not available for further appropriation or expenditure.
ResolutionA special or temporary order of a legislative body; an order of a legislative body requiring less legal formality than an ordinance or statute.
ResourcesTotal amounts available for appropriation including estimated revenues, fund transfers, and beginning balances.
RevenueSources of income fi nancing the operations of government.
Revenue BondThis type of bond is backed only by the revenues from a specifi c enterprise or project, such as a hospital or toll road.
Revenue CodesRevenues received by a local education agency are classifi ed by source of revenue by category and/or purpose within each source. The major sources of revenue are: 1. State 2. Federal 3. County Appropriation 4. Supplemental Taxes 5. Other revenues
Rollup BalancesThe fi nancial computer system will check available balances at the program code level rather that at the individual account level when payments are pro-cessed. Expenditures will be allowed as long as funds are available overall in the program. Rollups can be at the level code.
401GlossaryWake County Public School System - FY 2008-09 Plan for Student Success
Gloss ary
SalaryAn employee’s salary includes: (1) the amount of compensation to which the employee is entitled during the year from the salary schedule, (2) the amount of longevity pay, if any, to which the employee is entitled during the year, and (3) the amount of local supplement, if applicable, to which the employee is entitled during the school year.
Salary AuditA verifi cation by the Department of Public Instruction that the amount paid to the individual is in accordance with the certifi ed salary schedule.
SATThe SAT is a national exam designed to measure a student’s chance of suc-cess at the college level.
SchoolAn organizational subdivision of a school system consisting of a group of pupils composed of one or more grade groups, organized as one unit with an assigned principal, or person acting in the capacity of principal, to give instruction of the type defi ned in the NC Standard Course of Study, and housed in a school plant of one or more buildings.
School Improvement PlanAll LEAs must delineate a set of student performance goals aimed at increasing student achievement. These goals shall address specifi c, measurable goals for all student performance indicators adopted by the state board. Locally developed student performance goals must be stated in terms of three-to fi ve-year student performance goals, including annual milestones to measure progress in meeting those goals.
Secondary Budget ManagerSecondary budget managers are assistant principals or a cabinet member may establish central offi ce administrators as secondary budget manager.
Self-Contained Classroom - Exceptional ChildA separate class for exceptional children receiving special education for more than 60 percent of the school day.
Self-Contained - Exceptional ChildA self-contained student refers to an exceptional student who is taught in a separate class by exceptional children teachers for at least 60 percent of his or her instructional day.
Service LeaseA lease under which the lessor maintains and services the asset.
Service LevelServices or products which comprise actual or expected output of a given program. Focus is on results, not measures of workload.
Short Term DisabilityThe length of short-term disability includes two months waiting period and 12 months of benefi ts for a total of 14 months.
Site-based BudgetingA decentralized budget process whereby budget preparation and development are based on individual school (and department) sites.
Source of RevenueRevenues are classifi ed according to their source or point of origin.
State Allotted Positions/Months of EmploymentPositions or months of employment allotted and paid from the State Public School Fund.
State FormulaThe calculations used by the state to fund various allotments to the local education agency. Formulas can be based on number of positions calculated on average daily membership (ADM), months of employment (MOE), or fl at dollar amounts.
State Public School FundAppropriations for the current operating expenses of the public school system from monies made available to the local school administrative unit by the State Board of Education.
402 www.wcpss.net
Gloss aryStudent AccountingThe data collection system regarding student enrollment, membership, attendance, and withdrawal from membership in the public schools. The Student Information Management System (SIMS), or other Uniform Education Reporting System (UERS) compliant systems, are the offi cial means by which this data is reported to the Department of Public Instruction.
SubsistenceSubsistence is an allowance related to lodging, meal costs, and gratuities.
Substitute TeacherSubstitute teacher is a person whose credentials have been evaluated by the local superintendent, who has been determined to be capable of performing substitute teaching duties, and who has been approved by the local board of education.
Supplemental AppropriationAn additional appropriation made by the governing body after the budget year or biennium has started.
Supplemental RequestPrograms and services which departments would like to have added (in priority order) over their target budget, or if revenue received is greater than anticipated.
Supporting ServicesSupporting services are those services that provide administrative, technical, personal, and logistical support to facilitate and enhance instruction. Supporting services exist to sustain and enhance instruction, rather than add entities within themselves.
Tax LevyThe resultant product when the tax rate per one hundred dollars is multiplied by the tax base.
TaxesCompulsory charges levied by a government for the purpose of fi nancing services performed for the common benefi t of the people. This term does not include specifi c charges made against particular persons or property for current or permanent benefi t, such as special assessments.
Teacher Certifi cationArea in which a teacher is qualifi ed and certifi ed to teach.
Tenth Day AdjustmentsAdjustments to specifi c allotments following receipt of actual membership data for the tenth day of school.
TextbooksThe textbook allocation is a state source of funds. The textbook account is a credit balance from the state.
Title IA federally-funded categorical and supplementary program which provides federal assistance to state and local school systems through the Elementary and Secondary Education Act of 1965 (ESEA). The program was reauthorized in 1994, by the Improving America’s Schools Act. Its goals are to help low-achieving children succeed in the classroom, attain grade level profi ciency, and acquire the higher level skills that all children are expected to master.
Title I SchoolA Title I school is one that receives federal Title I funds, which are used to support instructional programs (such as K-5 literacy and preschool), profes-sional development and parental involvement. In Wake County, a school
403GlossaryWake County Public School System - FY 2008-09 Plan for Student Success
Gloss arymust have 35 percent or more children eligible for free or reduced-price lunch to qualify.
Title VIThe purpose of Title VI is to provide formula grants to assist states in developing the assessments required under the No Child Left Behind ESEA legislation, and competitive grants to states to support collaborative efforts with Institutions of Higher Education.
Trainable Mentally HandicappedTrainable mentally handicapped (TMH) refers to a student who is signifi cantly below general cognitive functioning and who has a reduced rate of learning which adversely affects that student’s educational performance.
Transfers In/OutAmounts transferred from one fund to another to assist in fi nancing the services for the recipient fund.
Triangle High FiveBusiness leaders and educators create unique regional consortium to support high schools
Five major Triangle business leaders and fi ve public school systems created a unique public/private sector high school reform initiative designed to increase the number of graduates, reduce the dropout rate, and better prepare students for successful lives after high school. Entitled “High Five: Regional Partnership for High School Excellence,” the fi ve-year, $2.5 million project represents the fi rst collaborative venture for the fi ve major area public school systems.
The partnership, created in April, 2004, is designed to support and enhance public high school performance by developing a regional approach in sharing best practices; facilitating collaboration between school districts, colleges and universities; identifying alternative delivery systems to reach at-risk students and broadening community support.
The regional partnership’s funding comes from The News & Observer Publishing Company, Blue Cross and Blue Shield of North Carolina Foundation, SAS, Progress Energy and Capitol Broadcasting Company. The fi ve Triangle public school systems participating in the program are:
Chapel Hill-Carrboro, Durham County, Johnston County, Orange County and Wake County.
VisionAll students graduating with high school diplomas will be well prepared to pursue higher education and careers of their choice.
Goals• 100 percent graduating high school by 2013• 90 percent completing college tech prep or college university prep course of study by 2009• 80 percent meeting course requirements for UNC system admission by 2009
Initiatives• Facilitate collaboration between the school districts.• Identify best practices in high school reform and collaborate on those practices.• Identify alternative learning environments and course delivery systems and develop standards for them.• Promote partnership with families, communities, businesses, the State Board of Education, and local higher education institutions.• Promote state policy review and modifi cations to support student success.• Identify and obtain fi nancial resources to support reform.
Trust and Agency FundRevenues and expenditures for trust and agency funds as needed by the local education agency to account for trust and agency arrangements such as endowments, funds of individuals held by the School Finance Offi cer, and special funds of individual schools.
Tydings AmendmentFederal law provides that certain federal funds not obligated during the fi rst year of allotment shall remain available for obligation and expenditure for one additional year. Federal grant periods vary. Therefore, each grant must be reviewed to determine if the Tydings Amendment will apply. Since the federal fi scal year begins October 1 and the state fi scal year begins July 1, many grant periods can be active up to 27 months when provisions of the Tydings Amendment are applicable.
404 www.wcpss.net
Gloss ary
Uniform Education Reporting SystemUniform Education Reporting System. The comprehensive system by which LEAs and Charter Schools report data electronically to the Department of Public Instruction. Some components of UERS include SIMS (Student Infor-mation Management System), and expenditure reporting in compliance with the Uniform Chart of Accounts.
Undesignated Fund BalancePortion of the total fund balance available for appropriation which is uncom-mitted at year end.
Unencumbered BalanceThe amount of an appropriation that is neither expended nor encumbered. It is essentially the amount of money still available for future purposes.
Uniform Budget FormatThe State Board of Education, in cooperation with the Local Government Commission, shall cause to be prepared and promulgated a standard budget format for use by local school administrative units throughout the state. The format shall be organized to enable the board of education and the board of county commissioners to accomplish the local fi scal policies embodied in the uniform budget format, facilitate the control and fi scal management of the local school administrative unit, and facilitate the gathering of accurate and reliable fi scal data on the operation of the public school system.
Uniform Chart of AccountsIn 1975, the General Assembly enacted a law requiring a uniform accounting system for all local education agencies effective July 1, 1976. The NC Public Schools Uniform Chart of Accounts is a complete listing of account codes for recording public school expenditures by different dimensions available for LEAs. It classifi es the individual accounts by fund, function, program report code, and object.
Unreserved Fund BalanceThe portion of a fund’s balance that is not restricted for a specifi c purpose and is available for general appropriation.
User ChargesThe payment of a fee for direct receipt of a public service by the party who benefi ts from the service.
Variable CostA cost that increases/decreases with increases/decreases in the amount of service provided such as the payment of a salary.
Waiver for Unavailable CategoriesProvides a separate account into which LEAs may transfer funds to cover the purchases of items (not personnel) not found in the Chart of Accounts for other categories.
WorkweekFor overtime purposes, according to the Fair Labor Standards Act, the work-week is a fi xed and regularly recurring period of 168 hours - seven consecu-tive 24-hour periods. A nonexempt employee is entitled to overtime at time and one-half for all hours worked over 40 in a workweek. It may begin on any day of the week and any hour of the day established by the employer.
405GlossaryWake County Public School System - FY 2008-09 Plan for Student Success
Gloss ary
Year-round EducationReorganization of the school calendar into instructional blocks with vacations distributed across the calendar year so that learning is continuous throughout the year.
Year-round PayAnnual salary distributed in twelve payments for personnel employed less than twelve months in a year-round school.
406 www.wcpss.net
Not es
407IndexWake County Public School System - FY 2008-09 Plan for Student Success
Index2008-09 Board of Education’s Plan for Student Success
IndexSymbols12-Month Position Allotments and 2-Month Teaming Allotments for Year-Round
Middle Schools 232
AABCs of Public Education 12ABC Transfer Policies 165Abstinence Education (AUM) Federal Grant 365Academically Gifted (AG) Teacher Months 192Accounting Support Position for Schools 289Activity Buses 341Allotment Process 127Alternative Schools and Programs 193Alternative Schools Capacity and Space 325Alternatives for Over-Staffi ng 127Amendments 89Analysis of Increase (Decrease) in Months of Employment 132–138Annual Replacement of Support Vehicles 310Anticipated Revenues 98–117Areas 237Area Superintendents 68–74Article 31 - The School Budget and Fiscal Control Act 77Assessed Value and Actual Value of Taxable Property, Wake County 148Assistant Principals 179Athletic Funds 244Audiologists 194Average Daily Membership 146
BBalanced Budget 76Balance in Over/Under Budget as of February 1, 2008 347Base Budget Adjustment/Reduction 337, 348, 349, 350, 351, 354
Base Budget Reduction/Adjustment 337, 348, 349, 350, 351, 354Basis of Presentation - Fund Accounting 92Beginning Teacher Support Program (BTSP) Coordinating Teacher 274Benefi ts Representative 275Board of Education District Map 39Board of Education In-System Travel 336Bridges to Success Network Program 366Budget Activities During FY 2007-08 to Prepare Budget for FY 2008-09 85Budgetary Assumptions 152–165Budget at a Glance 16–17Budget Basis 76Budget by Object Code - Operating Budget 118–125Budget by Object Code History - Operating Budget 172Budget by Purpose Code - Operating Budget 126Budget Cycle 85Budget Department Staff 260Budget Development and Drivers 18Budget Drivers - Impact on the Local Budget 19Budget Flexibility 78Budget Guidelines 82Budget Highlights 20–36Budget Manager Certifi cation Training 35Budget Policies, Wake County Public Schools 78Budget Process Calendar 85Budget Resolution 94–97Bus Dispatch Position 222Bus Drivers 223
CCapital Budget 86Capital Building Fund 33Capital Improvement Plan (CIP) 141–144Capital Improvement Plan, What will it provide? 141Capital Improvements Budget 20Capital Outlay Fund 33Career and Technical Education (CTE) Months of Employment (MOE) 195Carryforward Purchase Orders 373
2008-09 Adopted Plan for Student Success
408 www.wcpss.net
Index2008-09 Board of Education’s Plan for Student Success
Carryover Startup Dollars for New Schools 372Cash Management Policies and Practices 79Central Area Schools 71Changes in Standards / Expectations 169–170Charter Schools 189Charter School Verifi cation Letters 191Cheer Camp and Booking Fees 245Child Nutrition Services (CNS) 224Citizen Involvement 15, 44Classroom Materials, Instructional Supplies, and Equipment 181Classroom Teachers 182Commitments by the Board of Education 18Communications - Advertising 219Communications - Printing and Binding 220Community Relationships 15Community Schools Resource Specialist - Senior Administrator 335Computer Insurance Fund 374Computers and Supplies 342Construction and Crowding Solutions 142Contracted Services for Schools 184Contracted Services to Support Increased User Base and Applications 279Contract Instructional Support Technicians (ISTs) for High Schools 265Conversions 128Conversions that are typically done each year by schools: 128Cost Center Codes 93County Appropriation 81County Appropriation and Fund Balance History 150–151Criminal Record Checks (CRC’s) 276Custodians 280Customer Service Center - Support Position 221
DData Circuits for New Schools 266Data Storage 317Debt Obligation 93Direct Grants Fund 31Distribution of Staff Development Funds 78
District 1 - Northeast Wake County 41District 2 - Southeast Wake County 41District 3 - North Raleigh 42District 4 - East Raleigh 40District 5 - South Central Raleigh 42District 6 - Central Raleigh 40District 7 - West Raleigh / Morrisville 43District 8 - Southern Wake County 43District 9 - Western Wake County 44District and Financial Structure 91–93District and Overlapping Property Tax Rates, Wake County 149District Legal Authority 91District Summary 10Drivers 19
EE-Rate Support Analyst 294Early Hires, Task Management, and Staff Development Dollars for New Schools
238Early Reading First Federal Grant (Project Enlightenment) 367Eastern Area Schools 70, 240Economic Condition and Outlook 14Economy 175Education 176Effi cient and Effective Use of Resources 128Elementary School Openings, 2007-08 7Employees 13Employer Matching Benefi t Rates 152Encumbrance Control 88End-Of-Grade (EOG) EXAMS 12End of Course Results by Subject 2003-2007 168English as a Second Language (ESL) Academy 326English as a Second Language (ESL) Teacher Months of Employment (MOE) 196Enrollment 152EOG Math - Grades 3 through 5 167EOG Math - Grades 6 through 8 167EOG Reading - Grades 3 through 5 166
2008-09 Adopted Plan for Student Success
409IndexWake County Public School System - FY 2008-09 Plan for Student Success
Index2008-09 Board of Education’s Plan for Student Success
EOG Reading - Grades 6 through 8 166Evaluation and Research (E&R) - Printing, Staff Development, Local Travel, and
Supplies 246Evaluation of Programs - Curriculum Management Audit (CMA) 327Exceptional Children Contract Transportation 226Expenditure Control and Approvals 88Expenditures Per Pupil 145Extended Employment for School Counselors 247Extra Duty Budget to Accomodate New Schools 262
FFederal Grant Descriptions and Allotment Formulas 163–164Federal Grants Fund - State 30Field Marking Paint 248File Room Technician 290Finance Structure 91Financial Aid Advisors 249Financial Reporting Recognition 34Financing Risk through Commercial and Self Insurance 299Fiscal Accountability 34Fixed Asset Replacement and Capital Budget 312Flexibility 128Forklift Replacement 309Formative Assessment Specialist 329Fraud Awareness Training 35Fraud Hotline 89Fuel 286Fuel Management System 292Fund Accounting 92Fund Balance-Reserved 80Fund Balance-Unreserved 80Funds Checking 89
GGeographic Facts 175Get To Know the Wake County Public School System 3–15Government Finance Offi cers Association Award 37
Graduation and Rehearsal Facilities 302Graduation Costs 355Graduation Diploma Inserts and Certifi cates 296Grounds Equipment Replacement 315Grounds Maintenance for New Acreage 281Growth - Square Footage and Acreage 280–285Growth Issues 18Growth Requests - Employee Count 269–279Growth Requests - New Schools 232–268Growth Requests - Student Membership 179–231
H“How do we Measure Up?” - Wake County compared to State Averages and Larg-
est 5 LEAs 146High School Intervention Coordinators 250High School Openings, 2007-08 7Historical Comparison of Expenditures Per Pupil (excluding Child Nutrition)
145–146Historical Comparison of Property Tax Levies and Collections, Wake County 149History of Events in the Wake County Public School System 4Housing 175
IImpact of Capital Improvement on the Operating Budget 87In-School Suspension (ISS) Teachers 251Independent Audit Committee 35Instructional Support Technician (IST) 267Instrument Repair 252Integrated Pest Management (IPM) Program 282Interfund Transactions 79Internal Audit Senior Administrator 293Intervention Months of Employment (MOE) 197
KK-5 Curriculum and Instruction Months of Employment (MOE) 199
2008-09 Adopted for Student Success
410 www.wcpss.net
Index2008-09 Board of Education’s Plan for Student Success
LLand Banking 142Lapsed Salaries 338Leases for Mobile / Modular Units 305Level Codes 93Local Current Expense Fund 22Local Literacy Teachers 253Longevity 152
MMagnet Schools 8, 320Maintenance Growth 283Management Information and Reporting 89Market Share 10Media Specialists 200Medicaid Funds 368Membership Trends 147Mentor Wake Grant 369Message from the Superintendent 1–2Middle School Openings, 2007-08 7Middle School Teaming 233Minimum Competency Teachers 254Months of Employment 127Multiple Enterprise Fund 32Municipal Collaboration Projects 363, 375
NNet Local Expenditure Increases 19Net Local Revenue Increases 19New Programs or Increased Funding to Existing Programs 18, 83New Teacher Orientation 270Ninth Grade Centers 142, 339Non-Contributory Employee Benefi ts 271North Carolina Tax Rate 148Northern Area Schools 69North Garner Middle School Magnet Status 323
NovaNet Teachers 255
OObject Codes 93Occupational Safety and Health Administration (OSHA) Nurse 263Occupational Therapists 201Offi cial Fall 2007 20th Day Membership 147Oil, Tires, Bus Parts, and Supplies for Buses 287One-time allotment to schools in 2007-08 for leave, class size, scheduling, and
construction issues 357One-time allotment to schools in 2007-08 for Tenth Day Overages 358One-time allotment to schools in 2007-08 for Title I School Choice 359One-time allotment to schools in 2007-08 to adjust Fund 6 Individual School Ac-
count 356One-time Computer and Supplies Costs from 2007-08 purchased for new staff
members 364One-time costs for Director of Communications 362Online Media Resources 256Operating Budget 16, 20, 82Operating Capital Outlay Budget 33Oracle Advanced Benefi ts 295Organization 88Org Chart - Administrative Services Division 47, 48, 49Org Chart - Auxiliary Services Division 50Org Chart - Communications Division 53Org Chart - Instructional Services Division 56Org Chart - Organizational Development and Support 65Org Chart - Technology Services Division 62Org Chart - The Wake County Public School System 45Our Employees 13Our Schools 6Our School System 3Our Students 9Outsourcing of Bus Garage Parts Inventory 343
PPayroll Technician 277
2008-09 Adopted Plan for Student Success
411IndexWake County Public School System - FY 2008-09 Plan for Student Success
Index2008-09 Board of Education’s Plan for Student Success
Perfect Attendance for Bus Drivers and Mechnics 344Performance Recognition 12Per Pupil Expenditures (excluding Child Nutrition) 3, 146Physical Education Program (PEP) Federal Grant - Healthful Living 371Physical Therapists 202Population 174Positive Behavior Support (PBS) 330Preliminary Scholastic Aptitude Test (PSAT) 297Preschool Special Education Referral and Assessment Team 203Principal Property Taxpayers for Wake County 149Principals 234Printing and Reproduction Costs for Evaluation and Research 206Private Security Contract 306Processing Technician for Risk Management Department 264Program Codes 93Project Achieve 340Provide a 1% Salary Increase for Non-Certifi ed Employees 332Public School Financing 75Purpose Codes 92
QQuarterly Financial Reviews 89
RReal Estate Leases 303Real Time Inventory 345Remove Operational Costs for Real Estate Services and meet needs with Existing
Capital Improvement Plan (CIP) 2006 bond funds 346Renovations 142Reporting Entity 75Reproduction of required Student and Parent Materials 231Reserved Fund Balance 80Revenue by Source History - Operating Budget 171Risk Pool 370
S
Safety Assistants 227Salary Administration and Organizational Management Senior Administrator and
Clerical Support Positions 291Salary and Benefi t Issues 18Salary Audit 360Salary Increase for Non-Certifi ed Employees (One Percent) 332Salary Increases 152Salary Increases and Employer Matching Benefi t Rates 152SAT EXAMS 11Savings - Fund Balance Appropriation Issues 372–376Savings and Reduction of One-Time Costs from the Previous Year 18Scheduling Assistance - Athletic Director (AD) and Trainer 235Scholastic Aptitude Test (SAT) 11School-Based Clerical Allotment 185School Budget and Fiscal Control Act 77School Buses 228School Counselors 207School Psychologist Contracts 209School Psychologist Months of Employment (MOE) 210School Resource Offi cers (SRO) 307Schools 6School Social Worker Months of Employment (MOE) 211School System 3Senior Administrator - Recruitment 278Service Trucks for Mechanics 230Sick Leave Substitute Pay for Non-Categorical State and Local Teachers 269South Central Area Schools 72, 241Southern Area Schools 74, 242Special Education Contract Services 212Special Education Supplies and Materials 213Special Education Teacher Assistants 214Special Education Teachers 215Speech Therapists 216Staff Allotments 127–128Staff Budget 129–131Staff Development for Elementary, Middle, and High Schools 272Staff History 173
2008-09 Adopted Plan for Student Success
412 www.wcpss.net
Index2008-09 Board of Education’s Plan for Student Success
State and Local Allotment Formulas 153–162Statement of Revenues, Expenditures, and Changes in Fund Balance 139–140State of North Carolina Policies For School System Budgets 77State Public School Fund 21Strategic Directives 1–2Student Achievement 166–168Student Assistant Program (SAP) Coordinators 257Student Performance 11Student Population Projections 9Students New to Wake County by Grade 10Substitutes for Staff Planning Days 258Swimming Pool Rental 259Swimming Pool Rental for High Schools 298Systemwide Increases 18
TTax Data 148–149Teacher Assistants 187Teacher Assistants as Substitutes (Regular Education) 273Technology 13, 142Term Life Insurance 334Test Administration Costs 217Textbooks for Elementary, Middle, and High Schools 188Things to Do within the Municipalities of Wake County 177Title I - Supplemental Educational Services 331Total Budget 16, 20Transfers 89Transition Counselors 218Transportation 176Transportation Information Management System (TIMS) Technicians 308Travel for New Elementary, Middle, and High Schools 236
UUndesignated Operating Fund Balance 81Unemployment Insurance 152Unreserved Fund Balance 80Utilities for additional square footage 285
Utility Rate Increases 301
VVoice Circuits for New Schools 268
WWake County compared to Largest 5 LEA’s by Average Daily Membership 146Wake County Demographics 174–178Wake County Population Growth Projections 14Wake County Public School Systems Mission 46Wake Early College Satellite Campus 319Western Area Schools 73, 243What does the Operating Budget consist of? 16What does the Total Budget consist of? 16What is a Balanced Budget? 76Where are funds spent? 17Workers’ Compensation 152Wrecker Body 316
YYear-Round Schools 8Year-round schools 142
2008-09 Adopted Plan for Student Success
413Budget SurveyWake County Public School System - FY 2008-09 Plan for Student Success
Your opinion is important to us! Please take a few minutes to tell us what you think about our budget document. Your comments will be used to assist us in improving the document.
1. What is your role in relation to Wake County Public Schools (WCPSS)?� School Board Member� Leadership Team Member� Principal or Assistant Principal� Finance Liaison� Community Member� Other (please specify) _____________________________
2. Readability: Is the subject matter presented in an easy to read format and in terms that are understandable?� Very Easy� Somewhat Easy� Adequate� Somewhat Diffi cult� Diffi cult 3. Content: Please answer Yes or No to the following statements: a. The budget refl ects a good mix of narrative, graphs and tables. b. There is consistency in how the information is presented. c. It is easy to fi nd the information I am looking for within the document.
4. Organization: Please rate the following sections on the scale of 1-3.(1) Very helpful; (2) Helpful; and (3) Not Helpful.
_____ Introduction Section
_____ Organization Section
_____ Financial Section
Budget Survey2008-09 Adopted Plan for Student Success
_____ Information Section
_____ Business Cases _____ Growth _____ Systemwide _____ Commitments _____ New Programs _____ Savings
_____ Acronym Section
_____ Glossary Section
_____ Index Section
5. Overall Impressions: How would you rate the entire document?� Very Helpful� Answered Most Questions� Adequate� Minimally Helpful� Not Helpful
6. What would you like to see added, expanded, reduced, or removed?
Please complete our online version of this survey at:http://www.zoomerang.com/survey.zgi?p=WEB227J4438TJNor
Send this form to: WCPSS, Budget Department, 3600 Wake Forest Road, Raleigh, NC 27609. This form may also be faxed to 919-850-1888.