79

-vHGL HydroGeologic Inc 1(msas Cilv Operations
Exceeding Expectations
RECEIVEDJuly 2 2012
JUL 02 2012 Mr Jim Seiler AES Project Officer SUPERFUND DIVISION US Environmental Protection Agency Region 7 901 North 5m Street Kansas City KS 66101
RE Groundwater Flow Modeling Technical Memorandum for the Garvey Elevator Superfund Site Hastings Nebraska US EPA Region 7 AES Contract No EP-S7-05-05 Task Order No 0034 EPA Task Order Project Officer Brian Zurbuchen PhD
Dear Mr Seiler
HydroGeoLogic Inc (HGL) is pleased to submit a hard copy (with an electronic copy on CD) of the Groundwater Flow Modeling Technical Memorandum for the Garvey Elevator Superfund Site Hastings Nebraska This document was prepared in accordance with Task Order 0034 and our EPA-approved Task Order Proposal Amendment 1 Revision 1 submitted on September 19 2011
As requested by EPA two additional hard copies of the Final Groundwater Flow Modeling Memorandum will be sent to Laurie Brunner at the Nebraska Department of Environmental Quality Should you have any questions or comments please contact us at 913-317-8860
Enclosures
6340 Glenwood Suite 200 Building 7 Overland Park KS 66202 -------------- Phone (913) 317-8860 Fax (913) 317-8868 ------------- shy
wwwhglcom
GROUNDWATER FLOW MODELING TECHNICAL MEMORANDUM GARVEY ELEVATOR SUPERFUND SITE
HASTINGS NEBRASKA
TO Brian Zurbuchen PhD EPA TOPO FROM PE TOM THROUGH PG CHMM DATE July 2 2012 SUBJECT Groundwater Flow Modeling
Garvey Elevator Site Hastings Nebraska CONTRACT NO EP-S7-05-05 TASK ORDER NO 0034
10 INTRODUCTION
HydroGeoLogic Inc (HGL) is conducting remedial investigation (RI)feasibility study (FS) and remedial design (RD) activities at the Garvey Elevator site in Hastings Nebraska under Region 7 US Environmental Protection Agency (EPA) Architect and Engineering Services (AES) contract EP-S7-05-05 Task Order 0034 The Comprehensive Environmental Response Compensation and Liability Information System (CERCLIS) ID for the site is NEN000704351 EPA has organized the site into two operable units (OUs) OU 1 is designated as the area of soil and groundwater contamination that is generally within the boundaries of the former Garvey Elevators Inc facility property and also known as the source area OU 2 is the associated groundwater contaminant plume that extends east-southeast from OU 1 approximately 43 miles in the direction of groundwater flow This Technical Memorandum details the modeling approach and results that are being used to support the FS currently in progress for both OU 1 and OU 2 and for the expansion of the existing groundwater extraction well network at the Garvey Elevator Site A similar modeling exercise is being conducted for the West Highway 6 amp Highway 281 Site located approximately 1500 feet northeast of the Garvey Elevator Site
This memorandum is divided into nine sections Following this introduction Section 2 presents the modeling objectives and overall approach Section 3 identifies the major components of the conceptual model Section 4 addresses the computer code selection Section 5 presents the construction of the numerical model Section 6 details the activities undertaken for the groundwater flow calibration and sensitivity analysis the modeling performed to support the remedial alternative design is presented in Section 7 Section 8 presents a summary and conclusions of the groundwater flow particle tracking and contaminant transport analysis and Section 9 lists the references cited in preparing this memo Tables and Figures cited throughout this memo are provided in Attachments 1 and 2 respectively
HGLmdashGroundwater Flow Modeling Technical Memorandum Garvey Elevator Site ndash Hastings NE
20 MODELING OBJECTIVES AND OVERALL APPROACH
21 BASIC ASPECTS OF COMPUTER (NUMERICAL) MODELING
The flow model constructed for this exercise uses finite-difference techniques which require that the groundwater system be divided (lsquodiscretizedrsquo) into finite-sized blocks or lsquocellsrsquo Each cell is assigned unique hydraulic properties depending on the available field data and the goals for the analysis In this way complex features of the groundwater system can be accommodated in the model The time represented by the modeling effort must also be divided into discrete periods or lsquotime steps These steps must be short enough to provide an accurate solution but not so short that they require an excessive number of calculations to run a simulation The finite-difference method also requires that values for head be assigned at flow boundaries (referred to as lsquoboundary conditionsrsquo) as well as for the initial time period of the simulation (referred to as lsquoinitial conditionsrsquo) This is a requirement for producing a unique solution with any numerical method that depends on iteration as does the finite-difference method
After assigning properties initial conditions and boundary conditions the finite-difference equations for flow are solved to produce a mathematically approximate but scientifically reliable value of the average groundwater head (potentiometric surface elevation) within each cell Subsequently a different set of equations (which usually are also finite-difference equations) that describe chemical transport are solved to generate the average value of chemical concentration within each cell of the modeled groundwater system Models that use the finite-difference numerical technique allow rapid analysis of complex time-dependent groundwater systems as such they are preferable for all but the simplest scenarios
Numerical models are operated by a computer code or program The code is a generalized set of steps to which specific field conditions such as initial and boundary conditions are imposed Various model codes are available some are proprietary (privately owned) while others are in the public domain (available to everyone) The most widely used codes for describing groundwater flow and contaminant transport are MODFLOW and MT3D both are in the public domain
Because computer codes are generic in nature and must be adapted to actual field conditions in order to be helpful a clear understanding of the existing physical system (a conceptual model) is required The hydrogeologist develops a conceptual model of the hydrogeologic environment based on field experience available literature and site data This conceptual model provides a vital guide in creating a numerical model that represents actual field conditions
22 MODELING OBJECTIVES AND APPROAH
It is important to establish why the model is being created and to properly design the model simulations to sufficiently address the data needs that the modeling effort is intended to satisfy The objectives of this current exercise were to (1) Evaluate the overall effectiveness of the current extraction well system (2) identify areas outside of the capture zone that may require
US EPA Region 7 Garvey Groundwater Flow Modeling Memo 2 July 2012
HGLmdashGroundwater Flow Modeling Technical Memorandum Garvey Elevator Site ndash Hastings NE
enhancements and (3) develop a tool to assist in ldquowhat ifrdquo scenarios for the remedial alternative development
These three objectives were satisfied by
1 Constructing and calibrating a three-dimensional groundwater model that generates a flow field (array of head values) representing average conditions in the vicinity of the site
2 Performing a particle-tracking analysis with the calibrated flow field to define groundwater flow directions and estimate capture zones
3 Conducting chemical transport analyses to evaluate potential remediation alternatives and estimate remediation times
The three-dimensional (3-D) computer model for analyzing groundwater flow was constructed first then the model was calibrated and used as the basis for the flow and transport model of plume development
The following discussion describes the procedures used in creating the groundwater flow model and the plume development model
Steps Required in Creating the Flow and Transport Model
Steps completed in creating the numerical model included the following
1 Adopting a conceptual model to guide creation of model elements 2 Choosing an appropriate computer code for the analysis 3 Establishing the time period represented by the model and the duration of subdivisions
of this period (time steps) required for modeling 4 Selecting a suitable model domain and determining the dimensional (horizontal and
vertical) limits of the analysis 5 Establishing the model structure by determining the number of model layers and the
grid spacing requirements 6 Incorporating hydraulic boundaries and features including the shape and characteristics
of constant-head boundaries such as rivers precipitationrecharge and pumping 7 Assigning hydraulic parameters consisting of hydraulic conductivity and porosity 8 Selecting hydraulic calibration targets 9 Evaluating and assigning appropriate model computational characteristics for example
solution method iteration limits and convergence criteria to enhance model stability computational efficiency and solution accuracy
10 Running the model and adjusting assigned model parameters within predetermined limits to achieve the closest fit between model results (hydraulic heads) and calibration targets
11 Evaluating the sensitivity of model results to changes in model parameters 12 Assigning transport parameters including the distribution coefficient (defines
contaminant adsorption to soil and affects transport by retarding the rate of contaminant
US EPA Region 7 Garvey Groundwater Flow Modeling Memo 3 July 2012
HGLmdashGroundwater Flow Modeling Technical Memorandum Garvey Elevator Site ndash Hastings NE
movement) and the degradation coefficient for the modeled chemical species (relates to the rate of chemical decay in the groundwater system)
13 Placing particles within the model to determine groundwater flow directions and capture zone characteristics
14 Initializing the contaminant plume based on measured concentrations 15 Simulating remedial scenarios
Completion of these steps is necessary to create a model that represents field conditions as accurately as possible within the constraints of practicality and data availability The remainder of this report details how each of the steps outlined above was accomplished
30 CONCEPTUAL MODEL
A conceptual model was developed to serve as the basis for the construction of the flow and transport model A conceptual model generally summarizes the theoretical understanding of the primary conditions that affect groundwater flow and chemical transport and fate Additionally the current nature and extent of the groundwater contamination in OU 1 is also presented Unless otherwise indicated the information below was excerpted from the Focused Feasibility Study (HGL 2009)
31 SITE HYDROGEOLOGY
For additional information the Remedial Investigation (RI) report provides a comprehensive description of the hydrogeology (HGL 2011)
Regional Characteristics
Hastings is located in the Little Blue River Natural Resource District Depth to groundwater in the Hastings area is typically about 100 feet (ft) below ground surface (bgs) with localized zones of perched groundwater that can occur as shallow as 7 to 10 ft bgs The regional groundwater flow generally follows the direction of the Little Blue River toward the east to southeast
The principal aquifer for the Hastings area is the Pleistocene aquifer which is typically 100 ft to 150 ft thick The Pleistocene aquifer is composed of unconsolidated sand and gravel that extends from about 100 ft bgs to the top of the Niobrara Formation which occurs at about 233 ft bgs
Groundwater from the Pleistocene aquifer in the Hastings area is used for municipal domestic and agricultural use Due to high use of the Pleistocene aquifer the water table has dropped more than 20 ft between pre-1950s and 1992
Transmissivity ranges from more than 200000 gallons per day per foot in the central part of the county to less than 50000 gallons per day per foot in the northeastern corner and southernmost portions of the county
US EPA Region 7 Garvey Groundwater Flow Modeling Memo 4 July 2012
HGLmdashGroundwater Flow Modeling Technical Memorandum Garvey Elevator Site ndash Hastings NE
Site-Specific Characteristics
Groundwater typically occurs between 110 to 115 ft bgs at the site Three aquifer zones exist at the site based on the lithologic descriptions for their monitoring well boring logs These three aquifer zones are referred to as the shallow medial and lower zones
The shallow aquifer zone is unconfined and extends from about 115 ft bgs to 130 ft bgs and based upon lithology is divided into A and B Zones A fine-grained (aquitard) forms the base of the shallow aquifer and acts as a semi-confining layer to the underlying medial aquifer The medial aquifer extends from the bottom of the upper aquitard to the top of the lower aquitard at approximately 150 ft bgs (Zone C) The lower aquifer zone is believed to be from approximately 155 ft bgs to 240 ft bgs (Zones D and E) The weathered shale of the Niobrara Formation forms the base of the aquifer Groundwater flow in all aquifer zones is to the southeast
In 2011 discrete pumping tests were conducted using recovery wells RW-2 in the shallow aquifer and RW-7 in the medial aquifer (HGL 2011) The RW-2 constant-rate test was conducted at a pumping rate of approximately 95 gallons per minute (gpm) after the pumping rate stabilized The RW-7 constant-rate test was conducted at a pumping rate of approximately 100 gpm
For the RW-2 pumping test conducted in the shallow aquifer the average shallow aquifer hydraulic conductivity (K) value calculated from the constant-rate pumping test data was 245 (feet per day) ftday This is fairly consistent with the average shallow aquifer K value of 46 ftday measured by the EPA for the RI using the bi-chamber dipole flow testing analysis in well MW-33 a hydraulic testing well located at the northwestern perimeter of the site property A geotechnical analysis of an aquifer sample collected from the screened interval of MW-49B had a K value of 485 ftday which also is consistent with the two field-derived measurements
During the constant-rate test at RW-7 for the medial aquifer drawdown was observed in two monitoring wells MW-13C and MW-50C The average K value for the three MW-13C data analyses was 2494 ftday while the average K value for the same three analyses for the MWshy50C dataset was 1647 ftday In contrast an average medial aquifer K value of 98 ftday was measured by EPA for the RI using the bi-chamber dipole flow testing analysis in well MW-33 A geotechnical analysis of an aquifer sample collected from the screened interval of MW-50C had a K value of 587 ftday Given that the geotechnical sample was disturbed its K value is marginally valid in comparison to the aquifer parameters derived from the pumping test An acceptable K value for the medial aquifer would be an average of the three field-derived measurements which would yield a K value of 171 ftday
32 NATURE AND EXTENT OF VOCS
The contaminants in the groundwater were evaluated using data collected during the RI activities conducted at the site and from previous investigations The nature and extent of the volatile organic compounds (VOCs) in the groundwater are summarized below Unless
US EPA Region 7 Garvey Groundwater Flow Modeling Memo 5 July 2012
HGLmdashGroundwater Flow Modeling Technical Memorandum Garvey Elevator Site ndash Hastings NE
otherwise referenced the following sections are adapted from the RI Report (HGL 2011)
The VOCs detected in groundwater at the Garvey Elevator Site exceeding their preliminary remediation goals (PRGs) are tetrachloroethene (PCE) trichloroethene (TCE) and carbon tetrachloride The elevated PCE detections are attributed to the adjacent West Highway 6 amp Highway 281 Site The contaminant plume originating at the West Highway 6 amp Highway 281 Site is commingled with the contaminant plume originating at the Garvey Elevator Site The elevated TCE detections appear to be limited to the upper aquifer zone (Zone AB at 115 to 130 feet bgs) in an area east of the railroad tracks north of the grain storage facility The carbon tetrachloride contamination appears to originate from two soil source areas the former liquid fumigant AST and an area in the northeastern corner of the grain storage facility (possibly from the treatment of rail cars or stockpiled grain) Carbon tetrachloride has migrated through the soil to the groundwater The carbon tetrachloride contamination extends from the groundwater underlying the grain storage facility to approximately 47 miles downgradient to the east-southeast from the source areas Carbon tetrachloride plume is present above PRGs in the upper (Zone AB 115 to 125 feet bgs) medial (Zone C 130 to 155 feet bgs) and lower (Zone DE 160 to 235 feet bgs) aquifer zones One aquitard occurs between the upper (Zone A) and medial (Zone C) aquifer zones and another aquitard occurs between the medial (Zone C) and lower (Zone DE) aquifer zones The two aquitards vary in thickness and composition The carbon tetrachloride plume appears to migrate deeper in the aquifer zones as it migrates farther downgradient from the Site
The carbon tetrachloride concentrations that were used to initialize the shallow medial and lower aquifers in the model were derived from those observed during the September 2011 sampling event These isoconcentration maps are presented as Figures 31 32 and 33 for the shallow medial and lower aquifers respectively
40 COMPUTER CODE SELECTION
The computer codes that were used for this analysis are MODFLOW-2000 MT3DMS PEST and MODPATH MODFLOW-2000 the U S Geological Survey finite-difference groundwater flow model is a popular and widely used computer code (Harbaugh et al 2000) Groundwater flow within the aquifer is simulated using a block-centered finite-difference approach Layers can be simulated as confined unconfined or a combination of confined and unconfined Flow associated with external stresses such as wells areal recharge evapotranspiration drains and streams can also be simulated
The modular 3-D flow and transport model referred to as MT3D was originally developed by Zheng (1990) and subsequently updated to MT3DMS (Zheng and Wang 1999) MT3DMS has a comprehensive set of options and capabilities for simulating advection dispersiondiffusion and chemical reactions of contaminants in groundwater flow systems under general hydrogeologic conditions Although both codes use the same model structure MODFLOW is run first using the physical and hydraulic data entered into the model to produce a groundwater flow field (array of hydraulic heads) Subsequently MT3D is run using the head results from the flow model to produce a transport simulation
US EPA Region 7 Garvey Groundwater Flow Modeling Memo 6 July 2012
HGLmdashGroundwater Flow Modeling Technical Memorandum Garvey Elevator Site ndash Hastings NE
MODPATH is a particle tracking post-processing package that was developed to compute 3-D flow paths using output from steady-state or transient groundwater flow simulations by MODFLOW MODPATH is described in USGS Open-File Reports 89-381 and 89-622 (Pollock 1994) MODPATH uses a semi-analytical particle tracking scheme that allows an analytical expression of the particle flow path to be obtained within each finite-difference grid cell Particle paths are computed by tracking particles from one cell to the next until the particle reaches a boundary an internal sink or source or satisfies some other termination criterion
To facilitate the model calibration a parameter estimation tool was implemented PEST (Parameter ESTimation) is a calibration tool developed by Watermark Computing (Doherty 2006) that uses non-linear least-squares techniques to adjust model parameter data in order that the discrepancies between the pertinent model-generated numbers and the corresponding measurements are reduced to a minimum It does this by taking control of the model and running it as many times as is necessary to determine this optimal set of parameters
The pre- and post-processing of data inputoutput for these codes was performed with Groundwater Vistas (Rumbaugh and Rumbaugh 1998)
50 MODEL CONSTRUCTION
One primary goal of mathematical modeling is to synthesize the conceptual model into numerical terms from which flow and transport processes may be investigated under specified conditions This process entails several discrete steps (1) partitioning the conceptual model into units of time and space (2) assignment of boundary conditions and (3) specification of the values for the parameters The following sections briefly discuss the approach taken and the relevance of each of these topics to the modeling process
51 DOMAIN STRUCTURE AND GRID
The model domain is 10100 ft by 28200 ft (102 square miles) and extends horizontally from about 800 feet west of the site property boundary to approximately 6000 ft north and 2500 ft south of the site and about 25000 ft east of the site as shown in Figure 51 This is an area large enough to include all of the contaminant plumes and ensure that the effects of proposed pumping for the remedial alternatives will not reach the boundaries and cause boundary effects on the predicted drawdowns
In a numerical model the region of interest is partitioned into a series of cells (that is elements) which are arranged in layers This practice termed discretization effectively replaces the continuous problem domain with an array of cells The basic concept involves dividing up the area as realistically as practical One of the critical steps in applying a groundwater model is selecting the size of the cells Smaller cells lead to more accurate numerical solutions The desire for accuracy however must be balanced against the impracticality of solving for large numbers of nodes and the long computer run times that may be involved For this modeling exercise a finite-difference grid (squares and rectangles) was adopted with 404 rows 510 columns and 5 layers The rows and columns are evenly spaced
US EPA Region 7 Garvey Groundwater Flow Modeling Memo 7 July 2012
HGLmdashGroundwater Flow Modeling Technical Memorandum Garvey Elevator Site ndash Hastings NE
at 25 ft intervals over the area encompassing the site and extending approximately 8000 feet downgradient from the western model boundary The remaining portion of the model is uniformly spaced at 100 ft intervals creating 1030200 active cells
The grid is oriented to be approximately parallel to the measured plumes or 9 degrees south of east This orientation is representative of the net groundwater flow directions (as expressed by the plume) Based on regional potentiometric surface maps the ambient groundwater gradients are closer to 20 degrees south of east The natural gradients however may be shifted locally by pumping for irrigation and water supply
The shallow medial and lower aquifers are each discretized into single model layers (Figure 52) The shallow and medial aquifers are separated by a confining unit which is simulated with a single model layer A deeper confining unit separates the medial from the lower aquifer and is also simulated with a single model layer The base of the model is set to an elevation consistent with the base of the Pleistocene aquifer which is defined by the weathered shale of the Niobrara Formation (Figure 53) The lithologic contact information is provided in Table 51
The elevation of the top of the lower aquifer (model layer 5) is shown in Figure 54 An isopach map presented in Figure 55 shows that the thickness of the lower aquitard (model layer 4) that separates the lower aquifer from the medial aquifer As shown in the figure the thickness varies from being non-existent in approximately the northern third of the model domain to a thickness of about 75 feet near the eastern boundary The top and bottom of the medial aquifer is defined as the base of the upper aquitard and top of the lower aquitard The elevation of the base of the medial aquifer is depicted in Figure 56 The thickness of the upper aquitard (model layer 2) is presented in Figure 57 The thickness ranges from about 1 to 8 feet except in an area immediately north of the Garvey Elevator site where the aquitard is missing The elevation of the base of the upper aquifer is shown in Figure 58 The top of the upper aquifer is defined as the water table surface and is depicted in Figure 613
52 TIME BASIS
All of the calibration simulations capture zone and contaminant transport analyses were performed to steady-state conditions These conditions best represent the effects of long term pumping on the water levels and plume development and provide the best estimates of the capture zone and contaminant transport under the current conditions
53 BOUNDARY AND INITIAL CONDITIONS
531 Boundary Conditions
To obtain a solution for the governing equation of groundwater flow information is required about the physical state of the groundwater system This information is described by boundary and initial conditions Boundary conditions are the conditions the modeler specifies as known or estimated values to solve for the unknowns in the problem Boundaries generally are
US EPA Region 7 Garvey Groundwater Flow Modeling Memo 8 July 2012
HGLmdashGroundwater Flow Modeling Technical Memorandum Garvey Elevator Site ndash Hastings NE
quantified in terms of the volume of groundwater moving through the system The physical boundaries are then translated into mathematical terms and input into the computer model
Constant-head boundary conditions (ie groundwater elevations remain constant with time) were extrapolated from the regional gradients and assigned at the upgradient (northwestern) and downgradient (southeastern) model limits for all of the model layers (Figure 51)
The model boundaries to the northeast and southwest are approximately parallel to groundwater flow lines and are considered lsquono-flowrsquo boundaries across which no groundwater moves The base of the model is considered a no-flow boundary
Shallow Aquifer
The top of the model was set as a uniform recharge boundary (26 inches per year [inyr]) with the rate determined as part of the model calibration
As presented below and shown in Figure 59 all of the recovery wells are set to their average pumping rates for the week prior to and during the collection of the water level data calibration set (September 26-27 2011) These rates are listed below
Garvey Elevator Site
bull RW-1 = 00 gallons per minute (gpm) bull RW-2 = 80 gpm bull RW-3 = 74 gpm bull RW-4 = 98 gpm bull RW-5 = 51 gpm
West Highway 6 amp Highway 281 Site
bull EW-1 = 61 gpm bull EW-2 = 83 gpm bull EW-3 = 41 gpm bull EW-4 = 00 gpm
US EPA Region 7 Garvey Groundwater Flow Modeling Memo 9 July 2012
HGLmdashGroundwater Flow Modeling Technical Memorandum Garvey Elevator Site ndash Hastings NE
Medial Aquifer
There are no wells pumping from the medial aquifer at the West Highway 6 amp Highway 281 Site Recovery wells RW-6 RW-7 and RW-8 at the Garvey Elevator Site are set to their average rates observed for the week prior to and during the collection of the water level calibration set (Figure 510) These pumping rates are as follows
Garvey Elevator Site
bull RW-6 = 925 gpm bull RW-7 = 667 gpm bull RW-8 = 905 gpm
West Highway 6 amp Highway 281 Site
bull No wells are pumping from the medial aquifer
Lower Aquifer
All of the water pumped from the shallow and medial aquifers at the Garvey Elevator Site is treated and injected into the lower aquifer through two injection wells located as shown on Figure 511 The total amount of pumped water is approximately 280 gpm Since there are no flow meters on the injection wells it is assumed that 10 percent of the pumped water is lost to leaks and evaporation and the remaining 250 gallons is injected at an equal rate (125 gpm) into each of the two injection wells
Pumping records for the month of September 2011 indicate that the pumping rate for Municipal Well 9 averaged 577 gpm The close proximity of this well to a no-flow boundary (Figure 511) however would result in over predictions of the hydraulic conductivities in this area during the model calibration Therefore the pumping rate of Municipal Well 9 was reduced during the model calibration until the hydraulic conductivities approximated those in the general vicinity but outside the influence of the pumping Since this well is away from the contaminant plumes the modeling results will be relatively insensitive to the hydraulic conductivities predicted in this area Since the calibration set was collected in September it is assumed that the irrigation wells located within the model domain were not pumping water Injection and pumping rates from the lower aquifer are shown below
Garvey Elevator Site
bull IW-1 = 125 gpm bull IW-2 = 125 gpm
US EPA Region 7 Garvey Groundwater Flow Modeling Memo 10 July 2012
HGLmdashGroundwater Flow Modeling Technical Memorandum Garvey Elevator Site ndash Hastings NE
West Highway 6 amp Highway 281 Site
bull Municipal Well 9 = 342 gpm
532 Initial Conditions
As described in Section 32 carbon tetrachloride contamination is present in the upper middle and lower aquifers Groundwater contaminant concentration data presented on Figures 31 32 and 33 were used as the basis for estimating the initial plume concentrations within the model The actual concentrations specified as initial conditions for the shallow medial and lower aquifers are shown in Figures 512 513 and 514 respectively
60 MODEL CALIBRATION
Traditionally the term model calibration is used to refer to the trial-and-error adjustment of parameters of the groundwater system by comparing the models output (calculated values of hydraulic head or concentration) and the measured output (observed values of hydraulic head or concentration) In essence such a calibration procedure involves the following routines (1) operating the model using initial estimates of the values of the parameters (2) history-matching or comparing computed and observed values of hydraulic head or concentration and (3) adjusting the values of the parameters and repeating the simulation
Calibration of the model is aimed at demonstrating that it can produce realistic accurate and reliable predictions The flow model is calibrated by determining a set of parameters boundary conditions and hydraulic stresses that generate simulated potentiometric surfaces and fluxes that match field-measured values to within an acceptable range of errors The end result of the process of model calibration is an optimal set of values for parameters that minimize the discrepancy between the model output and the observed data The iterative process of matching calculated values with observed (historical) data by adjusting the model input can be a manual trial-and-error procedure or can be automated The calibration process also known as history-matching is closely related to estimating parameters This process might result in the refinement of initial estimates of aquifer properties (parameters) the establishment of the location of the boundaries (areal and vertical extent of aquifer) and the determination of flow and transport conditions at the boundaries
Calibration can be performed to steady-state or transient data sets Although most flow model calibration exercises involve steady-state data in some hydrogeologic settings assumption of steady-state conditions may be inappropriate due to large fluctuations in the water table or boundary conditions For this modeling exercise only steady-state calibrations were performed
To facilitate the model calibration PEST was used in conjunction with the groundwater flow code (MODFLOW-2000) PEST is a calibration tool that uses non-linear least-squares techniques to adjust model parameter data in order to reduce the discrepancies between the
US EPA Region 7 Garvey Groundwater Flow Modeling Memo 11 July 2012
HGLmdashGroundwater Flow Modeling Technical Memorandum Garvey Elevator Site ndash Hastings NE
pertinent model-generated numbers and the corresponding measurements to a minimum It does this by taking control of the model and running it as many times as is necessary to determine this optimal set of parameters within a user-specified range
Calibration of the steady state flow model was accomplished iteratively by adjusting model parameters during successive model runs to match the water-level data that was collected from all of the wells on September 26-27 2011 under stressed (ie pumping) conditions Since most of the recovery wells had been running for at least several weeks prior to and during the collection of these water levels is it assumed that the levels are representative of steady-state pumping conditions The water-level calibration targets for all of the aquifers are provided in Table 61
As part of the model calibration adjustments were made to the areal recharge (shallow aquifer) range of hydraulic conductivities ratio of vertical to horizontal hydraulic conductivities and minor adjustments to the constant head boundaries The general calibration approach that was followed involved adjusting the parameters mentioned above and inputting the parameters into a PEST simulation PEST would subsequently run MODFLOW thousands of times in which the hydraulic conductivities were adjusted for each iteration until the difference between the observed water levels (targets) and the model predicted values (error residuals) were minimized If these error residuals were too high further adjustments were made to the recharge hydraulic conductivity range etc and the PEST simulation was initiated again
During the model flow calibration it was found that the parameter imparting the most sensitivity to the model results is the areal recharge reaching the water table The Corps of Engineers proposed in their 1990 Final Groundwater Modeling Report of the Hastings East Industrial Park area that net recharge for non-irrigated grassland was estimated to be 26 inches per year (USACE 1990) After performing a number of simulations during the model calibration it was found that a value of 26 inches per year provided the best match to the measured water levels
The error residuals (that is the differences between model predictedcomputed and measuredobserved values) are depicted graphically in Figures 61 and 62 The error residuals and calibration statistics are also presented in tabular form in Table 61 As shown in Figure 61 most of the error residuals are within plusmn05 ft The minimum residual is -32 ft (over prediction of the hydraulic head) and the maximum residual is 196 ft (under prediction of hydraulic head) The graph depicted in Figure 62 shows that there is a good fit along the entire range of observed water level elevations
A common measure of the quality of the model calibration is the percent error The percent error is the root mean square error (RMSE) divided by the total change in the observed head As shown in Table 61 the RMSE is 075 and the range in observations is 4326 This leads to a percent error of about 17 percent which is well below the 10 percent error often cited as the cutoff for a well calibrated model
US EPA Region 7 Garvey Groundwater Flow Modeling Memo 12 July 2012
HGLmdashGroundwater Flow Modeling Technical Memorandum Garvey Elevator Site ndash Hastings NE
The areal distribution of error residuals for the shallow aquifer (model layer 1) near the Garvey Elevator Site and over the entire model domain are shown in Figures 63 and 64 respectively All of the error residuals shown in the figures are relatively small In fact the largest error residuals in the shallow aquifer are found in the immediate vicinity of the West Highway 6 amp Highway 281 Site and do not significantly impact the flow and transport results These error residuals were further lowered as part of the West Highway 6 amp Highway 281 model calibration performed as a separate exercise
The error residuals for the medial aquifer (model layer 3) are presented in Figure 65 With the exception of two wells that are located to the northeast of the Site in the vicinity of the West Highway 6 amp Highway 281 Site all of the residuals are relatively low
The areal distribution of error residuals for the lower aquifer (model layer 5) near the Garvey Elevator Site and over the entire model domain are depicted in Figures 66 and 67 respectively The large residual shown on Figure 66 is associated with MW-20C (-30 ft) The water levels and residuals for the MW-20 well series are as follows
MW-20C residual -300 ft water level 180892 ft above mean sea level (amsl) MW-20D residual 004 ft water level 181196 ft amsl MW-20E residual -037 ft water level 181155 ft amsl
As shown in Table 51 the top of the lower aquifer for the MW-20 series is encountered at a depth of 152 feet This is also the depth that the well screen begins for MW-20C Therefore MW-20C -20D and -20E are all screened in the lower aquifer
Historically the water level for MW-20C behaves somewhat erratically when compared to MW-20D and MW-20E For instance all of the measurements for the 3 wells are relatively close in 2009 and 2010 However in June of 2011 the water level observed in MW-20C is 4 feet above that observed in MW-20D and 3 feet above the water level measured in MW-20E Therefore primary reliance was placed on the water levels from MW-20D and MW-20E for the model calibration
The residuals for the lower aquifer monitoring wells farther downgradient of the site are all very low and demonstrate an excellent calibration (Figure 67)
The calibrated hydraulic conductivities for the shallow medial and lower aquifers are presented in Figures 68 69 and 610 respectively In the vicinity of the Site the calibrated horizontal hydraulic conductivity for the all of the aquifers ranges between 50 and 250 ft per day (ftd) It is assumed that the vertical hydraulic conductivity is a factor of 5 less than that of the horizontal hydraulic conductivity
Near the Site most of the shallow aquifer is characterized by hydraulic conductivities between 50 to 100 ftd The hydraulic conductivities in the medial aquifer however tend to range between 100 and 250 ftd over most of the Site The calibrated hydraulic conductivities for the lower aquifer range between 50 and 150 ftd over most of the eastern portion of the Site and between 100 and 250 ftd along the western boundary and in the northwest area of the Site
US EPA Region 7 Garvey Groundwater Flow Modeling Memo 13 July 2012
HGLmdashGroundwater Flow Modeling Technical Memorandum Garvey Elevator Site ndash Hastings NE
The model predicted hydraulic conductivities for the lower aquifer are less certain however because there are no pumping wells stressing the system in this aquifer
The hydraulic conductivities farther downgradient of the Site indicate that large areas in the shallow and medial aquifers have relatively low hydraulic conductivities ranging from 50 to 100 ftd The hydraulic conductivities of the lower aquifer over much of this area tend to be significantly higher and range between 100 and 250 ftd These higher hydraulic conductivities are consistent with the large production rates (eg 300 to 600 gpm) of the irrigation wells located in the area which draw from the lower aquifer during the summer months
The hydraulic conductivities of the upper and lower aquitards are show on Figures 611 and 612 respectively The upper aquitard is continuous except for an area located immediately north of the Site The lower aquitard is absent from approximately the northern one third of the model domain
The calibrated potentiometric surfaces for the shallow medial and lower aquifers are presented in Figures 613 through 615 respectively The calibrated potentiometric surface for the shallow and medial aquifers show some bending in the vicinity of the Site due to the pumping wells The potentiometric surface of the lower aquifer is clearly impacted by the injections wells (for example elevation line 1817) Downgradient from the Site the potentiometric lines are generally perpendicular to groundwater flow
As a qualitative check on the calibrated hydraulic conductivity fields and hydraulic gradients a particle tracking analysis was performed to estimate travel times Approximately 52 years has elapsed since Garvey Elevators began operation as a grain storage facility in 1959 and the 2011 sampling event As illustrated by Figure 616 it takes about 50 years for a particle to move from the Site boundary to the toe of the plume Although it is unknown when contamination reached the water table and the overall influence of municipal and irrigation wells on transport rates the results of the travel time analysis suggest that the calibrated hydraulic conductivities and gradients are reasonable A general discussion pertaining to particle tracking (eg computer code) is provided in Section 722
70 REMEDIAL ALTERNATIVE DESIGN
71 CONTAMINANT TRANSPORT PARAMETERIZATION
Once the calibration of the flow model was complete contaminant transport and particle tracking simulations were performed Parameters that are required to conduct contaminant transport modeling include effective porosities dispersivities retardation and chemical and biological transformations A brief description of each of these processes is presented below
Effective Porosity The effective porosity is the ratio of the volume of interconnected pore spaces available for transport to the total system volume It is used to estimate the velocity at which groundwater and contaminants travel through a porous medium The smaller the effective porosity the higher the groundwater velocity and the more rapidly contaminants will
US EPA Region 7 Garvey Groundwater Flow Modeling Memo 14 July 2012
HGLmdashGroundwater Flow Modeling Technical Memorandum Garvey Elevator Site ndash Hastings NE
be transported A reasonable value for sand silts and gravels is 25 percent and therefore this value was assigned to the model
Dispersivity The equations of solute transport that are solved in contaminant-transport codes are derived assuming that the solute migration is due to advection and hydrodynamic dispersion Advection describes the bulk movement of groundwater flow where hydrodynamic dispersion is caused by the tendency of the solute to spread out from the path that it would be expected to follow if transported only by advection This spreading of the contamination over an ever-increasing area is called hydrodynamic dispersion and has two components mechanical dispersion and diffusion Hydrodynamic dispersion causes dilution of the solute and occurs because of spatial variations in groundwater flow velocities and mechanical mixing during fluid advection Molecular diffusion the other component of hydrodynamic dispersion is due to the thermal kinetic energy of solute molecules and also contributes to the dispersion process Thus if hydrodynamic dispersion is factored into the solute transport processes ground-water contamination will cover a much larger region than in the case of pure advection with a corresponding reduction in the maximum and average concentrations of the contaminant Dispersion also increases the velocity of the contaminants because it considers the fact that some contaminants will travel through faster pathways (and some slower) than if only pure advection was assumed
The relatively narrow plume with respect to the plume length suggests relatively low dispersivity values Furthermore numerical dispersion occurring as part of the solution method has to also be factored into the dispersion estimate Finally if too large of a dispersion value is assigned contaminants will be artificially dispersed vertically through the upper and lower aquitards into the underlying aquifers Therefore the relatively low values of 50 5 and 1 ft were assigned to the longitudinal transverse and vertical dispersivities respectively
Retardation Factor The rate at which contaminants migrate relative to groundwater is termed the retardation factor and is determined by the effective porosity (see definition above) bulk density and distribution coefficient Adsorption of carbon tetrachloride and other chlorinated solvents is expected to be relatively low in the upper medial and lower aquifer zones leading to a low degree of retardation For modeling purposes a retardation factor of zero was assumed
Chemical and Biological Transformations
Most VOCs and chlorinated solvents including carbon tetrachloride are subject to biological and chemical transformations in the subsurface environment Biological transformations include aerobic degradation anaerobic degradation and co-metabolism Several chemical properties of both water and soil influence the stability of chlorinated solvents in an aquifer Chemical transformations include hydrolysis dehydrohalogenation and reduction in water These typically require low groundwater flow rates and therefore it is unlikely that these chemical transformations will play a significant role at the Site
Carbon tetrachloride can be reduced under anaerobic conditions via three different pathways
US EPA Region 7 Garvey Groundwater Flow Modeling Memo 15 July 2012
HGLmdashGroundwater Flow Modeling Technical Memorandum Garvey Elevator Site ndash Hastings NE
bull reductive dechlorination where carbon tetrachloride is reduced to chloroform chloroform is reduced to methylene chloride and methylene chloride is reduced to methane
bull a simple two-electron reduction process in which chloroform is only a minor product and
bull a one-electron reduction via sulfur and oxygen where carbon tetrachloride is reduced to carbon dioxide and chloroform is not produced
Based on the groundwater sample analytical results collected during the RI field investigation some degree of biodegradation of the carbon tetrachloride groundwater plume is occurring as evidenced by the presence of the degradation products chloroform and methylene chloride (HGL 2011) Concentrations of these degradation products are typically one to two orders of magnitude less than those of carbon tetrachloride in samples collected at the Site However chloroform concentrations are similar to or slightly greater than carbon tetrachloride concentrations in many of the groundwater transect samples collected downgradient of the Site indicating that biodegradation is occurring but not at an accelerated rate Therefore no degradation of carbon tetrachloride was assumed in the model
72 OU 1 - REMEDIAL ALTERNATIVES
The remedial scenarios being considered as part of the FS are presented in Table 71 As shown in the table there are four scenarios included under OU 1 The No Action Alternative (SG-1) and Maintaining and Operating the Existing Groundwater Extraction System (SG-2) would require a significant length of time for on-site carbon tetrachloride concentrations to fall below the maximum contaminant level (MCL) of 5 micrograms per liter (μgL) which is established as the preliminary cleanup level (PCL) These alternatives were not explicitly modeled
For the no action alternative (SG-1) the duration to reach MCLs should intuitively be longer than other alternatives that use active treatment methods However for cost estimating purposes it is assumed that the duration for SG-1 is 30 years
For alternative SG-2 the duration to achieve MCLs was estimated using groundwater contamination data from monitoring wells and recovery wells at the site Table 71 summarizes analytical data from these wells including projected times to achieve MCLs based on concentration trends Using these data an estimated duration of 30 years has been assumed for alternative SG-2 to achieve MCLs
721 SG3 - In-Situ Treatment via Groundwater Amendments
This alternative involves shutting off the existing groundwater extraction system and injecting amendments to remediate contaminated groundwater within the 500 μgL contour As shown in Figure 71 the initial conditions for this portion of the plume have been set to zero and the pumping and injection wells in the upper medial and lower aquifers have been shut off The model predicts that it would take approximately 4 years for the plume to disperse and the concentrations of carbon tetrachloride to decrease below the MCL of 5 μgL These
US EPA Region 7 Garvey Groundwater Flow Modeling Memo 16 July 2012
HGLmdashGroundwater Flow Modeling Technical Memorandum Garvey Elevator Site ndash Hastings NE
predictions are unrealistically short however for the following reasons diffusion back out of the finer grained clays is limited by concentration gradients that often lead to very long cleanup time frames and although sorption is probably low it can significantly increase remediation times particularly when coupled with diffusion processes For these reasons the remediation time for alternative SG3 was increased to 15 years
722 SG4 - Maintain and Operate Existing GET System and Treat Via Amendments
This alternative is identical to SG3 except that the existing groundwater extraction and treatment (GET) system remains on To ensure that the existing GET system is effective at capturing the contamination a capture zone analysis was conducted with the computer code MODPATH
MODPATH is a widely accepted 3-D particle-tracking model that uses the flow fields created by MODFLOW to predict groundwater flow directions Particle tracking is a form of flow and transport modeling that represents the bulk movement of groundwater Particle tracking neglects the effects of chemical reactions dispersion and diffusion The particle tracking analysis involves adding particles to the model at selected locations and then allowing the model to move the particles in the direction of groundwater flow The results of a particle tracking simulation are displayed by plotting pathlines through the aquifer Although both forward and reverse particle tracking can be performed with MODPATH for the Garvey Elevator Site only forward-tracking analyses are conducted
Before initiating the capture zone analysis the groundwater extraction rates were changed from those used to calibrate the model to rates that better reflect long term pumping rates The revised rates are as follows
Garvey Elevator Site
bull RW-1 = 35 gpm bull RW-2 = 68 gpm bull RW-3 = 90 gpm bull RW-4 = 102 gpm bull RW-5 = 50 gpm bull RW-6 = 900 gpm bull RW-7 = 680 gpm bull RW-8 = 1280 gpm
West Highway 6 amp Highway 281 Site
bull EW-1 = 61 gpm bull EW-2 = 83 gpm bull EW-3 = 41 gpm bull EW-4 = 00 gpm
Shallow Aquifer
US EPA Region 7 Garvey Groundwater Flow Modeling Memo 17 July 2012
HGLmdashGroundwater Flow Modeling Technical Memorandum Garvey Elevator Site ndash Hastings NE
As shown on Figure 72 particles released to all the model layers indicate that the extraction wells are effectively containing the on-site carbon tetrachloride plume At some point downgradient however capture is lost and the contaminants will continue to migrate with the groundwater
Medial Aquifer
The results of the particle-tracking analysis for the medial aquifer are presented as Figure 73 The particle tracking illustrates that the modeled capture zone extends sufficiently downgradient to capture the contamination that has moved immediately off site
The predicted remediation time for this alternative is about 2 years (Table 72) The removal of the contamination with the pumping wells has shortened the time from that predicted for Alternative SG3 As was the case for Alternative SG3 these predictions are unrealistically short for the same reasons For these reasons the remediation time for alternative SG3 was increased to 10 years
73 OU 2 - REMEDIAL ALTERNATIVES
Six remedial alternatives were considered for OU 2 (Table 72) Although it was not modeled based on the predicted remediation times of greater than 100 years for the G2 scenario the No-Action alternative (G1) remediation time is predicted to take more than 100 years However for cost estimating purposes it will be assumed that the duration for SG-1 is 30 years
731 G2 - Groundwater Recovery and Treatment at Leading Edge of Plume
This alternative involves pumping and treating the groundwater from the toe of the medial and lower aquifer plumes As shown in Figures 74 and 75 three wells would need to be placed in both the medial and lower aquifers to ensure capture of the plume The relative position of the two sets of wells is depicted on Figure 76 Each of the medial wells would be pumped at 50 gpm and the lower aquifer wells would each be pumped at 150 gpm The predicted remediation time for this alternative is greater than 100 years For costing purposes a duration of 100 years is assumed
732 G3a - Groundwater Recovery and Treatment at Leading Edge and Midpoint of Plume
This alternative is the same as Alternative G2 but in addition to pumping and treating contaminated groundwater from the toe of the plume contaminated groundwater is also pumped and treated from the midpoint of the medial and lower aquifer plume(s) A series of simulations were run in which the midpoint wells were located along different transects in order to decrease the remediation times the most optimal locations are shown in Figures 77 and 78
US EPA Region 7 Garvey Groundwater Flow Modeling Memo 18 July 2012
HGLmdashGroundwater Flow Modeling Technical Memorandum Garvey Elevator Site ndash Hastings NE
The relative position of the two sets of wells is depicted on Figure 79 Each of the medial wells would be pumped at 50 gpm and the lower aquifer wells would each be pumped at 150 gpm The predicted remediation time for this alternative is between 75 and 95 years For cost estimating purposes a duration of 75 years will be assumed
733 G3b - Groundwater Recovery and Treatment at Leading Edge and Midpoint of Medial Aquifer and Two Recovery Well Transects in Lower Plume
The results from G3a indicate that the contamination in the lower aquifer takes the longest time to remediate Therefore this alternative was added to determine how much the remediation times could be reduced if a second set of recovery wells was added to the lower aquifer The placement of the recovery wells in the medial aquifer remains the same as for Alternative G3a (Figure 77) The locations of the two transects of recovery wells in the lower aquifer are shown on Figure 710 Their placement relative to the medial wells is shown in Figure 711 Each of the medial wells would be pumped at 50 gpm and each of the lower aquifer wells would be pumped at 150 gpm The predicted remediation time for this alternative is about 53 years
734 G4a - Establishment of In Situ Treatment Zone at Midpoint of Lower Aquifer Plume and Groundwater Recovery and Treatment at Leading Edge of Medial and Lower Plumes
This alternative involves adding a treatment curtain to the pumping wells specified in the G2 alternative (Figure 712) The transect is simulated as a zero concentration boundary which effectively removes all of the carbon tetrachloride from the groundwater moving through it The relative position of the transect and wells is depicted on Figure 713 Each of the medial wells would be pumped at 50 gpm and each of the lower aquifer wells would be pumped at 150 gpm The predicted remediation time for this alternative is between 75 and 95 years For cost estimating purposes a duration of 75 years is assumed
735 G4b - Establishment of In Situ Treatment Zone(s) at Two Transects of Lower Aquifer Plume and Groundwater Recovery and Treatment at Leading Edge of Medial and Lower Plumes
This alternative involves adding two treatment curtains to the pumping wells specified in the G2 alternative (Figure 714) The relative position of the transects and recovery wells is depicted on Figure 715 Each of the medial wells would be pumped at 50 gpm and the lower aquifer wells each at 150 gpm The predicted remediation time for this alternative is about 56 years
80 SUMMARY AND CONCLUSIONS
A hydrogeologic conceptual site model of the subsurface groundwater flow and contaminant transport was developed to guide the creation of a numerical model The numerical model
US EPA Region 7 Garvey Groundwater Flow Modeling Memo 19 July 2012
HGLmdashGroundwater Flow Modeling Technical Memorandum Garvey Elevator Site ndash Hastings NE
was subsequently calibrated with existing field data (known water levels and pumping rates) to address the following objectives (1) evaluate the overall effectiveness of the current extraction well system (2) identify areas outside of the capture zone that may require enhancements and (3) develop a tool to assist in ldquowhat ifrdquo scenarios for the remedial alternative development
MODFLOW-2000 MT3D-MS and MODPATH are the computer codes applied to conduct the flow and transport analysis The output from MODFLOW-2000 is a groundwater velocity field which is used by MT3D-MS in conjunction with fate and transport parameters to simulate the migration of carbon tetrachloride Particle tracking analyses were also conducted with MODPATH to illustrate the groundwater flow directions travel times and capture zones All of these computer codes are widely used well documented and in the public domain
With respect to the construction of the model a three layer finite difference grid was utilized that simulates the upper middle and lower aquifers covers 102 square miles and includes 1030200 active cells
Calibration of the steady state flow model was accomplished iteratively by adjusting model parameters during successive model runs to match the water level data that was collected from all of the wells on September 26-27 2011 under stressed (pumping) conditions
The flow and transport model was initialized with measured carbon tetrachloride data obtained during a 2011 sampling event These initial concentrations were used as the basis to predict future concentrations under various remedial alternatives involving extraction wells and treatment curtains
Remediation times for OU 1 scenarios varied from 10 to 30 years Scenarios from the No Action alternative and alternative SG-2 were not modeled but were based on an assumed cost basis period and a duration based on existing concentration data trends respectively Remediation times for OU 2 scenarios range from 30 years to more than 100 years
90 REFERENCES
Doherty J 2006 PEST Model-Independent Parameter Estimation User Manual 5th Edition Watermark Computing
Harbaugh AW Banta ER Hill MC and McDonald MG 2000 MODFLOWndash2000 the US Geological Survey Modular Ground-Water ModelmdashUser guide to modularization concepts and the ground-water flow process US Geological Survey Open-File Report 00ndash92 121 p
HydroGeoLogic Inc (HGL) 2009 Focused Feasibility Study Version 4 Garvey Elevator Site OU 1 Garvey Elevator Site Hastings Nebraska December
HGL 2011 Final Remedial Investigation Report Garvey Elevator Site Hastings Nebraska April
US EPA Region 7 Garvey Groundwater Flow Modeling Memo 20 July 2012
HGLmdashGroundwater Flow Modeling Technical Memorandum Garvey Elevator Site ndash Hastings NE
McDonald MG and AW Harbaugh 1988 A Modular Three-dimensional Finite-difference Groundwater Flow Model US Geological Survey TWRI Chapter 6-A1
Pollock DW 1994 Userrsquos Guide for MODPATHMODPATH-PLOT Version 3A particle tracking post-processing package for MODFLOW the U S Geological Survey finite-difference ground-water flow model U S Geological Survey Open-File Report 94shy464
Rumbaugh JO and DB Rumbaugh 1998 Groundwater Vistas Version 516 Environmental Simulations
US Army Corps of Engineers (USACE) 1990 Final Groundwater Modeling Report Hastings East Industrial Park Remedial InvestigationFeasibility Study Hastings Nebraska August
Zheng C 1990 MT3D A modular three-dimensional transport model for simulation of advection dispersion and chemical reactions of contaminants in groundwater systemsrdquo Report to the US Environmental Protection Agency Robert S Kerr Environmental Research Laboratory Ada OK
Zheng Chunmiao and Wang P Patrick 1999 ldquoMT3DMS A modular three-dimensional multispecies transport model for simulation of advection dispersion and chemical reactions of contaminants in groundwater systems documentation and userrsquos guiderdquo Contract Report SERDP-99-1 US Army Engineer Research and Development Center Vicksburg Mississippi
Attachments
Attachment 1 Tables Attachment 2 Figures
US EPA Region 7 Garvey Groundwater Flow Modeling Memo 21 July 2012
This page was intentionally left blank
ATTACHMENT 1 TABLES
Table 51 Table 61 Table 71 Table 72
Contact Elevations of the Major Lithologic Units Water Level Calibration Statistics Groundwater Data Summary Projected Durations to Meet MCLs Remedial Alternatives Summary
This page was intentionally left blank
Table 51 Contact Elevations of the Major Lithologic Units
Garvey Elevator Site Hastings Nebraska
Elev Depth Elev Depth Elev Depth Elev Thickne Depth Elev Depth Elev Thickne Depth Elev Depth Elev (ft) (ft) (ft bgs) (ft amsl) (ft bgs) (ft amsl) (ft bgs) (ft amsl) (ft bgs) (ft amsl) (ft) (ft bgs) (ft amsl) (ft bgs) (ft amsl) (ft) (ft bgs) (ft amsl) (ft bgs) (ft amsl)
OU1 MW-1A 270590926 2080164407 125 192580 645 186130 995 182630 -- -- -- -- -- -- -- -- -- -- -- --OU1 MW-2A 271240410 2080539870 1235 192733 685 185883 835 184383 -- -- -- -- -- -- -- -- -- -- -- --OU1 MW-3ABDE 270755170 2080773994 243 193099 595 187149 111 181999 134 179707 1 135 179607 155 177530 1 156 177430 2385 169249 OU1 MW-4AB 270341995 2080827075 132 193184 585 187334 89 184284 -- -- -- -- -- -- -- -- -- -- -- --OU1 MW-5ABD 269943836 2080752777 188 193006 635 186656 885 184156 132 179785 1 133 179685 -- -- -- -- -- -- --OU1 MW-6ADE 271237345 2081216968 238 192948 735 185598 935 183598 129 180046 1 130 179946 155 177446 5 160 176946 -- --OU1 MW-7AB 269088475 2079699700 135 192092 55 186592 90 183092 -- -- -- -- -- -- -- -- -- -- -- --OU1 MW-8A 271214203 2079067544 132 194080 608 188000 90 185080 -- -- -- -- -- -- -- -- -- -- -- --OU1 MW-9A 272193736 2080628145 116 192540 70 185540 90 183540 -- -- -- -- -- -- -- -- -- -- -- --OU2 MW-10AB 272535399 2081973782 130 192381 65 185881 85 183881 125 179870 1 126 179770 -- -- -- -- -- -- --OU2 MW-11A 271826499 2083509070 110 191228 70 184228 90 182228 -- -- -- -- -- -- -- -- -- -- -- --OU2 MW-12AC 270399710 2085390335 170 191713 50 186713 805 183663 -- -- -- -- -- -- -- -- -- -- -- --
OU2 (new) MW-12D 270399901 2085403521 178 191698 57 185998 88 182898 120 179698 7 127 178998 -- -- -- -- -- -- --OU1 MW-13CE 270368902 2081015694 238 192874 75 185374 90 183874 130 179874 1 131 179774 -- -- -- -- -- 235 169374 OU2 MW-14A 270968774 2084137323 1085 190956 695 184006 895 182006 -- -- -- -- -- -- -- -- -- -- -- --OU2 MW-16AC 267054564 2084286931 160 191545 50 186545 80 183545 -- -- -- -- -- -- -- -- -- -- -- --OU2 MW-17ACD 268796556 2082958916 200 190185 60 184185 85 181685 -- -- -- -- -- -- -- -- -- -- -- --OU2 MW-18ACD 268693818 2085938384 205 191064 55 185564 95 181564 1155 179514 1 1165 179414 -- -- -- -- -- -- --OU1 MW-19AC 270955133 2081332850 165 192781 61 186681 895 183831 128 179981 8 136 179181 150 177781 2 152 177581 -- --OU1 MW-20ACDE 270597445 2081202233 255 192797 54 187397 87 184097 129 179897 7 136 179197 150 177797 2 152 177597 236 169197 OU1 MW-30ACDE 270271723 2081095430 255 192903 70 185903 85 184403 1255 180353 7 1325 179653 146 178303 2 148 178103 237 169203 OU1 MW-31AC 269550764 2080816035 165 193008 63 186708 883 184178 -- -- -- -- -- -- -- -- -- -- -- --OU1 MW-33 271206314 2079068057 255 194074 84 185674 95 184574 1385 180224 55 144 179674 167 177374 675 17375 176699 240 170074
OU1 (new) MW-47BCD 270781240 2081046150 1705 192995 -- -- -- -- 1315 179845 15 133 179695 151 177895 2 153 177695 -- --OU1 (new) MW-48BCD 270645490 2080859850 171 192887 -- -- -- -- 129 179987 35 1325 179637 1498 177907 5 1548 177407 -- --OU1 (new) MW-49BCD 270039470 2080890150 171 192934 -- -- -- -- 1305 179884 15 132 179734 1495 177984 4 1535 177584 -- --OU1 (new) MW-50BCD 270307290 2080987510 170 192925 -- -- -- -- 1275 180175 5 1325 179675 1495 177975 1 1505 177875 -- --OU1 (new) MW-51BCD 270487290 2080899910 171 192943 -- -- -- -- 1268 180263 52 132 179743 1495 177993 45 154 177543 -- --OU2 (new) MW-41D1 266698811 2089673996 171 191524 62 185324 92 182324 126 178899 2 128 178699 148 176699 2 150 176499 -- --OU2 (new) MW-41D2 266708267 2089674259 206 191499 62 185299 92 182299 126 178899 2 128 178699 148 176699 2 150 176499 -- --OU2 (new) MW-42DE 269168074 2100135574 215 190207 66 183607 98 180407 124 177823 10 134 176823 -- -- -- -- -- -- --OU2 (new) MW-43DE 265395404 2097605590 2215 190835 48 186035 89 181935 -- -- -- -- -- 153 175545 2 155 175345 -- --OU2 (new) MW-44DE 267552324 2105258206 214 188530 63 182230 92 179330 119 176630 3 122 176330 1425 174280 75 150 173530 -- --OU2 (new) MW-45CD 270056199 2083476668 170 190982 50 185982 89 182082 112 179746 3 115 179446 -- -- -- -- -- -- --OU2 (new) MW-46D1 269055295 2089632928 167 191097 61 184997 94 181697 121 179003 3 124 178703 148 176303 6 154 175703 -- --OU2 (new) MW-46D2 269063843 2089632455 202 191103 61 185003 94 181703 121 179003 3 124 178703 148 176303 6 154 175703 -- --
Hwy 6 MW-104ACD 271937379 2088225393 235 190901 472 186181 936 181541 115 179401 12 127 178201 -- -- -- -- -- 220 168901 Hwy 6 MW-105ACD 270069428 2089866388 257 191679 68 184879 105 181179 123 179379 10 133 178379 -- -- -- -- -- 2455 167129 Hwy 6 MW-106ACD 270452369 2098166199 255 190664 77 182964 1075 179914 130 177664 5 135 177164 -- -- -- -- -- 248 165864 OU1 I-1 270863284 2080138346 175 19212 -- -- -- -- -- -- -- -- -- -- -- -- -- -- -- --OU1 I-2 270331729 2080131336 175 19200 -- -- -- -- -- -- -- -- -- -- -- -- -- -- -- --OU1 HTW-40 271217856 2079157749 -- 19395 -- -- -- -- -- -- -- -- -- -- -- -- -- -- -- --
Hwy 6 HTW-100 273075261 2082012337 255 19066 770 182964 1076 179904 130 177664 55 -- -- -- -- -- -- -- -- --
Surface Elevation -
Surficial Soil Peoria and
Loveland Loess
Very Fine Sand Silty Fine Sand
Clayey Silt
Silty Sand and Gravel (contains Upper Aquifer)
Upper Aquitard Medial Aquifer
Monitoring Wells
Boring DepthEasting(2)Northing(2)
Well ID Lower Aquitard Lower AquiferSite
Top of Lithologic and Hydrostratigraphic Units(1)
Decomposed Weathered
Shale
Sheet 1 of 2
Table 51 Contact Elevations of the Major Lithologic Units
Garvey Elevator Site Hastings Nebraska
Elev Depth Elev Depth Elev Depth Elev Thickne Depth Elev Depth Elev Thickne Depth Elev Depth Elev (ft) (ft) (ft bgs) (ft amsl) (ft bgs) (ft amsl) (ft bgs) (ft amsl) (ft bgs) (ft amsl) (ft) (ft bgs) (ft amsl) (ft bgs) (ft amsl) (ft) (ft bgs) (ft amsl) (ft bgs) (ft amsl)
Surface Elevation -
Surficial Soil Peoria and
Loveland Loess
Very Fine Sand Silty Fine Sand
Clayey Silt
Silty Sand and Gravel (contains Upper Aquifer)
Upper Aquitard Medial Aquifer Boring DepthEasting(2)Northing(2)
Well ID Lower Aquitard Lower AquiferSite
Top of Lithologic and Hydrostratigraphic Units(1)
Decomposed Weathered
Shale
OU1 (new) SB-09 270168160 2080517340 13160 192984 59 187084 90 183984 130 179984 1 131 179884 -- -- -- -- -- -- --OU1 (new) SB-13 269654838 2080309785 14340 192973 67 186273 87 184273 130 179973 3 133 179673 -- -- -- -- -- -- --OU1 (new) SB-29 270864398 2081035503 14215 192989 68 186189 90 183989 -- -- -- -- -- -- -- -- -- -- -- --OU1 (new) SB-32 271237915 2079979855 14865 192475 66 185875 92 183275 -- -- -- -- -- 148 177675 297 149 177575 -- --OU1 (new) SB-33 269199799 2080682378 14085 193446 63 187146 93 184146 -- -- -- -- -- -- -- -- -- -- -- --OU1 (new) SB-39 271537352 2081550026 13560 192583 64 186183 89 183683 -- -- -- -- -- -- -- -- -- -- -- --OU2 (new) TS1-01 269515615 2089614339 864 191569 70 184569 86 182969 -- -- -- -- -- -- -- -- -- -- -- --OU2 (new) TS1-03 268313868 2089646765 16736 191251 66 184651 86 182651 1195 179301 05 120 179251 148 176451 5 153 175951 -- --OU2 (new) TS1-05 267030127 2089665004 16681 191624 75 184124 87 182924 117 179924 2 119 179724 153 176324 308 155 176124 -- --OU2 (new) TS2-02 271456113 2097510251 13680 191015 73 183715 104 180615 134 177614 3 137 177314 -- -- -- -- -- -- --OU2 (new) TS2-04 268939527 2097554155 16746 190360 70 183360 89 181460 126 177760 9 135 176860 152 175160 306 154 174960 -- --OU2 (new) TS2-05 267717573 2097569698 17161 190143 62 183943 99 180243 -- -- -- -- -- 157 174443 2 159 174243 -- --OU2 (new) TS2-06 266250085 2097592053 11980 190501 60 184501 100 180501 -- -- -- -- -- -- -- -- -- -- -- --OU2 (new) TS3-02 269400264 2102787273 15690 189415 68 182615 96 179815 125 176915 7 132 176215 147 174715 297 150 174415 -- --OU2 (new) TS3-05 265786308 2102812115 14380 189056 67 182356 96 179456 1195 177106 1 1205 177006 129 176156 261 132 175856 -- --OU2 (new) TS4-02 267112179 2105261928 17031 188448 64 182048 96 178848 116 176848 3 119 176548 141 174348 284 143 174148 -- --
Hwy 6 TS3-01 271941141 2089537242 1453 19153 720 184334 1125 180284 1256 178974 29 1285 178684 -- -- -- -- -- -- --Hwy 6 TS3-02 271499828 2089579255 1414 19139 692 184466 102 181186 1227 179116 59 1286 178526 -- -- -- -- -- -- --Hwy 6 TS3-03 270957676 2089591662 1440 19087 710 183767 941 181457 1178 179087 56 1234 178527 -- -- -- -- -- -- --Hwy 6 TS3-04 270411434 2089597601 1403 19088 663 184254 1006 180824 1167 179214 61 1228 178604 -- -- -- -- -- -- --Hwy 6 TS3-05 272464675 2089528557 1718 19173 685 184883 1032 181413 123 179433 7 130 178733 -- -- -- -- -- -- --Hwy 6 TS4-01 271882569 2095813356 1658 19042 650 183920 987 180550 1238 178040 52 129 177520 -- -- -- -- -- -- --Hwy 6 TS4-03 270996450 2096068696 1171 19050 810 182400 966 180840 1154 178960 12 1166 178840 -- -- -- -- -- -- --Hwy 6 TS5-01 271766686 2092074297 1562 19016 648 183680 905 181110 1163 178530 53 1216 178000 -- -- -- -- -- -- --Hwy 6 TS5-03 270732978 2092105115 1389 19008 709 182990 923 180850 1147 178610 46 1193 178150 -- -- -- -- -- -- --Hwy 6 TS5-05 272269991 2092059880 1717 19045 425 186200 942 181030 1153 178920 83 1236 178090 -- -- -- -- -- -- --
Electrical Conductivity Borings
(1)Surface elevation listed for nested monitoring wells (ABCDE) is the surface elevation of the A well Unit elevations are from the boring logs in which they were recorded (2)State Plane Coordinate system Nebraska 2600 amsl - above mean seal level bgs - below ground surface Elev - elevation ft - feet Hwy 6 - Wellsborings installed for the West Highway 6 and Highway 281 Site Investigations -- - not applicable or not available OU1 - Operable Unit 1 these wells are associated with on-site groundwater OU1 (new) - Operable Unit 1 wellsborings installed in AprilMay 2010 for the RI OU2 - Operable Unit 2 these wells are associated with off-site groundwater OU2 (new) - Operable Unit 2 Monitoring wellsborings installed in AprilMay 2010 for the RI
Sheet 2 of 2
Table 61 Water Level Calibration Statistics
Garvey Elevator Site Hastings Nebraska
Name Layer
Target Water Level Elevation - Sept 2011
(feet amsl) Model
Water Level Error
Residual MW-12U 1 18156 1814424820 117518 MW-100A 1 181542 1814519751 0900249 MW-16U 1 181534 1814385390 095461 MW-10A 1 181528 1814182851 1097149 MW-1A 1 181525 1815209270 004073 MW-2A 1 181519 1815393838 -0203838 MW-05 1 181516 1814358176 0801824
MW-102A 1 18151 1813770877 1329123 MW-13U 1 181507 1813730081 1339919 MW-7A 1 181504 1815242607 -0202607 MW-04 1 181487 1814376802 0493198
MW-17U 1 181486 1814230581 0629419 MW-07 1 181475 1814008616 0741384 MW-03 1 181471 1813907473 0802527 MW-02 1 181468 1813743101 0936899 MW-08 1 181465 1814180036 0469964 MW-06 1 18146 1814237391 0362609
MW-10U 1 181453 1814016597 0513403 MW-14U 1 181451 1814457639 0052361 MW-6A 1 181444 1814334070 010593 MW-01 1 18144 1814062502 0337498
MW-11A 1 181429 1812347804 1942196 MW-11U 1 181411 1814658764 -0548764 MW-10B 1 181372 1814173608 -0453608 MW-3A 1 181357 1813385654 0184346 MW-5B 1 181339 1813199091 0190909 MW-15U 1 181326 1814948966 -1688966 MW-47B 1 181316 1812784852 0375148 MW-50B 1 181314 1812748409 0391591 MW-4A 1 18131 1812992455 0107545 MW-3B 1 181308 1813389494 -0309494 MW-5A 1 181307 1813165365 -0095365 MW-19A 1 181301 1813252060 -024206 MW-4B 1 181298 1812954715 0025285 MW-31A 1 181289 1812885039 0004961 MW-51B 1 181236 1812125173 0234827 MW-49B 1 181227 1812349041 -0079041 MW-48B 1 18122 1812098306 0101694 MW-30A 1 181194 1812183956 -0243956 MW-09U 1 181194 1814076063 -2136063 MW-20A 1 181179 1812309176 -0519176 MW-14A 1 181061 1810498570 011143 MW-17A 1 18098 1809745419 0054581
Sheet 1 of 3
Table 61 Water Level Calibration Statistics
Garvey Elevator Site Hastings Nebraska
Name Layer
Target Water Level Elevation - Sept 2011
(feet amsl) Model
Water Level Error
Residual MW-12A 1 180706 1807353224 -0293224 MW-16A 1 180683 1806758847 0071153 MW-18A 1 18062 1805744494 0455506 MW-104A 1 180386 1804035180 -017518 MW-105A 1 179994 1799915974 0024026 MW-106A 1 178857 1788240807 0329193 MW-18C 3 180409 1804214829 -0124829 MW-12C 3 180568 1805675664 0004336 MW-16C 3 180625 1806232799 0017201 MW-45C 3 180888 1809089044 -0209044 MW-17C 3 180918 1809113670 006633 MW-47C 3 181047 1810251020 021898 MW-101B 3 181066 1811509656 -0849656 MW-102B 3 181092 1811706686 -0786686 MW-13C 3 181107 1811204349 -0134349 MW-51C 3 181177 1811366716 0403284 MW-50C 3 18119 1811832475 0067525 MW-49C 3 181235 1812474567 -0124567 MW-48C 3 18125 1812312538 0187462 MW-7B 3 181497 1815042613 -0072613
MW-09M 5 181527 1813657691 1612309 MW-3D 5 181479 1814354375 0435625 MW-3E 5 181379 1814210888 -0420888 MW-5D 5 181366 1813572038 0087962 MW-47D 5 181365 1812738611 0911389 MW-49D 5 18134 1813402643 -0002643 MW-48D 5 181323 1812926923 0303077 MW-50D 5 181323 1812962182 0267818 MW-31C 5 181311 1813127460 -001746 MW-51D 5 181302 1812256458 0763542 MW-13E 5 181234 1812181638 0158362
MW-100D 5 181223 1813629694 -1399694 MW-100C 5 181216 1813634399 -1474399 MW-30C 5 181208 1811949179 0130821 MW-19C 5 1812 1812353637 -0353637 MW-20D 5 181196 1811924735 0035265 MW-30D 5 181188 1811949179 -0069179 MW-20E 5 181155 1811924735 -0374735 MW-16M 5 181133 1811653909 -0323909 MW-13M 5 181117 1811940971 -0770971 MW-30E 5 181115 1811949179 -0799179 MW-11M 5 181097 1814139713 -3169713 MW-17D 5 180923 1808958032 0271968
Sheet 2 of 3
Table 61 Water Level Calibration Statistics
Garvey Elevator Site Hastings Nebraska
Name Layer
Target Water Level Elevation - Sept 2011
(feet amsl) Model
Water Level Error
Residual MW-20C 5 180892 1811924735 -3004735 MW-45D 5 180884 1809292039 -0452039 MW-12D 5 180575 1805738454 0011546 MW-18D 5 180413 1804194578 -0064578 MW-104D 5 180137 1801272389 0097611 MW-104C 5 180135 1801269033 0080967 MW-46D1 5 179796 1797768438 0191562 MW-105D 5 179794 1797798970 014103 MW-46D2 5 179792 1797771831 0148169 MW-105C 5 179791 1797803499 0106501 MW-41D2 5 179702 1797046783 -0026783 MW-41D1 5 179697 1797044368 -0074368 MW-106C 5 178531 1785334635 -0024635 MW-106D 5 178527 1785320367 -0050367 MW-43D 5 178387 1783880124 -0010124 MW-43E 5 178386 1783888909 -0028909 MW-42D 5 178183 1781770173 0059827 MW-42E 5 178182 1781753639 0066361 MW-44D 5 177409 1774079493 0010507 MW-44E 5 177407 1774078775 -0008775
Residual Mean 0046933 Res Std Dev 0743461 Sum of Squares 6048817
RMS Error 0744941 Min Residual -3169713 Max Residual 1942196
Number of Observations 109 Range in Observations 4362
Scaled Std Dev 0017044 Scaled Abs Mean 0010505
Scaled RMS 0017078 Notes
amsl - above mean sea level
Sheet 3 of 3
Table 71 Groundwater Data Summary Projected Durations to Meet MCLs
Garvey Elevator Site Hastings Nebraska
Well Data Collection Range TCE Concentration μgL Estimated Date to
Reach MCLs Duration from June 2012 yrsHigh Low
MW-3A May 1997 - March 2012 20000 11 already achieved NA MW-3B May 1997 - March 2012 23000 74 Nov 2045 33 MW-3D April 1997 - March 2012 5 05 already achieved NA MW-3E April 1997 - March 2012 4 05 already achieved NA MW-4A May 1997 - March 2012 18000 43 Sept 2013 1 MW-4B May 1997 - March 2012 29000 690 Dec 2042 30 MW-5A May 1997 - March 2012 24000 47 already achieved NA MW-5B May 1997 - March 2012 15000 12 Jan 2017 5 MW-5D April 1997 - March 2012 4 05 already achieved NA MW-13C May 1997 - March 2012 18000 28 Nov 2061 49 MW-13E May 1997 - March 2012 5 05 already achieved NA
RW-1 1999 - 2011 490 10 May 2016 4 RW-2 1999 - 2011 3200 5 Nov 2021 9 RW-3 1999 - 2011 3800 5 Feb 2024 12 RW-4 1997 - 2011 5500 5 June 2016 4 RW-5 1999 - 2011 5500 5 achieved NA RW-6 1999 - 2011 590 10 Oct 2018 6 RW-7 1995 - 2011 1000 5 Jan 2025 13 RW-8 1998 - 2011 380 5 March 2047 35
Notes
Dates and concentration data are from the site database projections to reach MCLs are based on curves fitted to data plots as provided by Dr Brian
Zurbuchen via email on June 11 2012
μgL - micrograms per liter
Sheet 1 of 1
Table 72 Remedial Alternatives Summary
Garvey Elevator Site Hastings Nebraska
Remedial Alternative Assumptions Remediation
Times Notes
OU 1
SG-1-No Action All extraction wells off 30 years
This scenario was not explicity modeled Based on the remedition duration predicted for SG2 remediation time will be greater than 30 years However for cost estimating purposes a 30-year duration will be used
SG2-- Maintain and Operate Existing GET System
No treatment of downgradient plume
30 years This scenario was not explicity modeled but remediation time was estimated based on contaminant concentration trends (see Table 71)
SG3--In Situ Treatment Via Groundwater Amendments
Area within gt500 ugL set to 00 on-site treatment system shut off
15 years Remediation time estimates are for OU1 (on-site) plume using multiple injection treatments and existing GET system shut off
SG4-- Maintain and Operate Existing GET System and Treatment Via Groundwater Amendments
Pump and treat system operating groundwater within concentrations gt500 ugL set to 00
10 years Remediation time estimates are for OU1 (on-site) plume using multiple injection treatments and existing GET system operating
OU 2
G1-No Action Pump and treat system operating no treatment of downgradient plume
30 years This scenario was not explicity modeled For cost estimating purposes a 30-year duration will be used
G2-Groundwater Recovery Treatment and Discharge at Leading Edge of Plume
On-site pump and treat system operating
100 years Based upon modeling results for more active remedies the remediation times for both the OU 1 and OU 2 plumes would exceed 100 years This scenario was not explicity modeled
G3a-Groundwater Recovery Treatment and Discharge at mid point and Leading Edge of Plume
On-site pump and treat system operating
75 years
Modeled duration ranges from 75 to 90 years
G3b-Groundwater Recovery Treatment and Discharge at two transects and Leading Edge of Plume
On-site pump and treat system operating
53 years
G4a-In Situ treatment at midpoint of plume and Groundwater Recovery Treatment and Discharge at leading edge of plume
On-site pump and treat system operating
75 years
Same as G3 but a treatment zone replaces the recovery wells near the midpoint of the plume Modeled duration ranges from 75 to 90 years
G4b-In Situ treatment at two transects near core of plume and Groundwater Recovery Treatment and Discharge at leading edge of plume
On-site pump and treat system operating
56 years Same as G3 but two treatment zones replace the recovery wells near the midpoint of the plume
Notes
μgL - micrograms per liter
Sheet 1 of 1
This page was intentionally left blank
ATTACHMENT 2 FIGURES
Figure 31 Carbon Tetrachloride Isoconcentrations Upper Aquifer Zone AB Figure 32 Carbon Tetrachloride Isoconcentrations Medial Aquifer Zone C Figure 33 Carbon Tetrachloride Isoconcentrations Lower Aquifer Zone DE
Figure 51 Model Domain and Boundary Conditions Figure 52 Vertical Discretization of Model Figure 53 Elevation of the Model Base Figure 54 Elevation of the Top of the Lower Aquifer Figure 55 Isopach Map of the Lower Confining Unit Figure 56 Elevation of the Base of the Medial Aquifer Figure 57 Isopach of Upper Aquifer Figure 58 Elevation of the Base of the Upper Aquifer Figure 59 Location of Recovery Wells in the Shallow Aquifer Figure 510 Location of Recovery Wells in the Medial Aquifer Figure 511 Location of Injection and Municipal Wells in the Lower Aquifer Figure 512 Initial Concentrations of Carbon Tetrachloride in the Shallow Aquifer Figure 513 Initial Concentrations of Carbon Tetrachloride in the Medial Aquifer Figure 514 Initial Concentrations of Carbon Tetrachloride in the Lower Aquifer
Figure 61 Error Residuals Versus Measured Water Levels Figure 62 Measured Water Levels Versus Predicted Water Level Elevations Figure 63 Error Residuals for the Shallow Aquifer in the Vicinity of the Garvey Elevator
Site Figure 64 Error Residuals for the Shallow Aquifer over the Model Domain Figure 65 Error Residuals for the Medial Aquifer over the Model Domain Figure 66 Error Residuals for the Lower Aquifer in the Vicinity of the Garvey Elevator
Site Figure 67 Error Residuals for the Lower Aquifer over the Entire Model Domain Figure 68 Calibrated Hydraulic Conductivities of the Shallow Aquifer Figure 69 Calibrated Hydraulic Conductivities of the Medial Aquifer Figure 610 Calibrated Hydraulic Conductivities of the Lower Aquifer Figure 611 Calibrated Hydraulic Conductivities of the Upper Aquitard Figure 612 Calibrated Hydraulic Conductivities of the Lower Aquitard Figure 613 Calibrated Potentiometric Surface of the Shallow Aquifer Figure 614 Calibrated Potentiometric Surface of the Medial Aquifer Figure 615 Calibrated Potentiometric Surface of the Lower Aquifer Figure 616 Particle Tracking Analysis to Estimate Travel Time
Figure 71 Initial Concentrations for Alternative SG3 Figure 72 Capture Zone Analysis in the Shallow Aquifer for Alternative SG3 Figure 73 Capture Zone Analysis in the Medial Aquifer for Alternative SG3 Figure 74 Alternative G2 ndash Proposed Recovery Wells Medial Aquifer
ATTACHMENT 2 FIGURES (continued)
Figure 75 Alternative G2 ndash Proposed Recovery Wells Lower Aquifer Figure 76 Preliminary Locations for Leading Edge Recovery Wells and Groundwater
Treatment Building ndash Alternative G2 Figure 77 Alternative G3ab ndash Proposed Recovery Wells Medial Aquifer Figure 78 Alternative G3a ndash Proposed Recovery Wells Lower Aquifer Figure 79 Preliminary Locations for Mid-Plume and Leading Edge Recovery Wells and
Groundwater Treatment BuildingmdashAlternative G3 Figure 710 Alternative G3b ndash Proposed Recovery Wells Lower Aquifer Figure 711 Alternative G3b ndash Relative Positions of Proposed Recovery Wells Medial and
Lower Aquifer Figure 712 Alternative G4a ndash Proposed Treatment Curtain and Recovery Wells Lower
Aquifer Figure 713 Preliminary Locations for Mid-Plume Injection Wells Leading Edge Recovery
Wells and Groundwater Treatment Building ndash Alternative G4 Figure 714 Alternative G4b ndash Proposed Treatment Curtains and Recovery Wells Lower
Aquifer Figure 715 Alternative G4b ndash Relative Positions of Proposed Recovery Wells and
Treatment Curtains
5
5
5
5
5
50
100 500
MW-6A SB-39 HGLmdashGroundwater Flow Modeling Technical MemorandumMW-2AHTW 40 (98)(ND)MW-8A MW47B ( Garvey Elevator SitemdashHastings NE(ND)
(59) SB-38
MW-19APSUS PU PPPUUU ( Figure 31 (70)MW-33 MW-3AB
Carbon Tetrachloride in the(ND53) MW49B MW-20A
+UP+UPPPP+U+U+UPPPPUUUU+UP+UPPPP+U+U+U(43) Upper Aquifer Zone AB(10)
MW-1A PU MW50B(ND) +UP+UPPPP+U+U+U September 2011 Sampling(84)
PPUUMW-4AB PPUU MW-13CE +++++UPUPPPPUUU (21640)
MW-30A (160)+UP+UPPPP+U+U+U LegendPPPUUU
1000 MW51B (1200) MW-5AB
(4119J)
Garvey Property BoundaryMW-7AB MW-31A (ND) (75) (
PPUU MW48B RailroadSB-33 (680)
Inset Ntilde Monitoring Well Location MW-47B MW-10A
(59) (ND) Multilevel Well MW-9A MW-6AHTW 40 MW-10B(ND) (98)
(ND) MW-11A S Hydraulic Conductivity
MW-33 UPPUMW-2A MW-19AU MW-14A(ND) P
(70) PU (ND) A West Highway 6 amp Highway 281 Site MW-12A AMW-106AMW-20A MW-104AMW-3A MW-8A (ND) Monitoring WellU UUU (ND)PSSU P PPP (10)(ND) (ND)(ND) U
UUUUU PUUUUP PPPPPPPPPPPPPPPPPPPPPPPUUUUPUPPPPUUUUU MW-13CE
UUUU Carbon Tetrachloride ConcentrationMW-3B MW-105A A (190)PPP A (ND)
UUUUUUUUU(53) MW-30A in micrograms per liter (microgL)PPUUPPPUUUPPPPPUUUUU
MW-12DMW-1A (160) MW-42 DEMW-45CD(ND)
MW-50B MW-49B MW-51B Carbon Tetrachloride Isoconcentration(84) PPUUPPUU(43)
PPUU(1200)
Contour (microgL)PPPUUU PPPUUUMW-46 D1D2MW-7B (5)(ND)
(Dashed Lines are Estimated)MW-7A (ND)
MW-5A (41)
MW-4A (21) MW-4B (640)
MW-48B (680)
MW-17A (ND)
MW-16A (ND) UUPP
MW-18A (ND)
MW-41 D1D2 UUPP
MW-44 DE UUPP
MW-5B
MW-31A (75)
(19)
MW-43 DE UUPP Notes
(ND) Nondetect
0 2500 5000
Feet sup3 Filename XEPA009GarveyGW_Flow_Tech_Memo Carbon_TetChl_UpperAquifer_ABmxd Project EP903401220202 Revised 061312 ST Source ENSR GDB 2008 DNR
100
5
100
SB-39MW-6AHTW 40 HGLmdashGroundwater Flow Modeling Technical Memorandum MW47C SB-38MW-33 MW-2A (62) ( Garvey Elevator SitemdashHastings NE
UUUPSUS P PPP (
U
Figure 32MW-8A MW-3ABDE MW-19C (ND) Carbon Tetrachloride in the
MW-1A +++++PPPP UPUPPPPUUUUUUU
+UP+UPPPP+U+U+U Medial Aquifer Zone CPU MW-20C +UP+UPPPP+U+U+U (ND) September 2011 SamplingMW49C
UU(ND) PPUU +++++PPPPPPPUUUUU MW50C
(ND) +UP+UPPPP+U+U+UPPPUUU LegendMW-13C
MW-4AB (130) MW-30C
MW-5AB (ND) MW48C MW51C
(ND) (ND) Garvey Property Boundary SB-33 (
MW-7AB PPUU MW-31C (ND) Railroad
Inset Ntilde Monitoring Well Location MW-47CMW-9A MW-10AB Multilevel Well(62)
HTW 40
MW-6A S Hydraulic Conductivity WellMW-11AMW-33 PPUUMW-2A
MW-19CUP (ND) P West Highway 6 amp Highway 281 SiteU MW-14A A A Monitoring WellMW-20C MW-12C MW-106CMW-104CPSS P PPP
U (ND) (ND) (90) (ND)
MW-8A MW-13C U U UUU
PMW-3ABDE PPPPPPPPUUUUPU (130) Carbon Tetrachloride ConcentrationPU UUUU UUUUUUUUUU
MW-105C A (190)MW-1A UUUUUUUUUPPPPPPPPPPPPPPPPPPP MW-30C PPPUUU MW-12D A (200) in micrograms per liter (microgL)
MW-49C UUUUPUPPPPUUPU (ND) UPPU Old Rolls MW-42 DEPP (13)(ND) Carbon Tetrachloride Isoconcentration MW-45C MW-50C (ND)
MW-51C (ND) PPUU PPUU PPUU (5) Contour (microgL)(ND)
UUU PPP MW-46 D1D2
PPP UUUMW-48C (Dashed Lines are Estimated)5MW-7AB (ND)
MW-4AB MW-17C MW-18C(ND) MW-44 DE Domestic Irrigation W ater Wells(81)MW-5AB
PPUUMW-31C MW-16C (ND)
PPUU(ND) MW-41 D1D2
PPUU
Notes MW-43 DE PPUU
(ND) Nondetect
0 2500 5000
Feet sup3 FilenameXEPA009GarveyGW_Flow_Tech_Memo Carbon_TetChl_Medial_Aquifer_Cmxd Project EP903401220202 Revised 061312 ST Source ENSR GDB 2008 DNR
50
5
5
50 100
MW-6D SB-39 HGLmdashGroundwater Flow Modeling Technical MemorandumHTW 40 (ND) SB-38MW-3DE ( Garvey Elevator SitemdashHastings NE (NDND)
UUUUPSUS P PPP MW-19AC( Figure 33MW-2A MW-33 MW47D
U (ND)
Carbon Tetrachloride in theMW-8A PPPPUUUU P Lower Aquifer Zone DEUMW-1A MW-20DEPU P
(NDND)UPUU
September 2011 Sampling MW-13EPPUUPPPU (ND)
MW50D UPMW49D (ND) UUU(ND) PPP MW-30DE Legend MW51D (ND)
(ND)MW-4AB MW48D (ND)
MW-7AB MW-5D (ND) Garvey Property Boundary
MW-31C (ND)
PPUU
(
RailroadSB-33MW-3DE (NDND)
Inset Ntilde Monitoring Well Location MW-47D
MW-9A (ND) Multilevel Well HTW 40
MW-6D MW-10AB (ND)
MW-11A S Hydraulic Conductivity Well MW-33 MW-2A UPPU
PUMW-19AC West Highway 6 amp Highway 281 Site MW-14A APU
MW-20DE MW-106D A Monitoring WellMW-104DPSSU PU PPPUUU (NDND)
MW-12C (ND)(ND)MW-8A MW-13E PU
UUUUU (ND) Carbon Tetrachloride ConcentrationU PPPPPPPPUUUUPU (190)PPUUU
PPUPPPPPPPPPPPPPPPUUUUUP
UUUUU UUUUUUU PPP A MW-105DMW-1A in micrograms per liter (microgL) AMW-30DE
PPUUPPPUUUPPPPPUUUUU(52)
(NDND) MW-12DNew RollsMW-49D (ND) (ND)
Carbon Tetrachloride Isoconcentration(ND) MW-45D PPUUMW-51D (ND)
MW-46 D1PPUU PPUU Contour (microgL)MW-50D (ND) (5)(ND)
PPPUUU (770)PPPUUU MW-42 DMW-48D (Dashed Lines are Estimated)MW-4AB (4274)(ND)
MW-44DEMW-46 D2 MW-17D (320) (19ND)MW-7AB
MW-5D Domestic Irrigation W ater Wells(94) MW-18D PPUUMW-31C(ND) (21) MW-41 D1MW-5B MW-16C PPUU (ND)
PPUUMW-41 D2 (10) Notes
MW-43DE UUPP(ND18) (ND) Nondetect
0 2500 5000
Feet sup3 Filename XEPA009GarveyGW_Flow_Tech_Memo Carbon_TetChl_LoweR_Aquifer_Dmxd Project EP903401220202 Revised 061312 ST Source ENSR GDB 2008 DNR
_L _j I I I I _j_ I I I
I l --- I 111
1
__u_ I I
1 I ~ N ----y-
+ ~ I
II L _l e11111111111 I ---1 ~lJJ I n r Igt I Constant Head Boundariesj l _Q No Flow Sound aries I I l
~ r-- I - I middot r-
- fl+- L -
0 I J ~r-
Ll-D l Garvey Site I - ~t
Ill -J
l unJprm Spacing 25 eet U~iform S pacing 1 00 feet I Constant Head Boundaries
j
middotmiddot- ~ No Flow Sound aries
J
--=J--=11-~=======2~-----~3=========4~------5 M1les 0 05
Figure 51 Model Domain Gridding and Boundaries
Figure 52 Vertical Discretization of Model
1610
1620
1 6 2 0
1630
1 6 3 0
1640
1 6 4 0
1650
1 6 5 0
1660
1660
1670
1670
1680
1680
1690
17
1698
17013
16918
169198
169118
165864
167129
168901
169482
169872
169403
169347
169374
169448
Figure 53 Elevation of the Model Base (weathered shale of the Niobrara Formation)
1111
I I
-
N
+ 0 05
I I
I 1 l
I
1 l -
2 3 4 Miles
Figure 54 Elevation of the Top of the Lower Aquifer
Figure 55 Isopach Map of Lower Confining Unit (model Layer 4)
Figure 56 Elevation of the Base of the Medial Aquifer
Figure 57 Isopach of Upper Aquitard (model layer 2)
Figure 58 Elevation of the Base of the Upper Aquifer
I I I
~ ~ t--7 t bull I I I
r I l
I EW-01 f1-m I N I bull __ j
+ twtrl I I I rl bull I I I I J I I I -r-----
- middot-- - -- -- middot------__J_--
I --- 1 Feet I 0 500 1 000 2000 3000 4000 rooo I I I I
Figure 59 Location of Recovery Wells in the Shallow Aquifer
_l ________ l I I I -1 middot ] l ~----------middotj + I j
middotmiddot= middotmiddot- ---------L -- ---- ___ _ [_ __
r--------shy1
o--~oomiddoto~bull1~oo=o ======4~oomiddoto------middot~ooco=======43oobullo -------~oo~1
Figure 510 Location of Recovery Wells in the Medial Aquifer
I I r
~~ r -
L - - - -- -1--ltmiddot --I-
I -
---- L f+r
il I
J ---1
I
N
+
Figure 511 Location of Injection and Municipal Wells in the Lower Aquifer
Figure 512 Initial Concentrations of Carbon Tetrachloride in the Shallow Aquifer
Figure 513 Initial Concentrations of Carbon Tetrachloride in the Medial Aquifer
Figure 514 Initial Concentrations of Carbon Tetrachloride in the Lower Aquifer
-40
-30
-20
-10
00
10
20
30
40
17741 17828 17915 18002 18090 18177
Res
idua
l
Layer 1
Layer 3
Layer 5
Observed Value
Figure 61 Error Residuals Versus Measured Water Levels
Layer 1
Layer 3
18090
18177
Layer 5
Mod
el V
alue
17741 17828 17915 18002 18090 18177
18002
17915
17828
17741
Observed Value
Figure 62 Measured Water Levels Versus Predicted Water Levels
bull -020
N
+ 0
h I I
-----------~----j_ _______ ___ j_94-__ _ __ I ------------- t
011
bull 005
05
bull
I
Mile 1
Figure 63 Error Residuals for the Shallow Aquifer in the vicinity of the Garvey Elevator Site
Figure 64 Error Residuals for the Shallow Aquifer Over the Model Domain
-007 bull
N
+
il _ __ ~ II
t079 i
I 1 II_ --middot--middot- J_~=====-middot 1------~
~--1 000 r-----middot- -middotmiddot ____
-021 bull
-012 007 bull bull
l middot l02
I ~~~~====~---====~---Feet _ o ___ _ $-_~_0 _ ___ _ J000 _____ 3QQ_Q_ ---4lIJOLUlJ00----ltgt5ultOOO-- middott- middot ----
I
Figure 65 Error Residuals for the Medial Aquifer Over the Model Domain
0 250
N
+
044 bullbull -042
000 bull
027 bull
013
-)35 bull
Figure 66 Error Residuals for the Lower Aquifer in the Vicinity of the Garvey Elevator Site
Figure 67 Error Residuals for the Lower Aquifer in the Entire Model Domain
Figure 68 Calibrated Hydraulic Conductivities of the Shallow Aquifer (ftd) (model layer 1)
Figure 69 Calibrated Hydraulic Conductivities of the Medial Aquifer (ftd) (model layer 3)
Figure 610 Calibrated Hydraulic Conductivities of the Lower Aquifer (ftd) (model layer 5)
Figure 611 Calibrated Hydraulic Conductivities of the Upper Aquitard (ftd) (model layer 2)
Figure 612 Calibrated Hydraulic Conductivities of the Lower Aquitard (ftd) (model layer 4)
Figure 613 Calibrated Potentiometric Surface of the Shallow Aquifer (model layer 1)
Figure 614 Calibrated Potentiometric Surface of the Medial Aquifer (model layer 3)
Figure 615 Calibrated Potentiometric Surface of the Lower Aquifer (model layer 5)
Figure 616 Particle Tracking Analysis to Estimate Travel Time
Figure 71 Initial Concentrations for Alternative SG3
E3 E3 2000feet
Figure 72 Capture Zone Analysis in the Shallow Aquifer for Alternative SG3
E3 E3 E3 2000feet
Figure 73 Capture Zone Analysis in the Medial Aquifer for Alternative SG3
Figure 74 Alternative G2-Proposed Recovery Wells Medial Aquifer
Figure 75 Alternative G2- Proposed Recovery Wells Lower Aquifer
50
5 5
5
50 100
MW-3DE (NDND)
MW-47D MW-9A (ND)
HTW 40 MW-6D MW-10AB
(ND) MW-11A
MW-2AMW-33 UPPUPU
MW-19AC MW-14A APUMW-20DE MW-106DMW-104D(NDND) MW-12CPSSU (ND)PU PPPUUU PU (ND) MW-13E
HGLmdashGroundwater Flow Modeling Technical Memorandum Garvey Elevator Superfund SitemdashHastings NE
Figure 76 Preliminary Locations for Leading
Edge Recovery Wells and Groundwater Treatment Building-Alternative G2
Legend Garvey Property Boundary
Railroad
Ntilde Monitoring Well Location
Multilevel Well
S Hydraulic Conductivity Well
A West Highway 6 amp Highway 281 Site Monitoring Well
(190) Carbon Tetrachloride Concentration in micrograms per liter (microgL)
Carbon Tetrachloride Isoconcentration Treatment Building
Technical Blvd
MW-8A UUUU UUUUU
U PPPPPPPPUUUUPU UUUUUUPUP
UUUUUPPPPPPPPPPPPPPPPPP (ND)
PPPUUU A MW-105DMW-1A UU AMW-30DE PPUUPPPUUUPPPPPUUUUU
(52)(NDND) MW-12DNew Rolls Contour (Lower Aquifer) (microgL)MW-49D (5)(ND) (ND)
(ND) MW-45D (Dashed Lines are Estimated)PPUUMW-51D (ND) MW-46 D1PPUU PPUUMW-50D
(ND) (ND)
PPPUUU (770)PPPUUU MW-42 DMW-48D Domestic Irrigation W ater WellsMW-4AB (4274) MW-44DE(ND)
(19ND)MW-46 D2 MW-17D (320)MW-7AB Carbon Tetrachloride Isoconcentration(94)MW-5D
MW-18D PPUU (5) Contour (Upper Aquifer) (microgL)(21) MW-41 D1 MW-31C(ND)
MW-5B MW-16C PPUU (Dashed Lines are Estimated)(ND)
PPUUIdlewilde Rd
MW-41 D2 Recovery Wells (Medial)
Recovery Wells (Deep)
(10)
MW-43DE PPUU(ND18)
Recovery Well Piping
Treatment Building
Notes (ND) Nondetect
Blaine A
ve
Showboa t B
lvd
sup3 Filename XEPA009GarveyGW_Flow_Tech_Memo Carbon_TetChl_LoweR_Aquifer_Dmxd Project EP903401220202 Revised 061312 ST2500 5000 Source ENSR GDB 2008 DNR
Feet
0
Figure 77 Alternative G3ab-Proposed Recovery Wells Medial Aquifer
Figure 78 Alternative G3a- Proposed Recovery Wells Lower Aquifer
50
5 5
5
50 100
HGLmdashGroundwater Flow Modeling Technical Memorandum Garvey Elevator Superfund SitemdashHastings NE
Figure 79 Preliminary Locations for Mid-Plume and
Leading Edge Recovery Wells and Groundwater Treatment Building-Alternative G3
Legend Garvey Property Boundary
Railroad
Ntilde Monitoring Well Location MW-3DE (NDND)
Multilevel Well MW-47D
MW-9A (ND) Hydraulic Conductivity WellSHTW 40 MW-6D MW-10AB
(ND) West Highway 6 amp Highway 281 SiteMW-11A
MW-33 PPUUMW-2A PUA Monitoring Well
MW-19AC MW-14A APUCarbon Tetrachloride Concentration
Technical Blvd
MW-44DE (19ND) (Dashed Lines are Estimated)
MW-20DE (190)MW-106DPSSU PU PPPUUU MW-104DMW-12C(NDND) (ND)PU in micrograms per liter (microgL)(ND) MW-13EMW-8A
U UUUU UPUPPPPUUUUUUUUP UUUUU UUUPPPPPPPPPPPPPPPPPPPPPPPUUUUUU
(ND) PPPUUU A Treatment BuildingMW-105DMW-1A Carbon Tetrachloride IsoconcentrationMW-30DE A
PPUUPPPUUUPPPPPUUUUU(52)
(NDND) MW-12DNew Rolls Contour (Lower Aquifer) (microgL)MW-49D (5)(ND) (ND)(ND) MW-45D
MW-51D PPUU(ND)
PPUU PPUUMW-50D (ND)
MW-46 D1(ND) PPPUUU (770)
PPPUUU MW-42 D (4274)
MW-48D Domestic Irrigation W ater WellsMW-4AB (ND) MW-46 D2
MW-17DMW-7AB (320)(94) Carbon Tetrachloride IsoconcentrationMW-5D
MW-18D(ND) MW-31C (21) PPMW-41 D1
UU (5) Contour (Upper Aquifer) (microgL)MW-5B MW-16C UU (ND)PP (Dashed Lines are Estimated)PPUUIdlewilde Rd
MW-41 D2 Recovery Wells (Medial)(10)
MW-43DE UUPP(ND18) Recovery Wells (Deep)
Recovery Well Piping
Treatment Building
Notes (ND) Nondetect
Blaine A
ve
Showboa t B
lvd
sup3 Filename XEPA009GarveyGW_Flow_Tech_Memo Mid-Plume_Prelim_Loc Project EP903401220202 Revised 061312 RL2500 5000 Source ENSR GDB 2008 DNR
Feet
0
Figure 710 Alternative G3b-Proposed Recovery Wells Lower Aquifer
Figure 711 Alternative G3b-Relative Positions of Proposed Recovery Wells Medial and Lower Aquifers
Figure 712 Alternative G4a-Proposed Treatment Curtain and Recovery Wells Lower Aquifer
50
5 5
5
50 100
HGLmdashGroundwater Flow Modeling Technical Memorandum Garvey Elevator Superfund SitemdashHastings NE
Figure 713 Preliminary Locations for Mid-Plume
Injection Wells Leading Edge Recovery Wells and Groundwater Treatment Building
-Alternative G4
Legend Garvey Property Boundary
Railroad
Ntilde Monitoring Well Location MW-3DE (NDND)
MW-47D MW-9A (ND)
HTW 40 MW-6D MW-10AB
(ND)
S Elm
Ave
S Wabash A
ve
Multilevel Well
S Hydraulic Conductivity Well
A West Highway 6 amp Highway 281 Site Monitoring Well
MW-11AMW-33 UPPUMW-2A PU
MW-19AC MW-14A APUMW-20DE MW-106D Carbon Tetrachloride ConcentrationPU PPPUUU (190)PSSU MW-104D(NDND) MW-12C (ND)PU in micrograms per liter (microgL)(ND)
Treatment Building Technical B
lvd MW-13EMW-8A
UUUU UUUUUU PPPPPPPPUUUUPU UUUUU
UPUP
UUUUUPPPPPPPPPPPPPPPPPP (ND)
PPPUUU A MW-105DMW-1A UU Carbon Tetrachloride IsoconcentrationAMW-30DE PPUUPPPUUUPPPPPUUUUU
(52)(NDND) MW-12DNew Rolls Contour (Lower Aquifer) (microgL)MW-49D (5)(ND) (ND)
(ND) MW-45D (Dashed Lines are Estimated)PPUUMW-51D (ND) MW-46 D1PPUU PPUUMW-50D
(ND) (ND)
PPPUUU (770)PPPUUU MW-42 DMW-48D Domestic Irrigation W ater WellsMW-4AB (4274)(ND) MW-44DEMW-46 D2
(19ND)MW-17D (320)MW-7AB Carbon Tetrachloride Isoconcentration(94)MW-5D MW-18D PPUU (5) Contour (Upper Aquifer) (microgL)(21) MW-41 D1
MW-31C(ND) MW-5B MW-16C PPUU (Dashed Lines are Estimated)(ND)
PPUUIdlewilde Rd
MW-41 D2 Recovery Wells (Medial)
Recovery Wells (Deep)
(10) Injection Area 1 MW-43DE PPUUPermanent Injection Well Spacing 40 ft (ND18)
Total Injection Wells Installed 39 Recovery Well Piping Injection Area (40 ft spacing between the wells) Treatment Building
Notes (ND) Nondetect
Blaine A
ve
Showboa t B
lvd
S Baltim
ore Ave
sup3 Filename XEPA009GarveyGW_Flow_Tech_Memo G4_Prelim_Loc_Inj_Areamxd Project EP903401220202 Revised 061312 RL2500 5000 Source ENSR GDB 2008 DNR
Feet
0
Figure 714 Alternative G4b-Proposed Treatment Curtains and Recovery Wells Lower Aquifer
Figure 715 Alternative G4b-Relative Positions of Proposed Recovery Wells and Treatment Curtains

HGLmdashGroundwater Flow Modeling Technical Memorandum Garvey Elevator Site ndash Hastings NE
movement) and the degradation coefficient for the modeled chemical species (relates to the rate of chemical decay in the groundwater system)
13 Placing particles within the model to determine groundwater flow directions and capture zone characteristics
14 Initializing the contaminant plume based on measured concentrations 15 Simulating remedial scenarios
Completion of these steps is necessary to create a model that represents field conditions as accurately as possible within the constraints of practicality and data availability The remainder of this report details how each of the steps outlined above was accomplished
30 CONCEPTUAL MODEL
A conceptual model was developed to serve as the basis for the construction of the flow and transport model A conceptual model generally summarizes the theoretical understanding of the primary conditions that affect groundwater flow and chemical transport and fate Additionally the current nature and extent of the groundwater contamination in OU 1 is also presented Unless otherwise indicated the information below was excerpted from the Focused Feasibility Study (HGL 2009)
31 SITE HYDROGEOLOGY
For additional information the Remedial Investigation (RI) report provides a comprehensive description of the hydrogeology (HGL 2011)
Regional Characteristics
Hastings is located in the Little Blue River Natural Resource District Depth to groundwater in the Hastings area is typically about 100 feet (ft) below ground surface (bgs) with localized zones of perched groundwater that can occur as shallow as 7 to 10 ft bgs The regional groundwater flow generally follows the direction of the Little Blue River toward the east to southeast
The principal aquifer for the Hastings area is the Pleistocene aquifer which is typically 100 ft to 150 ft thick The Pleistocene aquifer is composed of unconsolidated sand and gravel that extends from about 100 ft bgs to the top of the Niobrara Formation which occurs at about 233 ft bgs
Groundwater from the Pleistocene aquifer in the Hastings area is used for municipal domestic and agricultural use Due to high use of the Pleistocene aquifer the water table has dropped more than 20 ft between pre-1950s and 1992
Transmissivity ranges from more than 200000 gallons per day per foot in the central part of the county to less than 50000 gallons per day per foot in the northeastern corner and southernmost portions of the county
US EPA Region 7 Garvey Groundwater Flow Modeling Memo 4 July 2012
HGLmdashGroundwater Flow Modeling Technical Memorandum Garvey Elevator Site ndash Hastings NE
Site-Specific Characteristics
Groundwater typically occurs between 110 to 115 ft bgs at the site Three aquifer zones exist at the site based on the lithologic descriptions for their monitoring well boring logs These three aquifer zones are referred to as the shallow medial and lower zones
The shallow aquifer zone is unconfined and extends from about 115 ft bgs to 130 ft bgs and based upon lithology is divided into A and B Zones A fine-grained (aquitard) forms the base of the shallow aquifer and acts as a semi-confining layer to the underlying medial aquifer The medial aquifer extends from the bottom of the upper aquitard to the top of the lower aquitard at approximately 150 ft bgs (Zone C) The lower aquifer zone is believed to be from approximately 155 ft bgs to 240 ft bgs (Zones D and E) The weathered shale of the Niobrara Formation forms the base of the aquifer Groundwater flow in all aquifer zones is to the southeast
In 2011 discrete pumping tests were conducted using recovery wells RW-2 in the shallow aquifer and RW-7 in the medial aquifer (HGL 2011) The RW-2 constant-rate test was conducted at a pumping rate of approximately 95 gallons per minute (gpm) after the pumping rate stabilized The RW-7 constant-rate test was conducted at a pumping rate of approximately 100 gpm
For the RW-2 pumping test conducted in the shallow aquifer the average shallow aquifer hydraulic conductivity (K) value calculated from the constant-rate pumping test data was 245 (feet per day) ftday This is fairly consistent with the average shallow aquifer K value of 46 ftday measured by the EPA for the RI using the bi-chamber dipole flow testing analysis in well MW-33 a hydraulic testing well located at the northwestern perimeter of the site property A geotechnical analysis of an aquifer sample collected from the screened interval of MW-49B had a K value of 485 ftday which also is consistent with the two field-derived measurements
During the constant-rate test at RW-7 for the medial aquifer drawdown was observed in two monitoring wells MW-13C and MW-50C The average K value for the three MW-13C data analyses was 2494 ftday while the average K value for the same three analyses for the MWshy50C dataset was 1647 ftday In contrast an average medial aquifer K value of 98 ftday was measured by EPA for the RI using the bi-chamber dipole flow testing analysis in well MW-33 A geotechnical analysis of an aquifer sample collected from the screened interval of MW-50C had a K value of 587 ftday Given that the geotechnical sample was disturbed its K value is marginally valid in comparison to the aquifer parameters derived from the pumping test An acceptable K value for the medial aquifer would be an average of the three field-derived measurements which would yield a K value of 171 ftday
32 NATURE AND EXTENT OF VOCS
The contaminants in the groundwater were evaluated using data collected during the RI activities conducted at the site and from previous investigations The nature and extent of the volatile organic compounds (VOCs) in the groundwater are summarized below Unless
US EPA Region 7 Garvey Groundwater Flow Modeling Memo 5 July 2012
HGLmdashGroundwater Flow Modeling Technical Memorandum Garvey Elevator Site ndash Hastings NE
otherwise referenced the following sections are adapted from the RI Report (HGL 2011)
The VOCs detected in groundwater at the Garvey Elevator Site exceeding their preliminary remediation goals (PRGs) are tetrachloroethene (PCE) trichloroethene (TCE) and carbon tetrachloride The elevated PCE detections are attributed to the adjacent West Highway 6 amp Highway 281 Site The contaminant plume originating at the West Highway 6 amp Highway 281 Site is commingled with the contaminant plume originating at the Garvey Elevator Site The elevated TCE detections appear to be limited to the upper aquifer zone (Zone AB at 115 to 130 feet bgs) in an area east of the railroad tracks north of the grain storage facility The carbon tetrachloride contamination appears to originate from two soil source areas the former liquid fumigant AST and an area in the northeastern corner of the grain storage facility (possibly from the treatment of rail cars or stockpiled grain) Carbon tetrachloride has migrated through the soil to the groundwater The carbon tetrachloride contamination extends from the groundwater underlying the grain storage facility to approximately 47 miles downgradient to the east-southeast from the source areas Carbon tetrachloride plume is present above PRGs in the upper (Zone AB 115 to 125 feet bgs) medial (Zone C 130 to 155 feet bgs) and lower (Zone DE 160 to 235 feet bgs) aquifer zones One aquitard occurs between the upper (Zone A) and medial (Zone C) aquifer zones and another aquitard occurs between the medial (Zone C) and lower (Zone DE) aquifer zones The two aquitards vary in thickness and composition The carbon tetrachloride plume appears to migrate deeper in the aquifer zones as it migrates farther downgradient from the Site
The carbon tetrachloride concentrations that were used to initialize the shallow medial and lower aquifers in the model were derived from those observed during the September 2011 sampling event These isoconcentration maps are presented as Figures 31 32 and 33 for the shallow medial and lower aquifers respectively
40 COMPUTER CODE SELECTION
The computer codes that were used for this analysis are MODFLOW-2000 MT3DMS PEST and MODPATH MODFLOW-2000 the U S Geological Survey finite-difference groundwater flow model is a popular and widely used computer code (Harbaugh et al 2000) Groundwater flow within the aquifer is simulated using a block-centered finite-difference approach Layers can be simulated as confined unconfined or a combination of confined and unconfined Flow associated with external stresses such as wells areal recharge evapotranspiration drains and streams can also be simulated
The modular 3-D flow and transport model referred to as MT3D was originally developed by Zheng (1990) and subsequently updated to MT3DMS (Zheng and Wang 1999) MT3DMS has a comprehensive set of options and capabilities for simulating advection dispersiondiffusion and chemical reactions of contaminants in groundwater flow systems under general hydrogeologic conditions Although both codes use the same model structure MODFLOW is run first using the physical and hydraulic data entered into the model to produce a groundwater flow field (array of hydraulic heads) Subsequently MT3D is run using the head results from the flow model to produce a transport simulation
US EPA Region 7 Garvey Groundwater Flow Modeling Memo 6 July 2012
HGLmdashGroundwater Flow Modeling Technical Memorandum Garvey Elevator Site ndash Hastings NE
MODPATH is a particle tracking post-processing package that was developed to compute 3-D flow paths using output from steady-state or transient groundwater flow simulations by MODFLOW MODPATH is described in USGS Open-File Reports 89-381 and 89-622 (Pollock 1994) MODPATH uses a semi-analytical particle tracking scheme that allows an analytical expression of the particle flow path to be obtained within each finite-difference grid cell Particle paths are computed by tracking particles from one cell to the next until the particle reaches a boundary an internal sink or source or satisfies some other termination criterion
To facilitate the model calibration a parameter estimation tool was implemented PEST (Parameter ESTimation) is a calibration tool developed by Watermark Computing (Doherty 2006) that uses non-linear least-squares techniques to adjust model parameter data in order that the discrepancies between the pertinent model-generated numbers and the corresponding measurements are reduced to a minimum It does this by taking control of the model and running it as many times as is necessary to determine this optimal set of parameters
The pre- and post-processing of data inputoutput for these codes was performed with Groundwater Vistas (Rumbaugh and Rumbaugh 1998)
50 MODEL CONSTRUCTION
One primary goal of mathematical modeling is to synthesize the conceptual model into numerical terms from which flow and transport processes may be investigated under specified conditions This process entails several discrete steps (1) partitioning the conceptual model into units of time and space (2) assignment of boundary conditions and (3) specification of the values for the parameters The following sections briefly discuss the approach taken and the relevance of each of these topics to the modeling process
51 DOMAIN STRUCTURE AND GRID
The model domain is 10100 ft by 28200 ft (102 square miles) and extends horizontally from about 800 feet west of the site property boundary to approximately 6000 ft north and 2500 ft south of the site and about 25000 ft east of the site as shown in Figure 51 This is an area large enough to include all of the contaminant plumes and ensure that the effects of proposed pumping for the remedial alternatives will not reach the boundaries and cause boundary effects on the predicted drawdowns
In a numerical model the region of interest is partitioned into a series of cells (that is elements) which are arranged in layers This practice termed discretization effectively replaces the continuous problem domain with an array of cells The basic concept involves dividing up the area as realistically as practical One of the critical steps in applying a groundwater model is selecting the size of the cells Smaller cells lead to more accurate numerical solutions The desire for accuracy however must be balanced against the impracticality of solving for large numbers of nodes and the long computer run times that may be involved For this modeling exercise a finite-difference grid (squares and rectangles) was adopted with 404 rows 510 columns and 5 layers The rows and columns are evenly spaced
US EPA Region 7 Garvey Groundwater Flow Modeling Memo 7 July 2012
HGLmdashGroundwater Flow Modeling Technical Memorandum Garvey Elevator Site ndash Hastings NE
at 25 ft intervals over the area encompassing the site and extending approximately 8000 feet downgradient from the western model boundary The remaining portion of the model is uniformly spaced at 100 ft intervals creating 1030200 active cells
The grid is oriented to be approximately parallel to the measured plumes or 9 degrees south of east This orientation is representative of the net groundwater flow directions (as expressed by the plume) Based on regional potentiometric surface maps the ambient groundwater gradients are closer to 20 degrees south of east The natural gradients however may be shifted locally by pumping for irrigation and water supply
The shallow medial and lower aquifers are each discretized into single model layers (Figure 52) The shallow and medial aquifers are separated by a confining unit which is simulated with a single model layer A deeper confining unit separates the medial from the lower aquifer and is also simulated with a single model layer The base of the model is set to an elevation consistent with the base of the Pleistocene aquifer which is defined by the weathered shale of the Niobrara Formation (Figure 53) The lithologic contact information is provided in Table 51
The elevation of the top of the lower aquifer (model layer 5) is shown in Figure 54 An isopach map presented in Figure 55 shows that the thickness of the lower aquitard (model layer 4) that separates the lower aquifer from the medial aquifer As shown in the figure the thickness varies from being non-existent in approximately the northern third of the model domain to a thickness of about 75 feet near the eastern boundary The top and bottom of the medial aquifer is defined as the base of the upper aquitard and top of the lower aquitard The elevation of the base of the medial aquifer is depicted in Figure 56 The thickness of the upper aquitard (model layer 2) is presented in Figure 57 The thickness ranges from about 1 to 8 feet except in an area immediately north of the Garvey Elevator site where the aquitard is missing The elevation of the base of the upper aquifer is shown in Figure 58 The top of the upper aquifer is defined as the water table surface and is depicted in Figure 613
52 TIME BASIS
All of the calibration simulations capture zone and contaminant transport analyses were performed to steady-state conditions These conditions best represent the effects of long term pumping on the water levels and plume development and provide the best estimates of the capture zone and contaminant transport under the current conditions
53 BOUNDARY AND INITIAL CONDITIONS
531 Boundary Conditions
To obtain a solution for the governing equation of groundwater flow information is required about the physical state of the groundwater system This information is described by boundary and initial conditions Boundary conditions are the conditions the modeler specifies as known or estimated values to solve for the unknowns in the problem Boundaries generally are
US EPA Region 7 Garvey Groundwater Flow Modeling Memo 8 July 2012
HGLmdashGroundwater Flow Modeling Technical Memorandum Garvey Elevator Site ndash Hastings NE
quantified in terms of the volume of groundwater moving through the system The physical boundaries are then translated into mathematical terms and input into the computer model
Constant-head boundary conditions (ie groundwater elevations remain constant with time) were extrapolated from the regional gradients and assigned at the upgradient (northwestern) and downgradient (southeastern) model limits for all of the model layers (Figure 51)
The model boundaries to the northeast and southwest are approximately parallel to groundwater flow lines and are considered lsquono-flowrsquo boundaries across which no groundwater moves The base of the model is considered a no-flow boundary
Shallow Aquifer
The top of the model was set as a uniform recharge boundary (26 inches per year [inyr]) with the rate determined as part of the model calibration
As presented below and shown in Figure 59 all of the recovery wells are set to their average pumping rates for the week prior to and during the collection of the water level data calibration set (September 26-27 2011) These rates are listed below
Garvey Elevator Site
bull RW-1 = 00 gallons per minute (gpm) bull RW-2 = 80 gpm bull RW-3 = 74 gpm bull RW-4 = 98 gpm bull RW-5 = 51 gpm
West Highway 6 amp Highway 281 Site
bull EW-1 = 61 gpm bull EW-2 = 83 gpm bull EW-3 = 41 gpm bull EW-4 = 00 gpm
US EPA Region 7 Garvey Groundwater Flow Modeling Memo 9 July 2012
HGLmdashGroundwater Flow Modeling Technical Memorandum Garvey Elevator Site ndash Hastings NE
Medial Aquifer
There are no wells pumping from the medial aquifer at the West Highway 6 amp Highway 281 Site Recovery wells RW-6 RW-7 and RW-8 at the Garvey Elevator Site are set to their average rates observed for the week prior to and during the collection of the water level calibration set (Figure 510) These pumping rates are as follows
Garvey Elevator Site
bull RW-6 = 925 gpm bull RW-7 = 667 gpm bull RW-8 = 905 gpm
West Highway 6 amp Highway 281 Site
bull No wells are pumping from the medial aquifer
Lower Aquifer
All of the water pumped from the shallow and medial aquifers at the Garvey Elevator Site is treated and injected into the lower aquifer through two injection wells located as shown on Figure 511 The total amount of pumped water is approximately 280 gpm Since there are no flow meters on the injection wells it is assumed that 10 percent of the pumped water is lost to leaks and evaporation and the remaining 250 gallons is injected at an equal rate (125 gpm) into each of the two injection wells
Pumping records for the month of September 2011 indicate that the pumping rate for Municipal Well 9 averaged 577 gpm The close proximity of this well to a no-flow boundary (Figure 511) however would result in over predictions of the hydraulic conductivities in this area during the model calibration Therefore the pumping rate of Municipal Well 9 was reduced during the model calibration until the hydraulic conductivities approximated those in the general vicinity but outside the influence of the pumping Since this well is away from the contaminant plumes the modeling results will be relatively insensitive to the hydraulic conductivities predicted in this area Since the calibration set was collected in September it is assumed that the irrigation wells located within the model domain were not pumping water Injection and pumping rates from the lower aquifer are shown below
Garvey Elevator Site
bull IW-1 = 125 gpm bull IW-2 = 125 gpm
US EPA Region 7 Garvey Groundwater Flow Modeling Memo 10 July 2012
HGLmdashGroundwater Flow Modeling Technical Memorandum Garvey Elevator Site ndash Hastings NE
West Highway 6 amp Highway 281 Site
bull Municipal Well 9 = 342 gpm
532 Initial Conditions
As described in Section 32 carbon tetrachloride contamination is present in the upper middle and lower aquifers Groundwater contaminant concentration data presented on Figures 31 32 and 33 were used as the basis for estimating the initial plume concentrations within the model The actual concentrations specified as initial conditions for the shallow medial and lower aquifers are shown in Figures 512 513 and 514 respectively
60 MODEL CALIBRATION
Traditionally the term model calibration is used to refer to the trial-and-error adjustment of parameters of the groundwater system by comparing the models output (calculated values of hydraulic head or concentration) and the measured output (observed values of hydraulic head or concentration) In essence such a calibration procedure involves the following routines (1) operating the model using initial estimates of the values of the parameters (2) history-matching or comparing computed and observed values of hydraulic head or concentration and (3) adjusting the values of the parameters and repeating the simulation
Calibration of the model is aimed at demonstrating that it can produce realistic accurate and reliable predictions The flow model is calibrated by determining a set of parameters boundary conditions and hydraulic stresses that generate simulated potentiometric surfaces and fluxes that match field-measured values to within an acceptable range of errors The end result of the process of model calibration is an optimal set of values for parameters that minimize the discrepancy between the model output and the observed data The iterative process of matching calculated values with observed (historical) data by adjusting the model input can be a manual trial-and-error procedure or can be automated The calibration process also known as history-matching is closely related to estimating parameters This process might result in the refinement of initial estimates of aquifer properties (parameters) the establishment of the location of the boundaries (areal and vertical extent of aquifer) and the determination of flow and transport conditions at the boundaries
Calibration can be performed to steady-state or transient data sets Although most flow model calibration exercises involve steady-state data in some hydrogeologic settings assumption of steady-state conditions may be inappropriate due to large fluctuations in the water table or boundary conditions For this modeling exercise only steady-state calibrations were performed
To facilitate the model calibration PEST was used in conjunction with the groundwater flow code (MODFLOW-2000) PEST is a calibration tool that uses non-linear least-squares techniques to adjust model parameter data in order to reduce the discrepancies between the
US EPA Region 7 Garvey Groundwater Flow Modeling Memo 11 July 2012
HGLmdashGroundwater Flow Modeling Technical Memorandum Garvey Elevator Site ndash Hastings NE
pertinent model-generated numbers and the corresponding measurements to a minimum It does this by taking control of the model and running it as many times as is necessary to determine this optimal set of parameters within a user-specified range
Calibration of the steady state flow model was accomplished iteratively by adjusting model parameters during successive model runs to match the water-level data that was collected from all of the wells on September 26-27 2011 under stressed (ie pumping) conditions Since most of the recovery wells had been running for at least several weeks prior to and during the collection of these water levels is it assumed that the levels are representative of steady-state pumping conditions The water-level calibration targets for all of the aquifers are provided in Table 61
As part of the model calibration adjustments were made to the areal recharge (shallow aquifer) range of hydraulic conductivities ratio of vertical to horizontal hydraulic conductivities and minor adjustments to the constant head boundaries The general calibration approach that was followed involved adjusting the parameters mentioned above and inputting the parameters into a PEST simulation PEST would subsequently run MODFLOW thousands of times in which the hydraulic conductivities were adjusted for each iteration until the difference between the observed water levels (targets) and the model predicted values (error residuals) were minimized If these error residuals were too high further adjustments were made to the recharge hydraulic conductivity range etc and the PEST simulation was initiated again
During the model flow calibration it was found that the parameter imparting the most sensitivity to the model results is the areal recharge reaching the water table The Corps of Engineers proposed in their 1990 Final Groundwater Modeling Report of the Hastings East Industrial Park area that net recharge for non-irrigated grassland was estimated to be 26 inches per year (USACE 1990) After performing a number of simulations during the model calibration it was found that a value of 26 inches per year provided the best match to the measured water levels
The error residuals (that is the differences between model predictedcomputed and measuredobserved values) are depicted graphically in Figures 61 and 62 The error residuals and calibration statistics are also presented in tabular form in Table 61 As shown in Figure 61 most of the error residuals are within plusmn05 ft The minimum residual is -32 ft (over prediction of the hydraulic head) and the maximum residual is 196 ft (under prediction of hydraulic head) The graph depicted in Figure 62 shows that there is a good fit along the entire range of observed water level elevations
A common measure of the quality of the model calibration is the percent error The percent error is the root mean square error (RMSE) divided by the total change in the observed head As shown in Table 61 the RMSE is 075 and the range in observations is 4326 This leads to a percent error of about 17 percent which is well below the 10 percent error often cited as the cutoff for a well calibrated model
US EPA Region 7 Garvey Groundwater Flow Modeling Memo 12 July 2012
HGLmdashGroundwater Flow Modeling Technical Memorandum Garvey Elevator Site ndash Hastings NE
The areal distribution of error residuals for the shallow aquifer (model layer 1) near the Garvey Elevator Site and over the entire model domain are shown in Figures 63 and 64 respectively All of the error residuals shown in the figures are relatively small In fact the largest error residuals in the shallow aquifer are found in the immediate vicinity of the West Highway 6 amp Highway 281 Site and do not significantly impact the flow and transport results These error residuals were further lowered as part of the West Highway 6 amp Highway 281 model calibration performed as a separate exercise
The error residuals for the medial aquifer (model layer 3) are presented in Figure 65 With the exception of two wells that are located to the northeast of the Site in the vicinity of the West Highway 6 amp Highway 281 Site all of the residuals are relatively low
The areal distribution of error residuals for the lower aquifer (model layer 5) near the Garvey Elevator Site and over the entire model domain are depicted in Figures 66 and 67 respectively The large residual shown on Figure 66 is associated with MW-20C (-30 ft) The water levels and residuals for the MW-20 well series are as follows
MW-20C residual -300 ft water level 180892 ft above mean sea level (amsl) MW-20D residual 004 ft water level 181196 ft amsl MW-20E residual -037 ft water level 181155 ft amsl
As shown in Table 51 the top of the lower aquifer for the MW-20 series is encountered at a depth of 152 feet This is also the depth that the well screen begins for MW-20C Therefore MW-20C -20D and -20E are all screened in the lower aquifer
Historically the water level for MW-20C behaves somewhat erratically when compared to MW-20D and MW-20E For instance all of the measurements for the 3 wells are relatively close in 2009 and 2010 However in June of 2011 the water level observed in MW-20C is 4 feet above that observed in MW-20D and 3 feet above the water level measured in MW-20E Therefore primary reliance was placed on the water levels from MW-20D and MW-20E for the model calibration
The residuals for the lower aquifer monitoring wells farther downgradient of the site are all very low and demonstrate an excellent calibration (Figure 67)
The calibrated hydraulic conductivities for the shallow medial and lower aquifers are presented in Figures 68 69 and 610 respectively In the vicinity of the Site the calibrated horizontal hydraulic conductivity for the all of the aquifers ranges between 50 and 250 ft per day (ftd) It is assumed that the vertical hydraulic conductivity is a factor of 5 less than that of the horizontal hydraulic conductivity
Near the Site most of the shallow aquifer is characterized by hydraulic conductivities between 50 to 100 ftd The hydraulic conductivities in the medial aquifer however tend to range between 100 and 250 ftd over most of the Site The calibrated hydraulic conductivities for the lower aquifer range between 50 and 150 ftd over most of the eastern portion of the Site and between 100 and 250 ftd along the western boundary and in the northwest area of the Site
US EPA Region 7 Garvey Groundwater Flow Modeling Memo 13 July 2012
HGLmdashGroundwater Flow Modeling Technical Memorandum Garvey Elevator Site ndash Hastings NE
The model predicted hydraulic conductivities for the lower aquifer are less certain however because there are no pumping wells stressing the system in this aquifer
The hydraulic conductivities farther downgradient of the Site indicate that large areas in the shallow and medial aquifers have relatively low hydraulic conductivities ranging from 50 to 100 ftd The hydraulic conductivities of the lower aquifer over much of this area tend to be significantly higher and range between 100 and 250 ftd These higher hydraulic conductivities are consistent with the large production rates (eg 300 to 600 gpm) of the irrigation wells located in the area which draw from the lower aquifer during the summer months
The hydraulic conductivities of the upper and lower aquitards are show on Figures 611 and 612 respectively The upper aquitard is continuous except for an area located immediately north of the Site The lower aquitard is absent from approximately the northern one third of the model domain
The calibrated potentiometric surfaces for the shallow medial and lower aquifers are presented in Figures 613 through 615 respectively The calibrated potentiometric surface for the shallow and medial aquifers show some bending in the vicinity of the Site due to the pumping wells The potentiometric surface of the lower aquifer is clearly impacted by the injections wells (for example elevation line 1817) Downgradient from the Site the potentiometric lines are generally perpendicular to groundwater flow
As a qualitative check on the calibrated hydraulic conductivity fields and hydraulic gradients a particle tracking analysis was performed to estimate travel times Approximately 52 years has elapsed since Garvey Elevators began operation as a grain storage facility in 1959 and the 2011 sampling event As illustrated by Figure 616 it takes about 50 years for a particle to move from the Site boundary to the toe of the plume Although it is unknown when contamination reached the water table and the overall influence of municipal and irrigation wells on transport rates the results of the travel time analysis suggest that the calibrated hydraulic conductivities and gradients are reasonable A general discussion pertaining to particle tracking (eg computer code) is provided in Section 722
70 REMEDIAL ALTERNATIVE DESIGN
71 CONTAMINANT TRANSPORT PARAMETERIZATION
Once the calibration of the flow model was complete contaminant transport and particle tracking simulations were performed Parameters that are required to conduct contaminant transport modeling include effective porosities dispersivities retardation and chemical and biological transformations A brief description of each of these processes is presented below
Effective Porosity The effective porosity is the ratio of the volume of interconnected pore spaces available for transport to the total system volume It is used to estimate the velocity at which groundwater and contaminants travel through a porous medium The smaller the effective porosity the higher the groundwater velocity and the more rapidly contaminants will
US EPA Region 7 Garvey Groundwater Flow Modeling Memo 14 July 2012
HGLmdashGroundwater Flow Modeling Technical Memorandum Garvey Elevator Site ndash Hastings NE
be transported A reasonable value for sand silts and gravels is 25 percent and therefore this value was assigned to the model
Dispersivity The equations of solute transport that are solved in contaminant-transport codes are derived assuming that the solute migration is due to advection and hydrodynamic dispersion Advection describes the bulk movement of groundwater flow where hydrodynamic dispersion is caused by the tendency of the solute to spread out from the path that it would be expected to follow if transported only by advection This spreading of the contamination over an ever-increasing area is called hydrodynamic dispersion and has two components mechanical dispersion and diffusion Hydrodynamic dispersion causes dilution of the solute and occurs because of spatial variations in groundwater flow velocities and mechanical mixing during fluid advection Molecular diffusion the other component of hydrodynamic dispersion is due to the thermal kinetic energy of solute molecules and also contributes to the dispersion process Thus if hydrodynamic dispersion is factored into the solute transport processes ground-water contamination will cover a much larger region than in the case of pure advection with a corresponding reduction in the maximum and average concentrations of the contaminant Dispersion also increases the velocity of the contaminants because it considers the fact that some contaminants will travel through faster pathways (and some slower) than if only pure advection was assumed
The relatively narrow plume with respect to the plume length suggests relatively low dispersivity values Furthermore numerical dispersion occurring as part of the solution method has to also be factored into the dispersion estimate Finally if too large of a dispersion value is assigned contaminants will be artificially dispersed vertically through the upper and lower aquitards into the underlying aquifers Therefore the relatively low values of 50 5 and 1 ft were assigned to the longitudinal transverse and vertical dispersivities respectively
Retardation Factor The rate at which contaminants migrate relative to groundwater is termed the retardation factor and is determined by the effective porosity (see definition above) bulk density and distribution coefficient Adsorption of carbon tetrachloride and other chlorinated solvents is expected to be relatively low in the upper medial and lower aquifer zones leading to a low degree of retardation For modeling purposes a retardation factor of zero was assumed
Chemical and Biological Transformations
Most VOCs and chlorinated solvents including carbon tetrachloride are subject to biological and chemical transformations in the subsurface environment Biological transformations include aerobic degradation anaerobic degradation and co-metabolism Several chemical properties of both water and soil influence the stability of chlorinated solvents in an aquifer Chemical transformations include hydrolysis dehydrohalogenation and reduction in water These typically require low groundwater flow rates and therefore it is unlikely that these chemical transformations will play a significant role at the Site
Carbon tetrachloride can be reduced under anaerobic conditions via three different pathways
US EPA Region 7 Garvey Groundwater Flow Modeling Memo 15 July 2012
HGLmdashGroundwater Flow Modeling Technical Memorandum Garvey Elevator Site ndash Hastings NE
bull reductive dechlorination where carbon tetrachloride is reduced to chloroform chloroform is reduced to methylene chloride and methylene chloride is reduced to methane
bull a simple two-electron reduction process in which chloroform is only a minor product and
bull a one-electron reduction via sulfur and oxygen where carbon tetrachloride is reduced to carbon dioxide and chloroform is not produced
Based on the groundwater sample analytical results collected during the RI field investigation some degree of biodegradation of the carbon tetrachloride groundwater plume is occurring as evidenced by the presence of the degradation products chloroform and methylene chloride (HGL 2011) Concentrations of these degradation products are typically one to two orders of magnitude less than those of carbon tetrachloride in samples collected at the Site However chloroform concentrations are similar to or slightly greater than carbon tetrachloride concentrations in many of the groundwater transect samples collected downgradient of the Site indicating that biodegradation is occurring but not at an accelerated rate Therefore no degradation of carbon tetrachloride was assumed in the model
72 OU 1 - REMEDIAL ALTERNATIVES
The remedial scenarios being considered as part of the FS are presented in Table 71 As shown in the table there are four scenarios included under OU 1 The No Action Alternative (SG-1) and Maintaining and Operating the Existing Groundwater Extraction System (SG-2) would require a significant length of time for on-site carbon tetrachloride concentrations to fall below the maximum contaminant level (MCL) of 5 micrograms per liter (μgL) which is established as the preliminary cleanup level (PCL) These alternatives were not explicitly modeled
For the no action alternative (SG-1) the duration to reach MCLs should intuitively be longer than other alternatives that use active treatment methods However for cost estimating purposes it is assumed that the duration for SG-1 is 30 years
For alternative SG-2 the duration to achieve MCLs was estimated using groundwater contamination data from monitoring wells and recovery wells at the site Table 71 summarizes analytical data from these wells including projected times to achieve MCLs based on concentration trends Using these data an estimated duration of 30 years has been assumed for alternative SG-2 to achieve MCLs
721 SG3 - In-Situ Treatment via Groundwater Amendments
This alternative involves shutting off the existing groundwater extraction system and injecting amendments to remediate contaminated groundwater within the 500 μgL contour As shown in Figure 71 the initial conditions for this portion of the plume have been set to zero and the pumping and injection wells in the upper medial and lower aquifers have been shut off The model predicts that it would take approximately 4 years for the plume to disperse and the concentrations of carbon tetrachloride to decrease below the MCL of 5 μgL These
US EPA Region 7 Garvey Groundwater Flow Modeling Memo 16 July 2012
HGLmdashGroundwater Flow Modeling Technical Memorandum Garvey Elevator Site ndash Hastings NE
predictions are unrealistically short however for the following reasons diffusion back out of the finer grained clays is limited by concentration gradients that often lead to very long cleanup time frames and although sorption is probably low it can significantly increase remediation times particularly when coupled with diffusion processes For these reasons the remediation time for alternative SG3 was increased to 15 years
722 SG4 - Maintain and Operate Existing GET System and Treat Via Amendments
This alternative is identical to SG3 except that the existing groundwater extraction and treatment (GET) system remains on To ensure that the existing GET system is effective at capturing the contamination a capture zone analysis was conducted with the computer code MODPATH
MODPATH is a widely accepted 3-D particle-tracking model that uses the flow fields created by MODFLOW to predict groundwater flow directions Particle tracking is a form of flow and transport modeling that represents the bulk movement of groundwater Particle tracking neglects the effects of chemical reactions dispersion and diffusion The particle tracking analysis involves adding particles to the model at selected locations and then allowing the model to move the particles in the direction of groundwater flow The results of a particle tracking simulation are displayed by plotting pathlines through the aquifer Although both forward and reverse particle tracking can be performed with MODPATH for the Garvey Elevator Site only forward-tracking analyses are conducted
Before initiating the capture zone analysis the groundwater extraction rates were changed from those used to calibrate the model to rates that better reflect long term pumping rates The revised rates are as follows
Garvey Elevator Site
bull RW-1 = 35 gpm bull RW-2 = 68 gpm bull RW-3 = 90 gpm bull RW-4 = 102 gpm bull RW-5 = 50 gpm bull RW-6 = 900 gpm bull RW-7 = 680 gpm bull RW-8 = 1280 gpm
West Highway 6 amp Highway 281 Site
bull EW-1 = 61 gpm bull EW-2 = 83 gpm bull EW-3 = 41 gpm bull EW-4 = 00 gpm
Shallow Aquifer
US EPA Region 7 Garvey Groundwater Flow Modeling Memo 17 July 2012
HGLmdashGroundwater Flow Modeling Technical Memorandum Garvey Elevator Site ndash Hastings NE
As shown on Figure 72 particles released to all the model layers indicate that the extraction wells are effectively containing the on-site carbon tetrachloride plume At some point downgradient however capture is lost and the contaminants will continue to migrate with the groundwater
Medial Aquifer
The results of the particle-tracking analysis for the medial aquifer are presented as Figure 73 The particle tracking illustrates that the modeled capture zone extends sufficiently downgradient to capture the contamination that has moved immediately off site
The predicted remediation time for this alternative is about 2 years (Table 72) The removal of the contamination with the pumping wells has shortened the time from that predicted for Alternative SG3 As was the case for Alternative SG3 these predictions are unrealistically short for the same reasons For these reasons the remediation time for alternative SG3 was increased to 10 years
73 OU 2 - REMEDIAL ALTERNATIVES
Six remedial alternatives were considered for OU 2 (Table 72) Although it was not modeled based on the predicted remediation times of greater than 100 years for the G2 scenario the No-Action alternative (G1) remediation time is predicted to take more than 100 years However for cost estimating purposes it will be assumed that the duration for SG-1 is 30 years
731 G2 - Groundwater Recovery and Treatment at Leading Edge of Plume
This alternative involves pumping and treating the groundwater from the toe of the medial and lower aquifer plumes As shown in Figures 74 and 75 three wells would need to be placed in both the medial and lower aquifers to ensure capture of the plume The relative position of the two sets of wells is depicted on Figure 76 Each of the medial wells would be pumped at 50 gpm and the lower aquifer wells would each be pumped at 150 gpm The predicted remediation time for this alternative is greater than 100 years For costing purposes a duration of 100 years is assumed
732 G3a - Groundwater Recovery and Treatment at Leading Edge and Midpoint of Plume
This alternative is the same as Alternative G2 but in addition to pumping and treating contaminated groundwater from the toe of the plume contaminated groundwater is also pumped and treated from the midpoint of the medial and lower aquifer plume(s) A series of simulations were run in which the midpoint wells were located along different transects in order to decrease the remediation times the most optimal locations are shown in Figures 77 and 78
US EPA Region 7 Garvey Groundwater Flow Modeling Memo 18 July 2012
HGLmdashGroundwater Flow Modeling Technical Memorandum Garvey Elevator Site ndash Hastings NE
The relative position of the two sets of wells is depicted on Figure 79 Each of the medial wells would be pumped at 50 gpm and the lower aquifer wells would each be pumped at 150 gpm The predicted remediation time for this alternative is between 75 and 95 years For cost estimating purposes a duration of 75 years will be assumed
733 G3b - Groundwater Recovery and Treatment at Leading Edge and Midpoint of Medial Aquifer and Two Recovery Well Transects in Lower Plume
The results from G3a indicate that the contamination in the lower aquifer takes the longest time to remediate Therefore this alternative was added to determine how much the remediation times could be reduced if a second set of recovery wells was added to the lower aquifer The placement of the recovery wells in the medial aquifer remains the same as for Alternative G3a (Figure 77) The locations of the two transects of recovery wells in the lower aquifer are shown on Figure 710 Their placement relative to the medial wells is shown in Figure 711 Each of the medial wells would be pumped at 50 gpm and each of the lower aquifer wells would be pumped at 150 gpm The predicted remediation time for this alternative is about 53 years
734 G4a - Establishment of In Situ Treatment Zone at Midpoint of Lower Aquifer Plume and Groundwater Recovery and Treatment at Leading Edge of Medial and Lower Plumes
This alternative involves adding a treatment curtain to the pumping wells specified in the G2 alternative (Figure 712) The transect is simulated as a zero concentration boundary which effectively removes all of the carbon tetrachloride from the groundwater moving through it The relative position of the transect and wells is depicted on Figure 713 Each of the medial wells would be pumped at 50 gpm and each of the lower aquifer wells would be pumped at 150 gpm The predicted remediation time for this alternative is between 75 and 95 years For cost estimating purposes a duration of 75 years is assumed
735 G4b - Establishment of In Situ Treatment Zone(s) at Two Transects of Lower Aquifer Plume and Groundwater Recovery and Treatment at Leading Edge of Medial and Lower Plumes
This alternative involves adding two treatment curtains to the pumping wells specified in the G2 alternative (Figure 714) The relative position of the transects and recovery wells is depicted on Figure 715 Each of the medial wells would be pumped at 50 gpm and the lower aquifer wells each at 150 gpm The predicted remediation time for this alternative is about 56 years
80 SUMMARY AND CONCLUSIONS
A hydrogeologic conceptual site model of the subsurface groundwater flow and contaminant transport was developed to guide the creation of a numerical model The numerical model
US EPA Region 7 Garvey Groundwater Flow Modeling Memo 19 July 2012
HGLmdashGroundwater Flow Modeling Technical Memorandum Garvey Elevator Site ndash Hastings NE
was subsequently calibrated with existing field data (known water levels and pumping rates) to address the following objectives (1) evaluate the overall effectiveness of the current extraction well system (2) identify areas outside of the capture zone that may require enhancements and (3) develop a tool to assist in ldquowhat ifrdquo scenarios for the remedial alternative development
MODFLOW-2000 MT3D-MS and MODPATH are the computer codes applied to conduct the flow and transport analysis The output from MODFLOW-2000 is a groundwater velocity field which is used by MT3D-MS in conjunction with fate and transport parameters to simulate the migration of carbon tetrachloride Particle tracking analyses were also conducted with MODPATH to illustrate the groundwater flow directions travel times and capture zones All of these computer codes are widely used well documented and in the public domain
With respect to the construction of the model a three layer finite difference grid was utilized that simulates the upper middle and lower aquifers covers 102 square miles and includes 1030200 active cells
Calibration of the steady state flow model was accomplished iteratively by adjusting model parameters during successive model runs to match the water level data that was collected from all of the wells on September 26-27 2011 under stressed (pumping) conditions
The flow and transport model was initialized with measured carbon tetrachloride data obtained during a 2011 sampling event These initial concentrations were used as the basis to predict future concentrations under various remedial alternatives involving extraction wells and treatment curtains
Remediation times for OU 1 scenarios varied from 10 to 30 years Scenarios from the No Action alternative and alternative SG-2 were not modeled but were based on an assumed cost basis period and a duration based on existing concentration data trends respectively Remediation times for OU 2 scenarios range from 30 years to more than 100 years
90 REFERENCES
Doherty J 2006 PEST Model-Independent Parameter Estimation User Manual 5th Edition Watermark Computing
Harbaugh AW Banta ER Hill MC and McDonald MG 2000 MODFLOWndash2000 the US Geological Survey Modular Ground-Water ModelmdashUser guide to modularization concepts and the ground-water flow process US Geological Survey Open-File Report 00ndash92 121 p
HydroGeoLogic Inc (HGL) 2009 Focused Feasibility Study Version 4 Garvey Elevator Site OU 1 Garvey Elevator Site Hastings Nebraska December
HGL 2011 Final Remedial Investigation Report Garvey Elevator Site Hastings Nebraska April
US EPA Region 7 Garvey Groundwater Flow Modeling Memo 20 July 2012
HGLmdashGroundwater Flow Modeling Technical Memorandum Garvey Elevator Site ndash Hastings NE
McDonald MG and AW Harbaugh 1988 A Modular Three-dimensional Finite-difference Groundwater Flow Model US Geological Survey TWRI Chapter 6-A1
Pollock DW 1994 Userrsquos Guide for MODPATHMODPATH-PLOT Version 3A particle tracking post-processing package for MODFLOW the U S Geological Survey finite-difference ground-water flow model U S Geological Survey Open-File Report 94shy464
Rumbaugh JO and DB Rumbaugh 1998 Groundwater Vistas Version 516 Environmental Simulations
US Army Corps of Engineers (USACE) 1990 Final Groundwater Modeling Report Hastings East Industrial Park Remedial InvestigationFeasibility Study Hastings Nebraska August
Zheng C 1990 MT3D A modular three-dimensional transport model for simulation of advection dispersion and chemical reactions of contaminants in groundwater systemsrdquo Report to the US Environmental Protection Agency Robert S Kerr Environmental Research Laboratory Ada OK
Zheng Chunmiao and Wang P Patrick 1999 ldquoMT3DMS A modular three-dimensional multispecies transport model for simulation of advection dispersion and chemical reactions of contaminants in groundwater systems documentation and userrsquos guiderdquo Contract Report SERDP-99-1 US Army Engineer Research and Development Center Vicksburg Mississippi
Attachments
Attachment 1 Tables Attachment 2 Figures
US EPA Region 7 Garvey Groundwater Flow Modeling Memo 21 July 2012
This page was intentionally left blank
ATTACHMENT 1 TABLES
Table 51 Table 61 Table 71 Table 72
Contact Elevations of the Major Lithologic Units Water Level Calibration Statistics Groundwater Data Summary Projected Durations to Meet MCLs Remedial Alternatives Summary
This page was intentionally left blank
Table 51 Contact Elevations of the Major Lithologic Units
Garvey Elevator Site Hastings Nebraska
Elev Depth Elev Depth Elev Depth Elev Thickne Depth Elev Depth Elev Thickne Depth Elev Depth Elev (ft) (ft) (ft bgs) (ft amsl) (ft bgs) (ft amsl) (ft bgs) (ft amsl) (ft bgs) (ft amsl) (ft) (ft bgs) (ft amsl) (ft bgs) (ft amsl) (ft) (ft bgs) (ft amsl) (ft bgs) (ft amsl)
OU1 MW-1A 270590926 2080164407 125 192580 645 186130 995 182630 -- -- -- -- -- -- -- -- -- -- -- --OU1 MW-2A 271240410 2080539870 1235 192733 685 185883 835 184383 -- -- -- -- -- -- -- -- -- -- -- --OU1 MW-3ABDE 270755170 2080773994 243 193099 595 187149 111 181999 134 179707 1 135 179607 155 177530 1 156 177430 2385 169249 OU1 MW-4AB 270341995 2080827075 132 193184 585 187334 89 184284 -- -- -- -- -- -- -- -- -- -- -- --OU1 MW-5ABD 269943836 2080752777 188 193006 635 186656 885 184156 132 179785 1 133 179685 -- -- -- -- -- -- --OU1 MW-6ADE 271237345 2081216968 238 192948 735 185598 935 183598 129 180046 1 130 179946 155 177446 5 160 176946 -- --OU1 MW-7AB 269088475 2079699700 135 192092 55 186592 90 183092 -- -- -- -- -- -- -- -- -- -- -- --OU1 MW-8A 271214203 2079067544 132 194080 608 188000 90 185080 -- -- -- -- -- -- -- -- -- -- -- --OU1 MW-9A 272193736 2080628145 116 192540 70 185540 90 183540 -- -- -- -- -- -- -- -- -- -- -- --OU2 MW-10AB 272535399 2081973782 130 192381 65 185881 85 183881 125 179870 1 126 179770 -- -- -- -- -- -- --OU2 MW-11A 271826499 2083509070 110 191228 70 184228 90 182228 -- -- -- -- -- -- -- -- -- -- -- --OU2 MW-12AC 270399710 2085390335 170 191713 50 186713 805 183663 -- -- -- -- -- -- -- -- -- -- -- --
OU2 (new) MW-12D 270399901 2085403521 178 191698 57 185998 88 182898 120 179698 7 127 178998 -- -- -- -- -- -- --OU1 MW-13CE 270368902 2081015694 238 192874 75 185374 90 183874 130 179874 1 131 179774 -- -- -- -- -- 235 169374 OU2 MW-14A 270968774 2084137323 1085 190956 695 184006 895 182006 -- -- -- -- -- -- -- -- -- -- -- --OU2 MW-16AC 267054564 2084286931 160 191545 50 186545 80 183545 -- -- -- -- -- -- -- -- -- -- -- --OU2 MW-17ACD 268796556 2082958916 200 190185 60 184185 85 181685 -- -- -- -- -- -- -- -- -- -- -- --OU2 MW-18ACD 268693818 2085938384 205 191064 55 185564 95 181564 1155 179514 1 1165 179414 -- -- -- -- -- -- --OU1 MW-19AC 270955133 2081332850 165 192781 61 186681 895 183831 128 179981 8 136 179181 150 177781 2 152 177581 -- --OU1 MW-20ACDE 270597445 2081202233 255 192797 54 187397 87 184097 129 179897 7 136 179197 150 177797 2 152 177597 236 169197 OU1 MW-30ACDE 270271723 2081095430 255 192903 70 185903 85 184403 1255 180353 7 1325 179653 146 178303 2 148 178103 237 169203 OU1 MW-31AC 269550764 2080816035 165 193008 63 186708 883 184178 -- -- -- -- -- -- -- -- -- -- -- --OU1 MW-33 271206314 2079068057 255 194074 84 185674 95 184574 1385 180224 55 144 179674 167 177374 675 17375 176699 240 170074
OU1 (new) MW-47BCD 270781240 2081046150 1705 192995 -- -- -- -- 1315 179845 15 133 179695 151 177895 2 153 177695 -- --OU1 (new) MW-48BCD 270645490 2080859850 171 192887 -- -- -- -- 129 179987 35 1325 179637 1498 177907 5 1548 177407 -- --OU1 (new) MW-49BCD 270039470 2080890150 171 192934 -- -- -- -- 1305 179884 15 132 179734 1495 177984 4 1535 177584 -- --OU1 (new) MW-50BCD 270307290 2080987510 170 192925 -- -- -- -- 1275 180175 5 1325 179675 1495 177975 1 1505 177875 -- --OU1 (new) MW-51BCD 270487290 2080899910 171 192943 -- -- -- -- 1268 180263 52 132 179743 1495 177993 45 154 177543 -- --OU2 (new) MW-41D1 266698811 2089673996 171 191524 62 185324 92 182324 126 178899 2 128 178699 148 176699 2 150 176499 -- --OU2 (new) MW-41D2 266708267 2089674259 206 191499 62 185299 92 182299 126 178899 2 128 178699 148 176699 2 150 176499 -- --OU2 (new) MW-42DE 269168074 2100135574 215 190207 66 183607 98 180407 124 177823 10 134 176823 -- -- -- -- -- -- --OU2 (new) MW-43DE 265395404 2097605590 2215 190835 48 186035 89 181935 -- -- -- -- -- 153 175545 2 155 175345 -- --OU2 (new) MW-44DE 267552324 2105258206 214 188530 63 182230 92 179330 119 176630 3 122 176330 1425 174280 75 150 173530 -- --OU2 (new) MW-45CD 270056199 2083476668 170 190982 50 185982 89 182082 112 179746 3 115 179446 -- -- -- -- -- -- --OU2 (new) MW-46D1 269055295 2089632928 167 191097 61 184997 94 181697 121 179003 3 124 178703 148 176303 6 154 175703 -- --OU2 (new) MW-46D2 269063843 2089632455 202 191103 61 185003 94 181703 121 179003 3 124 178703 148 176303 6 154 175703 -- --
Hwy 6 MW-104ACD 271937379 2088225393 235 190901 472 186181 936 181541 115 179401 12 127 178201 -- -- -- -- -- 220 168901 Hwy 6 MW-105ACD 270069428 2089866388 257 191679 68 184879 105 181179 123 179379 10 133 178379 -- -- -- -- -- 2455 167129 Hwy 6 MW-106ACD 270452369 2098166199 255 190664 77 182964 1075 179914 130 177664 5 135 177164 -- -- -- -- -- 248 165864 OU1 I-1 270863284 2080138346 175 19212 -- -- -- -- -- -- -- -- -- -- -- -- -- -- -- --OU1 I-2 270331729 2080131336 175 19200 -- -- -- -- -- -- -- -- -- -- -- -- -- -- -- --OU1 HTW-40 271217856 2079157749 -- 19395 -- -- -- -- -- -- -- -- -- -- -- -- -- -- -- --
Hwy 6 HTW-100 273075261 2082012337 255 19066 770 182964 1076 179904 130 177664 55 -- -- -- -- -- -- -- -- --
Surface Elevation -
Surficial Soil Peoria and
Loveland Loess
Very Fine Sand Silty Fine Sand
Clayey Silt
Silty Sand and Gravel (contains Upper Aquifer)
Upper Aquitard Medial Aquifer
Monitoring Wells
Boring DepthEasting(2)Northing(2)
Well ID Lower Aquitard Lower AquiferSite
Top of Lithologic and Hydrostratigraphic Units(1)
Decomposed Weathered
Shale
Sheet 1 of 2
Table 51 Contact Elevations of the Major Lithologic Units
Garvey Elevator Site Hastings Nebraska
Elev Depth Elev Depth Elev Depth Elev Thickne Depth Elev Depth Elev Thickne Depth Elev Depth Elev (ft) (ft) (ft bgs) (ft amsl) (ft bgs) (ft amsl) (ft bgs) (ft amsl) (ft bgs) (ft amsl) (ft) (ft bgs) (ft amsl) (ft bgs) (ft amsl) (ft) (ft bgs) (ft amsl) (ft bgs) (ft amsl)
Surface Elevation -
Surficial Soil Peoria and
Loveland Loess
Very Fine Sand Silty Fine Sand
Clayey Silt
Silty Sand and Gravel (contains Upper Aquifer)
Upper Aquitard Medial Aquifer Boring DepthEasting(2)Northing(2)
Well ID Lower Aquitard Lower AquiferSite
Top of Lithologic and Hydrostratigraphic Units(1)
Decomposed Weathered
Shale
OU1 (new) SB-09 270168160 2080517340 13160 192984 59 187084 90 183984 130 179984 1 131 179884 -- -- -- -- -- -- --OU1 (new) SB-13 269654838 2080309785 14340 192973 67 186273 87 184273 130 179973 3 133 179673 -- -- -- -- -- -- --OU1 (new) SB-29 270864398 2081035503 14215 192989 68 186189 90 183989 -- -- -- -- -- -- -- -- -- -- -- --OU1 (new) SB-32 271237915 2079979855 14865 192475 66 185875 92 183275 -- -- -- -- -- 148 177675 297 149 177575 -- --OU1 (new) SB-33 269199799 2080682378 14085 193446 63 187146 93 184146 -- -- -- -- -- -- -- -- -- -- -- --OU1 (new) SB-39 271537352 2081550026 13560 192583 64 186183 89 183683 -- -- -- -- -- -- -- -- -- -- -- --OU2 (new) TS1-01 269515615 2089614339 864 191569 70 184569 86 182969 -- -- -- -- -- -- -- -- -- -- -- --OU2 (new) TS1-03 268313868 2089646765 16736 191251 66 184651 86 182651 1195 179301 05 120 179251 148 176451 5 153 175951 -- --OU2 (new) TS1-05 267030127 2089665004 16681 191624 75 184124 87 182924 117 179924 2 119 179724 153 176324 308 155 176124 -- --OU2 (new) TS2-02 271456113 2097510251 13680 191015 73 183715 104 180615 134 177614 3 137 177314 -- -- -- -- -- -- --OU2 (new) TS2-04 268939527 2097554155 16746 190360 70 183360 89 181460 126 177760 9 135 176860 152 175160 306 154 174960 -- --OU2 (new) TS2-05 267717573 2097569698 17161 190143 62 183943 99 180243 -- -- -- -- -- 157 174443 2 159 174243 -- --OU2 (new) TS2-06 266250085 2097592053 11980 190501 60 184501 100 180501 -- -- -- -- -- -- -- -- -- -- -- --OU2 (new) TS3-02 269400264 2102787273 15690 189415 68 182615 96 179815 125 176915 7 132 176215 147 174715 297 150 174415 -- --OU2 (new) TS3-05 265786308 2102812115 14380 189056 67 182356 96 179456 1195 177106 1 1205 177006 129 176156 261 132 175856 -- --OU2 (new) TS4-02 267112179 2105261928 17031 188448 64 182048 96 178848 116 176848 3 119 176548 141 174348 284 143 174148 -- --
Hwy 6 TS3-01 271941141 2089537242 1453 19153 720 184334 1125 180284 1256 178974 29 1285 178684 -- -- -- -- -- -- --Hwy 6 TS3-02 271499828 2089579255 1414 19139 692 184466 102 181186 1227 179116 59 1286 178526 -- -- -- -- -- -- --Hwy 6 TS3-03 270957676 2089591662 1440 19087 710 183767 941 181457 1178 179087 56 1234 178527 -- -- -- -- -- -- --Hwy 6 TS3-04 270411434 2089597601 1403 19088 663 184254 1006 180824 1167 179214 61 1228 178604 -- -- -- -- -- -- --Hwy 6 TS3-05 272464675 2089528557 1718 19173 685 184883 1032 181413 123 179433 7 130 178733 -- -- -- -- -- -- --Hwy 6 TS4-01 271882569 2095813356 1658 19042 650 183920 987 180550 1238 178040 52 129 177520 -- -- -- -- -- -- --Hwy 6 TS4-03 270996450 2096068696 1171 19050 810 182400 966 180840 1154 178960 12 1166 178840 -- -- -- -- -- -- --Hwy 6 TS5-01 271766686 2092074297 1562 19016 648 183680 905 181110 1163 178530 53 1216 178000 -- -- -- -- -- -- --Hwy 6 TS5-03 270732978 2092105115 1389 19008 709 182990 923 180850 1147 178610 46 1193 178150 -- -- -- -- -- -- --Hwy 6 TS5-05 272269991 2092059880 1717 19045 425 186200 942 181030 1153 178920 83 1236 178090 -- -- -- -- -- -- --
Electrical Conductivity Borings
(1)Surface elevation listed for nested monitoring wells (ABCDE) is the surface elevation of the A well Unit elevations are from the boring logs in which they were recorded (2)State Plane Coordinate system Nebraska 2600 amsl - above mean seal level bgs - below ground surface Elev - elevation ft - feet Hwy 6 - Wellsborings installed for the West Highway 6 and Highway 281 Site Investigations -- - not applicable or not available OU1 - Operable Unit 1 these wells are associated with on-site groundwater OU1 (new) - Operable Unit 1 wellsborings installed in AprilMay 2010 for the RI OU2 - Operable Unit 2 these wells are associated with off-site groundwater OU2 (new) - Operable Unit 2 Monitoring wellsborings installed in AprilMay 2010 for the RI
Sheet 2 of 2
Table 61 Water Level Calibration Statistics
Garvey Elevator Site Hastings Nebraska
Name Layer
Target Water Level Elevation - Sept 2011
(feet amsl) Model
Water Level Error
Residual MW-12U 1 18156 1814424820 117518 MW-100A 1 181542 1814519751 0900249 MW-16U 1 181534 1814385390 095461 MW-10A 1 181528 1814182851 1097149 MW-1A 1 181525 1815209270 004073 MW-2A 1 181519 1815393838 -0203838 MW-05 1 181516 1814358176 0801824
MW-102A 1 18151 1813770877 1329123 MW-13U 1 181507 1813730081 1339919 MW-7A 1 181504 1815242607 -0202607 MW-04 1 181487 1814376802 0493198
MW-17U 1 181486 1814230581 0629419 MW-07 1 181475 1814008616 0741384 MW-03 1 181471 1813907473 0802527 MW-02 1 181468 1813743101 0936899 MW-08 1 181465 1814180036 0469964 MW-06 1 18146 1814237391 0362609
MW-10U 1 181453 1814016597 0513403 MW-14U 1 181451 1814457639 0052361 MW-6A 1 181444 1814334070 010593 MW-01 1 18144 1814062502 0337498
MW-11A 1 181429 1812347804 1942196 MW-11U 1 181411 1814658764 -0548764 MW-10B 1 181372 1814173608 -0453608 MW-3A 1 181357 1813385654 0184346 MW-5B 1 181339 1813199091 0190909 MW-15U 1 181326 1814948966 -1688966 MW-47B 1 181316 1812784852 0375148 MW-50B 1 181314 1812748409 0391591 MW-4A 1 18131 1812992455 0107545 MW-3B 1 181308 1813389494 -0309494 MW-5A 1 181307 1813165365 -0095365 MW-19A 1 181301 1813252060 -024206 MW-4B 1 181298 1812954715 0025285 MW-31A 1 181289 1812885039 0004961 MW-51B 1 181236 1812125173 0234827 MW-49B 1 181227 1812349041 -0079041 MW-48B 1 18122 1812098306 0101694 MW-30A 1 181194 1812183956 -0243956 MW-09U 1 181194 1814076063 -2136063 MW-20A 1 181179 1812309176 -0519176 MW-14A 1 181061 1810498570 011143 MW-17A 1 18098 1809745419 0054581
Sheet 1 of 3
Table 61 Water Level Calibration Statistics
Garvey Elevator Site Hastings Nebraska
Name Layer
Target Water Level Elevation - Sept 2011
(feet amsl) Model
Water Level Error
Residual MW-12A 1 180706 1807353224 -0293224 MW-16A 1 180683 1806758847 0071153 MW-18A 1 18062 1805744494 0455506 MW-104A 1 180386 1804035180 -017518 MW-105A 1 179994 1799915974 0024026 MW-106A 1 178857 1788240807 0329193 MW-18C 3 180409 1804214829 -0124829 MW-12C 3 180568 1805675664 0004336 MW-16C 3 180625 1806232799 0017201 MW-45C 3 180888 1809089044 -0209044 MW-17C 3 180918 1809113670 006633 MW-47C 3 181047 1810251020 021898 MW-101B 3 181066 1811509656 -0849656 MW-102B 3 181092 1811706686 -0786686 MW-13C 3 181107 1811204349 -0134349 MW-51C 3 181177 1811366716 0403284 MW-50C 3 18119 1811832475 0067525 MW-49C 3 181235 1812474567 -0124567 MW-48C 3 18125 1812312538 0187462 MW-7B 3 181497 1815042613 -0072613
MW-09M 5 181527 1813657691 1612309 MW-3D 5 181479 1814354375 0435625 MW-3E 5 181379 1814210888 -0420888 MW-5D 5 181366 1813572038 0087962 MW-47D 5 181365 1812738611 0911389 MW-49D 5 18134 1813402643 -0002643 MW-48D 5 181323 1812926923 0303077 MW-50D 5 181323 1812962182 0267818 MW-31C 5 181311 1813127460 -001746 MW-51D 5 181302 1812256458 0763542 MW-13E 5 181234 1812181638 0158362
MW-100D 5 181223 1813629694 -1399694 MW-100C 5 181216 1813634399 -1474399 MW-30C 5 181208 1811949179 0130821 MW-19C 5 1812 1812353637 -0353637 MW-20D 5 181196 1811924735 0035265 MW-30D 5 181188 1811949179 -0069179 MW-20E 5 181155 1811924735 -0374735 MW-16M 5 181133 1811653909 -0323909 MW-13M 5 181117 1811940971 -0770971 MW-30E 5 181115 1811949179 -0799179 MW-11M 5 181097 1814139713 -3169713 MW-17D 5 180923 1808958032 0271968
Sheet 2 of 3
Table 61 Water Level Calibration Statistics
Garvey Elevator Site Hastings Nebraska
Name Layer
Target Water Level Elevation - Sept 2011
(feet amsl) Model
Water Level Error
Residual MW-20C 5 180892 1811924735 -3004735 MW-45D 5 180884 1809292039 -0452039 MW-12D 5 180575 1805738454 0011546 MW-18D 5 180413 1804194578 -0064578 MW-104D 5 180137 1801272389 0097611 MW-104C 5 180135 1801269033 0080967 MW-46D1 5 179796 1797768438 0191562 MW-105D 5 179794 1797798970 014103 MW-46D2 5 179792 1797771831 0148169 MW-105C 5 179791 1797803499 0106501 MW-41D2 5 179702 1797046783 -0026783 MW-41D1 5 179697 1797044368 -0074368 MW-106C 5 178531 1785334635 -0024635 MW-106D 5 178527 1785320367 -0050367 MW-43D 5 178387 1783880124 -0010124 MW-43E 5 178386 1783888909 -0028909 MW-42D 5 178183 1781770173 0059827 MW-42E 5 178182 1781753639 0066361 MW-44D 5 177409 1774079493 0010507 MW-44E 5 177407 1774078775 -0008775
Residual Mean 0046933 Res Std Dev 0743461 Sum of Squares 6048817
RMS Error 0744941 Min Residual -3169713 Max Residual 1942196
Number of Observations 109 Range in Observations 4362
Scaled Std Dev 0017044 Scaled Abs Mean 0010505
Scaled RMS 0017078 Notes
amsl - above mean sea level
Sheet 3 of 3
Table 71 Groundwater Data Summary Projected Durations to Meet MCLs
Garvey Elevator Site Hastings Nebraska
Well Data Collection Range TCE Concentration μgL Estimated Date to
Reach MCLs Duration from June 2012 yrsHigh Low
MW-3A May 1997 - March 2012 20000 11 already achieved NA MW-3B May 1997 - March 2012 23000 74 Nov 2045 33 MW-3D April 1997 - March 2012 5 05 already achieved NA MW-3E April 1997 - March 2012 4 05 already achieved NA MW-4A May 1997 - March 2012 18000 43 Sept 2013 1 MW-4B May 1997 - March 2012 29000 690 Dec 2042 30 MW-5A May 1997 - March 2012 24000 47 already achieved NA MW-5B May 1997 - March 2012 15000 12 Jan 2017 5 MW-5D April 1997 - March 2012 4 05 already achieved NA MW-13C May 1997 - March 2012 18000 28 Nov 2061 49 MW-13E May 1997 - March 2012 5 05 already achieved NA
RW-1 1999 - 2011 490 10 May 2016 4 RW-2 1999 - 2011 3200 5 Nov 2021 9 RW-3 1999 - 2011 3800 5 Feb 2024 12 RW-4 1997 - 2011 5500 5 June 2016 4 RW-5 1999 - 2011 5500 5 achieved NA RW-6 1999 - 2011 590 10 Oct 2018 6 RW-7 1995 - 2011 1000 5 Jan 2025 13 RW-8 1998 - 2011 380 5 March 2047 35
Notes
Dates and concentration data are from the site database projections to reach MCLs are based on curves fitted to data plots as provided by Dr Brian
Zurbuchen via email on June 11 2012
μgL - micrograms per liter
Sheet 1 of 1
Table 72 Remedial Alternatives Summary
Garvey Elevator Site Hastings Nebraska
Remedial Alternative Assumptions Remediation
Times Notes
OU 1
SG-1-No Action All extraction wells off 30 years
This scenario was not explicity modeled Based on the remedition duration predicted for SG2 remediation time will be greater than 30 years However for cost estimating purposes a 30-year duration will be used
SG2-- Maintain and Operate Existing GET System
No treatment of downgradient plume
30 years This scenario was not explicity modeled but remediation time was estimated based on contaminant concentration trends (see Table 71)
SG3--In Situ Treatment Via Groundwater Amendments
Area within gt500 ugL set to 00 on-site treatment system shut off
15 years Remediation time estimates are for OU1 (on-site) plume using multiple injection treatments and existing GET system shut off
SG4-- Maintain and Operate Existing GET System and Treatment Via Groundwater Amendments
Pump and treat system operating groundwater within concentrations gt500 ugL set to 00
10 years Remediation time estimates are for OU1 (on-site) plume using multiple injection treatments and existing GET system operating
OU 2
G1-No Action Pump and treat system operating no treatment of downgradient plume
30 years This scenario was not explicity modeled For cost estimating purposes a 30-year duration will be used
G2-Groundwater Recovery Treatment and Discharge at Leading Edge of Plume
On-site pump and treat system operating
100 years Based upon modeling results for more active remedies the remediation times for both the OU 1 and OU 2 plumes would exceed 100 years This scenario was not explicity modeled
G3a-Groundwater Recovery Treatment and Discharge at mid point and Leading Edge of Plume
On-site pump and treat system operating
75 years
Modeled duration ranges from 75 to 90 years
G3b-Groundwater Recovery Treatment and Discharge at two transects and Leading Edge of Plume
On-site pump and treat system operating
53 years
G4a-In Situ treatment at midpoint of plume and Groundwater Recovery Treatment and Discharge at leading edge of plume
On-site pump and treat system operating
75 years
Same as G3 but a treatment zone replaces the recovery wells near the midpoint of the plume Modeled duration ranges from 75 to 90 years
G4b-In Situ treatment at two transects near core of plume and Groundwater Recovery Treatment and Discharge at leading edge of plume
On-site pump and treat system operating
56 years Same as G3 but two treatment zones replace the recovery wells near the midpoint of the plume
Notes
μgL - micrograms per liter
Sheet 1 of 1
This page was intentionally left blank
ATTACHMENT 2 FIGURES
Figure 31 Carbon Tetrachloride Isoconcentrations Upper Aquifer Zone AB Figure 32 Carbon Tetrachloride Isoconcentrations Medial Aquifer Zone C Figure 33 Carbon Tetrachloride Isoconcentrations Lower Aquifer Zone DE
Figure 51 Model Domain and Boundary Conditions Figure 52 Vertical Discretization of Model Figure 53 Elevation of the Model Base Figure 54 Elevation of the Top of the Lower Aquifer Figure 55 Isopach Map of the Lower Confining Unit Figure 56 Elevation of the Base of the Medial Aquifer Figure 57 Isopach of Upper Aquifer Figure 58 Elevation of the Base of the Upper Aquifer Figure 59 Location of Recovery Wells in the Shallow Aquifer Figure 510 Location of Recovery Wells in the Medial Aquifer Figure 511 Location of Injection and Municipal Wells in the Lower Aquifer Figure 512 Initial Concentrations of Carbon Tetrachloride in the Shallow Aquifer Figure 513 Initial Concentrations of Carbon Tetrachloride in the Medial Aquifer Figure 514 Initial Concentrations of Carbon Tetrachloride in the Lower Aquifer
Figure 61 Error Residuals Versus Measured Water Levels Figure 62 Measured Water Levels Versus Predicted Water Level Elevations Figure 63 Error Residuals for the Shallow Aquifer in the Vicinity of the Garvey Elevator
Site Figure 64 Error Residuals for the Shallow Aquifer over the Model Domain Figure 65 Error Residuals for the Medial Aquifer over the Model Domain Figure 66 Error Residuals for the Lower Aquifer in the Vicinity of the Garvey Elevator
Site Figure 67 Error Residuals for the Lower Aquifer over the Entire Model Domain Figure 68 Calibrated Hydraulic Conductivities of the Shallow Aquifer Figure 69 Calibrated Hydraulic Conductivities of the Medial Aquifer Figure 610 Calibrated Hydraulic Conductivities of the Lower Aquifer Figure 611 Calibrated Hydraulic Conductivities of the Upper Aquitard Figure 612 Calibrated Hydraulic Conductivities of the Lower Aquitard Figure 613 Calibrated Potentiometric Surface of the Shallow Aquifer Figure 614 Calibrated Potentiometric Surface of the Medial Aquifer Figure 615 Calibrated Potentiometric Surface of the Lower Aquifer Figure 616 Particle Tracking Analysis to Estimate Travel Time
Figure 71 Initial Concentrations for Alternative SG3 Figure 72 Capture Zone Analysis in the Shallow Aquifer for Alternative SG3 Figure 73 Capture Zone Analysis in the Medial Aquifer for Alternative SG3 Figure 74 Alternative G2 ndash Proposed Recovery Wells Medial Aquifer
ATTACHMENT 2 FIGURES (continued)
Figure 75 Alternative G2 ndash Proposed Recovery Wells Lower Aquifer Figure 76 Preliminary Locations for Leading Edge Recovery Wells and Groundwater
Treatment Building ndash Alternative G2 Figure 77 Alternative G3ab ndash Proposed Recovery Wells Medial Aquifer Figure 78 Alternative G3a ndash Proposed Recovery Wells Lower Aquifer Figure 79 Preliminary Locations for Mid-Plume and Leading Edge Recovery Wells and
Groundwater Treatment BuildingmdashAlternative G3 Figure 710 Alternative G3b ndash Proposed Recovery Wells Lower Aquifer Figure 711 Alternative G3b ndash Relative Positions of Proposed Recovery Wells Medial and
Lower Aquifer Figure 712 Alternative G4a ndash Proposed Treatment Curtain and Recovery Wells Lower
Aquifer Figure 713 Preliminary Locations for Mid-Plume Injection Wells Leading Edge Recovery
Wells and Groundwater Treatment Building ndash Alternative G4 Figure 714 Alternative G4b ndash Proposed Treatment Curtains and Recovery Wells Lower
Aquifer Figure 715 Alternative G4b ndash Relative Positions of Proposed Recovery Wells and
Treatment Curtains
5
5
5
5
5
50
100 500
MW-6A SB-39 HGLmdashGroundwater Flow Modeling Technical MemorandumMW-2AHTW 40 (98)(ND)MW-8A MW47B ( Garvey Elevator SitemdashHastings NE(ND)
(59) SB-38
MW-19APSUS PU PPPUUU ( Figure 31 (70)MW-33 MW-3AB
Carbon Tetrachloride in the(ND53) MW49B MW-20A
+UP+UPPPP+U+U+UPPPPUUUU+UP+UPPPP+U+U+U(43) Upper Aquifer Zone AB(10)
MW-1A PU MW50B(ND) +UP+UPPPP+U+U+U September 2011 Sampling(84)
PPUUMW-4AB PPUU MW-13CE +++++UPUPPPPUUU (21640)
MW-30A (160)+UP+UPPPP+U+U+U LegendPPPUUU
1000 MW51B (1200) MW-5AB
(4119J)
Garvey Property BoundaryMW-7AB MW-31A (ND) (75) (
PPUU MW48B RailroadSB-33 (680)
Inset Ntilde Monitoring Well Location MW-47B MW-10A
(59) (ND) Multilevel Well MW-9A MW-6AHTW 40 MW-10B(ND) (98)
(ND) MW-11A S Hydraulic Conductivity
MW-33 UPPUMW-2A MW-19AU MW-14A(ND) P
(70) PU (ND) A West Highway 6 amp Highway 281 Site MW-12A AMW-106AMW-20A MW-104AMW-3A MW-8A (ND) Monitoring WellU UUU (ND)PSSU P PPP (10)(ND) (ND)(ND) U
UUUUU PUUUUP PPPPPPPPPPPPPPPPPPPPPPPUUUUPUPPPPUUUUU MW-13CE
UUUU Carbon Tetrachloride ConcentrationMW-3B MW-105A A (190)PPP A (ND)
UUUUUUUUU(53) MW-30A in micrograms per liter (microgL)PPUUPPPUUUPPPPPUUUUU
MW-12DMW-1A (160) MW-42 DEMW-45CD(ND)
MW-50B MW-49B MW-51B Carbon Tetrachloride Isoconcentration(84) PPUUPPUU(43)
PPUU(1200)
Contour (microgL)PPPUUU PPPUUUMW-46 D1D2MW-7B (5)(ND)
(Dashed Lines are Estimated)MW-7A (ND)
MW-5A (41)
MW-4A (21) MW-4B (640)
MW-48B (680)
MW-17A (ND)
MW-16A (ND) UUPP
MW-18A (ND)
MW-41 D1D2 UUPP
MW-44 DE UUPP
MW-5B
MW-31A (75)
(19)
MW-43 DE UUPP Notes
(ND) Nondetect
0 2500 5000
Feet sup3 Filename XEPA009GarveyGW_Flow_Tech_Memo Carbon_TetChl_UpperAquifer_ABmxd Project EP903401220202 Revised 061312 ST Source ENSR GDB 2008 DNR
100
5
100
SB-39MW-6AHTW 40 HGLmdashGroundwater Flow Modeling Technical Memorandum MW47C SB-38MW-33 MW-2A (62) ( Garvey Elevator SitemdashHastings NE
UUUPSUS P PPP (
U
Figure 32MW-8A MW-3ABDE MW-19C (ND) Carbon Tetrachloride in the
MW-1A +++++PPPP UPUPPPPUUUUUUU
+UP+UPPPP+U+U+U Medial Aquifer Zone CPU MW-20C +UP+UPPPP+U+U+U (ND) September 2011 SamplingMW49C
UU(ND) PPUU +++++PPPPPPPUUUUU MW50C
(ND) +UP+UPPPP+U+U+UPPPUUU LegendMW-13C
MW-4AB (130) MW-30C
MW-5AB (ND) MW48C MW51C
(ND) (ND) Garvey Property Boundary SB-33 (
MW-7AB PPUU MW-31C (ND) Railroad
Inset Ntilde Monitoring Well Location MW-47CMW-9A MW-10AB Multilevel Well(62)
HTW 40
MW-6A S Hydraulic Conductivity WellMW-11AMW-33 PPUUMW-2A
MW-19CUP (ND) P West Highway 6 amp Highway 281 SiteU MW-14A A A Monitoring WellMW-20C MW-12C MW-106CMW-104CPSS P PPP
U (ND) (ND) (90) (ND)
MW-8A MW-13C U U UUU
PMW-3ABDE PPPPPPPPUUUUPU (130) Carbon Tetrachloride ConcentrationPU UUUU UUUUUUUUUU
MW-105C A (190)MW-1A UUUUUUUUUPPPPPPPPPPPPPPPPPPP MW-30C PPPUUU MW-12D A (200) in micrograms per liter (microgL)
MW-49C UUUUPUPPPPUUPU (ND) UPPU Old Rolls MW-42 DEPP (13)(ND) Carbon Tetrachloride Isoconcentration MW-45C MW-50C (ND)
MW-51C (ND) PPUU PPUU PPUU (5) Contour (microgL)(ND)
UUU PPP MW-46 D1D2
PPP UUUMW-48C (Dashed Lines are Estimated)5MW-7AB (ND)
MW-4AB MW-17C MW-18C(ND) MW-44 DE Domestic Irrigation W ater Wells(81)MW-5AB
PPUUMW-31C MW-16C (ND)
PPUU(ND) MW-41 D1D2
PPUU
Notes MW-43 DE PPUU
(ND) Nondetect
0 2500 5000
Feet sup3 FilenameXEPA009GarveyGW_Flow_Tech_Memo Carbon_TetChl_Medial_Aquifer_Cmxd Project EP903401220202 Revised 061312 ST Source ENSR GDB 2008 DNR
50
5
5
50 100
MW-6D SB-39 HGLmdashGroundwater Flow Modeling Technical MemorandumHTW 40 (ND) SB-38MW-3DE ( Garvey Elevator SitemdashHastings NE (NDND)
UUUUPSUS P PPP MW-19AC( Figure 33MW-2A MW-33 MW47D
U (ND)
Carbon Tetrachloride in theMW-8A PPPPUUUU P Lower Aquifer Zone DEUMW-1A MW-20DEPU P
(NDND)UPUU
September 2011 Sampling MW-13EPPUUPPPU (ND)
MW50D UPMW49D (ND) UUU(ND) PPP MW-30DE Legend MW51D (ND)
(ND)MW-4AB MW48D (ND)
MW-7AB MW-5D (ND) Garvey Property Boundary
MW-31C (ND)
PPUU
(
RailroadSB-33MW-3DE (NDND)
Inset Ntilde Monitoring Well Location MW-47D
MW-9A (ND) Multilevel Well HTW 40
MW-6D MW-10AB (ND)
MW-11A S Hydraulic Conductivity Well MW-33 MW-2A UPPU
PUMW-19AC West Highway 6 amp Highway 281 Site MW-14A APU
MW-20DE MW-106D A Monitoring WellMW-104DPSSU PU PPPUUU (NDND)
MW-12C (ND)(ND)MW-8A MW-13E PU
UUUUU (ND) Carbon Tetrachloride ConcentrationU PPPPPPPPUUUUPU (190)PPUUU
PPUPPPPPPPPPPPPPPPUUUUUP
UUUUU UUUUUUU PPP A MW-105DMW-1A in micrograms per liter (microgL) AMW-30DE
PPUUPPPUUUPPPPPUUUUU(52)
(NDND) MW-12DNew RollsMW-49D (ND) (ND)
Carbon Tetrachloride Isoconcentration(ND) MW-45D PPUUMW-51D (ND)
MW-46 D1PPUU PPUU Contour (microgL)MW-50D (ND) (5)(ND)
PPPUUU (770)PPPUUU MW-42 DMW-48D (Dashed Lines are Estimated)MW-4AB (4274)(ND)
MW-44DEMW-46 D2 MW-17D (320) (19ND)MW-7AB
MW-5D Domestic Irrigation W ater Wells(94) MW-18D PPUUMW-31C(ND) (21) MW-41 D1MW-5B MW-16C PPUU (ND)
PPUUMW-41 D2 (10) Notes
MW-43DE UUPP(ND18) (ND) Nondetect
0 2500 5000
Feet sup3 Filename XEPA009GarveyGW_Flow_Tech_Memo Carbon_TetChl_LoweR_Aquifer_Dmxd Project EP903401220202 Revised 061312 ST Source ENSR GDB 2008 DNR
_L _j I I I I _j_ I I I
I l --- I 111
1
__u_ I I
1 I ~ N ----y-
+ ~ I
II L _l e11111111111 I ---1 ~lJJ I n r Igt I Constant Head Boundariesj l _Q No Flow Sound aries I I l
~ r-- I - I middot r-
- fl+- L -
0 I J ~r-
Ll-D l Garvey Site I - ~t
Ill -J
l unJprm Spacing 25 eet U~iform S pacing 1 00 feet I Constant Head Boundaries
j
middotmiddot- ~ No Flow Sound aries
J
--=J--=11-~=======2~-----~3=========4~------5 M1les 0 05
Figure 51 Model Domain Gridding and Boundaries
Figure 52 Vertical Discretization of Model
1610
1620
1 6 2 0
1630
1 6 3 0
1640
1 6 4 0
1650
1 6 5 0
1660
1660
1670
1670
1680
1680
1690
17
1698
17013
16918
169198
169118
165864
167129
168901
169482
169872
169403
169347
169374
169448
Figure 53 Elevation of the Model Base (weathered shale of the Niobrara Formation)
1111
I I
-
N
+ 0 05
I I
I 1 l
I
1 l -
2 3 4 Miles
Figure 54 Elevation of the Top of the Lower Aquifer
Figure 55 Isopach Map of Lower Confining Unit (model Layer 4)
Figure 56 Elevation of the Base of the Medial Aquifer
Figure 57 Isopach of Upper Aquitard (model layer 2)
Figure 58 Elevation of the Base of the Upper Aquifer
I I I
~ ~ t--7 t bull I I I
r I l
I EW-01 f1-m I N I bull __ j
+ twtrl I I I rl bull I I I I J I I I -r-----
- middot-- - -- -- middot------__J_--
I --- 1 Feet I 0 500 1 000 2000 3000 4000 rooo I I I I
Figure 59 Location of Recovery Wells in the Shallow Aquifer
_l ________ l I I I -1 middot ] l ~----------middotj + I j
middotmiddot= middotmiddot- ---------L -- ---- ___ _ [_ __
r--------shy1
o--~oomiddoto~bull1~oo=o ======4~oomiddoto------middot~ooco=======43oobullo -------~oo~1
Figure 510 Location of Recovery Wells in the Medial Aquifer
I I r
~~ r -
L - - - -- -1--ltmiddot --I-
I -
---- L f+r
il I
J ---1
I
N
+
Figure 511 Location of Injection and Municipal Wells in the Lower Aquifer
Figure 512 Initial Concentrations of Carbon Tetrachloride in the Shallow Aquifer
Figure 513 Initial Concentrations of Carbon Tetrachloride in the Medial Aquifer
Figure 514 Initial Concentrations of Carbon Tetrachloride in the Lower Aquifer
-40
-30
-20
-10
00
10
20
30
40
17741 17828 17915 18002 18090 18177
Res
idua
l
Layer 1
Layer 3
Layer 5
Observed Value
Figure 61 Error Residuals Versus Measured Water Levels
Layer 1
Layer 3
18090
18177
Layer 5
Mod
el V
alue
17741 17828 17915 18002 18090 18177
18002
17915
17828
17741
Observed Value
Figure 62 Measured Water Levels Versus Predicted Water Levels
bull -020
N
+ 0
h I I
-----------~----j_ _______ ___ j_94-__ _ __ I ------------- t
011
bull 005
05
bull
I
Mile 1
Figure 63 Error Residuals for the Shallow Aquifer in the vicinity of the Garvey Elevator Site
Figure 64 Error Residuals for the Shallow Aquifer Over the Model Domain
-007 bull
N
+
il _ __ ~ II
t079 i
I 1 II_ --middot--middot- J_~=====-middot 1------~
~--1 000 r-----middot- -middotmiddot ____
-021 bull
-012 007 bull bull
l middot l02
I ~~~~====~---====~---Feet _ o ___ _ $-_~_0 _ ___ _ J000 _____ 3QQ_Q_ ---4lIJOLUlJ00----ltgt5ultOOO-- middott- middot ----
I
Figure 65 Error Residuals for the Medial Aquifer Over the Model Domain
0 250
N
+
044 bullbull -042
000 bull
027 bull
013
-)35 bull
Figure 66 Error Residuals for the Lower Aquifer in the Vicinity of the Garvey Elevator Site
Figure 67 Error Residuals for the Lower Aquifer in the Entire Model Domain
Figure 68 Calibrated Hydraulic Conductivities of the Shallow Aquifer (ftd) (model layer 1)
Figure 69 Calibrated Hydraulic Conductivities of the Medial Aquifer (ftd) (model layer 3)
Figure 610 Calibrated Hydraulic Conductivities of the Lower Aquifer (ftd) (model layer 5)
Figure 611 Calibrated Hydraulic Conductivities of the Upper Aquitard (ftd) (model layer 2)
Figure 612 Calibrated Hydraulic Conductivities of the Lower Aquitard (ftd) (model layer 4)
Figure 613 Calibrated Potentiometric Surface of the Shallow Aquifer (model layer 1)
Figure 614 Calibrated Potentiometric Surface of the Medial Aquifer (model layer 3)
Figure 615 Calibrated Potentiometric Surface of the Lower Aquifer (model layer 5)
Figure 616 Particle Tracking Analysis to Estimate Travel Time
Figure 71 Initial Concentrations for Alternative SG3
E3 E3 2000feet
Figure 72 Capture Zone Analysis in the Shallow Aquifer for Alternative SG3
E3 E3 E3 2000feet
Figure 73 Capture Zone Analysis in the Medial Aquifer for Alternative SG3
Figure 74 Alternative G2-Proposed Recovery Wells Medial Aquifer
Figure 75 Alternative G2- Proposed Recovery Wells Lower Aquifer
50
5 5
5
50 100
MW-3DE (NDND)
MW-47D MW-9A (ND)
HTW 40 MW-6D MW-10AB
(ND) MW-11A
MW-2AMW-33 UPPUPU
MW-19AC MW-14A APUMW-20DE MW-106DMW-104D(NDND) MW-12CPSSU (ND)PU PPPUUU PU (ND) MW-13E
HGLmdashGroundwater Flow Modeling Technical Memorandum Garvey Elevator Superfund SitemdashHastings NE
Figure 76 Preliminary Locations for Leading
Edge Recovery Wells and Groundwater Treatment Building-Alternative G2
Legend Garvey Property Boundary
Railroad
Ntilde Monitoring Well Location
Multilevel Well
S Hydraulic Conductivity Well
A West Highway 6 amp Highway 281 Site Monitoring Well
(190) Carbon Tetrachloride Concentration in micrograms per liter (microgL)
Carbon Tetrachloride Isoconcentration Treatment Building
Technical Blvd
MW-8A UUUU UUUUU
U PPPPPPPPUUUUPU UUUUUUPUP
UUUUUPPPPPPPPPPPPPPPPPP (ND)
PPPUUU A MW-105DMW-1A UU AMW-30DE PPUUPPPUUUPPPPPUUUUU
(52)(NDND) MW-12DNew Rolls Contour (Lower Aquifer) (microgL)MW-49D (5)(ND) (ND)
(ND) MW-45D (Dashed Lines are Estimated)PPUUMW-51D (ND) MW-46 D1PPUU PPUUMW-50D
(ND) (ND)
PPPUUU (770)PPPUUU MW-42 DMW-48D Domestic Irrigation W ater WellsMW-4AB (4274) MW-44DE(ND)
(19ND)MW-46 D2 MW-17D (320)MW-7AB Carbon Tetrachloride Isoconcentration(94)MW-5D
MW-18D PPUU (5) Contour (Upper Aquifer) (microgL)(21) MW-41 D1 MW-31C(ND)
MW-5B MW-16C PPUU (Dashed Lines are Estimated)(ND)
PPUUIdlewilde Rd
MW-41 D2 Recovery Wells (Medial)
Recovery Wells (Deep)
(10)
MW-43DE PPUU(ND18)
Recovery Well Piping
Treatment Building
Notes (ND) Nondetect
Blaine A
ve
Showboa t B
lvd
sup3 Filename XEPA009GarveyGW_Flow_Tech_Memo Carbon_TetChl_LoweR_Aquifer_Dmxd Project EP903401220202 Revised 061312 ST2500 5000 Source ENSR GDB 2008 DNR
Feet
0
Figure 77 Alternative G3ab-Proposed Recovery Wells Medial Aquifer
Figure 78 Alternative G3a- Proposed Recovery Wells Lower Aquifer
50
5 5
5
50 100
HGLmdashGroundwater Flow Modeling Technical Memorandum Garvey Elevator Superfund SitemdashHastings NE
Figure 79 Preliminary Locations for Mid-Plume and
Leading Edge Recovery Wells and Groundwater Treatment Building-Alternative G3
Legend Garvey Property Boundary
Railroad
Ntilde Monitoring Well Location MW-3DE (NDND)
Multilevel Well MW-47D
MW-9A (ND) Hydraulic Conductivity WellSHTW 40 MW-6D MW-10AB
(ND) West Highway 6 amp Highway 281 SiteMW-11A
MW-33 PPUUMW-2A PUA Monitoring Well
MW-19AC MW-14A APUCarbon Tetrachloride Concentration
Technical Blvd
MW-44DE (19ND) (Dashed Lines are Estimated)
MW-20DE (190)MW-106DPSSU PU PPPUUU MW-104DMW-12C(NDND) (ND)PU in micrograms per liter (microgL)(ND) MW-13EMW-8A
U UUUU UPUPPPPUUUUUUUUP UUUUU UUUPPPPPPPPPPPPPPPPPPPPPPPUUUUUU
(ND) PPPUUU A Treatment BuildingMW-105DMW-1A Carbon Tetrachloride IsoconcentrationMW-30DE A
PPUUPPPUUUPPPPPUUUUU(52)
(NDND) MW-12DNew Rolls Contour (Lower Aquifer) (microgL)MW-49D (5)(ND) (ND)(ND) MW-45D
MW-51D PPUU(ND)
PPUU PPUUMW-50D (ND)
MW-46 D1(ND) PPPUUU (770)
PPPUUU MW-42 D (4274)
MW-48D Domestic Irrigation W ater WellsMW-4AB (ND) MW-46 D2
MW-17DMW-7AB (320)(94) Carbon Tetrachloride IsoconcentrationMW-5D
MW-18D(ND) MW-31C (21) PPMW-41 D1
UU (5) Contour (Upper Aquifer) (microgL)MW-5B MW-16C UU (ND)PP (Dashed Lines are Estimated)PPUUIdlewilde Rd
MW-41 D2 Recovery Wells (Medial)(10)
MW-43DE UUPP(ND18) Recovery Wells (Deep)
Recovery Well Piping
Treatment Building
Notes (ND) Nondetect
Blaine A
ve
Showboa t B
lvd
sup3 Filename XEPA009GarveyGW_Flow_Tech_Memo Mid-Plume_Prelim_Loc Project EP903401220202 Revised 061312 RL2500 5000 Source ENSR GDB 2008 DNR
Feet
0
Figure 710 Alternative G3b-Proposed Recovery Wells Lower Aquifer
Figure 711 Alternative G3b-Relative Positions of Proposed Recovery Wells Medial and Lower Aquifers
Figure 712 Alternative G4a-Proposed Treatment Curtain and Recovery Wells Lower Aquifer
50
5 5
5
50 100
HGLmdashGroundwater Flow Modeling Technical Memorandum Garvey Elevator Superfund SitemdashHastings NE
Figure 713 Preliminary Locations for Mid-Plume
Injection Wells Leading Edge Recovery Wells and Groundwater Treatment Building
-Alternative G4
Legend Garvey Property Boundary
Railroad
Ntilde Monitoring Well Location MW-3DE (NDND)
MW-47D MW-9A (ND)
HTW 40 MW-6D MW-10AB
(ND)
S Elm
Ave
S Wabash A
ve
Multilevel Well
S Hydraulic Conductivity Well
A West Highway 6 amp Highway 281 Site Monitoring Well
MW-11AMW-33 UPPUMW-2A PU
MW-19AC MW-14A APUMW-20DE MW-106D Carbon Tetrachloride ConcentrationPU PPPUUU (190)PSSU MW-104D(NDND) MW-12C (ND)PU in micrograms per liter (microgL)(ND)
Treatment Building Technical B
lvd MW-13EMW-8A
UUUU UUUUUU PPPPPPPPUUUUPU UUUUU
UPUP
UUUUUPPPPPPPPPPPPPPPPPP (ND)
PPPUUU A MW-105DMW-1A UU Carbon Tetrachloride IsoconcentrationAMW-30DE PPUUPPPUUUPPPPPUUUUU
(52)(NDND) MW-12DNew Rolls Contour (Lower Aquifer) (microgL)MW-49D (5)(ND) (ND)
(ND) MW-45D (Dashed Lines are Estimated)PPUUMW-51D (ND) MW-46 D1PPUU PPUUMW-50D
(ND) (ND)
PPPUUU (770)PPPUUU MW-42 DMW-48D Domestic Irrigation W ater WellsMW-4AB (4274)(ND) MW-44DEMW-46 D2
(19ND)MW-17D (320)MW-7AB Carbon Tetrachloride Isoconcentration(94)MW-5D MW-18D PPUU (5) Contour (Upper Aquifer) (microgL)(21) MW-41 D1
MW-31C(ND) MW-5B MW-16C PPUU (Dashed Lines are Estimated)(ND)
PPUUIdlewilde Rd
MW-41 D2 Recovery Wells (Medial)
Recovery Wells (Deep)
(10) Injection Area 1 MW-43DE PPUUPermanent Injection Well Spacing 40 ft (ND18)
Total Injection Wells Installed 39 Recovery Well Piping Injection Area (40 ft spacing between the wells) Treatment Building
Notes (ND) Nondetect
Blaine A
ve
Showboa t B
lvd
S Baltim
ore Ave
sup3 Filename XEPA009GarveyGW_Flow_Tech_Memo G4_Prelim_Loc_Inj_Areamxd Project EP903401220202 Revised 061312 RL2500 5000 Source ENSR GDB 2008 DNR
Feet
0
Figure 714 Alternative G4b-Proposed Treatment Curtains and Recovery Wells Lower Aquifer
Figure 715 Alternative G4b-Relative Positions of Proposed Recovery Wells and Treatment Curtains
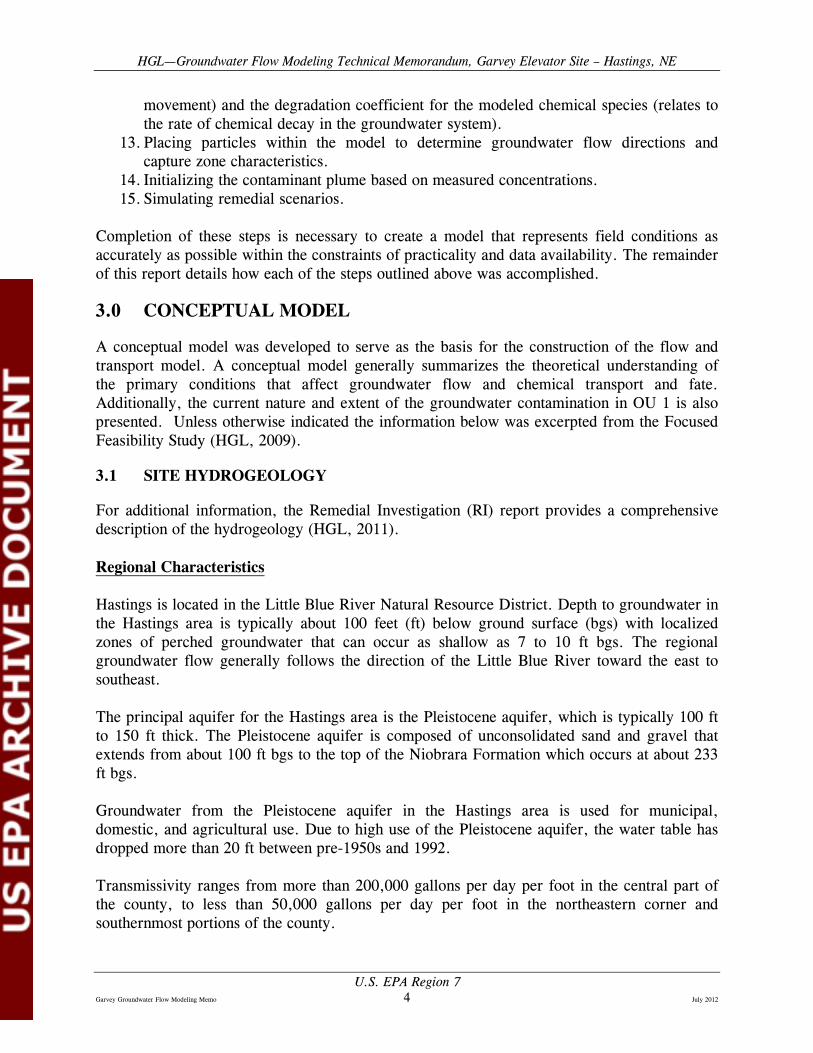
HGLmdashGroundwater Flow Modeling Technical Memorandum Garvey Elevator Site ndash Hastings NE
quantified in terms of the volume of groundwater moving through the system The physical boundaries are then translated into mathematical terms and input into the computer model
Constant-head boundary conditions (ie groundwater elevations remain constant with time) were extrapolated from the regional gradients and assigned at the upgradient (northwestern) and downgradient (southeastern) model limits for all of the model layers (Figure 51)
The model boundaries to the northeast and southwest are approximately parallel to groundwater flow lines and are considered lsquono-flowrsquo boundaries across which no groundwater moves The base of the model is considered a no-flow boundary
Shallow Aquifer
The top of the model was set as a uniform recharge boundary (26 inches per year [inyr]) with the rate determined as part of the model calibration
As presented below and shown in Figure 59 all of the recovery wells are set to their average pumping rates for the week prior to and during the collection of the water level data calibration set (September 26-27 2011) These rates are listed below
Garvey Elevator Site
bull RW-1 = 00 gallons per minute (gpm) bull RW-2 = 80 gpm bull RW-3 = 74 gpm bull RW-4 = 98 gpm bull RW-5 = 51 gpm
West Highway 6 amp Highway 281 Site
bull EW-1 = 61 gpm bull EW-2 = 83 gpm bull EW-3 = 41 gpm bull EW-4 = 00 gpm
US EPA Region 7 Garvey Groundwater Flow Modeling Memo 9 July 2012
HGLmdashGroundwater Flow Modeling Technical Memorandum Garvey Elevator Site ndash Hastings NE
Medial Aquifer
There are no wells pumping from the medial aquifer at the West Highway 6 amp Highway 281 Site Recovery wells RW-6 RW-7 and RW-8 at the Garvey Elevator Site are set to their average rates observed for the week prior to and during the collection of the water level calibration set (Figure 510) These pumping rates are as follows
Garvey Elevator Site
bull RW-6 = 925 gpm bull RW-7 = 667 gpm bull RW-8 = 905 gpm
West Highway 6 amp Highway 281 Site
bull No wells are pumping from the medial aquifer
Lower Aquifer
All of the water pumped from the shallow and medial aquifers at the Garvey Elevator Site is treated and injected into the lower aquifer through two injection wells located as shown on Figure 511 The total amount of pumped water is approximately 280 gpm Since there are no flow meters on the injection wells it is assumed that 10 percent of the pumped water is lost to leaks and evaporation and the remaining 250 gallons is injected at an equal rate (125 gpm) into each of the two injection wells
Pumping records for the month of September 2011 indicate that the pumping rate for Municipal Well 9 averaged 577 gpm The close proximity of this well to a no-flow boundary (Figure 511) however would result in over predictions of the hydraulic conductivities in this area during the model calibration Therefore the pumping rate of Municipal Well 9 was reduced during the model calibration until the hydraulic conductivities approximated those in the general vicinity but outside the influence of the pumping Since this well is away from the contaminant plumes the modeling results will be relatively insensitive to the hydraulic conductivities predicted in this area Since the calibration set was collected in September it is assumed that the irrigation wells located within the model domain were not pumping water Injection and pumping rates from the lower aquifer are shown below
Garvey Elevator Site
bull IW-1 = 125 gpm bull IW-2 = 125 gpm
US EPA Region 7 Garvey Groundwater Flow Modeling Memo 10 July 2012
HGLmdashGroundwater Flow Modeling Technical Memorandum Garvey Elevator Site ndash Hastings NE
West Highway 6 amp Highway 281 Site
bull Municipal Well 9 = 342 gpm
532 Initial Conditions
As described in Section 32 carbon tetrachloride contamination is present in the upper middle and lower aquifers Groundwater contaminant concentration data presented on Figures 31 32 and 33 were used as the basis for estimating the initial plume concentrations within the model The actual concentrations specified as initial conditions for the shallow medial and lower aquifers are shown in Figures 512 513 and 514 respectively
60 MODEL CALIBRATION
Traditionally the term model calibration is used to refer to the trial-and-error adjustment of parameters of the groundwater system by comparing the models output (calculated values of hydraulic head or concentration) and the measured output (observed values of hydraulic head or concentration) In essence such a calibration procedure involves the following routines (1) operating the model using initial estimates of the values of the parameters (2) history-matching or comparing computed and observed values of hydraulic head or concentration and (3) adjusting the values of the parameters and repeating the simulation
Calibration of the model is aimed at demonstrating that it can produce realistic accurate and reliable predictions The flow model is calibrated by determining a set of parameters boundary conditions and hydraulic stresses that generate simulated potentiometric surfaces and fluxes that match field-measured values to within an acceptable range of errors The end result of the process of model calibration is an optimal set of values for parameters that minimize the discrepancy between the model output and the observed data The iterative process of matching calculated values with observed (historical) data by adjusting the model input can be a manual trial-and-error procedure or can be automated The calibration process also known as history-matching is closely related to estimating parameters This process might result in the refinement of initial estimates of aquifer properties (parameters) the establishment of the location of the boundaries (areal and vertical extent of aquifer) and the determination of flow and transport conditions at the boundaries
Calibration can be performed to steady-state or transient data sets Although most flow model calibration exercises involve steady-state data in some hydrogeologic settings assumption of steady-state conditions may be inappropriate due to large fluctuations in the water table or boundary conditions For this modeling exercise only steady-state calibrations were performed
To facilitate the model calibration PEST was used in conjunction with the groundwater flow code (MODFLOW-2000) PEST is a calibration tool that uses non-linear least-squares techniques to adjust model parameter data in order to reduce the discrepancies between the
US EPA Region 7 Garvey Groundwater Flow Modeling Memo 11 July 2012
HGLmdashGroundwater Flow Modeling Technical Memorandum Garvey Elevator Site ndash Hastings NE
pertinent model-generated numbers and the corresponding measurements to a minimum It does this by taking control of the model and running it as many times as is necessary to determine this optimal set of parameters within a user-specified range
Calibration of the steady state flow model was accomplished iteratively by adjusting model parameters during successive model runs to match the water-level data that was collected from all of the wells on September 26-27 2011 under stressed (ie pumping) conditions Since most of the recovery wells had been running for at least several weeks prior to and during the collection of these water levels is it assumed that the levels are representative of steady-state pumping conditions The water-level calibration targets for all of the aquifers are provided in Table 61
As part of the model calibration adjustments were made to the areal recharge (shallow aquifer) range of hydraulic conductivities ratio of vertical to horizontal hydraulic conductivities and minor adjustments to the constant head boundaries The general calibration approach that was followed involved adjusting the parameters mentioned above and inputting the parameters into a PEST simulation PEST would subsequently run MODFLOW thousands of times in which the hydraulic conductivities were adjusted for each iteration until the difference between the observed water levels (targets) and the model predicted values (error residuals) were minimized If these error residuals were too high further adjustments were made to the recharge hydraulic conductivity range etc and the PEST simulation was initiated again
During the model flow calibration it was found that the parameter imparting the most sensitivity to the model results is the areal recharge reaching the water table The Corps of Engineers proposed in their 1990 Final Groundwater Modeling Report of the Hastings East Industrial Park area that net recharge for non-irrigated grassland was estimated to be 26 inches per year (USACE 1990) After performing a number of simulations during the model calibration it was found that a value of 26 inches per year provided the best match to the measured water levels
The error residuals (that is the differences between model predictedcomputed and measuredobserved values) are depicted graphically in Figures 61 and 62 The error residuals and calibration statistics are also presented in tabular form in Table 61 As shown in Figure 61 most of the error residuals are within plusmn05 ft The minimum residual is -32 ft (over prediction of the hydraulic head) and the maximum residual is 196 ft (under prediction of hydraulic head) The graph depicted in Figure 62 shows that there is a good fit along the entire range of observed water level elevations
A common measure of the quality of the model calibration is the percent error The percent error is the root mean square error (RMSE) divided by the total change in the observed head As shown in Table 61 the RMSE is 075 and the range in observations is 4326 This leads to a percent error of about 17 percent which is well below the 10 percent error often cited as the cutoff for a well calibrated model
US EPA Region 7 Garvey Groundwater Flow Modeling Memo 12 July 2012
HGLmdashGroundwater Flow Modeling Technical Memorandum Garvey Elevator Site ndash Hastings NE
The areal distribution of error residuals for the shallow aquifer (model layer 1) near the Garvey Elevator Site and over the entire model domain are shown in Figures 63 and 64 respectively All of the error residuals shown in the figures are relatively small In fact the largest error residuals in the shallow aquifer are found in the immediate vicinity of the West Highway 6 amp Highway 281 Site and do not significantly impact the flow and transport results These error residuals were further lowered as part of the West Highway 6 amp Highway 281 model calibration performed as a separate exercise
The error residuals for the medial aquifer (model layer 3) are presented in Figure 65 With the exception of two wells that are located to the northeast of the Site in the vicinity of the West Highway 6 amp Highway 281 Site all of the residuals are relatively low
The areal distribution of error residuals for the lower aquifer (model layer 5) near the Garvey Elevator Site and over the entire model domain are depicted in Figures 66 and 67 respectively The large residual shown on Figure 66 is associated with MW-20C (-30 ft) The water levels and residuals for the MW-20 well series are as follows
MW-20C residual -300 ft water level 180892 ft above mean sea level (amsl) MW-20D residual 004 ft water level 181196 ft amsl MW-20E residual -037 ft water level 181155 ft amsl
As shown in Table 51 the top of the lower aquifer for the MW-20 series is encountered at a depth of 152 feet This is also the depth that the well screen begins for MW-20C Therefore MW-20C -20D and -20E are all screened in the lower aquifer
Historically the water level for MW-20C behaves somewhat erratically when compared to MW-20D and MW-20E For instance all of the measurements for the 3 wells are relatively close in 2009 and 2010 However in June of 2011 the water level observed in MW-20C is 4 feet above that observed in MW-20D and 3 feet above the water level measured in MW-20E Therefore primary reliance was placed on the water levels from MW-20D and MW-20E for the model calibration
The residuals for the lower aquifer monitoring wells farther downgradient of the site are all very low and demonstrate an excellent calibration (Figure 67)
The calibrated hydraulic conductivities for the shallow medial and lower aquifers are presented in Figures 68 69 and 610 respectively In the vicinity of the Site the calibrated horizontal hydraulic conductivity for the all of the aquifers ranges between 50 and 250 ft per day (ftd) It is assumed that the vertical hydraulic conductivity is a factor of 5 less than that of the horizontal hydraulic conductivity
Near the Site most of the shallow aquifer is characterized by hydraulic conductivities between 50 to 100 ftd The hydraulic conductivities in the medial aquifer however tend to range between 100 and 250 ftd over most of the Site The calibrated hydraulic conductivities for the lower aquifer range between 50 and 150 ftd over most of the eastern portion of the Site and between 100 and 250 ftd along the western boundary and in the northwest area of the Site
US EPA Region 7 Garvey Groundwater Flow Modeling Memo 13 July 2012
HGLmdashGroundwater Flow Modeling Technical Memorandum Garvey Elevator Site ndash Hastings NE
The model predicted hydraulic conductivities for the lower aquifer are less certain however because there are no pumping wells stressing the system in this aquifer
The hydraulic conductivities farther downgradient of the Site indicate that large areas in the shallow and medial aquifers have relatively low hydraulic conductivities ranging from 50 to 100 ftd The hydraulic conductivities of the lower aquifer over much of this area tend to be significantly higher and range between 100 and 250 ftd These higher hydraulic conductivities are consistent with the large production rates (eg 300 to 600 gpm) of the irrigation wells located in the area which draw from the lower aquifer during the summer months
The hydraulic conductivities of the upper and lower aquitards are show on Figures 611 and 612 respectively The upper aquitard is continuous except for an area located immediately north of the Site The lower aquitard is absent from approximately the northern one third of the model domain
The calibrated potentiometric surfaces for the shallow medial and lower aquifers are presented in Figures 613 through 615 respectively The calibrated potentiometric surface for the shallow and medial aquifers show some bending in the vicinity of the Site due to the pumping wells The potentiometric surface of the lower aquifer is clearly impacted by the injections wells (for example elevation line 1817) Downgradient from the Site the potentiometric lines are generally perpendicular to groundwater flow
As a qualitative check on the calibrated hydraulic conductivity fields and hydraulic gradients a particle tracking analysis was performed to estimate travel times Approximately 52 years has elapsed since Garvey Elevators began operation as a grain storage facility in 1959 and the 2011 sampling event As illustrated by Figure 616 it takes about 50 years for a particle to move from the Site boundary to the toe of the plume Although it is unknown when contamination reached the water table and the overall influence of municipal and irrigation wells on transport rates the results of the travel time analysis suggest that the calibrated hydraulic conductivities and gradients are reasonable A general discussion pertaining to particle tracking (eg computer code) is provided in Section 722
70 REMEDIAL ALTERNATIVE DESIGN
71 CONTAMINANT TRANSPORT PARAMETERIZATION
Once the calibration of the flow model was complete contaminant transport and particle tracking simulations were performed Parameters that are required to conduct contaminant transport modeling include effective porosities dispersivities retardation and chemical and biological transformations A brief description of each of these processes is presented below
Effective Porosity The effective porosity is the ratio of the volume of interconnected pore spaces available for transport to the total system volume It is used to estimate the velocity at which groundwater and contaminants travel through a porous medium The smaller the effective porosity the higher the groundwater velocity and the more rapidly contaminants will
US EPA Region 7 Garvey Groundwater Flow Modeling Memo 14 July 2012
HGLmdashGroundwater Flow Modeling Technical Memorandum Garvey Elevator Site ndash Hastings NE
be transported A reasonable value for sand silts and gravels is 25 percent and therefore this value was assigned to the model
Dispersivity The equations of solute transport that are solved in contaminant-transport codes are derived assuming that the solute migration is due to advection and hydrodynamic dispersion Advection describes the bulk movement of groundwater flow where hydrodynamic dispersion is caused by the tendency of the solute to spread out from the path that it would be expected to follow if transported only by advection This spreading of the contamination over an ever-increasing area is called hydrodynamic dispersion and has two components mechanical dispersion and diffusion Hydrodynamic dispersion causes dilution of the solute and occurs because of spatial variations in groundwater flow velocities and mechanical mixing during fluid advection Molecular diffusion the other component of hydrodynamic dispersion is due to the thermal kinetic energy of solute molecules and also contributes to the dispersion process Thus if hydrodynamic dispersion is factored into the solute transport processes ground-water contamination will cover a much larger region than in the case of pure advection with a corresponding reduction in the maximum and average concentrations of the contaminant Dispersion also increases the velocity of the contaminants because it considers the fact that some contaminants will travel through faster pathways (and some slower) than if only pure advection was assumed
The relatively narrow plume with respect to the plume length suggests relatively low dispersivity values Furthermore numerical dispersion occurring as part of the solution method has to also be factored into the dispersion estimate Finally if too large of a dispersion value is assigned contaminants will be artificially dispersed vertically through the upper and lower aquitards into the underlying aquifers Therefore the relatively low values of 50 5 and 1 ft were assigned to the longitudinal transverse and vertical dispersivities respectively
Retardation Factor The rate at which contaminants migrate relative to groundwater is termed the retardation factor and is determined by the effective porosity (see definition above) bulk density and distribution coefficient Adsorption of carbon tetrachloride and other chlorinated solvents is expected to be relatively low in the upper medial and lower aquifer zones leading to a low degree of retardation For modeling purposes a retardation factor of zero was assumed
Chemical and Biological Transformations
Most VOCs and chlorinated solvents including carbon tetrachloride are subject to biological and chemical transformations in the subsurface environment Biological transformations include aerobic degradation anaerobic degradation and co-metabolism Several chemical properties of both water and soil influence the stability of chlorinated solvents in an aquifer Chemical transformations include hydrolysis dehydrohalogenation and reduction in water These typically require low groundwater flow rates and therefore it is unlikely that these chemical transformations will play a significant role at the Site
Carbon tetrachloride can be reduced under anaerobic conditions via three different pathways
US EPA Region 7 Garvey Groundwater Flow Modeling Memo 15 July 2012
HGLmdashGroundwater Flow Modeling Technical Memorandum Garvey Elevator Site ndash Hastings NE
bull reductive dechlorination where carbon tetrachloride is reduced to chloroform chloroform is reduced to methylene chloride and methylene chloride is reduced to methane
bull a simple two-electron reduction process in which chloroform is only a minor product and
bull a one-electron reduction via sulfur and oxygen where carbon tetrachloride is reduced to carbon dioxide and chloroform is not produced
Based on the groundwater sample analytical results collected during the RI field investigation some degree of biodegradation of the carbon tetrachloride groundwater plume is occurring as evidenced by the presence of the degradation products chloroform and methylene chloride (HGL 2011) Concentrations of these degradation products are typically one to two orders of magnitude less than those of carbon tetrachloride in samples collected at the Site However chloroform concentrations are similar to or slightly greater than carbon tetrachloride concentrations in many of the groundwater transect samples collected downgradient of the Site indicating that biodegradation is occurring but not at an accelerated rate Therefore no degradation of carbon tetrachloride was assumed in the model
72 OU 1 - REMEDIAL ALTERNATIVES
The remedial scenarios being considered as part of the FS are presented in Table 71 As shown in the table there are four scenarios included under OU 1 The No Action Alternative (SG-1) and Maintaining and Operating the Existing Groundwater Extraction System (SG-2) would require a significant length of time for on-site carbon tetrachloride concentrations to fall below the maximum contaminant level (MCL) of 5 micrograms per liter (μgL) which is established as the preliminary cleanup level (PCL) These alternatives were not explicitly modeled
For the no action alternative (SG-1) the duration to reach MCLs should intuitively be longer than other alternatives that use active treatment methods However for cost estimating purposes it is assumed that the duration for SG-1 is 30 years
For alternative SG-2 the duration to achieve MCLs was estimated using groundwater contamination data from monitoring wells and recovery wells at the site Table 71 summarizes analytical data from these wells including projected times to achieve MCLs based on concentration trends Using these data an estimated duration of 30 years has been assumed for alternative SG-2 to achieve MCLs
721 SG3 - In-Situ Treatment via Groundwater Amendments
This alternative involves shutting off the existing groundwater extraction system and injecting amendments to remediate contaminated groundwater within the 500 μgL contour As shown in Figure 71 the initial conditions for this portion of the plume have been set to zero and the pumping and injection wells in the upper medial and lower aquifers have been shut off The model predicts that it would take approximately 4 years for the plume to disperse and the concentrations of carbon tetrachloride to decrease below the MCL of 5 μgL These
US EPA Region 7 Garvey Groundwater Flow Modeling Memo 16 July 2012
HGLmdashGroundwater Flow Modeling Technical Memorandum Garvey Elevator Site ndash Hastings NE
predictions are unrealistically short however for the following reasons diffusion back out of the finer grained clays is limited by concentration gradients that often lead to very long cleanup time frames and although sorption is probably low it can significantly increase remediation times particularly when coupled with diffusion processes For these reasons the remediation time for alternative SG3 was increased to 15 years
722 SG4 - Maintain and Operate Existing GET System and Treat Via Amendments
This alternative is identical to SG3 except that the existing groundwater extraction and treatment (GET) system remains on To ensure that the existing GET system is effective at capturing the contamination a capture zone analysis was conducted with the computer code MODPATH
MODPATH is a widely accepted 3-D particle-tracking model that uses the flow fields created by MODFLOW to predict groundwater flow directions Particle tracking is a form of flow and transport modeling that represents the bulk movement of groundwater Particle tracking neglects the effects of chemical reactions dispersion and diffusion The particle tracking analysis involves adding particles to the model at selected locations and then allowing the model to move the particles in the direction of groundwater flow The results of a particle tracking simulation are displayed by plotting pathlines through the aquifer Although both forward and reverse particle tracking can be performed with MODPATH for the Garvey Elevator Site only forward-tracking analyses are conducted
Before initiating the capture zone analysis the groundwater extraction rates were changed from those used to calibrate the model to rates that better reflect long term pumping rates The revised rates are as follows
Garvey Elevator Site
bull RW-1 = 35 gpm bull RW-2 = 68 gpm bull RW-3 = 90 gpm bull RW-4 = 102 gpm bull RW-5 = 50 gpm bull RW-6 = 900 gpm bull RW-7 = 680 gpm bull RW-8 = 1280 gpm
West Highway 6 amp Highway 281 Site
bull EW-1 = 61 gpm bull EW-2 = 83 gpm bull EW-3 = 41 gpm bull EW-4 = 00 gpm
Shallow Aquifer
US EPA Region 7 Garvey Groundwater Flow Modeling Memo 17 July 2012
HGLmdashGroundwater Flow Modeling Technical Memorandum Garvey Elevator Site ndash Hastings NE
As shown on Figure 72 particles released to all the model layers indicate that the extraction wells are effectively containing the on-site carbon tetrachloride plume At some point downgradient however capture is lost and the contaminants will continue to migrate with the groundwater
Medial Aquifer
The results of the particle-tracking analysis for the medial aquifer are presented as Figure 73 The particle tracking illustrates that the modeled capture zone extends sufficiently downgradient to capture the contamination that has moved immediately off site
The predicted remediation time for this alternative is about 2 years (Table 72) The removal of the contamination with the pumping wells has shortened the time from that predicted for Alternative SG3 As was the case for Alternative SG3 these predictions are unrealistically short for the same reasons For these reasons the remediation time for alternative SG3 was increased to 10 years
73 OU 2 - REMEDIAL ALTERNATIVES
Six remedial alternatives were considered for OU 2 (Table 72) Although it was not modeled based on the predicted remediation times of greater than 100 years for the G2 scenario the No-Action alternative (G1) remediation time is predicted to take more than 100 years However for cost estimating purposes it will be assumed that the duration for SG-1 is 30 years
731 G2 - Groundwater Recovery and Treatment at Leading Edge of Plume
This alternative involves pumping and treating the groundwater from the toe of the medial and lower aquifer plumes As shown in Figures 74 and 75 three wells would need to be placed in both the medial and lower aquifers to ensure capture of the plume The relative position of the two sets of wells is depicted on Figure 76 Each of the medial wells would be pumped at 50 gpm and the lower aquifer wells would each be pumped at 150 gpm The predicted remediation time for this alternative is greater than 100 years For costing purposes a duration of 100 years is assumed
732 G3a - Groundwater Recovery and Treatment at Leading Edge and Midpoint of Plume
This alternative is the same as Alternative G2 but in addition to pumping and treating contaminated groundwater from the toe of the plume contaminated groundwater is also pumped and treated from the midpoint of the medial and lower aquifer plume(s) A series of simulations were run in which the midpoint wells were located along different transects in order to decrease the remediation times the most optimal locations are shown in Figures 77 and 78
US EPA Region 7 Garvey Groundwater Flow Modeling Memo 18 July 2012
HGLmdashGroundwater Flow Modeling Technical Memorandum Garvey Elevator Site ndash Hastings NE
The relative position of the two sets of wells is depicted on Figure 79 Each of the medial wells would be pumped at 50 gpm and the lower aquifer wells would each be pumped at 150 gpm The predicted remediation time for this alternative is between 75 and 95 years For cost estimating purposes a duration of 75 years will be assumed
733 G3b - Groundwater Recovery and Treatment at Leading Edge and Midpoint of Medial Aquifer and Two Recovery Well Transects in Lower Plume
The results from G3a indicate that the contamination in the lower aquifer takes the longest time to remediate Therefore this alternative was added to determine how much the remediation times could be reduced if a second set of recovery wells was added to the lower aquifer The placement of the recovery wells in the medial aquifer remains the same as for Alternative G3a (Figure 77) The locations of the two transects of recovery wells in the lower aquifer are shown on Figure 710 Their placement relative to the medial wells is shown in Figure 711 Each of the medial wells would be pumped at 50 gpm and each of the lower aquifer wells would be pumped at 150 gpm The predicted remediation time for this alternative is about 53 years
734 G4a - Establishment of In Situ Treatment Zone at Midpoint of Lower Aquifer Plume and Groundwater Recovery and Treatment at Leading Edge of Medial and Lower Plumes
This alternative involves adding a treatment curtain to the pumping wells specified in the G2 alternative (Figure 712) The transect is simulated as a zero concentration boundary which effectively removes all of the carbon tetrachloride from the groundwater moving through it The relative position of the transect and wells is depicted on Figure 713 Each of the medial wells would be pumped at 50 gpm and each of the lower aquifer wells would be pumped at 150 gpm The predicted remediation time for this alternative is between 75 and 95 years For cost estimating purposes a duration of 75 years is assumed
735 G4b - Establishment of In Situ Treatment Zone(s) at Two Transects of Lower Aquifer Plume and Groundwater Recovery and Treatment at Leading Edge of Medial and Lower Plumes
This alternative involves adding two treatment curtains to the pumping wells specified in the G2 alternative (Figure 714) The relative position of the transects and recovery wells is depicted on Figure 715 Each of the medial wells would be pumped at 50 gpm and the lower aquifer wells each at 150 gpm The predicted remediation time for this alternative is about 56 years
80 SUMMARY AND CONCLUSIONS
A hydrogeologic conceptual site model of the subsurface groundwater flow and contaminant transport was developed to guide the creation of a numerical model The numerical model
US EPA Region 7 Garvey Groundwater Flow Modeling Memo 19 July 2012
HGLmdashGroundwater Flow Modeling Technical Memorandum Garvey Elevator Site ndash Hastings NE
was subsequently calibrated with existing field data (known water levels and pumping rates) to address the following objectives (1) evaluate the overall effectiveness of the current extraction well system (2) identify areas outside of the capture zone that may require enhancements and (3) develop a tool to assist in ldquowhat ifrdquo scenarios for the remedial alternative development
MODFLOW-2000 MT3D-MS and MODPATH are the computer codes applied to conduct the flow and transport analysis The output from MODFLOW-2000 is a groundwater velocity field which is used by MT3D-MS in conjunction with fate and transport parameters to simulate the migration of carbon tetrachloride Particle tracking analyses were also conducted with MODPATH to illustrate the groundwater flow directions travel times and capture zones All of these computer codes are widely used well documented and in the public domain
With respect to the construction of the model a three layer finite difference grid was utilized that simulates the upper middle and lower aquifers covers 102 square miles and includes 1030200 active cells
Calibration of the steady state flow model was accomplished iteratively by adjusting model parameters during successive model runs to match the water level data that was collected from all of the wells on September 26-27 2011 under stressed (pumping) conditions
The flow and transport model was initialized with measured carbon tetrachloride data obtained during a 2011 sampling event These initial concentrations were used as the basis to predict future concentrations under various remedial alternatives involving extraction wells and treatment curtains
Remediation times for OU 1 scenarios varied from 10 to 30 years Scenarios from the No Action alternative and alternative SG-2 were not modeled but were based on an assumed cost basis period and a duration based on existing concentration data trends respectively Remediation times for OU 2 scenarios range from 30 years to more than 100 years
90 REFERENCES
Doherty J 2006 PEST Model-Independent Parameter Estimation User Manual 5th Edition Watermark Computing
Harbaugh AW Banta ER Hill MC and McDonald MG 2000 MODFLOWndash2000 the US Geological Survey Modular Ground-Water ModelmdashUser guide to modularization concepts and the ground-water flow process US Geological Survey Open-File Report 00ndash92 121 p
HydroGeoLogic Inc (HGL) 2009 Focused Feasibility Study Version 4 Garvey Elevator Site OU 1 Garvey Elevator Site Hastings Nebraska December
HGL 2011 Final Remedial Investigation Report Garvey Elevator Site Hastings Nebraska April
US EPA Region 7 Garvey Groundwater Flow Modeling Memo 20 July 2012
HGLmdashGroundwater Flow Modeling Technical Memorandum Garvey Elevator Site ndash Hastings NE
McDonald MG and AW Harbaugh 1988 A Modular Three-dimensional Finite-difference Groundwater Flow Model US Geological Survey TWRI Chapter 6-A1
Pollock DW 1994 Userrsquos Guide for MODPATHMODPATH-PLOT Version 3A particle tracking post-processing package for MODFLOW the U S Geological Survey finite-difference ground-water flow model U S Geological Survey Open-File Report 94shy464
Rumbaugh JO and DB Rumbaugh 1998 Groundwater Vistas Version 516 Environmental Simulations
US Army Corps of Engineers (USACE) 1990 Final Groundwater Modeling Report Hastings East Industrial Park Remedial InvestigationFeasibility Study Hastings Nebraska August
Zheng C 1990 MT3D A modular three-dimensional transport model for simulation of advection dispersion and chemical reactions of contaminants in groundwater systemsrdquo Report to the US Environmental Protection Agency Robert S Kerr Environmental Research Laboratory Ada OK
Zheng Chunmiao and Wang P Patrick 1999 ldquoMT3DMS A modular three-dimensional multispecies transport model for simulation of advection dispersion and chemical reactions of contaminants in groundwater systems documentation and userrsquos guiderdquo Contract Report SERDP-99-1 US Army Engineer Research and Development Center Vicksburg Mississippi
Attachments
Attachment 1 Tables Attachment 2 Figures
US EPA Region 7 Garvey Groundwater Flow Modeling Memo 21 July 2012
This page was intentionally left blank
ATTACHMENT 1 TABLES
Table 51 Table 61 Table 71 Table 72
Contact Elevations of the Major Lithologic Units Water Level Calibration Statistics Groundwater Data Summary Projected Durations to Meet MCLs Remedial Alternatives Summary
This page was intentionally left blank
Table 51 Contact Elevations of the Major Lithologic Units
Garvey Elevator Site Hastings Nebraska
Elev Depth Elev Depth Elev Depth Elev Thickne Depth Elev Depth Elev Thickne Depth Elev Depth Elev (ft) (ft) (ft bgs) (ft amsl) (ft bgs) (ft amsl) (ft bgs) (ft amsl) (ft bgs) (ft amsl) (ft) (ft bgs) (ft amsl) (ft bgs) (ft amsl) (ft) (ft bgs) (ft amsl) (ft bgs) (ft amsl)
OU1 MW-1A 270590926 2080164407 125 192580 645 186130 995 182630 -- -- -- -- -- -- -- -- -- -- -- --OU1 MW-2A 271240410 2080539870 1235 192733 685 185883 835 184383 -- -- -- -- -- -- -- -- -- -- -- --OU1 MW-3ABDE 270755170 2080773994 243 193099 595 187149 111 181999 134 179707 1 135 179607 155 177530 1 156 177430 2385 169249 OU1 MW-4AB 270341995 2080827075 132 193184 585 187334 89 184284 -- -- -- -- -- -- -- -- -- -- -- --OU1 MW-5ABD 269943836 2080752777 188 193006 635 186656 885 184156 132 179785 1 133 179685 -- -- -- -- -- -- --OU1 MW-6ADE 271237345 2081216968 238 192948 735 185598 935 183598 129 180046 1 130 179946 155 177446 5 160 176946 -- --OU1 MW-7AB 269088475 2079699700 135 192092 55 186592 90 183092 -- -- -- -- -- -- -- -- -- -- -- --OU1 MW-8A 271214203 2079067544 132 194080 608 188000 90 185080 -- -- -- -- -- -- -- -- -- -- -- --OU1 MW-9A 272193736 2080628145 116 192540 70 185540 90 183540 -- -- -- -- -- -- -- -- -- -- -- --OU2 MW-10AB 272535399 2081973782 130 192381 65 185881 85 183881 125 179870 1 126 179770 -- -- -- -- -- -- --OU2 MW-11A 271826499 2083509070 110 191228 70 184228 90 182228 -- -- -- -- -- -- -- -- -- -- -- --OU2 MW-12AC 270399710 2085390335 170 191713 50 186713 805 183663 -- -- -- -- -- -- -- -- -- -- -- --
OU2 (new) MW-12D 270399901 2085403521 178 191698 57 185998 88 182898 120 179698 7 127 178998 -- -- -- -- -- -- --OU1 MW-13CE 270368902 2081015694 238 192874 75 185374 90 183874 130 179874 1 131 179774 -- -- -- -- -- 235 169374 OU2 MW-14A 270968774 2084137323 1085 190956 695 184006 895 182006 -- -- -- -- -- -- -- -- -- -- -- --OU2 MW-16AC 267054564 2084286931 160 191545 50 186545 80 183545 -- -- -- -- -- -- -- -- -- -- -- --OU2 MW-17ACD 268796556 2082958916 200 190185 60 184185 85 181685 -- -- -- -- -- -- -- -- -- -- -- --OU2 MW-18ACD 268693818 2085938384 205 191064 55 185564 95 181564 1155 179514 1 1165 179414 -- -- -- -- -- -- --OU1 MW-19AC 270955133 2081332850 165 192781 61 186681 895 183831 128 179981 8 136 179181 150 177781 2 152 177581 -- --OU1 MW-20ACDE 270597445 2081202233 255 192797 54 187397 87 184097 129 179897 7 136 179197 150 177797 2 152 177597 236 169197 OU1 MW-30ACDE 270271723 2081095430 255 192903 70 185903 85 184403 1255 180353 7 1325 179653 146 178303 2 148 178103 237 169203 OU1 MW-31AC 269550764 2080816035 165 193008 63 186708 883 184178 -- -- -- -- -- -- -- -- -- -- -- --OU1 MW-33 271206314 2079068057 255 194074 84 185674 95 184574 1385 180224 55 144 179674 167 177374 675 17375 176699 240 170074
OU1 (new) MW-47BCD 270781240 2081046150 1705 192995 -- -- -- -- 1315 179845 15 133 179695 151 177895 2 153 177695 -- --OU1 (new) MW-48BCD 270645490 2080859850 171 192887 -- -- -- -- 129 179987 35 1325 179637 1498 177907 5 1548 177407 -- --OU1 (new) MW-49BCD 270039470 2080890150 171 192934 -- -- -- -- 1305 179884 15 132 179734 1495 177984 4 1535 177584 -- --OU1 (new) MW-50BCD 270307290 2080987510 170 192925 -- -- -- -- 1275 180175 5 1325 179675 1495 177975 1 1505 177875 -- --OU1 (new) MW-51BCD 270487290 2080899910 171 192943 -- -- -- -- 1268 180263 52 132 179743 1495 177993 45 154 177543 -- --OU2 (new) MW-41D1 266698811 2089673996 171 191524 62 185324 92 182324 126 178899 2 128 178699 148 176699 2 150 176499 -- --OU2 (new) MW-41D2 266708267 2089674259 206 191499 62 185299 92 182299 126 178899 2 128 178699 148 176699 2 150 176499 -- --OU2 (new) MW-42DE 269168074 2100135574 215 190207 66 183607 98 180407 124 177823 10 134 176823 -- -- -- -- -- -- --OU2 (new) MW-43DE 265395404 2097605590 2215 190835 48 186035 89 181935 -- -- -- -- -- 153 175545 2 155 175345 -- --OU2 (new) MW-44DE 267552324 2105258206 214 188530 63 182230 92 179330 119 176630 3 122 176330 1425 174280 75 150 173530 -- --OU2 (new) MW-45CD 270056199 2083476668 170 190982 50 185982 89 182082 112 179746 3 115 179446 -- -- -- -- -- -- --OU2 (new) MW-46D1 269055295 2089632928 167 191097 61 184997 94 181697 121 179003 3 124 178703 148 176303 6 154 175703 -- --OU2 (new) MW-46D2 269063843 2089632455 202 191103 61 185003 94 181703 121 179003 3 124 178703 148 176303 6 154 175703 -- --
Hwy 6 MW-104ACD 271937379 2088225393 235 190901 472 186181 936 181541 115 179401 12 127 178201 -- -- -- -- -- 220 168901 Hwy 6 MW-105ACD 270069428 2089866388 257 191679 68 184879 105 181179 123 179379 10 133 178379 -- -- -- -- -- 2455 167129 Hwy 6 MW-106ACD 270452369 2098166199 255 190664 77 182964 1075 179914 130 177664 5 135 177164 -- -- -- -- -- 248 165864 OU1 I-1 270863284 2080138346 175 19212 -- -- -- -- -- -- -- -- -- -- -- -- -- -- -- --OU1 I-2 270331729 2080131336 175 19200 -- -- -- -- -- -- -- -- -- -- -- -- -- -- -- --OU1 HTW-40 271217856 2079157749 -- 19395 -- -- -- -- -- -- -- -- -- -- -- -- -- -- -- --
Hwy 6 HTW-100 273075261 2082012337 255 19066 770 182964 1076 179904 130 177664 55 -- -- -- -- -- -- -- -- --
Surface Elevation -
Surficial Soil Peoria and
Loveland Loess
Very Fine Sand Silty Fine Sand
Clayey Silt
Silty Sand and Gravel (contains Upper Aquifer)
Upper Aquitard Medial Aquifer
Monitoring Wells
Boring DepthEasting(2)Northing(2)
Well ID Lower Aquitard Lower AquiferSite
Top of Lithologic and Hydrostratigraphic Units(1)
Decomposed Weathered
Shale
Sheet 1 of 2
Table 51 Contact Elevations of the Major Lithologic Units
Garvey Elevator Site Hastings Nebraska
Elev Depth Elev Depth Elev Depth Elev Thickne Depth Elev Depth Elev Thickne Depth Elev Depth Elev (ft) (ft) (ft bgs) (ft amsl) (ft bgs) (ft amsl) (ft bgs) (ft amsl) (ft bgs) (ft amsl) (ft) (ft bgs) (ft amsl) (ft bgs) (ft amsl) (ft) (ft bgs) (ft amsl) (ft bgs) (ft amsl)
Surface Elevation -
Surficial Soil Peoria and
Loveland Loess
Very Fine Sand Silty Fine Sand
Clayey Silt
Silty Sand and Gravel (contains Upper Aquifer)
Upper Aquitard Medial Aquifer Boring DepthEasting(2)Northing(2)
Well ID Lower Aquitard Lower AquiferSite
Top of Lithologic and Hydrostratigraphic Units(1)
Decomposed Weathered
Shale
OU1 (new) SB-09 270168160 2080517340 13160 192984 59 187084 90 183984 130 179984 1 131 179884 -- -- -- -- -- -- --OU1 (new) SB-13 269654838 2080309785 14340 192973 67 186273 87 184273 130 179973 3 133 179673 -- -- -- -- -- -- --OU1 (new) SB-29 270864398 2081035503 14215 192989 68 186189 90 183989 -- -- -- -- -- -- -- -- -- -- -- --OU1 (new) SB-32 271237915 2079979855 14865 192475 66 185875 92 183275 -- -- -- -- -- 148 177675 297 149 177575 -- --OU1 (new) SB-33 269199799 2080682378 14085 193446 63 187146 93 184146 -- -- -- -- -- -- -- -- -- -- -- --OU1 (new) SB-39 271537352 2081550026 13560 192583 64 186183 89 183683 -- -- -- -- -- -- -- -- -- -- -- --OU2 (new) TS1-01 269515615 2089614339 864 191569 70 184569 86 182969 -- -- -- -- -- -- -- -- -- -- -- --OU2 (new) TS1-03 268313868 2089646765 16736 191251 66 184651 86 182651 1195 179301 05 120 179251 148 176451 5 153 175951 -- --OU2 (new) TS1-05 267030127 2089665004 16681 191624 75 184124 87 182924 117 179924 2 119 179724 153 176324 308 155 176124 -- --OU2 (new) TS2-02 271456113 2097510251 13680 191015 73 183715 104 180615 134 177614 3 137 177314 -- -- -- -- -- -- --OU2 (new) TS2-04 268939527 2097554155 16746 190360 70 183360 89 181460 126 177760 9 135 176860 152 175160 306 154 174960 -- --OU2 (new) TS2-05 267717573 2097569698 17161 190143 62 183943 99 180243 -- -- -- -- -- 157 174443 2 159 174243 -- --OU2 (new) TS2-06 266250085 2097592053 11980 190501 60 184501 100 180501 -- -- -- -- -- -- -- -- -- -- -- --OU2 (new) TS3-02 269400264 2102787273 15690 189415 68 182615 96 179815 125 176915 7 132 176215 147 174715 297 150 174415 -- --OU2 (new) TS3-05 265786308 2102812115 14380 189056 67 182356 96 179456 1195 177106 1 1205 177006 129 176156 261 132 175856 -- --OU2 (new) TS4-02 267112179 2105261928 17031 188448 64 182048 96 178848 116 176848 3 119 176548 141 174348 284 143 174148 -- --
Hwy 6 TS3-01 271941141 2089537242 1453 19153 720 184334 1125 180284 1256 178974 29 1285 178684 -- -- -- -- -- -- --Hwy 6 TS3-02 271499828 2089579255 1414 19139 692 184466 102 181186 1227 179116 59 1286 178526 -- -- -- -- -- -- --Hwy 6 TS3-03 270957676 2089591662 1440 19087 710 183767 941 181457 1178 179087 56 1234 178527 -- -- -- -- -- -- --Hwy 6 TS3-04 270411434 2089597601 1403 19088 663 184254 1006 180824 1167 179214 61 1228 178604 -- -- -- -- -- -- --Hwy 6 TS3-05 272464675 2089528557 1718 19173 685 184883 1032 181413 123 179433 7 130 178733 -- -- -- -- -- -- --Hwy 6 TS4-01 271882569 2095813356 1658 19042 650 183920 987 180550 1238 178040 52 129 177520 -- -- -- -- -- -- --Hwy 6 TS4-03 270996450 2096068696 1171 19050 810 182400 966 180840 1154 178960 12 1166 178840 -- -- -- -- -- -- --Hwy 6 TS5-01 271766686 2092074297 1562 19016 648 183680 905 181110 1163 178530 53 1216 178000 -- -- -- -- -- -- --Hwy 6 TS5-03 270732978 2092105115 1389 19008 709 182990 923 180850 1147 178610 46 1193 178150 -- -- -- -- -- -- --Hwy 6 TS5-05 272269991 2092059880 1717 19045 425 186200 942 181030 1153 178920 83 1236 178090 -- -- -- -- -- -- --
Electrical Conductivity Borings
(1)Surface elevation listed for nested monitoring wells (ABCDE) is the surface elevation of the A well Unit elevations are from the boring logs in which they were recorded (2)State Plane Coordinate system Nebraska 2600 amsl - above mean seal level bgs - below ground surface Elev - elevation ft - feet Hwy 6 - Wellsborings installed for the West Highway 6 and Highway 281 Site Investigations -- - not applicable or not available OU1 - Operable Unit 1 these wells are associated with on-site groundwater OU1 (new) - Operable Unit 1 wellsborings installed in AprilMay 2010 for the RI OU2 - Operable Unit 2 these wells are associated with off-site groundwater OU2 (new) - Operable Unit 2 Monitoring wellsborings installed in AprilMay 2010 for the RI
Sheet 2 of 2
Table 61 Water Level Calibration Statistics
Garvey Elevator Site Hastings Nebraska
Name Layer
Target Water Level Elevation - Sept 2011
(feet amsl) Model
Water Level Error
Residual MW-12U 1 18156 1814424820 117518 MW-100A 1 181542 1814519751 0900249 MW-16U 1 181534 1814385390 095461 MW-10A 1 181528 1814182851 1097149 MW-1A 1 181525 1815209270 004073 MW-2A 1 181519 1815393838 -0203838 MW-05 1 181516 1814358176 0801824
MW-102A 1 18151 1813770877 1329123 MW-13U 1 181507 1813730081 1339919 MW-7A 1 181504 1815242607 -0202607 MW-04 1 181487 1814376802 0493198
MW-17U 1 181486 1814230581 0629419 MW-07 1 181475 1814008616 0741384 MW-03 1 181471 1813907473 0802527 MW-02 1 181468 1813743101 0936899 MW-08 1 181465 1814180036 0469964 MW-06 1 18146 1814237391 0362609
MW-10U 1 181453 1814016597 0513403 MW-14U 1 181451 1814457639 0052361 MW-6A 1 181444 1814334070 010593 MW-01 1 18144 1814062502 0337498
MW-11A 1 181429 1812347804 1942196 MW-11U 1 181411 1814658764 -0548764 MW-10B 1 181372 1814173608 -0453608 MW-3A 1 181357 1813385654 0184346 MW-5B 1 181339 1813199091 0190909 MW-15U 1 181326 1814948966 -1688966 MW-47B 1 181316 1812784852 0375148 MW-50B 1 181314 1812748409 0391591 MW-4A 1 18131 1812992455 0107545 MW-3B 1 181308 1813389494 -0309494 MW-5A 1 181307 1813165365 -0095365 MW-19A 1 181301 1813252060 -024206 MW-4B 1 181298 1812954715 0025285 MW-31A 1 181289 1812885039 0004961 MW-51B 1 181236 1812125173 0234827 MW-49B 1 181227 1812349041 -0079041 MW-48B 1 18122 1812098306 0101694 MW-30A 1 181194 1812183956 -0243956 MW-09U 1 181194 1814076063 -2136063 MW-20A 1 181179 1812309176 -0519176 MW-14A 1 181061 1810498570 011143 MW-17A 1 18098 1809745419 0054581
Sheet 1 of 3
Table 61 Water Level Calibration Statistics
Garvey Elevator Site Hastings Nebraska
Name Layer
Target Water Level Elevation - Sept 2011
(feet amsl) Model
Water Level Error
Residual MW-12A 1 180706 1807353224 -0293224 MW-16A 1 180683 1806758847 0071153 MW-18A 1 18062 1805744494 0455506 MW-104A 1 180386 1804035180 -017518 MW-105A 1 179994 1799915974 0024026 MW-106A 1 178857 1788240807 0329193 MW-18C 3 180409 1804214829 -0124829 MW-12C 3 180568 1805675664 0004336 MW-16C 3 180625 1806232799 0017201 MW-45C 3 180888 1809089044 -0209044 MW-17C 3 180918 1809113670 006633 MW-47C 3 181047 1810251020 021898 MW-101B 3 181066 1811509656 -0849656 MW-102B 3 181092 1811706686 -0786686 MW-13C 3 181107 1811204349 -0134349 MW-51C 3 181177 1811366716 0403284 MW-50C 3 18119 1811832475 0067525 MW-49C 3 181235 1812474567 -0124567 MW-48C 3 18125 1812312538 0187462 MW-7B 3 181497 1815042613 -0072613
MW-09M 5 181527 1813657691 1612309 MW-3D 5 181479 1814354375 0435625 MW-3E 5 181379 1814210888 -0420888 MW-5D 5 181366 1813572038 0087962 MW-47D 5 181365 1812738611 0911389 MW-49D 5 18134 1813402643 -0002643 MW-48D 5 181323 1812926923 0303077 MW-50D 5 181323 1812962182 0267818 MW-31C 5 181311 1813127460 -001746 MW-51D 5 181302 1812256458 0763542 MW-13E 5 181234 1812181638 0158362
MW-100D 5 181223 1813629694 -1399694 MW-100C 5 181216 1813634399 -1474399 MW-30C 5 181208 1811949179 0130821 MW-19C 5 1812 1812353637 -0353637 MW-20D 5 181196 1811924735 0035265 MW-30D 5 181188 1811949179 -0069179 MW-20E 5 181155 1811924735 -0374735 MW-16M 5 181133 1811653909 -0323909 MW-13M 5 181117 1811940971 -0770971 MW-30E 5 181115 1811949179 -0799179 MW-11M 5 181097 1814139713 -3169713 MW-17D 5 180923 1808958032 0271968
Sheet 2 of 3
Table 61 Water Level Calibration Statistics
Garvey Elevator Site Hastings Nebraska
Name Layer
Target Water Level Elevation - Sept 2011
(feet amsl) Model
Water Level Error
Residual MW-20C 5 180892 1811924735 -3004735 MW-45D 5 180884 1809292039 -0452039 MW-12D 5 180575 1805738454 0011546 MW-18D 5 180413 1804194578 -0064578 MW-104D 5 180137 1801272389 0097611 MW-104C 5 180135 1801269033 0080967 MW-46D1 5 179796 1797768438 0191562 MW-105D 5 179794 1797798970 014103 MW-46D2 5 179792 1797771831 0148169 MW-105C 5 179791 1797803499 0106501 MW-41D2 5 179702 1797046783 -0026783 MW-41D1 5 179697 1797044368 -0074368 MW-106C 5 178531 1785334635 -0024635 MW-106D 5 178527 1785320367 -0050367 MW-43D 5 178387 1783880124 -0010124 MW-43E 5 178386 1783888909 -0028909 MW-42D 5 178183 1781770173 0059827 MW-42E 5 178182 1781753639 0066361 MW-44D 5 177409 1774079493 0010507 MW-44E 5 177407 1774078775 -0008775
Residual Mean 0046933 Res Std Dev 0743461 Sum of Squares 6048817
RMS Error 0744941 Min Residual -3169713 Max Residual 1942196
Number of Observations 109 Range in Observations 4362
Scaled Std Dev 0017044 Scaled Abs Mean 0010505
Scaled RMS 0017078 Notes
amsl - above mean sea level
Sheet 3 of 3
Table 71 Groundwater Data Summary Projected Durations to Meet MCLs
Garvey Elevator Site Hastings Nebraska
Well Data Collection Range TCE Concentration μgL Estimated Date to
Reach MCLs Duration from June 2012 yrsHigh Low
MW-3A May 1997 - March 2012 20000 11 already achieved NA MW-3B May 1997 - March 2012 23000 74 Nov 2045 33 MW-3D April 1997 - March 2012 5 05 already achieved NA MW-3E April 1997 - March 2012 4 05 already achieved NA MW-4A May 1997 - March 2012 18000 43 Sept 2013 1 MW-4B May 1997 - March 2012 29000 690 Dec 2042 30 MW-5A May 1997 - March 2012 24000 47 already achieved NA MW-5B May 1997 - March 2012 15000 12 Jan 2017 5 MW-5D April 1997 - March 2012 4 05 already achieved NA MW-13C May 1997 - March 2012 18000 28 Nov 2061 49 MW-13E May 1997 - March 2012 5 05 already achieved NA
RW-1 1999 - 2011 490 10 May 2016 4 RW-2 1999 - 2011 3200 5 Nov 2021 9 RW-3 1999 - 2011 3800 5 Feb 2024 12 RW-4 1997 - 2011 5500 5 June 2016 4 RW-5 1999 - 2011 5500 5 achieved NA RW-6 1999 - 2011 590 10 Oct 2018 6 RW-7 1995 - 2011 1000 5 Jan 2025 13 RW-8 1998 - 2011 380 5 March 2047 35
Notes
Dates and concentration data are from the site database projections to reach MCLs are based on curves fitted to data plots as provided by Dr Brian
Zurbuchen via email on June 11 2012
μgL - micrograms per liter
Sheet 1 of 1
Table 72 Remedial Alternatives Summary
Garvey Elevator Site Hastings Nebraska
Remedial Alternative Assumptions Remediation
Times Notes
OU 1
SG-1-No Action All extraction wells off 30 years
This scenario was not explicity modeled Based on the remedition duration predicted for SG2 remediation time will be greater than 30 years However for cost estimating purposes a 30-year duration will be used
SG2-- Maintain and Operate Existing GET System
No treatment of downgradient plume
30 years This scenario was not explicity modeled but remediation time was estimated based on contaminant concentration trends (see Table 71)
SG3--In Situ Treatment Via Groundwater Amendments
Area within gt500 ugL set to 00 on-site treatment system shut off
15 years Remediation time estimates are for OU1 (on-site) plume using multiple injection treatments and existing GET system shut off
SG4-- Maintain and Operate Existing GET System and Treatment Via Groundwater Amendments
Pump and treat system operating groundwater within concentrations gt500 ugL set to 00
10 years Remediation time estimates are for OU1 (on-site) plume using multiple injection treatments and existing GET system operating
OU 2
G1-No Action Pump and treat system operating no treatment of downgradient plume
30 years This scenario was not explicity modeled For cost estimating purposes a 30-year duration will be used
G2-Groundwater Recovery Treatment and Discharge at Leading Edge of Plume
On-site pump and treat system operating
100 years Based upon modeling results for more active remedies the remediation times for both the OU 1 and OU 2 plumes would exceed 100 years This scenario was not explicity modeled
G3a-Groundwater Recovery Treatment and Discharge at mid point and Leading Edge of Plume
On-site pump and treat system operating
75 years
Modeled duration ranges from 75 to 90 years
G3b-Groundwater Recovery Treatment and Discharge at two transects and Leading Edge of Plume
On-site pump and treat system operating
53 years
G4a-In Situ treatment at midpoint of plume and Groundwater Recovery Treatment and Discharge at leading edge of plume
On-site pump and treat system operating
75 years
Same as G3 but a treatment zone replaces the recovery wells near the midpoint of the plume Modeled duration ranges from 75 to 90 years
G4b-In Situ treatment at two transects near core of plume and Groundwater Recovery Treatment and Discharge at leading edge of plume
On-site pump and treat system operating
56 years Same as G3 but two treatment zones replace the recovery wells near the midpoint of the plume
Notes
μgL - micrograms per liter
Sheet 1 of 1
This page was intentionally left blank
ATTACHMENT 2 FIGURES
Figure 31 Carbon Tetrachloride Isoconcentrations Upper Aquifer Zone AB Figure 32 Carbon Tetrachloride Isoconcentrations Medial Aquifer Zone C Figure 33 Carbon Tetrachloride Isoconcentrations Lower Aquifer Zone DE
Figure 51 Model Domain and Boundary Conditions Figure 52 Vertical Discretization of Model Figure 53 Elevation of the Model Base Figure 54 Elevation of the Top of the Lower Aquifer Figure 55 Isopach Map of the Lower Confining Unit Figure 56 Elevation of the Base of the Medial Aquifer Figure 57 Isopach of Upper Aquifer Figure 58 Elevation of the Base of the Upper Aquifer Figure 59 Location of Recovery Wells in the Shallow Aquifer Figure 510 Location of Recovery Wells in the Medial Aquifer Figure 511 Location of Injection and Municipal Wells in the Lower Aquifer Figure 512 Initial Concentrations of Carbon Tetrachloride in the Shallow Aquifer Figure 513 Initial Concentrations of Carbon Tetrachloride in the Medial Aquifer Figure 514 Initial Concentrations of Carbon Tetrachloride in the Lower Aquifer
Figure 61 Error Residuals Versus Measured Water Levels Figure 62 Measured Water Levels Versus Predicted Water Level Elevations Figure 63 Error Residuals for the Shallow Aquifer in the Vicinity of the Garvey Elevator
Site Figure 64 Error Residuals for the Shallow Aquifer over the Model Domain Figure 65 Error Residuals for the Medial Aquifer over the Model Domain Figure 66 Error Residuals for the Lower Aquifer in the Vicinity of the Garvey Elevator
Site Figure 67 Error Residuals for the Lower Aquifer over the Entire Model Domain Figure 68 Calibrated Hydraulic Conductivities of the Shallow Aquifer Figure 69 Calibrated Hydraulic Conductivities of the Medial Aquifer Figure 610 Calibrated Hydraulic Conductivities of the Lower Aquifer Figure 611 Calibrated Hydraulic Conductivities of the Upper Aquitard Figure 612 Calibrated Hydraulic Conductivities of the Lower Aquitard Figure 613 Calibrated Potentiometric Surface of the Shallow Aquifer Figure 614 Calibrated Potentiometric Surface of the Medial Aquifer Figure 615 Calibrated Potentiometric Surface of the Lower Aquifer Figure 616 Particle Tracking Analysis to Estimate Travel Time
Figure 71 Initial Concentrations for Alternative SG3 Figure 72 Capture Zone Analysis in the Shallow Aquifer for Alternative SG3 Figure 73 Capture Zone Analysis in the Medial Aquifer for Alternative SG3 Figure 74 Alternative G2 ndash Proposed Recovery Wells Medial Aquifer
ATTACHMENT 2 FIGURES (continued)
Figure 75 Alternative G2 ndash Proposed Recovery Wells Lower Aquifer Figure 76 Preliminary Locations for Leading Edge Recovery Wells and Groundwater
Treatment Building ndash Alternative G2 Figure 77 Alternative G3ab ndash Proposed Recovery Wells Medial Aquifer Figure 78 Alternative G3a ndash Proposed Recovery Wells Lower Aquifer Figure 79 Preliminary Locations for Mid-Plume and Leading Edge Recovery Wells and
Groundwater Treatment BuildingmdashAlternative G3 Figure 710 Alternative G3b ndash Proposed Recovery Wells Lower Aquifer Figure 711 Alternative G3b ndash Relative Positions of Proposed Recovery Wells Medial and
Lower Aquifer Figure 712 Alternative G4a ndash Proposed Treatment Curtain and Recovery Wells Lower
Aquifer Figure 713 Preliminary Locations for Mid-Plume Injection Wells Leading Edge Recovery
Wells and Groundwater Treatment Building ndash Alternative G4 Figure 714 Alternative G4b ndash Proposed Treatment Curtains and Recovery Wells Lower
Aquifer Figure 715 Alternative G4b ndash Relative Positions of Proposed Recovery Wells and
Treatment Curtains
5
5
5
5
5
50
100 500
MW-6A SB-39 HGLmdashGroundwater Flow Modeling Technical MemorandumMW-2AHTW 40 (98)(ND)MW-8A MW47B ( Garvey Elevator SitemdashHastings NE(ND)
(59) SB-38
MW-19APSUS PU PPPUUU ( Figure 31 (70)MW-33 MW-3AB
Carbon Tetrachloride in the(ND53) MW49B MW-20A
+UP+UPPPP+U+U+UPPPPUUUU+UP+UPPPP+U+U+U(43) Upper Aquifer Zone AB(10)
MW-1A PU MW50B(ND) +UP+UPPPP+U+U+U September 2011 Sampling(84)
PPUUMW-4AB PPUU MW-13CE +++++UPUPPPPUUU (21640)
MW-30A (160)+UP+UPPPP+U+U+U LegendPPPUUU
1000 MW51B (1200) MW-5AB
(4119J)
Garvey Property BoundaryMW-7AB MW-31A (ND) (75) (
PPUU MW48B RailroadSB-33 (680)
Inset Ntilde Monitoring Well Location MW-47B MW-10A
(59) (ND) Multilevel Well MW-9A MW-6AHTW 40 MW-10B(ND) (98)
(ND) MW-11A S Hydraulic Conductivity
MW-33 UPPUMW-2A MW-19AU MW-14A(ND) P
(70) PU (ND) A West Highway 6 amp Highway 281 Site MW-12A AMW-106AMW-20A MW-104AMW-3A MW-8A (ND) Monitoring WellU UUU (ND)PSSU P PPP (10)(ND) (ND)(ND) U
UUUUU PUUUUP PPPPPPPPPPPPPPPPPPPPPPPUUUUPUPPPPUUUUU MW-13CE
UUUU Carbon Tetrachloride ConcentrationMW-3B MW-105A A (190)PPP A (ND)
UUUUUUUUU(53) MW-30A in micrograms per liter (microgL)PPUUPPPUUUPPPPPUUUUU
MW-12DMW-1A (160) MW-42 DEMW-45CD(ND)
MW-50B MW-49B MW-51B Carbon Tetrachloride Isoconcentration(84) PPUUPPUU(43)
PPUU(1200)
Contour (microgL)PPPUUU PPPUUUMW-46 D1D2MW-7B (5)(ND)
(Dashed Lines are Estimated)MW-7A (ND)
MW-5A (41)
MW-4A (21) MW-4B (640)
MW-48B (680)
MW-17A (ND)
MW-16A (ND) UUPP
MW-18A (ND)
MW-41 D1D2 UUPP
MW-44 DE UUPP
MW-5B
MW-31A (75)
(19)
MW-43 DE UUPP Notes
(ND) Nondetect
0 2500 5000
Feet sup3 Filename XEPA009GarveyGW_Flow_Tech_Memo Carbon_TetChl_UpperAquifer_ABmxd Project EP903401220202 Revised 061312 ST Source ENSR GDB 2008 DNR
100
5
100
SB-39MW-6AHTW 40 HGLmdashGroundwater Flow Modeling Technical Memorandum MW47C SB-38MW-33 MW-2A (62) ( Garvey Elevator SitemdashHastings NE
UUUPSUS P PPP (
U
Figure 32MW-8A MW-3ABDE MW-19C (ND) Carbon Tetrachloride in the
MW-1A +++++PPPP UPUPPPPUUUUUUU
+UP+UPPPP+U+U+U Medial Aquifer Zone CPU MW-20C +UP+UPPPP+U+U+U (ND) September 2011 SamplingMW49C
UU(ND) PPUU +++++PPPPPPPUUUUU MW50C
(ND) +UP+UPPPP+U+U+UPPPUUU LegendMW-13C
MW-4AB (130) MW-30C
MW-5AB (ND) MW48C MW51C
(ND) (ND) Garvey Property Boundary SB-33 (
MW-7AB PPUU MW-31C (ND) Railroad
Inset Ntilde Monitoring Well Location MW-47CMW-9A MW-10AB Multilevel Well(62)
HTW 40
MW-6A S Hydraulic Conductivity WellMW-11AMW-33 PPUUMW-2A
MW-19CUP (ND) P West Highway 6 amp Highway 281 SiteU MW-14A A A Monitoring WellMW-20C MW-12C MW-106CMW-104CPSS P PPP
U (ND) (ND) (90) (ND)
MW-8A MW-13C U U UUU
PMW-3ABDE PPPPPPPPUUUUPU (130) Carbon Tetrachloride ConcentrationPU UUUU UUUUUUUUUU
MW-105C A (190)MW-1A UUUUUUUUUPPPPPPPPPPPPPPPPPPP MW-30C PPPUUU MW-12D A (200) in micrograms per liter (microgL)
MW-49C UUUUPUPPPPUUPU (ND) UPPU Old Rolls MW-42 DEPP (13)(ND) Carbon Tetrachloride Isoconcentration MW-45C MW-50C (ND)
MW-51C (ND) PPUU PPUU PPUU (5) Contour (microgL)(ND)
UUU PPP MW-46 D1D2
PPP UUUMW-48C (Dashed Lines are Estimated)5MW-7AB (ND)
MW-4AB MW-17C MW-18C(ND) MW-44 DE Domestic Irrigation W ater Wells(81)MW-5AB
PPUUMW-31C MW-16C (ND)
PPUU(ND) MW-41 D1D2
PPUU
Notes MW-43 DE PPUU
(ND) Nondetect
0 2500 5000
Feet sup3 FilenameXEPA009GarveyGW_Flow_Tech_Memo Carbon_TetChl_Medial_Aquifer_Cmxd Project EP903401220202 Revised 061312 ST Source ENSR GDB 2008 DNR
50
5
5
50 100
MW-6D SB-39 HGLmdashGroundwater Flow Modeling Technical MemorandumHTW 40 (ND) SB-38MW-3DE ( Garvey Elevator SitemdashHastings NE (NDND)
UUUUPSUS P PPP MW-19AC( Figure 33MW-2A MW-33 MW47D
U (ND)
Carbon Tetrachloride in theMW-8A PPPPUUUU P Lower Aquifer Zone DEUMW-1A MW-20DEPU P
(NDND)UPUU
September 2011 Sampling MW-13EPPUUPPPU (ND)
MW50D UPMW49D (ND) UUU(ND) PPP MW-30DE Legend MW51D (ND)
(ND)MW-4AB MW48D (ND)
MW-7AB MW-5D (ND) Garvey Property Boundary
MW-31C (ND)
PPUU
(
RailroadSB-33MW-3DE (NDND)
Inset Ntilde Monitoring Well Location MW-47D
MW-9A (ND) Multilevel Well HTW 40
MW-6D MW-10AB (ND)
MW-11A S Hydraulic Conductivity Well MW-33 MW-2A UPPU
PUMW-19AC West Highway 6 amp Highway 281 Site MW-14A APU
MW-20DE MW-106D A Monitoring WellMW-104DPSSU PU PPPUUU (NDND)
MW-12C (ND)(ND)MW-8A MW-13E PU
UUUUU (ND) Carbon Tetrachloride ConcentrationU PPPPPPPPUUUUPU (190)PPUUU
PPUPPPPPPPPPPPPPPPUUUUUP
UUUUU UUUUUUU PPP A MW-105DMW-1A in micrograms per liter (microgL) AMW-30DE
PPUUPPPUUUPPPPPUUUUU(52)
(NDND) MW-12DNew RollsMW-49D (ND) (ND)
Carbon Tetrachloride Isoconcentration(ND) MW-45D PPUUMW-51D (ND)
MW-46 D1PPUU PPUU Contour (microgL)MW-50D (ND) (5)(ND)
PPPUUU (770)PPPUUU MW-42 DMW-48D (Dashed Lines are Estimated)MW-4AB (4274)(ND)
MW-44DEMW-46 D2 MW-17D (320) (19ND)MW-7AB
MW-5D Domestic Irrigation W ater Wells(94) MW-18D PPUUMW-31C(ND) (21) MW-41 D1MW-5B MW-16C PPUU (ND)
PPUUMW-41 D2 (10) Notes
MW-43DE UUPP(ND18) (ND) Nondetect
0 2500 5000
Feet sup3 Filename XEPA009GarveyGW_Flow_Tech_Memo Carbon_TetChl_LoweR_Aquifer_Dmxd Project EP903401220202 Revised 061312 ST Source ENSR GDB 2008 DNR
_L _j I I I I _j_ I I I
I l --- I 111
1
__u_ I I
1 I ~ N ----y-
+ ~ I
II L _l e11111111111 I ---1 ~lJJ I n r Igt I Constant Head Boundariesj l _Q No Flow Sound aries I I l
~ r-- I - I middot r-
- fl+- L -
0 I J ~r-
Ll-D l Garvey Site I - ~t
Ill -J
l unJprm Spacing 25 eet U~iform S pacing 1 00 feet I Constant Head Boundaries
j
middotmiddot- ~ No Flow Sound aries
J
--=J--=11-~=======2~-----~3=========4~------5 M1les 0 05
Figure 51 Model Domain Gridding and Boundaries
Figure 52 Vertical Discretization of Model
1610
1620
1 6 2 0
1630
1 6 3 0
1640
1 6 4 0
1650
1 6 5 0
1660
1660
1670
1670
1680
1680
1690
17
1698
17013
16918
169198
169118
165864
167129
168901
169482
169872
169403
169347
169374
169448
Figure 53 Elevation of the Model Base (weathered shale of the Niobrara Formation)
1111
I I
-
N
+ 0 05
I I
I 1 l
I
1 l -
2 3 4 Miles
Figure 54 Elevation of the Top of the Lower Aquifer
Figure 55 Isopach Map of Lower Confining Unit (model Layer 4)
Figure 56 Elevation of the Base of the Medial Aquifer
Figure 57 Isopach of Upper Aquitard (model layer 2)
Figure 58 Elevation of the Base of the Upper Aquifer
I I I
~ ~ t--7 t bull I I I
r I l
I EW-01 f1-m I N I bull __ j
+ twtrl I I I rl bull I I I I J I I I -r-----
- middot-- - -- -- middot------__J_--
I --- 1 Feet I 0 500 1 000 2000 3000 4000 rooo I I I I
Figure 59 Location of Recovery Wells in the Shallow Aquifer
_l ________ l I I I -1 middot ] l ~----------middotj + I j
middotmiddot= middotmiddot- ---------L -- ---- ___ _ [_ __
r--------shy1
o--~oomiddoto~bull1~oo=o ======4~oomiddoto------middot~ooco=======43oobullo -------~oo~1
Figure 510 Location of Recovery Wells in the Medial Aquifer
I I r
~~ r -
L - - - -- -1--ltmiddot --I-
I -
---- L f+r
il I
J ---1
I
N
+
Figure 511 Location of Injection and Municipal Wells in the Lower Aquifer
Figure 512 Initial Concentrations of Carbon Tetrachloride in the Shallow Aquifer
Figure 513 Initial Concentrations of Carbon Tetrachloride in the Medial Aquifer
Figure 514 Initial Concentrations of Carbon Tetrachloride in the Lower Aquifer
-40
-30
-20
-10
00
10
20
30
40
17741 17828 17915 18002 18090 18177
Res
idua
l
Layer 1
Layer 3
Layer 5
Observed Value
Figure 61 Error Residuals Versus Measured Water Levels
Layer 1
Layer 3
18090
18177
Layer 5
Mod
el V
alue
17741 17828 17915 18002 18090 18177
18002
17915
17828
17741
Observed Value
Figure 62 Measured Water Levels Versus Predicted Water Levels
bull -020
N
+ 0
h I I
-----------~----j_ _______ ___ j_94-__ _ __ I ------------- t
011
bull 005
05
bull
I
Mile 1
Figure 63 Error Residuals for the Shallow Aquifer in the vicinity of the Garvey Elevator Site
Figure 64 Error Residuals for the Shallow Aquifer Over the Model Domain
-007 bull
N
+
il _ __ ~ II
t079 i
I 1 II_ --middot--middot- J_~=====-middot 1------~
~--1 000 r-----middot- -middotmiddot ____
-021 bull
-012 007 bull bull
l middot l02
I ~~~~====~---====~---Feet _ o ___ _ $-_~_0 _ ___ _ J000 _____ 3QQ_Q_ ---4lIJOLUlJ00----ltgt5ultOOO-- middott- middot ----
I
Figure 65 Error Residuals for the Medial Aquifer Over the Model Domain
0 250
N
+
044 bullbull -042
000 bull
027 bull
013
-)35 bull
Figure 66 Error Residuals for the Lower Aquifer in the Vicinity of the Garvey Elevator Site
Figure 67 Error Residuals for the Lower Aquifer in the Entire Model Domain
Figure 68 Calibrated Hydraulic Conductivities of the Shallow Aquifer (ftd) (model layer 1)
Figure 69 Calibrated Hydraulic Conductivities of the Medial Aquifer (ftd) (model layer 3)
Figure 610 Calibrated Hydraulic Conductivities of the Lower Aquifer (ftd) (model layer 5)
Figure 611 Calibrated Hydraulic Conductivities of the Upper Aquitard (ftd) (model layer 2)
Figure 612 Calibrated Hydraulic Conductivities of the Lower Aquitard (ftd) (model layer 4)
Figure 613 Calibrated Potentiometric Surface of the Shallow Aquifer (model layer 1)
Figure 614 Calibrated Potentiometric Surface of the Medial Aquifer (model layer 3)
Figure 615 Calibrated Potentiometric Surface of the Lower Aquifer (model layer 5)
Figure 616 Particle Tracking Analysis to Estimate Travel Time
Figure 71 Initial Concentrations for Alternative SG3
E3 E3 2000feet
Figure 72 Capture Zone Analysis in the Shallow Aquifer for Alternative SG3
E3 E3 E3 2000feet
Figure 73 Capture Zone Analysis in the Medial Aquifer for Alternative SG3
Figure 74 Alternative G2-Proposed Recovery Wells Medial Aquifer
Figure 75 Alternative G2- Proposed Recovery Wells Lower Aquifer
50
5 5
5
50 100
MW-3DE (NDND)
MW-47D MW-9A (ND)
HTW 40 MW-6D MW-10AB
(ND) MW-11A
MW-2AMW-33 UPPUPU
MW-19AC MW-14A APUMW-20DE MW-106DMW-104D(NDND) MW-12CPSSU (ND)PU PPPUUU PU (ND) MW-13E
HGLmdashGroundwater Flow Modeling Technical Memorandum Garvey Elevator Superfund SitemdashHastings NE
Figure 76 Preliminary Locations for Leading
Edge Recovery Wells and Groundwater Treatment Building-Alternative G2
Legend Garvey Property Boundary
Railroad
Ntilde Monitoring Well Location
Multilevel Well
S Hydraulic Conductivity Well
A West Highway 6 amp Highway 281 Site Monitoring Well
(190) Carbon Tetrachloride Concentration in micrograms per liter (microgL)
Carbon Tetrachloride Isoconcentration Treatment Building
Technical Blvd
MW-8A UUUU UUUUU
U PPPPPPPPUUUUPU UUUUUUPUP
UUUUUPPPPPPPPPPPPPPPPPP (ND)
PPPUUU A MW-105DMW-1A UU AMW-30DE PPUUPPPUUUPPPPPUUUUU
(52)(NDND) MW-12DNew Rolls Contour (Lower Aquifer) (microgL)MW-49D (5)(ND) (ND)
(ND) MW-45D (Dashed Lines are Estimated)PPUUMW-51D (ND) MW-46 D1PPUU PPUUMW-50D
(ND) (ND)
PPPUUU (770)PPPUUU MW-42 DMW-48D Domestic Irrigation W ater WellsMW-4AB (4274) MW-44DE(ND)
(19ND)MW-46 D2 MW-17D (320)MW-7AB Carbon Tetrachloride Isoconcentration(94)MW-5D
MW-18D PPUU (5) Contour (Upper Aquifer) (microgL)(21) MW-41 D1 MW-31C(ND)
MW-5B MW-16C PPUU (Dashed Lines are Estimated)(ND)
PPUUIdlewilde Rd
MW-41 D2 Recovery Wells (Medial)
Recovery Wells (Deep)
(10)
MW-43DE PPUU(ND18)
Recovery Well Piping
Treatment Building
Notes (ND) Nondetect
Blaine A
ve
Showboa t B
lvd
sup3 Filename XEPA009GarveyGW_Flow_Tech_Memo Carbon_TetChl_LoweR_Aquifer_Dmxd Project EP903401220202 Revised 061312 ST2500 5000 Source ENSR GDB 2008 DNR
Feet
0
Figure 77 Alternative G3ab-Proposed Recovery Wells Medial Aquifer
Figure 78 Alternative G3a- Proposed Recovery Wells Lower Aquifer
50
5 5
5
50 100
HGLmdashGroundwater Flow Modeling Technical Memorandum Garvey Elevator Superfund SitemdashHastings NE
Figure 79 Preliminary Locations for Mid-Plume and
Leading Edge Recovery Wells and Groundwater Treatment Building-Alternative G3
Legend Garvey Property Boundary
Railroad
Ntilde Monitoring Well Location MW-3DE (NDND)
Multilevel Well MW-47D
MW-9A (ND) Hydraulic Conductivity WellSHTW 40 MW-6D MW-10AB
(ND) West Highway 6 amp Highway 281 SiteMW-11A
MW-33 PPUUMW-2A PUA Monitoring Well
MW-19AC MW-14A APUCarbon Tetrachloride Concentration
Technical Blvd
MW-44DE (19ND) (Dashed Lines are Estimated)
MW-20DE (190)MW-106DPSSU PU PPPUUU MW-104DMW-12C(NDND) (ND)PU in micrograms per liter (microgL)(ND) MW-13EMW-8A
U UUUU UPUPPPPUUUUUUUUP UUUUU UUUPPPPPPPPPPPPPPPPPPPPPPPUUUUUU
(ND) PPPUUU A Treatment BuildingMW-105DMW-1A Carbon Tetrachloride IsoconcentrationMW-30DE A
PPUUPPPUUUPPPPPUUUUU(52)
(NDND) MW-12DNew Rolls Contour (Lower Aquifer) (microgL)MW-49D (5)(ND) (ND)(ND) MW-45D
MW-51D PPUU(ND)
PPUU PPUUMW-50D (ND)
MW-46 D1(ND) PPPUUU (770)
PPPUUU MW-42 D (4274)
MW-48D Domestic Irrigation W ater WellsMW-4AB (ND) MW-46 D2
MW-17DMW-7AB (320)(94) Carbon Tetrachloride IsoconcentrationMW-5D
MW-18D(ND) MW-31C (21) PPMW-41 D1
UU (5) Contour (Upper Aquifer) (microgL)MW-5B MW-16C UU (ND)PP (Dashed Lines are Estimated)PPUUIdlewilde Rd
MW-41 D2 Recovery Wells (Medial)(10)
MW-43DE UUPP(ND18) Recovery Wells (Deep)
Recovery Well Piping
Treatment Building
Notes (ND) Nondetect
Blaine A
ve
Showboa t B
lvd
sup3 Filename XEPA009GarveyGW_Flow_Tech_Memo Mid-Plume_Prelim_Loc Project EP903401220202 Revised 061312 RL2500 5000 Source ENSR GDB 2008 DNR
Feet
0
Figure 710 Alternative G3b-Proposed Recovery Wells Lower Aquifer
Figure 711 Alternative G3b-Relative Positions of Proposed Recovery Wells Medial and Lower Aquifers
Figure 712 Alternative G4a-Proposed Treatment Curtain and Recovery Wells Lower Aquifer
50
5 5
5
50 100
HGLmdashGroundwater Flow Modeling Technical Memorandum Garvey Elevator Superfund SitemdashHastings NE
Figure 713 Preliminary Locations for Mid-Plume
Injection Wells Leading Edge Recovery Wells and Groundwater Treatment Building
-Alternative G4
Legend Garvey Property Boundary
Railroad
Ntilde Monitoring Well Location MW-3DE (NDND)
MW-47D MW-9A (ND)
HTW 40 MW-6D MW-10AB
(ND)
S Elm
Ave
S Wabash A
ve
Multilevel Well
S Hydraulic Conductivity Well
A West Highway 6 amp Highway 281 Site Monitoring Well
MW-11AMW-33 UPPUMW-2A PU
MW-19AC MW-14A APUMW-20DE MW-106D Carbon Tetrachloride ConcentrationPU PPPUUU (190)PSSU MW-104D(NDND) MW-12C (ND)PU in micrograms per liter (microgL)(ND)
Treatment Building Technical B
lvd MW-13EMW-8A
UUUU UUUUUU PPPPPPPPUUUUPU UUUUU
UPUP
UUUUUPPPPPPPPPPPPPPPPPP (ND)
PPPUUU A MW-105DMW-1A UU Carbon Tetrachloride IsoconcentrationAMW-30DE PPUUPPPUUUPPPPPUUUUU
(52)(NDND) MW-12DNew Rolls Contour (Lower Aquifer) (microgL)MW-49D (5)(ND) (ND)
(ND) MW-45D (Dashed Lines are Estimated)PPUUMW-51D (ND) MW-46 D1PPUU PPUUMW-50D
(ND) (ND)
PPPUUU (770)PPPUUU MW-42 DMW-48D Domestic Irrigation W ater WellsMW-4AB (4274)(ND) MW-44DEMW-46 D2
(19ND)MW-17D (320)MW-7AB Carbon Tetrachloride Isoconcentration(94)MW-5D MW-18D PPUU (5) Contour (Upper Aquifer) (microgL)(21) MW-41 D1
MW-31C(ND) MW-5B MW-16C PPUU (Dashed Lines are Estimated)(ND)
PPUUIdlewilde Rd
MW-41 D2 Recovery Wells (Medial)
Recovery Wells (Deep)
(10) Injection Area 1 MW-43DE PPUUPermanent Injection Well Spacing 40 ft (ND18)
Total Injection Wells Installed 39 Recovery Well Piping Injection Area (40 ft spacing between the wells) Treatment Building
Notes (ND) Nondetect
Blaine A
ve
Showboa t B
lvd
S Baltim
ore Ave
sup3 Filename XEPA009GarveyGW_Flow_Tech_Memo G4_Prelim_Loc_Inj_Areamxd Project EP903401220202 Revised 061312 RL2500 5000 Source ENSR GDB 2008 DNR
Feet
0
Figure 714 Alternative G4b-Proposed Treatment Curtains and Recovery Wells Lower Aquifer
Figure 715 Alternative G4b-Relative Positions of Proposed Recovery Wells and Treatment Curtains
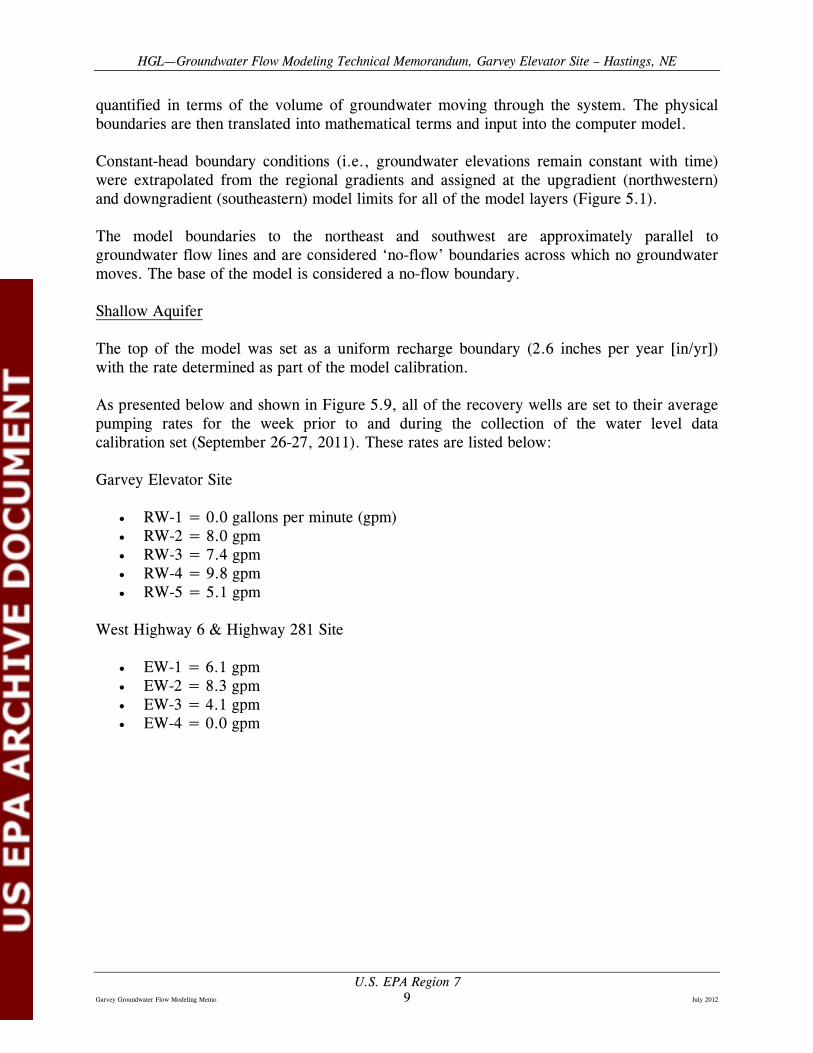
HGLmdashGroundwater Flow Modeling Technical Memorandum Garvey Elevator Site ndash Hastings NE
Medial Aquifer
There are no wells pumping from the medial aquifer at the West Highway 6 amp Highway 281 Site Recovery wells RW-6 RW-7 and RW-8 at the Garvey Elevator Site are set to their average rates observed for the week prior to and during the collection of the water level calibration set (Figure 510) These pumping rates are as follows
Garvey Elevator Site
bull RW-6 = 925 gpm bull RW-7 = 667 gpm bull RW-8 = 905 gpm
West Highway 6 amp Highway 281 Site
bull No wells are pumping from the medial aquifer
Lower Aquifer
All of the water pumped from the shallow and medial aquifers at the Garvey Elevator Site is treated and injected into the lower aquifer through two injection wells located as shown on Figure 511 The total amount of pumped water is approximately 280 gpm Since there are no flow meters on the injection wells it is assumed that 10 percent of the pumped water is lost to leaks and evaporation and the remaining 250 gallons is injected at an equal rate (125 gpm) into each of the two injection wells
Pumping records for the month of September 2011 indicate that the pumping rate for Municipal Well 9 averaged 577 gpm The close proximity of this well to a no-flow boundary (Figure 511) however would result in over predictions of the hydraulic conductivities in this area during the model calibration Therefore the pumping rate of Municipal Well 9 was reduced during the model calibration until the hydraulic conductivities approximated those in the general vicinity but outside the influence of the pumping Since this well is away from the contaminant plumes the modeling results will be relatively insensitive to the hydraulic conductivities predicted in this area Since the calibration set was collected in September it is assumed that the irrigation wells located within the model domain were not pumping water Injection and pumping rates from the lower aquifer are shown below
Garvey Elevator Site
bull IW-1 = 125 gpm bull IW-2 = 125 gpm
US EPA Region 7 Garvey Groundwater Flow Modeling Memo 10 July 2012
HGLmdashGroundwater Flow Modeling Technical Memorandum Garvey Elevator Site ndash Hastings NE
West Highway 6 amp Highway 281 Site
bull Municipal Well 9 = 342 gpm
532 Initial Conditions
As described in Section 32 carbon tetrachloride contamination is present in the upper middle and lower aquifers Groundwater contaminant concentration data presented on Figures 31 32 and 33 were used as the basis for estimating the initial plume concentrations within the model The actual concentrations specified as initial conditions for the shallow medial and lower aquifers are shown in Figures 512 513 and 514 respectively
60 MODEL CALIBRATION
Traditionally the term model calibration is used to refer to the trial-and-error adjustment of parameters of the groundwater system by comparing the models output (calculated values of hydraulic head or concentration) and the measured output (observed values of hydraulic head or concentration) In essence such a calibration procedure involves the following routines (1) operating the model using initial estimates of the values of the parameters (2) history-matching or comparing computed and observed values of hydraulic head or concentration and (3) adjusting the values of the parameters and repeating the simulation
Calibration of the model is aimed at demonstrating that it can produce realistic accurate and reliable predictions The flow model is calibrated by determining a set of parameters boundary conditions and hydraulic stresses that generate simulated potentiometric surfaces and fluxes that match field-measured values to within an acceptable range of errors The end result of the process of model calibration is an optimal set of values for parameters that minimize the discrepancy between the model output and the observed data The iterative process of matching calculated values with observed (historical) data by adjusting the model input can be a manual trial-and-error procedure or can be automated The calibration process also known as history-matching is closely related to estimating parameters This process might result in the refinement of initial estimates of aquifer properties (parameters) the establishment of the location of the boundaries (areal and vertical extent of aquifer) and the determination of flow and transport conditions at the boundaries
Calibration can be performed to steady-state or transient data sets Although most flow model calibration exercises involve steady-state data in some hydrogeologic settings assumption of steady-state conditions may be inappropriate due to large fluctuations in the water table or boundary conditions For this modeling exercise only steady-state calibrations were performed
To facilitate the model calibration PEST was used in conjunction with the groundwater flow code (MODFLOW-2000) PEST is a calibration tool that uses non-linear least-squares techniques to adjust model parameter data in order to reduce the discrepancies between the
US EPA Region 7 Garvey Groundwater Flow Modeling Memo 11 July 2012
HGLmdashGroundwater Flow Modeling Technical Memorandum Garvey Elevator Site ndash Hastings NE
pertinent model-generated numbers and the corresponding measurements to a minimum It does this by taking control of the model and running it as many times as is necessary to determine this optimal set of parameters within a user-specified range
Calibration of the steady state flow model was accomplished iteratively by adjusting model parameters during successive model runs to match the water-level data that was collected from all of the wells on September 26-27 2011 under stressed (ie pumping) conditions Since most of the recovery wells had been running for at least several weeks prior to and during the collection of these water levels is it assumed that the levels are representative of steady-state pumping conditions The water-level calibration targets for all of the aquifers are provided in Table 61
As part of the model calibration adjustments were made to the areal recharge (shallow aquifer) range of hydraulic conductivities ratio of vertical to horizontal hydraulic conductivities and minor adjustments to the constant head boundaries The general calibration approach that was followed involved adjusting the parameters mentioned above and inputting the parameters into a PEST simulation PEST would subsequently run MODFLOW thousands of times in which the hydraulic conductivities were adjusted for each iteration until the difference between the observed water levels (targets) and the model predicted values (error residuals) were minimized If these error residuals were too high further adjustments were made to the recharge hydraulic conductivity range etc and the PEST simulation was initiated again
During the model flow calibration it was found that the parameter imparting the most sensitivity to the model results is the areal recharge reaching the water table The Corps of Engineers proposed in their 1990 Final Groundwater Modeling Report of the Hastings East Industrial Park area that net recharge for non-irrigated grassland was estimated to be 26 inches per year (USACE 1990) After performing a number of simulations during the model calibration it was found that a value of 26 inches per year provided the best match to the measured water levels
The error residuals (that is the differences between model predictedcomputed and measuredobserved values) are depicted graphically in Figures 61 and 62 The error residuals and calibration statistics are also presented in tabular form in Table 61 As shown in Figure 61 most of the error residuals are within plusmn05 ft The minimum residual is -32 ft (over prediction of the hydraulic head) and the maximum residual is 196 ft (under prediction of hydraulic head) The graph depicted in Figure 62 shows that there is a good fit along the entire range of observed water level elevations
A common measure of the quality of the model calibration is the percent error The percent error is the root mean square error (RMSE) divided by the total change in the observed head As shown in Table 61 the RMSE is 075 and the range in observations is 4326 This leads to a percent error of about 17 percent which is well below the 10 percent error often cited as the cutoff for a well calibrated model
US EPA Region 7 Garvey Groundwater Flow Modeling Memo 12 July 2012
HGLmdashGroundwater Flow Modeling Technical Memorandum Garvey Elevator Site ndash Hastings NE
The areal distribution of error residuals for the shallow aquifer (model layer 1) near the Garvey Elevator Site and over the entire model domain are shown in Figures 63 and 64 respectively All of the error residuals shown in the figures are relatively small In fact the largest error residuals in the shallow aquifer are found in the immediate vicinity of the West Highway 6 amp Highway 281 Site and do not significantly impact the flow and transport results These error residuals were further lowered as part of the West Highway 6 amp Highway 281 model calibration performed as a separate exercise
The error residuals for the medial aquifer (model layer 3) are presented in Figure 65 With the exception of two wells that are located to the northeast of the Site in the vicinity of the West Highway 6 amp Highway 281 Site all of the residuals are relatively low
The areal distribution of error residuals for the lower aquifer (model layer 5) near the Garvey Elevator Site and over the entire model domain are depicted in Figures 66 and 67 respectively The large residual shown on Figure 66 is associated with MW-20C (-30 ft) The water levels and residuals for the MW-20 well series are as follows
MW-20C residual -300 ft water level 180892 ft above mean sea level (amsl) MW-20D residual 004 ft water level 181196 ft amsl MW-20E residual -037 ft water level 181155 ft amsl
As shown in Table 51 the top of the lower aquifer for the MW-20 series is encountered at a depth of 152 feet This is also the depth that the well screen begins for MW-20C Therefore MW-20C -20D and -20E are all screened in the lower aquifer
Historically the water level for MW-20C behaves somewhat erratically when compared to MW-20D and MW-20E For instance all of the measurements for the 3 wells are relatively close in 2009 and 2010 However in June of 2011 the water level observed in MW-20C is 4 feet above that observed in MW-20D and 3 feet above the water level measured in MW-20E Therefore primary reliance was placed on the water levels from MW-20D and MW-20E for the model calibration
The residuals for the lower aquifer monitoring wells farther downgradient of the site are all very low and demonstrate an excellent calibration (Figure 67)
The calibrated hydraulic conductivities for the shallow medial and lower aquifers are presented in Figures 68 69 and 610 respectively In the vicinity of the Site the calibrated horizontal hydraulic conductivity for the all of the aquifers ranges between 50 and 250 ft per day (ftd) It is assumed that the vertical hydraulic conductivity is a factor of 5 less than that of the horizontal hydraulic conductivity
Near the Site most of the shallow aquifer is characterized by hydraulic conductivities between 50 to 100 ftd The hydraulic conductivities in the medial aquifer however tend to range between 100 and 250 ftd over most of the Site The calibrated hydraulic conductivities for the lower aquifer range between 50 and 150 ftd over most of the eastern portion of the Site and between 100 and 250 ftd along the western boundary and in the northwest area of the Site
US EPA Region 7 Garvey Groundwater Flow Modeling Memo 13 July 2012
HGLmdashGroundwater Flow Modeling Technical Memorandum Garvey Elevator Site ndash Hastings NE
The model predicted hydraulic conductivities for the lower aquifer are less certain however because there are no pumping wells stressing the system in this aquifer
The hydraulic conductivities farther downgradient of the Site indicate that large areas in the shallow and medial aquifers have relatively low hydraulic conductivities ranging from 50 to 100 ftd The hydraulic conductivities of the lower aquifer over much of this area tend to be significantly higher and range between 100 and 250 ftd These higher hydraulic conductivities are consistent with the large production rates (eg 300 to 600 gpm) of the irrigation wells located in the area which draw from the lower aquifer during the summer months
The hydraulic conductivities of the upper and lower aquitards are show on Figures 611 and 612 respectively The upper aquitard is continuous except for an area located immediately north of the Site The lower aquitard is absent from approximately the northern one third of the model domain
The calibrated potentiometric surfaces for the shallow medial and lower aquifers are presented in Figures 613 through 615 respectively The calibrated potentiometric surface for the shallow and medial aquifers show some bending in the vicinity of the Site due to the pumping wells The potentiometric surface of the lower aquifer is clearly impacted by the injections wells (for example elevation line 1817) Downgradient from the Site the potentiometric lines are generally perpendicular to groundwater flow
As a qualitative check on the calibrated hydraulic conductivity fields and hydraulic gradients a particle tracking analysis was performed to estimate travel times Approximately 52 years has elapsed since Garvey Elevators began operation as a grain storage facility in 1959 and the 2011 sampling event As illustrated by Figure 616 it takes about 50 years for a particle to move from the Site boundary to the toe of the plume Although it is unknown when contamination reached the water table and the overall influence of municipal and irrigation wells on transport rates the results of the travel time analysis suggest that the calibrated hydraulic conductivities and gradients are reasonable A general discussion pertaining to particle tracking (eg computer code) is provided in Section 722
70 REMEDIAL ALTERNATIVE DESIGN
71 CONTAMINANT TRANSPORT PARAMETERIZATION
Once the calibration of the flow model was complete contaminant transport and particle tracking simulations were performed Parameters that are required to conduct contaminant transport modeling include effective porosities dispersivities retardation and chemical and biological transformations A brief description of each of these processes is presented below
Effective Porosity The effective porosity is the ratio of the volume of interconnected pore spaces available for transport to the total system volume It is used to estimate the velocity at which groundwater and contaminants travel through a porous medium The smaller the effective porosity the higher the groundwater velocity and the more rapidly contaminants will
US EPA Region 7 Garvey Groundwater Flow Modeling Memo 14 July 2012
HGLmdashGroundwater Flow Modeling Technical Memorandum Garvey Elevator Site ndash Hastings NE
be transported A reasonable value for sand silts and gravels is 25 percent and therefore this value was assigned to the model
Dispersivity The equations of solute transport that are solved in contaminant-transport codes are derived assuming that the solute migration is due to advection and hydrodynamic dispersion Advection describes the bulk movement of groundwater flow where hydrodynamic dispersion is caused by the tendency of the solute to spread out from the path that it would be expected to follow if transported only by advection This spreading of the contamination over an ever-increasing area is called hydrodynamic dispersion and has two components mechanical dispersion and diffusion Hydrodynamic dispersion causes dilution of the solute and occurs because of spatial variations in groundwater flow velocities and mechanical mixing during fluid advection Molecular diffusion the other component of hydrodynamic dispersion is due to the thermal kinetic energy of solute molecules and also contributes to the dispersion process Thus if hydrodynamic dispersion is factored into the solute transport processes ground-water contamination will cover a much larger region than in the case of pure advection with a corresponding reduction in the maximum and average concentrations of the contaminant Dispersion also increases the velocity of the contaminants because it considers the fact that some contaminants will travel through faster pathways (and some slower) than if only pure advection was assumed
The relatively narrow plume with respect to the plume length suggests relatively low dispersivity values Furthermore numerical dispersion occurring as part of the solution method has to also be factored into the dispersion estimate Finally if too large of a dispersion value is assigned contaminants will be artificially dispersed vertically through the upper and lower aquitards into the underlying aquifers Therefore the relatively low values of 50 5 and 1 ft were assigned to the longitudinal transverse and vertical dispersivities respectively
Retardation Factor The rate at which contaminants migrate relative to groundwater is termed the retardation factor and is determined by the effective porosity (see definition above) bulk density and distribution coefficient Adsorption of carbon tetrachloride and other chlorinated solvents is expected to be relatively low in the upper medial and lower aquifer zones leading to a low degree of retardation For modeling purposes a retardation factor of zero was assumed
Chemical and Biological Transformations
Most VOCs and chlorinated solvents including carbon tetrachloride are subject to biological and chemical transformations in the subsurface environment Biological transformations include aerobic degradation anaerobic degradation and co-metabolism Several chemical properties of both water and soil influence the stability of chlorinated solvents in an aquifer Chemical transformations include hydrolysis dehydrohalogenation and reduction in water These typically require low groundwater flow rates and therefore it is unlikely that these chemical transformations will play a significant role at the Site
Carbon tetrachloride can be reduced under anaerobic conditions via three different pathways
US EPA Region 7 Garvey Groundwater Flow Modeling Memo 15 July 2012
HGLmdashGroundwater Flow Modeling Technical Memorandum Garvey Elevator Site ndash Hastings NE
bull reductive dechlorination where carbon tetrachloride is reduced to chloroform chloroform is reduced to methylene chloride and methylene chloride is reduced to methane
bull a simple two-electron reduction process in which chloroform is only a minor product and
bull a one-electron reduction via sulfur and oxygen where carbon tetrachloride is reduced to carbon dioxide and chloroform is not produced
Based on the groundwater sample analytical results collected during the RI field investigation some degree of biodegradation of the carbon tetrachloride groundwater plume is occurring as evidenced by the presence of the degradation products chloroform and methylene chloride (HGL 2011) Concentrations of these degradation products are typically one to two orders of magnitude less than those of carbon tetrachloride in samples collected at the Site However chloroform concentrations are similar to or slightly greater than carbon tetrachloride concentrations in many of the groundwater transect samples collected downgradient of the Site indicating that biodegradation is occurring but not at an accelerated rate Therefore no degradation of carbon tetrachloride was assumed in the model
72 OU 1 - REMEDIAL ALTERNATIVES
The remedial scenarios being considered as part of the FS are presented in Table 71 As shown in the table there are four scenarios included under OU 1 The No Action Alternative (SG-1) and Maintaining and Operating the Existing Groundwater Extraction System (SG-2) would require a significant length of time for on-site carbon tetrachloride concentrations to fall below the maximum contaminant level (MCL) of 5 micrograms per liter (μgL) which is established as the preliminary cleanup level (PCL) These alternatives were not explicitly modeled
For the no action alternative (SG-1) the duration to reach MCLs should intuitively be longer than other alternatives that use active treatment methods However for cost estimating purposes it is assumed that the duration for SG-1 is 30 years
For alternative SG-2 the duration to achieve MCLs was estimated using groundwater contamination data from monitoring wells and recovery wells at the site Table 71 summarizes analytical data from these wells including projected times to achieve MCLs based on concentration trends Using these data an estimated duration of 30 years has been assumed for alternative SG-2 to achieve MCLs
721 SG3 - In-Situ Treatment via Groundwater Amendments
This alternative involves shutting off the existing groundwater extraction system and injecting amendments to remediate contaminated groundwater within the 500 μgL contour As shown in Figure 71 the initial conditions for this portion of the plume have been set to zero and the pumping and injection wells in the upper medial and lower aquifers have been shut off The model predicts that it would take approximately 4 years for the plume to disperse and the concentrations of carbon tetrachloride to decrease below the MCL of 5 μgL These
US EPA Region 7 Garvey Groundwater Flow Modeling Memo 16 July 2012
HGLmdashGroundwater Flow Modeling Technical Memorandum Garvey Elevator Site ndash Hastings NE
predictions are unrealistically short however for the following reasons diffusion back out of the finer grained clays is limited by concentration gradients that often lead to very long cleanup time frames and although sorption is probably low it can significantly increase remediation times particularly when coupled with diffusion processes For these reasons the remediation time for alternative SG3 was increased to 15 years
722 SG4 - Maintain and Operate Existing GET System and Treat Via Amendments
This alternative is identical to SG3 except that the existing groundwater extraction and treatment (GET) system remains on To ensure that the existing GET system is effective at capturing the contamination a capture zone analysis was conducted with the computer code MODPATH
MODPATH is a widely accepted 3-D particle-tracking model that uses the flow fields created by MODFLOW to predict groundwater flow directions Particle tracking is a form of flow and transport modeling that represents the bulk movement of groundwater Particle tracking neglects the effects of chemical reactions dispersion and diffusion The particle tracking analysis involves adding particles to the model at selected locations and then allowing the model to move the particles in the direction of groundwater flow The results of a particle tracking simulation are displayed by plotting pathlines through the aquifer Although both forward and reverse particle tracking can be performed with MODPATH for the Garvey Elevator Site only forward-tracking analyses are conducted
Before initiating the capture zone analysis the groundwater extraction rates were changed from those used to calibrate the model to rates that better reflect long term pumping rates The revised rates are as follows
Garvey Elevator Site
bull RW-1 = 35 gpm bull RW-2 = 68 gpm bull RW-3 = 90 gpm bull RW-4 = 102 gpm bull RW-5 = 50 gpm bull RW-6 = 900 gpm bull RW-7 = 680 gpm bull RW-8 = 1280 gpm
West Highway 6 amp Highway 281 Site
bull EW-1 = 61 gpm bull EW-2 = 83 gpm bull EW-3 = 41 gpm bull EW-4 = 00 gpm
Shallow Aquifer
US EPA Region 7 Garvey Groundwater Flow Modeling Memo 17 July 2012
HGLmdashGroundwater Flow Modeling Technical Memorandum Garvey Elevator Site ndash Hastings NE
As shown on Figure 72 particles released to all the model layers indicate that the extraction wells are effectively containing the on-site carbon tetrachloride plume At some point downgradient however capture is lost and the contaminants will continue to migrate with the groundwater
Medial Aquifer
The results of the particle-tracking analysis for the medial aquifer are presented as Figure 73 The particle tracking illustrates that the modeled capture zone extends sufficiently downgradient to capture the contamination that has moved immediately off site
The predicted remediation time for this alternative is about 2 years (Table 72) The removal of the contamination with the pumping wells has shortened the time from that predicted for Alternative SG3 As was the case for Alternative SG3 these predictions are unrealistically short for the same reasons For these reasons the remediation time for alternative SG3 was increased to 10 years
73 OU 2 - REMEDIAL ALTERNATIVES
Six remedial alternatives were considered for OU 2 (Table 72) Although it was not modeled based on the predicted remediation times of greater than 100 years for the G2 scenario the No-Action alternative (G1) remediation time is predicted to take more than 100 years However for cost estimating purposes it will be assumed that the duration for SG-1 is 30 years
731 G2 - Groundwater Recovery and Treatment at Leading Edge of Plume
This alternative involves pumping and treating the groundwater from the toe of the medial and lower aquifer plumes As shown in Figures 74 and 75 three wells would need to be placed in both the medial and lower aquifers to ensure capture of the plume The relative position of the two sets of wells is depicted on Figure 76 Each of the medial wells would be pumped at 50 gpm and the lower aquifer wells would each be pumped at 150 gpm The predicted remediation time for this alternative is greater than 100 years For costing purposes a duration of 100 years is assumed
732 G3a - Groundwater Recovery and Treatment at Leading Edge and Midpoint of Plume
This alternative is the same as Alternative G2 but in addition to pumping and treating contaminated groundwater from the toe of the plume contaminated groundwater is also pumped and treated from the midpoint of the medial and lower aquifer plume(s) A series of simulations were run in which the midpoint wells were located along different transects in order to decrease the remediation times the most optimal locations are shown in Figures 77 and 78
US EPA Region 7 Garvey Groundwater Flow Modeling Memo 18 July 2012
HGLmdashGroundwater Flow Modeling Technical Memorandum Garvey Elevator Site ndash Hastings NE
The relative position of the two sets of wells is depicted on Figure 79 Each of the medial wells would be pumped at 50 gpm and the lower aquifer wells would each be pumped at 150 gpm The predicted remediation time for this alternative is between 75 and 95 years For cost estimating purposes a duration of 75 years will be assumed
733 G3b - Groundwater Recovery and Treatment at Leading Edge and Midpoint of Medial Aquifer and Two Recovery Well Transects in Lower Plume
The results from G3a indicate that the contamination in the lower aquifer takes the longest time to remediate Therefore this alternative was added to determine how much the remediation times could be reduced if a second set of recovery wells was added to the lower aquifer The placement of the recovery wells in the medial aquifer remains the same as for Alternative G3a (Figure 77) The locations of the two transects of recovery wells in the lower aquifer are shown on Figure 710 Their placement relative to the medial wells is shown in Figure 711 Each of the medial wells would be pumped at 50 gpm and each of the lower aquifer wells would be pumped at 150 gpm The predicted remediation time for this alternative is about 53 years
734 G4a - Establishment of In Situ Treatment Zone at Midpoint of Lower Aquifer Plume and Groundwater Recovery and Treatment at Leading Edge of Medial and Lower Plumes
This alternative involves adding a treatment curtain to the pumping wells specified in the G2 alternative (Figure 712) The transect is simulated as a zero concentration boundary which effectively removes all of the carbon tetrachloride from the groundwater moving through it The relative position of the transect and wells is depicted on Figure 713 Each of the medial wells would be pumped at 50 gpm and each of the lower aquifer wells would be pumped at 150 gpm The predicted remediation time for this alternative is between 75 and 95 years For cost estimating purposes a duration of 75 years is assumed
735 G4b - Establishment of In Situ Treatment Zone(s) at Two Transects of Lower Aquifer Plume and Groundwater Recovery and Treatment at Leading Edge of Medial and Lower Plumes
This alternative involves adding two treatment curtains to the pumping wells specified in the G2 alternative (Figure 714) The relative position of the transects and recovery wells is depicted on Figure 715 Each of the medial wells would be pumped at 50 gpm and the lower aquifer wells each at 150 gpm The predicted remediation time for this alternative is about 56 years
80 SUMMARY AND CONCLUSIONS
A hydrogeologic conceptual site model of the subsurface groundwater flow and contaminant transport was developed to guide the creation of a numerical model The numerical model
US EPA Region 7 Garvey Groundwater Flow Modeling Memo 19 July 2012
HGLmdashGroundwater Flow Modeling Technical Memorandum Garvey Elevator Site ndash Hastings NE
was subsequently calibrated with existing field data (known water levels and pumping rates) to address the following objectives (1) evaluate the overall effectiveness of the current extraction well system (2) identify areas outside of the capture zone that may require enhancements and (3) develop a tool to assist in ldquowhat ifrdquo scenarios for the remedial alternative development
MODFLOW-2000 MT3D-MS and MODPATH are the computer codes applied to conduct the flow and transport analysis The output from MODFLOW-2000 is a groundwater velocity field which is used by MT3D-MS in conjunction with fate and transport parameters to simulate the migration of carbon tetrachloride Particle tracking analyses were also conducted with MODPATH to illustrate the groundwater flow directions travel times and capture zones All of these computer codes are widely used well documented and in the public domain
With respect to the construction of the model a three layer finite difference grid was utilized that simulates the upper middle and lower aquifers covers 102 square miles and includes 1030200 active cells
Calibration of the steady state flow model was accomplished iteratively by adjusting model parameters during successive model runs to match the water level data that was collected from all of the wells on September 26-27 2011 under stressed (pumping) conditions
The flow and transport model was initialized with measured carbon tetrachloride data obtained during a 2011 sampling event These initial concentrations were used as the basis to predict future concentrations under various remedial alternatives involving extraction wells and treatment curtains
Remediation times for OU 1 scenarios varied from 10 to 30 years Scenarios from the No Action alternative and alternative SG-2 were not modeled but were based on an assumed cost basis period and a duration based on existing concentration data trends respectively Remediation times for OU 2 scenarios range from 30 years to more than 100 years
90 REFERENCES
Doherty J 2006 PEST Model-Independent Parameter Estimation User Manual 5th Edition Watermark Computing
Harbaugh AW Banta ER Hill MC and McDonald MG 2000 MODFLOWndash2000 the US Geological Survey Modular Ground-Water ModelmdashUser guide to modularization concepts and the ground-water flow process US Geological Survey Open-File Report 00ndash92 121 p
HydroGeoLogic Inc (HGL) 2009 Focused Feasibility Study Version 4 Garvey Elevator Site OU 1 Garvey Elevator Site Hastings Nebraska December
HGL 2011 Final Remedial Investigation Report Garvey Elevator Site Hastings Nebraska April
US EPA Region 7 Garvey Groundwater Flow Modeling Memo 20 July 2012
HGLmdashGroundwater Flow Modeling Technical Memorandum Garvey Elevator Site ndash Hastings NE
McDonald MG and AW Harbaugh 1988 A Modular Three-dimensional Finite-difference Groundwater Flow Model US Geological Survey TWRI Chapter 6-A1
Pollock DW 1994 Userrsquos Guide for MODPATHMODPATH-PLOT Version 3A particle tracking post-processing package for MODFLOW the U S Geological Survey finite-difference ground-water flow model U S Geological Survey Open-File Report 94shy464
Rumbaugh JO and DB Rumbaugh 1998 Groundwater Vistas Version 516 Environmental Simulations
US Army Corps of Engineers (USACE) 1990 Final Groundwater Modeling Report Hastings East Industrial Park Remedial InvestigationFeasibility Study Hastings Nebraska August
Zheng C 1990 MT3D A modular three-dimensional transport model for simulation of advection dispersion and chemical reactions of contaminants in groundwater systemsrdquo Report to the US Environmental Protection Agency Robert S Kerr Environmental Research Laboratory Ada OK
Zheng Chunmiao and Wang P Patrick 1999 ldquoMT3DMS A modular three-dimensional multispecies transport model for simulation of advection dispersion and chemical reactions of contaminants in groundwater systems documentation and userrsquos guiderdquo Contract Report SERDP-99-1 US Army Engineer Research and Development Center Vicksburg Mississippi
Attachments
Attachment 1 Tables Attachment 2 Figures
US EPA Region 7 Garvey Groundwater Flow Modeling Memo 21 July 2012
This page was intentionally left blank
ATTACHMENT 1 TABLES
Table 51 Table 61 Table 71 Table 72
Contact Elevations of the Major Lithologic Units Water Level Calibration Statistics Groundwater Data Summary Projected Durations to Meet MCLs Remedial Alternatives Summary
This page was intentionally left blank
Table 51 Contact Elevations of the Major Lithologic Units
Garvey Elevator Site Hastings Nebraska
Elev Depth Elev Depth Elev Depth Elev Thickne Depth Elev Depth Elev Thickne Depth Elev Depth Elev (ft) (ft) (ft bgs) (ft amsl) (ft bgs) (ft amsl) (ft bgs) (ft amsl) (ft bgs) (ft amsl) (ft) (ft bgs) (ft amsl) (ft bgs) (ft amsl) (ft) (ft bgs) (ft amsl) (ft bgs) (ft amsl)
OU1 MW-1A 270590926 2080164407 125 192580 645 186130 995 182630 -- -- -- -- -- -- -- -- -- -- -- --OU1 MW-2A 271240410 2080539870 1235 192733 685 185883 835 184383 -- -- -- -- -- -- -- -- -- -- -- --OU1 MW-3ABDE 270755170 2080773994 243 193099 595 187149 111 181999 134 179707 1 135 179607 155 177530 1 156 177430 2385 169249 OU1 MW-4AB 270341995 2080827075 132 193184 585 187334 89 184284 -- -- -- -- -- -- -- -- -- -- -- --OU1 MW-5ABD 269943836 2080752777 188 193006 635 186656 885 184156 132 179785 1 133 179685 -- -- -- -- -- -- --OU1 MW-6ADE 271237345 2081216968 238 192948 735 185598 935 183598 129 180046 1 130 179946 155 177446 5 160 176946 -- --OU1 MW-7AB 269088475 2079699700 135 192092 55 186592 90 183092 -- -- -- -- -- -- -- -- -- -- -- --OU1 MW-8A 271214203 2079067544 132 194080 608 188000 90 185080 -- -- -- -- -- -- -- -- -- -- -- --OU1 MW-9A 272193736 2080628145 116 192540 70 185540 90 183540 -- -- -- -- -- -- -- -- -- -- -- --OU2 MW-10AB 272535399 2081973782 130 192381 65 185881 85 183881 125 179870 1 126 179770 -- -- -- -- -- -- --OU2 MW-11A 271826499 2083509070 110 191228 70 184228 90 182228 -- -- -- -- -- -- -- -- -- -- -- --OU2 MW-12AC 270399710 2085390335 170 191713 50 186713 805 183663 -- -- -- -- -- -- -- -- -- -- -- --
OU2 (new) MW-12D 270399901 2085403521 178 191698 57 185998 88 182898 120 179698 7 127 178998 -- -- -- -- -- -- --OU1 MW-13CE 270368902 2081015694 238 192874 75 185374 90 183874 130 179874 1 131 179774 -- -- -- -- -- 235 169374 OU2 MW-14A 270968774 2084137323 1085 190956 695 184006 895 182006 -- -- -- -- -- -- -- -- -- -- -- --OU2 MW-16AC 267054564 2084286931 160 191545 50 186545 80 183545 -- -- -- -- -- -- -- -- -- -- -- --OU2 MW-17ACD 268796556 2082958916 200 190185 60 184185 85 181685 -- -- -- -- -- -- -- -- -- -- -- --OU2 MW-18ACD 268693818 2085938384 205 191064 55 185564 95 181564 1155 179514 1 1165 179414 -- -- -- -- -- -- --OU1 MW-19AC 270955133 2081332850 165 192781 61 186681 895 183831 128 179981 8 136 179181 150 177781 2 152 177581 -- --OU1 MW-20ACDE 270597445 2081202233 255 192797 54 187397 87 184097 129 179897 7 136 179197 150 177797 2 152 177597 236 169197 OU1 MW-30ACDE 270271723 2081095430 255 192903 70 185903 85 184403 1255 180353 7 1325 179653 146 178303 2 148 178103 237 169203 OU1 MW-31AC 269550764 2080816035 165 193008 63 186708 883 184178 -- -- -- -- -- -- -- -- -- -- -- --OU1 MW-33 271206314 2079068057 255 194074 84 185674 95 184574 1385 180224 55 144 179674 167 177374 675 17375 176699 240 170074
OU1 (new) MW-47BCD 270781240 2081046150 1705 192995 -- -- -- -- 1315 179845 15 133 179695 151 177895 2 153 177695 -- --OU1 (new) MW-48BCD 270645490 2080859850 171 192887 -- -- -- -- 129 179987 35 1325 179637 1498 177907 5 1548 177407 -- --OU1 (new) MW-49BCD 270039470 2080890150 171 192934 -- -- -- -- 1305 179884 15 132 179734 1495 177984 4 1535 177584 -- --OU1 (new) MW-50BCD 270307290 2080987510 170 192925 -- -- -- -- 1275 180175 5 1325 179675 1495 177975 1 1505 177875 -- --OU1 (new) MW-51BCD 270487290 2080899910 171 192943 -- -- -- -- 1268 180263 52 132 179743 1495 177993 45 154 177543 -- --OU2 (new) MW-41D1 266698811 2089673996 171 191524 62 185324 92 182324 126 178899 2 128 178699 148 176699 2 150 176499 -- --OU2 (new) MW-41D2 266708267 2089674259 206 191499 62 185299 92 182299 126 178899 2 128 178699 148 176699 2 150 176499 -- --OU2 (new) MW-42DE 269168074 2100135574 215 190207 66 183607 98 180407 124 177823 10 134 176823 -- -- -- -- -- -- --OU2 (new) MW-43DE 265395404 2097605590 2215 190835 48 186035 89 181935 -- -- -- -- -- 153 175545 2 155 175345 -- --OU2 (new) MW-44DE 267552324 2105258206 214 188530 63 182230 92 179330 119 176630 3 122 176330 1425 174280 75 150 173530 -- --OU2 (new) MW-45CD 270056199 2083476668 170 190982 50 185982 89 182082 112 179746 3 115 179446 -- -- -- -- -- -- --OU2 (new) MW-46D1 269055295 2089632928 167 191097 61 184997 94 181697 121 179003 3 124 178703 148 176303 6 154 175703 -- --OU2 (new) MW-46D2 269063843 2089632455 202 191103 61 185003 94 181703 121 179003 3 124 178703 148 176303 6 154 175703 -- --
Hwy 6 MW-104ACD 271937379 2088225393 235 190901 472 186181 936 181541 115 179401 12 127 178201 -- -- -- -- -- 220 168901 Hwy 6 MW-105ACD 270069428 2089866388 257 191679 68 184879 105 181179 123 179379 10 133 178379 -- -- -- -- -- 2455 167129 Hwy 6 MW-106ACD 270452369 2098166199 255 190664 77 182964 1075 179914 130 177664 5 135 177164 -- -- -- -- -- 248 165864 OU1 I-1 270863284 2080138346 175 19212 -- -- -- -- -- -- -- -- -- -- -- -- -- -- -- --OU1 I-2 270331729 2080131336 175 19200 -- -- -- -- -- -- -- -- -- -- -- -- -- -- -- --OU1 HTW-40 271217856 2079157749 -- 19395 -- -- -- -- -- -- -- -- -- -- -- -- -- -- -- --
Hwy 6 HTW-100 273075261 2082012337 255 19066 770 182964 1076 179904 130 177664 55 -- -- -- -- -- -- -- -- --
Surface Elevation -
Surficial Soil Peoria and
Loveland Loess
Very Fine Sand Silty Fine Sand
Clayey Silt
Silty Sand and Gravel (contains Upper Aquifer)
Upper Aquitard Medial Aquifer
Monitoring Wells
Boring DepthEasting(2)Northing(2)
Well ID Lower Aquitard Lower AquiferSite
Top of Lithologic and Hydrostratigraphic Units(1)
Decomposed Weathered
Shale
Sheet 1 of 2
Table 51 Contact Elevations of the Major Lithologic Units
Garvey Elevator Site Hastings Nebraska
Elev Depth Elev Depth Elev Depth Elev Thickne Depth Elev Depth Elev Thickne Depth Elev Depth Elev (ft) (ft) (ft bgs) (ft amsl) (ft bgs) (ft amsl) (ft bgs) (ft amsl) (ft bgs) (ft amsl) (ft) (ft bgs) (ft amsl) (ft bgs) (ft amsl) (ft) (ft bgs) (ft amsl) (ft bgs) (ft amsl)
Surface Elevation -
Surficial Soil Peoria and
Loveland Loess
Very Fine Sand Silty Fine Sand
Clayey Silt
Silty Sand and Gravel (contains Upper Aquifer)
Upper Aquitard Medial Aquifer Boring DepthEasting(2)Northing(2)
Well ID Lower Aquitard Lower AquiferSite
Top of Lithologic and Hydrostratigraphic Units(1)
Decomposed Weathered
Shale
OU1 (new) SB-09 270168160 2080517340 13160 192984 59 187084 90 183984 130 179984 1 131 179884 -- -- -- -- -- -- --OU1 (new) SB-13 269654838 2080309785 14340 192973 67 186273 87 184273 130 179973 3 133 179673 -- -- -- -- -- -- --OU1 (new) SB-29 270864398 2081035503 14215 192989 68 186189 90 183989 -- -- -- -- -- -- -- -- -- -- -- --OU1 (new) SB-32 271237915 2079979855 14865 192475 66 185875 92 183275 -- -- -- -- -- 148 177675 297 149 177575 -- --OU1 (new) SB-33 269199799 2080682378 14085 193446 63 187146 93 184146 -- -- -- -- -- -- -- -- -- -- -- --OU1 (new) SB-39 271537352 2081550026 13560 192583 64 186183 89 183683 -- -- -- -- -- -- -- -- -- -- -- --OU2 (new) TS1-01 269515615 2089614339 864 191569 70 184569 86 182969 -- -- -- -- -- -- -- -- -- -- -- --OU2 (new) TS1-03 268313868 2089646765 16736 191251 66 184651 86 182651 1195 179301 05 120 179251 148 176451 5 153 175951 -- --OU2 (new) TS1-05 267030127 2089665004 16681 191624 75 184124 87 182924 117 179924 2 119 179724 153 176324 308 155 176124 -- --OU2 (new) TS2-02 271456113 2097510251 13680 191015 73 183715 104 180615 134 177614 3 137 177314 -- -- -- -- -- -- --OU2 (new) TS2-04 268939527 2097554155 16746 190360 70 183360 89 181460 126 177760 9 135 176860 152 175160 306 154 174960 -- --OU2 (new) TS2-05 267717573 2097569698 17161 190143 62 183943 99 180243 -- -- -- -- -- 157 174443 2 159 174243 -- --OU2 (new) TS2-06 266250085 2097592053 11980 190501 60 184501 100 180501 -- -- -- -- -- -- -- -- -- -- -- --OU2 (new) TS3-02 269400264 2102787273 15690 189415 68 182615 96 179815 125 176915 7 132 176215 147 174715 297 150 174415 -- --OU2 (new) TS3-05 265786308 2102812115 14380 189056 67 182356 96 179456 1195 177106 1 1205 177006 129 176156 261 132 175856 -- --OU2 (new) TS4-02 267112179 2105261928 17031 188448 64 182048 96 178848 116 176848 3 119 176548 141 174348 284 143 174148 -- --
Hwy 6 TS3-01 271941141 2089537242 1453 19153 720 184334 1125 180284 1256 178974 29 1285 178684 -- -- -- -- -- -- --Hwy 6 TS3-02 271499828 2089579255 1414 19139 692 184466 102 181186 1227 179116 59 1286 178526 -- -- -- -- -- -- --Hwy 6 TS3-03 270957676 2089591662 1440 19087 710 183767 941 181457 1178 179087 56 1234 178527 -- -- -- -- -- -- --Hwy 6 TS3-04 270411434 2089597601 1403 19088 663 184254 1006 180824 1167 179214 61 1228 178604 -- -- -- -- -- -- --Hwy 6 TS3-05 272464675 2089528557 1718 19173 685 184883 1032 181413 123 179433 7 130 178733 -- -- -- -- -- -- --Hwy 6 TS4-01 271882569 2095813356 1658 19042 650 183920 987 180550 1238 178040 52 129 177520 -- -- -- -- -- -- --Hwy 6 TS4-03 270996450 2096068696 1171 19050 810 182400 966 180840 1154 178960 12 1166 178840 -- -- -- -- -- -- --Hwy 6 TS5-01 271766686 2092074297 1562 19016 648 183680 905 181110 1163 178530 53 1216 178000 -- -- -- -- -- -- --Hwy 6 TS5-03 270732978 2092105115 1389 19008 709 182990 923 180850 1147 178610 46 1193 178150 -- -- -- -- -- -- --Hwy 6 TS5-05 272269991 2092059880 1717 19045 425 186200 942 181030 1153 178920 83 1236 178090 -- -- -- -- -- -- --
Electrical Conductivity Borings
(1)Surface elevation listed for nested monitoring wells (ABCDE) is the surface elevation of the A well Unit elevations are from the boring logs in which they were recorded (2)State Plane Coordinate system Nebraska 2600 amsl - above mean seal level bgs - below ground surface Elev - elevation ft - feet Hwy 6 - Wellsborings installed for the West Highway 6 and Highway 281 Site Investigations -- - not applicable or not available OU1 - Operable Unit 1 these wells are associated with on-site groundwater OU1 (new) - Operable Unit 1 wellsborings installed in AprilMay 2010 for the RI OU2 - Operable Unit 2 these wells are associated with off-site groundwater OU2 (new) - Operable Unit 2 Monitoring wellsborings installed in AprilMay 2010 for the RI
Sheet 2 of 2
Table 61 Water Level Calibration Statistics
Garvey Elevator Site Hastings Nebraska
Name Layer
Target Water Level Elevation - Sept 2011
(feet amsl) Model
Water Level Error
Residual MW-12U 1 18156 1814424820 117518 MW-100A 1 181542 1814519751 0900249 MW-16U 1 181534 1814385390 095461 MW-10A 1 181528 1814182851 1097149 MW-1A 1 181525 1815209270 004073 MW-2A 1 181519 1815393838 -0203838 MW-05 1 181516 1814358176 0801824
MW-102A 1 18151 1813770877 1329123 MW-13U 1 181507 1813730081 1339919 MW-7A 1 181504 1815242607 -0202607 MW-04 1 181487 1814376802 0493198
MW-17U 1 181486 1814230581 0629419 MW-07 1 181475 1814008616 0741384 MW-03 1 181471 1813907473 0802527 MW-02 1 181468 1813743101 0936899 MW-08 1 181465 1814180036 0469964 MW-06 1 18146 1814237391 0362609
MW-10U 1 181453 1814016597 0513403 MW-14U 1 181451 1814457639 0052361 MW-6A 1 181444 1814334070 010593 MW-01 1 18144 1814062502 0337498
MW-11A 1 181429 1812347804 1942196 MW-11U 1 181411 1814658764 -0548764 MW-10B 1 181372 1814173608 -0453608 MW-3A 1 181357 1813385654 0184346 MW-5B 1 181339 1813199091 0190909 MW-15U 1 181326 1814948966 -1688966 MW-47B 1 181316 1812784852 0375148 MW-50B 1 181314 1812748409 0391591 MW-4A 1 18131 1812992455 0107545 MW-3B 1 181308 1813389494 -0309494 MW-5A 1 181307 1813165365 -0095365 MW-19A 1 181301 1813252060 -024206 MW-4B 1 181298 1812954715 0025285 MW-31A 1 181289 1812885039 0004961 MW-51B 1 181236 1812125173 0234827 MW-49B 1 181227 1812349041 -0079041 MW-48B 1 18122 1812098306 0101694 MW-30A 1 181194 1812183956 -0243956 MW-09U 1 181194 1814076063 -2136063 MW-20A 1 181179 1812309176 -0519176 MW-14A 1 181061 1810498570 011143 MW-17A 1 18098 1809745419 0054581
Sheet 1 of 3
Table 61 Water Level Calibration Statistics
Garvey Elevator Site Hastings Nebraska
Name Layer
Target Water Level Elevation - Sept 2011
(feet amsl) Model
Water Level Error
Residual MW-12A 1 180706 1807353224 -0293224 MW-16A 1 180683 1806758847 0071153 MW-18A 1 18062 1805744494 0455506 MW-104A 1 180386 1804035180 -017518 MW-105A 1 179994 1799915974 0024026 MW-106A 1 178857 1788240807 0329193 MW-18C 3 180409 1804214829 -0124829 MW-12C 3 180568 1805675664 0004336 MW-16C 3 180625 1806232799 0017201 MW-45C 3 180888 1809089044 -0209044 MW-17C 3 180918 1809113670 006633 MW-47C 3 181047 1810251020 021898 MW-101B 3 181066 1811509656 -0849656 MW-102B 3 181092 1811706686 -0786686 MW-13C 3 181107 1811204349 -0134349 MW-51C 3 181177 1811366716 0403284 MW-50C 3 18119 1811832475 0067525 MW-49C 3 181235 1812474567 -0124567 MW-48C 3 18125 1812312538 0187462 MW-7B 3 181497 1815042613 -0072613
MW-09M 5 181527 1813657691 1612309 MW-3D 5 181479 1814354375 0435625 MW-3E 5 181379 1814210888 -0420888 MW-5D 5 181366 1813572038 0087962 MW-47D 5 181365 1812738611 0911389 MW-49D 5 18134 1813402643 -0002643 MW-48D 5 181323 1812926923 0303077 MW-50D 5 181323 1812962182 0267818 MW-31C 5 181311 1813127460 -001746 MW-51D 5 181302 1812256458 0763542 MW-13E 5 181234 1812181638 0158362
MW-100D 5 181223 1813629694 -1399694 MW-100C 5 181216 1813634399 -1474399 MW-30C 5 181208 1811949179 0130821 MW-19C 5 1812 1812353637 -0353637 MW-20D 5 181196 1811924735 0035265 MW-30D 5 181188 1811949179 -0069179 MW-20E 5 181155 1811924735 -0374735 MW-16M 5 181133 1811653909 -0323909 MW-13M 5 181117 1811940971 -0770971 MW-30E 5 181115 1811949179 -0799179 MW-11M 5 181097 1814139713 -3169713 MW-17D 5 180923 1808958032 0271968
Sheet 2 of 3
Table 61 Water Level Calibration Statistics
Garvey Elevator Site Hastings Nebraska
Name Layer
Target Water Level Elevation - Sept 2011
(feet amsl) Model
Water Level Error
Residual MW-20C 5 180892 1811924735 -3004735 MW-45D 5 180884 1809292039 -0452039 MW-12D 5 180575 1805738454 0011546 MW-18D 5 180413 1804194578 -0064578 MW-104D 5 180137 1801272389 0097611 MW-104C 5 180135 1801269033 0080967 MW-46D1 5 179796 1797768438 0191562 MW-105D 5 179794 1797798970 014103 MW-46D2 5 179792 1797771831 0148169 MW-105C 5 179791 1797803499 0106501 MW-41D2 5 179702 1797046783 -0026783 MW-41D1 5 179697 1797044368 -0074368 MW-106C 5 178531 1785334635 -0024635 MW-106D 5 178527 1785320367 -0050367 MW-43D 5 178387 1783880124 -0010124 MW-43E 5 178386 1783888909 -0028909 MW-42D 5 178183 1781770173 0059827 MW-42E 5 178182 1781753639 0066361 MW-44D 5 177409 1774079493 0010507 MW-44E 5 177407 1774078775 -0008775
Residual Mean 0046933 Res Std Dev 0743461 Sum of Squares 6048817
RMS Error 0744941 Min Residual -3169713 Max Residual 1942196
Number of Observations 109 Range in Observations 4362
Scaled Std Dev 0017044 Scaled Abs Mean 0010505
Scaled RMS 0017078 Notes
amsl - above mean sea level
Sheet 3 of 3
Table 71 Groundwater Data Summary Projected Durations to Meet MCLs
Garvey Elevator Site Hastings Nebraska
Well Data Collection Range TCE Concentration μgL Estimated Date to
Reach MCLs Duration from June 2012 yrsHigh Low
MW-3A May 1997 - March 2012 20000 11 already achieved NA MW-3B May 1997 - March 2012 23000 74 Nov 2045 33 MW-3D April 1997 - March 2012 5 05 already achieved NA MW-3E April 1997 - March 2012 4 05 already achieved NA MW-4A May 1997 - March 2012 18000 43 Sept 2013 1 MW-4B May 1997 - March 2012 29000 690 Dec 2042 30 MW-5A May 1997 - March 2012 24000 47 already achieved NA MW-5B May 1997 - March 2012 15000 12 Jan 2017 5 MW-5D April 1997 - March 2012 4 05 already achieved NA MW-13C May 1997 - March 2012 18000 28 Nov 2061 49 MW-13E May 1997 - March 2012 5 05 already achieved NA
RW-1 1999 - 2011 490 10 May 2016 4 RW-2 1999 - 2011 3200 5 Nov 2021 9 RW-3 1999 - 2011 3800 5 Feb 2024 12 RW-4 1997 - 2011 5500 5 June 2016 4 RW-5 1999 - 2011 5500 5 achieved NA RW-6 1999 - 2011 590 10 Oct 2018 6 RW-7 1995 - 2011 1000 5 Jan 2025 13 RW-8 1998 - 2011 380 5 March 2047 35
Notes
Dates and concentration data are from the site database projections to reach MCLs are based on curves fitted to data plots as provided by Dr Brian
Zurbuchen via email on June 11 2012
μgL - micrograms per liter
Sheet 1 of 1
Table 72 Remedial Alternatives Summary
Garvey Elevator Site Hastings Nebraska
Remedial Alternative Assumptions Remediation
Times Notes
OU 1
SG-1-No Action All extraction wells off 30 years
This scenario was not explicity modeled Based on the remedition duration predicted for SG2 remediation time will be greater than 30 years However for cost estimating purposes a 30-year duration will be used
SG2-- Maintain and Operate Existing GET System
No treatment of downgradient plume
30 years This scenario was not explicity modeled but remediation time was estimated based on contaminant concentration trends (see Table 71)
SG3--In Situ Treatment Via Groundwater Amendments
Area within gt500 ugL set to 00 on-site treatment system shut off
15 years Remediation time estimates are for OU1 (on-site) plume using multiple injection treatments and existing GET system shut off
SG4-- Maintain and Operate Existing GET System and Treatment Via Groundwater Amendments
Pump and treat system operating groundwater within concentrations gt500 ugL set to 00
10 years Remediation time estimates are for OU1 (on-site) plume using multiple injection treatments and existing GET system operating
OU 2
G1-No Action Pump and treat system operating no treatment of downgradient plume
30 years This scenario was not explicity modeled For cost estimating purposes a 30-year duration will be used
G2-Groundwater Recovery Treatment and Discharge at Leading Edge of Plume
On-site pump and treat system operating
100 years Based upon modeling results for more active remedies the remediation times for both the OU 1 and OU 2 plumes would exceed 100 years This scenario was not explicity modeled
G3a-Groundwater Recovery Treatment and Discharge at mid point and Leading Edge of Plume
On-site pump and treat system operating
75 years
Modeled duration ranges from 75 to 90 years
G3b-Groundwater Recovery Treatment and Discharge at two transects and Leading Edge of Plume
On-site pump and treat system operating
53 years
G4a-In Situ treatment at midpoint of plume and Groundwater Recovery Treatment and Discharge at leading edge of plume
On-site pump and treat system operating
75 years
Same as G3 but a treatment zone replaces the recovery wells near the midpoint of the plume Modeled duration ranges from 75 to 90 years
G4b-In Situ treatment at two transects near core of plume and Groundwater Recovery Treatment and Discharge at leading edge of plume
On-site pump and treat system operating
56 years Same as G3 but two treatment zones replace the recovery wells near the midpoint of the plume
Notes
μgL - micrograms per liter
Sheet 1 of 1
This page was intentionally left blank
ATTACHMENT 2 FIGURES
Figure 31 Carbon Tetrachloride Isoconcentrations Upper Aquifer Zone AB Figure 32 Carbon Tetrachloride Isoconcentrations Medial Aquifer Zone C Figure 33 Carbon Tetrachloride Isoconcentrations Lower Aquifer Zone DE
Figure 51 Model Domain and Boundary Conditions Figure 52 Vertical Discretization of Model Figure 53 Elevation of the Model Base Figure 54 Elevation of the Top of the Lower Aquifer Figure 55 Isopach Map of the Lower Confining Unit Figure 56 Elevation of the Base of the Medial Aquifer Figure 57 Isopach of Upper Aquifer Figure 58 Elevation of the Base of the Upper Aquifer Figure 59 Location of Recovery Wells in the Shallow Aquifer Figure 510 Location of Recovery Wells in the Medial Aquifer Figure 511 Location of Injection and Municipal Wells in the Lower Aquifer Figure 512 Initial Concentrations of Carbon Tetrachloride in the Shallow Aquifer Figure 513 Initial Concentrations of Carbon Tetrachloride in the Medial Aquifer Figure 514 Initial Concentrations of Carbon Tetrachloride in the Lower Aquifer
Figure 61 Error Residuals Versus Measured Water Levels Figure 62 Measured Water Levels Versus Predicted Water Level Elevations Figure 63 Error Residuals for the Shallow Aquifer in the Vicinity of the Garvey Elevator
Site Figure 64 Error Residuals for the Shallow Aquifer over the Model Domain Figure 65 Error Residuals for the Medial Aquifer over the Model Domain Figure 66 Error Residuals for the Lower Aquifer in the Vicinity of the Garvey Elevator
Site Figure 67 Error Residuals for the Lower Aquifer over the Entire Model Domain Figure 68 Calibrated Hydraulic Conductivities of the Shallow Aquifer Figure 69 Calibrated Hydraulic Conductivities of the Medial Aquifer Figure 610 Calibrated Hydraulic Conductivities of the Lower Aquifer Figure 611 Calibrated Hydraulic Conductivities of the Upper Aquitard Figure 612 Calibrated Hydraulic Conductivities of the Lower Aquitard Figure 613 Calibrated Potentiometric Surface of the Shallow Aquifer Figure 614 Calibrated Potentiometric Surface of the Medial Aquifer Figure 615 Calibrated Potentiometric Surface of the Lower Aquifer Figure 616 Particle Tracking Analysis to Estimate Travel Time
Figure 71 Initial Concentrations for Alternative SG3 Figure 72 Capture Zone Analysis in the Shallow Aquifer for Alternative SG3 Figure 73 Capture Zone Analysis in the Medial Aquifer for Alternative SG3 Figure 74 Alternative G2 ndash Proposed Recovery Wells Medial Aquifer
ATTACHMENT 2 FIGURES (continued)
Figure 75 Alternative G2 ndash Proposed Recovery Wells Lower Aquifer Figure 76 Preliminary Locations for Leading Edge Recovery Wells and Groundwater
Treatment Building ndash Alternative G2 Figure 77 Alternative G3ab ndash Proposed Recovery Wells Medial Aquifer Figure 78 Alternative G3a ndash Proposed Recovery Wells Lower Aquifer Figure 79 Preliminary Locations for Mid-Plume and Leading Edge Recovery Wells and
Groundwater Treatment BuildingmdashAlternative G3 Figure 710 Alternative G3b ndash Proposed Recovery Wells Lower Aquifer Figure 711 Alternative G3b ndash Relative Positions of Proposed Recovery Wells Medial and
Lower Aquifer Figure 712 Alternative G4a ndash Proposed Treatment Curtain and Recovery Wells Lower
Aquifer Figure 713 Preliminary Locations for Mid-Plume Injection Wells Leading Edge Recovery
Wells and Groundwater Treatment Building ndash Alternative G4 Figure 714 Alternative G4b ndash Proposed Treatment Curtains and Recovery Wells Lower
Aquifer Figure 715 Alternative G4b ndash Relative Positions of Proposed Recovery Wells and
Treatment Curtains
5
5
5
5
5
50
100 500
MW-6A SB-39 HGLmdashGroundwater Flow Modeling Technical MemorandumMW-2AHTW 40 (98)(ND)MW-8A MW47B ( Garvey Elevator SitemdashHastings NE(ND)
(59) SB-38
MW-19APSUS PU PPPUUU ( Figure 31 (70)MW-33 MW-3AB
Carbon Tetrachloride in the(ND53) MW49B MW-20A
+UP+UPPPP+U+U+UPPPPUUUU+UP+UPPPP+U+U+U(43) Upper Aquifer Zone AB(10)
MW-1A PU MW50B(ND) +UP+UPPPP+U+U+U September 2011 Sampling(84)
PPUUMW-4AB PPUU MW-13CE +++++UPUPPPPUUU (21640)
MW-30A (160)+UP+UPPPP+U+U+U LegendPPPUUU
1000 MW51B (1200) MW-5AB
(4119J)
Garvey Property BoundaryMW-7AB MW-31A (ND) (75) (
PPUU MW48B RailroadSB-33 (680)
Inset Ntilde Monitoring Well Location MW-47B MW-10A
(59) (ND) Multilevel Well MW-9A MW-6AHTW 40 MW-10B(ND) (98)
(ND) MW-11A S Hydraulic Conductivity
MW-33 UPPUMW-2A MW-19AU MW-14A(ND) P
(70) PU (ND) A West Highway 6 amp Highway 281 Site MW-12A AMW-106AMW-20A MW-104AMW-3A MW-8A (ND) Monitoring WellU UUU (ND)PSSU P PPP (10)(ND) (ND)(ND) U
UUUUU PUUUUP PPPPPPPPPPPPPPPPPPPPPPPUUUUPUPPPPUUUUU MW-13CE
UUUU Carbon Tetrachloride ConcentrationMW-3B MW-105A A (190)PPP A (ND)
UUUUUUUUU(53) MW-30A in micrograms per liter (microgL)PPUUPPPUUUPPPPPUUUUU
MW-12DMW-1A (160) MW-42 DEMW-45CD(ND)
MW-50B MW-49B MW-51B Carbon Tetrachloride Isoconcentration(84) PPUUPPUU(43)
PPUU(1200)
Contour (microgL)PPPUUU PPPUUUMW-46 D1D2MW-7B (5)(ND)
(Dashed Lines are Estimated)MW-7A (ND)
MW-5A (41)
MW-4A (21) MW-4B (640)
MW-48B (680)
MW-17A (ND)
MW-16A (ND) UUPP
MW-18A (ND)
MW-41 D1D2 UUPP
MW-44 DE UUPP
MW-5B
MW-31A (75)
(19)
MW-43 DE UUPP Notes
(ND) Nondetect
0 2500 5000
Feet sup3 Filename XEPA009GarveyGW_Flow_Tech_Memo Carbon_TetChl_UpperAquifer_ABmxd Project EP903401220202 Revised 061312 ST Source ENSR GDB 2008 DNR
100
5
100
SB-39MW-6AHTW 40 HGLmdashGroundwater Flow Modeling Technical Memorandum MW47C SB-38MW-33 MW-2A (62) ( Garvey Elevator SitemdashHastings NE
UUUPSUS P PPP (
U
Figure 32MW-8A MW-3ABDE MW-19C (ND) Carbon Tetrachloride in the
MW-1A +++++PPPP UPUPPPPUUUUUUU
+UP+UPPPP+U+U+U Medial Aquifer Zone CPU MW-20C +UP+UPPPP+U+U+U (ND) September 2011 SamplingMW49C
UU(ND) PPUU +++++PPPPPPPUUUUU MW50C
(ND) +UP+UPPPP+U+U+UPPPUUU LegendMW-13C
MW-4AB (130) MW-30C
MW-5AB (ND) MW48C MW51C
(ND) (ND) Garvey Property Boundary SB-33 (
MW-7AB PPUU MW-31C (ND) Railroad
Inset Ntilde Monitoring Well Location MW-47CMW-9A MW-10AB Multilevel Well(62)
HTW 40
MW-6A S Hydraulic Conductivity WellMW-11AMW-33 PPUUMW-2A
MW-19CUP (ND) P West Highway 6 amp Highway 281 SiteU MW-14A A A Monitoring WellMW-20C MW-12C MW-106CMW-104CPSS P PPP
U (ND) (ND) (90) (ND)
MW-8A MW-13C U U UUU
PMW-3ABDE PPPPPPPPUUUUPU (130) Carbon Tetrachloride ConcentrationPU UUUU UUUUUUUUUU
MW-105C A (190)MW-1A UUUUUUUUUPPPPPPPPPPPPPPPPPPP MW-30C PPPUUU MW-12D A (200) in micrograms per liter (microgL)
MW-49C UUUUPUPPPPUUPU (ND) UPPU Old Rolls MW-42 DEPP (13)(ND) Carbon Tetrachloride Isoconcentration MW-45C MW-50C (ND)
MW-51C (ND) PPUU PPUU PPUU (5) Contour (microgL)(ND)
UUU PPP MW-46 D1D2
PPP UUUMW-48C (Dashed Lines are Estimated)5MW-7AB (ND)
MW-4AB MW-17C MW-18C(ND) MW-44 DE Domestic Irrigation W ater Wells(81)MW-5AB
PPUUMW-31C MW-16C (ND)
PPUU(ND) MW-41 D1D2
PPUU
Notes MW-43 DE PPUU
(ND) Nondetect
0 2500 5000
Feet sup3 FilenameXEPA009GarveyGW_Flow_Tech_Memo Carbon_TetChl_Medial_Aquifer_Cmxd Project EP903401220202 Revised 061312 ST Source ENSR GDB 2008 DNR
50
5
5
50 100
MW-6D SB-39 HGLmdashGroundwater Flow Modeling Technical MemorandumHTW 40 (ND) SB-38MW-3DE ( Garvey Elevator SitemdashHastings NE (NDND)
UUUUPSUS P PPP MW-19AC( Figure 33MW-2A MW-33 MW47D
U (ND)
Carbon Tetrachloride in theMW-8A PPPPUUUU P Lower Aquifer Zone DEUMW-1A MW-20DEPU P
(NDND)UPUU
September 2011 Sampling MW-13EPPUUPPPU (ND)
MW50D UPMW49D (ND) UUU(ND) PPP MW-30DE Legend MW51D (ND)
(ND)MW-4AB MW48D (ND)
MW-7AB MW-5D (ND) Garvey Property Boundary
MW-31C (ND)
PPUU
(
RailroadSB-33MW-3DE (NDND)
Inset Ntilde Monitoring Well Location MW-47D
MW-9A (ND) Multilevel Well HTW 40
MW-6D MW-10AB (ND)
MW-11A S Hydraulic Conductivity Well MW-33 MW-2A UPPU
PUMW-19AC West Highway 6 amp Highway 281 Site MW-14A APU
MW-20DE MW-106D A Monitoring WellMW-104DPSSU PU PPPUUU (NDND)
MW-12C (ND)(ND)MW-8A MW-13E PU
UUUUU (ND) Carbon Tetrachloride ConcentrationU PPPPPPPPUUUUPU (190)PPUUU
PPUPPPPPPPPPPPPPPPUUUUUP
UUUUU UUUUUUU PPP A MW-105DMW-1A in micrograms per liter (microgL) AMW-30DE
PPUUPPPUUUPPPPPUUUUU(52)
(NDND) MW-12DNew RollsMW-49D (ND) (ND)
Carbon Tetrachloride Isoconcentration(ND) MW-45D PPUUMW-51D (ND)
MW-46 D1PPUU PPUU Contour (microgL)MW-50D (ND) (5)(ND)
PPPUUU (770)PPPUUU MW-42 DMW-48D (Dashed Lines are Estimated)MW-4AB (4274)(ND)
MW-44DEMW-46 D2 MW-17D (320) (19ND)MW-7AB
MW-5D Domestic Irrigation W ater Wells(94) MW-18D PPUUMW-31C(ND) (21) MW-41 D1MW-5B MW-16C PPUU (ND)
PPUUMW-41 D2 (10) Notes
MW-43DE UUPP(ND18) (ND) Nondetect
0 2500 5000
Feet sup3 Filename XEPA009GarveyGW_Flow_Tech_Memo Carbon_TetChl_LoweR_Aquifer_Dmxd Project EP903401220202 Revised 061312 ST Source ENSR GDB 2008 DNR
_L _j I I I I _j_ I I I
I l --- I 111
1
__u_ I I
1 I ~ N ----y-
+ ~ I
II L _l e11111111111 I ---1 ~lJJ I n r Igt I Constant Head Boundariesj l _Q No Flow Sound aries I I l
~ r-- I - I middot r-
- fl+- L -
0 I J ~r-
Ll-D l Garvey Site I - ~t
Ill -J
l unJprm Spacing 25 eet U~iform S pacing 1 00 feet I Constant Head Boundaries
j
middotmiddot- ~ No Flow Sound aries
J
--=J--=11-~=======2~-----~3=========4~------5 M1les 0 05
Figure 51 Model Domain Gridding and Boundaries
Figure 52 Vertical Discretization of Model
1610
1620
1 6 2 0
1630
1 6 3 0
1640
1 6 4 0
1650
1 6 5 0
1660
1660
1670
1670
1680
1680
1690
17
1698
17013
16918
169198
169118
165864
167129
168901
169482
169872
169403
169347
169374
169448
Figure 53 Elevation of the Model Base (weathered shale of the Niobrara Formation)
1111
I I
-
N
+ 0 05
I I
I 1 l
I
1 l -
2 3 4 Miles
Figure 54 Elevation of the Top of the Lower Aquifer
Figure 55 Isopach Map of Lower Confining Unit (model Layer 4)
Figure 56 Elevation of the Base of the Medial Aquifer
Figure 57 Isopach of Upper Aquitard (model layer 2)
Figure 58 Elevation of the Base of the Upper Aquifer
I I I
~ ~ t--7 t bull I I I
r I l
I EW-01 f1-m I N I bull __ j
+ twtrl I I I rl bull I I I I J I I I -r-----
- middot-- - -- -- middot------__J_--
I --- 1 Feet I 0 500 1 000 2000 3000 4000 rooo I I I I
Figure 59 Location of Recovery Wells in the Shallow Aquifer
_l ________ l I I I -1 middot ] l ~----------middotj + I j
middotmiddot= middotmiddot- ---------L -- ---- ___ _ [_ __
r--------shy1
o--~oomiddoto~bull1~oo=o ======4~oomiddoto------middot~ooco=======43oobullo -------~oo~1
Figure 510 Location of Recovery Wells in the Medial Aquifer
I I r
~~ r -
L - - - -- -1--ltmiddot --I-
I -
---- L f+r
il I
J ---1
I
N
+
Figure 511 Location of Injection and Municipal Wells in the Lower Aquifer
Figure 512 Initial Concentrations of Carbon Tetrachloride in the Shallow Aquifer
Figure 513 Initial Concentrations of Carbon Tetrachloride in the Medial Aquifer
Figure 514 Initial Concentrations of Carbon Tetrachloride in the Lower Aquifer
-40
-30
-20
-10
00
10
20
30
40
17741 17828 17915 18002 18090 18177
Res
idua
l
Layer 1
Layer 3
Layer 5
Observed Value
Figure 61 Error Residuals Versus Measured Water Levels
Layer 1
Layer 3
18090
18177
Layer 5
Mod
el V
alue
17741 17828 17915 18002 18090 18177
18002
17915
17828
17741
Observed Value
Figure 62 Measured Water Levels Versus Predicted Water Levels
bull -020
N
+ 0
h I I
-----------~----j_ _______ ___ j_94-__ _ __ I ------------- t
011
bull 005
05
bull
I
Mile 1
Figure 63 Error Residuals for the Shallow Aquifer in the vicinity of the Garvey Elevator Site
Figure 64 Error Residuals for the Shallow Aquifer Over the Model Domain
-007 bull
N
+
il _ __ ~ II
t079 i
I 1 II_ --middot--middot- J_~=====-middot 1------~
~--1 000 r-----middot- -middotmiddot ____
-021 bull
-012 007 bull bull
l middot l02
I ~~~~====~---====~---Feet _ o ___ _ $-_~_0 _ ___ _ J000 _____ 3QQ_Q_ ---4lIJOLUlJ00----ltgt5ultOOO-- middott- middot ----
I
Figure 65 Error Residuals for the Medial Aquifer Over the Model Domain
0 250
N
+
044 bullbull -042
000 bull
027 bull
013
-)35 bull
Figure 66 Error Residuals for the Lower Aquifer in the Vicinity of the Garvey Elevator Site
Figure 67 Error Residuals for the Lower Aquifer in the Entire Model Domain
Figure 68 Calibrated Hydraulic Conductivities of the Shallow Aquifer (ftd) (model layer 1)
Figure 69 Calibrated Hydraulic Conductivities of the Medial Aquifer (ftd) (model layer 3)
Figure 610 Calibrated Hydraulic Conductivities of the Lower Aquifer (ftd) (model layer 5)
Figure 611 Calibrated Hydraulic Conductivities of the Upper Aquitard (ftd) (model layer 2)
Figure 612 Calibrated Hydraulic Conductivities of the Lower Aquitard (ftd) (model layer 4)
Figure 613 Calibrated Potentiometric Surface of the Shallow Aquifer (model layer 1)
Figure 614 Calibrated Potentiometric Surface of the Medial Aquifer (model layer 3)
Figure 615 Calibrated Potentiometric Surface of the Lower Aquifer (model layer 5)
Figure 616 Particle Tracking Analysis to Estimate Travel Time
Figure 71 Initial Concentrations for Alternative SG3
E3 E3 2000feet
Figure 72 Capture Zone Analysis in the Shallow Aquifer for Alternative SG3
E3 E3 E3 2000feet
Figure 73 Capture Zone Analysis in the Medial Aquifer for Alternative SG3
Figure 74 Alternative G2-Proposed Recovery Wells Medial Aquifer
Figure 75 Alternative G2- Proposed Recovery Wells Lower Aquifer
50
5 5
5
50 100
MW-3DE (NDND)
MW-47D MW-9A (ND)
HTW 40 MW-6D MW-10AB
(ND) MW-11A
MW-2AMW-33 UPPUPU
MW-19AC MW-14A APUMW-20DE MW-106DMW-104D(NDND) MW-12CPSSU (ND)PU PPPUUU PU (ND) MW-13E
HGLmdashGroundwater Flow Modeling Technical Memorandum Garvey Elevator Superfund SitemdashHastings NE
Figure 76 Preliminary Locations for Leading
Edge Recovery Wells and Groundwater Treatment Building-Alternative G2
Legend Garvey Property Boundary
Railroad
Ntilde Monitoring Well Location
Multilevel Well
S Hydraulic Conductivity Well
A West Highway 6 amp Highway 281 Site Monitoring Well
(190) Carbon Tetrachloride Concentration in micrograms per liter (microgL)
Carbon Tetrachloride Isoconcentration Treatment Building
Technical Blvd
MW-8A UUUU UUUUU
U PPPPPPPPUUUUPU UUUUUUPUP
UUUUUPPPPPPPPPPPPPPPPPP (ND)
PPPUUU A MW-105DMW-1A UU AMW-30DE PPUUPPPUUUPPPPPUUUUU
(52)(NDND) MW-12DNew Rolls Contour (Lower Aquifer) (microgL)MW-49D (5)(ND) (ND)
(ND) MW-45D (Dashed Lines are Estimated)PPUUMW-51D (ND) MW-46 D1PPUU PPUUMW-50D
(ND) (ND)
PPPUUU (770)PPPUUU MW-42 DMW-48D Domestic Irrigation W ater WellsMW-4AB (4274) MW-44DE(ND)
(19ND)MW-46 D2 MW-17D (320)MW-7AB Carbon Tetrachloride Isoconcentration(94)MW-5D
MW-18D PPUU (5) Contour (Upper Aquifer) (microgL)(21) MW-41 D1 MW-31C(ND)
MW-5B MW-16C PPUU (Dashed Lines are Estimated)(ND)
PPUUIdlewilde Rd
MW-41 D2 Recovery Wells (Medial)
Recovery Wells (Deep)
(10)
MW-43DE PPUU(ND18)
Recovery Well Piping
Treatment Building
Notes (ND) Nondetect
Blaine A
ve
Showboa t B
lvd
sup3 Filename XEPA009GarveyGW_Flow_Tech_Memo Carbon_TetChl_LoweR_Aquifer_Dmxd Project EP903401220202 Revised 061312 ST2500 5000 Source ENSR GDB 2008 DNR
Feet
0
Figure 77 Alternative G3ab-Proposed Recovery Wells Medial Aquifer
Figure 78 Alternative G3a- Proposed Recovery Wells Lower Aquifer
50
5 5
5
50 100
HGLmdashGroundwater Flow Modeling Technical Memorandum Garvey Elevator Superfund SitemdashHastings NE
Figure 79 Preliminary Locations for Mid-Plume and
Leading Edge Recovery Wells and Groundwater Treatment Building-Alternative G3
Legend Garvey Property Boundary
Railroad
Ntilde Monitoring Well Location MW-3DE (NDND)
Multilevel Well MW-47D
MW-9A (ND) Hydraulic Conductivity WellSHTW 40 MW-6D MW-10AB
(ND) West Highway 6 amp Highway 281 SiteMW-11A
MW-33 PPUUMW-2A PUA Monitoring Well
MW-19AC MW-14A APUCarbon Tetrachloride Concentration
Technical Blvd
MW-44DE (19ND) (Dashed Lines are Estimated)
MW-20DE (190)MW-106DPSSU PU PPPUUU MW-104DMW-12C(NDND) (ND)PU in micrograms per liter (microgL)(ND) MW-13EMW-8A
U UUUU UPUPPPPUUUUUUUUP UUUUU UUUPPPPPPPPPPPPPPPPPPPPPPPUUUUUU
(ND) PPPUUU A Treatment BuildingMW-105DMW-1A Carbon Tetrachloride IsoconcentrationMW-30DE A
PPUUPPPUUUPPPPPUUUUU(52)
(NDND) MW-12DNew Rolls Contour (Lower Aquifer) (microgL)MW-49D (5)(ND) (ND)(ND) MW-45D
MW-51D PPUU(ND)
PPUU PPUUMW-50D (ND)
MW-46 D1(ND) PPPUUU (770)
PPPUUU MW-42 D (4274)
MW-48D Domestic Irrigation W ater WellsMW-4AB (ND) MW-46 D2
MW-17DMW-7AB (320)(94) Carbon Tetrachloride IsoconcentrationMW-5D
MW-18D(ND) MW-31C (21) PPMW-41 D1
UU (5) Contour (Upper Aquifer) (microgL)MW-5B MW-16C UU (ND)PP (Dashed Lines are Estimated)PPUUIdlewilde Rd
MW-41 D2 Recovery Wells (Medial)(10)
MW-43DE UUPP(ND18) Recovery Wells (Deep)
Recovery Well Piping
Treatment Building
Notes (ND) Nondetect
Blaine A
ve
Showboa t B
lvd
sup3 Filename XEPA009GarveyGW_Flow_Tech_Memo Mid-Plume_Prelim_Loc Project EP903401220202 Revised 061312 RL2500 5000 Source ENSR GDB 2008 DNR
Feet
0
Figure 710 Alternative G3b-Proposed Recovery Wells Lower Aquifer
Figure 711 Alternative G3b-Relative Positions of Proposed Recovery Wells Medial and Lower Aquifers
Figure 712 Alternative G4a-Proposed Treatment Curtain and Recovery Wells Lower Aquifer
50
5 5
5
50 100
HGLmdashGroundwater Flow Modeling Technical Memorandum Garvey Elevator Superfund SitemdashHastings NE
Figure 713 Preliminary Locations for Mid-Plume
Injection Wells Leading Edge Recovery Wells and Groundwater Treatment Building
-Alternative G4
Legend Garvey Property Boundary
Railroad
Ntilde Monitoring Well Location MW-3DE (NDND)
MW-47D MW-9A (ND)
HTW 40 MW-6D MW-10AB
(ND)
S Elm
Ave
S Wabash A
ve
Multilevel Well
S Hydraulic Conductivity Well
A West Highway 6 amp Highway 281 Site Monitoring Well
MW-11AMW-33 UPPUMW-2A PU
MW-19AC MW-14A APUMW-20DE MW-106D Carbon Tetrachloride ConcentrationPU PPPUUU (190)PSSU MW-104D(NDND) MW-12C (ND)PU in micrograms per liter (microgL)(ND)
Treatment Building Technical B
lvd MW-13EMW-8A
UUUU UUUUUU PPPPPPPPUUUUPU UUUUU
UPUP
UUUUUPPPPPPPPPPPPPPPPPP (ND)
PPPUUU A MW-105DMW-1A UU Carbon Tetrachloride IsoconcentrationAMW-30DE PPUUPPPUUUPPPPPUUUUU
(52)(NDND) MW-12DNew Rolls Contour (Lower Aquifer) (microgL)MW-49D (5)(ND) (ND)
(ND) MW-45D (Dashed Lines are Estimated)PPUUMW-51D (ND) MW-46 D1PPUU PPUUMW-50D
(ND) (ND)
PPPUUU (770)PPPUUU MW-42 DMW-48D Domestic Irrigation W ater WellsMW-4AB (4274)(ND) MW-44DEMW-46 D2
(19ND)MW-17D (320)MW-7AB Carbon Tetrachloride Isoconcentration(94)MW-5D MW-18D PPUU (5) Contour (Upper Aquifer) (microgL)(21) MW-41 D1
MW-31C(ND) MW-5B MW-16C PPUU (Dashed Lines are Estimated)(ND)
PPUUIdlewilde Rd
MW-41 D2 Recovery Wells (Medial)
Recovery Wells (Deep)
(10) Injection Area 1 MW-43DE PPUUPermanent Injection Well Spacing 40 ft (ND18)
Total Injection Wells Installed 39 Recovery Well Piping Injection Area (40 ft spacing between the wells) Treatment Building
Notes (ND) Nondetect
Blaine A
ve
Showboa t B
lvd
S Baltim
ore Ave
sup3 Filename XEPA009GarveyGW_Flow_Tech_Memo G4_Prelim_Loc_Inj_Areamxd Project EP903401220202 Revised 061312 RL2500 5000 Source ENSR GDB 2008 DNR
Feet
0
Figure 714 Alternative G4b-Proposed Treatment Curtains and Recovery Wells Lower Aquifer
Figure 715 Alternative G4b-Relative Positions of Proposed Recovery Wells and Treatment Curtains

HGLmdashGroundwater Flow Modeling Technical Memorandum Garvey Elevator Site ndash Hastings NE
West Highway 6 amp Highway 281 Site
bull Municipal Well 9 = 342 gpm
532 Initial Conditions
As described in Section 32 carbon tetrachloride contamination is present in the upper middle and lower aquifers Groundwater contaminant concentration data presented on Figures 31 32 and 33 were used as the basis for estimating the initial plume concentrations within the model The actual concentrations specified as initial conditions for the shallow medial and lower aquifers are shown in Figures 512 513 and 514 respectively
60 MODEL CALIBRATION
Traditionally the term model calibration is used to refer to the trial-and-error adjustment of parameters of the groundwater system by comparing the models output (calculated values of hydraulic head or concentration) and the measured output (observed values of hydraulic head or concentration) In essence such a calibration procedure involves the following routines (1) operating the model using initial estimates of the values of the parameters (2) history-matching or comparing computed and observed values of hydraulic head or concentration and (3) adjusting the values of the parameters and repeating the simulation
Calibration of the model is aimed at demonstrating that it can produce realistic accurate and reliable predictions The flow model is calibrated by determining a set of parameters boundary conditions and hydraulic stresses that generate simulated potentiometric surfaces and fluxes that match field-measured values to within an acceptable range of errors The end result of the process of model calibration is an optimal set of values for parameters that minimize the discrepancy between the model output and the observed data The iterative process of matching calculated values with observed (historical) data by adjusting the model input can be a manual trial-and-error procedure or can be automated The calibration process also known as history-matching is closely related to estimating parameters This process might result in the refinement of initial estimates of aquifer properties (parameters) the establishment of the location of the boundaries (areal and vertical extent of aquifer) and the determination of flow and transport conditions at the boundaries
Calibration can be performed to steady-state or transient data sets Although most flow model calibration exercises involve steady-state data in some hydrogeologic settings assumption of steady-state conditions may be inappropriate due to large fluctuations in the water table or boundary conditions For this modeling exercise only steady-state calibrations were performed
To facilitate the model calibration PEST was used in conjunction with the groundwater flow code (MODFLOW-2000) PEST is a calibration tool that uses non-linear least-squares techniques to adjust model parameter data in order to reduce the discrepancies between the
US EPA Region 7 Garvey Groundwater Flow Modeling Memo 11 July 2012
HGLmdashGroundwater Flow Modeling Technical Memorandum Garvey Elevator Site ndash Hastings NE
pertinent model-generated numbers and the corresponding measurements to a minimum It does this by taking control of the model and running it as many times as is necessary to determine this optimal set of parameters within a user-specified range
Calibration of the steady state flow model was accomplished iteratively by adjusting model parameters during successive model runs to match the water-level data that was collected from all of the wells on September 26-27 2011 under stressed (ie pumping) conditions Since most of the recovery wells had been running for at least several weeks prior to and during the collection of these water levels is it assumed that the levels are representative of steady-state pumping conditions The water-level calibration targets for all of the aquifers are provided in Table 61
As part of the model calibration adjustments were made to the areal recharge (shallow aquifer) range of hydraulic conductivities ratio of vertical to horizontal hydraulic conductivities and minor adjustments to the constant head boundaries The general calibration approach that was followed involved adjusting the parameters mentioned above and inputting the parameters into a PEST simulation PEST would subsequently run MODFLOW thousands of times in which the hydraulic conductivities were adjusted for each iteration until the difference between the observed water levels (targets) and the model predicted values (error residuals) were minimized If these error residuals were too high further adjustments were made to the recharge hydraulic conductivity range etc and the PEST simulation was initiated again
During the model flow calibration it was found that the parameter imparting the most sensitivity to the model results is the areal recharge reaching the water table The Corps of Engineers proposed in their 1990 Final Groundwater Modeling Report of the Hastings East Industrial Park area that net recharge for non-irrigated grassland was estimated to be 26 inches per year (USACE 1990) After performing a number of simulations during the model calibration it was found that a value of 26 inches per year provided the best match to the measured water levels
The error residuals (that is the differences between model predictedcomputed and measuredobserved values) are depicted graphically in Figures 61 and 62 The error residuals and calibration statistics are also presented in tabular form in Table 61 As shown in Figure 61 most of the error residuals are within plusmn05 ft The minimum residual is -32 ft (over prediction of the hydraulic head) and the maximum residual is 196 ft (under prediction of hydraulic head) The graph depicted in Figure 62 shows that there is a good fit along the entire range of observed water level elevations
A common measure of the quality of the model calibration is the percent error The percent error is the root mean square error (RMSE) divided by the total change in the observed head As shown in Table 61 the RMSE is 075 and the range in observations is 4326 This leads to a percent error of about 17 percent which is well below the 10 percent error often cited as the cutoff for a well calibrated model
US EPA Region 7 Garvey Groundwater Flow Modeling Memo 12 July 2012
HGLmdashGroundwater Flow Modeling Technical Memorandum Garvey Elevator Site ndash Hastings NE
The areal distribution of error residuals for the shallow aquifer (model layer 1) near the Garvey Elevator Site and over the entire model domain are shown in Figures 63 and 64 respectively All of the error residuals shown in the figures are relatively small In fact the largest error residuals in the shallow aquifer are found in the immediate vicinity of the West Highway 6 amp Highway 281 Site and do not significantly impact the flow and transport results These error residuals were further lowered as part of the West Highway 6 amp Highway 281 model calibration performed as a separate exercise
The error residuals for the medial aquifer (model layer 3) are presented in Figure 65 With the exception of two wells that are located to the northeast of the Site in the vicinity of the West Highway 6 amp Highway 281 Site all of the residuals are relatively low
The areal distribution of error residuals for the lower aquifer (model layer 5) near the Garvey Elevator Site and over the entire model domain are depicted in Figures 66 and 67 respectively The large residual shown on Figure 66 is associated with MW-20C (-30 ft) The water levels and residuals for the MW-20 well series are as follows
MW-20C residual -300 ft water level 180892 ft above mean sea level (amsl) MW-20D residual 004 ft water level 181196 ft amsl MW-20E residual -037 ft water level 181155 ft amsl
As shown in Table 51 the top of the lower aquifer for the MW-20 series is encountered at a depth of 152 feet This is also the depth that the well screen begins for MW-20C Therefore MW-20C -20D and -20E are all screened in the lower aquifer
Historically the water level for MW-20C behaves somewhat erratically when compared to MW-20D and MW-20E For instance all of the measurements for the 3 wells are relatively close in 2009 and 2010 However in June of 2011 the water level observed in MW-20C is 4 feet above that observed in MW-20D and 3 feet above the water level measured in MW-20E Therefore primary reliance was placed on the water levels from MW-20D and MW-20E for the model calibration
The residuals for the lower aquifer monitoring wells farther downgradient of the site are all very low and demonstrate an excellent calibration (Figure 67)
The calibrated hydraulic conductivities for the shallow medial and lower aquifers are presented in Figures 68 69 and 610 respectively In the vicinity of the Site the calibrated horizontal hydraulic conductivity for the all of the aquifers ranges between 50 and 250 ft per day (ftd) It is assumed that the vertical hydraulic conductivity is a factor of 5 less than that of the horizontal hydraulic conductivity
Near the Site most of the shallow aquifer is characterized by hydraulic conductivities between 50 to 100 ftd The hydraulic conductivities in the medial aquifer however tend to range between 100 and 250 ftd over most of the Site The calibrated hydraulic conductivities for the lower aquifer range between 50 and 150 ftd over most of the eastern portion of the Site and between 100 and 250 ftd along the western boundary and in the northwest area of the Site
US EPA Region 7 Garvey Groundwater Flow Modeling Memo 13 July 2012
HGLmdashGroundwater Flow Modeling Technical Memorandum Garvey Elevator Site ndash Hastings NE
The model predicted hydraulic conductivities for the lower aquifer are less certain however because there are no pumping wells stressing the system in this aquifer
The hydraulic conductivities farther downgradient of the Site indicate that large areas in the shallow and medial aquifers have relatively low hydraulic conductivities ranging from 50 to 100 ftd The hydraulic conductivities of the lower aquifer over much of this area tend to be significantly higher and range between 100 and 250 ftd These higher hydraulic conductivities are consistent with the large production rates (eg 300 to 600 gpm) of the irrigation wells located in the area which draw from the lower aquifer during the summer months
The hydraulic conductivities of the upper and lower aquitards are show on Figures 611 and 612 respectively The upper aquitard is continuous except for an area located immediately north of the Site The lower aquitard is absent from approximately the northern one third of the model domain
The calibrated potentiometric surfaces for the shallow medial and lower aquifers are presented in Figures 613 through 615 respectively The calibrated potentiometric surface for the shallow and medial aquifers show some bending in the vicinity of the Site due to the pumping wells The potentiometric surface of the lower aquifer is clearly impacted by the injections wells (for example elevation line 1817) Downgradient from the Site the potentiometric lines are generally perpendicular to groundwater flow
As a qualitative check on the calibrated hydraulic conductivity fields and hydraulic gradients a particle tracking analysis was performed to estimate travel times Approximately 52 years has elapsed since Garvey Elevators began operation as a grain storage facility in 1959 and the 2011 sampling event As illustrated by Figure 616 it takes about 50 years for a particle to move from the Site boundary to the toe of the plume Although it is unknown when contamination reached the water table and the overall influence of municipal and irrigation wells on transport rates the results of the travel time analysis suggest that the calibrated hydraulic conductivities and gradients are reasonable A general discussion pertaining to particle tracking (eg computer code) is provided in Section 722
70 REMEDIAL ALTERNATIVE DESIGN
71 CONTAMINANT TRANSPORT PARAMETERIZATION
Once the calibration of the flow model was complete contaminant transport and particle tracking simulations were performed Parameters that are required to conduct contaminant transport modeling include effective porosities dispersivities retardation and chemical and biological transformations A brief description of each of these processes is presented below
Effective Porosity The effective porosity is the ratio of the volume of interconnected pore spaces available for transport to the total system volume It is used to estimate the velocity at which groundwater and contaminants travel through a porous medium The smaller the effective porosity the higher the groundwater velocity and the more rapidly contaminants will
US EPA Region 7 Garvey Groundwater Flow Modeling Memo 14 July 2012
HGLmdashGroundwater Flow Modeling Technical Memorandum Garvey Elevator Site ndash Hastings NE
be transported A reasonable value for sand silts and gravels is 25 percent and therefore this value was assigned to the model
Dispersivity The equations of solute transport that are solved in contaminant-transport codes are derived assuming that the solute migration is due to advection and hydrodynamic dispersion Advection describes the bulk movement of groundwater flow where hydrodynamic dispersion is caused by the tendency of the solute to spread out from the path that it would be expected to follow if transported only by advection This spreading of the contamination over an ever-increasing area is called hydrodynamic dispersion and has two components mechanical dispersion and diffusion Hydrodynamic dispersion causes dilution of the solute and occurs because of spatial variations in groundwater flow velocities and mechanical mixing during fluid advection Molecular diffusion the other component of hydrodynamic dispersion is due to the thermal kinetic energy of solute molecules and also contributes to the dispersion process Thus if hydrodynamic dispersion is factored into the solute transport processes ground-water contamination will cover a much larger region than in the case of pure advection with a corresponding reduction in the maximum and average concentrations of the contaminant Dispersion also increases the velocity of the contaminants because it considers the fact that some contaminants will travel through faster pathways (and some slower) than if only pure advection was assumed
The relatively narrow plume with respect to the plume length suggests relatively low dispersivity values Furthermore numerical dispersion occurring as part of the solution method has to also be factored into the dispersion estimate Finally if too large of a dispersion value is assigned contaminants will be artificially dispersed vertically through the upper and lower aquitards into the underlying aquifers Therefore the relatively low values of 50 5 and 1 ft were assigned to the longitudinal transverse and vertical dispersivities respectively
Retardation Factor The rate at which contaminants migrate relative to groundwater is termed the retardation factor and is determined by the effective porosity (see definition above) bulk density and distribution coefficient Adsorption of carbon tetrachloride and other chlorinated solvents is expected to be relatively low in the upper medial and lower aquifer zones leading to a low degree of retardation For modeling purposes a retardation factor of zero was assumed
Chemical and Biological Transformations
Most VOCs and chlorinated solvents including carbon tetrachloride are subject to biological and chemical transformations in the subsurface environment Biological transformations include aerobic degradation anaerobic degradation and co-metabolism Several chemical properties of both water and soil influence the stability of chlorinated solvents in an aquifer Chemical transformations include hydrolysis dehydrohalogenation and reduction in water These typically require low groundwater flow rates and therefore it is unlikely that these chemical transformations will play a significant role at the Site
Carbon tetrachloride can be reduced under anaerobic conditions via three different pathways
US EPA Region 7 Garvey Groundwater Flow Modeling Memo 15 July 2012
HGLmdashGroundwater Flow Modeling Technical Memorandum Garvey Elevator Site ndash Hastings NE
bull reductive dechlorination where carbon tetrachloride is reduced to chloroform chloroform is reduced to methylene chloride and methylene chloride is reduced to methane
bull a simple two-electron reduction process in which chloroform is only a minor product and
bull a one-electron reduction via sulfur and oxygen where carbon tetrachloride is reduced to carbon dioxide and chloroform is not produced
Based on the groundwater sample analytical results collected during the RI field investigation some degree of biodegradation of the carbon tetrachloride groundwater plume is occurring as evidenced by the presence of the degradation products chloroform and methylene chloride (HGL 2011) Concentrations of these degradation products are typically one to two orders of magnitude less than those of carbon tetrachloride in samples collected at the Site However chloroform concentrations are similar to or slightly greater than carbon tetrachloride concentrations in many of the groundwater transect samples collected downgradient of the Site indicating that biodegradation is occurring but not at an accelerated rate Therefore no degradation of carbon tetrachloride was assumed in the model
72 OU 1 - REMEDIAL ALTERNATIVES
The remedial scenarios being considered as part of the FS are presented in Table 71 As shown in the table there are four scenarios included under OU 1 The No Action Alternative (SG-1) and Maintaining and Operating the Existing Groundwater Extraction System (SG-2) would require a significant length of time for on-site carbon tetrachloride concentrations to fall below the maximum contaminant level (MCL) of 5 micrograms per liter (μgL) which is established as the preliminary cleanup level (PCL) These alternatives were not explicitly modeled
For the no action alternative (SG-1) the duration to reach MCLs should intuitively be longer than other alternatives that use active treatment methods However for cost estimating purposes it is assumed that the duration for SG-1 is 30 years
For alternative SG-2 the duration to achieve MCLs was estimated using groundwater contamination data from monitoring wells and recovery wells at the site Table 71 summarizes analytical data from these wells including projected times to achieve MCLs based on concentration trends Using these data an estimated duration of 30 years has been assumed for alternative SG-2 to achieve MCLs
721 SG3 - In-Situ Treatment via Groundwater Amendments
This alternative involves shutting off the existing groundwater extraction system and injecting amendments to remediate contaminated groundwater within the 500 μgL contour As shown in Figure 71 the initial conditions for this portion of the plume have been set to zero and the pumping and injection wells in the upper medial and lower aquifers have been shut off The model predicts that it would take approximately 4 years for the plume to disperse and the concentrations of carbon tetrachloride to decrease below the MCL of 5 μgL These
US EPA Region 7 Garvey Groundwater Flow Modeling Memo 16 July 2012
HGLmdashGroundwater Flow Modeling Technical Memorandum Garvey Elevator Site ndash Hastings NE
predictions are unrealistically short however for the following reasons diffusion back out of the finer grained clays is limited by concentration gradients that often lead to very long cleanup time frames and although sorption is probably low it can significantly increase remediation times particularly when coupled with diffusion processes For these reasons the remediation time for alternative SG3 was increased to 15 years
722 SG4 - Maintain and Operate Existing GET System and Treat Via Amendments
This alternative is identical to SG3 except that the existing groundwater extraction and treatment (GET) system remains on To ensure that the existing GET system is effective at capturing the contamination a capture zone analysis was conducted with the computer code MODPATH
MODPATH is a widely accepted 3-D particle-tracking model that uses the flow fields created by MODFLOW to predict groundwater flow directions Particle tracking is a form of flow and transport modeling that represents the bulk movement of groundwater Particle tracking neglects the effects of chemical reactions dispersion and diffusion The particle tracking analysis involves adding particles to the model at selected locations and then allowing the model to move the particles in the direction of groundwater flow The results of a particle tracking simulation are displayed by plotting pathlines through the aquifer Although both forward and reverse particle tracking can be performed with MODPATH for the Garvey Elevator Site only forward-tracking analyses are conducted
Before initiating the capture zone analysis the groundwater extraction rates were changed from those used to calibrate the model to rates that better reflect long term pumping rates The revised rates are as follows
Garvey Elevator Site
bull RW-1 = 35 gpm bull RW-2 = 68 gpm bull RW-3 = 90 gpm bull RW-4 = 102 gpm bull RW-5 = 50 gpm bull RW-6 = 900 gpm bull RW-7 = 680 gpm bull RW-8 = 1280 gpm
West Highway 6 amp Highway 281 Site
bull EW-1 = 61 gpm bull EW-2 = 83 gpm bull EW-3 = 41 gpm bull EW-4 = 00 gpm
Shallow Aquifer
US EPA Region 7 Garvey Groundwater Flow Modeling Memo 17 July 2012
HGLmdashGroundwater Flow Modeling Technical Memorandum Garvey Elevator Site ndash Hastings NE
As shown on Figure 72 particles released to all the model layers indicate that the extraction wells are effectively containing the on-site carbon tetrachloride plume At some point downgradient however capture is lost and the contaminants will continue to migrate with the groundwater
Medial Aquifer
The results of the particle-tracking analysis for the medial aquifer are presented as Figure 73 The particle tracking illustrates that the modeled capture zone extends sufficiently downgradient to capture the contamination that has moved immediately off site
The predicted remediation time for this alternative is about 2 years (Table 72) The removal of the contamination with the pumping wells has shortened the time from that predicted for Alternative SG3 As was the case for Alternative SG3 these predictions are unrealistically short for the same reasons For these reasons the remediation time for alternative SG3 was increased to 10 years
73 OU 2 - REMEDIAL ALTERNATIVES
Six remedial alternatives were considered for OU 2 (Table 72) Although it was not modeled based on the predicted remediation times of greater than 100 years for the G2 scenario the No-Action alternative (G1) remediation time is predicted to take more than 100 years However for cost estimating purposes it will be assumed that the duration for SG-1 is 30 years
731 G2 - Groundwater Recovery and Treatment at Leading Edge of Plume
This alternative involves pumping and treating the groundwater from the toe of the medial and lower aquifer plumes As shown in Figures 74 and 75 three wells would need to be placed in both the medial and lower aquifers to ensure capture of the plume The relative position of the two sets of wells is depicted on Figure 76 Each of the medial wells would be pumped at 50 gpm and the lower aquifer wells would each be pumped at 150 gpm The predicted remediation time for this alternative is greater than 100 years For costing purposes a duration of 100 years is assumed
732 G3a - Groundwater Recovery and Treatment at Leading Edge and Midpoint of Plume
This alternative is the same as Alternative G2 but in addition to pumping and treating contaminated groundwater from the toe of the plume contaminated groundwater is also pumped and treated from the midpoint of the medial and lower aquifer plume(s) A series of simulations were run in which the midpoint wells were located along different transects in order to decrease the remediation times the most optimal locations are shown in Figures 77 and 78
US EPA Region 7 Garvey Groundwater Flow Modeling Memo 18 July 2012
HGLmdashGroundwater Flow Modeling Technical Memorandum Garvey Elevator Site ndash Hastings NE
The relative position of the two sets of wells is depicted on Figure 79 Each of the medial wells would be pumped at 50 gpm and the lower aquifer wells would each be pumped at 150 gpm The predicted remediation time for this alternative is between 75 and 95 years For cost estimating purposes a duration of 75 years will be assumed
733 G3b - Groundwater Recovery and Treatment at Leading Edge and Midpoint of Medial Aquifer and Two Recovery Well Transects in Lower Plume
The results from G3a indicate that the contamination in the lower aquifer takes the longest time to remediate Therefore this alternative was added to determine how much the remediation times could be reduced if a second set of recovery wells was added to the lower aquifer The placement of the recovery wells in the medial aquifer remains the same as for Alternative G3a (Figure 77) The locations of the two transects of recovery wells in the lower aquifer are shown on Figure 710 Their placement relative to the medial wells is shown in Figure 711 Each of the medial wells would be pumped at 50 gpm and each of the lower aquifer wells would be pumped at 150 gpm The predicted remediation time for this alternative is about 53 years
734 G4a - Establishment of In Situ Treatment Zone at Midpoint of Lower Aquifer Plume and Groundwater Recovery and Treatment at Leading Edge of Medial and Lower Plumes
This alternative involves adding a treatment curtain to the pumping wells specified in the G2 alternative (Figure 712) The transect is simulated as a zero concentration boundary which effectively removes all of the carbon tetrachloride from the groundwater moving through it The relative position of the transect and wells is depicted on Figure 713 Each of the medial wells would be pumped at 50 gpm and each of the lower aquifer wells would be pumped at 150 gpm The predicted remediation time for this alternative is between 75 and 95 years For cost estimating purposes a duration of 75 years is assumed
735 G4b - Establishment of In Situ Treatment Zone(s) at Two Transects of Lower Aquifer Plume and Groundwater Recovery and Treatment at Leading Edge of Medial and Lower Plumes
This alternative involves adding two treatment curtains to the pumping wells specified in the G2 alternative (Figure 714) The relative position of the transects and recovery wells is depicted on Figure 715 Each of the medial wells would be pumped at 50 gpm and the lower aquifer wells each at 150 gpm The predicted remediation time for this alternative is about 56 years
80 SUMMARY AND CONCLUSIONS
A hydrogeologic conceptual site model of the subsurface groundwater flow and contaminant transport was developed to guide the creation of a numerical model The numerical model
US EPA Region 7 Garvey Groundwater Flow Modeling Memo 19 July 2012
HGLmdashGroundwater Flow Modeling Technical Memorandum Garvey Elevator Site ndash Hastings NE
was subsequently calibrated with existing field data (known water levels and pumping rates) to address the following objectives (1) evaluate the overall effectiveness of the current extraction well system (2) identify areas outside of the capture zone that may require enhancements and (3) develop a tool to assist in ldquowhat ifrdquo scenarios for the remedial alternative development
MODFLOW-2000 MT3D-MS and MODPATH are the computer codes applied to conduct the flow and transport analysis The output from MODFLOW-2000 is a groundwater velocity field which is used by MT3D-MS in conjunction with fate and transport parameters to simulate the migration of carbon tetrachloride Particle tracking analyses were also conducted with MODPATH to illustrate the groundwater flow directions travel times and capture zones All of these computer codes are widely used well documented and in the public domain
With respect to the construction of the model a three layer finite difference grid was utilized that simulates the upper middle and lower aquifers covers 102 square miles and includes 1030200 active cells
Calibration of the steady state flow model was accomplished iteratively by adjusting model parameters during successive model runs to match the water level data that was collected from all of the wells on September 26-27 2011 under stressed (pumping) conditions
The flow and transport model was initialized with measured carbon tetrachloride data obtained during a 2011 sampling event These initial concentrations were used as the basis to predict future concentrations under various remedial alternatives involving extraction wells and treatment curtains
Remediation times for OU 1 scenarios varied from 10 to 30 years Scenarios from the No Action alternative and alternative SG-2 were not modeled but were based on an assumed cost basis period and a duration based on existing concentration data trends respectively Remediation times for OU 2 scenarios range from 30 years to more than 100 years
90 REFERENCES
Doherty J 2006 PEST Model-Independent Parameter Estimation User Manual 5th Edition Watermark Computing
Harbaugh AW Banta ER Hill MC and McDonald MG 2000 MODFLOWndash2000 the US Geological Survey Modular Ground-Water ModelmdashUser guide to modularization concepts and the ground-water flow process US Geological Survey Open-File Report 00ndash92 121 p
HydroGeoLogic Inc (HGL) 2009 Focused Feasibility Study Version 4 Garvey Elevator Site OU 1 Garvey Elevator Site Hastings Nebraska December
HGL 2011 Final Remedial Investigation Report Garvey Elevator Site Hastings Nebraska April
US EPA Region 7 Garvey Groundwater Flow Modeling Memo 20 July 2012
HGLmdashGroundwater Flow Modeling Technical Memorandum Garvey Elevator Site ndash Hastings NE
McDonald MG and AW Harbaugh 1988 A Modular Three-dimensional Finite-difference Groundwater Flow Model US Geological Survey TWRI Chapter 6-A1
Pollock DW 1994 Userrsquos Guide for MODPATHMODPATH-PLOT Version 3A particle tracking post-processing package for MODFLOW the U S Geological Survey finite-difference ground-water flow model U S Geological Survey Open-File Report 94shy464
Rumbaugh JO and DB Rumbaugh 1998 Groundwater Vistas Version 516 Environmental Simulations
US Army Corps of Engineers (USACE) 1990 Final Groundwater Modeling Report Hastings East Industrial Park Remedial InvestigationFeasibility Study Hastings Nebraska August
Zheng C 1990 MT3D A modular three-dimensional transport model for simulation of advection dispersion and chemical reactions of contaminants in groundwater systemsrdquo Report to the US Environmental Protection Agency Robert S Kerr Environmental Research Laboratory Ada OK
Zheng Chunmiao and Wang P Patrick 1999 ldquoMT3DMS A modular three-dimensional multispecies transport model for simulation of advection dispersion and chemical reactions of contaminants in groundwater systems documentation and userrsquos guiderdquo Contract Report SERDP-99-1 US Army Engineer Research and Development Center Vicksburg Mississippi
Attachments
Attachment 1 Tables Attachment 2 Figures
US EPA Region 7 Garvey Groundwater Flow Modeling Memo 21 July 2012
This page was intentionally left blank
ATTACHMENT 1 TABLES
Table 51 Table 61 Table 71 Table 72
Contact Elevations of the Major Lithologic Units Water Level Calibration Statistics Groundwater Data Summary Projected Durations to Meet MCLs Remedial Alternatives Summary
This page was intentionally left blank
Table 51 Contact Elevations of the Major Lithologic Units
Garvey Elevator Site Hastings Nebraska
Elev Depth Elev Depth Elev Depth Elev Thickne Depth Elev Depth Elev Thickne Depth Elev Depth Elev (ft) (ft) (ft bgs) (ft amsl) (ft bgs) (ft amsl) (ft bgs) (ft amsl) (ft bgs) (ft amsl) (ft) (ft bgs) (ft amsl) (ft bgs) (ft amsl) (ft) (ft bgs) (ft amsl) (ft bgs) (ft amsl)
OU1 MW-1A 270590926 2080164407 125 192580 645 186130 995 182630 -- -- -- -- -- -- -- -- -- -- -- --OU1 MW-2A 271240410 2080539870 1235 192733 685 185883 835 184383 -- -- -- -- -- -- -- -- -- -- -- --OU1 MW-3ABDE 270755170 2080773994 243 193099 595 187149 111 181999 134 179707 1 135 179607 155 177530 1 156 177430 2385 169249 OU1 MW-4AB 270341995 2080827075 132 193184 585 187334 89 184284 -- -- -- -- -- -- -- -- -- -- -- --OU1 MW-5ABD 269943836 2080752777 188 193006 635 186656 885 184156 132 179785 1 133 179685 -- -- -- -- -- -- --OU1 MW-6ADE 271237345 2081216968 238 192948 735 185598 935 183598 129 180046 1 130 179946 155 177446 5 160 176946 -- --OU1 MW-7AB 269088475 2079699700 135 192092 55 186592 90 183092 -- -- -- -- -- -- -- -- -- -- -- --OU1 MW-8A 271214203 2079067544 132 194080 608 188000 90 185080 -- -- -- -- -- -- -- -- -- -- -- --OU1 MW-9A 272193736 2080628145 116 192540 70 185540 90 183540 -- -- -- -- -- -- -- -- -- -- -- --OU2 MW-10AB 272535399 2081973782 130 192381 65 185881 85 183881 125 179870 1 126 179770 -- -- -- -- -- -- --OU2 MW-11A 271826499 2083509070 110 191228 70 184228 90 182228 -- -- -- -- -- -- -- -- -- -- -- --OU2 MW-12AC 270399710 2085390335 170 191713 50 186713 805 183663 -- -- -- -- -- -- -- -- -- -- -- --
OU2 (new) MW-12D 270399901 2085403521 178 191698 57 185998 88 182898 120 179698 7 127 178998 -- -- -- -- -- -- --OU1 MW-13CE 270368902 2081015694 238 192874 75 185374 90 183874 130 179874 1 131 179774 -- -- -- -- -- 235 169374 OU2 MW-14A 270968774 2084137323 1085 190956 695 184006 895 182006 -- -- -- -- -- -- -- -- -- -- -- --OU2 MW-16AC 267054564 2084286931 160 191545 50 186545 80 183545 -- -- -- -- -- -- -- -- -- -- -- --OU2 MW-17ACD 268796556 2082958916 200 190185 60 184185 85 181685 -- -- -- -- -- -- -- -- -- -- -- --OU2 MW-18ACD 268693818 2085938384 205 191064 55 185564 95 181564 1155 179514 1 1165 179414 -- -- -- -- -- -- --OU1 MW-19AC 270955133 2081332850 165 192781 61 186681 895 183831 128 179981 8 136 179181 150 177781 2 152 177581 -- --OU1 MW-20ACDE 270597445 2081202233 255 192797 54 187397 87 184097 129 179897 7 136 179197 150 177797 2 152 177597 236 169197 OU1 MW-30ACDE 270271723 2081095430 255 192903 70 185903 85 184403 1255 180353 7 1325 179653 146 178303 2 148 178103 237 169203 OU1 MW-31AC 269550764 2080816035 165 193008 63 186708 883 184178 -- -- -- -- -- -- -- -- -- -- -- --OU1 MW-33 271206314 2079068057 255 194074 84 185674 95 184574 1385 180224 55 144 179674 167 177374 675 17375 176699 240 170074
OU1 (new) MW-47BCD 270781240 2081046150 1705 192995 -- -- -- -- 1315 179845 15 133 179695 151 177895 2 153 177695 -- --OU1 (new) MW-48BCD 270645490 2080859850 171 192887 -- -- -- -- 129 179987 35 1325 179637 1498 177907 5 1548 177407 -- --OU1 (new) MW-49BCD 270039470 2080890150 171 192934 -- -- -- -- 1305 179884 15 132 179734 1495 177984 4 1535 177584 -- --OU1 (new) MW-50BCD 270307290 2080987510 170 192925 -- -- -- -- 1275 180175 5 1325 179675 1495 177975 1 1505 177875 -- --OU1 (new) MW-51BCD 270487290 2080899910 171 192943 -- -- -- -- 1268 180263 52 132 179743 1495 177993 45 154 177543 -- --OU2 (new) MW-41D1 266698811 2089673996 171 191524 62 185324 92 182324 126 178899 2 128 178699 148 176699 2 150 176499 -- --OU2 (new) MW-41D2 266708267 2089674259 206 191499 62 185299 92 182299 126 178899 2 128 178699 148 176699 2 150 176499 -- --OU2 (new) MW-42DE 269168074 2100135574 215 190207 66 183607 98 180407 124 177823 10 134 176823 -- -- -- -- -- -- --OU2 (new) MW-43DE 265395404 2097605590 2215 190835 48 186035 89 181935 -- -- -- -- -- 153 175545 2 155 175345 -- --OU2 (new) MW-44DE 267552324 2105258206 214 188530 63 182230 92 179330 119 176630 3 122 176330 1425 174280 75 150 173530 -- --OU2 (new) MW-45CD 270056199 2083476668 170 190982 50 185982 89 182082 112 179746 3 115 179446 -- -- -- -- -- -- --OU2 (new) MW-46D1 269055295 2089632928 167 191097 61 184997 94 181697 121 179003 3 124 178703 148 176303 6 154 175703 -- --OU2 (new) MW-46D2 269063843 2089632455 202 191103 61 185003 94 181703 121 179003 3 124 178703 148 176303 6 154 175703 -- --
Hwy 6 MW-104ACD 271937379 2088225393 235 190901 472 186181 936 181541 115 179401 12 127 178201 -- -- -- -- -- 220 168901 Hwy 6 MW-105ACD 270069428 2089866388 257 191679 68 184879 105 181179 123 179379 10 133 178379 -- -- -- -- -- 2455 167129 Hwy 6 MW-106ACD 270452369 2098166199 255 190664 77 182964 1075 179914 130 177664 5 135 177164 -- -- -- -- -- 248 165864 OU1 I-1 270863284 2080138346 175 19212 -- -- -- -- -- -- -- -- -- -- -- -- -- -- -- --OU1 I-2 270331729 2080131336 175 19200 -- -- -- -- -- -- -- -- -- -- -- -- -- -- -- --OU1 HTW-40 271217856 2079157749 -- 19395 -- -- -- -- -- -- -- -- -- -- -- -- -- -- -- --
Hwy 6 HTW-100 273075261 2082012337 255 19066 770 182964 1076 179904 130 177664 55 -- -- -- -- -- -- -- -- --
Surface Elevation -
Surficial Soil Peoria and
Loveland Loess
Very Fine Sand Silty Fine Sand
Clayey Silt
Silty Sand and Gravel (contains Upper Aquifer)
Upper Aquitard Medial Aquifer
Monitoring Wells
Boring DepthEasting(2)Northing(2)
Well ID Lower Aquitard Lower AquiferSite
Top of Lithologic and Hydrostratigraphic Units(1)
Decomposed Weathered
Shale
Sheet 1 of 2
Table 51 Contact Elevations of the Major Lithologic Units
Garvey Elevator Site Hastings Nebraska
Elev Depth Elev Depth Elev Depth Elev Thickne Depth Elev Depth Elev Thickne Depth Elev Depth Elev (ft) (ft) (ft bgs) (ft amsl) (ft bgs) (ft amsl) (ft bgs) (ft amsl) (ft bgs) (ft amsl) (ft) (ft bgs) (ft amsl) (ft bgs) (ft amsl) (ft) (ft bgs) (ft amsl) (ft bgs) (ft amsl)
Surface Elevation -
Surficial Soil Peoria and
Loveland Loess
Very Fine Sand Silty Fine Sand
Clayey Silt
Silty Sand and Gravel (contains Upper Aquifer)
Upper Aquitard Medial Aquifer Boring DepthEasting(2)Northing(2)
Well ID Lower Aquitard Lower AquiferSite
Top of Lithologic and Hydrostratigraphic Units(1)
Decomposed Weathered
Shale
OU1 (new) SB-09 270168160 2080517340 13160 192984 59 187084 90 183984 130 179984 1 131 179884 -- -- -- -- -- -- --OU1 (new) SB-13 269654838 2080309785 14340 192973 67 186273 87 184273 130 179973 3 133 179673 -- -- -- -- -- -- --OU1 (new) SB-29 270864398 2081035503 14215 192989 68 186189 90 183989 -- -- -- -- -- -- -- -- -- -- -- --OU1 (new) SB-32 271237915 2079979855 14865 192475 66 185875 92 183275 -- -- -- -- -- 148 177675 297 149 177575 -- --OU1 (new) SB-33 269199799 2080682378 14085 193446 63 187146 93 184146 -- -- -- -- -- -- -- -- -- -- -- --OU1 (new) SB-39 271537352 2081550026 13560 192583 64 186183 89 183683 -- -- -- -- -- -- -- -- -- -- -- --OU2 (new) TS1-01 269515615 2089614339 864 191569 70 184569 86 182969 -- -- -- -- -- -- -- -- -- -- -- --OU2 (new) TS1-03 268313868 2089646765 16736 191251 66 184651 86 182651 1195 179301 05 120 179251 148 176451 5 153 175951 -- --OU2 (new) TS1-05 267030127 2089665004 16681 191624 75 184124 87 182924 117 179924 2 119 179724 153 176324 308 155 176124 -- --OU2 (new) TS2-02 271456113 2097510251 13680 191015 73 183715 104 180615 134 177614 3 137 177314 -- -- -- -- -- -- --OU2 (new) TS2-04 268939527 2097554155 16746 190360 70 183360 89 181460 126 177760 9 135 176860 152 175160 306 154 174960 -- --OU2 (new) TS2-05 267717573 2097569698 17161 190143 62 183943 99 180243 -- -- -- -- -- 157 174443 2 159 174243 -- --OU2 (new) TS2-06 266250085 2097592053 11980 190501 60 184501 100 180501 -- -- -- -- -- -- -- -- -- -- -- --OU2 (new) TS3-02 269400264 2102787273 15690 189415 68 182615 96 179815 125 176915 7 132 176215 147 174715 297 150 174415 -- --OU2 (new) TS3-05 265786308 2102812115 14380 189056 67 182356 96 179456 1195 177106 1 1205 177006 129 176156 261 132 175856 -- --OU2 (new) TS4-02 267112179 2105261928 17031 188448 64 182048 96 178848 116 176848 3 119 176548 141 174348 284 143 174148 -- --
Hwy 6 TS3-01 271941141 2089537242 1453 19153 720 184334 1125 180284 1256 178974 29 1285 178684 -- -- -- -- -- -- --Hwy 6 TS3-02 271499828 2089579255 1414 19139 692 184466 102 181186 1227 179116 59 1286 178526 -- -- -- -- -- -- --Hwy 6 TS3-03 270957676 2089591662 1440 19087 710 183767 941 181457 1178 179087 56 1234 178527 -- -- -- -- -- -- --Hwy 6 TS3-04 270411434 2089597601 1403 19088 663 184254 1006 180824 1167 179214 61 1228 178604 -- -- -- -- -- -- --Hwy 6 TS3-05 272464675 2089528557 1718 19173 685 184883 1032 181413 123 179433 7 130 178733 -- -- -- -- -- -- --Hwy 6 TS4-01 271882569 2095813356 1658 19042 650 183920 987 180550 1238 178040 52 129 177520 -- -- -- -- -- -- --Hwy 6 TS4-03 270996450 2096068696 1171 19050 810 182400 966 180840 1154 178960 12 1166 178840 -- -- -- -- -- -- --Hwy 6 TS5-01 271766686 2092074297 1562 19016 648 183680 905 181110 1163 178530 53 1216 178000 -- -- -- -- -- -- --Hwy 6 TS5-03 270732978 2092105115 1389 19008 709 182990 923 180850 1147 178610 46 1193 178150 -- -- -- -- -- -- --Hwy 6 TS5-05 272269991 2092059880 1717 19045 425 186200 942 181030 1153 178920 83 1236 178090 -- -- -- -- -- -- --
Electrical Conductivity Borings
(1)Surface elevation listed for nested monitoring wells (ABCDE) is the surface elevation of the A well Unit elevations are from the boring logs in which they were recorded (2)State Plane Coordinate system Nebraska 2600 amsl - above mean seal level bgs - below ground surface Elev - elevation ft - feet Hwy 6 - Wellsborings installed for the West Highway 6 and Highway 281 Site Investigations -- - not applicable or not available OU1 - Operable Unit 1 these wells are associated with on-site groundwater OU1 (new) - Operable Unit 1 wellsborings installed in AprilMay 2010 for the RI OU2 - Operable Unit 2 these wells are associated with off-site groundwater OU2 (new) - Operable Unit 2 Monitoring wellsborings installed in AprilMay 2010 for the RI
Sheet 2 of 2
Table 61 Water Level Calibration Statistics
Garvey Elevator Site Hastings Nebraska
Name Layer
Target Water Level Elevation - Sept 2011
(feet amsl) Model
Water Level Error
Residual MW-12U 1 18156 1814424820 117518 MW-100A 1 181542 1814519751 0900249 MW-16U 1 181534 1814385390 095461 MW-10A 1 181528 1814182851 1097149 MW-1A 1 181525 1815209270 004073 MW-2A 1 181519 1815393838 -0203838 MW-05 1 181516 1814358176 0801824
MW-102A 1 18151 1813770877 1329123 MW-13U 1 181507 1813730081 1339919 MW-7A 1 181504 1815242607 -0202607 MW-04 1 181487 1814376802 0493198
MW-17U 1 181486 1814230581 0629419 MW-07 1 181475 1814008616 0741384 MW-03 1 181471 1813907473 0802527 MW-02 1 181468 1813743101 0936899 MW-08 1 181465 1814180036 0469964 MW-06 1 18146 1814237391 0362609
MW-10U 1 181453 1814016597 0513403 MW-14U 1 181451 1814457639 0052361 MW-6A 1 181444 1814334070 010593 MW-01 1 18144 1814062502 0337498
MW-11A 1 181429 1812347804 1942196 MW-11U 1 181411 1814658764 -0548764 MW-10B 1 181372 1814173608 -0453608 MW-3A 1 181357 1813385654 0184346 MW-5B 1 181339 1813199091 0190909 MW-15U 1 181326 1814948966 -1688966 MW-47B 1 181316 1812784852 0375148 MW-50B 1 181314 1812748409 0391591 MW-4A 1 18131 1812992455 0107545 MW-3B 1 181308 1813389494 -0309494 MW-5A 1 181307 1813165365 -0095365 MW-19A 1 181301 1813252060 -024206 MW-4B 1 181298 1812954715 0025285 MW-31A 1 181289 1812885039 0004961 MW-51B 1 181236 1812125173 0234827 MW-49B 1 181227 1812349041 -0079041 MW-48B 1 18122 1812098306 0101694 MW-30A 1 181194 1812183956 -0243956 MW-09U 1 181194 1814076063 -2136063 MW-20A 1 181179 1812309176 -0519176 MW-14A 1 181061 1810498570 011143 MW-17A 1 18098 1809745419 0054581
Sheet 1 of 3
Table 61 Water Level Calibration Statistics
Garvey Elevator Site Hastings Nebraska
Name Layer
Target Water Level Elevation - Sept 2011
(feet amsl) Model
Water Level Error
Residual MW-12A 1 180706 1807353224 -0293224 MW-16A 1 180683 1806758847 0071153 MW-18A 1 18062 1805744494 0455506 MW-104A 1 180386 1804035180 -017518 MW-105A 1 179994 1799915974 0024026 MW-106A 1 178857 1788240807 0329193 MW-18C 3 180409 1804214829 -0124829 MW-12C 3 180568 1805675664 0004336 MW-16C 3 180625 1806232799 0017201 MW-45C 3 180888 1809089044 -0209044 MW-17C 3 180918 1809113670 006633 MW-47C 3 181047 1810251020 021898 MW-101B 3 181066 1811509656 -0849656 MW-102B 3 181092 1811706686 -0786686 MW-13C 3 181107 1811204349 -0134349 MW-51C 3 181177 1811366716 0403284 MW-50C 3 18119 1811832475 0067525 MW-49C 3 181235 1812474567 -0124567 MW-48C 3 18125 1812312538 0187462 MW-7B 3 181497 1815042613 -0072613
MW-09M 5 181527 1813657691 1612309 MW-3D 5 181479 1814354375 0435625 MW-3E 5 181379 1814210888 -0420888 MW-5D 5 181366 1813572038 0087962 MW-47D 5 181365 1812738611 0911389 MW-49D 5 18134 1813402643 -0002643 MW-48D 5 181323 1812926923 0303077 MW-50D 5 181323 1812962182 0267818 MW-31C 5 181311 1813127460 -001746 MW-51D 5 181302 1812256458 0763542 MW-13E 5 181234 1812181638 0158362
MW-100D 5 181223 1813629694 -1399694 MW-100C 5 181216 1813634399 -1474399 MW-30C 5 181208 1811949179 0130821 MW-19C 5 1812 1812353637 -0353637 MW-20D 5 181196 1811924735 0035265 MW-30D 5 181188 1811949179 -0069179 MW-20E 5 181155 1811924735 -0374735 MW-16M 5 181133 1811653909 -0323909 MW-13M 5 181117 1811940971 -0770971 MW-30E 5 181115 1811949179 -0799179 MW-11M 5 181097 1814139713 -3169713 MW-17D 5 180923 1808958032 0271968
Sheet 2 of 3
Table 61 Water Level Calibration Statistics
Garvey Elevator Site Hastings Nebraska
Name Layer
Target Water Level Elevation - Sept 2011
(feet amsl) Model
Water Level Error
Residual MW-20C 5 180892 1811924735 -3004735 MW-45D 5 180884 1809292039 -0452039 MW-12D 5 180575 1805738454 0011546 MW-18D 5 180413 1804194578 -0064578 MW-104D 5 180137 1801272389 0097611 MW-104C 5 180135 1801269033 0080967 MW-46D1 5 179796 1797768438 0191562 MW-105D 5 179794 1797798970 014103 MW-46D2 5 179792 1797771831 0148169 MW-105C 5 179791 1797803499 0106501 MW-41D2 5 179702 1797046783 -0026783 MW-41D1 5 179697 1797044368 -0074368 MW-106C 5 178531 1785334635 -0024635 MW-106D 5 178527 1785320367 -0050367 MW-43D 5 178387 1783880124 -0010124 MW-43E 5 178386 1783888909 -0028909 MW-42D 5 178183 1781770173 0059827 MW-42E 5 178182 1781753639 0066361 MW-44D 5 177409 1774079493 0010507 MW-44E 5 177407 1774078775 -0008775
Residual Mean 0046933 Res Std Dev 0743461 Sum of Squares 6048817
RMS Error 0744941 Min Residual -3169713 Max Residual 1942196
Number of Observations 109 Range in Observations 4362
Scaled Std Dev 0017044 Scaled Abs Mean 0010505
Scaled RMS 0017078 Notes
amsl - above mean sea level
Sheet 3 of 3
Table 71 Groundwater Data Summary Projected Durations to Meet MCLs
Garvey Elevator Site Hastings Nebraska
Well Data Collection Range TCE Concentration μgL Estimated Date to
Reach MCLs Duration from June 2012 yrsHigh Low
MW-3A May 1997 - March 2012 20000 11 already achieved NA MW-3B May 1997 - March 2012 23000 74 Nov 2045 33 MW-3D April 1997 - March 2012 5 05 already achieved NA MW-3E April 1997 - March 2012 4 05 already achieved NA MW-4A May 1997 - March 2012 18000 43 Sept 2013 1 MW-4B May 1997 - March 2012 29000 690 Dec 2042 30 MW-5A May 1997 - March 2012 24000 47 already achieved NA MW-5B May 1997 - March 2012 15000 12 Jan 2017 5 MW-5D April 1997 - March 2012 4 05 already achieved NA MW-13C May 1997 - March 2012 18000 28 Nov 2061 49 MW-13E May 1997 - March 2012 5 05 already achieved NA
RW-1 1999 - 2011 490 10 May 2016 4 RW-2 1999 - 2011 3200 5 Nov 2021 9 RW-3 1999 - 2011 3800 5 Feb 2024 12 RW-4 1997 - 2011 5500 5 June 2016 4 RW-5 1999 - 2011 5500 5 achieved NA RW-6 1999 - 2011 590 10 Oct 2018 6 RW-7 1995 - 2011 1000 5 Jan 2025 13 RW-8 1998 - 2011 380 5 March 2047 35
Notes
Dates and concentration data are from the site database projections to reach MCLs are based on curves fitted to data plots as provided by Dr Brian
Zurbuchen via email on June 11 2012
μgL - micrograms per liter
Sheet 1 of 1
Table 72 Remedial Alternatives Summary
Garvey Elevator Site Hastings Nebraska
Remedial Alternative Assumptions Remediation
Times Notes
OU 1
SG-1-No Action All extraction wells off 30 years
This scenario was not explicity modeled Based on the remedition duration predicted for SG2 remediation time will be greater than 30 years However for cost estimating purposes a 30-year duration will be used
SG2-- Maintain and Operate Existing GET System
No treatment of downgradient plume
30 years This scenario was not explicity modeled but remediation time was estimated based on contaminant concentration trends (see Table 71)
SG3--In Situ Treatment Via Groundwater Amendments
Area within gt500 ugL set to 00 on-site treatment system shut off
15 years Remediation time estimates are for OU1 (on-site) plume using multiple injection treatments and existing GET system shut off
SG4-- Maintain and Operate Existing GET System and Treatment Via Groundwater Amendments
Pump and treat system operating groundwater within concentrations gt500 ugL set to 00
10 years Remediation time estimates are for OU1 (on-site) plume using multiple injection treatments and existing GET system operating
OU 2
G1-No Action Pump and treat system operating no treatment of downgradient plume
30 years This scenario was not explicity modeled For cost estimating purposes a 30-year duration will be used
G2-Groundwater Recovery Treatment and Discharge at Leading Edge of Plume
On-site pump and treat system operating
100 years Based upon modeling results for more active remedies the remediation times for both the OU 1 and OU 2 plumes would exceed 100 years This scenario was not explicity modeled
G3a-Groundwater Recovery Treatment and Discharge at mid point and Leading Edge of Plume
On-site pump and treat system operating
75 years
Modeled duration ranges from 75 to 90 years
G3b-Groundwater Recovery Treatment and Discharge at two transects and Leading Edge of Plume
On-site pump and treat system operating
53 years
G4a-In Situ treatment at midpoint of plume and Groundwater Recovery Treatment and Discharge at leading edge of plume
On-site pump and treat system operating
75 years
Same as G3 but a treatment zone replaces the recovery wells near the midpoint of the plume Modeled duration ranges from 75 to 90 years
G4b-In Situ treatment at two transects near core of plume and Groundwater Recovery Treatment and Discharge at leading edge of plume
On-site pump and treat system operating
56 years Same as G3 but two treatment zones replace the recovery wells near the midpoint of the plume
Notes
μgL - micrograms per liter
Sheet 1 of 1
This page was intentionally left blank
ATTACHMENT 2 FIGURES
Figure 31 Carbon Tetrachloride Isoconcentrations Upper Aquifer Zone AB Figure 32 Carbon Tetrachloride Isoconcentrations Medial Aquifer Zone C Figure 33 Carbon Tetrachloride Isoconcentrations Lower Aquifer Zone DE
Figure 51 Model Domain and Boundary Conditions Figure 52 Vertical Discretization of Model Figure 53 Elevation of the Model Base Figure 54 Elevation of the Top of the Lower Aquifer Figure 55 Isopach Map of the Lower Confining Unit Figure 56 Elevation of the Base of the Medial Aquifer Figure 57 Isopach of Upper Aquifer Figure 58 Elevation of the Base of the Upper Aquifer Figure 59 Location of Recovery Wells in the Shallow Aquifer Figure 510 Location of Recovery Wells in the Medial Aquifer Figure 511 Location of Injection and Municipal Wells in the Lower Aquifer Figure 512 Initial Concentrations of Carbon Tetrachloride in the Shallow Aquifer Figure 513 Initial Concentrations of Carbon Tetrachloride in the Medial Aquifer Figure 514 Initial Concentrations of Carbon Tetrachloride in the Lower Aquifer
Figure 61 Error Residuals Versus Measured Water Levels Figure 62 Measured Water Levels Versus Predicted Water Level Elevations Figure 63 Error Residuals for the Shallow Aquifer in the Vicinity of the Garvey Elevator
Site Figure 64 Error Residuals for the Shallow Aquifer over the Model Domain Figure 65 Error Residuals for the Medial Aquifer over the Model Domain Figure 66 Error Residuals for the Lower Aquifer in the Vicinity of the Garvey Elevator
Site Figure 67 Error Residuals for the Lower Aquifer over the Entire Model Domain Figure 68 Calibrated Hydraulic Conductivities of the Shallow Aquifer Figure 69 Calibrated Hydraulic Conductivities of the Medial Aquifer Figure 610 Calibrated Hydraulic Conductivities of the Lower Aquifer Figure 611 Calibrated Hydraulic Conductivities of the Upper Aquitard Figure 612 Calibrated Hydraulic Conductivities of the Lower Aquitard Figure 613 Calibrated Potentiometric Surface of the Shallow Aquifer Figure 614 Calibrated Potentiometric Surface of the Medial Aquifer Figure 615 Calibrated Potentiometric Surface of the Lower Aquifer Figure 616 Particle Tracking Analysis to Estimate Travel Time
Figure 71 Initial Concentrations for Alternative SG3 Figure 72 Capture Zone Analysis in the Shallow Aquifer for Alternative SG3 Figure 73 Capture Zone Analysis in the Medial Aquifer for Alternative SG3 Figure 74 Alternative G2 ndash Proposed Recovery Wells Medial Aquifer
ATTACHMENT 2 FIGURES (continued)
Figure 75 Alternative G2 ndash Proposed Recovery Wells Lower Aquifer Figure 76 Preliminary Locations for Leading Edge Recovery Wells and Groundwater
Treatment Building ndash Alternative G2 Figure 77 Alternative G3ab ndash Proposed Recovery Wells Medial Aquifer Figure 78 Alternative G3a ndash Proposed Recovery Wells Lower Aquifer Figure 79 Preliminary Locations for Mid-Plume and Leading Edge Recovery Wells and
Groundwater Treatment BuildingmdashAlternative G3 Figure 710 Alternative G3b ndash Proposed Recovery Wells Lower Aquifer Figure 711 Alternative G3b ndash Relative Positions of Proposed Recovery Wells Medial and
Lower Aquifer Figure 712 Alternative G4a ndash Proposed Treatment Curtain and Recovery Wells Lower
Aquifer Figure 713 Preliminary Locations for Mid-Plume Injection Wells Leading Edge Recovery
Wells and Groundwater Treatment Building ndash Alternative G4 Figure 714 Alternative G4b ndash Proposed Treatment Curtains and Recovery Wells Lower
Aquifer Figure 715 Alternative G4b ndash Relative Positions of Proposed Recovery Wells and
Treatment Curtains
5
5
5
5
5
50
100 500
MW-6A SB-39 HGLmdashGroundwater Flow Modeling Technical MemorandumMW-2AHTW 40 (98)(ND)MW-8A MW47B ( Garvey Elevator SitemdashHastings NE(ND)
(59) SB-38
MW-19APSUS PU PPPUUU ( Figure 31 (70)MW-33 MW-3AB
Carbon Tetrachloride in the(ND53) MW49B MW-20A
+UP+UPPPP+U+U+UPPPPUUUU+UP+UPPPP+U+U+U(43) Upper Aquifer Zone AB(10)
MW-1A PU MW50B(ND) +UP+UPPPP+U+U+U September 2011 Sampling(84)
PPUUMW-4AB PPUU MW-13CE +++++UPUPPPPUUU (21640)
MW-30A (160)+UP+UPPPP+U+U+U LegendPPPUUU
1000 MW51B (1200) MW-5AB
(4119J)
Garvey Property BoundaryMW-7AB MW-31A (ND) (75) (
PPUU MW48B RailroadSB-33 (680)
Inset Ntilde Monitoring Well Location MW-47B MW-10A
(59) (ND) Multilevel Well MW-9A MW-6AHTW 40 MW-10B(ND) (98)
(ND) MW-11A S Hydraulic Conductivity
MW-33 UPPUMW-2A MW-19AU MW-14A(ND) P
(70) PU (ND) A West Highway 6 amp Highway 281 Site MW-12A AMW-106AMW-20A MW-104AMW-3A MW-8A (ND) Monitoring WellU UUU (ND)PSSU P PPP (10)(ND) (ND)(ND) U
UUUUU PUUUUP PPPPPPPPPPPPPPPPPPPPPPPUUUUPUPPPPUUUUU MW-13CE
UUUU Carbon Tetrachloride ConcentrationMW-3B MW-105A A (190)PPP A (ND)
UUUUUUUUU(53) MW-30A in micrograms per liter (microgL)PPUUPPPUUUPPPPPUUUUU
MW-12DMW-1A (160) MW-42 DEMW-45CD(ND)
MW-50B MW-49B MW-51B Carbon Tetrachloride Isoconcentration(84) PPUUPPUU(43)
PPUU(1200)
Contour (microgL)PPPUUU PPPUUUMW-46 D1D2MW-7B (5)(ND)
(Dashed Lines are Estimated)MW-7A (ND)
MW-5A (41)
MW-4A (21) MW-4B (640)
MW-48B (680)
MW-17A (ND)
MW-16A (ND) UUPP
MW-18A (ND)
MW-41 D1D2 UUPP
MW-44 DE UUPP
MW-5B
MW-31A (75)
(19)
MW-43 DE UUPP Notes
(ND) Nondetect
0 2500 5000
Feet sup3 Filename XEPA009GarveyGW_Flow_Tech_Memo Carbon_TetChl_UpperAquifer_ABmxd Project EP903401220202 Revised 061312 ST Source ENSR GDB 2008 DNR
100
5
100
SB-39MW-6AHTW 40 HGLmdashGroundwater Flow Modeling Technical Memorandum MW47C SB-38MW-33 MW-2A (62) ( Garvey Elevator SitemdashHastings NE
UUUPSUS P PPP (
U
Figure 32MW-8A MW-3ABDE MW-19C (ND) Carbon Tetrachloride in the
MW-1A +++++PPPP UPUPPPPUUUUUUU
+UP+UPPPP+U+U+U Medial Aquifer Zone CPU MW-20C +UP+UPPPP+U+U+U (ND) September 2011 SamplingMW49C
UU(ND) PPUU +++++PPPPPPPUUUUU MW50C
(ND) +UP+UPPPP+U+U+UPPPUUU LegendMW-13C
MW-4AB (130) MW-30C
MW-5AB (ND) MW48C MW51C
(ND) (ND) Garvey Property Boundary SB-33 (
MW-7AB PPUU MW-31C (ND) Railroad
Inset Ntilde Monitoring Well Location MW-47CMW-9A MW-10AB Multilevel Well(62)
HTW 40
MW-6A S Hydraulic Conductivity WellMW-11AMW-33 PPUUMW-2A
MW-19CUP (ND) P West Highway 6 amp Highway 281 SiteU MW-14A A A Monitoring WellMW-20C MW-12C MW-106CMW-104CPSS P PPP
U (ND) (ND) (90) (ND)
MW-8A MW-13C U U UUU
PMW-3ABDE PPPPPPPPUUUUPU (130) Carbon Tetrachloride ConcentrationPU UUUU UUUUUUUUUU
MW-105C A (190)MW-1A UUUUUUUUUPPPPPPPPPPPPPPPPPPP MW-30C PPPUUU MW-12D A (200) in micrograms per liter (microgL)
MW-49C UUUUPUPPPPUUPU (ND) UPPU Old Rolls MW-42 DEPP (13)(ND) Carbon Tetrachloride Isoconcentration MW-45C MW-50C (ND)
MW-51C (ND) PPUU PPUU PPUU (5) Contour (microgL)(ND)
UUU PPP MW-46 D1D2
PPP UUUMW-48C (Dashed Lines are Estimated)5MW-7AB (ND)
MW-4AB MW-17C MW-18C(ND) MW-44 DE Domestic Irrigation W ater Wells(81)MW-5AB
PPUUMW-31C MW-16C (ND)
PPUU(ND) MW-41 D1D2
PPUU
Notes MW-43 DE PPUU
(ND) Nondetect
0 2500 5000
Feet sup3 FilenameXEPA009GarveyGW_Flow_Tech_Memo Carbon_TetChl_Medial_Aquifer_Cmxd Project EP903401220202 Revised 061312 ST Source ENSR GDB 2008 DNR
50
5
5
50 100
MW-6D SB-39 HGLmdashGroundwater Flow Modeling Technical MemorandumHTW 40 (ND) SB-38MW-3DE ( Garvey Elevator SitemdashHastings NE (NDND)
UUUUPSUS P PPP MW-19AC( Figure 33MW-2A MW-33 MW47D
U (ND)
Carbon Tetrachloride in theMW-8A PPPPUUUU P Lower Aquifer Zone DEUMW-1A MW-20DEPU P
(NDND)UPUU
September 2011 Sampling MW-13EPPUUPPPU (ND)
MW50D UPMW49D (ND) UUU(ND) PPP MW-30DE Legend MW51D (ND)
(ND)MW-4AB MW48D (ND)
MW-7AB MW-5D (ND) Garvey Property Boundary
MW-31C (ND)
PPUU
(
RailroadSB-33MW-3DE (NDND)
Inset Ntilde Monitoring Well Location MW-47D
MW-9A (ND) Multilevel Well HTW 40
MW-6D MW-10AB (ND)
MW-11A S Hydraulic Conductivity Well MW-33 MW-2A UPPU
PUMW-19AC West Highway 6 amp Highway 281 Site MW-14A APU
MW-20DE MW-106D A Monitoring WellMW-104DPSSU PU PPPUUU (NDND)
MW-12C (ND)(ND)MW-8A MW-13E PU
UUUUU (ND) Carbon Tetrachloride ConcentrationU PPPPPPPPUUUUPU (190)PPUUU
PPUPPPPPPPPPPPPPPPUUUUUP
UUUUU UUUUUUU PPP A MW-105DMW-1A in micrograms per liter (microgL) AMW-30DE
PPUUPPPUUUPPPPPUUUUU(52)
(NDND) MW-12DNew RollsMW-49D (ND) (ND)
Carbon Tetrachloride Isoconcentration(ND) MW-45D PPUUMW-51D (ND)
MW-46 D1PPUU PPUU Contour (microgL)MW-50D (ND) (5)(ND)
PPPUUU (770)PPPUUU MW-42 DMW-48D (Dashed Lines are Estimated)MW-4AB (4274)(ND)
MW-44DEMW-46 D2 MW-17D (320) (19ND)MW-7AB
MW-5D Domestic Irrigation W ater Wells(94) MW-18D PPUUMW-31C(ND) (21) MW-41 D1MW-5B MW-16C PPUU (ND)
PPUUMW-41 D2 (10) Notes
MW-43DE UUPP(ND18) (ND) Nondetect
0 2500 5000
Feet sup3 Filename XEPA009GarveyGW_Flow_Tech_Memo Carbon_TetChl_LoweR_Aquifer_Dmxd Project EP903401220202 Revised 061312 ST Source ENSR GDB 2008 DNR
_L _j I I I I _j_ I I I
I l --- I 111
1
__u_ I I
1 I ~ N ----y-
+ ~ I
II L _l e11111111111 I ---1 ~lJJ I n r Igt I Constant Head Boundariesj l _Q No Flow Sound aries I I l
~ r-- I - I middot r-
- fl+- L -
0 I J ~r-
Ll-D l Garvey Site I - ~t
Ill -J
l unJprm Spacing 25 eet U~iform S pacing 1 00 feet I Constant Head Boundaries
j
middotmiddot- ~ No Flow Sound aries
J
--=J--=11-~=======2~-----~3=========4~------5 M1les 0 05
Figure 51 Model Domain Gridding and Boundaries
Figure 52 Vertical Discretization of Model
1610
1620
1 6 2 0
1630
1 6 3 0
1640
1 6 4 0
1650
1 6 5 0
1660
1660
1670
1670
1680
1680
1690
17
1698
17013
16918
169198
169118
165864
167129
168901
169482
169872
169403
169347
169374
169448
Figure 53 Elevation of the Model Base (weathered shale of the Niobrara Formation)
1111
I I
-
N
+ 0 05
I I
I 1 l
I
1 l -
2 3 4 Miles
Figure 54 Elevation of the Top of the Lower Aquifer
Figure 55 Isopach Map of Lower Confining Unit (model Layer 4)
Figure 56 Elevation of the Base of the Medial Aquifer
Figure 57 Isopach of Upper Aquitard (model layer 2)
Figure 58 Elevation of the Base of the Upper Aquifer
I I I
~ ~ t--7 t bull I I I
r I l
I EW-01 f1-m I N I bull __ j
+ twtrl I I I rl bull I I I I J I I I -r-----
- middot-- - -- -- middot------__J_--
I --- 1 Feet I 0 500 1 000 2000 3000 4000 rooo I I I I
Figure 59 Location of Recovery Wells in the Shallow Aquifer
_l ________ l I I I -1 middot ] l ~----------middotj + I j
middotmiddot= middotmiddot- ---------L -- ---- ___ _ [_ __
r--------shy1
o--~oomiddoto~bull1~oo=o ======4~oomiddoto------middot~ooco=======43oobullo -------~oo~1
Figure 510 Location of Recovery Wells in the Medial Aquifer
I I r
~~ r -
L - - - -- -1--ltmiddot --I-
I -
---- L f+r
il I
J ---1
I
N
+
Figure 511 Location of Injection and Municipal Wells in the Lower Aquifer
Figure 512 Initial Concentrations of Carbon Tetrachloride in the Shallow Aquifer
Figure 513 Initial Concentrations of Carbon Tetrachloride in the Medial Aquifer
Figure 514 Initial Concentrations of Carbon Tetrachloride in the Lower Aquifer
-40
-30
-20
-10
00
10
20
30
40
17741 17828 17915 18002 18090 18177
Res
idua
l
Layer 1
Layer 3
Layer 5
Observed Value
Figure 61 Error Residuals Versus Measured Water Levels
Layer 1
Layer 3
18090
18177
Layer 5
Mod
el V
alue
17741 17828 17915 18002 18090 18177
18002
17915
17828
17741
Observed Value
Figure 62 Measured Water Levels Versus Predicted Water Levels
bull -020
N
+ 0
h I I
-----------~----j_ _______ ___ j_94-__ _ __ I ------------- t
011
bull 005
05
bull
I
Mile 1
Figure 63 Error Residuals for the Shallow Aquifer in the vicinity of the Garvey Elevator Site
Figure 64 Error Residuals for the Shallow Aquifer Over the Model Domain
-007 bull
N
+
il _ __ ~ II
t079 i
I 1 II_ --middot--middot- J_~=====-middot 1------~
~--1 000 r-----middot- -middotmiddot ____
-021 bull
-012 007 bull bull
l middot l02
I ~~~~====~---====~---Feet _ o ___ _ $-_~_0 _ ___ _ J000 _____ 3QQ_Q_ ---4lIJOLUlJ00----ltgt5ultOOO-- middott- middot ----
I
Figure 65 Error Residuals for the Medial Aquifer Over the Model Domain
0 250
N
+
044 bullbull -042
000 bull
027 bull
013
-)35 bull
Figure 66 Error Residuals for the Lower Aquifer in the Vicinity of the Garvey Elevator Site
Figure 67 Error Residuals for the Lower Aquifer in the Entire Model Domain
Figure 68 Calibrated Hydraulic Conductivities of the Shallow Aquifer (ftd) (model layer 1)
Figure 69 Calibrated Hydraulic Conductivities of the Medial Aquifer (ftd) (model layer 3)
Figure 610 Calibrated Hydraulic Conductivities of the Lower Aquifer (ftd) (model layer 5)
Figure 611 Calibrated Hydraulic Conductivities of the Upper Aquitard (ftd) (model layer 2)
Figure 612 Calibrated Hydraulic Conductivities of the Lower Aquitard (ftd) (model layer 4)
Figure 613 Calibrated Potentiometric Surface of the Shallow Aquifer (model layer 1)
Figure 614 Calibrated Potentiometric Surface of the Medial Aquifer (model layer 3)
Figure 615 Calibrated Potentiometric Surface of the Lower Aquifer (model layer 5)
Figure 616 Particle Tracking Analysis to Estimate Travel Time
Figure 71 Initial Concentrations for Alternative SG3
E3 E3 2000feet
Figure 72 Capture Zone Analysis in the Shallow Aquifer for Alternative SG3
E3 E3 E3 2000feet
Figure 73 Capture Zone Analysis in the Medial Aquifer for Alternative SG3
Figure 74 Alternative G2-Proposed Recovery Wells Medial Aquifer
Figure 75 Alternative G2- Proposed Recovery Wells Lower Aquifer
50
5 5
5
50 100
MW-3DE (NDND)
MW-47D MW-9A (ND)
HTW 40 MW-6D MW-10AB
(ND) MW-11A
MW-2AMW-33 UPPUPU
MW-19AC MW-14A APUMW-20DE MW-106DMW-104D(NDND) MW-12CPSSU (ND)PU PPPUUU PU (ND) MW-13E
HGLmdashGroundwater Flow Modeling Technical Memorandum Garvey Elevator Superfund SitemdashHastings NE
Figure 76 Preliminary Locations for Leading
Edge Recovery Wells and Groundwater Treatment Building-Alternative G2
Legend Garvey Property Boundary
Railroad
Ntilde Monitoring Well Location
Multilevel Well
S Hydraulic Conductivity Well
A West Highway 6 amp Highway 281 Site Monitoring Well
(190) Carbon Tetrachloride Concentration in micrograms per liter (microgL)
Carbon Tetrachloride Isoconcentration Treatment Building
Technical Blvd
MW-8A UUUU UUUUU
U PPPPPPPPUUUUPU UUUUUUPUP
UUUUUPPPPPPPPPPPPPPPPPP (ND)
PPPUUU A MW-105DMW-1A UU AMW-30DE PPUUPPPUUUPPPPPUUUUU
(52)(NDND) MW-12DNew Rolls Contour (Lower Aquifer) (microgL)MW-49D (5)(ND) (ND)
(ND) MW-45D (Dashed Lines are Estimated)PPUUMW-51D (ND) MW-46 D1PPUU PPUUMW-50D
(ND) (ND)
PPPUUU (770)PPPUUU MW-42 DMW-48D Domestic Irrigation W ater WellsMW-4AB (4274) MW-44DE(ND)
(19ND)MW-46 D2 MW-17D (320)MW-7AB Carbon Tetrachloride Isoconcentration(94)MW-5D
MW-18D PPUU (5) Contour (Upper Aquifer) (microgL)(21) MW-41 D1 MW-31C(ND)
MW-5B MW-16C PPUU (Dashed Lines are Estimated)(ND)
PPUUIdlewilde Rd
MW-41 D2 Recovery Wells (Medial)
Recovery Wells (Deep)
(10)
MW-43DE PPUU(ND18)
Recovery Well Piping
Treatment Building
Notes (ND) Nondetect
Blaine A
ve
Showboa t B
lvd
sup3 Filename XEPA009GarveyGW_Flow_Tech_Memo Carbon_TetChl_LoweR_Aquifer_Dmxd Project EP903401220202 Revised 061312 ST2500 5000 Source ENSR GDB 2008 DNR
Feet
0
Figure 77 Alternative G3ab-Proposed Recovery Wells Medial Aquifer
Figure 78 Alternative G3a- Proposed Recovery Wells Lower Aquifer
50
5 5
5
50 100
HGLmdashGroundwater Flow Modeling Technical Memorandum Garvey Elevator Superfund SitemdashHastings NE
Figure 79 Preliminary Locations for Mid-Plume and
Leading Edge Recovery Wells and Groundwater Treatment Building-Alternative G3
Legend Garvey Property Boundary
Railroad
Ntilde Monitoring Well Location MW-3DE (NDND)
Multilevel Well MW-47D
MW-9A (ND) Hydraulic Conductivity WellSHTW 40 MW-6D MW-10AB
(ND) West Highway 6 amp Highway 281 SiteMW-11A
MW-33 PPUUMW-2A PUA Monitoring Well
MW-19AC MW-14A APUCarbon Tetrachloride Concentration
Technical Blvd
MW-44DE (19ND) (Dashed Lines are Estimated)
MW-20DE (190)MW-106DPSSU PU PPPUUU MW-104DMW-12C(NDND) (ND)PU in micrograms per liter (microgL)(ND) MW-13EMW-8A
U UUUU UPUPPPPUUUUUUUUP UUUUU UUUPPPPPPPPPPPPPPPPPPPPPPPUUUUUU
(ND) PPPUUU A Treatment BuildingMW-105DMW-1A Carbon Tetrachloride IsoconcentrationMW-30DE A
PPUUPPPUUUPPPPPUUUUU(52)
(NDND) MW-12DNew Rolls Contour (Lower Aquifer) (microgL)MW-49D (5)(ND) (ND)(ND) MW-45D
MW-51D PPUU(ND)
PPUU PPUUMW-50D (ND)
MW-46 D1(ND) PPPUUU (770)
PPPUUU MW-42 D (4274)
MW-48D Domestic Irrigation W ater WellsMW-4AB (ND) MW-46 D2
MW-17DMW-7AB (320)(94) Carbon Tetrachloride IsoconcentrationMW-5D
MW-18D(ND) MW-31C (21) PPMW-41 D1
UU (5) Contour (Upper Aquifer) (microgL)MW-5B MW-16C UU (ND)PP (Dashed Lines are Estimated)PPUUIdlewilde Rd
MW-41 D2 Recovery Wells (Medial)(10)
MW-43DE UUPP(ND18) Recovery Wells (Deep)
Recovery Well Piping
Treatment Building
Notes (ND) Nondetect
Blaine A
ve
Showboa t B
lvd
sup3 Filename XEPA009GarveyGW_Flow_Tech_Memo Mid-Plume_Prelim_Loc Project EP903401220202 Revised 061312 RL2500 5000 Source ENSR GDB 2008 DNR
Feet
0
Figure 710 Alternative G3b-Proposed Recovery Wells Lower Aquifer
Figure 711 Alternative G3b-Relative Positions of Proposed Recovery Wells Medial and Lower Aquifers
Figure 712 Alternative G4a-Proposed Treatment Curtain and Recovery Wells Lower Aquifer
50
5 5
5
50 100
HGLmdashGroundwater Flow Modeling Technical Memorandum Garvey Elevator Superfund SitemdashHastings NE
Figure 713 Preliminary Locations for Mid-Plume
Injection Wells Leading Edge Recovery Wells and Groundwater Treatment Building
-Alternative G4
Legend Garvey Property Boundary
Railroad
Ntilde Monitoring Well Location MW-3DE (NDND)
MW-47D MW-9A (ND)
HTW 40 MW-6D MW-10AB
(ND)
S Elm
Ave
S Wabash A
ve
Multilevel Well
S Hydraulic Conductivity Well
A West Highway 6 amp Highway 281 Site Monitoring Well
MW-11AMW-33 UPPUMW-2A PU
MW-19AC MW-14A APUMW-20DE MW-106D Carbon Tetrachloride ConcentrationPU PPPUUU (190)PSSU MW-104D(NDND) MW-12C (ND)PU in micrograms per liter (microgL)(ND)
Treatment Building Technical B
lvd MW-13EMW-8A
UUUU UUUUUU PPPPPPPPUUUUPU UUUUU
UPUP
UUUUUPPPPPPPPPPPPPPPPPP (ND)
PPPUUU A MW-105DMW-1A UU Carbon Tetrachloride IsoconcentrationAMW-30DE PPUUPPPUUUPPPPPUUUUU
(52)(NDND) MW-12DNew Rolls Contour (Lower Aquifer) (microgL)MW-49D (5)(ND) (ND)
(ND) MW-45D (Dashed Lines are Estimated)PPUUMW-51D (ND) MW-46 D1PPUU PPUUMW-50D
(ND) (ND)
PPPUUU (770)PPPUUU MW-42 DMW-48D Domestic Irrigation W ater WellsMW-4AB (4274)(ND) MW-44DEMW-46 D2
(19ND)MW-17D (320)MW-7AB Carbon Tetrachloride Isoconcentration(94)MW-5D MW-18D PPUU (5) Contour (Upper Aquifer) (microgL)(21) MW-41 D1
MW-31C(ND) MW-5B MW-16C PPUU (Dashed Lines are Estimated)(ND)
PPUUIdlewilde Rd
MW-41 D2 Recovery Wells (Medial)
Recovery Wells (Deep)
(10) Injection Area 1 MW-43DE PPUUPermanent Injection Well Spacing 40 ft (ND18)
Total Injection Wells Installed 39 Recovery Well Piping Injection Area (40 ft spacing between the wells) Treatment Building
Notes (ND) Nondetect
Blaine A
ve
Showboa t B
lvd
S Baltim
ore Ave
sup3 Filename XEPA009GarveyGW_Flow_Tech_Memo G4_Prelim_Loc_Inj_Areamxd Project EP903401220202 Revised 061312 RL2500 5000 Source ENSR GDB 2008 DNR
Feet
0
Figure 714 Alternative G4b-Proposed Treatment Curtains and Recovery Wells Lower Aquifer
Figure 715 Alternative G4b-Relative Positions of Proposed Recovery Wells and Treatment Curtains

HGLmdashGroundwater Flow Modeling Technical Memorandum Garvey Elevator Site ndash Hastings NE
As shown on Figure 72 particles released to all the model layers indicate that the extraction wells are effectively containing the on-site carbon tetrachloride plume At some point downgradient however capture is lost and the contaminants will continue to migrate with the groundwater
Medial Aquifer
The results of the particle-tracking analysis for the medial aquifer are presented as Figure 73 The particle tracking illustrates that the modeled capture zone extends sufficiently downgradient to capture the contamination that has moved immediately off site
The predicted remediation time for this alternative is about 2 years (Table 72) The removal of the contamination with the pumping wells has shortened the time from that predicted for Alternative SG3 As was the case for Alternative SG3 these predictions are unrealistically short for the same reasons For these reasons the remediation time for alternative SG3 was increased to 10 years
73 OU 2 - REMEDIAL ALTERNATIVES
Six remedial alternatives were considered for OU 2 (Table 72) Although it was not modeled based on the predicted remediation times of greater than 100 years for the G2 scenario the No-Action alternative (G1) remediation time is predicted to take more than 100 years However for cost estimating purposes it will be assumed that the duration for SG-1 is 30 years
731 G2 - Groundwater Recovery and Treatment at Leading Edge of Plume
This alternative involves pumping and treating the groundwater from the toe of the medial and lower aquifer plumes As shown in Figures 74 and 75 three wells would need to be placed in both the medial and lower aquifers to ensure capture of the plume The relative position of the two sets of wells is depicted on Figure 76 Each of the medial wells would be pumped at 50 gpm and the lower aquifer wells would each be pumped at 150 gpm The predicted remediation time for this alternative is greater than 100 years For costing purposes a duration of 100 years is assumed
732 G3a - Groundwater Recovery and Treatment at Leading Edge and Midpoint of Plume
This alternative is the same as Alternative G2 but in addition to pumping and treating contaminated groundwater from the toe of the plume contaminated groundwater is also pumped and treated from the midpoint of the medial and lower aquifer plume(s) A series of simulations were run in which the midpoint wells were located along different transects in order to decrease the remediation times the most optimal locations are shown in Figures 77 and 78
US EPA Region 7 Garvey Groundwater Flow Modeling Memo 18 July 2012
HGLmdashGroundwater Flow Modeling Technical Memorandum Garvey Elevator Site ndash Hastings NE
The relative position of the two sets of wells is depicted on Figure 79 Each of the medial wells would be pumped at 50 gpm and the lower aquifer wells would each be pumped at 150 gpm The predicted remediation time for this alternative is between 75 and 95 years For cost estimating purposes a duration of 75 years will be assumed
733 G3b - Groundwater Recovery and Treatment at Leading Edge and Midpoint of Medial Aquifer and Two Recovery Well Transects in Lower Plume
The results from G3a indicate that the contamination in the lower aquifer takes the longest time to remediate Therefore this alternative was added to determine how much the remediation times could be reduced if a second set of recovery wells was added to the lower aquifer The placement of the recovery wells in the medial aquifer remains the same as for Alternative G3a (Figure 77) The locations of the two transects of recovery wells in the lower aquifer are shown on Figure 710 Their placement relative to the medial wells is shown in Figure 711 Each of the medial wells would be pumped at 50 gpm and each of the lower aquifer wells would be pumped at 150 gpm The predicted remediation time for this alternative is about 53 years
734 G4a - Establishment of In Situ Treatment Zone at Midpoint of Lower Aquifer Plume and Groundwater Recovery and Treatment at Leading Edge of Medial and Lower Plumes
This alternative involves adding a treatment curtain to the pumping wells specified in the G2 alternative (Figure 712) The transect is simulated as a zero concentration boundary which effectively removes all of the carbon tetrachloride from the groundwater moving through it The relative position of the transect and wells is depicted on Figure 713 Each of the medial wells would be pumped at 50 gpm and each of the lower aquifer wells would be pumped at 150 gpm The predicted remediation time for this alternative is between 75 and 95 years For cost estimating purposes a duration of 75 years is assumed
735 G4b - Establishment of In Situ Treatment Zone(s) at Two Transects of Lower Aquifer Plume and Groundwater Recovery and Treatment at Leading Edge of Medial and Lower Plumes
This alternative involves adding two treatment curtains to the pumping wells specified in the G2 alternative (Figure 714) The relative position of the transects and recovery wells is depicted on Figure 715 Each of the medial wells would be pumped at 50 gpm and the lower aquifer wells each at 150 gpm The predicted remediation time for this alternative is about 56 years
80 SUMMARY AND CONCLUSIONS
A hydrogeologic conceptual site model of the subsurface groundwater flow and contaminant transport was developed to guide the creation of a numerical model The numerical model
US EPA Region 7 Garvey Groundwater Flow Modeling Memo 19 July 2012
HGLmdashGroundwater Flow Modeling Technical Memorandum Garvey Elevator Site ndash Hastings NE
was subsequently calibrated with existing field data (known water levels and pumping rates) to address the following objectives (1) evaluate the overall effectiveness of the current extraction well system (2) identify areas outside of the capture zone that may require enhancements and (3) develop a tool to assist in ldquowhat ifrdquo scenarios for the remedial alternative development
MODFLOW-2000 MT3D-MS and MODPATH are the computer codes applied to conduct the flow and transport analysis The output from MODFLOW-2000 is a groundwater velocity field which is used by MT3D-MS in conjunction with fate and transport parameters to simulate the migration of carbon tetrachloride Particle tracking analyses were also conducted with MODPATH to illustrate the groundwater flow directions travel times and capture zones All of these computer codes are widely used well documented and in the public domain
With respect to the construction of the model a three layer finite difference grid was utilized that simulates the upper middle and lower aquifers covers 102 square miles and includes 1030200 active cells
Calibration of the steady state flow model was accomplished iteratively by adjusting model parameters during successive model runs to match the water level data that was collected from all of the wells on September 26-27 2011 under stressed (pumping) conditions
The flow and transport model was initialized with measured carbon tetrachloride data obtained during a 2011 sampling event These initial concentrations were used as the basis to predict future concentrations under various remedial alternatives involving extraction wells and treatment curtains
Remediation times for OU 1 scenarios varied from 10 to 30 years Scenarios from the No Action alternative and alternative SG-2 were not modeled but were based on an assumed cost basis period and a duration based on existing concentration data trends respectively Remediation times for OU 2 scenarios range from 30 years to more than 100 years
90 REFERENCES
Doherty J 2006 PEST Model-Independent Parameter Estimation User Manual 5th Edition Watermark Computing
Harbaugh AW Banta ER Hill MC and McDonald MG 2000 MODFLOWndash2000 the US Geological Survey Modular Ground-Water ModelmdashUser guide to modularization concepts and the ground-water flow process US Geological Survey Open-File Report 00ndash92 121 p
HydroGeoLogic Inc (HGL) 2009 Focused Feasibility Study Version 4 Garvey Elevator Site OU 1 Garvey Elevator Site Hastings Nebraska December
HGL 2011 Final Remedial Investigation Report Garvey Elevator Site Hastings Nebraska April
US EPA Region 7 Garvey Groundwater Flow Modeling Memo 20 July 2012
HGLmdashGroundwater Flow Modeling Technical Memorandum Garvey Elevator Site ndash Hastings NE
McDonald MG and AW Harbaugh 1988 A Modular Three-dimensional Finite-difference Groundwater Flow Model US Geological Survey TWRI Chapter 6-A1
Pollock DW 1994 Userrsquos Guide for MODPATHMODPATH-PLOT Version 3A particle tracking post-processing package for MODFLOW the U S Geological Survey finite-difference ground-water flow model U S Geological Survey Open-File Report 94shy464
Rumbaugh JO and DB Rumbaugh 1998 Groundwater Vistas Version 516 Environmental Simulations
US Army Corps of Engineers (USACE) 1990 Final Groundwater Modeling Report Hastings East Industrial Park Remedial InvestigationFeasibility Study Hastings Nebraska August
Zheng C 1990 MT3D A modular three-dimensional transport model for simulation of advection dispersion and chemical reactions of contaminants in groundwater systemsrdquo Report to the US Environmental Protection Agency Robert S Kerr Environmental Research Laboratory Ada OK
Zheng Chunmiao and Wang P Patrick 1999 ldquoMT3DMS A modular three-dimensional multispecies transport model for simulation of advection dispersion and chemical reactions of contaminants in groundwater systems documentation and userrsquos guiderdquo Contract Report SERDP-99-1 US Army Engineer Research and Development Center Vicksburg Mississippi
Attachments
Attachment 1 Tables Attachment 2 Figures
US EPA Region 7 Garvey Groundwater Flow Modeling Memo 21 July 2012
This page was intentionally left blank
ATTACHMENT 1 TABLES
Table 51 Table 61 Table 71 Table 72
Contact Elevations of the Major Lithologic Units Water Level Calibration Statistics Groundwater Data Summary Projected Durations to Meet MCLs Remedial Alternatives Summary
This page was intentionally left blank
Table 51 Contact Elevations of the Major Lithologic Units
Garvey Elevator Site Hastings Nebraska
Elev Depth Elev Depth Elev Depth Elev Thickne Depth Elev Depth Elev Thickne Depth Elev Depth Elev (ft) (ft) (ft bgs) (ft amsl) (ft bgs) (ft amsl) (ft bgs) (ft amsl) (ft bgs) (ft amsl) (ft) (ft bgs) (ft amsl) (ft bgs) (ft amsl) (ft) (ft bgs) (ft amsl) (ft bgs) (ft amsl)
OU1 MW-1A 270590926 2080164407 125 192580 645 186130 995 182630 -- -- -- -- -- -- -- -- -- -- -- --OU1 MW-2A 271240410 2080539870 1235 192733 685 185883 835 184383 -- -- -- -- -- -- -- -- -- -- -- --OU1 MW-3ABDE 270755170 2080773994 243 193099 595 187149 111 181999 134 179707 1 135 179607 155 177530 1 156 177430 2385 169249 OU1 MW-4AB 270341995 2080827075 132 193184 585 187334 89 184284 -- -- -- -- -- -- -- -- -- -- -- --OU1 MW-5ABD 269943836 2080752777 188 193006 635 186656 885 184156 132 179785 1 133 179685 -- -- -- -- -- -- --OU1 MW-6ADE 271237345 2081216968 238 192948 735 185598 935 183598 129 180046 1 130 179946 155 177446 5 160 176946 -- --OU1 MW-7AB 269088475 2079699700 135 192092 55 186592 90 183092 -- -- -- -- -- -- -- -- -- -- -- --OU1 MW-8A 271214203 2079067544 132 194080 608 188000 90 185080 -- -- -- -- -- -- -- -- -- -- -- --OU1 MW-9A 272193736 2080628145 116 192540 70 185540 90 183540 -- -- -- -- -- -- -- -- -- -- -- --OU2 MW-10AB 272535399 2081973782 130 192381 65 185881 85 183881 125 179870 1 126 179770 -- -- -- -- -- -- --OU2 MW-11A 271826499 2083509070 110 191228 70 184228 90 182228 -- -- -- -- -- -- -- -- -- -- -- --OU2 MW-12AC 270399710 2085390335 170 191713 50 186713 805 183663 -- -- -- -- -- -- -- -- -- -- -- --
OU2 (new) MW-12D 270399901 2085403521 178 191698 57 185998 88 182898 120 179698 7 127 178998 -- -- -- -- -- -- --OU1 MW-13CE 270368902 2081015694 238 192874 75 185374 90 183874 130 179874 1 131 179774 -- -- -- -- -- 235 169374 OU2 MW-14A 270968774 2084137323 1085 190956 695 184006 895 182006 -- -- -- -- -- -- -- -- -- -- -- --OU2 MW-16AC 267054564 2084286931 160 191545 50 186545 80 183545 -- -- -- -- -- -- -- -- -- -- -- --OU2 MW-17ACD 268796556 2082958916 200 190185 60 184185 85 181685 -- -- -- -- -- -- -- -- -- -- -- --OU2 MW-18ACD 268693818 2085938384 205 191064 55 185564 95 181564 1155 179514 1 1165 179414 -- -- -- -- -- -- --OU1 MW-19AC 270955133 2081332850 165 192781 61 186681 895 183831 128 179981 8 136 179181 150 177781 2 152 177581 -- --OU1 MW-20ACDE 270597445 2081202233 255 192797 54 187397 87 184097 129 179897 7 136 179197 150 177797 2 152 177597 236 169197 OU1 MW-30ACDE 270271723 2081095430 255 192903 70 185903 85 184403 1255 180353 7 1325 179653 146 178303 2 148 178103 237 169203 OU1 MW-31AC 269550764 2080816035 165 193008 63 186708 883 184178 -- -- -- -- -- -- -- -- -- -- -- --OU1 MW-33 271206314 2079068057 255 194074 84 185674 95 184574 1385 180224 55 144 179674 167 177374 675 17375 176699 240 170074
OU1 (new) MW-47BCD 270781240 2081046150 1705 192995 -- -- -- -- 1315 179845 15 133 179695 151 177895 2 153 177695 -- --OU1 (new) MW-48BCD 270645490 2080859850 171 192887 -- -- -- -- 129 179987 35 1325 179637 1498 177907 5 1548 177407 -- --OU1 (new) MW-49BCD 270039470 2080890150 171 192934 -- -- -- -- 1305 179884 15 132 179734 1495 177984 4 1535 177584 -- --OU1 (new) MW-50BCD 270307290 2080987510 170 192925 -- -- -- -- 1275 180175 5 1325 179675 1495 177975 1 1505 177875 -- --OU1 (new) MW-51BCD 270487290 2080899910 171 192943 -- -- -- -- 1268 180263 52 132 179743 1495 177993 45 154 177543 -- --OU2 (new) MW-41D1 266698811 2089673996 171 191524 62 185324 92 182324 126 178899 2 128 178699 148 176699 2 150 176499 -- --OU2 (new) MW-41D2 266708267 2089674259 206 191499 62 185299 92 182299 126 178899 2 128 178699 148 176699 2 150 176499 -- --OU2 (new) MW-42DE 269168074 2100135574 215 190207 66 183607 98 180407 124 177823 10 134 176823 -- -- -- -- -- -- --OU2 (new) MW-43DE 265395404 2097605590 2215 190835 48 186035 89 181935 -- -- -- -- -- 153 175545 2 155 175345 -- --OU2 (new) MW-44DE 267552324 2105258206 214 188530 63 182230 92 179330 119 176630 3 122 176330 1425 174280 75 150 173530 -- --OU2 (new) MW-45CD 270056199 2083476668 170 190982 50 185982 89 182082 112 179746 3 115 179446 -- -- -- -- -- -- --OU2 (new) MW-46D1 269055295 2089632928 167 191097 61 184997 94 181697 121 179003 3 124 178703 148 176303 6 154 175703 -- --OU2 (new) MW-46D2 269063843 2089632455 202 191103 61 185003 94 181703 121 179003 3 124 178703 148 176303 6 154 175703 -- --
Hwy 6 MW-104ACD 271937379 2088225393 235 190901 472 186181 936 181541 115 179401 12 127 178201 -- -- -- -- -- 220 168901 Hwy 6 MW-105ACD 270069428 2089866388 257 191679 68 184879 105 181179 123 179379 10 133 178379 -- -- -- -- -- 2455 167129 Hwy 6 MW-106ACD 270452369 2098166199 255 190664 77 182964 1075 179914 130 177664 5 135 177164 -- -- -- -- -- 248 165864 OU1 I-1 270863284 2080138346 175 19212 -- -- -- -- -- -- -- -- -- -- -- -- -- -- -- --OU1 I-2 270331729 2080131336 175 19200 -- -- -- -- -- -- -- -- -- -- -- -- -- -- -- --OU1 HTW-40 271217856 2079157749 -- 19395 -- -- -- -- -- -- -- -- -- -- -- -- -- -- -- --
Hwy 6 HTW-100 273075261 2082012337 255 19066 770 182964 1076 179904 130 177664 55 -- -- -- -- -- -- -- -- --
Surface Elevation -
Surficial Soil Peoria and
Loveland Loess
Very Fine Sand Silty Fine Sand
Clayey Silt
Silty Sand and Gravel (contains Upper Aquifer)
Upper Aquitard Medial Aquifer
Monitoring Wells
Boring DepthEasting(2)Northing(2)
Well ID Lower Aquitard Lower AquiferSite
Top of Lithologic and Hydrostratigraphic Units(1)
Decomposed Weathered
Shale
Sheet 1 of 2
Table 51 Contact Elevations of the Major Lithologic Units
Garvey Elevator Site Hastings Nebraska
Elev Depth Elev Depth Elev Depth Elev Thickne Depth Elev Depth Elev Thickne Depth Elev Depth Elev (ft) (ft) (ft bgs) (ft amsl) (ft bgs) (ft amsl) (ft bgs) (ft amsl) (ft bgs) (ft amsl) (ft) (ft bgs) (ft amsl) (ft bgs) (ft amsl) (ft) (ft bgs) (ft amsl) (ft bgs) (ft amsl)
Surface Elevation -
Surficial Soil Peoria and
Loveland Loess
Very Fine Sand Silty Fine Sand
Clayey Silt
Silty Sand and Gravel (contains Upper Aquifer)
Upper Aquitard Medial Aquifer Boring DepthEasting(2)Northing(2)
Well ID Lower Aquitard Lower AquiferSite
Top of Lithologic and Hydrostratigraphic Units(1)
Decomposed Weathered
Shale
OU1 (new) SB-09 270168160 2080517340 13160 192984 59 187084 90 183984 130 179984 1 131 179884 -- -- -- -- -- -- --OU1 (new) SB-13 269654838 2080309785 14340 192973 67 186273 87 184273 130 179973 3 133 179673 -- -- -- -- -- -- --OU1 (new) SB-29 270864398 2081035503 14215 192989 68 186189 90 183989 -- -- -- -- -- -- -- -- -- -- -- --OU1 (new) SB-32 271237915 2079979855 14865 192475 66 185875 92 183275 -- -- -- -- -- 148 177675 297 149 177575 -- --OU1 (new) SB-33 269199799 2080682378 14085 193446 63 187146 93 184146 -- -- -- -- -- -- -- -- -- -- -- --OU1 (new) SB-39 271537352 2081550026 13560 192583 64 186183 89 183683 -- -- -- -- -- -- -- -- -- -- -- --OU2 (new) TS1-01 269515615 2089614339 864 191569 70 184569 86 182969 -- -- -- -- -- -- -- -- -- -- -- --OU2 (new) TS1-03 268313868 2089646765 16736 191251 66 184651 86 182651 1195 179301 05 120 179251 148 176451 5 153 175951 -- --OU2 (new) TS1-05 267030127 2089665004 16681 191624 75 184124 87 182924 117 179924 2 119 179724 153 176324 308 155 176124 -- --OU2 (new) TS2-02 271456113 2097510251 13680 191015 73 183715 104 180615 134 177614 3 137 177314 -- -- -- -- -- -- --OU2 (new) TS2-04 268939527 2097554155 16746 190360 70 183360 89 181460 126 177760 9 135 176860 152 175160 306 154 174960 -- --OU2 (new) TS2-05 267717573 2097569698 17161 190143 62 183943 99 180243 -- -- -- -- -- 157 174443 2 159 174243 -- --OU2 (new) TS2-06 266250085 2097592053 11980 190501 60 184501 100 180501 -- -- -- -- -- -- -- -- -- -- -- --OU2 (new) TS3-02 269400264 2102787273 15690 189415 68 182615 96 179815 125 176915 7 132 176215 147 174715 297 150 174415 -- --OU2 (new) TS3-05 265786308 2102812115 14380 189056 67 182356 96 179456 1195 177106 1 1205 177006 129 176156 261 132 175856 -- --OU2 (new) TS4-02 267112179 2105261928 17031 188448 64 182048 96 178848 116 176848 3 119 176548 141 174348 284 143 174148 -- --
Hwy 6 TS3-01 271941141 2089537242 1453 19153 720 184334 1125 180284 1256 178974 29 1285 178684 -- -- -- -- -- -- --Hwy 6 TS3-02 271499828 2089579255 1414 19139 692 184466 102 181186 1227 179116 59 1286 178526 -- -- -- -- -- -- --Hwy 6 TS3-03 270957676 2089591662 1440 19087 710 183767 941 181457 1178 179087 56 1234 178527 -- -- -- -- -- -- --Hwy 6 TS3-04 270411434 2089597601 1403 19088 663 184254 1006 180824 1167 179214 61 1228 178604 -- -- -- -- -- -- --Hwy 6 TS3-05 272464675 2089528557 1718 19173 685 184883 1032 181413 123 179433 7 130 178733 -- -- -- -- -- -- --Hwy 6 TS4-01 271882569 2095813356 1658 19042 650 183920 987 180550 1238 178040 52 129 177520 -- -- -- -- -- -- --Hwy 6 TS4-03 270996450 2096068696 1171 19050 810 182400 966 180840 1154 178960 12 1166 178840 -- -- -- -- -- -- --Hwy 6 TS5-01 271766686 2092074297 1562 19016 648 183680 905 181110 1163 178530 53 1216 178000 -- -- -- -- -- -- --Hwy 6 TS5-03 270732978 2092105115 1389 19008 709 182990 923 180850 1147 178610 46 1193 178150 -- -- -- -- -- -- --Hwy 6 TS5-05 272269991 2092059880 1717 19045 425 186200 942 181030 1153 178920 83 1236 178090 -- -- -- -- -- -- --
Electrical Conductivity Borings
(1)Surface elevation listed for nested monitoring wells (ABCDE) is the surface elevation of the A well Unit elevations are from the boring logs in which they were recorded (2)State Plane Coordinate system Nebraska 2600 amsl - above mean seal level bgs - below ground surface Elev - elevation ft - feet Hwy 6 - Wellsborings installed for the West Highway 6 and Highway 281 Site Investigations -- - not applicable or not available OU1 - Operable Unit 1 these wells are associated with on-site groundwater OU1 (new) - Operable Unit 1 wellsborings installed in AprilMay 2010 for the RI OU2 - Operable Unit 2 these wells are associated with off-site groundwater OU2 (new) - Operable Unit 2 Monitoring wellsborings installed in AprilMay 2010 for the RI
Sheet 2 of 2
Table 61 Water Level Calibration Statistics
Garvey Elevator Site Hastings Nebraska
Name Layer
Target Water Level Elevation - Sept 2011
(feet amsl) Model
Water Level Error
Residual MW-12U 1 18156 1814424820 117518 MW-100A 1 181542 1814519751 0900249 MW-16U 1 181534 1814385390 095461 MW-10A 1 181528 1814182851 1097149 MW-1A 1 181525 1815209270 004073 MW-2A 1 181519 1815393838 -0203838 MW-05 1 181516 1814358176 0801824
MW-102A 1 18151 1813770877 1329123 MW-13U 1 181507 1813730081 1339919 MW-7A 1 181504 1815242607 -0202607 MW-04 1 181487 1814376802 0493198
MW-17U 1 181486 1814230581 0629419 MW-07 1 181475 1814008616 0741384 MW-03 1 181471 1813907473 0802527 MW-02 1 181468 1813743101 0936899 MW-08 1 181465 1814180036 0469964 MW-06 1 18146 1814237391 0362609
MW-10U 1 181453 1814016597 0513403 MW-14U 1 181451 1814457639 0052361 MW-6A 1 181444 1814334070 010593 MW-01 1 18144 1814062502 0337498
MW-11A 1 181429 1812347804 1942196 MW-11U 1 181411 1814658764 -0548764 MW-10B 1 181372 1814173608 -0453608 MW-3A 1 181357 1813385654 0184346 MW-5B 1 181339 1813199091 0190909 MW-15U 1 181326 1814948966 -1688966 MW-47B 1 181316 1812784852 0375148 MW-50B 1 181314 1812748409 0391591 MW-4A 1 18131 1812992455 0107545 MW-3B 1 181308 1813389494 -0309494 MW-5A 1 181307 1813165365 -0095365 MW-19A 1 181301 1813252060 -024206 MW-4B 1 181298 1812954715 0025285 MW-31A 1 181289 1812885039 0004961 MW-51B 1 181236 1812125173 0234827 MW-49B 1 181227 1812349041 -0079041 MW-48B 1 18122 1812098306 0101694 MW-30A 1 181194 1812183956 -0243956 MW-09U 1 181194 1814076063 -2136063 MW-20A 1 181179 1812309176 -0519176 MW-14A 1 181061 1810498570 011143 MW-17A 1 18098 1809745419 0054581
Sheet 1 of 3
Table 61 Water Level Calibration Statistics
Garvey Elevator Site Hastings Nebraska
Name Layer
Target Water Level Elevation - Sept 2011
(feet amsl) Model
Water Level Error
Residual MW-12A 1 180706 1807353224 -0293224 MW-16A 1 180683 1806758847 0071153 MW-18A 1 18062 1805744494 0455506 MW-104A 1 180386 1804035180 -017518 MW-105A 1 179994 1799915974 0024026 MW-106A 1 178857 1788240807 0329193 MW-18C 3 180409 1804214829 -0124829 MW-12C 3 180568 1805675664 0004336 MW-16C 3 180625 1806232799 0017201 MW-45C 3 180888 1809089044 -0209044 MW-17C 3 180918 1809113670 006633 MW-47C 3 181047 1810251020 021898 MW-101B 3 181066 1811509656 -0849656 MW-102B 3 181092 1811706686 -0786686 MW-13C 3 181107 1811204349 -0134349 MW-51C 3 181177 1811366716 0403284 MW-50C 3 18119 1811832475 0067525 MW-49C 3 181235 1812474567 -0124567 MW-48C 3 18125 1812312538 0187462 MW-7B 3 181497 1815042613 -0072613
MW-09M 5 181527 1813657691 1612309 MW-3D 5 181479 1814354375 0435625 MW-3E 5 181379 1814210888 -0420888 MW-5D 5 181366 1813572038 0087962 MW-47D 5 181365 1812738611 0911389 MW-49D 5 18134 1813402643 -0002643 MW-48D 5 181323 1812926923 0303077 MW-50D 5 181323 1812962182 0267818 MW-31C 5 181311 1813127460 -001746 MW-51D 5 181302 1812256458 0763542 MW-13E 5 181234 1812181638 0158362
MW-100D 5 181223 1813629694 -1399694 MW-100C 5 181216 1813634399 -1474399 MW-30C 5 181208 1811949179 0130821 MW-19C 5 1812 1812353637 -0353637 MW-20D 5 181196 1811924735 0035265 MW-30D 5 181188 1811949179 -0069179 MW-20E 5 181155 1811924735 -0374735 MW-16M 5 181133 1811653909 -0323909 MW-13M 5 181117 1811940971 -0770971 MW-30E 5 181115 1811949179 -0799179 MW-11M 5 181097 1814139713 -3169713 MW-17D 5 180923 1808958032 0271968
Sheet 2 of 3
Table 61 Water Level Calibration Statistics
Garvey Elevator Site Hastings Nebraska
Name Layer
Target Water Level Elevation - Sept 2011
(feet amsl) Model
Water Level Error
Residual MW-20C 5 180892 1811924735 -3004735 MW-45D 5 180884 1809292039 -0452039 MW-12D 5 180575 1805738454 0011546 MW-18D 5 180413 1804194578 -0064578 MW-104D 5 180137 1801272389 0097611 MW-104C 5 180135 1801269033 0080967 MW-46D1 5 179796 1797768438 0191562 MW-105D 5 179794 1797798970 014103 MW-46D2 5 179792 1797771831 0148169 MW-105C 5 179791 1797803499 0106501 MW-41D2 5 179702 1797046783 -0026783 MW-41D1 5 179697 1797044368 -0074368 MW-106C 5 178531 1785334635 -0024635 MW-106D 5 178527 1785320367 -0050367 MW-43D 5 178387 1783880124 -0010124 MW-43E 5 178386 1783888909 -0028909 MW-42D 5 178183 1781770173 0059827 MW-42E 5 178182 1781753639 0066361 MW-44D 5 177409 1774079493 0010507 MW-44E 5 177407 1774078775 -0008775
Residual Mean 0046933 Res Std Dev 0743461 Sum of Squares 6048817
RMS Error 0744941 Min Residual -3169713 Max Residual 1942196
Number of Observations 109 Range in Observations 4362
Scaled Std Dev 0017044 Scaled Abs Mean 0010505
Scaled RMS 0017078 Notes
amsl - above mean sea level
Sheet 3 of 3
Table 71 Groundwater Data Summary Projected Durations to Meet MCLs
Garvey Elevator Site Hastings Nebraska
Well Data Collection Range TCE Concentration μgL Estimated Date to
Reach MCLs Duration from June 2012 yrsHigh Low
MW-3A May 1997 - March 2012 20000 11 already achieved NA MW-3B May 1997 - March 2012 23000 74 Nov 2045 33 MW-3D April 1997 - March 2012 5 05 already achieved NA MW-3E April 1997 - March 2012 4 05 already achieved NA MW-4A May 1997 - March 2012 18000 43 Sept 2013 1 MW-4B May 1997 - March 2012 29000 690 Dec 2042 30 MW-5A May 1997 - March 2012 24000 47 already achieved NA MW-5B May 1997 - March 2012 15000 12 Jan 2017 5 MW-5D April 1997 - March 2012 4 05 already achieved NA MW-13C May 1997 - March 2012 18000 28 Nov 2061 49 MW-13E May 1997 - March 2012 5 05 already achieved NA
RW-1 1999 - 2011 490 10 May 2016 4 RW-2 1999 - 2011 3200 5 Nov 2021 9 RW-3 1999 - 2011 3800 5 Feb 2024 12 RW-4 1997 - 2011 5500 5 June 2016 4 RW-5 1999 - 2011 5500 5 achieved NA RW-6 1999 - 2011 590 10 Oct 2018 6 RW-7 1995 - 2011 1000 5 Jan 2025 13 RW-8 1998 - 2011 380 5 March 2047 35
Notes
Dates and concentration data are from the site database projections to reach MCLs are based on curves fitted to data plots as provided by Dr Brian
Zurbuchen via email on June 11 2012
μgL - micrograms per liter
Sheet 1 of 1
Table 72 Remedial Alternatives Summary
Garvey Elevator Site Hastings Nebraska
Remedial Alternative Assumptions Remediation
Times Notes
OU 1
SG-1-No Action All extraction wells off 30 years
This scenario was not explicity modeled Based on the remedition duration predicted for SG2 remediation time will be greater than 30 years However for cost estimating purposes a 30-year duration will be used
SG2-- Maintain and Operate Existing GET System
No treatment of downgradient plume
30 years This scenario was not explicity modeled but remediation time was estimated based on contaminant concentration trends (see Table 71)
SG3--In Situ Treatment Via Groundwater Amendments
Area within gt500 ugL set to 00 on-site treatment system shut off
15 years Remediation time estimates are for OU1 (on-site) plume using multiple injection treatments and existing GET system shut off
SG4-- Maintain and Operate Existing GET System and Treatment Via Groundwater Amendments
Pump and treat system operating groundwater within concentrations gt500 ugL set to 00
10 years Remediation time estimates are for OU1 (on-site) plume using multiple injection treatments and existing GET system operating
OU 2
G1-No Action Pump and treat system operating no treatment of downgradient plume
30 years This scenario was not explicity modeled For cost estimating purposes a 30-year duration will be used
G2-Groundwater Recovery Treatment and Discharge at Leading Edge of Plume
On-site pump and treat system operating
100 years Based upon modeling results for more active remedies the remediation times for both the OU 1 and OU 2 plumes would exceed 100 years This scenario was not explicity modeled
G3a-Groundwater Recovery Treatment and Discharge at mid point and Leading Edge of Plume
On-site pump and treat system operating
75 years
Modeled duration ranges from 75 to 90 years
G3b-Groundwater Recovery Treatment and Discharge at two transects and Leading Edge of Plume
On-site pump and treat system operating
53 years
G4a-In Situ treatment at midpoint of plume and Groundwater Recovery Treatment and Discharge at leading edge of plume
On-site pump and treat system operating
75 years
Same as G3 but a treatment zone replaces the recovery wells near the midpoint of the plume Modeled duration ranges from 75 to 90 years
G4b-In Situ treatment at two transects near core of plume and Groundwater Recovery Treatment and Discharge at leading edge of plume
On-site pump and treat system operating
56 years Same as G3 but two treatment zones replace the recovery wells near the midpoint of the plume
Notes
μgL - micrograms per liter
Sheet 1 of 1
This page was intentionally left blank
ATTACHMENT 2 FIGURES
Figure 31 Carbon Tetrachloride Isoconcentrations Upper Aquifer Zone AB Figure 32 Carbon Tetrachloride Isoconcentrations Medial Aquifer Zone C Figure 33 Carbon Tetrachloride Isoconcentrations Lower Aquifer Zone DE
Figure 51 Model Domain and Boundary Conditions Figure 52 Vertical Discretization of Model Figure 53 Elevation of the Model Base Figure 54 Elevation of the Top of the Lower Aquifer Figure 55 Isopach Map of the Lower Confining Unit Figure 56 Elevation of the Base of the Medial Aquifer Figure 57 Isopach of Upper Aquifer Figure 58 Elevation of the Base of the Upper Aquifer Figure 59 Location of Recovery Wells in the Shallow Aquifer Figure 510 Location of Recovery Wells in the Medial Aquifer Figure 511 Location of Injection and Municipal Wells in the Lower Aquifer Figure 512 Initial Concentrations of Carbon Tetrachloride in the Shallow Aquifer Figure 513 Initial Concentrations of Carbon Tetrachloride in the Medial Aquifer Figure 514 Initial Concentrations of Carbon Tetrachloride in the Lower Aquifer
Figure 61 Error Residuals Versus Measured Water Levels Figure 62 Measured Water Levels Versus Predicted Water Level Elevations Figure 63 Error Residuals for the Shallow Aquifer in the Vicinity of the Garvey Elevator
Site Figure 64 Error Residuals for the Shallow Aquifer over the Model Domain Figure 65 Error Residuals for the Medial Aquifer over the Model Domain Figure 66 Error Residuals for the Lower Aquifer in the Vicinity of the Garvey Elevator
Site Figure 67 Error Residuals for the Lower Aquifer over the Entire Model Domain Figure 68 Calibrated Hydraulic Conductivities of the Shallow Aquifer Figure 69 Calibrated Hydraulic Conductivities of the Medial Aquifer Figure 610 Calibrated Hydraulic Conductivities of the Lower Aquifer Figure 611 Calibrated Hydraulic Conductivities of the Upper Aquitard Figure 612 Calibrated Hydraulic Conductivities of the Lower Aquitard Figure 613 Calibrated Potentiometric Surface of the Shallow Aquifer Figure 614 Calibrated Potentiometric Surface of the Medial Aquifer Figure 615 Calibrated Potentiometric Surface of the Lower Aquifer Figure 616 Particle Tracking Analysis to Estimate Travel Time
Figure 71 Initial Concentrations for Alternative SG3 Figure 72 Capture Zone Analysis in the Shallow Aquifer for Alternative SG3 Figure 73 Capture Zone Analysis in the Medial Aquifer for Alternative SG3 Figure 74 Alternative G2 ndash Proposed Recovery Wells Medial Aquifer
ATTACHMENT 2 FIGURES (continued)
Figure 75 Alternative G2 ndash Proposed Recovery Wells Lower Aquifer Figure 76 Preliminary Locations for Leading Edge Recovery Wells and Groundwater
Treatment Building ndash Alternative G2 Figure 77 Alternative G3ab ndash Proposed Recovery Wells Medial Aquifer Figure 78 Alternative G3a ndash Proposed Recovery Wells Lower Aquifer Figure 79 Preliminary Locations for Mid-Plume and Leading Edge Recovery Wells and
Groundwater Treatment BuildingmdashAlternative G3 Figure 710 Alternative G3b ndash Proposed Recovery Wells Lower Aquifer Figure 711 Alternative G3b ndash Relative Positions of Proposed Recovery Wells Medial and
Lower Aquifer Figure 712 Alternative G4a ndash Proposed Treatment Curtain and Recovery Wells Lower
Aquifer Figure 713 Preliminary Locations for Mid-Plume Injection Wells Leading Edge Recovery
Wells and Groundwater Treatment Building ndash Alternative G4 Figure 714 Alternative G4b ndash Proposed Treatment Curtains and Recovery Wells Lower
Aquifer Figure 715 Alternative G4b ndash Relative Positions of Proposed Recovery Wells and
Treatment Curtains
5
5
5
5
5
50
100 500
MW-6A SB-39 HGLmdashGroundwater Flow Modeling Technical MemorandumMW-2AHTW 40 (98)(ND)MW-8A MW47B ( Garvey Elevator SitemdashHastings NE(ND)
(59) SB-38
MW-19APSUS PU PPPUUU ( Figure 31 (70)MW-33 MW-3AB
Carbon Tetrachloride in the(ND53) MW49B MW-20A
+UP+UPPPP+U+U+UPPPPUUUU+UP+UPPPP+U+U+U(43) Upper Aquifer Zone AB(10)
MW-1A PU MW50B(ND) +UP+UPPPP+U+U+U September 2011 Sampling(84)
PPUUMW-4AB PPUU MW-13CE +++++UPUPPPPUUU (21640)
MW-30A (160)+UP+UPPPP+U+U+U LegendPPPUUU
1000 MW51B (1200) MW-5AB
(4119J)
Garvey Property BoundaryMW-7AB MW-31A (ND) (75) (
PPUU MW48B RailroadSB-33 (680)
Inset Ntilde Monitoring Well Location MW-47B MW-10A
(59) (ND) Multilevel Well MW-9A MW-6AHTW 40 MW-10B(ND) (98)
(ND) MW-11A S Hydraulic Conductivity
MW-33 UPPUMW-2A MW-19AU MW-14A(ND) P
(70) PU (ND) A West Highway 6 amp Highway 281 Site MW-12A AMW-106AMW-20A MW-104AMW-3A MW-8A (ND) Monitoring WellU UUU (ND)PSSU P PPP (10)(ND) (ND)(ND) U
UUUUU PUUUUP PPPPPPPPPPPPPPPPPPPPPPPUUUUPUPPPPUUUUU MW-13CE
UUUU Carbon Tetrachloride ConcentrationMW-3B MW-105A A (190)PPP A (ND)
UUUUUUUUU(53) MW-30A in micrograms per liter (microgL)PPUUPPPUUUPPPPPUUUUU
MW-12DMW-1A (160) MW-42 DEMW-45CD(ND)
MW-50B MW-49B MW-51B Carbon Tetrachloride Isoconcentration(84) PPUUPPUU(43)
PPUU(1200)
Contour (microgL)PPPUUU PPPUUUMW-46 D1D2MW-7B (5)(ND)
(Dashed Lines are Estimated)MW-7A (ND)
MW-5A (41)
MW-4A (21) MW-4B (640)
MW-48B (680)
MW-17A (ND)
MW-16A (ND) UUPP
MW-18A (ND)
MW-41 D1D2 UUPP
MW-44 DE UUPP
MW-5B
MW-31A (75)
(19)
MW-43 DE UUPP Notes
(ND) Nondetect
0 2500 5000
Feet sup3 Filename XEPA009GarveyGW_Flow_Tech_Memo Carbon_TetChl_UpperAquifer_ABmxd Project EP903401220202 Revised 061312 ST Source ENSR GDB 2008 DNR
100
5
100
SB-39MW-6AHTW 40 HGLmdashGroundwater Flow Modeling Technical Memorandum MW47C SB-38MW-33 MW-2A (62) ( Garvey Elevator SitemdashHastings NE
UUUPSUS P PPP (
U
Figure 32MW-8A MW-3ABDE MW-19C (ND) Carbon Tetrachloride in the
MW-1A +++++PPPP UPUPPPPUUUUUUU
+UP+UPPPP+U+U+U Medial Aquifer Zone CPU MW-20C +UP+UPPPP+U+U+U (ND) September 2011 SamplingMW49C
UU(ND) PPUU +++++PPPPPPPUUUUU MW50C
(ND) +UP+UPPPP+U+U+UPPPUUU LegendMW-13C
MW-4AB (130) MW-30C
MW-5AB (ND) MW48C MW51C
(ND) (ND) Garvey Property Boundary SB-33 (
MW-7AB PPUU MW-31C (ND) Railroad
Inset Ntilde Monitoring Well Location MW-47CMW-9A MW-10AB Multilevel Well(62)
HTW 40
MW-6A S Hydraulic Conductivity WellMW-11AMW-33 PPUUMW-2A
MW-19CUP (ND) P West Highway 6 amp Highway 281 SiteU MW-14A A A Monitoring WellMW-20C MW-12C MW-106CMW-104CPSS P PPP
U (ND) (ND) (90) (ND)
MW-8A MW-13C U U UUU
PMW-3ABDE PPPPPPPPUUUUPU (130) Carbon Tetrachloride ConcentrationPU UUUU UUUUUUUUUU
MW-105C A (190)MW-1A UUUUUUUUUPPPPPPPPPPPPPPPPPPP MW-30C PPPUUU MW-12D A (200) in micrograms per liter (microgL)
MW-49C UUUUPUPPPPUUPU (ND) UPPU Old Rolls MW-42 DEPP (13)(ND) Carbon Tetrachloride Isoconcentration MW-45C MW-50C (ND)
MW-51C (ND) PPUU PPUU PPUU (5) Contour (microgL)(ND)
UUU PPP MW-46 D1D2
PPP UUUMW-48C (Dashed Lines are Estimated)5MW-7AB (ND)
MW-4AB MW-17C MW-18C(ND) MW-44 DE Domestic Irrigation W ater Wells(81)MW-5AB
PPUUMW-31C MW-16C (ND)
PPUU(ND) MW-41 D1D2
PPUU
Notes MW-43 DE PPUU
(ND) Nondetect
0 2500 5000
Feet sup3 FilenameXEPA009GarveyGW_Flow_Tech_Memo Carbon_TetChl_Medial_Aquifer_Cmxd Project EP903401220202 Revised 061312 ST Source ENSR GDB 2008 DNR
50
5
5
50 100
MW-6D SB-39 HGLmdashGroundwater Flow Modeling Technical MemorandumHTW 40 (ND) SB-38MW-3DE ( Garvey Elevator SitemdashHastings NE (NDND)
UUUUPSUS P PPP MW-19AC( Figure 33MW-2A MW-33 MW47D
U (ND)
Carbon Tetrachloride in theMW-8A PPPPUUUU P Lower Aquifer Zone DEUMW-1A MW-20DEPU P
(NDND)UPUU
September 2011 Sampling MW-13EPPUUPPPU (ND)
MW50D UPMW49D (ND) UUU(ND) PPP MW-30DE Legend MW51D (ND)
(ND)MW-4AB MW48D (ND)
MW-7AB MW-5D (ND) Garvey Property Boundary
MW-31C (ND)
PPUU
(
RailroadSB-33MW-3DE (NDND)
Inset Ntilde Monitoring Well Location MW-47D
MW-9A (ND) Multilevel Well HTW 40
MW-6D MW-10AB (ND)
MW-11A S Hydraulic Conductivity Well MW-33 MW-2A UPPU
PUMW-19AC West Highway 6 amp Highway 281 Site MW-14A APU
MW-20DE MW-106D A Monitoring WellMW-104DPSSU PU PPPUUU (NDND)
MW-12C (ND)(ND)MW-8A MW-13E PU
UUUUU (ND) Carbon Tetrachloride ConcentrationU PPPPPPPPUUUUPU (190)PPUUU
PPUPPPPPPPPPPPPPPPUUUUUP
UUUUU UUUUUUU PPP A MW-105DMW-1A in micrograms per liter (microgL) AMW-30DE
PPUUPPPUUUPPPPPUUUUU(52)
(NDND) MW-12DNew RollsMW-49D (ND) (ND)
Carbon Tetrachloride Isoconcentration(ND) MW-45D PPUUMW-51D (ND)
MW-46 D1PPUU PPUU Contour (microgL)MW-50D (ND) (5)(ND)
PPPUUU (770)PPPUUU MW-42 DMW-48D (Dashed Lines are Estimated)MW-4AB (4274)(ND)
MW-44DEMW-46 D2 MW-17D (320) (19ND)MW-7AB
MW-5D Domestic Irrigation W ater Wells(94) MW-18D PPUUMW-31C(ND) (21) MW-41 D1MW-5B MW-16C PPUU (ND)
PPUUMW-41 D2 (10) Notes
MW-43DE UUPP(ND18) (ND) Nondetect
0 2500 5000
Feet sup3 Filename XEPA009GarveyGW_Flow_Tech_Memo Carbon_TetChl_LoweR_Aquifer_Dmxd Project EP903401220202 Revised 061312 ST Source ENSR GDB 2008 DNR
_L _j I I I I _j_ I I I
I l --- I 111
1
__u_ I I
1 I ~ N ----y-
+ ~ I
II L _l e11111111111 I ---1 ~lJJ I n r Igt I Constant Head Boundariesj l _Q No Flow Sound aries I I l
~ r-- I - I middot r-
- fl+- L -
0 I J ~r-
Ll-D l Garvey Site I - ~t
Ill -J
l unJprm Spacing 25 eet U~iform S pacing 1 00 feet I Constant Head Boundaries
j
middotmiddot- ~ No Flow Sound aries
J
--=J--=11-~=======2~-----~3=========4~------5 M1les 0 05
Figure 51 Model Domain Gridding and Boundaries
Figure 52 Vertical Discretization of Model
1610
1620
1 6 2 0
1630
1 6 3 0
1640
1 6 4 0
1650
1 6 5 0
1660
1660
1670
1670
1680
1680
1690
17
1698
17013
16918
169198
169118
165864
167129
168901
169482
169872
169403
169347
169374
169448
Figure 53 Elevation of the Model Base (weathered shale of the Niobrara Formation)
1111
I I
-
N
+ 0 05
I I
I 1 l
I
1 l -
2 3 4 Miles
Figure 54 Elevation of the Top of the Lower Aquifer
Figure 55 Isopach Map of Lower Confining Unit (model Layer 4)
Figure 56 Elevation of the Base of the Medial Aquifer
Figure 57 Isopach of Upper Aquitard (model layer 2)
Figure 58 Elevation of the Base of the Upper Aquifer
I I I
~ ~ t--7 t bull I I I
r I l
I EW-01 f1-m I N I bull __ j
+ twtrl I I I rl bull I I I I J I I I -r-----
- middot-- - -- -- middot------__J_--
I --- 1 Feet I 0 500 1 000 2000 3000 4000 rooo I I I I
Figure 59 Location of Recovery Wells in the Shallow Aquifer
_l ________ l I I I -1 middot ] l ~----------middotj + I j
middotmiddot= middotmiddot- ---------L -- ---- ___ _ [_ __
r--------shy1
o--~oomiddoto~bull1~oo=o ======4~oomiddoto------middot~ooco=======43oobullo -------~oo~1
Figure 510 Location of Recovery Wells in the Medial Aquifer
I I r
~~ r -
L - - - -- -1--ltmiddot --I-
I -
---- L f+r
il I
J ---1
I
N
+
Figure 511 Location of Injection and Municipal Wells in the Lower Aquifer
Figure 512 Initial Concentrations of Carbon Tetrachloride in the Shallow Aquifer
Figure 513 Initial Concentrations of Carbon Tetrachloride in the Medial Aquifer
Figure 514 Initial Concentrations of Carbon Tetrachloride in the Lower Aquifer
-40
-30
-20
-10
00
10
20
30
40
17741 17828 17915 18002 18090 18177
Res
idua
l
Layer 1
Layer 3
Layer 5
Observed Value
Figure 61 Error Residuals Versus Measured Water Levels
Layer 1
Layer 3
18090
18177
Layer 5
Mod
el V
alue
17741 17828 17915 18002 18090 18177
18002
17915
17828
17741
Observed Value
Figure 62 Measured Water Levels Versus Predicted Water Levels
bull -020
N
+ 0
h I I
-----------~----j_ _______ ___ j_94-__ _ __ I ------------- t
011
bull 005
05
bull
I
Mile 1
Figure 63 Error Residuals for the Shallow Aquifer in the vicinity of the Garvey Elevator Site
Figure 64 Error Residuals for the Shallow Aquifer Over the Model Domain
-007 bull
N
+
il _ __ ~ II
t079 i
I 1 II_ --middot--middot- J_~=====-middot 1------~
~--1 000 r-----middot- -middotmiddot ____
-021 bull
-012 007 bull bull
l middot l02
I ~~~~====~---====~---Feet _ o ___ _ $-_~_0 _ ___ _ J000 _____ 3QQ_Q_ ---4lIJOLUlJ00----ltgt5ultOOO-- middott- middot ----
I
Figure 65 Error Residuals for the Medial Aquifer Over the Model Domain
0 250
N
+
044 bullbull -042
000 bull
027 bull
013
-)35 bull
Figure 66 Error Residuals for the Lower Aquifer in the Vicinity of the Garvey Elevator Site
Figure 67 Error Residuals for the Lower Aquifer in the Entire Model Domain
Figure 68 Calibrated Hydraulic Conductivities of the Shallow Aquifer (ftd) (model layer 1)
Figure 69 Calibrated Hydraulic Conductivities of the Medial Aquifer (ftd) (model layer 3)
Figure 610 Calibrated Hydraulic Conductivities of the Lower Aquifer (ftd) (model layer 5)
Figure 611 Calibrated Hydraulic Conductivities of the Upper Aquitard (ftd) (model layer 2)
Figure 612 Calibrated Hydraulic Conductivities of the Lower Aquitard (ftd) (model layer 4)
Figure 613 Calibrated Potentiometric Surface of the Shallow Aquifer (model layer 1)
Figure 614 Calibrated Potentiometric Surface of the Medial Aquifer (model layer 3)
Figure 615 Calibrated Potentiometric Surface of the Lower Aquifer (model layer 5)
Figure 616 Particle Tracking Analysis to Estimate Travel Time
Figure 71 Initial Concentrations for Alternative SG3
E3 E3 2000feet
Figure 72 Capture Zone Analysis in the Shallow Aquifer for Alternative SG3
E3 E3 E3 2000feet
Figure 73 Capture Zone Analysis in the Medial Aquifer for Alternative SG3
Figure 74 Alternative G2-Proposed Recovery Wells Medial Aquifer
Figure 75 Alternative G2- Proposed Recovery Wells Lower Aquifer
50
5 5
5
50 100
MW-3DE (NDND)
MW-47D MW-9A (ND)
HTW 40 MW-6D MW-10AB
(ND) MW-11A
MW-2AMW-33 UPPUPU
MW-19AC MW-14A APUMW-20DE MW-106DMW-104D(NDND) MW-12CPSSU (ND)PU PPPUUU PU (ND) MW-13E
HGLmdashGroundwater Flow Modeling Technical Memorandum Garvey Elevator Superfund SitemdashHastings NE
Figure 76 Preliminary Locations for Leading
Edge Recovery Wells and Groundwater Treatment Building-Alternative G2
Legend Garvey Property Boundary
Railroad
Ntilde Monitoring Well Location
Multilevel Well
S Hydraulic Conductivity Well
A West Highway 6 amp Highway 281 Site Monitoring Well
(190) Carbon Tetrachloride Concentration in micrograms per liter (microgL)
Carbon Tetrachloride Isoconcentration Treatment Building
Technical Blvd
MW-8A UUUU UUUUU
U PPPPPPPPUUUUPU UUUUUUPUP
UUUUUPPPPPPPPPPPPPPPPPP (ND)
PPPUUU A MW-105DMW-1A UU AMW-30DE PPUUPPPUUUPPPPPUUUUU
(52)(NDND) MW-12DNew Rolls Contour (Lower Aquifer) (microgL)MW-49D (5)(ND) (ND)
(ND) MW-45D (Dashed Lines are Estimated)PPUUMW-51D (ND) MW-46 D1PPUU PPUUMW-50D
(ND) (ND)
PPPUUU (770)PPPUUU MW-42 DMW-48D Domestic Irrigation W ater WellsMW-4AB (4274) MW-44DE(ND)
(19ND)MW-46 D2 MW-17D (320)MW-7AB Carbon Tetrachloride Isoconcentration(94)MW-5D
MW-18D PPUU (5) Contour (Upper Aquifer) (microgL)(21) MW-41 D1 MW-31C(ND)
MW-5B MW-16C PPUU (Dashed Lines are Estimated)(ND)
PPUUIdlewilde Rd
MW-41 D2 Recovery Wells (Medial)
Recovery Wells (Deep)
(10)
MW-43DE PPUU(ND18)
Recovery Well Piping
Treatment Building
Notes (ND) Nondetect
Blaine A
ve
Showboa t B
lvd
sup3 Filename XEPA009GarveyGW_Flow_Tech_Memo Carbon_TetChl_LoweR_Aquifer_Dmxd Project EP903401220202 Revised 061312 ST2500 5000 Source ENSR GDB 2008 DNR
Feet
0
Figure 77 Alternative G3ab-Proposed Recovery Wells Medial Aquifer
Figure 78 Alternative G3a- Proposed Recovery Wells Lower Aquifer
50
5 5
5
50 100
HGLmdashGroundwater Flow Modeling Technical Memorandum Garvey Elevator Superfund SitemdashHastings NE
Figure 79 Preliminary Locations for Mid-Plume and
Leading Edge Recovery Wells and Groundwater Treatment Building-Alternative G3
Legend Garvey Property Boundary
Railroad
Ntilde Monitoring Well Location MW-3DE (NDND)
Multilevel Well MW-47D
MW-9A (ND) Hydraulic Conductivity WellSHTW 40 MW-6D MW-10AB
(ND) West Highway 6 amp Highway 281 SiteMW-11A
MW-33 PPUUMW-2A PUA Monitoring Well
MW-19AC MW-14A APUCarbon Tetrachloride Concentration
Technical Blvd
MW-44DE (19ND) (Dashed Lines are Estimated)
MW-20DE (190)MW-106DPSSU PU PPPUUU MW-104DMW-12C(NDND) (ND)PU in micrograms per liter (microgL)(ND) MW-13EMW-8A
U UUUU UPUPPPPUUUUUUUUP UUUUU UUUPPPPPPPPPPPPPPPPPPPPPPPUUUUUU
(ND) PPPUUU A Treatment BuildingMW-105DMW-1A Carbon Tetrachloride IsoconcentrationMW-30DE A
PPUUPPPUUUPPPPPUUUUU(52)
(NDND) MW-12DNew Rolls Contour (Lower Aquifer) (microgL)MW-49D (5)(ND) (ND)(ND) MW-45D
MW-51D PPUU(ND)
PPUU PPUUMW-50D (ND)
MW-46 D1(ND) PPPUUU (770)
PPPUUU MW-42 D (4274)
MW-48D Domestic Irrigation W ater WellsMW-4AB (ND) MW-46 D2
MW-17DMW-7AB (320)(94) Carbon Tetrachloride IsoconcentrationMW-5D
MW-18D(ND) MW-31C (21) PPMW-41 D1
UU (5) Contour (Upper Aquifer) (microgL)MW-5B MW-16C UU (ND)PP (Dashed Lines are Estimated)PPUUIdlewilde Rd
MW-41 D2 Recovery Wells (Medial)(10)
MW-43DE UUPP(ND18) Recovery Wells (Deep)
Recovery Well Piping
Treatment Building
Notes (ND) Nondetect
Blaine A
ve
Showboa t B
lvd
sup3 Filename XEPA009GarveyGW_Flow_Tech_Memo Mid-Plume_Prelim_Loc Project EP903401220202 Revised 061312 RL2500 5000 Source ENSR GDB 2008 DNR
Feet
0
Figure 710 Alternative G3b-Proposed Recovery Wells Lower Aquifer
Figure 711 Alternative G3b-Relative Positions of Proposed Recovery Wells Medial and Lower Aquifers
Figure 712 Alternative G4a-Proposed Treatment Curtain and Recovery Wells Lower Aquifer
50
5 5
5
50 100
HGLmdashGroundwater Flow Modeling Technical Memorandum Garvey Elevator Superfund SitemdashHastings NE
Figure 713 Preliminary Locations for Mid-Plume
Injection Wells Leading Edge Recovery Wells and Groundwater Treatment Building
-Alternative G4
Legend Garvey Property Boundary
Railroad
Ntilde Monitoring Well Location MW-3DE (NDND)
MW-47D MW-9A (ND)
HTW 40 MW-6D MW-10AB
(ND)
S Elm
Ave
S Wabash A
ve
Multilevel Well
S Hydraulic Conductivity Well
A West Highway 6 amp Highway 281 Site Monitoring Well
MW-11AMW-33 UPPUMW-2A PU
MW-19AC MW-14A APUMW-20DE MW-106D Carbon Tetrachloride ConcentrationPU PPPUUU (190)PSSU MW-104D(NDND) MW-12C (ND)PU in micrograms per liter (microgL)(ND)
Treatment Building Technical B
lvd MW-13EMW-8A
UUUU UUUUUU PPPPPPPPUUUUPU UUUUU
UPUP
UUUUUPPPPPPPPPPPPPPPPPP (ND)
PPPUUU A MW-105DMW-1A UU Carbon Tetrachloride IsoconcentrationAMW-30DE PPUUPPPUUUPPPPPUUUUU
(52)(NDND) MW-12DNew Rolls Contour (Lower Aquifer) (microgL)MW-49D (5)(ND) (ND)
(ND) MW-45D (Dashed Lines are Estimated)PPUUMW-51D (ND) MW-46 D1PPUU PPUUMW-50D
(ND) (ND)
PPPUUU (770)PPPUUU MW-42 DMW-48D Domestic Irrigation W ater WellsMW-4AB (4274)(ND) MW-44DEMW-46 D2
(19ND)MW-17D (320)MW-7AB Carbon Tetrachloride Isoconcentration(94)MW-5D MW-18D PPUU (5) Contour (Upper Aquifer) (microgL)(21) MW-41 D1
MW-31C(ND) MW-5B MW-16C PPUU (Dashed Lines are Estimated)(ND)
PPUUIdlewilde Rd
MW-41 D2 Recovery Wells (Medial)
Recovery Wells (Deep)
(10) Injection Area 1 MW-43DE PPUUPermanent Injection Well Spacing 40 ft (ND18)
Total Injection Wells Installed 39 Recovery Well Piping Injection Area (40 ft spacing between the wells) Treatment Building
Notes (ND) Nondetect
Blaine A
ve
Showboa t B
lvd
S Baltim
ore Ave
sup3 Filename XEPA009GarveyGW_Flow_Tech_Memo G4_Prelim_Loc_Inj_Areamxd Project EP903401220202 Revised 061312 RL2500 5000 Source ENSR GDB 2008 DNR
Feet
0
Figure 714 Alternative G4b-Proposed Treatment Curtains and Recovery Wells Lower Aquifer
Figure 715 Alternative G4b-Relative Positions of Proposed Recovery Wells and Treatment Curtains
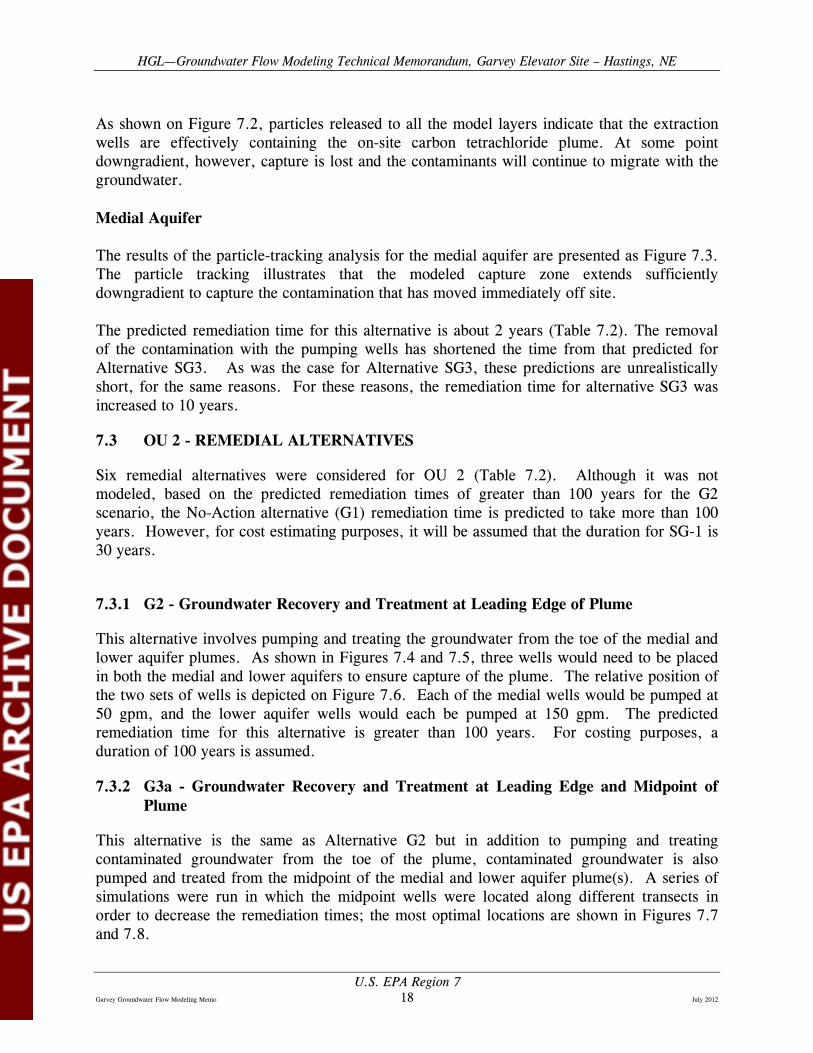
HGLmdashGroundwater Flow Modeling Technical Memorandum Garvey Elevator Site ndash Hastings NE
McDonald MG and AW Harbaugh 1988 A Modular Three-dimensional Finite-difference Groundwater Flow Model US Geological Survey TWRI Chapter 6-A1
Pollock DW 1994 Userrsquos Guide for MODPATHMODPATH-PLOT Version 3A particle tracking post-processing package for MODFLOW the U S Geological Survey finite-difference ground-water flow model U S Geological Survey Open-File Report 94shy464
Rumbaugh JO and DB Rumbaugh 1998 Groundwater Vistas Version 516 Environmental Simulations
US Army Corps of Engineers (USACE) 1990 Final Groundwater Modeling Report Hastings East Industrial Park Remedial InvestigationFeasibility Study Hastings Nebraska August
Zheng C 1990 MT3D A modular three-dimensional transport model for simulation of advection dispersion and chemical reactions of contaminants in groundwater systemsrdquo Report to the US Environmental Protection Agency Robert S Kerr Environmental Research Laboratory Ada OK
Zheng Chunmiao and Wang P Patrick 1999 ldquoMT3DMS A modular three-dimensional multispecies transport model for simulation of advection dispersion and chemical reactions of contaminants in groundwater systems documentation and userrsquos guiderdquo Contract Report SERDP-99-1 US Army Engineer Research and Development Center Vicksburg Mississippi
Attachments
Attachment 1 Tables Attachment 2 Figures
US EPA Region 7 Garvey Groundwater Flow Modeling Memo 21 July 2012
This page was intentionally left blank
ATTACHMENT 1 TABLES
Table 51 Table 61 Table 71 Table 72
Contact Elevations of the Major Lithologic Units Water Level Calibration Statistics Groundwater Data Summary Projected Durations to Meet MCLs Remedial Alternatives Summary
This page was intentionally left blank
Table 51 Contact Elevations of the Major Lithologic Units
Garvey Elevator Site Hastings Nebraska
Elev Depth Elev Depth Elev Depth Elev Thickne Depth Elev Depth Elev Thickne Depth Elev Depth Elev (ft) (ft) (ft bgs) (ft amsl) (ft bgs) (ft amsl) (ft bgs) (ft amsl) (ft bgs) (ft amsl) (ft) (ft bgs) (ft amsl) (ft bgs) (ft amsl) (ft) (ft bgs) (ft amsl) (ft bgs) (ft amsl)
OU1 MW-1A 270590926 2080164407 125 192580 645 186130 995 182630 -- -- -- -- -- -- -- -- -- -- -- --OU1 MW-2A 271240410 2080539870 1235 192733 685 185883 835 184383 -- -- -- -- -- -- -- -- -- -- -- --OU1 MW-3ABDE 270755170 2080773994 243 193099 595 187149 111 181999 134 179707 1 135 179607 155 177530 1 156 177430 2385 169249 OU1 MW-4AB 270341995 2080827075 132 193184 585 187334 89 184284 -- -- -- -- -- -- -- -- -- -- -- --OU1 MW-5ABD 269943836 2080752777 188 193006 635 186656 885 184156 132 179785 1 133 179685 -- -- -- -- -- -- --OU1 MW-6ADE 271237345 2081216968 238 192948 735 185598 935 183598 129 180046 1 130 179946 155 177446 5 160 176946 -- --OU1 MW-7AB 269088475 2079699700 135 192092 55 186592 90 183092 -- -- -- -- -- -- -- -- -- -- -- --OU1 MW-8A 271214203 2079067544 132 194080 608 188000 90 185080 -- -- -- -- -- -- -- -- -- -- -- --OU1 MW-9A 272193736 2080628145 116 192540 70 185540 90 183540 -- -- -- -- -- -- -- -- -- -- -- --OU2 MW-10AB 272535399 2081973782 130 192381 65 185881 85 183881 125 179870 1 126 179770 -- -- -- -- -- -- --OU2 MW-11A 271826499 2083509070 110 191228 70 184228 90 182228 -- -- -- -- -- -- -- -- -- -- -- --OU2 MW-12AC 270399710 2085390335 170 191713 50 186713 805 183663 -- -- -- -- -- -- -- -- -- -- -- --
OU2 (new) MW-12D 270399901 2085403521 178 191698 57 185998 88 182898 120 179698 7 127 178998 -- -- -- -- -- -- --OU1 MW-13CE 270368902 2081015694 238 192874 75 185374 90 183874 130 179874 1 131 179774 -- -- -- -- -- 235 169374 OU2 MW-14A 270968774 2084137323 1085 190956 695 184006 895 182006 -- -- -- -- -- -- -- -- -- -- -- --OU2 MW-16AC 267054564 2084286931 160 191545 50 186545 80 183545 -- -- -- -- -- -- -- -- -- -- -- --OU2 MW-17ACD 268796556 2082958916 200 190185 60 184185 85 181685 -- -- -- -- -- -- -- -- -- -- -- --OU2 MW-18ACD 268693818 2085938384 205 191064 55 185564 95 181564 1155 179514 1 1165 179414 -- -- -- -- -- -- --OU1 MW-19AC 270955133 2081332850 165 192781 61 186681 895 183831 128 179981 8 136 179181 150 177781 2 152 177581 -- --OU1 MW-20ACDE 270597445 2081202233 255 192797 54 187397 87 184097 129 179897 7 136 179197 150 177797 2 152 177597 236 169197 OU1 MW-30ACDE 270271723 2081095430 255 192903 70 185903 85 184403 1255 180353 7 1325 179653 146 178303 2 148 178103 237 169203 OU1 MW-31AC 269550764 2080816035 165 193008 63 186708 883 184178 -- -- -- -- -- -- -- -- -- -- -- --OU1 MW-33 271206314 2079068057 255 194074 84 185674 95 184574 1385 180224 55 144 179674 167 177374 675 17375 176699 240 170074
OU1 (new) MW-47BCD 270781240 2081046150 1705 192995 -- -- -- -- 1315 179845 15 133 179695 151 177895 2 153 177695 -- --OU1 (new) MW-48BCD 270645490 2080859850 171 192887 -- -- -- -- 129 179987 35 1325 179637 1498 177907 5 1548 177407 -- --OU1 (new) MW-49BCD 270039470 2080890150 171 192934 -- -- -- -- 1305 179884 15 132 179734 1495 177984 4 1535 177584 -- --OU1 (new) MW-50BCD 270307290 2080987510 170 192925 -- -- -- -- 1275 180175 5 1325 179675 1495 177975 1 1505 177875 -- --OU1 (new) MW-51BCD 270487290 2080899910 171 192943 -- -- -- -- 1268 180263 52 132 179743 1495 177993 45 154 177543 -- --OU2 (new) MW-41D1 266698811 2089673996 171 191524 62 185324 92 182324 126 178899 2 128 178699 148 176699 2 150 176499 -- --OU2 (new) MW-41D2 266708267 2089674259 206 191499 62 185299 92 182299 126 178899 2 128 178699 148 176699 2 150 176499 -- --OU2 (new) MW-42DE 269168074 2100135574 215 190207 66 183607 98 180407 124 177823 10 134 176823 -- -- -- -- -- -- --OU2 (new) MW-43DE 265395404 2097605590 2215 190835 48 186035 89 181935 -- -- -- -- -- 153 175545 2 155 175345 -- --OU2 (new) MW-44DE 267552324 2105258206 214 188530 63 182230 92 179330 119 176630 3 122 176330 1425 174280 75 150 173530 -- --OU2 (new) MW-45CD 270056199 2083476668 170 190982 50 185982 89 182082 112 179746 3 115 179446 -- -- -- -- -- -- --OU2 (new) MW-46D1 269055295 2089632928 167 191097 61 184997 94 181697 121 179003 3 124 178703 148 176303 6 154 175703 -- --OU2 (new) MW-46D2 269063843 2089632455 202 191103 61 185003 94 181703 121 179003 3 124 178703 148 176303 6 154 175703 -- --
Hwy 6 MW-104ACD 271937379 2088225393 235 190901 472 186181 936 181541 115 179401 12 127 178201 -- -- -- -- -- 220 168901 Hwy 6 MW-105ACD 270069428 2089866388 257 191679 68 184879 105 181179 123 179379 10 133 178379 -- -- -- -- -- 2455 167129 Hwy 6 MW-106ACD 270452369 2098166199 255 190664 77 182964 1075 179914 130 177664 5 135 177164 -- -- -- -- -- 248 165864 OU1 I-1 270863284 2080138346 175 19212 -- -- -- -- -- -- -- -- -- -- -- -- -- -- -- --OU1 I-2 270331729 2080131336 175 19200 -- -- -- -- -- -- -- -- -- -- -- -- -- -- -- --OU1 HTW-40 271217856 2079157749 -- 19395 -- -- -- -- -- -- -- -- -- -- -- -- -- -- -- --
Hwy 6 HTW-100 273075261 2082012337 255 19066 770 182964 1076 179904 130 177664 55 -- -- -- -- -- -- -- -- --
Surface Elevation -
Surficial Soil Peoria and
Loveland Loess
Very Fine Sand Silty Fine Sand
Clayey Silt
Silty Sand and Gravel (contains Upper Aquifer)
Upper Aquitard Medial Aquifer
Monitoring Wells
Boring DepthEasting(2)Northing(2)
Well ID Lower Aquitard Lower AquiferSite
Top of Lithologic and Hydrostratigraphic Units(1)
Decomposed Weathered
Shale
Sheet 1 of 2
Table 51 Contact Elevations of the Major Lithologic Units
Garvey Elevator Site Hastings Nebraska
Elev Depth Elev Depth Elev Depth Elev Thickne Depth Elev Depth Elev Thickne Depth Elev Depth Elev (ft) (ft) (ft bgs) (ft amsl) (ft bgs) (ft amsl) (ft bgs) (ft amsl) (ft bgs) (ft amsl) (ft) (ft bgs) (ft amsl) (ft bgs) (ft amsl) (ft) (ft bgs) (ft amsl) (ft bgs) (ft amsl)
Surface Elevation -
Surficial Soil Peoria and
Loveland Loess
Very Fine Sand Silty Fine Sand
Clayey Silt
Silty Sand and Gravel (contains Upper Aquifer)
Upper Aquitard Medial Aquifer Boring DepthEasting(2)Northing(2)
Well ID Lower Aquitard Lower AquiferSite
Top of Lithologic and Hydrostratigraphic Units(1)
Decomposed Weathered
Shale
OU1 (new) SB-09 270168160 2080517340 13160 192984 59 187084 90 183984 130 179984 1 131 179884 -- -- -- -- -- -- --OU1 (new) SB-13 269654838 2080309785 14340 192973 67 186273 87 184273 130 179973 3 133 179673 -- -- -- -- -- -- --OU1 (new) SB-29 270864398 2081035503 14215 192989 68 186189 90 183989 -- -- -- -- -- -- -- -- -- -- -- --OU1 (new) SB-32 271237915 2079979855 14865 192475 66 185875 92 183275 -- -- -- -- -- 148 177675 297 149 177575 -- --OU1 (new) SB-33 269199799 2080682378 14085 193446 63 187146 93 184146 -- -- -- -- -- -- -- -- -- -- -- --OU1 (new) SB-39 271537352 2081550026 13560 192583 64 186183 89 183683 -- -- -- -- -- -- -- -- -- -- -- --OU2 (new) TS1-01 269515615 2089614339 864 191569 70 184569 86 182969 -- -- -- -- -- -- -- -- -- -- -- --OU2 (new) TS1-03 268313868 2089646765 16736 191251 66 184651 86 182651 1195 179301 05 120 179251 148 176451 5 153 175951 -- --OU2 (new) TS1-05 267030127 2089665004 16681 191624 75 184124 87 182924 117 179924 2 119 179724 153 176324 308 155 176124 -- --OU2 (new) TS2-02 271456113 2097510251 13680 191015 73 183715 104 180615 134 177614 3 137 177314 -- -- -- -- -- -- --OU2 (new) TS2-04 268939527 2097554155 16746 190360 70 183360 89 181460 126 177760 9 135 176860 152 175160 306 154 174960 -- --OU2 (new) TS2-05 267717573 2097569698 17161 190143 62 183943 99 180243 -- -- -- -- -- 157 174443 2 159 174243 -- --OU2 (new) TS2-06 266250085 2097592053 11980 190501 60 184501 100 180501 -- -- -- -- -- -- -- -- -- -- -- --OU2 (new) TS3-02 269400264 2102787273 15690 189415 68 182615 96 179815 125 176915 7 132 176215 147 174715 297 150 174415 -- --OU2 (new) TS3-05 265786308 2102812115 14380 189056 67 182356 96 179456 1195 177106 1 1205 177006 129 176156 261 132 175856 -- --OU2 (new) TS4-02 267112179 2105261928 17031 188448 64 182048 96 178848 116 176848 3 119 176548 141 174348 284 143 174148 -- --
Hwy 6 TS3-01 271941141 2089537242 1453 19153 720 184334 1125 180284 1256 178974 29 1285 178684 -- -- -- -- -- -- --Hwy 6 TS3-02 271499828 2089579255 1414 19139 692 184466 102 181186 1227 179116 59 1286 178526 -- -- -- -- -- -- --Hwy 6 TS3-03 270957676 2089591662 1440 19087 710 183767 941 181457 1178 179087 56 1234 178527 -- -- -- -- -- -- --Hwy 6 TS3-04 270411434 2089597601 1403 19088 663 184254 1006 180824 1167 179214 61 1228 178604 -- -- -- -- -- -- --Hwy 6 TS3-05 272464675 2089528557 1718 19173 685 184883 1032 181413 123 179433 7 130 178733 -- -- -- -- -- -- --Hwy 6 TS4-01 271882569 2095813356 1658 19042 650 183920 987 180550 1238 178040 52 129 177520 -- -- -- -- -- -- --Hwy 6 TS4-03 270996450 2096068696 1171 19050 810 182400 966 180840 1154 178960 12 1166 178840 -- -- -- -- -- -- --Hwy 6 TS5-01 271766686 2092074297 1562 19016 648 183680 905 181110 1163 178530 53 1216 178000 -- -- -- -- -- -- --Hwy 6 TS5-03 270732978 2092105115 1389 19008 709 182990 923 180850 1147 178610 46 1193 178150 -- -- -- -- -- -- --Hwy 6 TS5-05 272269991 2092059880 1717 19045 425 186200 942 181030 1153 178920 83 1236 178090 -- -- -- -- -- -- --
Electrical Conductivity Borings
(1)Surface elevation listed for nested monitoring wells (ABCDE) is the surface elevation of the A well Unit elevations are from the boring logs in which they were recorded (2)State Plane Coordinate system Nebraska 2600 amsl - above mean seal level bgs - below ground surface Elev - elevation ft - feet Hwy 6 - Wellsborings installed for the West Highway 6 and Highway 281 Site Investigations -- - not applicable or not available OU1 - Operable Unit 1 these wells are associated with on-site groundwater OU1 (new) - Operable Unit 1 wellsborings installed in AprilMay 2010 for the RI OU2 - Operable Unit 2 these wells are associated with off-site groundwater OU2 (new) - Operable Unit 2 Monitoring wellsborings installed in AprilMay 2010 for the RI
Sheet 2 of 2
Table 61 Water Level Calibration Statistics
Garvey Elevator Site Hastings Nebraska
Name Layer
Target Water Level Elevation - Sept 2011
(feet amsl) Model
Water Level Error
Residual MW-12U 1 18156 1814424820 117518 MW-100A 1 181542 1814519751 0900249 MW-16U 1 181534 1814385390 095461 MW-10A 1 181528 1814182851 1097149 MW-1A 1 181525 1815209270 004073 MW-2A 1 181519 1815393838 -0203838 MW-05 1 181516 1814358176 0801824
MW-102A 1 18151 1813770877 1329123 MW-13U 1 181507 1813730081 1339919 MW-7A 1 181504 1815242607 -0202607 MW-04 1 181487 1814376802 0493198
MW-17U 1 181486 1814230581 0629419 MW-07 1 181475 1814008616 0741384 MW-03 1 181471 1813907473 0802527 MW-02 1 181468 1813743101 0936899 MW-08 1 181465 1814180036 0469964 MW-06 1 18146 1814237391 0362609
MW-10U 1 181453 1814016597 0513403 MW-14U 1 181451 1814457639 0052361 MW-6A 1 181444 1814334070 010593 MW-01 1 18144 1814062502 0337498
MW-11A 1 181429 1812347804 1942196 MW-11U 1 181411 1814658764 -0548764 MW-10B 1 181372 1814173608 -0453608 MW-3A 1 181357 1813385654 0184346 MW-5B 1 181339 1813199091 0190909 MW-15U 1 181326 1814948966 -1688966 MW-47B 1 181316 1812784852 0375148 MW-50B 1 181314 1812748409 0391591 MW-4A 1 18131 1812992455 0107545 MW-3B 1 181308 1813389494 -0309494 MW-5A 1 181307 1813165365 -0095365 MW-19A 1 181301 1813252060 -024206 MW-4B 1 181298 1812954715 0025285 MW-31A 1 181289 1812885039 0004961 MW-51B 1 181236 1812125173 0234827 MW-49B 1 181227 1812349041 -0079041 MW-48B 1 18122 1812098306 0101694 MW-30A 1 181194 1812183956 -0243956 MW-09U 1 181194 1814076063 -2136063 MW-20A 1 181179 1812309176 -0519176 MW-14A 1 181061 1810498570 011143 MW-17A 1 18098 1809745419 0054581
Sheet 1 of 3
Table 61 Water Level Calibration Statistics
Garvey Elevator Site Hastings Nebraska
Name Layer
Target Water Level Elevation - Sept 2011
(feet amsl) Model
Water Level Error
Residual MW-12A 1 180706 1807353224 -0293224 MW-16A 1 180683 1806758847 0071153 MW-18A 1 18062 1805744494 0455506 MW-104A 1 180386 1804035180 -017518 MW-105A 1 179994 1799915974 0024026 MW-106A 1 178857 1788240807 0329193 MW-18C 3 180409 1804214829 -0124829 MW-12C 3 180568 1805675664 0004336 MW-16C 3 180625 1806232799 0017201 MW-45C 3 180888 1809089044 -0209044 MW-17C 3 180918 1809113670 006633 MW-47C 3 181047 1810251020 021898 MW-101B 3 181066 1811509656 -0849656 MW-102B 3 181092 1811706686 -0786686 MW-13C 3 181107 1811204349 -0134349 MW-51C 3 181177 1811366716 0403284 MW-50C 3 18119 1811832475 0067525 MW-49C 3 181235 1812474567 -0124567 MW-48C 3 18125 1812312538 0187462 MW-7B 3 181497 1815042613 -0072613
MW-09M 5 181527 1813657691 1612309 MW-3D 5 181479 1814354375 0435625 MW-3E 5 181379 1814210888 -0420888 MW-5D 5 181366 1813572038 0087962 MW-47D 5 181365 1812738611 0911389 MW-49D 5 18134 1813402643 -0002643 MW-48D 5 181323 1812926923 0303077 MW-50D 5 181323 1812962182 0267818 MW-31C 5 181311 1813127460 -001746 MW-51D 5 181302 1812256458 0763542 MW-13E 5 181234 1812181638 0158362
MW-100D 5 181223 1813629694 -1399694 MW-100C 5 181216 1813634399 -1474399 MW-30C 5 181208 1811949179 0130821 MW-19C 5 1812 1812353637 -0353637 MW-20D 5 181196 1811924735 0035265 MW-30D 5 181188 1811949179 -0069179 MW-20E 5 181155 1811924735 -0374735 MW-16M 5 181133 1811653909 -0323909 MW-13M 5 181117 1811940971 -0770971 MW-30E 5 181115 1811949179 -0799179 MW-11M 5 181097 1814139713 -3169713 MW-17D 5 180923 1808958032 0271968
Sheet 2 of 3
Table 61 Water Level Calibration Statistics
Garvey Elevator Site Hastings Nebraska
Name Layer
Target Water Level Elevation - Sept 2011
(feet amsl) Model
Water Level Error
Residual MW-20C 5 180892 1811924735 -3004735 MW-45D 5 180884 1809292039 -0452039 MW-12D 5 180575 1805738454 0011546 MW-18D 5 180413 1804194578 -0064578 MW-104D 5 180137 1801272389 0097611 MW-104C 5 180135 1801269033 0080967 MW-46D1 5 179796 1797768438 0191562 MW-105D 5 179794 1797798970 014103 MW-46D2 5 179792 1797771831 0148169 MW-105C 5 179791 1797803499 0106501 MW-41D2 5 179702 1797046783 -0026783 MW-41D1 5 179697 1797044368 -0074368 MW-106C 5 178531 1785334635 -0024635 MW-106D 5 178527 1785320367 -0050367 MW-43D 5 178387 1783880124 -0010124 MW-43E 5 178386 1783888909 -0028909 MW-42D 5 178183 1781770173 0059827 MW-42E 5 178182 1781753639 0066361 MW-44D 5 177409 1774079493 0010507 MW-44E 5 177407 1774078775 -0008775
Residual Mean 0046933 Res Std Dev 0743461 Sum of Squares 6048817
RMS Error 0744941 Min Residual -3169713 Max Residual 1942196
Number of Observations 109 Range in Observations 4362
Scaled Std Dev 0017044 Scaled Abs Mean 0010505
Scaled RMS 0017078 Notes
amsl - above mean sea level
Sheet 3 of 3
Table 71 Groundwater Data Summary Projected Durations to Meet MCLs
Garvey Elevator Site Hastings Nebraska
Well Data Collection Range TCE Concentration μgL Estimated Date to
Reach MCLs Duration from June 2012 yrsHigh Low
MW-3A May 1997 - March 2012 20000 11 already achieved NA MW-3B May 1997 - March 2012 23000 74 Nov 2045 33 MW-3D April 1997 - March 2012 5 05 already achieved NA MW-3E April 1997 - March 2012 4 05 already achieved NA MW-4A May 1997 - March 2012 18000 43 Sept 2013 1 MW-4B May 1997 - March 2012 29000 690 Dec 2042 30 MW-5A May 1997 - March 2012 24000 47 already achieved NA MW-5B May 1997 - March 2012 15000 12 Jan 2017 5 MW-5D April 1997 - March 2012 4 05 already achieved NA MW-13C May 1997 - March 2012 18000 28 Nov 2061 49 MW-13E May 1997 - March 2012 5 05 already achieved NA
RW-1 1999 - 2011 490 10 May 2016 4 RW-2 1999 - 2011 3200 5 Nov 2021 9 RW-3 1999 - 2011 3800 5 Feb 2024 12 RW-4 1997 - 2011 5500 5 June 2016 4 RW-5 1999 - 2011 5500 5 achieved NA RW-6 1999 - 2011 590 10 Oct 2018 6 RW-7 1995 - 2011 1000 5 Jan 2025 13 RW-8 1998 - 2011 380 5 March 2047 35
Notes
Dates and concentration data are from the site database projections to reach MCLs are based on curves fitted to data plots as provided by Dr Brian
Zurbuchen via email on June 11 2012
μgL - micrograms per liter
Sheet 1 of 1
Table 72 Remedial Alternatives Summary
Garvey Elevator Site Hastings Nebraska
Remedial Alternative Assumptions Remediation
Times Notes
OU 1
SG-1-No Action All extraction wells off 30 years
This scenario was not explicity modeled Based on the remedition duration predicted for SG2 remediation time will be greater than 30 years However for cost estimating purposes a 30-year duration will be used
SG2-- Maintain and Operate Existing GET System
No treatment of downgradient plume
30 years This scenario was not explicity modeled but remediation time was estimated based on contaminant concentration trends (see Table 71)
SG3--In Situ Treatment Via Groundwater Amendments
Area within gt500 ugL set to 00 on-site treatment system shut off
15 years Remediation time estimates are for OU1 (on-site) plume using multiple injection treatments and existing GET system shut off
SG4-- Maintain and Operate Existing GET System and Treatment Via Groundwater Amendments
Pump and treat system operating groundwater within concentrations gt500 ugL set to 00
10 years Remediation time estimates are for OU1 (on-site) plume using multiple injection treatments and existing GET system operating
OU 2
G1-No Action Pump and treat system operating no treatment of downgradient plume
30 years This scenario was not explicity modeled For cost estimating purposes a 30-year duration will be used
G2-Groundwater Recovery Treatment and Discharge at Leading Edge of Plume
On-site pump and treat system operating
100 years Based upon modeling results for more active remedies the remediation times for both the OU 1 and OU 2 plumes would exceed 100 years This scenario was not explicity modeled
G3a-Groundwater Recovery Treatment and Discharge at mid point and Leading Edge of Plume
On-site pump and treat system operating
75 years
Modeled duration ranges from 75 to 90 years
G3b-Groundwater Recovery Treatment and Discharge at two transects and Leading Edge of Plume
On-site pump and treat system operating
53 years
G4a-In Situ treatment at midpoint of plume and Groundwater Recovery Treatment and Discharge at leading edge of plume
On-site pump and treat system operating
75 years
Same as G3 but a treatment zone replaces the recovery wells near the midpoint of the plume Modeled duration ranges from 75 to 90 years
G4b-In Situ treatment at two transects near core of plume and Groundwater Recovery Treatment and Discharge at leading edge of plume
On-site pump and treat system operating
56 years Same as G3 but two treatment zones replace the recovery wells near the midpoint of the plume
Notes
μgL - micrograms per liter
Sheet 1 of 1
This page was intentionally left blank
ATTACHMENT 2 FIGURES
Figure 31 Carbon Tetrachloride Isoconcentrations Upper Aquifer Zone AB Figure 32 Carbon Tetrachloride Isoconcentrations Medial Aquifer Zone C Figure 33 Carbon Tetrachloride Isoconcentrations Lower Aquifer Zone DE
Figure 51 Model Domain and Boundary Conditions Figure 52 Vertical Discretization of Model Figure 53 Elevation of the Model Base Figure 54 Elevation of the Top of the Lower Aquifer Figure 55 Isopach Map of the Lower Confining Unit Figure 56 Elevation of the Base of the Medial Aquifer Figure 57 Isopach of Upper Aquifer Figure 58 Elevation of the Base of the Upper Aquifer Figure 59 Location of Recovery Wells in the Shallow Aquifer Figure 510 Location of Recovery Wells in the Medial Aquifer Figure 511 Location of Injection and Municipal Wells in the Lower Aquifer Figure 512 Initial Concentrations of Carbon Tetrachloride in the Shallow Aquifer Figure 513 Initial Concentrations of Carbon Tetrachloride in the Medial Aquifer Figure 514 Initial Concentrations of Carbon Tetrachloride in the Lower Aquifer
Figure 61 Error Residuals Versus Measured Water Levels Figure 62 Measured Water Levels Versus Predicted Water Level Elevations Figure 63 Error Residuals for the Shallow Aquifer in the Vicinity of the Garvey Elevator
Site Figure 64 Error Residuals for the Shallow Aquifer over the Model Domain Figure 65 Error Residuals for the Medial Aquifer over the Model Domain Figure 66 Error Residuals for the Lower Aquifer in the Vicinity of the Garvey Elevator
Site Figure 67 Error Residuals for the Lower Aquifer over the Entire Model Domain Figure 68 Calibrated Hydraulic Conductivities of the Shallow Aquifer Figure 69 Calibrated Hydraulic Conductivities of the Medial Aquifer Figure 610 Calibrated Hydraulic Conductivities of the Lower Aquifer Figure 611 Calibrated Hydraulic Conductivities of the Upper Aquitard Figure 612 Calibrated Hydraulic Conductivities of the Lower Aquitard Figure 613 Calibrated Potentiometric Surface of the Shallow Aquifer Figure 614 Calibrated Potentiometric Surface of the Medial Aquifer Figure 615 Calibrated Potentiometric Surface of the Lower Aquifer Figure 616 Particle Tracking Analysis to Estimate Travel Time
Figure 71 Initial Concentrations for Alternative SG3 Figure 72 Capture Zone Analysis in the Shallow Aquifer for Alternative SG3 Figure 73 Capture Zone Analysis in the Medial Aquifer for Alternative SG3 Figure 74 Alternative G2 ndash Proposed Recovery Wells Medial Aquifer
ATTACHMENT 2 FIGURES (continued)
Figure 75 Alternative G2 ndash Proposed Recovery Wells Lower Aquifer Figure 76 Preliminary Locations for Leading Edge Recovery Wells and Groundwater
Treatment Building ndash Alternative G2 Figure 77 Alternative G3ab ndash Proposed Recovery Wells Medial Aquifer Figure 78 Alternative G3a ndash Proposed Recovery Wells Lower Aquifer Figure 79 Preliminary Locations for Mid-Plume and Leading Edge Recovery Wells and
Groundwater Treatment BuildingmdashAlternative G3 Figure 710 Alternative G3b ndash Proposed Recovery Wells Lower Aquifer Figure 711 Alternative G3b ndash Relative Positions of Proposed Recovery Wells Medial and
Lower Aquifer Figure 712 Alternative G4a ndash Proposed Treatment Curtain and Recovery Wells Lower
Aquifer Figure 713 Preliminary Locations for Mid-Plume Injection Wells Leading Edge Recovery
Wells and Groundwater Treatment Building ndash Alternative G4 Figure 714 Alternative G4b ndash Proposed Treatment Curtains and Recovery Wells Lower
Aquifer Figure 715 Alternative G4b ndash Relative Positions of Proposed Recovery Wells and
Treatment Curtains
5
5
5
5
5
50
100 500
MW-6A SB-39 HGLmdashGroundwater Flow Modeling Technical MemorandumMW-2AHTW 40 (98)(ND)MW-8A MW47B ( Garvey Elevator SitemdashHastings NE(ND)
(59) SB-38
MW-19APSUS PU PPPUUU ( Figure 31 (70)MW-33 MW-3AB
Carbon Tetrachloride in the(ND53) MW49B MW-20A
+UP+UPPPP+U+U+UPPPPUUUU+UP+UPPPP+U+U+U(43) Upper Aquifer Zone AB(10)
MW-1A PU MW50B(ND) +UP+UPPPP+U+U+U September 2011 Sampling(84)
PPUUMW-4AB PPUU MW-13CE +++++UPUPPPPUUU (21640)
MW-30A (160)+UP+UPPPP+U+U+U LegendPPPUUU
1000 MW51B (1200) MW-5AB
(4119J)
Garvey Property BoundaryMW-7AB MW-31A (ND) (75) (
PPUU MW48B RailroadSB-33 (680)
Inset Ntilde Monitoring Well Location MW-47B MW-10A
(59) (ND) Multilevel Well MW-9A MW-6AHTW 40 MW-10B(ND) (98)
(ND) MW-11A S Hydraulic Conductivity
MW-33 UPPUMW-2A MW-19AU MW-14A(ND) P
(70) PU (ND) A West Highway 6 amp Highway 281 Site MW-12A AMW-106AMW-20A MW-104AMW-3A MW-8A (ND) Monitoring WellU UUU (ND)PSSU P PPP (10)(ND) (ND)(ND) U
UUUUU PUUUUP PPPPPPPPPPPPPPPPPPPPPPPUUUUPUPPPPUUUUU MW-13CE
UUUU Carbon Tetrachloride ConcentrationMW-3B MW-105A A (190)PPP A (ND)
UUUUUUUUU(53) MW-30A in micrograms per liter (microgL)PPUUPPPUUUPPPPPUUUUU
MW-12DMW-1A (160) MW-42 DEMW-45CD(ND)
MW-50B MW-49B MW-51B Carbon Tetrachloride Isoconcentration(84) PPUUPPUU(43)
PPUU(1200)
Contour (microgL)PPPUUU PPPUUUMW-46 D1D2MW-7B (5)(ND)
(Dashed Lines are Estimated)MW-7A (ND)
MW-5A (41)
MW-4A (21) MW-4B (640)
MW-48B (680)
MW-17A (ND)
MW-16A (ND) UUPP
MW-18A (ND)
MW-41 D1D2 UUPP
MW-44 DE UUPP
MW-5B
MW-31A (75)
(19)
MW-43 DE UUPP Notes
(ND) Nondetect
0 2500 5000
Feet sup3 Filename XEPA009GarveyGW_Flow_Tech_Memo Carbon_TetChl_UpperAquifer_ABmxd Project EP903401220202 Revised 061312 ST Source ENSR GDB 2008 DNR
100
5
100
SB-39MW-6AHTW 40 HGLmdashGroundwater Flow Modeling Technical Memorandum MW47C SB-38MW-33 MW-2A (62) ( Garvey Elevator SitemdashHastings NE
UUUPSUS P PPP (
U
Figure 32MW-8A MW-3ABDE MW-19C (ND) Carbon Tetrachloride in the
MW-1A +++++PPPP UPUPPPPUUUUUUU
+UP+UPPPP+U+U+U Medial Aquifer Zone CPU MW-20C +UP+UPPPP+U+U+U (ND) September 2011 SamplingMW49C
UU(ND) PPUU +++++PPPPPPPUUUUU MW50C
(ND) +UP+UPPPP+U+U+UPPPUUU LegendMW-13C
MW-4AB (130) MW-30C
MW-5AB (ND) MW48C MW51C
(ND) (ND) Garvey Property Boundary SB-33 (
MW-7AB PPUU MW-31C (ND) Railroad
Inset Ntilde Monitoring Well Location MW-47CMW-9A MW-10AB Multilevel Well(62)
HTW 40
MW-6A S Hydraulic Conductivity WellMW-11AMW-33 PPUUMW-2A
MW-19CUP (ND) P West Highway 6 amp Highway 281 SiteU MW-14A A A Monitoring WellMW-20C MW-12C MW-106CMW-104CPSS P PPP
U (ND) (ND) (90) (ND)
MW-8A MW-13C U U UUU
PMW-3ABDE PPPPPPPPUUUUPU (130) Carbon Tetrachloride ConcentrationPU UUUU UUUUUUUUUU
MW-105C A (190)MW-1A UUUUUUUUUPPPPPPPPPPPPPPPPPPP MW-30C PPPUUU MW-12D A (200) in micrograms per liter (microgL)
MW-49C UUUUPUPPPPUUPU (ND) UPPU Old Rolls MW-42 DEPP (13)(ND) Carbon Tetrachloride Isoconcentration MW-45C MW-50C (ND)
MW-51C (ND) PPUU PPUU PPUU (5) Contour (microgL)(ND)
UUU PPP MW-46 D1D2
PPP UUUMW-48C (Dashed Lines are Estimated)5MW-7AB (ND)
MW-4AB MW-17C MW-18C(ND) MW-44 DE Domestic Irrigation W ater Wells(81)MW-5AB
PPUUMW-31C MW-16C (ND)
PPUU(ND) MW-41 D1D2
PPUU
Notes MW-43 DE PPUU
(ND) Nondetect
0 2500 5000
Feet sup3 FilenameXEPA009GarveyGW_Flow_Tech_Memo Carbon_TetChl_Medial_Aquifer_Cmxd Project EP903401220202 Revised 061312 ST Source ENSR GDB 2008 DNR
50
5
5
50 100
MW-6D SB-39 HGLmdashGroundwater Flow Modeling Technical MemorandumHTW 40 (ND) SB-38MW-3DE ( Garvey Elevator SitemdashHastings NE (NDND)
UUUUPSUS P PPP MW-19AC( Figure 33MW-2A MW-33 MW47D
U (ND)
Carbon Tetrachloride in theMW-8A PPPPUUUU P Lower Aquifer Zone DEUMW-1A MW-20DEPU P
(NDND)UPUU
September 2011 Sampling MW-13EPPUUPPPU (ND)
MW50D UPMW49D (ND) UUU(ND) PPP MW-30DE Legend MW51D (ND)
(ND)MW-4AB MW48D (ND)
MW-7AB MW-5D (ND) Garvey Property Boundary
MW-31C (ND)
PPUU
(
RailroadSB-33MW-3DE (NDND)
Inset Ntilde Monitoring Well Location MW-47D
MW-9A (ND) Multilevel Well HTW 40
MW-6D MW-10AB (ND)
MW-11A S Hydraulic Conductivity Well MW-33 MW-2A UPPU
PUMW-19AC West Highway 6 amp Highway 281 Site MW-14A APU
MW-20DE MW-106D A Monitoring WellMW-104DPSSU PU PPPUUU (NDND)
MW-12C (ND)(ND)MW-8A MW-13E PU
UUUUU (ND) Carbon Tetrachloride ConcentrationU PPPPPPPPUUUUPU (190)PPUUU
PPUPPPPPPPPPPPPPPPUUUUUP
UUUUU UUUUUUU PPP A MW-105DMW-1A in micrograms per liter (microgL) AMW-30DE
PPUUPPPUUUPPPPPUUUUU(52)
(NDND) MW-12DNew RollsMW-49D (ND) (ND)
Carbon Tetrachloride Isoconcentration(ND) MW-45D PPUUMW-51D (ND)
MW-46 D1PPUU PPUU Contour (microgL)MW-50D (ND) (5)(ND)
PPPUUU (770)PPPUUU MW-42 DMW-48D (Dashed Lines are Estimated)MW-4AB (4274)(ND)
MW-44DEMW-46 D2 MW-17D (320) (19ND)MW-7AB
MW-5D Domestic Irrigation W ater Wells(94) MW-18D PPUUMW-31C(ND) (21) MW-41 D1MW-5B MW-16C PPUU (ND)
PPUUMW-41 D2 (10) Notes
MW-43DE UUPP(ND18) (ND) Nondetect
0 2500 5000
Feet sup3 Filename XEPA009GarveyGW_Flow_Tech_Memo Carbon_TetChl_LoweR_Aquifer_Dmxd Project EP903401220202 Revised 061312 ST Source ENSR GDB 2008 DNR
_L _j I I I I _j_ I I I
I l --- I 111
1
__u_ I I
1 I ~ N ----y-
+ ~ I
II L _l e11111111111 I ---1 ~lJJ I n r Igt I Constant Head Boundariesj l _Q No Flow Sound aries I I l
~ r-- I - I middot r-
- fl+- L -
0 I J ~r-
Ll-D l Garvey Site I - ~t
Ill -J
l unJprm Spacing 25 eet U~iform S pacing 1 00 feet I Constant Head Boundaries
j
middotmiddot- ~ No Flow Sound aries
J
--=J--=11-~=======2~-----~3=========4~------5 M1les 0 05
Figure 51 Model Domain Gridding and Boundaries
Figure 52 Vertical Discretization of Model
1610
1620
1 6 2 0
1630
1 6 3 0
1640
1 6 4 0
1650
1 6 5 0
1660
1660
1670
1670
1680
1680
1690
17
1698
17013
16918
169198
169118
165864
167129
168901
169482
169872
169403
169347
169374
169448
Figure 53 Elevation of the Model Base (weathered shale of the Niobrara Formation)
1111
I I
-
N
+ 0 05
I I
I 1 l
I
1 l -
2 3 4 Miles
Figure 54 Elevation of the Top of the Lower Aquifer
Figure 55 Isopach Map of Lower Confining Unit (model Layer 4)
Figure 56 Elevation of the Base of the Medial Aquifer
Figure 57 Isopach of Upper Aquitard (model layer 2)
Figure 58 Elevation of the Base of the Upper Aquifer
I I I
~ ~ t--7 t bull I I I
r I l
I EW-01 f1-m I N I bull __ j
+ twtrl I I I rl bull I I I I J I I I -r-----
- middot-- - -- -- middot------__J_--
I --- 1 Feet I 0 500 1 000 2000 3000 4000 rooo I I I I
Figure 59 Location of Recovery Wells in the Shallow Aquifer
_l ________ l I I I -1 middot ] l ~----------middotj + I j
middotmiddot= middotmiddot- ---------L -- ---- ___ _ [_ __
r--------shy1
o--~oomiddoto~bull1~oo=o ======4~oomiddoto------middot~ooco=======43oobullo -------~oo~1
Figure 510 Location of Recovery Wells in the Medial Aquifer
I I r
~~ r -
L - - - -- -1--ltmiddot --I-
I -
---- L f+r
il I
J ---1
I
N
+
Figure 511 Location of Injection and Municipal Wells in the Lower Aquifer
Figure 512 Initial Concentrations of Carbon Tetrachloride in the Shallow Aquifer
Figure 513 Initial Concentrations of Carbon Tetrachloride in the Medial Aquifer
Figure 514 Initial Concentrations of Carbon Tetrachloride in the Lower Aquifer
-40
-30
-20
-10
00
10
20
30
40
17741 17828 17915 18002 18090 18177
Res
idua
l
Layer 1
Layer 3
Layer 5
Observed Value
Figure 61 Error Residuals Versus Measured Water Levels
Layer 1
Layer 3
18090
18177
Layer 5
Mod
el V
alue
17741 17828 17915 18002 18090 18177
18002
17915
17828
17741
Observed Value
Figure 62 Measured Water Levels Versus Predicted Water Levels
bull -020
N
+ 0
h I I
-----------~----j_ _______ ___ j_94-__ _ __ I ------------- t
011
bull 005
05
bull
I
Mile 1
Figure 63 Error Residuals for the Shallow Aquifer in the vicinity of the Garvey Elevator Site
Figure 64 Error Residuals for the Shallow Aquifer Over the Model Domain
-007 bull
N
+
il _ __ ~ II
t079 i
I 1 II_ --middot--middot- J_~=====-middot 1------~
~--1 000 r-----middot- -middotmiddot ____
-021 bull
-012 007 bull bull
l middot l02
I ~~~~====~---====~---Feet _ o ___ _ $-_~_0 _ ___ _ J000 _____ 3QQ_Q_ ---4lIJOLUlJ00----ltgt5ultOOO-- middott- middot ----
I
Figure 65 Error Residuals for the Medial Aquifer Over the Model Domain
0 250
N
+
044 bullbull -042
000 bull
027 bull
013
-)35 bull
Figure 66 Error Residuals for the Lower Aquifer in the Vicinity of the Garvey Elevator Site
Figure 67 Error Residuals for the Lower Aquifer in the Entire Model Domain
Figure 68 Calibrated Hydraulic Conductivities of the Shallow Aquifer (ftd) (model layer 1)
Figure 69 Calibrated Hydraulic Conductivities of the Medial Aquifer (ftd) (model layer 3)
Figure 610 Calibrated Hydraulic Conductivities of the Lower Aquifer (ftd) (model layer 5)
Figure 611 Calibrated Hydraulic Conductivities of the Upper Aquitard (ftd) (model layer 2)
Figure 612 Calibrated Hydraulic Conductivities of the Lower Aquitard (ftd) (model layer 4)
Figure 613 Calibrated Potentiometric Surface of the Shallow Aquifer (model layer 1)
Figure 614 Calibrated Potentiometric Surface of the Medial Aquifer (model layer 3)
Figure 615 Calibrated Potentiometric Surface of the Lower Aquifer (model layer 5)
Figure 616 Particle Tracking Analysis to Estimate Travel Time
Figure 71 Initial Concentrations for Alternative SG3
E3 E3 2000feet
Figure 72 Capture Zone Analysis in the Shallow Aquifer for Alternative SG3
E3 E3 E3 2000feet
Figure 73 Capture Zone Analysis in the Medial Aquifer for Alternative SG3
Figure 74 Alternative G2-Proposed Recovery Wells Medial Aquifer
Figure 75 Alternative G2- Proposed Recovery Wells Lower Aquifer
50
5 5
5
50 100
MW-3DE (NDND)
MW-47D MW-9A (ND)
HTW 40 MW-6D MW-10AB
(ND) MW-11A
MW-2AMW-33 UPPUPU
MW-19AC MW-14A APUMW-20DE MW-106DMW-104D(NDND) MW-12CPSSU (ND)PU PPPUUU PU (ND) MW-13E
HGLmdashGroundwater Flow Modeling Technical Memorandum Garvey Elevator Superfund SitemdashHastings NE
Figure 76 Preliminary Locations for Leading
Edge Recovery Wells and Groundwater Treatment Building-Alternative G2
Legend Garvey Property Boundary
Railroad
Ntilde Monitoring Well Location
Multilevel Well
S Hydraulic Conductivity Well
A West Highway 6 amp Highway 281 Site Monitoring Well
(190) Carbon Tetrachloride Concentration in micrograms per liter (microgL)
Carbon Tetrachloride Isoconcentration Treatment Building
Technical Blvd
MW-8A UUUU UUUUU
U PPPPPPPPUUUUPU UUUUUUPUP
UUUUUPPPPPPPPPPPPPPPPPP (ND)
PPPUUU A MW-105DMW-1A UU AMW-30DE PPUUPPPUUUPPPPPUUUUU
(52)(NDND) MW-12DNew Rolls Contour (Lower Aquifer) (microgL)MW-49D (5)(ND) (ND)
(ND) MW-45D (Dashed Lines are Estimated)PPUUMW-51D (ND) MW-46 D1PPUU PPUUMW-50D
(ND) (ND)
PPPUUU (770)PPPUUU MW-42 DMW-48D Domestic Irrigation W ater WellsMW-4AB (4274) MW-44DE(ND)
(19ND)MW-46 D2 MW-17D (320)MW-7AB Carbon Tetrachloride Isoconcentration(94)MW-5D
MW-18D PPUU (5) Contour (Upper Aquifer) (microgL)(21) MW-41 D1 MW-31C(ND)
MW-5B MW-16C PPUU (Dashed Lines are Estimated)(ND)
PPUUIdlewilde Rd
MW-41 D2 Recovery Wells (Medial)
Recovery Wells (Deep)
(10)
MW-43DE PPUU(ND18)
Recovery Well Piping
Treatment Building
Notes (ND) Nondetect
Blaine A
ve
Showboa t B
lvd
sup3 Filename XEPA009GarveyGW_Flow_Tech_Memo Carbon_TetChl_LoweR_Aquifer_Dmxd Project EP903401220202 Revised 061312 ST2500 5000 Source ENSR GDB 2008 DNR
Feet
0
Figure 77 Alternative G3ab-Proposed Recovery Wells Medial Aquifer
Figure 78 Alternative G3a- Proposed Recovery Wells Lower Aquifer
50
5 5
5
50 100
HGLmdashGroundwater Flow Modeling Technical Memorandum Garvey Elevator Superfund SitemdashHastings NE
Figure 79 Preliminary Locations for Mid-Plume and
Leading Edge Recovery Wells and Groundwater Treatment Building-Alternative G3
Legend Garvey Property Boundary
Railroad
Ntilde Monitoring Well Location MW-3DE (NDND)
Multilevel Well MW-47D
MW-9A (ND) Hydraulic Conductivity WellSHTW 40 MW-6D MW-10AB
(ND) West Highway 6 amp Highway 281 SiteMW-11A
MW-33 PPUUMW-2A PUA Monitoring Well
MW-19AC MW-14A APUCarbon Tetrachloride Concentration
Technical Blvd
MW-44DE (19ND) (Dashed Lines are Estimated)
MW-20DE (190)MW-106DPSSU PU PPPUUU MW-104DMW-12C(NDND) (ND)PU in micrograms per liter (microgL)(ND) MW-13EMW-8A
U UUUU UPUPPPPUUUUUUUUP UUUUU UUUPPPPPPPPPPPPPPPPPPPPPPPUUUUUU
(ND) PPPUUU A Treatment BuildingMW-105DMW-1A Carbon Tetrachloride IsoconcentrationMW-30DE A
PPUUPPPUUUPPPPPUUUUU(52)
(NDND) MW-12DNew Rolls Contour (Lower Aquifer) (microgL)MW-49D (5)(ND) (ND)(ND) MW-45D
MW-51D PPUU(ND)
PPUU PPUUMW-50D (ND)
MW-46 D1(ND) PPPUUU (770)
PPPUUU MW-42 D (4274)
MW-48D Domestic Irrigation W ater WellsMW-4AB (ND) MW-46 D2
MW-17DMW-7AB (320)(94) Carbon Tetrachloride IsoconcentrationMW-5D
MW-18D(ND) MW-31C (21) PPMW-41 D1
UU (5) Contour (Upper Aquifer) (microgL)MW-5B MW-16C UU (ND)PP (Dashed Lines are Estimated)PPUUIdlewilde Rd
MW-41 D2 Recovery Wells (Medial)(10)
MW-43DE UUPP(ND18) Recovery Wells (Deep)
Recovery Well Piping
Treatment Building
Notes (ND) Nondetect
Blaine A
ve
Showboa t B
lvd
sup3 Filename XEPA009GarveyGW_Flow_Tech_Memo Mid-Plume_Prelim_Loc Project EP903401220202 Revised 061312 RL2500 5000 Source ENSR GDB 2008 DNR
Feet
0
Figure 710 Alternative G3b-Proposed Recovery Wells Lower Aquifer
Figure 711 Alternative G3b-Relative Positions of Proposed Recovery Wells Medial and Lower Aquifers
Figure 712 Alternative G4a-Proposed Treatment Curtain and Recovery Wells Lower Aquifer
50
5 5
5
50 100
HGLmdashGroundwater Flow Modeling Technical Memorandum Garvey Elevator Superfund SitemdashHastings NE
Figure 713 Preliminary Locations for Mid-Plume
Injection Wells Leading Edge Recovery Wells and Groundwater Treatment Building
-Alternative G4
Legend Garvey Property Boundary
Railroad
Ntilde Monitoring Well Location MW-3DE (NDND)
MW-47D MW-9A (ND)
HTW 40 MW-6D MW-10AB
(ND)
S Elm
Ave
S Wabash A
ve
Multilevel Well
S Hydraulic Conductivity Well
A West Highway 6 amp Highway 281 Site Monitoring Well
MW-11AMW-33 UPPUMW-2A PU
MW-19AC MW-14A APUMW-20DE MW-106D Carbon Tetrachloride ConcentrationPU PPPUUU (190)PSSU MW-104D(NDND) MW-12C (ND)PU in micrograms per liter (microgL)(ND)
Treatment Building Technical B
lvd MW-13EMW-8A
UUUU UUUUUU PPPPPPPPUUUUPU UUUUU
UPUP
UUUUUPPPPPPPPPPPPPPPPPP (ND)
PPPUUU A MW-105DMW-1A UU Carbon Tetrachloride IsoconcentrationAMW-30DE PPUUPPPUUUPPPPPUUUUU
(52)(NDND) MW-12DNew Rolls Contour (Lower Aquifer) (microgL)MW-49D (5)(ND) (ND)
(ND) MW-45D (Dashed Lines are Estimated)PPUUMW-51D (ND) MW-46 D1PPUU PPUUMW-50D
(ND) (ND)
PPPUUU (770)PPPUUU MW-42 DMW-48D Domestic Irrigation W ater WellsMW-4AB (4274)(ND) MW-44DEMW-46 D2
(19ND)MW-17D (320)MW-7AB Carbon Tetrachloride Isoconcentration(94)MW-5D MW-18D PPUU (5) Contour (Upper Aquifer) (microgL)(21) MW-41 D1
MW-31C(ND) MW-5B MW-16C PPUU (Dashed Lines are Estimated)(ND)
PPUUIdlewilde Rd
MW-41 D2 Recovery Wells (Medial)
Recovery Wells (Deep)
(10) Injection Area 1 MW-43DE PPUUPermanent Injection Well Spacing 40 ft (ND18)
Total Injection Wells Installed 39 Recovery Well Piping Injection Area (40 ft spacing between the wells) Treatment Building
Notes (ND) Nondetect
Blaine A
ve
Showboa t B
lvd
S Baltim
ore Ave
sup3 Filename XEPA009GarveyGW_Flow_Tech_Memo G4_Prelim_Loc_Inj_Areamxd Project EP903401220202 Revised 061312 RL2500 5000 Source ENSR GDB 2008 DNR
Feet
0
Figure 714 Alternative G4b-Proposed Treatment Curtains and Recovery Wells Lower Aquifer
Figure 715 Alternative G4b-Relative Positions of Proposed Recovery Wells and Treatment Curtains

This page was intentionally left blank
ATTACHMENT 1 TABLES
Table 51 Table 61 Table 71 Table 72
Contact Elevations of the Major Lithologic Units Water Level Calibration Statistics Groundwater Data Summary Projected Durations to Meet MCLs Remedial Alternatives Summary
This page was intentionally left blank
Table 51 Contact Elevations of the Major Lithologic Units
Garvey Elevator Site Hastings Nebraska
Elev Depth Elev Depth Elev Depth Elev Thickne Depth Elev Depth Elev Thickne Depth Elev Depth Elev (ft) (ft) (ft bgs) (ft amsl) (ft bgs) (ft amsl) (ft bgs) (ft amsl) (ft bgs) (ft amsl) (ft) (ft bgs) (ft amsl) (ft bgs) (ft amsl) (ft) (ft bgs) (ft amsl) (ft bgs) (ft amsl)
OU1 MW-1A 270590926 2080164407 125 192580 645 186130 995 182630 -- -- -- -- -- -- -- -- -- -- -- --OU1 MW-2A 271240410 2080539870 1235 192733 685 185883 835 184383 -- -- -- -- -- -- -- -- -- -- -- --OU1 MW-3ABDE 270755170 2080773994 243 193099 595 187149 111 181999 134 179707 1 135 179607 155 177530 1 156 177430 2385 169249 OU1 MW-4AB 270341995 2080827075 132 193184 585 187334 89 184284 -- -- -- -- -- -- -- -- -- -- -- --OU1 MW-5ABD 269943836 2080752777 188 193006 635 186656 885 184156 132 179785 1 133 179685 -- -- -- -- -- -- --OU1 MW-6ADE 271237345 2081216968 238 192948 735 185598 935 183598 129 180046 1 130 179946 155 177446 5 160 176946 -- --OU1 MW-7AB 269088475 2079699700 135 192092 55 186592 90 183092 -- -- -- -- -- -- -- -- -- -- -- --OU1 MW-8A 271214203 2079067544 132 194080 608 188000 90 185080 -- -- -- -- -- -- -- -- -- -- -- --OU1 MW-9A 272193736 2080628145 116 192540 70 185540 90 183540 -- -- -- -- -- -- -- -- -- -- -- --OU2 MW-10AB 272535399 2081973782 130 192381 65 185881 85 183881 125 179870 1 126 179770 -- -- -- -- -- -- --OU2 MW-11A 271826499 2083509070 110 191228 70 184228 90 182228 -- -- -- -- -- -- -- -- -- -- -- --OU2 MW-12AC 270399710 2085390335 170 191713 50 186713 805 183663 -- -- -- -- -- -- -- -- -- -- -- --
OU2 (new) MW-12D 270399901 2085403521 178 191698 57 185998 88 182898 120 179698 7 127 178998 -- -- -- -- -- -- --OU1 MW-13CE 270368902 2081015694 238 192874 75 185374 90 183874 130 179874 1 131 179774 -- -- -- -- -- 235 169374 OU2 MW-14A 270968774 2084137323 1085 190956 695 184006 895 182006 -- -- -- -- -- -- -- -- -- -- -- --OU2 MW-16AC 267054564 2084286931 160 191545 50 186545 80 183545 -- -- -- -- -- -- -- -- -- -- -- --OU2 MW-17ACD 268796556 2082958916 200 190185 60 184185 85 181685 -- -- -- -- -- -- -- -- -- -- -- --OU2 MW-18ACD 268693818 2085938384 205 191064 55 185564 95 181564 1155 179514 1 1165 179414 -- -- -- -- -- -- --OU1 MW-19AC 270955133 2081332850 165 192781 61 186681 895 183831 128 179981 8 136 179181 150 177781 2 152 177581 -- --OU1 MW-20ACDE 270597445 2081202233 255 192797 54 187397 87 184097 129 179897 7 136 179197 150 177797 2 152 177597 236 169197 OU1 MW-30ACDE 270271723 2081095430 255 192903 70 185903 85 184403 1255 180353 7 1325 179653 146 178303 2 148 178103 237 169203 OU1 MW-31AC 269550764 2080816035 165 193008 63 186708 883 184178 -- -- -- -- -- -- -- -- -- -- -- --OU1 MW-33 271206314 2079068057 255 194074 84 185674 95 184574 1385 180224 55 144 179674 167 177374 675 17375 176699 240 170074
OU1 (new) MW-47BCD 270781240 2081046150 1705 192995 -- -- -- -- 1315 179845 15 133 179695 151 177895 2 153 177695 -- --OU1 (new) MW-48BCD 270645490 2080859850 171 192887 -- -- -- -- 129 179987 35 1325 179637 1498 177907 5 1548 177407 -- --OU1 (new) MW-49BCD 270039470 2080890150 171 192934 -- -- -- -- 1305 179884 15 132 179734 1495 177984 4 1535 177584 -- --OU1 (new) MW-50BCD 270307290 2080987510 170 192925 -- -- -- -- 1275 180175 5 1325 179675 1495 177975 1 1505 177875 -- --OU1 (new) MW-51BCD 270487290 2080899910 171 192943 -- -- -- -- 1268 180263 52 132 179743 1495 177993 45 154 177543 -- --OU2 (new) MW-41D1 266698811 2089673996 171 191524 62 185324 92 182324 126 178899 2 128 178699 148 176699 2 150 176499 -- --OU2 (new) MW-41D2 266708267 2089674259 206 191499 62 185299 92 182299 126 178899 2 128 178699 148 176699 2 150 176499 -- --OU2 (new) MW-42DE 269168074 2100135574 215 190207 66 183607 98 180407 124 177823 10 134 176823 -- -- -- -- -- -- --OU2 (new) MW-43DE 265395404 2097605590 2215 190835 48 186035 89 181935 -- -- -- -- -- 153 175545 2 155 175345 -- --OU2 (new) MW-44DE 267552324 2105258206 214 188530 63 182230 92 179330 119 176630 3 122 176330 1425 174280 75 150 173530 -- --OU2 (new) MW-45CD 270056199 2083476668 170 190982 50 185982 89 182082 112 179746 3 115 179446 -- -- -- -- -- -- --OU2 (new) MW-46D1 269055295 2089632928 167 191097 61 184997 94 181697 121 179003 3 124 178703 148 176303 6 154 175703 -- --OU2 (new) MW-46D2 269063843 2089632455 202 191103 61 185003 94 181703 121 179003 3 124 178703 148 176303 6 154 175703 -- --
Hwy 6 MW-104ACD 271937379 2088225393 235 190901 472 186181 936 181541 115 179401 12 127 178201 -- -- -- -- -- 220 168901 Hwy 6 MW-105ACD 270069428 2089866388 257 191679 68 184879 105 181179 123 179379 10 133 178379 -- -- -- -- -- 2455 167129 Hwy 6 MW-106ACD 270452369 2098166199 255 190664 77 182964 1075 179914 130 177664 5 135 177164 -- -- -- -- -- 248 165864 OU1 I-1 270863284 2080138346 175 19212 -- -- -- -- -- -- -- -- -- -- -- -- -- -- -- --OU1 I-2 270331729 2080131336 175 19200 -- -- -- -- -- -- -- -- -- -- -- -- -- -- -- --OU1 HTW-40 271217856 2079157749 -- 19395 -- -- -- -- -- -- -- -- -- -- -- -- -- -- -- --
Hwy 6 HTW-100 273075261 2082012337 255 19066 770 182964 1076 179904 130 177664 55 -- -- -- -- -- -- -- -- --
Surface Elevation -
Surficial Soil Peoria and
Loveland Loess
Very Fine Sand Silty Fine Sand
Clayey Silt
Silty Sand and Gravel (contains Upper Aquifer)
Upper Aquitard Medial Aquifer
Monitoring Wells
Boring DepthEasting(2)Northing(2)
Well ID Lower Aquitard Lower AquiferSite
Top of Lithologic and Hydrostratigraphic Units(1)
Decomposed Weathered
Shale
Sheet 1 of 2
Table 51 Contact Elevations of the Major Lithologic Units
Garvey Elevator Site Hastings Nebraska
Elev Depth Elev Depth Elev Depth Elev Thickne Depth Elev Depth Elev Thickne Depth Elev Depth Elev (ft) (ft) (ft bgs) (ft amsl) (ft bgs) (ft amsl) (ft bgs) (ft amsl) (ft bgs) (ft amsl) (ft) (ft bgs) (ft amsl) (ft bgs) (ft amsl) (ft) (ft bgs) (ft amsl) (ft bgs) (ft amsl)
Surface Elevation -
Surficial Soil Peoria and
Loveland Loess
Very Fine Sand Silty Fine Sand
Clayey Silt
Silty Sand and Gravel (contains Upper Aquifer)
Upper Aquitard Medial Aquifer Boring DepthEasting(2)Northing(2)
Well ID Lower Aquitard Lower AquiferSite
Top of Lithologic and Hydrostratigraphic Units(1)
Decomposed Weathered
Shale
OU1 (new) SB-09 270168160 2080517340 13160 192984 59 187084 90 183984 130 179984 1 131 179884 -- -- -- -- -- -- --OU1 (new) SB-13 269654838 2080309785 14340 192973 67 186273 87 184273 130 179973 3 133 179673 -- -- -- -- -- -- --OU1 (new) SB-29 270864398 2081035503 14215 192989 68 186189 90 183989 -- -- -- -- -- -- -- -- -- -- -- --OU1 (new) SB-32 271237915 2079979855 14865 192475 66 185875 92 183275 -- -- -- -- -- 148 177675 297 149 177575 -- --OU1 (new) SB-33 269199799 2080682378 14085 193446 63 187146 93 184146 -- -- -- -- -- -- -- -- -- -- -- --OU1 (new) SB-39 271537352 2081550026 13560 192583 64 186183 89 183683 -- -- -- -- -- -- -- -- -- -- -- --OU2 (new) TS1-01 269515615 2089614339 864 191569 70 184569 86 182969 -- -- -- -- -- -- -- -- -- -- -- --OU2 (new) TS1-03 268313868 2089646765 16736 191251 66 184651 86 182651 1195 179301 05 120 179251 148 176451 5 153 175951 -- --OU2 (new) TS1-05 267030127 2089665004 16681 191624 75 184124 87 182924 117 179924 2 119 179724 153 176324 308 155 176124 -- --OU2 (new) TS2-02 271456113 2097510251 13680 191015 73 183715 104 180615 134 177614 3 137 177314 -- -- -- -- -- -- --OU2 (new) TS2-04 268939527 2097554155 16746 190360 70 183360 89 181460 126 177760 9 135 176860 152 175160 306 154 174960 -- --OU2 (new) TS2-05 267717573 2097569698 17161 190143 62 183943 99 180243 -- -- -- -- -- 157 174443 2 159 174243 -- --OU2 (new) TS2-06 266250085 2097592053 11980 190501 60 184501 100 180501 -- -- -- -- -- -- -- -- -- -- -- --OU2 (new) TS3-02 269400264 2102787273 15690 189415 68 182615 96 179815 125 176915 7 132 176215 147 174715 297 150 174415 -- --OU2 (new) TS3-05 265786308 2102812115 14380 189056 67 182356 96 179456 1195 177106 1 1205 177006 129 176156 261 132 175856 -- --OU2 (new) TS4-02 267112179 2105261928 17031 188448 64 182048 96 178848 116 176848 3 119 176548 141 174348 284 143 174148 -- --
Hwy 6 TS3-01 271941141 2089537242 1453 19153 720 184334 1125 180284 1256 178974 29 1285 178684 -- -- -- -- -- -- --Hwy 6 TS3-02 271499828 2089579255 1414 19139 692 184466 102 181186 1227 179116 59 1286 178526 -- -- -- -- -- -- --Hwy 6 TS3-03 270957676 2089591662 1440 19087 710 183767 941 181457 1178 179087 56 1234 178527 -- -- -- -- -- -- --Hwy 6 TS3-04 270411434 2089597601 1403 19088 663 184254 1006 180824 1167 179214 61 1228 178604 -- -- -- -- -- -- --Hwy 6 TS3-05 272464675 2089528557 1718 19173 685 184883 1032 181413 123 179433 7 130 178733 -- -- -- -- -- -- --Hwy 6 TS4-01 271882569 2095813356 1658 19042 650 183920 987 180550 1238 178040 52 129 177520 -- -- -- -- -- -- --Hwy 6 TS4-03 270996450 2096068696 1171 19050 810 182400 966 180840 1154 178960 12 1166 178840 -- -- -- -- -- -- --Hwy 6 TS5-01 271766686 2092074297 1562 19016 648 183680 905 181110 1163 178530 53 1216 178000 -- -- -- -- -- -- --Hwy 6 TS5-03 270732978 2092105115 1389 19008 709 182990 923 180850 1147 178610 46 1193 178150 -- -- -- -- -- -- --Hwy 6 TS5-05 272269991 2092059880 1717 19045 425 186200 942 181030 1153 178920 83 1236 178090 -- -- -- -- -- -- --
Electrical Conductivity Borings
(1)Surface elevation listed for nested monitoring wells (ABCDE) is the surface elevation of the A well Unit elevations are from the boring logs in which they were recorded (2)State Plane Coordinate system Nebraska 2600 amsl - above mean seal level bgs - below ground surface Elev - elevation ft - feet Hwy 6 - Wellsborings installed for the West Highway 6 and Highway 281 Site Investigations -- - not applicable or not available OU1 - Operable Unit 1 these wells are associated with on-site groundwater OU1 (new) - Operable Unit 1 wellsborings installed in AprilMay 2010 for the RI OU2 - Operable Unit 2 these wells are associated with off-site groundwater OU2 (new) - Operable Unit 2 Monitoring wellsborings installed in AprilMay 2010 for the RI
Sheet 2 of 2
Table 61 Water Level Calibration Statistics
Garvey Elevator Site Hastings Nebraska
Name Layer
Target Water Level Elevation - Sept 2011
(feet amsl) Model
Water Level Error
Residual MW-12U 1 18156 1814424820 117518 MW-100A 1 181542 1814519751 0900249 MW-16U 1 181534 1814385390 095461 MW-10A 1 181528 1814182851 1097149 MW-1A 1 181525 1815209270 004073 MW-2A 1 181519 1815393838 -0203838 MW-05 1 181516 1814358176 0801824
MW-102A 1 18151 1813770877 1329123 MW-13U 1 181507 1813730081 1339919 MW-7A 1 181504 1815242607 -0202607 MW-04 1 181487 1814376802 0493198
MW-17U 1 181486 1814230581 0629419 MW-07 1 181475 1814008616 0741384 MW-03 1 181471 1813907473 0802527 MW-02 1 181468 1813743101 0936899 MW-08 1 181465 1814180036 0469964 MW-06 1 18146 1814237391 0362609
MW-10U 1 181453 1814016597 0513403 MW-14U 1 181451 1814457639 0052361 MW-6A 1 181444 1814334070 010593 MW-01 1 18144 1814062502 0337498
MW-11A 1 181429 1812347804 1942196 MW-11U 1 181411 1814658764 -0548764 MW-10B 1 181372 1814173608 -0453608 MW-3A 1 181357 1813385654 0184346 MW-5B 1 181339 1813199091 0190909 MW-15U 1 181326 1814948966 -1688966 MW-47B 1 181316 1812784852 0375148 MW-50B 1 181314 1812748409 0391591 MW-4A 1 18131 1812992455 0107545 MW-3B 1 181308 1813389494 -0309494 MW-5A 1 181307 1813165365 -0095365 MW-19A 1 181301 1813252060 -024206 MW-4B 1 181298 1812954715 0025285 MW-31A 1 181289 1812885039 0004961 MW-51B 1 181236 1812125173 0234827 MW-49B 1 181227 1812349041 -0079041 MW-48B 1 18122 1812098306 0101694 MW-30A 1 181194 1812183956 -0243956 MW-09U 1 181194 1814076063 -2136063 MW-20A 1 181179 1812309176 -0519176 MW-14A 1 181061 1810498570 011143 MW-17A 1 18098 1809745419 0054581
Sheet 1 of 3
Table 61 Water Level Calibration Statistics
Garvey Elevator Site Hastings Nebraska
Name Layer
Target Water Level Elevation - Sept 2011
(feet amsl) Model
Water Level Error
Residual MW-12A 1 180706 1807353224 -0293224 MW-16A 1 180683 1806758847 0071153 MW-18A 1 18062 1805744494 0455506 MW-104A 1 180386 1804035180 -017518 MW-105A 1 179994 1799915974 0024026 MW-106A 1 178857 1788240807 0329193 MW-18C 3 180409 1804214829 -0124829 MW-12C 3 180568 1805675664 0004336 MW-16C 3 180625 1806232799 0017201 MW-45C 3 180888 1809089044 -0209044 MW-17C 3 180918 1809113670 006633 MW-47C 3 181047 1810251020 021898 MW-101B 3 181066 1811509656 -0849656 MW-102B 3 181092 1811706686 -0786686 MW-13C 3 181107 1811204349 -0134349 MW-51C 3 181177 1811366716 0403284 MW-50C 3 18119 1811832475 0067525 MW-49C 3 181235 1812474567 -0124567 MW-48C 3 18125 1812312538 0187462 MW-7B 3 181497 1815042613 -0072613
MW-09M 5 181527 1813657691 1612309 MW-3D 5 181479 1814354375 0435625 MW-3E 5 181379 1814210888 -0420888 MW-5D 5 181366 1813572038 0087962 MW-47D 5 181365 1812738611 0911389 MW-49D 5 18134 1813402643 -0002643 MW-48D 5 181323 1812926923 0303077 MW-50D 5 181323 1812962182 0267818 MW-31C 5 181311 1813127460 -001746 MW-51D 5 181302 1812256458 0763542 MW-13E 5 181234 1812181638 0158362
MW-100D 5 181223 1813629694 -1399694 MW-100C 5 181216 1813634399 -1474399 MW-30C 5 181208 1811949179 0130821 MW-19C 5 1812 1812353637 -0353637 MW-20D 5 181196 1811924735 0035265 MW-30D 5 181188 1811949179 -0069179 MW-20E 5 181155 1811924735 -0374735 MW-16M 5 181133 1811653909 -0323909 MW-13M 5 181117 1811940971 -0770971 MW-30E 5 181115 1811949179 -0799179 MW-11M 5 181097 1814139713 -3169713 MW-17D 5 180923 1808958032 0271968
Sheet 2 of 3
Table 61 Water Level Calibration Statistics
Garvey Elevator Site Hastings Nebraska
Name Layer
Target Water Level Elevation - Sept 2011
(feet amsl) Model
Water Level Error
Residual MW-20C 5 180892 1811924735 -3004735 MW-45D 5 180884 1809292039 -0452039 MW-12D 5 180575 1805738454 0011546 MW-18D 5 180413 1804194578 -0064578 MW-104D 5 180137 1801272389 0097611 MW-104C 5 180135 1801269033 0080967 MW-46D1 5 179796 1797768438 0191562 MW-105D 5 179794 1797798970 014103 MW-46D2 5 179792 1797771831 0148169 MW-105C 5 179791 1797803499 0106501 MW-41D2 5 179702 1797046783 -0026783 MW-41D1 5 179697 1797044368 -0074368 MW-106C 5 178531 1785334635 -0024635 MW-106D 5 178527 1785320367 -0050367 MW-43D 5 178387 1783880124 -0010124 MW-43E 5 178386 1783888909 -0028909 MW-42D 5 178183 1781770173 0059827 MW-42E 5 178182 1781753639 0066361 MW-44D 5 177409 1774079493 0010507 MW-44E 5 177407 1774078775 -0008775
Residual Mean 0046933 Res Std Dev 0743461 Sum of Squares 6048817
RMS Error 0744941 Min Residual -3169713 Max Residual 1942196
Number of Observations 109 Range in Observations 4362
Scaled Std Dev 0017044 Scaled Abs Mean 0010505
Scaled RMS 0017078 Notes
amsl - above mean sea level
Sheet 3 of 3
Table 71 Groundwater Data Summary Projected Durations to Meet MCLs
Garvey Elevator Site Hastings Nebraska
Well Data Collection Range TCE Concentration μgL Estimated Date to
Reach MCLs Duration from June 2012 yrsHigh Low
MW-3A May 1997 - March 2012 20000 11 already achieved NA MW-3B May 1997 - March 2012 23000 74 Nov 2045 33 MW-3D April 1997 - March 2012 5 05 already achieved NA MW-3E April 1997 - March 2012 4 05 already achieved NA MW-4A May 1997 - March 2012 18000 43 Sept 2013 1 MW-4B May 1997 - March 2012 29000 690 Dec 2042 30 MW-5A May 1997 - March 2012 24000 47 already achieved NA MW-5B May 1997 - March 2012 15000 12 Jan 2017 5 MW-5D April 1997 - March 2012 4 05 already achieved NA MW-13C May 1997 - March 2012 18000 28 Nov 2061 49 MW-13E May 1997 - March 2012 5 05 already achieved NA
RW-1 1999 - 2011 490 10 May 2016 4 RW-2 1999 - 2011 3200 5 Nov 2021 9 RW-3 1999 - 2011 3800 5 Feb 2024 12 RW-4 1997 - 2011 5500 5 June 2016 4 RW-5 1999 - 2011 5500 5 achieved NA RW-6 1999 - 2011 590 10 Oct 2018 6 RW-7 1995 - 2011 1000 5 Jan 2025 13 RW-8 1998 - 2011 380 5 March 2047 35
Notes
Dates and concentration data are from the site database projections to reach MCLs are based on curves fitted to data plots as provided by Dr Brian
Zurbuchen via email on June 11 2012
μgL - micrograms per liter
Sheet 1 of 1
Table 72 Remedial Alternatives Summary
Garvey Elevator Site Hastings Nebraska
Remedial Alternative Assumptions Remediation
Times Notes
OU 1
SG-1-No Action All extraction wells off 30 years
This scenario was not explicity modeled Based on the remedition duration predicted for SG2 remediation time will be greater than 30 years However for cost estimating purposes a 30-year duration will be used
SG2-- Maintain and Operate Existing GET System
No treatment of downgradient plume
30 years This scenario was not explicity modeled but remediation time was estimated based on contaminant concentration trends (see Table 71)
SG3--In Situ Treatment Via Groundwater Amendments
Area within gt500 ugL set to 00 on-site treatment system shut off
15 years Remediation time estimates are for OU1 (on-site) plume using multiple injection treatments and existing GET system shut off
SG4-- Maintain and Operate Existing GET System and Treatment Via Groundwater Amendments
Pump and treat system operating groundwater within concentrations gt500 ugL set to 00
10 years Remediation time estimates are for OU1 (on-site) plume using multiple injection treatments and existing GET system operating
OU 2
G1-No Action Pump and treat system operating no treatment of downgradient plume
30 years This scenario was not explicity modeled For cost estimating purposes a 30-year duration will be used
G2-Groundwater Recovery Treatment and Discharge at Leading Edge of Plume
On-site pump and treat system operating
100 years Based upon modeling results for more active remedies the remediation times for both the OU 1 and OU 2 plumes would exceed 100 years This scenario was not explicity modeled
G3a-Groundwater Recovery Treatment and Discharge at mid point and Leading Edge of Plume
On-site pump and treat system operating
75 years
Modeled duration ranges from 75 to 90 years
G3b-Groundwater Recovery Treatment and Discharge at two transects and Leading Edge of Plume
On-site pump and treat system operating
53 years
G4a-In Situ treatment at midpoint of plume and Groundwater Recovery Treatment and Discharge at leading edge of plume
On-site pump and treat system operating
75 years
Same as G3 but a treatment zone replaces the recovery wells near the midpoint of the plume Modeled duration ranges from 75 to 90 years
G4b-In Situ treatment at two transects near core of plume and Groundwater Recovery Treatment and Discharge at leading edge of plume
On-site pump and treat system operating
56 years Same as G3 but two treatment zones replace the recovery wells near the midpoint of the plume
Notes
μgL - micrograms per liter
Sheet 1 of 1
This page was intentionally left blank
ATTACHMENT 2 FIGURES
Figure 31 Carbon Tetrachloride Isoconcentrations Upper Aquifer Zone AB Figure 32 Carbon Tetrachloride Isoconcentrations Medial Aquifer Zone C Figure 33 Carbon Tetrachloride Isoconcentrations Lower Aquifer Zone DE
Figure 51 Model Domain and Boundary Conditions Figure 52 Vertical Discretization of Model Figure 53 Elevation of the Model Base Figure 54 Elevation of the Top of the Lower Aquifer Figure 55 Isopach Map of the Lower Confining Unit Figure 56 Elevation of the Base of the Medial Aquifer Figure 57 Isopach of Upper Aquifer Figure 58 Elevation of the Base of the Upper Aquifer Figure 59 Location of Recovery Wells in the Shallow Aquifer Figure 510 Location of Recovery Wells in the Medial Aquifer Figure 511 Location of Injection and Municipal Wells in the Lower Aquifer Figure 512 Initial Concentrations of Carbon Tetrachloride in the Shallow Aquifer Figure 513 Initial Concentrations of Carbon Tetrachloride in the Medial Aquifer Figure 514 Initial Concentrations of Carbon Tetrachloride in the Lower Aquifer
Figure 61 Error Residuals Versus Measured Water Levels Figure 62 Measured Water Levels Versus Predicted Water Level Elevations Figure 63 Error Residuals for the Shallow Aquifer in the Vicinity of the Garvey Elevator
Site Figure 64 Error Residuals for the Shallow Aquifer over the Model Domain Figure 65 Error Residuals for the Medial Aquifer over the Model Domain Figure 66 Error Residuals for the Lower Aquifer in the Vicinity of the Garvey Elevator
Site Figure 67 Error Residuals for the Lower Aquifer over the Entire Model Domain Figure 68 Calibrated Hydraulic Conductivities of the Shallow Aquifer Figure 69 Calibrated Hydraulic Conductivities of the Medial Aquifer Figure 610 Calibrated Hydraulic Conductivities of the Lower Aquifer Figure 611 Calibrated Hydraulic Conductivities of the Upper Aquitard Figure 612 Calibrated Hydraulic Conductivities of the Lower Aquitard Figure 613 Calibrated Potentiometric Surface of the Shallow Aquifer Figure 614 Calibrated Potentiometric Surface of the Medial Aquifer Figure 615 Calibrated Potentiometric Surface of the Lower Aquifer Figure 616 Particle Tracking Analysis to Estimate Travel Time
Figure 71 Initial Concentrations for Alternative SG3 Figure 72 Capture Zone Analysis in the Shallow Aquifer for Alternative SG3 Figure 73 Capture Zone Analysis in the Medial Aquifer for Alternative SG3 Figure 74 Alternative G2 ndash Proposed Recovery Wells Medial Aquifer
ATTACHMENT 2 FIGURES (continued)
Figure 75 Alternative G2 ndash Proposed Recovery Wells Lower Aquifer Figure 76 Preliminary Locations for Leading Edge Recovery Wells and Groundwater
Treatment Building ndash Alternative G2 Figure 77 Alternative G3ab ndash Proposed Recovery Wells Medial Aquifer Figure 78 Alternative G3a ndash Proposed Recovery Wells Lower Aquifer Figure 79 Preliminary Locations for Mid-Plume and Leading Edge Recovery Wells and
Groundwater Treatment BuildingmdashAlternative G3 Figure 710 Alternative G3b ndash Proposed Recovery Wells Lower Aquifer Figure 711 Alternative G3b ndash Relative Positions of Proposed Recovery Wells Medial and
Lower Aquifer Figure 712 Alternative G4a ndash Proposed Treatment Curtain and Recovery Wells Lower
Aquifer Figure 713 Preliminary Locations for Mid-Plume Injection Wells Leading Edge Recovery
Wells and Groundwater Treatment Building ndash Alternative G4 Figure 714 Alternative G4b ndash Proposed Treatment Curtains and Recovery Wells Lower
Aquifer Figure 715 Alternative G4b ndash Relative Positions of Proposed Recovery Wells and
Treatment Curtains
5
5
5
5
5
50
100 500
MW-6A SB-39 HGLmdashGroundwater Flow Modeling Technical MemorandumMW-2AHTW 40 (98)(ND)MW-8A MW47B ( Garvey Elevator SitemdashHastings NE(ND)
(59) SB-38
MW-19APSUS PU PPPUUU ( Figure 31 (70)MW-33 MW-3AB
Carbon Tetrachloride in the(ND53) MW49B MW-20A
+UP+UPPPP+U+U+UPPPPUUUU+UP+UPPPP+U+U+U(43) Upper Aquifer Zone AB(10)
MW-1A PU MW50B(ND) +UP+UPPPP+U+U+U September 2011 Sampling(84)
PPUUMW-4AB PPUU MW-13CE +++++UPUPPPPUUU (21640)
MW-30A (160)+UP+UPPPP+U+U+U LegendPPPUUU
1000 MW51B (1200) MW-5AB
(4119J)
Garvey Property BoundaryMW-7AB MW-31A (ND) (75) (
PPUU MW48B RailroadSB-33 (680)
Inset Ntilde Monitoring Well Location MW-47B MW-10A
(59) (ND) Multilevel Well MW-9A MW-6AHTW 40 MW-10B(ND) (98)
(ND) MW-11A S Hydraulic Conductivity
MW-33 UPPUMW-2A MW-19AU MW-14A(ND) P
(70) PU (ND) A West Highway 6 amp Highway 281 Site MW-12A AMW-106AMW-20A MW-104AMW-3A MW-8A (ND) Monitoring WellU UUU (ND)PSSU P PPP (10)(ND) (ND)(ND) U
UUUUU PUUUUP PPPPPPPPPPPPPPPPPPPPPPPUUUUPUPPPPUUUUU MW-13CE
UUUU Carbon Tetrachloride ConcentrationMW-3B MW-105A A (190)PPP A (ND)
UUUUUUUUU(53) MW-30A in micrograms per liter (microgL)PPUUPPPUUUPPPPPUUUUU
MW-12DMW-1A (160) MW-42 DEMW-45CD(ND)
MW-50B MW-49B MW-51B Carbon Tetrachloride Isoconcentration(84) PPUUPPUU(43)
PPUU(1200)
Contour (microgL)PPPUUU PPPUUUMW-46 D1D2MW-7B (5)(ND)
(Dashed Lines are Estimated)MW-7A (ND)
MW-5A (41)
MW-4A (21) MW-4B (640)
MW-48B (680)
MW-17A (ND)
MW-16A (ND) UUPP
MW-18A (ND)
MW-41 D1D2 UUPP
MW-44 DE UUPP
MW-5B
MW-31A (75)
(19)
MW-43 DE UUPP Notes
(ND) Nondetect
0 2500 5000
Feet sup3 Filename XEPA009GarveyGW_Flow_Tech_Memo Carbon_TetChl_UpperAquifer_ABmxd Project EP903401220202 Revised 061312 ST Source ENSR GDB 2008 DNR
100
5
100
SB-39MW-6AHTW 40 HGLmdashGroundwater Flow Modeling Technical Memorandum MW47C SB-38MW-33 MW-2A (62) ( Garvey Elevator SitemdashHastings NE
UUUPSUS P PPP (
U
Figure 32MW-8A MW-3ABDE MW-19C (ND) Carbon Tetrachloride in the
MW-1A +++++PPPP UPUPPPPUUUUUUU
+UP+UPPPP+U+U+U Medial Aquifer Zone CPU MW-20C +UP+UPPPP+U+U+U (ND) September 2011 SamplingMW49C
UU(ND) PPUU +++++PPPPPPPUUUUU MW50C
(ND) +UP+UPPPP+U+U+UPPPUUU LegendMW-13C
MW-4AB (130) MW-30C
MW-5AB (ND) MW48C MW51C
(ND) (ND) Garvey Property Boundary SB-33 (
MW-7AB PPUU MW-31C (ND) Railroad
Inset Ntilde Monitoring Well Location MW-47CMW-9A MW-10AB Multilevel Well(62)
HTW 40
MW-6A S Hydraulic Conductivity WellMW-11AMW-33 PPUUMW-2A
MW-19CUP (ND) P West Highway 6 amp Highway 281 SiteU MW-14A A A Monitoring WellMW-20C MW-12C MW-106CMW-104CPSS P PPP
U (ND) (ND) (90) (ND)
MW-8A MW-13C U U UUU
PMW-3ABDE PPPPPPPPUUUUPU (130) Carbon Tetrachloride ConcentrationPU UUUU UUUUUUUUUU
MW-105C A (190)MW-1A UUUUUUUUUPPPPPPPPPPPPPPPPPPP MW-30C PPPUUU MW-12D A (200) in micrograms per liter (microgL)
MW-49C UUUUPUPPPPUUPU (ND) UPPU Old Rolls MW-42 DEPP (13)(ND) Carbon Tetrachloride Isoconcentration MW-45C MW-50C (ND)
MW-51C (ND) PPUU PPUU PPUU (5) Contour (microgL)(ND)
UUU PPP MW-46 D1D2
PPP UUUMW-48C (Dashed Lines are Estimated)5MW-7AB (ND)
MW-4AB MW-17C MW-18C(ND) MW-44 DE Domestic Irrigation W ater Wells(81)MW-5AB
PPUUMW-31C MW-16C (ND)
PPUU(ND) MW-41 D1D2
PPUU
Notes MW-43 DE PPUU
(ND) Nondetect
0 2500 5000
Feet sup3 FilenameXEPA009GarveyGW_Flow_Tech_Memo Carbon_TetChl_Medial_Aquifer_Cmxd Project EP903401220202 Revised 061312 ST Source ENSR GDB 2008 DNR
50
5
5
50 100
MW-6D SB-39 HGLmdashGroundwater Flow Modeling Technical MemorandumHTW 40 (ND) SB-38MW-3DE ( Garvey Elevator SitemdashHastings NE (NDND)
UUUUPSUS P PPP MW-19AC( Figure 33MW-2A MW-33 MW47D
U (ND)
Carbon Tetrachloride in theMW-8A PPPPUUUU P Lower Aquifer Zone DEUMW-1A MW-20DEPU P
(NDND)UPUU
September 2011 Sampling MW-13EPPUUPPPU (ND)
MW50D UPMW49D (ND) UUU(ND) PPP MW-30DE Legend MW51D (ND)
(ND)MW-4AB MW48D (ND)
MW-7AB MW-5D (ND) Garvey Property Boundary
MW-31C (ND)
PPUU
(
RailroadSB-33MW-3DE (NDND)
Inset Ntilde Monitoring Well Location MW-47D
MW-9A (ND) Multilevel Well HTW 40
MW-6D MW-10AB (ND)
MW-11A S Hydraulic Conductivity Well MW-33 MW-2A UPPU
PUMW-19AC West Highway 6 amp Highway 281 Site MW-14A APU
MW-20DE MW-106D A Monitoring WellMW-104DPSSU PU PPPUUU (NDND)
MW-12C (ND)(ND)MW-8A MW-13E PU
UUUUU (ND) Carbon Tetrachloride ConcentrationU PPPPPPPPUUUUPU (190)PPUUU
PPUPPPPPPPPPPPPPPPUUUUUP
UUUUU UUUUUUU PPP A MW-105DMW-1A in micrograms per liter (microgL) AMW-30DE
PPUUPPPUUUPPPPPUUUUU(52)
(NDND) MW-12DNew RollsMW-49D (ND) (ND)
Carbon Tetrachloride Isoconcentration(ND) MW-45D PPUUMW-51D (ND)
MW-46 D1PPUU PPUU Contour (microgL)MW-50D (ND) (5)(ND)
PPPUUU (770)PPPUUU MW-42 DMW-48D (Dashed Lines are Estimated)MW-4AB (4274)(ND)
MW-44DEMW-46 D2 MW-17D (320) (19ND)MW-7AB
MW-5D Domestic Irrigation W ater Wells(94) MW-18D PPUUMW-31C(ND) (21) MW-41 D1MW-5B MW-16C PPUU (ND)
PPUUMW-41 D2 (10) Notes
MW-43DE UUPP(ND18) (ND) Nondetect
0 2500 5000
Feet sup3 Filename XEPA009GarveyGW_Flow_Tech_Memo Carbon_TetChl_LoweR_Aquifer_Dmxd Project EP903401220202 Revised 061312 ST Source ENSR GDB 2008 DNR
_L _j I I I I _j_ I I I
I l --- I 111
1
__u_ I I
1 I ~ N ----y-
+ ~ I
II L _l e11111111111 I ---1 ~lJJ I n r Igt I Constant Head Boundariesj l _Q No Flow Sound aries I I l
~ r-- I - I middot r-
- fl+- L -
0 I J ~r-
Ll-D l Garvey Site I - ~t
Ill -J
l unJprm Spacing 25 eet U~iform S pacing 1 00 feet I Constant Head Boundaries
j
middotmiddot- ~ No Flow Sound aries
J
--=J--=11-~=======2~-----~3=========4~------5 M1les 0 05
Figure 51 Model Domain Gridding and Boundaries
Figure 52 Vertical Discretization of Model
1610
1620
1 6 2 0
1630
1 6 3 0
1640
1 6 4 0
1650
1 6 5 0
1660
1660
1670
1670
1680
1680
1690
17
1698
17013
16918
169198
169118
165864
167129
168901
169482
169872
169403
169347
169374
169448
Figure 53 Elevation of the Model Base (weathered shale of the Niobrara Formation)
1111
I I
-
N
+ 0 05
I I
I 1 l
I
1 l -
2 3 4 Miles
Figure 54 Elevation of the Top of the Lower Aquifer
Figure 55 Isopach Map of Lower Confining Unit (model Layer 4)
Figure 56 Elevation of the Base of the Medial Aquifer
Figure 57 Isopach of Upper Aquitard (model layer 2)
Figure 58 Elevation of the Base of the Upper Aquifer
I I I
~ ~ t--7 t bull I I I
r I l
I EW-01 f1-m I N I bull __ j
+ twtrl I I I rl bull I I I I J I I I -r-----
- middot-- - -- -- middot------__J_--
I --- 1 Feet I 0 500 1 000 2000 3000 4000 rooo I I I I
Figure 59 Location of Recovery Wells in the Shallow Aquifer
_l ________ l I I I -1 middot ] l ~----------middotj + I j
middotmiddot= middotmiddot- ---------L -- ---- ___ _ [_ __
r--------shy1
o--~oomiddoto~bull1~oo=o ======4~oomiddoto------middot~ooco=======43oobullo -------~oo~1
Figure 510 Location of Recovery Wells in the Medial Aquifer
I I r
~~ r -
L - - - -- -1--ltmiddot --I-
I -
---- L f+r
il I
J ---1
I
N
+
Figure 511 Location of Injection and Municipal Wells in the Lower Aquifer
Figure 512 Initial Concentrations of Carbon Tetrachloride in the Shallow Aquifer
Figure 513 Initial Concentrations of Carbon Tetrachloride in the Medial Aquifer
Figure 514 Initial Concentrations of Carbon Tetrachloride in the Lower Aquifer
-40
-30
-20
-10
00
10
20
30
40
17741 17828 17915 18002 18090 18177
Res
idua
l
Layer 1
Layer 3
Layer 5
Observed Value
Figure 61 Error Residuals Versus Measured Water Levels
Layer 1
Layer 3
18090
18177
Layer 5
Mod
el V
alue
17741 17828 17915 18002 18090 18177
18002
17915
17828
17741
Observed Value
Figure 62 Measured Water Levels Versus Predicted Water Levels
bull -020
N
+ 0
h I I
-----------~----j_ _______ ___ j_94-__ _ __ I ------------- t
011
bull 005
05
bull
I
Mile 1
Figure 63 Error Residuals for the Shallow Aquifer in the vicinity of the Garvey Elevator Site
Figure 64 Error Residuals for the Shallow Aquifer Over the Model Domain
-007 bull
N
+
il _ __ ~ II
t079 i
I 1 II_ --middot--middot- J_~=====-middot 1------~
~--1 000 r-----middot- -middotmiddot ____
-021 bull
-012 007 bull bull
l middot l02
I ~~~~====~---====~---Feet _ o ___ _ $-_~_0 _ ___ _ J000 _____ 3QQ_Q_ ---4lIJOLUlJ00----ltgt5ultOOO-- middott- middot ----
I
Figure 65 Error Residuals for the Medial Aquifer Over the Model Domain
0 250
N
+
044 bullbull -042
000 bull
027 bull
013
-)35 bull
Figure 66 Error Residuals for the Lower Aquifer in the Vicinity of the Garvey Elevator Site
Figure 67 Error Residuals for the Lower Aquifer in the Entire Model Domain
Figure 68 Calibrated Hydraulic Conductivities of the Shallow Aquifer (ftd) (model layer 1)
Figure 69 Calibrated Hydraulic Conductivities of the Medial Aquifer (ftd) (model layer 3)
Figure 610 Calibrated Hydraulic Conductivities of the Lower Aquifer (ftd) (model layer 5)
Figure 611 Calibrated Hydraulic Conductivities of the Upper Aquitard (ftd) (model layer 2)
Figure 612 Calibrated Hydraulic Conductivities of the Lower Aquitard (ftd) (model layer 4)
Figure 613 Calibrated Potentiometric Surface of the Shallow Aquifer (model layer 1)
Figure 614 Calibrated Potentiometric Surface of the Medial Aquifer (model layer 3)
Figure 615 Calibrated Potentiometric Surface of the Lower Aquifer (model layer 5)
Figure 616 Particle Tracking Analysis to Estimate Travel Time
Figure 71 Initial Concentrations for Alternative SG3
E3 E3 2000feet
Figure 72 Capture Zone Analysis in the Shallow Aquifer for Alternative SG3
E3 E3 E3 2000feet
Figure 73 Capture Zone Analysis in the Medial Aquifer for Alternative SG3
Figure 74 Alternative G2-Proposed Recovery Wells Medial Aquifer
Figure 75 Alternative G2- Proposed Recovery Wells Lower Aquifer
50
5 5
5
50 100
MW-3DE (NDND)
MW-47D MW-9A (ND)
HTW 40 MW-6D MW-10AB
(ND) MW-11A
MW-2AMW-33 UPPUPU
MW-19AC MW-14A APUMW-20DE MW-106DMW-104D(NDND) MW-12CPSSU (ND)PU PPPUUU PU (ND) MW-13E
HGLmdashGroundwater Flow Modeling Technical Memorandum Garvey Elevator Superfund SitemdashHastings NE
Figure 76 Preliminary Locations for Leading
Edge Recovery Wells and Groundwater Treatment Building-Alternative G2
Legend Garvey Property Boundary
Railroad
Ntilde Monitoring Well Location
Multilevel Well
S Hydraulic Conductivity Well
A West Highway 6 amp Highway 281 Site Monitoring Well
(190) Carbon Tetrachloride Concentration in micrograms per liter (microgL)
Carbon Tetrachloride Isoconcentration Treatment Building
Technical Blvd
MW-8A UUUU UUUUU
U PPPPPPPPUUUUPU UUUUUUPUP
UUUUUPPPPPPPPPPPPPPPPPP (ND)
PPPUUU A MW-105DMW-1A UU AMW-30DE PPUUPPPUUUPPPPPUUUUU
(52)(NDND) MW-12DNew Rolls Contour (Lower Aquifer) (microgL)MW-49D (5)(ND) (ND)
(ND) MW-45D (Dashed Lines are Estimated)PPUUMW-51D (ND) MW-46 D1PPUU PPUUMW-50D
(ND) (ND)
PPPUUU (770)PPPUUU MW-42 DMW-48D Domestic Irrigation W ater WellsMW-4AB (4274) MW-44DE(ND)
(19ND)MW-46 D2 MW-17D (320)MW-7AB Carbon Tetrachloride Isoconcentration(94)MW-5D
MW-18D PPUU (5) Contour (Upper Aquifer) (microgL)(21) MW-41 D1 MW-31C(ND)
MW-5B MW-16C PPUU (Dashed Lines are Estimated)(ND)
PPUUIdlewilde Rd
MW-41 D2 Recovery Wells (Medial)
Recovery Wells (Deep)
(10)
MW-43DE PPUU(ND18)
Recovery Well Piping
Treatment Building
Notes (ND) Nondetect
Blaine A
ve
Showboa t B
lvd
sup3 Filename XEPA009GarveyGW_Flow_Tech_Memo Carbon_TetChl_LoweR_Aquifer_Dmxd Project EP903401220202 Revised 061312 ST2500 5000 Source ENSR GDB 2008 DNR
Feet
0
Figure 77 Alternative G3ab-Proposed Recovery Wells Medial Aquifer
Figure 78 Alternative G3a- Proposed Recovery Wells Lower Aquifer
50
5 5
5
50 100
HGLmdashGroundwater Flow Modeling Technical Memorandum Garvey Elevator Superfund SitemdashHastings NE
Figure 79 Preliminary Locations for Mid-Plume and
Leading Edge Recovery Wells and Groundwater Treatment Building-Alternative G3
Legend Garvey Property Boundary
Railroad
Ntilde Monitoring Well Location MW-3DE (NDND)
Multilevel Well MW-47D
MW-9A (ND) Hydraulic Conductivity WellSHTW 40 MW-6D MW-10AB
(ND) West Highway 6 amp Highway 281 SiteMW-11A
MW-33 PPUUMW-2A PUA Monitoring Well
MW-19AC MW-14A APUCarbon Tetrachloride Concentration
Technical Blvd
MW-44DE (19ND) (Dashed Lines are Estimated)
MW-20DE (190)MW-106DPSSU PU PPPUUU MW-104DMW-12C(NDND) (ND)PU in micrograms per liter (microgL)(ND) MW-13EMW-8A
U UUUU UPUPPPPUUUUUUUUP UUUUU UUUPPPPPPPPPPPPPPPPPPPPPPPUUUUUU
(ND) PPPUUU A Treatment BuildingMW-105DMW-1A Carbon Tetrachloride IsoconcentrationMW-30DE A
PPUUPPPUUUPPPPPUUUUU(52)
(NDND) MW-12DNew Rolls Contour (Lower Aquifer) (microgL)MW-49D (5)(ND) (ND)(ND) MW-45D
MW-51D PPUU(ND)
PPUU PPUUMW-50D (ND)
MW-46 D1(ND) PPPUUU (770)
PPPUUU MW-42 D (4274)
MW-48D Domestic Irrigation W ater WellsMW-4AB (ND) MW-46 D2
MW-17DMW-7AB (320)(94) Carbon Tetrachloride IsoconcentrationMW-5D
MW-18D(ND) MW-31C (21) PPMW-41 D1
UU (5) Contour (Upper Aquifer) (microgL)MW-5B MW-16C UU (ND)PP (Dashed Lines are Estimated)PPUUIdlewilde Rd
MW-41 D2 Recovery Wells (Medial)(10)
MW-43DE UUPP(ND18) Recovery Wells (Deep)
Recovery Well Piping
Treatment Building
Notes (ND) Nondetect
Blaine A
ve
Showboa t B
lvd
sup3 Filename XEPA009GarveyGW_Flow_Tech_Memo Mid-Plume_Prelim_Loc Project EP903401220202 Revised 061312 RL2500 5000 Source ENSR GDB 2008 DNR
Feet
0
Figure 710 Alternative G3b-Proposed Recovery Wells Lower Aquifer
Figure 711 Alternative G3b-Relative Positions of Proposed Recovery Wells Medial and Lower Aquifers
Figure 712 Alternative G4a-Proposed Treatment Curtain and Recovery Wells Lower Aquifer
50
5 5
5
50 100
HGLmdashGroundwater Flow Modeling Technical Memorandum Garvey Elevator Superfund SitemdashHastings NE
Figure 713 Preliminary Locations for Mid-Plume
Injection Wells Leading Edge Recovery Wells and Groundwater Treatment Building
-Alternative G4
Legend Garvey Property Boundary
Railroad
Ntilde Monitoring Well Location MW-3DE (NDND)
MW-47D MW-9A (ND)
HTW 40 MW-6D MW-10AB
(ND)
S Elm
Ave
S Wabash A
ve
Multilevel Well
S Hydraulic Conductivity Well
A West Highway 6 amp Highway 281 Site Monitoring Well
MW-11AMW-33 UPPUMW-2A PU
MW-19AC MW-14A APUMW-20DE MW-106D Carbon Tetrachloride ConcentrationPU PPPUUU (190)PSSU MW-104D(NDND) MW-12C (ND)PU in micrograms per liter (microgL)(ND)
Treatment Building Technical B
lvd MW-13EMW-8A
UUUU UUUUUU PPPPPPPPUUUUPU UUUUU
UPUP
UUUUUPPPPPPPPPPPPPPPPPP (ND)
PPPUUU A MW-105DMW-1A UU Carbon Tetrachloride IsoconcentrationAMW-30DE PPUUPPPUUUPPPPPUUUUU
(52)(NDND) MW-12DNew Rolls Contour (Lower Aquifer) (microgL)MW-49D (5)(ND) (ND)
(ND) MW-45D (Dashed Lines are Estimated)PPUUMW-51D (ND) MW-46 D1PPUU PPUUMW-50D
(ND) (ND)
PPPUUU (770)PPPUUU MW-42 DMW-48D Domestic Irrigation W ater WellsMW-4AB (4274)(ND) MW-44DEMW-46 D2
(19ND)MW-17D (320)MW-7AB Carbon Tetrachloride Isoconcentration(94)MW-5D MW-18D PPUU (5) Contour (Upper Aquifer) (microgL)(21) MW-41 D1
MW-31C(ND) MW-5B MW-16C PPUU (Dashed Lines are Estimated)(ND)
PPUUIdlewilde Rd
MW-41 D2 Recovery Wells (Medial)
Recovery Wells (Deep)
(10) Injection Area 1 MW-43DE PPUUPermanent Injection Well Spacing 40 ft (ND18)
Total Injection Wells Installed 39 Recovery Well Piping Injection Area (40 ft spacing between the wells) Treatment Building
Notes (ND) Nondetect
Blaine A
ve
Showboa t B
lvd
S Baltim
ore Ave
sup3 Filename XEPA009GarveyGW_Flow_Tech_Memo G4_Prelim_Loc_Inj_Areamxd Project EP903401220202 Revised 061312 RL2500 5000 Source ENSR GDB 2008 DNR
Feet
0
Figure 714 Alternative G4b-Proposed Treatment Curtains and Recovery Wells Lower Aquifer
Figure 715 Alternative G4b-Relative Positions of Proposed Recovery Wells and Treatment Curtains

This page was intentionally left blank
Table 51 Contact Elevations of the Major Lithologic Units
Garvey Elevator Site Hastings Nebraska
Elev Depth Elev Depth Elev Depth Elev Thickne Depth Elev Depth Elev Thickne Depth Elev Depth Elev (ft) (ft) (ft bgs) (ft amsl) (ft bgs) (ft amsl) (ft bgs) (ft amsl) (ft bgs) (ft amsl) (ft) (ft bgs) (ft amsl) (ft bgs) (ft amsl) (ft) (ft bgs) (ft amsl) (ft bgs) (ft amsl)
OU1 MW-1A 270590926 2080164407 125 192580 645 186130 995 182630 -- -- -- -- -- -- -- -- -- -- -- --OU1 MW-2A 271240410 2080539870 1235 192733 685 185883 835 184383 -- -- -- -- -- -- -- -- -- -- -- --OU1 MW-3ABDE 270755170 2080773994 243 193099 595 187149 111 181999 134 179707 1 135 179607 155 177530 1 156 177430 2385 169249 OU1 MW-4AB 270341995 2080827075 132 193184 585 187334 89 184284 -- -- -- -- -- -- -- -- -- -- -- --OU1 MW-5ABD 269943836 2080752777 188 193006 635 186656 885 184156 132 179785 1 133 179685 -- -- -- -- -- -- --OU1 MW-6ADE 271237345 2081216968 238 192948 735 185598 935 183598 129 180046 1 130 179946 155 177446 5 160 176946 -- --OU1 MW-7AB 269088475 2079699700 135 192092 55 186592 90 183092 -- -- -- -- -- -- -- -- -- -- -- --OU1 MW-8A 271214203 2079067544 132 194080 608 188000 90 185080 -- -- -- -- -- -- -- -- -- -- -- --OU1 MW-9A 272193736 2080628145 116 192540 70 185540 90 183540 -- -- -- -- -- -- -- -- -- -- -- --OU2 MW-10AB 272535399 2081973782 130 192381 65 185881 85 183881 125 179870 1 126 179770 -- -- -- -- -- -- --OU2 MW-11A 271826499 2083509070 110 191228 70 184228 90 182228 -- -- -- -- -- -- -- -- -- -- -- --OU2 MW-12AC 270399710 2085390335 170 191713 50 186713 805 183663 -- -- -- -- -- -- -- -- -- -- -- --
OU2 (new) MW-12D 270399901 2085403521 178 191698 57 185998 88 182898 120 179698 7 127 178998 -- -- -- -- -- -- --OU1 MW-13CE 270368902 2081015694 238 192874 75 185374 90 183874 130 179874 1 131 179774 -- -- -- -- -- 235 169374 OU2 MW-14A 270968774 2084137323 1085 190956 695 184006 895 182006 -- -- -- -- -- -- -- -- -- -- -- --OU2 MW-16AC 267054564 2084286931 160 191545 50 186545 80 183545 -- -- -- -- -- -- -- -- -- -- -- --OU2 MW-17ACD 268796556 2082958916 200 190185 60 184185 85 181685 -- -- -- -- -- -- -- -- -- -- -- --OU2 MW-18ACD 268693818 2085938384 205 191064 55 185564 95 181564 1155 179514 1 1165 179414 -- -- -- -- -- -- --OU1 MW-19AC 270955133 2081332850 165 192781 61 186681 895 183831 128 179981 8 136 179181 150 177781 2 152 177581 -- --OU1 MW-20ACDE 270597445 2081202233 255 192797 54 187397 87 184097 129 179897 7 136 179197 150 177797 2 152 177597 236 169197 OU1 MW-30ACDE 270271723 2081095430 255 192903 70 185903 85 184403 1255 180353 7 1325 179653 146 178303 2 148 178103 237 169203 OU1 MW-31AC 269550764 2080816035 165 193008 63 186708 883 184178 -- -- -- -- -- -- -- -- -- -- -- --OU1 MW-33 271206314 2079068057 255 194074 84 185674 95 184574 1385 180224 55 144 179674 167 177374 675 17375 176699 240 170074
OU1 (new) MW-47BCD 270781240 2081046150 1705 192995 -- -- -- -- 1315 179845 15 133 179695 151 177895 2 153 177695 -- --OU1 (new) MW-48BCD 270645490 2080859850 171 192887 -- -- -- -- 129 179987 35 1325 179637 1498 177907 5 1548 177407 -- --OU1 (new) MW-49BCD 270039470 2080890150 171 192934 -- -- -- -- 1305 179884 15 132 179734 1495 177984 4 1535 177584 -- --OU1 (new) MW-50BCD 270307290 2080987510 170 192925 -- -- -- -- 1275 180175 5 1325 179675 1495 177975 1 1505 177875 -- --OU1 (new) MW-51BCD 270487290 2080899910 171 192943 -- -- -- -- 1268 180263 52 132 179743 1495 177993 45 154 177543 -- --OU2 (new) MW-41D1 266698811 2089673996 171 191524 62 185324 92 182324 126 178899 2 128 178699 148 176699 2 150 176499 -- --OU2 (new) MW-41D2 266708267 2089674259 206 191499 62 185299 92 182299 126 178899 2 128 178699 148 176699 2 150 176499 -- --OU2 (new) MW-42DE 269168074 2100135574 215 190207 66 183607 98 180407 124 177823 10 134 176823 -- -- -- -- -- -- --OU2 (new) MW-43DE 265395404 2097605590 2215 190835 48 186035 89 181935 -- -- -- -- -- 153 175545 2 155 175345 -- --OU2 (new) MW-44DE 267552324 2105258206 214 188530 63 182230 92 179330 119 176630 3 122 176330 1425 174280 75 150 173530 -- --OU2 (new) MW-45CD 270056199 2083476668 170 190982 50 185982 89 182082 112 179746 3 115 179446 -- -- -- -- -- -- --OU2 (new) MW-46D1 269055295 2089632928 167 191097 61 184997 94 181697 121 179003 3 124 178703 148 176303 6 154 175703 -- --OU2 (new) MW-46D2 269063843 2089632455 202 191103 61 185003 94 181703 121 179003 3 124 178703 148 176303 6 154 175703 -- --
Hwy 6 MW-104ACD 271937379 2088225393 235 190901 472 186181 936 181541 115 179401 12 127 178201 -- -- -- -- -- 220 168901 Hwy 6 MW-105ACD 270069428 2089866388 257 191679 68 184879 105 181179 123 179379 10 133 178379 -- -- -- -- -- 2455 167129 Hwy 6 MW-106ACD 270452369 2098166199 255 190664 77 182964 1075 179914 130 177664 5 135 177164 -- -- -- -- -- 248 165864 OU1 I-1 270863284 2080138346 175 19212 -- -- -- -- -- -- -- -- -- -- -- -- -- -- -- --OU1 I-2 270331729 2080131336 175 19200 -- -- -- -- -- -- -- -- -- -- -- -- -- -- -- --OU1 HTW-40 271217856 2079157749 -- 19395 -- -- -- -- -- -- -- -- -- -- -- -- -- -- -- --
Hwy 6 HTW-100 273075261 2082012337 255 19066 770 182964 1076 179904 130 177664 55 -- -- -- -- -- -- -- -- --
Surface Elevation -
Surficial Soil Peoria and
Loveland Loess
Very Fine Sand Silty Fine Sand
Clayey Silt
Silty Sand and Gravel (contains Upper Aquifer)
Upper Aquitard Medial Aquifer
Monitoring Wells
Boring DepthEasting(2)Northing(2)
Well ID Lower Aquitard Lower AquiferSite
Top of Lithologic and Hydrostratigraphic Units(1)
Decomposed Weathered
Shale
Sheet 1 of 2
Table 51 Contact Elevations of the Major Lithologic Units
Garvey Elevator Site Hastings Nebraska
Elev Depth Elev Depth Elev Depth Elev Thickne Depth Elev Depth Elev Thickne Depth Elev Depth Elev (ft) (ft) (ft bgs) (ft amsl) (ft bgs) (ft amsl) (ft bgs) (ft amsl) (ft bgs) (ft amsl) (ft) (ft bgs) (ft amsl) (ft bgs) (ft amsl) (ft) (ft bgs) (ft amsl) (ft bgs) (ft amsl)
Surface Elevation -
Surficial Soil Peoria and
Loveland Loess
Very Fine Sand Silty Fine Sand
Clayey Silt
Silty Sand and Gravel (contains Upper Aquifer)
Upper Aquitard Medial Aquifer Boring DepthEasting(2)Northing(2)
Well ID Lower Aquitard Lower AquiferSite
Top of Lithologic and Hydrostratigraphic Units(1)
Decomposed Weathered
Shale
OU1 (new) SB-09 270168160 2080517340 13160 192984 59 187084 90 183984 130 179984 1 131 179884 -- -- -- -- -- -- --OU1 (new) SB-13 269654838 2080309785 14340 192973 67 186273 87 184273 130 179973 3 133 179673 -- -- -- -- -- -- --OU1 (new) SB-29 270864398 2081035503 14215 192989 68 186189 90 183989 -- -- -- -- -- -- -- -- -- -- -- --OU1 (new) SB-32 271237915 2079979855 14865 192475 66 185875 92 183275 -- -- -- -- -- 148 177675 297 149 177575 -- --OU1 (new) SB-33 269199799 2080682378 14085 193446 63 187146 93 184146 -- -- -- -- -- -- -- -- -- -- -- --OU1 (new) SB-39 271537352 2081550026 13560 192583 64 186183 89 183683 -- -- -- -- -- -- -- -- -- -- -- --OU2 (new) TS1-01 269515615 2089614339 864 191569 70 184569 86 182969 -- -- -- -- -- -- -- -- -- -- -- --OU2 (new) TS1-03 268313868 2089646765 16736 191251 66 184651 86 182651 1195 179301 05 120 179251 148 176451 5 153 175951 -- --OU2 (new) TS1-05 267030127 2089665004 16681 191624 75 184124 87 182924 117 179924 2 119 179724 153 176324 308 155 176124 -- --OU2 (new) TS2-02 271456113 2097510251 13680 191015 73 183715 104 180615 134 177614 3 137 177314 -- -- -- -- -- -- --OU2 (new) TS2-04 268939527 2097554155 16746 190360 70 183360 89 181460 126 177760 9 135 176860 152 175160 306 154 174960 -- --OU2 (new) TS2-05 267717573 2097569698 17161 190143 62 183943 99 180243 -- -- -- -- -- 157 174443 2 159 174243 -- --OU2 (new) TS2-06 266250085 2097592053 11980 190501 60 184501 100 180501 -- -- -- -- -- -- -- -- -- -- -- --OU2 (new) TS3-02 269400264 2102787273 15690 189415 68 182615 96 179815 125 176915 7 132 176215 147 174715 297 150 174415 -- --OU2 (new) TS3-05 265786308 2102812115 14380 189056 67 182356 96 179456 1195 177106 1 1205 177006 129 176156 261 132 175856 -- --OU2 (new) TS4-02 267112179 2105261928 17031 188448 64 182048 96 178848 116 176848 3 119 176548 141 174348 284 143 174148 -- --
Hwy 6 TS3-01 271941141 2089537242 1453 19153 720 184334 1125 180284 1256 178974 29 1285 178684 -- -- -- -- -- -- --Hwy 6 TS3-02 271499828 2089579255 1414 19139 692 184466 102 181186 1227 179116 59 1286 178526 -- -- -- -- -- -- --Hwy 6 TS3-03 270957676 2089591662 1440 19087 710 183767 941 181457 1178 179087 56 1234 178527 -- -- -- -- -- -- --Hwy 6 TS3-04 270411434 2089597601 1403 19088 663 184254 1006 180824 1167 179214 61 1228 178604 -- -- -- -- -- -- --Hwy 6 TS3-05 272464675 2089528557 1718 19173 685 184883 1032 181413 123 179433 7 130 178733 -- -- -- -- -- -- --Hwy 6 TS4-01 271882569 2095813356 1658 19042 650 183920 987 180550 1238 178040 52 129 177520 -- -- -- -- -- -- --Hwy 6 TS4-03 270996450 2096068696 1171 19050 810 182400 966 180840 1154 178960 12 1166 178840 -- -- -- -- -- -- --Hwy 6 TS5-01 271766686 2092074297 1562 19016 648 183680 905 181110 1163 178530 53 1216 178000 -- -- -- -- -- -- --Hwy 6 TS5-03 270732978 2092105115 1389 19008 709 182990 923 180850 1147 178610 46 1193 178150 -- -- -- -- -- -- --Hwy 6 TS5-05 272269991 2092059880 1717 19045 425 186200 942 181030 1153 178920 83 1236 178090 -- -- -- -- -- -- --
Electrical Conductivity Borings
(1)Surface elevation listed for nested monitoring wells (ABCDE) is the surface elevation of the A well Unit elevations are from the boring logs in which they were recorded (2)State Plane Coordinate system Nebraska 2600 amsl - above mean seal level bgs - below ground surface Elev - elevation ft - feet Hwy 6 - Wellsborings installed for the West Highway 6 and Highway 281 Site Investigations -- - not applicable or not available OU1 - Operable Unit 1 these wells are associated with on-site groundwater OU1 (new) - Operable Unit 1 wellsborings installed in AprilMay 2010 for the RI OU2 - Operable Unit 2 these wells are associated with off-site groundwater OU2 (new) - Operable Unit 2 Monitoring wellsborings installed in AprilMay 2010 for the RI
Sheet 2 of 2
Table 61 Water Level Calibration Statistics
Garvey Elevator Site Hastings Nebraska
Name Layer
Target Water Level Elevation - Sept 2011
(feet amsl) Model
Water Level Error
Residual MW-12U 1 18156 1814424820 117518 MW-100A 1 181542 1814519751 0900249 MW-16U 1 181534 1814385390 095461 MW-10A 1 181528 1814182851 1097149 MW-1A 1 181525 1815209270 004073 MW-2A 1 181519 1815393838 -0203838 MW-05 1 181516 1814358176 0801824
MW-102A 1 18151 1813770877 1329123 MW-13U 1 181507 1813730081 1339919 MW-7A 1 181504 1815242607 -0202607 MW-04 1 181487 1814376802 0493198
MW-17U 1 181486 1814230581 0629419 MW-07 1 181475 1814008616 0741384 MW-03 1 181471 1813907473 0802527 MW-02 1 181468 1813743101 0936899 MW-08 1 181465 1814180036 0469964 MW-06 1 18146 1814237391 0362609
MW-10U 1 181453 1814016597 0513403 MW-14U 1 181451 1814457639 0052361 MW-6A 1 181444 1814334070 010593 MW-01 1 18144 1814062502 0337498
MW-11A 1 181429 1812347804 1942196 MW-11U 1 181411 1814658764 -0548764 MW-10B 1 181372 1814173608 -0453608 MW-3A 1 181357 1813385654 0184346 MW-5B 1 181339 1813199091 0190909 MW-15U 1 181326 1814948966 -1688966 MW-47B 1 181316 1812784852 0375148 MW-50B 1 181314 1812748409 0391591 MW-4A 1 18131 1812992455 0107545 MW-3B 1 181308 1813389494 -0309494 MW-5A 1 181307 1813165365 -0095365 MW-19A 1 181301 1813252060 -024206 MW-4B 1 181298 1812954715 0025285 MW-31A 1 181289 1812885039 0004961 MW-51B 1 181236 1812125173 0234827 MW-49B 1 181227 1812349041 -0079041 MW-48B 1 18122 1812098306 0101694 MW-30A 1 181194 1812183956 -0243956 MW-09U 1 181194 1814076063 -2136063 MW-20A 1 181179 1812309176 -0519176 MW-14A 1 181061 1810498570 011143 MW-17A 1 18098 1809745419 0054581
Sheet 1 of 3
Table 61 Water Level Calibration Statistics
Garvey Elevator Site Hastings Nebraska
Name Layer
Target Water Level Elevation - Sept 2011
(feet amsl) Model
Water Level Error
Residual MW-12A 1 180706 1807353224 -0293224 MW-16A 1 180683 1806758847 0071153 MW-18A 1 18062 1805744494 0455506 MW-104A 1 180386 1804035180 -017518 MW-105A 1 179994 1799915974 0024026 MW-106A 1 178857 1788240807 0329193 MW-18C 3 180409 1804214829 -0124829 MW-12C 3 180568 1805675664 0004336 MW-16C 3 180625 1806232799 0017201 MW-45C 3 180888 1809089044 -0209044 MW-17C 3 180918 1809113670 006633 MW-47C 3 181047 1810251020 021898 MW-101B 3 181066 1811509656 -0849656 MW-102B 3 181092 1811706686 -0786686 MW-13C 3 181107 1811204349 -0134349 MW-51C 3 181177 1811366716 0403284 MW-50C 3 18119 1811832475 0067525 MW-49C 3 181235 1812474567 -0124567 MW-48C 3 18125 1812312538 0187462 MW-7B 3 181497 1815042613 -0072613
MW-09M 5 181527 1813657691 1612309 MW-3D 5 181479 1814354375 0435625 MW-3E 5 181379 1814210888 -0420888 MW-5D 5 181366 1813572038 0087962 MW-47D 5 181365 1812738611 0911389 MW-49D 5 18134 1813402643 -0002643 MW-48D 5 181323 1812926923 0303077 MW-50D 5 181323 1812962182 0267818 MW-31C 5 181311 1813127460 -001746 MW-51D 5 181302 1812256458 0763542 MW-13E 5 181234 1812181638 0158362
MW-100D 5 181223 1813629694 -1399694 MW-100C 5 181216 1813634399 -1474399 MW-30C 5 181208 1811949179 0130821 MW-19C 5 1812 1812353637 -0353637 MW-20D 5 181196 1811924735 0035265 MW-30D 5 181188 1811949179 -0069179 MW-20E 5 181155 1811924735 -0374735 MW-16M 5 181133 1811653909 -0323909 MW-13M 5 181117 1811940971 -0770971 MW-30E 5 181115 1811949179 -0799179 MW-11M 5 181097 1814139713 -3169713 MW-17D 5 180923 1808958032 0271968
Sheet 2 of 3
Table 61 Water Level Calibration Statistics
Garvey Elevator Site Hastings Nebraska
Name Layer
Target Water Level Elevation - Sept 2011
(feet amsl) Model
Water Level Error
Residual MW-20C 5 180892 1811924735 -3004735 MW-45D 5 180884 1809292039 -0452039 MW-12D 5 180575 1805738454 0011546 MW-18D 5 180413 1804194578 -0064578 MW-104D 5 180137 1801272389 0097611 MW-104C 5 180135 1801269033 0080967 MW-46D1 5 179796 1797768438 0191562 MW-105D 5 179794 1797798970 014103 MW-46D2 5 179792 1797771831 0148169 MW-105C 5 179791 1797803499 0106501 MW-41D2 5 179702 1797046783 -0026783 MW-41D1 5 179697 1797044368 -0074368 MW-106C 5 178531 1785334635 -0024635 MW-106D 5 178527 1785320367 -0050367 MW-43D 5 178387 1783880124 -0010124 MW-43E 5 178386 1783888909 -0028909 MW-42D 5 178183 1781770173 0059827 MW-42E 5 178182 1781753639 0066361 MW-44D 5 177409 1774079493 0010507 MW-44E 5 177407 1774078775 -0008775
Residual Mean 0046933 Res Std Dev 0743461 Sum of Squares 6048817
RMS Error 0744941 Min Residual -3169713 Max Residual 1942196
Number of Observations 109 Range in Observations 4362
Scaled Std Dev 0017044 Scaled Abs Mean 0010505
Scaled RMS 0017078 Notes
amsl - above mean sea level
Sheet 3 of 3
Table 71 Groundwater Data Summary Projected Durations to Meet MCLs
Garvey Elevator Site Hastings Nebraska
Well Data Collection Range TCE Concentration μgL Estimated Date to
Reach MCLs Duration from June 2012 yrsHigh Low
MW-3A May 1997 - March 2012 20000 11 already achieved NA MW-3B May 1997 - March 2012 23000 74 Nov 2045 33 MW-3D April 1997 - March 2012 5 05 already achieved NA MW-3E April 1997 - March 2012 4 05 already achieved NA MW-4A May 1997 - March 2012 18000 43 Sept 2013 1 MW-4B May 1997 - March 2012 29000 690 Dec 2042 30 MW-5A May 1997 - March 2012 24000 47 already achieved NA MW-5B May 1997 - March 2012 15000 12 Jan 2017 5 MW-5D April 1997 - March 2012 4 05 already achieved NA MW-13C May 1997 - March 2012 18000 28 Nov 2061 49 MW-13E May 1997 - March 2012 5 05 already achieved NA
RW-1 1999 - 2011 490 10 May 2016 4 RW-2 1999 - 2011 3200 5 Nov 2021 9 RW-3 1999 - 2011 3800 5 Feb 2024 12 RW-4 1997 - 2011 5500 5 June 2016 4 RW-5 1999 - 2011 5500 5 achieved NA RW-6 1999 - 2011 590 10 Oct 2018 6 RW-7 1995 - 2011 1000 5 Jan 2025 13 RW-8 1998 - 2011 380 5 March 2047 35
Notes
Dates and concentration data are from the site database projections to reach MCLs are based on curves fitted to data plots as provided by Dr Brian
Zurbuchen via email on June 11 2012
μgL - micrograms per liter
Sheet 1 of 1
Table 72 Remedial Alternatives Summary
Garvey Elevator Site Hastings Nebraska
Remedial Alternative Assumptions Remediation
Times Notes
OU 1
SG-1-No Action All extraction wells off 30 years
This scenario was not explicity modeled Based on the remedition duration predicted for SG2 remediation time will be greater than 30 years However for cost estimating purposes a 30-year duration will be used
SG2-- Maintain and Operate Existing GET System
No treatment of downgradient plume
30 years This scenario was not explicity modeled but remediation time was estimated based on contaminant concentration trends (see Table 71)
SG3--In Situ Treatment Via Groundwater Amendments
Area within gt500 ugL set to 00 on-site treatment system shut off
15 years Remediation time estimates are for OU1 (on-site) plume using multiple injection treatments and existing GET system shut off
SG4-- Maintain and Operate Existing GET System and Treatment Via Groundwater Amendments
Pump and treat system operating groundwater within concentrations gt500 ugL set to 00
10 years Remediation time estimates are for OU1 (on-site) plume using multiple injection treatments and existing GET system operating
OU 2
G1-No Action Pump and treat system operating no treatment of downgradient plume
30 years This scenario was not explicity modeled For cost estimating purposes a 30-year duration will be used
G2-Groundwater Recovery Treatment and Discharge at Leading Edge of Plume
On-site pump and treat system operating
100 years Based upon modeling results for more active remedies the remediation times for both the OU 1 and OU 2 plumes would exceed 100 years This scenario was not explicity modeled
G3a-Groundwater Recovery Treatment and Discharge at mid point and Leading Edge of Plume
On-site pump and treat system operating
75 years
Modeled duration ranges from 75 to 90 years
G3b-Groundwater Recovery Treatment and Discharge at two transects and Leading Edge of Plume
On-site pump and treat system operating
53 years
G4a-In Situ treatment at midpoint of plume and Groundwater Recovery Treatment and Discharge at leading edge of plume
On-site pump and treat system operating
75 years
Same as G3 but a treatment zone replaces the recovery wells near the midpoint of the plume Modeled duration ranges from 75 to 90 years
G4b-In Situ treatment at two transects near core of plume and Groundwater Recovery Treatment and Discharge at leading edge of plume
On-site pump and treat system operating
56 years Same as G3 but two treatment zones replace the recovery wells near the midpoint of the plume
Notes
μgL - micrograms per liter
Sheet 1 of 1
This page was intentionally left blank
ATTACHMENT 2 FIGURES
Figure 31 Carbon Tetrachloride Isoconcentrations Upper Aquifer Zone AB Figure 32 Carbon Tetrachloride Isoconcentrations Medial Aquifer Zone C Figure 33 Carbon Tetrachloride Isoconcentrations Lower Aquifer Zone DE
Figure 51 Model Domain and Boundary Conditions Figure 52 Vertical Discretization of Model Figure 53 Elevation of the Model Base Figure 54 Elevation of the Top of the Lower Aquifer Figure 55 Isopach Map of the Lower Confining Unit Figure 56 Elevation of the Base of the Medial Aquifer Figure 57 Isopach of Upper Aquifer Figure 58 Elevation of the Base of the Upper Aquifer Figure 59 Location of Recovery Wells in the Shallow Aquifer Figure 510 Location of Recovery Wells in the Medial Aquifer Figure 511 Location of Injection and Municipal Wells in the Lower Aquifer Figure 512 Initial Concentrations of Carbon Tetrachloride in the Shallow Aquifer Figure 513 Initial Concentrations of Carbon Tetrachloride in the Medial Aquifer Figure 514 Initial Concentrations of Carbon Tetrachloride in the Lower Aquifer
Figure 61 Error Residuals Versus Measured Water Levels Figure 62 Measured Water Levels Versus Predicted Water Level Elevations Figure 63 Error Residuals for the Shallow Aquifer in the Vicinity of the Garvey Elevator
Site Figure 64 Error Residuals for the Shallow Aquifer over the Model Domain Figure 65 Error Residuals for the Medial Aquifer over the Model Domain Figure 66 Error Residuals for the Lower Aquifer in the Vicinity of the Garvey Elevator
Site Figure 67 Error Residuals for the Lower Aquifer over the Entire Model Domain Figure 68 Calibrated Hydraulic Conductivities of the Shallow Aquifer Figure 69 Calibrated Hydraulic Conductivities of the Medial Aquifer Figure 610 Calibrated Hydraulic Conductivities of the Lower Aquifer Figure 611 Calibrated Hydraulic Conductivities of the Upper Aquitard Figure 612 Calibrated Hydraulic Conductivities of the Lower Aquitard Figure 613 Calibrated Potentiometric Surface of the Shallow Aquifer Figure 614 Calibrated Potentiometric Surface of the Medial Aquifer Figure 615 Calibrated Potentiometric Surface of the Lower Aquifer Figure 616 Particle Tracking Analysis to Estimate Travel Time
Figure 71 Initial Concentrations for Alternative SG3 Figure 72 Capture Zone Analysis in the Shallow Aquifer for Alternative SG3 Figure 73 Capture Zone Analysis in the Medial Aquifer for Alternative SG3 Figure 74 Alternative G2 ndash Proposed Recovery Wells Medial Aquifer
ATTACHMENT 2 FIGURES (continued)
Figure 75 Alternative G2 ndash Proposed Recovery Wells Lower Aquifer Figure 76 Preliminary Locations for Leading Edge Recovery Wells and Groundwater
Treatment Building ndash Alternative G2 Figure 77 Alternative G3ab ndash Proposed Recovery Wells Medial Aquifer Figure 78 Alternative G3a ndash Proposed Recovery Wells Lower Aquifer Figure 79 Preliminary Locations for Mid-Plume and Leading Edge Recovery Wells and
Groundwater Treatment BuildingmdashAlternative G3 Figure 710 Alternative G3b ndash Proposed Recovery Wells Lower Aquifer Figure 711 Alternative G3b ndash Relative Positions of Proposed Recovery Wells Medial and
Lower Aquifer Figure 712 Alternative G4a ndash Proposed Treatment Curtain and Recovery Wells Lower
Aquifer Figure 713 Preliminary Locations for Mid-Plume Injection Wells Leading Edge Recovery
Wells and Groundwater Treatment Building ndash Alternative G4 Figure 714 Alternative G4b ndash Proposed Treatment Curtains and Recovery Wells Lower
Aquifer Figure 715 Alternative G4b ndash Relative Positions of Proposed Recovery Wells and
Treatment Curtains
5
5
5
5
5
50
100 500
MW-6A SB-39 HGLmdashGroundwater Flow Modeling Technical MemorandumMW-2AHTW 40 (98)(ND)MW-8A MW47B ( Garvey Elevator SitemdashHastings NE(ND)
(59) SB-38
MW-19APSUS PU PPPUUU ( Figure 31 (70)MW-33 MW-3AB
Carbon Tetrachloride in the(ND53) MW49B MW-20A
+UP+UPPPP+U+U+UPPPPUUUU+UP+UPPPP+U+U+U(43) Upper Aquifer Zone AB(10)
MW-1A PU MW50B(ND) +UP+UPPPP+U+U+U September 2011 Sampling(84)
PPUUMW-4AB PPUU MW-13CE +++++UPUPPPPUUU (21640)
MW-30A (160)+UP+UPPPP+U+U+U LegendPPPUUU
1000 MW51B (1200) MW-5AB
(4119J)
Garvey Property BoundaryMW-7AB MW-31A (ND) (75) (
PPUU MW48B RailroadSB-33 (680)
Inset Ntilde Monitoring Well Location MW-47B MW-10A
(59) (ND) Multilevel Well MW-9A MW-6AHTW 40 MW-10B(ND) (98)
(ND) MW-11A S Hydraulic Conductivity
MW-33 UPPUMW-2A MW-19AU MW-14A(ND) P
(70) PU (ND) A West Highway 6 amp Highway 281 Site MW-12A AMW-106AMW-20A MW-104AMW-3A MW-8A (ND) Monitoring WellU UUU (ND)PSSU P PPP (10)(ND) (ND)(ND) U
UUUUU PUUUUP PPPPPPPPPPPPPPPPPPPPPPPUUUUPUPPPPUUUUU MW-13CE
UUUU Carbon Tetrachloride ConcentrationMW-3B MW-105A A (190)PPP A (ND)
UUUUUUUUU(53) MW-30A in micrograms per liter (microgL)PPUUPPPUUUPPPPPUUUUU
MW-12DMW-1A (160) MW-42 DEMW-45CD(ND)
MW-50B MW-49B MW-51B Carbon Tetrachloride Isoconcentration(84) PPUUPPUU(43)
PPUU(1200)
Contour (microgL)PPPUUU PPPUUUMW-46 D1D2MW-7B (5)(ND)
(Dashed Lines are Estimated)MW-7A (ND)
MW-5A (41)
MW-4A (21) MW-4B (640)
MW-48B (680)
MW-17A (ND)
MW-16A (ND) UUPP
MW-18A (ND)
MW-41 D1D2 UUPP
MW-44 DE UUPP
MW-5B
MW-31A (75)
(19)
MW-43 DE UUPP Notes
(ND) Nondetect
0 2500 5000
Feet sup3 Filename XEPA009GarveyGW_Flow_Tech_Memo Carbon_TetChl_UpperAquifer_ABmxd Project EP903401220202 Revised 061312 ST Source ENSR GDB 2008 DNR
100
5
100
SB-39MW-6AHTW 40 HGLmdashGroundwater Flow Modeling Technical Memorandum MW47C SB-38MW-33 MW-2A (62) ( Garvey Elevator SitemdashHastings NE
UUUPSUS P PPP (
U
Figure 32MW-8A MW-3ABDE MW-19C (ND) Carbon Tetrachloride in the
MW-1A +++++PPPP UPUPPPPUUUUUUU
+UP+UPPPP+U+U+U Medial Aquifer Zone CPU MW-20C +UP+UPPPP+U+U+U (ND) September 2011 SamplingMW49C
UU(ND) PPUU +++++PPPPPPPUUUUU MW50C
(ND) +UP+UPPPP+U+U+UPPPUUU LegendMW-13C
MW-4AB (130) MW-30C
MW-5AB (ND) MW48C MW51C
(ND) (ND) Garvey Property Boundary SB-33 (
MW-7AB PPUU MW-31C (ND) Railroad
Inset Ntilde Monitoring Well Location MW-47CMW-9A MW-10AB Multilevel Well(62)
HTW 40
MW-6A S Hydraulic Conductivity WellMW-11AMW-33 PPUUMW-2A
MW-19CUP (ND) P West Highway 6 amp Highway 281 SiteU MW-14A A A Monitoring WellMW-20C MW-12C MW-106CMW-104CPSS P PPP
U (ND) (ND) (90) (ND)
MW-8A MW-13C U U UUU
PMW-3ABDE PPPPPPPPUUUUPU (130) Carbon Tetrachloride ConcentrationPU UUUU UUUUUUUUUU
MW-105C A (190)MW-1A UUUUUUUUUPPPPPPPPPPPPPPPPPPP MW-30C PPPUUU MW-12D A (200) in micrograms per liter (microgL)
MW-49C UUUUPUPPPPUUPU (ND) UPPU Old Rolls MW-42 DEPP (13)(ND) Carbon Tetrachloride Isoconcentration MW-45C MW-50C (ND)
MW-51C (ND) PPUU PPUU PPUU (5) Contour (microgL)(ND)
UUU PPP MW-46 D1D2
PPP UUUMW-48C (Dashed Lines are Estimated)5MW-7AB (ND)
MW-4AB MW-17C MW-18C(ND) MW-44 DE Domestic Irrigation W ater Wells(81)MW-5AB
PPUUMW-31C MW-16C (ND)
PPUU(ND) MW-41 D1D2
PPUU
Notes MW-43 DE PPUU
(ND) Nondetect
0 2500 5000
Feet sup3 FilenameXEPA009GarveyGW_Flow_Tech_Memo Carbon_TetChl_Medial_Aquifer_Cmxd Project EP903401220202 Revised 061312 ST Source ENSR GDB 2008 DNR
50
5
5
50 100
MW-6D SB-39 HGLmdashGroundwater Flow Modeling Technical MemorandumHTW 40 (ND) SB-38MW-3DE ( Garvey Elevator SitemdashHastings NE (NDND)
UUUUPSUS P PPP MW-19AC( Figure 33MW-2A MW-33 MW47D
U (ND)
Carbon Tetrachloride in theMW-8A PPPPUUUU P Lower Aquifer Zone DEUMW-1A MW-20DEPU P
(NDND)UPUU
September 2011 Sampling MW-13EPPUUPPPU (ND)
MW50D UPMW49D (ND) UUU(ND) PPP MW-30DE Legend MW51D (ND)
(ND)MW-4AB MW48D (ND)
MW-7AB MW-5D (ND) Garvey Property Boundary
MW-31C (ND)
PPUU
(
RailroadSB-33MW-3DE (NDND)
Inset Ntilde Monitoring Well Location MW-47D
MW-9A (ND) Multilevel Well HTW 40
MW-6D MW-10AB (ND)
MW-11A S Hydraulic Conductivity Well MW-33 MW-2A UPPU
PUMW-19AC West Highway 6 amp Highway 281 Site MW-14A APU
MW-20DE MW-106D A Monitoring WellMW-104DPSSU PU PPPUUU (NDND)
MW-12C (ND)(ND)MW-8A MW-13E PU
UUUUU (ND) Carbon Tetrachloride ConcentrationU PPPPPPPPUUUUPU (190)PPUUU
PPUPPPPPPPPPPPPPPPUUUUUP
UUUUU UUUUUUU PPP A MW-105DMW-1A in micrograms per liter (microgL) AMW-30DE
PPUUPPPUUUPPPPPUUUUU(52)
(NDND) MW-12DNew RollsMW-49D (ND) (ND)
Carbon Tetrachloride Isoconcentration(ND) MW-45D PPUUMW-51D (ND)
MW-46 D1PPUU PPUU Contour (microgL)MW-50D (ND) (5)(ND)
PPPUUU (770)PPPUUU MW-42 DMW-48D (Dashed Lines are Estimated)MW-4AB (4274)(ND)
MW-44DEMW-46 D2 MW-17D (320) (19ND)MW-7AB
MW-5D Domestic Irrigation W ater Wells(94) MW-18D PPUUMW-31C(ND) (21) MW-41 D1MW-5B MW-16C PPUU (ND)
PPUUMW-41 D2 (10) Notes
MW-43DE UUPP(ND18) (ND) Nondetect
0 2500 5000
Feet sup3 Filename XEPA009GarveyGW_Flow_Tech_Memo Carbon_TetChl_LoweR_Aquifer_Dmxd Project EP903401220202 Revised 061312 ST Source ENSR GDB 2008 DNR
_L _j I I I I _j_ I I I
I l --- I 111
1
__u_ I I
1 I ~ N ----y-
+ ~ I
II L _l e11111111111 I ---1 ~lJJ I n r Igt I Constant Head Boundariesj l _Q No Flow Sound aries I I l
~ r-- I - I middot r-
- fl+- L -
0 I J ~r-
Ll-D l Garvey Site I - ~t
Ill -J
l unJprm Spacing 25 eet U~iform S pacing 1 00 feet I Constant Head Boundaries
j
middotmiddot- ~ No Flow Sound aries
J
--=J--=11-~=======2~-----~3=========4~------5 M1les 0 05
Figure 51 Model Domain Gridding and Boundaries
Figure 52 Vertical Discretization of Model
1610
1620
1 6 2 0
1630
1 6 3 0
1640
1 6 4 0
1650
1 6 5 0
1660
1660
1670
1670
1680
1680
1690
17
1698
17013
16918
169198
169118
165864
167129
168901
169482
169872
169403
169347
169374
169448
Figure 53 Elevation of the Model Base (weathered shale of the Niobrara Formation)
1111
I I
-
N
+ 0 05
I I
I 1 l
I
1 l -
2 3 4 Miles
Figure 54 Elevation of the Top of the Lower Aquifer
Figure 55 Isopach Map of Lower Confining Unit (model Layer 4)
Figure 56 Elevation of the Base of the Medial Aquifer
Figure 57 Isopach of Upper Aquitard (model layer 2)
Figure 58 Elevation of the Base of the Upper Aquifer
I I I
~ ~ t--7 t bull I I I
r I l
I EW-01 f1-m I N I bull __ j
+ twtrl I I I rl bull I I I I J I I I -r-----
- middot-- - -- -- middot------__J_--
I --- 1 Feet I 0 500 1 000 2000 3000 4000 rooo I I I I
Figure 59 Location of Recovery Wells in the Shallow Aquifer
_l ________ l I I I -1 middot ] l ~----------middotj + I j
middotmiddot= middotmiddot- ---------L -- ---- ___ _ [_ __
r--------shy1
o--~oomiddoto~bull1~oo=o ======4~oomiddoto------middot~ooco=======43oobullo -------~oo~1
Figure 510 Location of Recovery Wells in the Medial Aquifer
I I r
~~ r -
L - - - -- -1--ltmiddot --I-
I -
---- L f+r
il I
J ---1
I
N
+
Figure 511 Location of Injection and Municipal Wells in the Lower Aquifer
Figure 512 Initial Concentrations of Carbon Tetrachloride in the Shallow Aquifer
Figure 513 Initial Concentrations of Carbon Tetrachloride in the Medial Aquifer
Figure 514 Initial Concentrations of Carbon Tetrachloride in the Lower Aquifer
-40
-30
-20
-10
00
10
20
30
40
17741 17828 17915 18002 18090 18177
Res
idua
l
Layer 1
Layer 3
Layer 5
Observed Value
Figure 61 Error Residuals Versus Measured Water Levels
Layer 1
Layer 3
18090
18177
Layer 5
Mod
el V
alue
17741 17828 17915 18002 18090 18177
18002
17915
17828
17741
Observed Value
Figure 62 Measured Water Levels Versus Predicted Water Levels
bull -020
N
+ 0
h I I
-----------~----j_ _______ ___ j_94-__ _ __ I ------------- t
011
bull 005
05
bull
I
Mile 1
Figure 63 Error Residuals for the Shallow Aquifer in the vicinity of the Garvey Elevator Site
Figure 64 Error Residuals for the Shallow Aquifer Over the Model Domain
-007 bull
N
+
il _ __ ~ II
t079 i
I 1 II_ --middot--middot- J_~=====-middot 1------~
~--1 000 r-----middot- -middotmiddot ____
-021 bull
-012 007 bull bull
l middot l02
I ~~~~====~---====~---Feet _ o ___ _ $-_~_0 _ ___ _ J000 _____ 3QQ_Q_ ---4lIJOLUlJ00----ltgt5ultOOO-- middott- middot ----
I
Figure 65 Error Residuals for the Medial Aquifer Over the Model Domain
0 250
N
+
044 bullbull -042
000 bull
027 bull
013
-)35 bull
Figure 66 Error Residuals for the Lower Aquifer in the Vicinity of the Garvey Elevator Site
Figure 67 Error Residuals for the Lower Aquifer in the Entire Model Domain
Figure 68 Calibrated Hydraulic Conductivities of the Shallow Aquifer (ftd) (model layer 1)
Figure 69 Calibrated Hydraulic Conductivities of the Medial Aquifer (ftd) (model layer 3)
Figure 610 Calibrated Hydraulic Conductivities of the Lower Aquifer (ftd) (model layer 5)
Figure 611 Calibrated Hydraulic Conductivities of the Upper Aquitard (ftd) (model layer 2)
Figure 612 Calibrated Hydraulic Conductivities of the Lower Aquitard (ftd) (model layer 4)
Figure 613 Calibrated Potentiometric Surface of the Shallow Aquifer (model layer 1)
Figure 614 Calibrated Potentiometric Surface of the Medial Aquifer (model layer 3)
Figure 615 Calibrated Potentiometric Surface of the Lower Aquifer (model layer 5)
Figure 616 Particle Tracking Analysis to Estimate Travel Time
Figure 71 Initial Concentrations for Alternative SG3
E3 E3 2000feet
Figure 72 Capture Zone Analysis in the Shallow Aquifer for Alternative SG3
E3 E3 E3 2000feet
Figure 73 Capture Zone Analysis in the Medial Aquifer for Alternative SG3
Figure 74 Alternative G2-Proposed Recovery Wells Medial Aquifer
Figure 75 Alternative G2- Proposed Recovery Wells Lower Aquifer
50
5 5
5
50 100
MW-3DE (NDND)
MW-47D MW-9A (ND)
HTW 40 MW-6D MW-10AB
(ND) MW-11A
MW-2AMW-33 UPPUPU
MW-19AC MW-14A APUMW-20DE MW-106DMW-104D(NDND) MW-12CPSSU (ND)PU PPPUUU PU (ND) MW-13E
HGLmdashGroundwater Flow Modeling Technical Memorandum Garvey Elevator Superfund SitemdashHastings NE
Figure 76 Preliminary Locations for Leading
Edge Recovery Wells and Groundwater Treatment Building-Alternative G2
Legend Garvey Property Boundary
Railroad
Ntilde Monitoring Well Location
Multilevel Well
S Hydraulic Conductivity Well
A West Highway 6 amp Highway 281 Site Monitoring Well
(190) Carbon Tetrachloride Concentration in micrograms per liter (microgL)
Carbon Tetrachloride Isoconcentration Treatment Building
Technical Blvd
MW-8A UUUU UUUUU
U PPPPPPPPUUUUPU UUUUUUPUP
UUUUUPPPPPPPPPPPPPPPPPP (ND)
PPPUUU A MW-105DMW-1A UU AMW-30DE PPUUPPPUUUPPPPPUUUUU
(52)(NDND) MW-12DNew Rolls Contour (Lower Aquifer) (microgL)MW-49D (5)(ND) (ND)
(ND) MW-45D (Dashed Lines are Estimated)PPUUMW-51D (ND) MW-46 D1PPUU PPUUMW-50D
(ND) (ND)
PPPUUU (770)PPPUUU MW-42 DMW-48D Domestic Irrigation W ater WellsMW-4AB (4274) MW-44DE(ND)
(19ND)MW-46 D2 MW-17D (320)MW-7AB Carbon Tetrachloride Isoconcentration(94)MW-5D
MW-18D PPUU (5) Contour (Upper Aquifer) (microgL)(21) MW-41 D1 MW-31C(ND)
MW-5B MW-16C PPUU (Dashed Lines are Estimated)(ND)
PPUUIdlewilde Rd
MW-41 D2 Recovery Wells (Medial)
Recovery Wells (Deep)
(10)
MW-43DE PPUU(ND18)
Recovery Well Piping
Treatment Building
Notes (ND) Nondetect
Blaine A
ve
Showboa t B
lvd
sup3 Filename XEPA009GarveyGW_Flow_Tech_Memo Carbon_TetChl_LoweR_Aquifer_Dmxd Project EP903401220202 Revised 061312 ST2500 5000 Source ENSR GDB 2008 DNR
Feet
0
Figure 77 Alternative G3ab-Proposed Recovery Wells Medial Aquifer
Figure 78 Alternative G3a- Proposed Recovery Wells Lower Aquifer
50
5 5
5
50 100
HGLmdashGroundwater Flow Modeling Technical Memorandum Garvey Elevator Superfund SitemdashHastings NE
Figure 79 Preliminary Locations for Mid-Plume and
Leading Edge Recovery Wells and Groundwater Treatment Building-Alternative G3
Legend Garvey Property Boundary
Railroad
Ntilde Monitoring Well Location MW-3DE (NDND)
Multilevel Well MW-47D
MW-9A (ND) Hydraulic Conductivity WellSHTW 40 MW-6D MW-10AB
(ND) West Highway 6 amp Highway 281 SiteMW-11A
MW-33 PPUUMW-2A PUA Monitoring Well
MW-19AC MW-14A APUCarbon Tetrachloride Concentration
Technical Blvd
MW-44DE (19ND) (Dashed Lines are Estimated)
MW-20DE (190)MW-106DPSSU PU PPPUUU MW-104DMW-12C(NDND) (ND)PU in micrograms per liter (microgL)(ND) MW-13EMW-8A
U UUUU UPUPPPPUUUUUUUUP UUUUU UUUPPPPPPPPPPPPPPPPPPPPPPPUUUUUU
(ND) PPPUUU A Treatment BuildingMW-105DMW-1A Carbon Tetrachloride IsoconcentrationMW-30DE A
PPUUPPPUUUPPPPPUUUUU(52)
(NDND) MW-12DNew Rolls Contour (Lower Aquifer) (microgL)MW-49D (5)(ND) (ND)(ND) MW-45D
MW-51D PPUU(ND)
PPUU PPUUMW-50D (ND)
MW-46 D1(ND) PPPUUU (770)
PPPUUU MW-42 D (4274)
MW-48D Domestic Irrigation W ater WellsMW-4AB (ND) MW-46 D2
MW-17DMW-7AB (320)(94) Carbon Tetrachloride IsoconcentrationMW-5D
MW-18D(ND) MW-31C (21) PPMW-41 D1
UU (5) Contour (Upper Aquifer) (microgL)MW-5B MW-16C UU (ND)PP (Dashed Lines are Estimated)PPUUIdlewilde Rd
MW-41 D2 Recovery Wells (Medial)(10)
MW-43DE UUPP(ND18) Recovery Wells (Deep)
Recovery Well Piping
Treatment Building
Notes (ND) Nondetect
Blaine A
ve
Showboa t B
lvd
sup3 Filename XEPA009GarveyGW_Flow_Tech_Memo Mid-Plume_Prelim_Loc Project EP903401220202 Revised 061312 RL2500 5000 Source ENSR GDB 2008 DNR
Feet
0
Figure 710 Alternative G3b-Proposed Recovery Wells Lower Aquifer
Figure 711 Alternative G3b-Relative Positions of Proposed Recovery Wells Medial and Lower Aquifers
Figure 712 Alternative G4a-Proposed Treatment Curtain and Recovery Wells Lower Aquifer
50
5 5
5
50 100
HGLmdashGroundwater Flow Modeling Technical Memorandum Garvey Elevator Superfund SitemdashHastings NE
Figure 713 Preliminary Locations for Mid-Plume
Injection Wells Leading Edge Recovery Wells and Groundwater Treatment Building
-Alternative G4
Legend Garvey Property Boundary
Railroad
Ntilde Monitoring Well Location MW-3DE (NDND)
MW-47D MW-9A (ND)
HTW 40 MW-6D MW-10AB
(ND)
S Elm
Ave
S Wabash A
ve
Multilevel Well
S Hydraulic Conductivity Well
A West Highway 6 amp Highway 281 Site Monitoring Well
MW-11AMW-33 UPPUMW-2A PU
MW-19AC MW-14A APUMW-20DE MW-106D Carbon Tetrachloride ConcentrationPU PPPUUU (190)PSSU MW-104D(NDND) MW-12C (ND)PU in micrograms per liter (microgL)(ND)
Treatment Building Technical B
lvd MW-13EMW-8A
UUUU UUUUUU PPPPPPPPUUUUPU UUUUU
UPUP
UUUUUPPPPPPPPPPPPPPPPPP (ND)
PPPUUU A MW-105DMW-1A UU Carbon Tetrachloride IsoconcentrationAMW-30DE PPUUPPPUUUPPPPPUUUUU
(52)(NDND) MW-12DNew Rolls Contour (Lower Aquifer) (microgL)MW-49D (5)(ND) (ND)
(ND) MW-45D (Dashed Lines are Estimated)PPUUMW-51D (ND) MW-46 D1PPUU PPUUMW-50D
(ND) (ND)
PPPUUU (770)PPPUUU MW-42 DMW-48D Domestic Irrigation W ater WellsMW-4AB (4274)(ND) MW-44DEMW-46 D2
(19ND)MW-17D (320)MW-7AB Carbon Tetrachloride Isoconcentration(94)MW-5D MW-18D PPUU (5) Contour (Upper Aquifer) (microgL)(21) MW-41 D1
MW-31C(ND) MW-5B MW-16C PPUU (Dashed Lines are Estimated)(ND)
PPUUIdlewilde Rd
MW-41 D2 Recovery Wells (Medial)
Recovery Wells (Deep)
(10) Injection Area 1 MW-43DE PPUUPermanent Injection Well Spacing 40 ft (ND18)
Total Injection Wells Installed 39 Recovery Well Piping Injection Area (40 ft spacing between the wells) Treatment Building
Notes (ND) Nondetect
Blaine A
ve
Showboa t B
lvd
S Baltim
ore Ave
sup3 Filename XEPA009GarveyGW_Flow_Tech_Memo G4_Prelim_Loc_Inj_Areamxd Project EP903401220202 Revised 061312 RL2500 5000 Source ENSR GDB 2008 DNR
Feet
0
Figure 714 Alternative G4b-Proposed Treatment Curtains and Recovery Wells Lower Aquifer
Figure 715 Alternative G4b-Relative Positions of Proposed Recovery Wells and Treatment Curtains

Table 51 Contact Elevations of the Major Lithologic Units
Garvey Elevator Site Hastings Nebraska
Elev Depth Elev Depth Elev Depth Elev Thickne Depth Elev Depth Elev Thickne Depth Elev Depth Elev (ft) (ft) (ft bgs) (ft amsl) (ft bgs) (ft amsl) (ft bgs) (ft amsl) (ft bgs) (ft amsl) (ft) (ft bgs) (ft amsl) (ft bgs) (ft amsl) (ft) (ft bgs) (ft amsl) (ft bgs) (ft amsl)
Surface Elevation -
Surficial Soil Peoria and
Loveland Loess
Very Fine Sand Silty Fine Sand
Clayey Silt
Silty Sand and Gravel (contains Upper Aquifer)
Upper Aquitard Medial Aquifer Boring DepthEasting(2)Northing(2)
Well ID Lower Aquitard Lower AquiferSite
Top of Lithologic and Hydrostratigraphic Units(1)
Decomposed Weathered
Shale
OU1 (new) SB-09 270168160 2080517340 13160 192984 59 187084 90 183984 130 179984 1 131 179884 -- -- -- -- -- -- --OU1 (new) SB-13 269654838 2080309785 14340 192973 67 186273 87 184273 130 179973 3 133 179673 -- -- -- -- -- -- --OU1 (new) SB-29 270864398 2081035503 14215 192989 68 186189 90 183989 -- -- -- -- -- -- -- -- -- -- -- --OU1 (new) SB-32 271237915 2079979855 14865 192475 66 185875 92 183275 -- -- -- -- -- 148 177675 297 149 177575 -- --OU1 (new) SB-33 269199799 2080682378 14085 193446 63 187146 93 184146 -- -- -- -- -- -- -- -- -- -- -- --OU1 (new) SB-39 271537352 2081550026 13560 192583 64 186183 89 183683 -- -- -- -- -- -- -- -- -- -- -- --OU2 (new) TS1-01 269515615 2089614339 864 191569 70 184569 86 182969 -- -- -- -- -- -- -- -- -- -- -- --OU2 (new) TS1-03 268313868 2089646765 16736 191251 66 184651 86 182651 1195 179301 05 120 179251 148 176451 5 153 175951 -- --OU2 (new) TS1-05 267030127 2089665004 16681 191624 75 184124 87 182924 117 179924 2 119 179724 153 176324 308 155 176124 -- --OU2 (new) TS2-02 271456113 2097510251 13680 191015 73 183715 104 180615 134 177614 3 137 177314 -- -- -- -- -- -- --OU2 (new) TS2-04 268939527 2097554155 16746 190360 70 183360 89 181460 126 177760 9 135 176860 152 175160 306 154 174960 -- --OU2 (new) TS2-05 267717573 2097569698 17161 190143 62 183943 99 180243 -- -- -- -- -- 157 174443 2 159 174243 -- --OU2 (new) TS2-06 266250085 2097592053 11980 190501 60 184501 100 180501 -- -- -- -- -- -- -- -- -- -- -- --OU2 (new) TS3-02 269400264 2102787273 15690 189415 68 182615 96 179815 125 176915 7 132 176215 147 174715 297 150 174415 -- --OU2 (new) TS3-05 265786308 2102812115 14380 189056 67 182356 96 179456 1195 177106 1 1205 177006 129 176156 261 132 175856 -- --OU2 (new) TS4-02 267112179 2105261928 17031 188448 64 182048 96 178848 116 176848 3 119 176548 141 174348 284 143 174148 -- --
Hwy 6 TS3-01 271941141 2089537242 1453 19153 720 184334 1125 180284 1256 178974 29 1285 178684 -- -- -- -- -- -- --Hwy 6 TS3-02 271499828 2089579255 1414 19139 692 184466 102 181186 1227 179116 59 1286 178526 -- -- -- -- -- -- --Hwy 6 TS3-03 270957676 2089591662 1440 19087 710 183767 941 181457 1178 179087 56 1234 178527 -- -- -- -- -- -- --Hwy 6 TS3-04 270411434 2089597601 1403 19088 663 184254 1006 180824 1167 179214 61 1228 178604 -- -- -- -- -- -- --Hwy 6 TS3-05 272464675 2089528557 1718 19173 685 184883 1032 181413 123 179433 7 130 178733 -- -- -- -- -- -- --Hwy 6 TS4-01 271882569 2095813356 1658 19042 650 183920 987 180550 1238 178040 52 129 177520 -- -- -- -- -- -- --Hwy 6 TS4-03 270996450 2096068696 1171 19050 810 182400 966 180840 1154 178960 12 1166 178840 -- -- -- -- -- -- --Hwy 6 TS5-01 271766686 2092074297 1562 19016 648 183680 905 181110 1163 178530 53 1216 178000 -- -- -- -- -- -- --Hwy 6 TS5-03 270732978 2092105115 1389 19008 709 182990 923 180850 1147 178610 46 1193 178150 -- -- -- -- -- -- --Hwy 6 TS5-05 272269991 2092059880 1717 19045 425 186200 942 181030 1153 178920 83 1236 178090 -- -- -- -- -- -- --
Electrical Conductivity Borings
(1)Surface elevation listed for nested monitoring wells (ABCDE) is the surface elevation of the A well Unit elevations are from the boring logs in which they were recorded (2)State Plane Coordinate system Nebraska 2600 amsl - above mean seal level bgs - below ground surface Elev - elevation ft - feet Hwy 6 - Wellsborings installed for the West Highway 6 and Highway 281 Site Investigations -- - not applicable or not available OU1 - Operable Unit 1 these wells are associated with on-site groundwater OU1 (new) - Operable Unit 1 wellsborings installed in AprilMay 2010 for the RI OU2 - Operable Unit 2 these wells are associated with off-site groundwater OU2 (new) - Operable Unit 2 Monitoring wellsborings installed in AprilMay 2010 for the RI
Sheet 2 of 2
Table 61 Water Level Calibration Statistics
Garvey Elevator Site Hastings Nebraska
Name Layer
Target Water Level Elevation - Sept 2011
(feet amsl) Model
Water Level Error
Residual MW-12U 1 18156 1814424820 117518 MW-100A 1 181542 1814519751 0900249 MW-16U 1 181534 1814385390 095461 MW-10A 1 181528 1814182851 1097149 MW-1A 1 181525 1815209270 004073 MW-2A 1 181519 1815393838 -0203838 MW-05 1 181516 1814358176 0801824
MW-102A 1 18151 1813770877 1329123 MW-13U 1 181507 1813730081 1339919 MW-7A 1 181504 1815242607 -0202607 MW-04 1 181487 1814376802 0493198
MW-17U 1 181486 1814230581 0629419 MW-07 1 181475 1814008616 0741384 MW-03 1 181471 1813907473 0802527 MW-02 1 181468 1813743101 0936899 MW-08 1 181465 1814180036 0469964 MW-06 1 18146 1814237391 0362609
MW-10U 1 181453 1814016597 0513403 MW-14U 1 181451 1814457639 0052361 MW-6A 1 181444 1814334070 010593 MW-01 1 18144 1814062502 0337498
MW-11A 1 181429 1812347804 1942196 MW-11U 1 181411 1814658764 -0548764 MW-10B 1 181372 1814173608 -0453608 MW-3A 1 181357 1813385654 0184346 MW-5B 1 181339 1813199091 0190909 MW-15U 1 181326 1814948966 -1688966 MW-47B 1 181316 1812784852 0375148 MW-50B 1 181314 1812748409 0391591 MW-4A 1 18131 1812992455 0107545 MW-3B 1 181308 1813389494 -0309494 MW-5A 1 181307 1813165365 -0095365 MW-19A 1 181301 1813252060 -024206 MW-4B 1 181298 1812954715 0025285 MW-31A 1 181289 1812885039 0004961 MW-51B 1 181236 1812125173 0234827 MW-49B 1 181227 1812349041 -0079041 MW-48B 1 18122 1812098306 0101694 MW-30A 1 181194 1812183956 -0243956 MW-09U 1 181194 1814076063 -2136063 MW-20A 1 181179 1812309176 -0519176 MW-14A 1 181061 1810498570 011143 MW-17A 1 18098 1809745419 0054581
Sheet 1 of 3
Table 61 Water Level Calibration Statistics
Garvey Elevator Site Hastings Nebraska
Name Layer
Target Water Level Elevation - Sept 2011
(feet amsl) Model
Water Level Error
Residual MW-12A 1 180706 1807353224 -0293224 MW-16A 1 180683 1806758847 0071153 MW-18A 1 18062 1805744494 0455506 MW-104A 1 180386 1804035180 -017518 MW-105A 1 179994 1799915974 0024026 MW-106A 1 178857 1788240807 0329193 MW-18C 3 180409 1804214829 -0124829 MW-12C 3 180568 1805675664 0004336 MW-16C 3 180625 1806232799 0017201 MW-45C 3 180888 1809089044 -0209044 MW-17C 3 180918 1809113670 006633 MW-47C 3 181047 1810251020 021898 MW-101B 3 181066 1811509656 -0849656 MW-102B 3 181092 1811706686 -0786686 MW-13C 3 181107 1811204349 -0134349 MW-51C 3 181177 1811366716 0403284 MW-50C 3 18119 1811832475 0067525 MW-49C 3 181235 1812474567 -0124567 MW-48C 3 18125 1812312538 0187462 MW-7B 3 181497 1815042613 -0072613
MW-09M 5 181527 1813657691 1612309 MW-3D 5 181479 1814354375 0435625 MW-3E 5 181379 1814210888 -0420888 MW-5D 5 181366 1813572038 0087962 MW-47D 5 181365 1812738611 0911389 MW-49D 5 18134 1813402643 -0002643 MW-48D 5 181323 1812926923 0303077 MW-50D 5 181323 1812962182 0267818 MW-31C 5 181311 1813127460 -001746 MW-51D 5 181302 1812256458 0763542 MW-13E 5 181234 1812181638 0158362
MW-100D 5 181223 1813629694 -1399694 MW-100C 5 181216 1813634399 -1474399 MW-30C 5 181208 1811949179 0130821 MW-19C 5 1812 1812353637 -0353637 MW-20D 5 181196 1811924735 0035265 MW-30D 5 181188 1811949179 -0069179 MW-20E 5 181155 1811924735 -0374735 MW-16M 5 181133 1811653909 -0323909 MW-13M 5 181117 1811940971 -0770971 MW-30E 5 181115 1811949179 -0799179 MW-11M 5 181097 1814139713 -3169713 MW-17D 5 180923 1808958032 0271968
Sheet 2 of 3
Table 61 Water Level Calibration Statistics
Garvey Elevator Site Hastings Nebraska
Name Layer
Target Water Level Elevation - Sept 2011
(feet amsl) Model
Water Level Error
Residual MW-20C 5 180892 1811924735 -3004735 MW-45D 5 180884 1809292039 -0452039 MW-12D 5 180575 1805738454 0011546 MW-18D 5 180413 1804194578 -0064578 MW-104D 5 180137 1801272389 0097611 MW-104C 5 180135 1801269033 0080967 MW-46D1 5 179796 1797768438 0191562 MW-105D 5 179794 1797798970 014103 MW-46D2 5 179792 1797771831 0148169 MW-105C 5 179791 1797803499 0106501 MW-41D2 5 179702 1797046783 -0026783 MW-41D1 5 179697 1797044368 -0074368 MW-106C 5 178531 1785334635 -0024635 MW-106D 5 178527 1785320367 -0050367 MW-43D 5 178387 1783880124 -0010124 MW-43E 5 178386 1783888909 -0028909 MW-42D 5 178183 1781770173 0059827 MW-42E 5 178182 1781753639 0066361 MW-44D 5 177409 1774079493 0010507 MW-44E 5 177407 1774078775 -0008775
Residual Mean 0046933 Res Std Dev 0743461 Sum of Squares 6048817
RMS Error 0744941 Min Residual -3169713 Max Residual 1942196
Number of Observations 109 Range in Observations 4362
Scaled Std Dev 0017044 Scaled Abs Mean 0010505
Scaled RMS 0017078 Notes
amsl - above mean sea level
Sheet 3 of 3
Table 71 Groundwater Data Summary Projected Durations to Meet MCLs
Garvey Elevator Site Hastings Nebraska
Well Data Collection Range TCE Concentration μgL Estimated Date to
Reach MCLs Duration from June 2012 yrsHigh Low
MW-3A May 1997 - March 2012 20000 11 already achieved NA MW-3B May 1997 - March 2012 23000 74 Nov 2045 33 MW-3D April 1997 - March 2012 5 05 already achieved NA MW-3E April 1997 - March 2012 4 05 already achieved NA MW-4A May 1997 - March 2012 18000 43 Sept 2013 1 MW-4B May 1997 - March 2012 29000 690 Dec 2042 30 MW-5A May 1997 - March 2012 24000 47 already achieved NA MW-5B May 1997 - March 2012 15000 12 Jan 2017 5 MW-5D April 1997 - March 2012 4 05 already achieved NA MW-13C May 1997 - March 2012 18000 28 Nov 2061 49 MW-13E May 1997 - March 2012 5 05 already achieved NA
RW-1 1999 - 2011 490 10 May 2016 4 RW-2 1999 - 2011 3200 5 Nov 2021 9 RW-3 1999 - 2011 3800 5 Feb 2024 12 RW-4 1997 - 2011 5500 5 June 2016 4 RW-5 1999 - 2011 5500 5 achieved NA RW-6 1999 - 2011 590 10 Oct 2018 6 RW-7 1995 - 2011 1000 5 Jan 2025 13 RW-8 1998 - 2011 380 5 March 2047 35
Notes
Dates and concentration data are from the site database projections to reach MCLs are based on curves fitted to data plots as provided by Dr Brian
Zurbuchen via email on June 11 2012
μgL - micrograms per liter
Sheet 1 of 1
Table 72 Remedial Alternatives Summary
Garvey Elevator Site Hastings Nebraska
Remedial Alternative Assumptions Remediation
Times Notes
OU 1
SG-1-No Action All extraction wells off 30 years
This scenario was not explicity modeled Based on the remedition duration predicted for SG2 remediation time will be greater than 30 years However for cost estimating purposes a 30-year duration will be used
SG2-- Maintain and Operate Existing GET System
No treatment of downgradient plume
30 years This scenario was not explicity modeled but remediation time was estimated based on contaminant concentration trends (see Table 71)
SG3--In Situ Treatment Via Groundwater Amendments
Area within gt500 ugL set to 00 on-site treatment system shut off
15 years Remediation time estimates are for OU1 (on-site) plume using multiple injection treatments and existing GET system shut off
SG4-- Maintain and Operate Existing GET System and Treatment Via Groundwater Amendments
Pump and treat system operating groundwater within concentrations gt500 ugL set to 00
10 years Remediation time estimates are for OU1 (on-site) plume using multiple injection treatments and existing GET system operating
OU 2
G1-No Action Pump and treat system operating no treatment of downgradient plume
30 years This scenario was not explicity modeled For cost estimating purposes a 30-year duration will be used
G2-Groundwater Recovery Treatment and Discharge at Leading Edge of Plume
On-site pump and treat system operating
100 years Based upon modeling results for more active remedies the remediation times for both the OU 1 and OU 2 plumes would exceed 100 years This scenario was not explicity modeled
G3a-Groundwater Recovery Treatment and Discharge at mid point and Leading Edge of Plume
On-site pump and treat system operating
75 years
Modeled duration ranges from 75 to 90 years
G3b-Groundwater Recovery Treatment and Discharge at two transects and Leading Edge of Plume
On-site pump and treat system operating
53 years
G4a-In Situ treatment at midpoint of plume and Groundwater Recovery Treatment and Discharge at leading edge of plume
On-site pump and treat system operating
75 years
Same as G3 but a treatment zone replaces the recovery wells near the midpoint of the plume Modeled duration ranges from 75 to 90 years
G4b-In Situ treatment at two transects near core of plume and Groundwater Recovery Treatment and Discharge at leading edge of plume
On-site pump and treat system operating
56 years Same as G3 but two treatment zones replace the recovery wells near the midpoint of the plume
Notes
μgL - micrograms per liter
Sheet 1 of 1
This page was intentionally left blank
ATTACHMENT 2 FIGURES
Figure 31 Carbon Tetrachloride Isoconcentrations Upper Aquifer Zone AB Figure 32 Carbon Tetrachloride Isoconcentrations Medial Aquifer Zone C Figure 33 Carbon Tetrachloride Isoconcentrations Lower Aquifer Zone DE
Figure 51 Model Domain and Boundary Conditions Figure 52 Vertical Discretization of Model Figure 53 Elevation of the Model Base Figure 54 Elevation of the Top of the Lower Aquifer Figure 55 Isopach Map of the Lower Confining Unit Figure 56 Elevation of the Base of the Medial Aquifer Figure 57 Isopach of Upper Aquifer Figure 58 Elevation of the Base of the Upper Aquifer Figure 59 Location of Recovery Wells in the Shallow Aquifer Figure 510 Location of Recovery Wells in the Medial Aquifer Figure 511 Location of Injection and Municipal Wells in the Lower Aquifer Figure 512 Initial Concentrations of Carbon Tetrachloride in the Shallow Aquifer Figure 513 Initial Concentrations of Carbon Tetrachloride in the Medial Aquifer Figure 514 Initial Concentrations of Carbon Tetrachloride in the Lower Aquifer
Figure 61 Error Residuals Versus Measured Water Levels Figure 62 Measured Water Levels Versus Predicted Water Level Elevations Figure 63 Error Residuals for the Shallow Aquifer in the Vicinity of the Garvey Elevator
Site Figure 64 Error Residuals for the Shallow Aquifer over the Model Domain Figure 65 Error Residuals for the Medial Aquifer over the Model Domain Figure 66 Error Residuals for the Lower Aquifer in the Vicinity of the Garvey Elevator
Site Figure 67 Error Residuals for the Lower Aquifer over the Entire Model Domain Figure 68 Calibrated Hydraulic Conductivities of the Shallow Aquifer Figure 69 Calibrated Hydraulic Conductivities of the Medial Aquifer Figure 610 Calibrated Hydraulic Conductivities of the Lower Aquifer Figure 611 Calibrated Hydraulic Conductivities of the Upper Aquitard Figure 612 Calibrated Hydraulic Conductivities of the Lower Aquitard Figure 613 Calibrated Potentiometric Surface of the Shallow Aquifer Figure 614 Calibrated Potentiometric Surface of the Medial Aquifer Figure 615 Calibrated Potentiometric Surface of the Lower Aquifer Figure 616 Particle Tracking Analysis to Estimate Travel Time
Figure 71 Initial Concentrations for Alternative SG3 Figure 72 Capture Zone Analysis in the Shallow Aquifer for Alternative SG3 Figure 73 Capture Zone Analysis in the Medial Aquifer for Alternative SG3 Figure 74 Alternative G2 ndash Proposed Recovery Wells Medial Aquifer
ATTACHMENT 2 FIGURES (continued)
Figure 75 Alternative G2 ndash Proposed Recovery Wells Lower Aquifer Figure 76 Preliminary Locations for Leading Edge Recovery Wells and Groundwater
Treatment Building ndash Alternative G2 Figure 77 Alternative G3ab ndash Proposed Recovery Wells Medial Aquifer Figure 78 Alternative G3a ndash Proposed Recovery Wells Lower Aquifer Figure 79 Preliminary Locations for Mid-Plume and Leading Edge Recovery Wells and
Groundwater Treatment BuildingmdashAlternative G3 Figure 710 Alternative G3b ndash Proposed Recovery Wells Lower Aquifer Figure 711 Alternative G3b ndash Relative Positions of Proposed Recovery Wells Medial and
Lower Aquifer Figure 712 Alternative G4a ndash Proposed Treatment Curtain and Recovery Wells Lower
Aquifer Figure 713 Preliminary Locations for Mid-Plume Injection Wells Leading Edge Recovery
Wells and Groundwater Treatment Building ndash Alternative G4 Figure 714 Alternative G4b ndash Proposed Treatment Curtains and Recovery Wells Lower
Aquifer Figure 715 Alternative G4b ndash Relative Positions of Proposed Recovery Wells and
Treatment Curtains
5
5
5
5
5
50
100 500
MW-6A SB-39 HGLmdashGroundwater Flow Modeling Technical MemorandumMW-2AHTW 40 (98)(ND)MW-8A MW47B ( Garvey Elevator SitemdashHastings NE(ND)
(59) SB-38
MW-19APSUS PU PPPUUU ( Figure 31 (70)MW-33 MW-3AB
Carbon Tetrachloride in the(ND53) MW49B MW-20A
+UP+UPPPP+U+U+UPPPPUUUU+UP+UPPPP+U+U+U(43) Upper Aquifer Zone AB(10)
MW-1A PU MW50B(ND) +UP+UPPPP+U+U+U September 2011 Sampling(84)
PPUUMW-4AB PPUU MW-13CE +++++UPUPPPPUUU (21640)
MW-30A (160)+UP+UPPPP+U+U+U LegendPPPUUU
1000 MW51B (1200) MW-5AB
(4119J)
Garvey Property BoundaryMW-7AB MW-31A (ND) (75) (
PPUU MW48B RailroadSB-33 (680)
Inset Ntilde Monitoring Well Location MW-47B MW-10A
(59) (ND) Multilevel Well MW-9A MW-6AHTW 40 MW-10B(ND) (98)
(ND) MW-11A S Hydraulic Conductivity
MW-33 UPPUMW-2A MW-19AU MW-14A(ND) P
(70) PU (ND) A West Highway 6 amp Highway 281 Site MW-12A AMW-106AMW-20A MW-104AMW-3A MW-8A (ND) Monitoring WellU UUU (ND)PSSU P PPP (10)(ND) (ND)(ND) U
UUUUU PUUUUP PPPPPPPPPPPPPPPPPPPPPPPUUUUPUPPPPUUUUU MW-13CE
UUUU Carbon Tetrachloride ConcentrationMW-3B MW-105A A (190)PPP A (ND)
UUUUUUUUU(53) MW-30A in micrograms per liter (microgL)PPUUPPPUUUPPPPPUUUUU
MW-12DMW-1A (160) MW-42 DEMW-45CD(ND)
MW-50B MW-49B MW-51B Carbon Tetrachloride Isoconcentration(84) PPUUPPUU(43)
PPUU(1200)
Contour (microgL)PPPUUU PPPUUUMW-46 D1D2MW-7B (5)(ND)
(Dashed Lines are Estimated)MW-7A (ND)
MW-5A (41)
MW-4A (21) MW-4B (640)
MW-48B (680)
MW-17A (ND)
MW-16A (ND) UUPP
MW-18A (ND)
MW-41 D1D2 UUPP
MW-44 DE UUPP
MW-5B
MW-31A (75)
(19)
MW-43 DE UUPP Notes
(ND) Nondetect
0 2500 5000
Feet sup3 Filename XEPA009GarveyGW_Flow_Tech_Memo Carbon_TetChl_UpperAquifer_ABmxd Project EP903401220202 Revised 061312 ST Source ENSR GDB 2008 DNR
100
5
100
SB-39MW-6AHTW 40 HGLmdashGroundwater Flow Modeling Technical Memorandum MW47C SB-38MW-33 MW-2A (62) ( Garvey Elevator SitemdashHastings NE
UUUPSUS P PPP (
U
Figure 32MW-8A MW-3ABDE MW-19C (ND) Carbon Tetrachloride in the
MW-1A +++++PPPP UPUPPPPUUUUUUU
+UP+UPPPP+U+U+U Medial Aquifer Zone CPU MW-20C +UP+UPPPP+U+U+U (ND) September 2011 SamplingMW49C
UU(ND) PPUU +++++PPPPPPPUUUUU MW50C
(ND) +UP+UPPPP+U+U+UPPPUUU LegendMW-13C
MW-4AB (130) MW-30C
MW-5AB (ND) MW48C MW51C
(ND) (ND) Garvey Property Boundary SB-33 (
MW-7AB PPUU MW-31C (ND) Railroad
Inset Ntilde Monitoring Well Location MW-47CMW-9A MW-10AB Multilevel Well(62)
HTW 40
MW-6A S Hydraulic Conductivity WellMW-11AMW-33 PPUUMW-2A
MW-19CUP (ND) P West Highway 6 amp Highway 281 SiteU MW-14A A A Monitoring WellMW-20C MW-12C MW-106CMW-104CPSS P PPP
U (ND) (ND) (90) (ND)
MW-8A MW-13C U U UUU
PMW-3ABDE PPPPPPPPUUUUPU (130) Carbon Tetrachloride ConcentrationPU UUUU UUUUUUUUUU
MW-105C A (190)MW-1A UUUUUUUUUPPPPPPPPPPPPPPPPPPP MW-30C PPPUUU MW-12D A (200) in micrograms per liter (microgL)
MW-49C UUUUPUPPPPUUPU (ND) UPPU Old Rolls MW-42 DEPP (13)(ND) Carbon Tetrachloride Isoconcentration MW-45C MW-50C (ND)
MW-51C (ND) PPUU PPUU PPUU (5) Contour (microgL)(ND)
UUU PPP MW-46 D1D2
PPP UUUMW-48C (Dashed Lines are Estimated)5MW-7AB (ND)
MW-4AB MW-17C MW-18C(ND) MW-44 DE Domestic Irrigation W ater Wells(81)MW-5AB
PPUUMW-31C MW-16C (ND)
PPUU(ND) MW-41 D1D2
PPUU
Notes MW-43 DE PPUU
(ND) Nondetect
0 2500 5000
Feet sup3 FilenameXEPA009GarveyGW_Flow_Tech_Memo Carbon_TetChl_Medial_Aquifer_Cmxd Project EP903401220202 Revised 061312 ST Source ENSR GDB 2008 DNR
50
5
5
50 100
MW-6D SB-39 HGLmdashGroundwater Flow Modeling Technical MemorandumHTW 40 (ND) SB-38MW-3DE ( Garvey Elevator SitemdashHastings NE (NDND)
UUUUPSUS P PPP MW-19AC( Figure 33MW-2A MW-33 MW47D
U (ND)
Carbon Tetrachloride in theMW-8A PPPPUUUU P Lower Aquifer Zone DEUMW-1A MW-20DEPU P
(NDND)UPUU
September 2011 Sampling MW-13EPPUUPPPU (ND)
MW50D UPMW49D (ND) UUU(ND) PPP MW-30DE Legend MW51D (ND)
(ND)MW-4AB MW48D (ND)
MW-7AB MW-5D (ND) Garvey Property Boundary
MW-31C (ND)
PPUU
(
RailroadSB-33MW-3DE (NDND)
Inset Ntilde Monitoring Well Location MW-47D
MW-9A (ND) Multilevel Well HTW 40
MW-6D MW-10AB (ND)
MW-11A S Hydraulic Conductivity Well MW-33 MW-2A UPPU
PUMW-19AC West Highway 6 amp Highway 281 Site MW-14A APU
MW-20DE MW-106D A Monitoring WellMW-104DPSSU PU PPPUUU (NDND)
MW-12C (ND)(ND)MW-8A MW-13E PU
UUUUU (ND) Carbon Tetrachloride ConcentrationU PPPPPPPPUUUUPU (190)PPUUU
PPUPPPPPPPPPPPPPPPUUUUUP
UUUUU UUUUUUU PPP A MW-105DMW-1A in micrograms per liter (microgL) AMW-30DE
PPUUPPPUUUPPPPPUUUUU(52)
(NDND) MW-12DNew RollsMW-49D (ND) (ND)
Carbon Tetrachloride Isoconcentration(ND) MW-45D PPUUMW-51D (ND)
MW-46 D1PPUU PPUU Contour (microgL)MW-50D (ND) (5)(ND)
PPPUUU (770)PPPUUU MW-42 DMW-48D (Dashed Lines are Estimated)MW-4AB (4274)(ND)
MW-44DEMW-46 D2 MW-17D (320) (19ND)MW-7AB
MW-5D Domestic Irrigation W ater Wells(94) MW-18D PPUUMW-31C(ND) (21) MW-41 D1MW-5B MW-16C PPUU (ND)
PPUUMW-41 D2 (10) Notes
MW-43DE UUPP(ND18) (ND) Nondetect
0 2500 5000
Feet sup3 Filename XEPA009GarveyGW_Flow_Tech_Memo Carbon_TetChl_LoweR_Aquifer_Dmxd Project EP903401220202 Revised 061312 ST Source ENSR GDB 2008 DNR
_L _j I I I I _j_ I I I
I l --- I 111
1
__u_ I I
1 I ~ N ----y-
+ ~ I
II L _l e11111111111 I ---1 ~lJJ I n r Igt I Constant Head Boundariesj l _Q No Flow Sound aries I I l
~ r-- I - I middot r-
- fl+- L -
0 I J ~r-
Ll-D l Garvey Site I - ~t
Ill -J
l unJprm Spacing 25 eet U~iform S pacing 1 00 feet I Constant Head Boundaries
j
middotmiddot- ~ No Flow Sound aries
J
--=J--=11-~=======2~-----~3=========4~------5 M1les 0 05
Figure 51 Model Domain Gridding and Boundaries
Figure 52 Vertical Discretization of Model
1610
1620
1 6 2 0
1630
1 6 3 0
1640
1 6 4 0
1650
1 6 5 0
1660
1660
1670
1670
1680
1680
1690
17
1698
17013
16918
169198
169118
165864
167129
168901
169482
169872
169403
169347
169374
169448
Figure 53 Elevation of the Model Base (weathered shale of the Niobrara Formation)
1111
I I
-
N
+ 0 05
I I
I 1 l
I
1 l -
2 3 4 Miles
Figure 54 Elevation of the Top of the Lower Aquifer
Figure 55 Isopach Map of Lower Confining Unit (model Layer 4)
Figure 56 Elevation of the Base of the Medial Aquifer
Figure 57 Isopach of Upper Aquitard (model layer 2)
Figure 58 Elevation of the Base of the Upper Aquifer
I I I
~ ~ t--7 t bull I I I
r I l
I EW-01 f1-m I N I bull __ j
+ twtrl I I I rl bull I I I I J I I I -r-----
- middot-- - -- -- middot------__J_--
I --- 1 Feet I 0 500 1 000 2000 3000 4000 rooo I I I I
Figure 59 Location of Recovery Wells in the Shallow Aquifer
_l ________ l I I I -1 middot ] l ~----------middotj + I j
middotmiddot= middotmiddot- ---------L -- ---- ___ _ [_ __
r--------shy1
o--~oomiddoto~bull1~oo=o ======4~oomiddoto------middot~ooco=======43oobullo -------~oo~1
Figure 510 Location of Recovery Wells in the Medial Aquifer
I I r
~~ r -
L - - - -- -1--ltmiddot --I-
I -
---- L f+r
il I
J ---1
I
N
+
Figure 511 Location of Injection and Municipal Wells in the Lower Aquifer
Figure 512 Initial Concentrations of Carbon Tetrachloride in the Shallow Aquifer
Figure 513 Initial Concentrations of Carbon Tetrachloride in the Medial Aquifer
Figure 514 Initial Concentrations of Carbon Tetrachloride in the Lower Aquifer
-40
-30
-20
-10
00
10
20
30
40
17741 17828 17915 18002 18090 18177
Res
idua
l
Layer 1
Layer 3
Layer 5
Observed Value
Figure 61 Error Residuals Versus Measured Water Levels
Layer 1
Layer 3
18090
18177
Layer 5
Mod
el V
alue
17741 17828 17915 18002 18090 18177
18002
17915
17828
17741
Observed Value
Figure 62 Measured Water Levels Versus Predicted Water Levels
bull -020
N
+ 0
h I I
-----------~----j_ _______ ___ j_94-__ _ __ I ------------- t
011
bull 005
05
bull
I
Mile 1
Figure 63 Error Residuals for the Shallow Aquifer in the vicinity of the Garvey Elevator Site
Figure 64 Error Residuals for the Shallow Aquifer Over the Model Domain
-007 bull
N
+
il _ __ ~ II
t079 i
I 1 II_ --middot--middot- J_~=====-middot 1------~
~--1 000 r-----middot- -middotmiddot ____
-021 bull
-012 007 bull bull
l middot l02
I ~~~~====~---====~---Feet _ o ___ _ $-_~_0 _ ___ _ J000 _____ 3QQ_Q_ ---4lIJOLUlJ00----ltgt5ultOOO-- middott- middot ----
I
Figure 65 Error Residuals for the Medial Aquifer Over the Model Domain
0 250
N
+
044 bullbull -042
000 bull
027 bull
013
-)35 bull
Figure 66 Error Residuals for the Lower Aquifer in the Vicinity of the Garvey Elevator Site
Figure 67 Error Residuals for the Lower Aquifer in the Entire Model Domain
Figure 68 Calibrated Hydraulic Conductivities of the Shallow Aquifer (ftd) (model layer 1)
Figure 69 Calibrated Hydraulic Conductivities of the Medial Aquifer (ftd) (model layer 3)
Figure 610 Calibrated Hydraulic Conductivities of the Lower Aquifer (ftd) (model layer 5)
Figure 611 Calibrated Hydraulic Conductivities of the Upper Aquitard (ftd) (model layer 2)
Figure 612 Calibrated Hydraulic Conductivities of the Lower Aquitard (ftd) (model layer 4)
Figure 613 Calibrated Potentiometric Surface of the Shallow Aquifer (model layer 1)
Figure 614 Calibrated Potentiometric Surface of the Medial Aquifer (model layer 3)
Figure 615 Calibrated Potentiometric Surface of the Lower Aquifer (model layer 5)
Figure 616 Particle Tracking Analysis to Estimate Travel Time
Figure 71 Initial Concentrations for Alternative SG3
E3 E3 2000feet
Figure 72 Capture Zone Analysis in the Shallow Aquifer for Alternative SG3
E3 E3 E3 2000feet
Figure 73 Capture Zone Analysis in the Medial Aquifer for Alternative SG3
Figure 74 Alternative G2-Proposed Recovery Wells Medial Aquifer
Figure 75 Alternative G2- Proposed Recovery Wells Lower Aquifer
50
5 5
5
50 100
MW-3DE (NDND)
MW-47D MW-9A (ND)
HTW 40 MW-6D MW-10AB
(ND) MW-11A
MW-2AMW-33 UPPUPU
MW-19AC MW-14A APUMW-20DE MW-106DMW-104D(NDND) MW-12CPSSU (ND)PU PPPUUU PU (ND) MW-13E
HGLmdashGroundwater Flow Modeling Technical Memorandum Garvey Elevator Superfund SitemdashHastings NE
Figure 76 Preliminary Locations for Leading
Edge Recovery Wells and Groundwater Treatment Building-Alternative G2
Legend Garvey Property Boundary
Railroad
Ntilde Monitoring Well Location
Multilevel Well
S Hydraulic Conductivity Well
A West Highway 6 amp Highway 281 Site Monitoring Well
(190) Carbon Tetrachloride Concentration in micrograms per liter (microgL)
Carbon Tetrachloride Isoconcentration Treatment Building
Technical Blvd
MW-8A UUUU UUUUU
U PPPPPPPPUUUUPU UUUUUUPUP
UUUUUPPPPPPPPPPPPPPPPPP (ND)
PPPUUU A MW-105DMW-1A UU AMW-30DE PPUUPPPUUUPPPPPUUUUU
(52)(NDND) MW-12DNew Rolls Contour (Lower Aquifer) (microgL)MW-49D (5)(ND) (ND)
(ND) MW-45D (Dashed Lines are Estimated)PPUUMW-51D (ND) MW-46 D1PPUU PPUUMW-50D
(ND) (ND)
PPPUUU (770)PPPUUU MW-42 DMW-48D Domestic Irrigation W ater WellsMW-4AB (4274) MW-44DE(ND)
(19ND)MW-46 D2 MW-17D (320)MW-7AB Carbon Tetrachloride Isoconcentration(94)MW-5D
MW-18D PPUU (5) Contour (Upper Aquifer) (microgL)(21) MW-41 D1 MW-31C(ND)
MW-5B MW-16C PPUU (Dashed Lines are Estimated)(ND)
PPUUIdlewilde Rd
MW-41 D2 Recovery Wells (Medial)
Recovery Wells (Deep)
(10)
MW-43DE PPUU(ND18)
Recovery Well Piping
Treatment Building
Notes (ND) Nondetect
Blaine A
ve
Showboa t B
lvd
sup3 Filename XEPA009GarveyGW_Flow_Tech_Memo Carbon_TetChl_LoweR_Aquifer_Dmxd Project EP903401220202 Revised 061312 ST2500 5000 Source ENSR GDB 2008 DNR
Feet
0
Figure 77 Alternative G3ab-Proposed Recovery Wells Medial Aquifer
Figure 78 Alternative G3a- Proposed Recovery Wells Lower Aquifer
50
5 5
5
50 100
HGLmdashGroundwater Flow Modeling Technical Memorandum Garvey Elevator Superfund SitemdashHastings NE
Figure 79 Preliminary Locations for Mid-Plume and
Leading Edge Recovery Wells and Groundwater Treatment Building-Alternative G3
Legend Garvey Property Boundary
Railroad
Ntilde Monitoring Well Location MW-3DE (NDND)
Multilevel Well MW-47D
MW-9A (ND) Hydraulic Conductivity WellSHTW 40 MW-6D MW-10AB
(ND) West Highway 6 amp Highway 281 SiteMW-11A
MW-33 PPUUMW-2A PUA Monitoring Well
MW-19AC MW-14A APUCarbon Tetrachloride Concentration
Technical Blvd
MW-44DE (19ND) (Dashed Lines are Estimated)
MW-20DE (190)MW-106DPSSU PU PPPUUU MW-104DMW-12C(NDND) (ND)PU in micrograms per liter (microgL)(ND) MW-13EMW-8A
U UUUU UPUPPPPUUUUUUUUP UUUUU UUUPPPPPPPPPPPPPPPPPPPPPPPUUUUUU
(ND) PPPUUU A Treatment BuildingMW-105DMW-1A Carbon Tetrachloride IsoconcentrationMW-30DE A
PPUUPPPUUUPPPPPUUUUU(52)
(NDND) MW-12DNew Rolls Contour (Lower Aquifer) (microgL)MW-49D (5)(ND) (ND)(ND) MW-45D
MW-51D PPUU(ND)
PPUU PPUUMW-50D (ND)
MW-46 D1(ND) PPPUUU (770)
PPPUUU MW-42 D (4274)
MW-48D Domestic Irrigation W ater WellsMW-4AB (ND) MW-46 D2
MW-17DMW-7AB (320)(94) Carbon Tetrachloride IsoconcentrationMW-5D
MW-18D(ND) MW-31C (21) PPMW-41 D1
UU (5) Contour (Upper Aquifer) (microgL)MW-5B MW-16C UU (ND)PP (Dashed Lines are Estimated)PPUUIdlewilde Rd
MW-41 D2 Recovery Wells (Medial)(10)
MW-43DE UUPP(ND18) Recovery Wells (Deep)
Recovery Well Piping
Treatment Building
Notes (ND) Nondetect
Blaine A
ve
Showboa t B
lvd
sup3 Filename XEPA009GarveyGW_Flow_Tech_Memo Mid-Plume_Prelim_Loc Project EP903401220202 Revised 061312 RL2500 5000 Source ENSR GDB 2008 DNR
Feet
0
Figure 710 Alternative G3b-Proposed Recovery Wells Lower Aquifer
Figure 711 Alternative G3b-Relative Positions of Proposed Recovery Wells Medial and Lower Aquifers
Figure 712 Alternative G4a-Proposed Treatment Curtain and Recovery Wells Lower Aquifer
50
5 5
5
50 100
HGLmdashGroundwater Flow Modeling Technical Memorandum Garvey Elevator Superfund SitemdashHastings NE
Figure 713 Preliminary Locations for Mid-Plume
Injection Wells Leading Edge Recovery Wells and Groundwater Treatment Building
-Alternative G4
Legend Garvey Property Boundary
Railroad
Ntilde Monitoring Well Location MW-3DE (NDND)
MW-47D MW-9A (ND)
HTW 40 MW-6D MW-10AB
(ND)
S Elm
Ave
S Wabash A
ve
Multilevel Well
S Hydraulic Conductivity Well
A West Highway 6 amp Highway 281 Site Monitoring Well
MW-11AMW-33 UPPUMW-2A PU
MW-19AC MW-14A APUMW-20DE MW-106D Carbon Tetrachloride ConcentrationPU PPPUUU (190)PSSU MW-104D(NDND) MW-12C (ND)PU in micrograms per liter (microgL)(ND)
Treatment Building Technical B
lvd MW-13EMW-8A
UUUU UUUUUU PPPPPPPPUUUUPU UUUUU
UPUP
UUUUUPPPPPPPPPPPPPPPPPP (ND)
PPPUUU A MW-105DMW-1A UU Carbon Tetrachloride IsoconcentrationAMW-30DE PPUUPPPUUUPPPPPUUUUU
(52)(NDND) MW-12DNew Rolls Contour (Lower Aquifer) (microgL)MW-49D (5)(ND) (ND)
(ND) MW-45D (Dashed Lines are Estimated)PPUUMW-51D (ND) MW-46 D1PPUU PPUUMW-50D
(ND) (ND)
PPPUUU (770)PPPUUU MW-42 DMW-48D Domestic Irrigation W ater WellsMW-4AB (4274)(ND) MW-44DEMW-46 D2
(19ND)MW-17D (320)MW-7AB Carbon Tetrachloride Isoconcentration(94)MW-5D MW-18D PPUU (5) Contour (Upper Aquifer) (microgL)(21) MW-41 D1
MW-31C(ND) MW-5B MW-16C PPUU (Dashed Lines are Estimated)(ND)
PPUUIdlewilde Rd
MW-41 D2 Recovery Wells (Medial)
Recovery Wells (Deep)
(10) Injection Area 1 MW-43DE PPUUPermanent Injection Well Spacing 40 ft (ND18)
Total Injection Wells Installed 39 Recovery Well Piping Injection Area (40 ft spacing between the wells) Treatment Building
Notes (ND) Nondetect
Blaine A
ve
Showboa t B
lvd
S Baltim
ore Ave
sup3 Filename XEPA009GarveyGW_Flow_Tech_Memo G4_Prelim_Loc_Inj_Areamxd Project EP903401220202 Revised 061312 RL2500 5000 Source ENSR GDB 2008 DNR
Feet
0
Figure 714 Alternative G4b-Proposed Treatment Curtains and Recovery Wells Lower Aquifer
Figure 715 Alternative G4b-Relative Positions of Proposed Recovery Wells and Treatment Curtains

Table 61 Water Level Calibration Statistics
Garvey Elevator Site Hastings Nebraska
Name Layer
Target Water Level Elevation - Sept 2011
(feet amsl) Model
Water Level Error
Residual MW-20C 5 180892 1811924735 -3004735 MW-45D 5 180884 1809292039 -0452039 MW-12D 5 180575 1805738454 0011546 MW-18D 5 180413 1804194578 -0064578 MW-104D 5 180137 1801272389 0097611 MW-104C 5 180135 1801269033 0080967 MW-46D1 5 179796 1797768438 0191562 MW-105D 5 179794 1797798970 014103 MW-46D2 5 179792 1797771831 0148169 MW-105C 5 179791 1797803499 0106501 MW-41D2 5 179702 1797046783 -0026783 MW-41D1 5 179697 1797044368 -0074368 MW-106C 5 178531 1785334635 -0024635 MW-106D 5 178527 1785320367 -0050367 MW-43D 5 178387 1783880124 -0010124 MW-43E 5 178386 1783888909 -0028909 MW-42D 5 178183 1781770173 0059827 MW-42E 5 178182 1781753639 0066361 MW-44D 5 177409 1774079493 0010507 MW-44E 5 177407 1774078775 -0008775
Residual Mean 0046933 Res Std Dev 0743461 Sum of Squares 6048817
RMS Error 0744941 Min Residual -3169713 Max Residual 1942196
Number of Observations 109 Range in Observations 4362
Scaled Std Dev 0017044 Scaled Abs Mean 0010505
Scaled RMS 0017078 Notes
amsl - above mean sea level
Sheet 3 of 3
Table 71 Groundwater Data Summary Projected Durations to Meet MCLs
Garvey Elevator Site Hastings Nebraska
Well Data Collection Range TCE Concentration μgL Estimated Date to
Reach MCLs Duration from June 2012 yrsHigh Low
MW-3A May 1997 - March 2012 20000 11 already achieved NA MW-3B May 1997 - March 2012 23000 74 Nov 2045 33 MW-3D April 1997 - March 2012 5 05 already achieved NA MW-3E April 1997 - March 2012 4 05 already achieved NA MW-4A May 1997 - March 2012 18000 43 Sept 2013 1 MW-4B May 1997 - March 2012 29000 690 Dec 2042 30 MW-5A May 1997 - March 2012 24000 47 already achieved NA MW-5B May 1997 - March 2012 15000 12 Jan 2017 5 MW-5D April 1997 - March 2012 4 05 already achieved NA MW-13C May 1997 - March 2012 18000 28 Nov 2061 49 MW-13E May 1997 - March 2012 5 05 already achieved NA
RW-1 1999 - 2011 490 10 May 2016 4 RW-2 1999 - 2011 3200 5 Nov 2021 9 RW-3 1999 - 2011 3800 5 Feb 2024 12 RW-4 1997 - 2011 5500 5 June 2016 4 RW-5 1999 - 2011 5500 5 achieved NA RW-6 1999 - 2011 590 10 Oct 2018 6 RW-7 1995 - 2011 1000 5 Jan 2025 13 RW-8 1998 - 2011 380 5 March 2047 35
Notes
Dates and concentration data are from the site database projections to reach MCLs are based on curves fitted to data plots as provided by Dr Brian
Zurbuchen via email on June 11 2012
μgL - micrograms per liter
Sheet 1 of 1
Table 72 Remedial Alternatives Summary
Garvey Elevator Site Hastings Nebraska
Remedial Alternative Assumptions Remediation
Times Notes
OU 1
SG-1-No Action All extraction wells off 30 years
This scenario was not explicity modeled Based on the remedition duration predicted for SG2 remediation time will be greater than 30 years However for cost estimating purposes a 30-year duration will be used
SG2-- Maintain and Operate Existing GET System
No treatment of downgradient plume
30 years This scenario was not explicity modeled but remediation time was estimated based on contaminant concentration trends (see Table 71)
SG3--In Situ Treatment Via Groundwater Amendments
Area within gt500 ugL set to 00 on-site treatment system shut off
15 years Remediation time estimates are for OU1 (on-site) plume using multiple injection treatments and existing GET system shut off
SG4-- Maintain and Operate Existing GET System and Treatment Via Groundwater Amendments
Pump and treat system operating groundwater within concentrations gt500 ugL set to 00
10 years Remediation time estimates are for OU1 (on-site) plume using multiple injection treatments and existing GET system operating
OU 2
G1-No Action Pump and treat system operating no treatment of downgradient plume
30 years This scenario was not explicity modeled For cost estimating purposes a 30-year duration will be used
G2-Groundwater Recovery Treatment and Discharge at Leading Edge of Plume
On-site pump and treat system operating
100 years Based upon modeling results for more active remedies the remediation times for both the OU 1 and OU 2 plumes would exceed 100 years This scenario was not explicity modeled
G3a-Groundwater Recovery Treatment and Discharge at mid point and Leading Edge of Plume
On-site pump and treat system operating
75 years
Modeled duration ranges from 75 to 90 years
G3b-Groundwater Recovery Treatment and Discharge at two transects and Leading Edge of Plume
On-site pump and treat system operating
53 years
G4a-In Situ treatment at midpoint of plume and Groundwater Recovery Treatment and Discharge at leading edge of plume
On-site pump and treat system operating
75 years
Same as G3 but a treatment zone replaces the recovery wells near the midpoint of the plume Modeled duration ranges from 75 to 90 years
G4b-In Situ treatment at two transects near core of plume and Groundwater Recovery Treatment and Discharge at leading edge of plume
On-site pump and treat system operating
56 years Same as G3 but two treatment zones replace the recovery wells near the midpoint of the plume
Notes
μgL - micrograms per liter
Sheet 1 of 1
This page was intentionally left blank
ATTACHMENT 2 FIGURES
Figure 31 Carbon Tetrachloride Isoconcentrations Upper Aquifer Zone AB Figure 32 Carbon Tetrachloride Isoconcentrations Medial Aquifer Zone C Figure 33 Carbon Tetrachloride Isoconcentrations Lower Aquifer Zone DE
Figure 51 Model Domain and Boundary Conditions Figure 52 Vertical Discretization of Model Figure 53 Elevation of the Model Base Figure 54 Elevation of the Top of the Lower Aquifer Figure 55 Isopach Map of the Lower Confining Unit Figure 56 Elevation of the Base of the Medial Aquifer Figure 57 Isopach of Upper Aquifer Figure 58 Elevation of the Base of the Upper Aquifer Figure 59 Location of Recovery Wells in the Shallow Aquifer Figure 510 Location of Recovery Wells in the Medial Aquifer Figure 511 Location of Injection and Municipal Wells in the Lower Aquifer Figure 512 Initial Concentrations of Carbon Tetrachloride in the Shallow Aquifer Figure 513 Initial Concentrations of Carbon Tetrachloride in the Medial Aquifer Figure 514 Initial Concentrations of Carbon Tetrachloride in the Lower Aquifer
Figure 61 Error Residuals Versus Measured Water Levels Figure 62 Measured Water Levels Versus Predicted Water Level Elevations Figure 63 Error Residuals for the Shallow Aquifer in the Vicinity of the Garvey Elevator
Site Figure 64 Error Residuals for the Shallow Aquifer over the Model Domain Figure 65 Error Residuals for the Medial Aquifer over the Model Domain Figure 66 Error Residuals for the Lower Aquifer in the Vicinity of the Garvey Elevator
Site Figure 67 Error Residuals for the Lower Aquifer over the Entire Model Domain Figure 68 Calibrated Hydraulic Conductivities of the Shallow Aquifer Figure 69 Calibrated Hydraulic Conductivities of the Medial Aquifer Figure 610 Calibrated Hydraulic Conductivities of the Lower Aquifer Figure 611 Calibrated Hydraulic Conductivities of the Upper Aquitard Figure 612 Calibrated Hydraulic Conductivities of the Lower Aquitard Figure 613 Calibrated Potentiometric Surface of the Shallow Aquifer Figure 614 Calibrated Potentiometric Surface of the Medial Aquifer Figure 615 Calibrated Potentiometric Surface of the Lower Aquifer Figure 616 Particle Tracking Analysis to Estimate Travel Time
Figure 71 Initial Concentrations for Alternative SG3 Figure 72 Capture Zone Analysis in the Shallow Aquifer for Alternative SG3 Figure 73 Capture Zone Analysis in the Medial Aquifer for Alternative SG3 Figure 74 Alternative G2 ndash Proposed Recovery Wells Medial Aquifer
ATTACHMENT 2 FIGURES (continued)
Figure 75 Alternative G2 ndash Proposed Recovery Wells Lower Aquifer Figure 76 Preliminary Locations for Leading Edge Recovery Wells and Groundwater
Treatment Building ndash Alternative G2 Figure 77 Alternative G3ab ndash Proposed Recovery Wells Medial Aquifer Figure 78 Alternative G3a ndash Proposed Recovery Wells Lower Aquifer Figure 79 Preliminary Locations for Mid-Plume and Leading Edge Recovery Wells and
Groundwater Treatment BuildingmdashAlternative G3 Figure 710 Alternative G3b ndash Proposed Recovery Wells Lower Aquifer Figure 711 Alternative G3b ndash Relative Positions of Proposed Recovery Wells Medial and
Lower Aquifer Figure 712 Alternative G4a ndash Proposed Treatment Curtain and Recovery Wells Lower
Aquifer Figure 713 Preliminary Locations for Mid-Plume Injection Wells Leading Edge Recovery
Wells and Groundwater Treatment Building ndash Alternative G4 Figure 714 Alternative G4b ndash Proposed Treatment Curtains and Recovery Wells Lower
Aquifer Figure 715 Alternative G4b ndash Relative Positions of Proposed Recovery Wells and
Treatment Curtains
5
5
5
5
5
50
100 500
MW-6A SB-39 HGLmdashGroundwater Flow Modeling Technical MemorandumMW-2AHTW 40 (98)(ND)MW-8A MW47B ( Garvey Elevator SitemdashHastings NE(ND)
(59) SB-38
MW-19APSUS PU PPPUUU ( Figure 31 (70)MW-33 MW-3AB
Carbon Tetrachloride in the(ND53) MW49B MW-20A
+UP+UPPPP+U+U+UPPPPUUUU+UP+UPPPP+U+U+U(43) Upper Aquifer Zone AB(10)
MW-1A PU MW50B(ND) +UP+UPPPP+U+U+U September 2011 Sampling(84)
PPUUMW-4AB PPUU MW-13CE +++++UPUPPPPUUU (21640)
MW-30A (160)+UP+UPPPP+U+U+U LegendPPPUUU
1000 MW51B (1200) MW-5AB
(4119J)
Garvey Property BoundaryMW-7AB MW-31A (ND) (75) (
PPUU MW48B RailroadSB-33 (680)
Inset Ntilde Monitoring Well Location MW-47B MW-10A
(59) (ND) Multilevel Well MW-9A MW-6AHTW 40 MW-10B(ND) (98)
(ND) MW-11A S Hydraulic Conductivity
MW-33 UPPUMW-2A MW-19AU MW-14A(ND) P
(70) PU (ND) A West Highway 6 amp Highway 281 Site MW-12A AMW-106AMW-20A MW-104AMW-3A MW-8A (ND) Monitoring WellU UUU (ND)PSSU P PPP (10)(ND) (ND)(ND) U
UUUUU PUUUUP PPPPPPPPPPPPPPPPPPPPPPPUUUUPUPPPPUUUUU MW-13CE
UUUU Carbon Tetrachloride ConcentrationMW-3B MW-105A A (190)PPP A (ND)
UUUUUUUUU(53) MW-30A in micrograms per liter (microgL)PPUUPPPUUUPPPPPUUUUU
MW-12DMW-1A (160) MW-42 DEMW-45CD(ND)
MW-50B MW-49B MW-51B Carbon Tetrachloride Isoconcentration(84) PPUUPPUU(43)
PPUU(1200)
Contour (microgL)PPPUUU PPPUUUMW-46 D1D2MW-7B (5)(ND)
(Dashed Lines are Estimated)MW-7A (ND)
MW-5A (41)
MW-4A (21) MW-4B (640)
MW-48B (680)
MW-17A (ND)
MW-16A (ND) UUPP
MW-18A (ND)
MW-41 D1D2 UUPP
MW-44 DE UUPP
MW-5B
MW-31A (75)
(19)
MW-43 DE UUPP Notes
(ND) Nondetect
0 2500 5000
Feet sup3 Filename XEPA009GarveyGW_Flow_Tech_Memo Carbon_TetChl_UpperAquifer_ABmxd Project EP903401220202 Revised 061312 ST Source ENSR GDB 2008 DNR
100
5
100
SB-39MW-6AHTW 40 HGLmdashGroundwater Flow Modeling Technical Memorandum MW47C SB-38MW-33 MW-2A (62) ( Garvey Elevator SitemdashHastings NE
UUUPSUS P PPP (
U
Figure 32MW-8A MW-3ABDE MW-19C (ND) Carbon Tetrachloride in the
MW-1A +++++PPPP UPUPPPPUUUUUUU
+UP+UPPPP+U+U+U Medial Aquifer Zone CPU MW-20C +UP+UPPPP+U+U+U (ND) September 2011 SamplingMW49C
UU(ND) PPUU +++++PPPPPPPUUUUU MW50C
(ND) +UP+UPPPP+U+U+UPPPUUU LegendMW-13C
MW-4AB (130) MW-30C
MW-5AB (ND) MW48C MW51C
(ND) (ND) Garvey Property Boundary SB-33 (
MW-7AB PPUU MW-31C (ND) Railroad
Inset Ntilde Monitoring Well Location MW-47CMW-9A MW-10AB Multilevel Well(62)
HTW 40
MW-6A S Hydraulic Conductivity WellMW-11AMW-33 PPUUMW-2A
MW-19CUP (ND) P West Highway 6 amp Highway 281 SiteU MW-14A A A Monitoring WellMW-20C MW-12C MW-106CMW-104CPSS P PPP
U (ND) (ND) (90) (ND)
MW-8A MW-13C U U UUU
PMW-3ABDE PPPPPPPPUUUUPU (130) Carbon Tetrachloride ConcentrationPU UUUU UUUUUUUUUU
MW-105C A (190)MW-1A UUUUUUUUUPPPPPPPPPPPPPPPPPPP MW-30C PPPUUU MW-12D A (200) in micrograms per liter (microgL)
MW-49C UUUUPUPPPPUUPU (ND) UPPU Old Rolls MW-42 DEPP (13)(ND) Carbon Tetrachloride Isoconcentration MW-45C MW-50C (ND)
MW-51C (ND) PPUU PPUU PPUU (5) Contour (microgL)(ND)
UUU PPP MW-46 D1D2
PPP UUUMW-48C (Dashed Lines are Estimated)5MW-7AB (ND)
MW-4AB MW-17C MW-18C(ND) MW-44 DE Domestic Irrigation W ater Wells(81)MW-5AB
PPUUMW-31C MW-16C (ND)
PPUU(ND) MW-41 D1D2
PPUU
Notes MW-43 DE PPUU
(ND) Nondetect
0 2500 5000
Feet sup3 FilenameXEPA009GarveyGW_Flow_Tech_Memo Carbon_TetChl_Medial_Aquifer_Cmxd Project EP903401220202 Revised 061312 ST Source ENSR GDB 2008 DNR
50
5
5
50 100
MW-6D SB-39 HGLmdashGroundwater Flow Modeling Technical MemorandumHTW 40 (ND) SB-38MW-3DE ( Garvey Elevator SitemdashHastings NE (NDND)
UUUUPSUS P PPP MW-19AC( Figure 33MW-2A MW-33 MW47D
U (ND)
Carbon Tetrachloride in theMW-8A PPPPUUUU P Lower Aquifer Zone DEUMW-1A MW-20DEPU P
(NDND)UPUU
September 2011 Sampling MW-13EPPUUPPPU (ND)
MW50D UPMW49D (ND) UUU(ND) PPP MW-30DE Legend MW51D (ND)
(ND)MW-4AB MW48D (ND)
MW-7AB MW-5D (ND) Garvey Property Boundary
MW-31C (ND)
PPUU
(
RailroadSB-33MW-3DE (NDND)
Inset Ntilde Monitoring Well Location MW-47D
MW-9A (ND) Multilevel Well HTW 40
MW-6D MW-10AB (ND)
MW-11A S Hydraulic Conductivity Well MW-33 MW-2A UPPU
PUMW-19AC West Highway 6 amp Highway 281 Site MW-14A APU
MW-20DE MW-106D A Monitoring WellMW-104DPSSU PU PPPUUU (NDND)
MW-12C (ND)(ND)MW-8A MW-13E PU
UUUUU (ND) Carbon Tetrachloride ConcentrationU PPPPPPPPUUUUPU (190)PPUUU
PPUPPPPPPPPPPPPPPPUUUUUP
UUUUU UUUUUUU PPP A MW-105DMW-1A in micrograms per liter (microgL) AMW-30DE
PPUUPPPUUUPPPPPUUUUU(52)
(NDND) MW-12DNew RollsMW-49D (ND) (ND)
Carbon Tetrachloride Isoconcentration(ND) MW-45D PPUUMW-51D (ND)
MW-46 D1PPUU PPUU Contour (microgL)MW-50D (ND) (5)(ND)
PPPUUU (770)PPPUUU MW-42 DMW-48D (Dashed Lines are Estimated)MW-4AB (4274)(ND)
MW-44DEMW-46 D2 MW-17D (320) (19ND)MW-7AB
MW-5D Domestic Irrigation W ater Wells(94) MW-18D PPUUMW-31C(ND) (21) MW-41 D1MW-5B MW-16C PPUU (ND)
PPUUMW-41 D2 (10) Notes
MW-43DE UUPP(ND18) (ND) Nondetect
0 2500 5000
Feet sup3 Filename XEPA009GarveyGW_Flow_Tech_Memo Carbon_TetChl_LoweR_Aquifer_Dmxd Project EP903401220202 Revised 061312 ST Source ENSR GDB 2008 DNR
_L _j I I I I _j_ I I I
I l --- I 111
1
__u_ I I
1 I ~ N ----y-
+ ~ I
II L _l e11111111111 I ---1 ~lJJ I n r Igt I Constant Head Boundariesj l _Q No Flow Sound aries I I l
~ r-- I - I middot r-
- fl+- L -
0 I J ~r-
Ll-D l Garvey Site I - ~t
Ill -J
l unJprm Spacing 25 eet U~iform S pacing 1 00 feet I Constant Head Boundaries
j
middotmiddot- ~ No Flow Sound aries
J
--=J--=11-~=======2~-----~3=========4~------5 M1les 0 05
Figure 51 Model Domain Gridding and Boundaries
Figure 52 Vertical Discretization of Model
1610
1620
1 6 2 0
1630
1 6 3 0
1640
1 6 4 0
1650
1 6 5 0
1660
1660
1670
1670
1680
1680
1690
17
1698
17013
16918
169198
169118
165864
167129
168901
169482
169872
169403
169347
169374
169448
Figure 53 Elevation of the Model Base (weathered shale of the Niobrara Formation)
1111
I I
-
N
+ 0 05
I I
I 1 l
I
1 l -
2 3 4 Miles
Figure 54 Elevation of the Top of the Lower Aquifer
Figure 55 Isopach Map of Lower Confining Unit (model Layer 4)
Figure 56 Elevation of the Base of the Medial Aquifer
Figure 57 Isopach of Upper Aquitard (model layer 2)
Figure 58 Elevation of the Base of the Upper Aquifer
I I I
~ ~ t--7 t bull I I I
r I l
I EW-01 f1-m I N I bull __ j
+ twtrl I I I rl bull I I I I J I I I -r-----
- middot-- - -- -- middot------__J_--
I --- 1 Feet I 0 500 1 000 2000 3000 4000 rooo I I I I
Figure 59 Location of Recovery Wells in the Shallow Aquifer
_l ________ l I I I -1 middot ] l ~----------middotj + I j
middotmiddot= middotmiddot- ---------L -- ---- ___ _ [_ __
r--------shy1
o--~oomiddoto~bull1~oo=o ======4~oomiddoto------middot~ooco=======43oobullo -------~oo~1
Figure 510 Location of Recovery Wells in the Medial Aquifer
I I r
~~ r -
L - - - -- -1--ltmiddot --I-
I -
---- L f+r
il I
J ---1
I
N
+
Figure 511 Location of Injection and Municipal Wells in the Lower Aquifer
Figure 512 Initial Concentrations of Carbon Tetrachloride in the Shallow Aquifer
Figure 513 Initial Concentrations of Carbon Tetrachloride in the Medial Aquifer
Figure 514 Initial Concentrations of Carbon Tetrachloride in the Lower Aquifer
-40
-30
-20
-10
00
10
20
30
40
17741 17828 17915 18002 18090 18177
Res
idua
l
Layer 1
Layer 3
Layer 5
Observed Value
Figure 61 Error Residuals Versus Measured Water Levels
Layer 1
Layer 3
18090
18177
Layer 5
Mod
el V
alue
17741 17828 17915 18002 18090 18177
18002
17915
17828
17741
Observed Value
Figure 62 Measured Water Levels Versus Predicted Water Levels
bull -020
N
+ 0
h I I
-----------~----j_ _______ ___ j_94-__ _ __ I ------------- t
011
bull 005
05
bull
I
Mile 1
Figure 63 Error Residuals for the Shallow Aquifer in the vicinity of the Garvey Elevator Site
Figure 64 Error Residuals for the Shallow Aquifer Over the Model Domain
-007 bull
N
+
il _ __ ~ II
t079 i
I 1 II_ --middot--middot- J_~=====-middot 1------~
~--1 000 r-----middot- -middotmiddot ____
-021 bull
-012 007 bull bull
l middot l02
I ~~~~====~---====~---Feet _ o ___ _ $-_~_0 _ ___ _ J000 _____ 3QQ_Q_ ---4lIJOLUlJ00----ltgt5ultOOO-- middott- middot ----
I
Figure 65 Error Residuals for the Medial Aquifer Over the Model Domain
0 250
N
+
044 bullbull -042
000 bull
027 bull
013
-)35 bull
Figure 66 Error Residuals for the Lower Aquifer in the Vicinity of the Garvey Elevator Site
Figure 67 Error Residuals for the Lower Aquifer in the Entire Model Domain
Figure 68 Calibrated Hydraulic Conductivities of the Shallow Aquifer (ftd) (model layer 1)
Figure 69 Calibrated Hydraulic Conductivities of the Medial Aquifer (ftd) (model layer 3)
Figure 610 Calibrated Hydraulic Conductivities of the Lower Aquifer (ftd) (model layer 5)
Figure 611 Calibrated Hydraulic Conductivities of the Upper Aquitard (ftd) (model layer 2)
Figure 612 Calibrated Hydraulic Conductivities of the Lower Aquitard (ftd) (model layer 4)
Figure 613 Calibrated Potentiometric Surface of the Shallow Aquifer (model layer 1)
Figure 614 Calibrated Potentiometric Surface of the Medial Aquifer (model layer 3)
Figure 615 Calibrated Potentiometric Surface of the Lower Aquifer (model layer 5)
Figure 616 Particle Tracking Analysis to Estimate Travel Time
Figure 71 Initial Concentrations for Alternative SG3
E3 E3 2000feet
Figure 72 Capture Zone Analysis in the Shallow Aquifer for Alternative SG3
E3 E3 E3 2000feet
Figure 73 Capture Zone Analysis in the Medial Aquifer for Alternative SG3
Figure 74 Alternative G2-Proposed Recovery Wells Medial Aquifer
Figure 75 Alternative G2- Proposed Recovery Wells Lower Aquifer
50
5 5
5
50 100
MW-3DE (NDND)
MW-47D MW-9A (ND)
HTW 40 MW-6D MW-10AB
(ND) MW-11A
MW-2AMW-33 UPPUPU
MW-19AC MW-14A APUMW-20DE MW-106DMW-104D(NDND) MW-12CPSSU (ND)PU PPPUUU PU (ND) MW-13E
HGLmdashGroundwater Flow Modeling Technical Memorandum Garvey Elevator Superfund SitemdashHastings NE
Figure 76 Preliminary Locations for Leading
Edge Recovery Wells and Groundwater Treatment Building-Alternative G2
Legend Garvey Property Boundary
Railroad
Ntilde Monitoring Well Location
Multilevel Well
S Hydraulic Conductivity Well
A West Highway 6 amp Highway 281 Site Monitoring Well
(190) Carbon Tetrachloride Concentration in micrograms per liter (microgL)
Carbon Tetrachloride Isoconcentration Treatment Building
Technical Blvd
MW-8A UUUU UUUUU
U PPPPPPPPUUUUPU UUUUUUPUP
UUUUUPPPPPPPPPPPPPPPPPP (ND)
PPPUUU A MW-105DMW-1A UU AMW-30DE PPUUPPPUUUPPPPPUUUUU
(52)(NDND) MW-12DNew Rolls Contour (Lower Aquifer) (microgL)MW-49D (5)(ND) (ND)
(ND) MW-45D (Dashed Lines are Estimated)PPUUMW-51D (ND) MW-46 D1PPUU PPUUMW-50D
(ND) (ND)
PPPUUU (770)PPPUUU MW-42 DMW-48D Domestic Irrigation W ater WellsMW-4AB (4274) MW-44DE(ND)
(19ND)MW-46 D2 MW-17D (320)MW-7AB Carbon Tetrachloride Isoconcentration(94)MW-5D
MW-18D PPUU (5) Contour (Upper Aquifer) (microgL)(21) MW-41 D1 MW-31C(ND)
MW-5B MW-16C PPUU (Dashed Lines are Estimated)(ND)
PPUUIdlewilde Rd
MW-41 D2 Recovery Wells (Medial)
Recovery Wells (Deep)
(10)
MW-43DE PPUU(ND18)
Recovery Well Piping
Treatment Building
Notes (ND) Nondetect
Blaine A
ve
Showboa t B
lvd
sup3 Filename XEPA009GarveyGW_Flow_Tech_Memo Carbon_TetChl_LoweR_Aquifer_Dmxd Project EP903401220202 Revised 061312 ST2500 5000 Source ENSR GDB 2008 DNR
Feet
0
Figure 77 Alternative G3ab-Proposed Recovery Wells Medial Aquifer
Figure 78 Alternative G3a- Proposed Recovery Wells Lower Aquifer
50
5 5
5
50 100
HGLmdashGroundwater Flow Modeling Technical Memorandum Garvey Elevator Superfund SitemdashHastings NE
Figure 79 Preliminary Locations for Mid-Plume and
Leading Edge Recovery Wells and Groundwater Treatment Building-Alternative G3
Legend Garvey Property Boundary
Railroad
Ntilde Monitoring Well Location MW-3DE (NDND)
Multilevel Well MW-47D
MW-9A (ND) Hydraulic Conductivity WellSHTW 40 MW-6D MW-10AB
(ND) West Highway 6 amp Highway 281 SiteMW-11A
MW-33 PPUUMW-2A PUA Monitoring Well
MW-19AC MW-14A APUCarbon Tetrachloride Concentration
Technical Blvd
MW-44DE (19ND) (Dashed Lines are Estimated)
MW-20DE (190)MW-106DPSSU PU PPPUUU MW-104DMW-12C(NDND) (ND)PU in micrograms per liter (microgL)(ND) MW-13EMW-8A
U UUUU UPUPPPPUUUUUUUUP UUUUU UUUPPPPPPPPPPPPPPPPPPPPPPPUUUUUU
(ND) PPPUUU A Treatment BuildingMW-105DMW-1A Carbon Tetrachloride IsoconcentrationMW-30DE A
PPUUPPPUUUPPPPPUUUUU(52)
(NDND) MW-12DNew Rolls Contour (Lower Aquifer) (microgL)MW-49D (5)(ND) (ND)(ND) MW-45D
MW-51D PPUU(ND)
PPUU PPUUMW-50D (ND)
MW-46 D1(ND) PPPUUU (770)
PPPUUU MW-42 D (4274)
MW-48D Domestic Irrigation W ater WellsMW-4AB (ND) MW-46 D2
MW-17DMW-7AB (320)(94) Carbon Tetrachloride IsoconcentrationMW-5D
MW-18D(ND) MW-31C (21) PPMW-41 D1
UU (5) Contour (Upper Aquifer) (microgL)MW-5B MW-16C UU (ND)PP (Dashed Lines are Estimated)PPUUIdlewilde Rd
MW-41 D2 Recovery Wells (Medial)(10)
MW-43DE UUPP(ND18) Recovery Wells (Deep)
Recovery Well Piping
Treatment Building
Notes (ND) Nondetect
Blaine A
ve
Showboa t B
lvd
sup3 Filename XEPA009GarveyGW_Flow_Tech_Memo Mid-Plume_Prelim_Loc Project EP903401220202 Revised 061312 RL2500 5000 Source ENSR GDB 2008 DNR
Feet
0
Figure 710 Alternative G3b-Proposed Recovery Wells Lower Aquifer
Figure 711 Alternative G3b-Relative Positions of Proposed Recovery Wells Medial and Lower Aquifers
Figure 712 Alternative G4a-Proposed Treatment Curtain and Recovery Wells Lower Aquifer
50
5 5
5
50 100
HGLmdashGroundwater Flow Modeling Technical Memorandum Garvey Elevator Superfund SitemdashHastings NE
Figure 713 Preliminary Locations for Mid-Plume
Injection Wells Leading Edge Recovery Wells and Groundwater Treatment Building
-Alternative G4
Legend Garvey Property Boundary
Railroad
Ntilde Monitoring Well Location MW-3DE (NDND)
MW-47D MW-9A (ND)
HTW 40 MW-6D MW-10AB
(ND)
S Elm
Ave
S Wabash A
ve
Multilevel Well
S Hydraulic Conductivity Well
A West Highway 6 amp Highway 281 Site Monitoring Well
MW-11AMW-33 UPPUMW-2A PU
MW-19AC MW-14A APUMW-20DE MW-106D Carbon Tetrachloride ConcentrationPU PPPUUU (190)PSSU MW-104D(NDND) MW-12C (ND)PU in micrograms per liter (microgL)(ND)
Treatment Building Technical B
lvd MW-13EMW-8A
UUUU UUUUUU PPPPPPPPUUUUPU UUUUU
UPUP
UUUUUPPPPPPPPPPPPPPPPPP (ND)
PPPUUU A MW-105DMW-1A UU Carbon Tetrachloride IsoconcentrationAMW-30DE PPUUPPPUUUPPPPPUUUUU
(52)(NDND) MW-12DNew Rolls Contour (Lower Aquifer) (microgL)MW-49D (5)(ND) (ND)
(ND) MW-45D (Dashed Lines are Estimated)PPUUMW-51D (ND) MW-46 D1PPUU PPUUMW-50D
(ND) (ND)
PPPUUU (770)PPPUUU MW-42 DMW-48D Domestic Irrigation W ater WellsMW-4AB (4274)(ND) MW-44DEMW-46 D2
(19ND)MW-17D (320)MW-7AB Carbon Tetrachloride Isoconcentration(94)MW-5D MW-18D PPUU (5) Contour (Upper Aquifer) (microgL)(21) MW-41 D1
MW-31C(ND) MW-5B MW-16C PPUU (Dashed Lines are Estimated)(ND)
PPUUIdlewilde Rd
MW-41 D2 Recovery Wells (Medial)
Recovery Wells (Deep)
(10) Injection Area 1 MW-43DE PPUUPermanent Injection Well Spacing 40 ft (ND18)
Total Injection Wells Installed 39 Recovery Well Piping Injection Area (40 ft spacing between the wells) Treatment Building
Notes (ND) Nondetect
Blaine A
ve
Showboa t B
lvd
S Baltim
ore Ave
sup3 Filename XEPA009GarveyGW_Flow_Tech_Memo G4_Prelim_Loc_Inj_Areamxd Project EP903401220202 Revised 061312 RL2500 5000 Source ENSR GDB 2008 DNR
Feet
0
Figure 714 Alternative G4b-Proposed Treatment Curtains and Recovery Wells Lower Aquifer
Figure 715 Alternative G4b-Relative Positions of Proposed Recovery Wells and Treatment Curtains
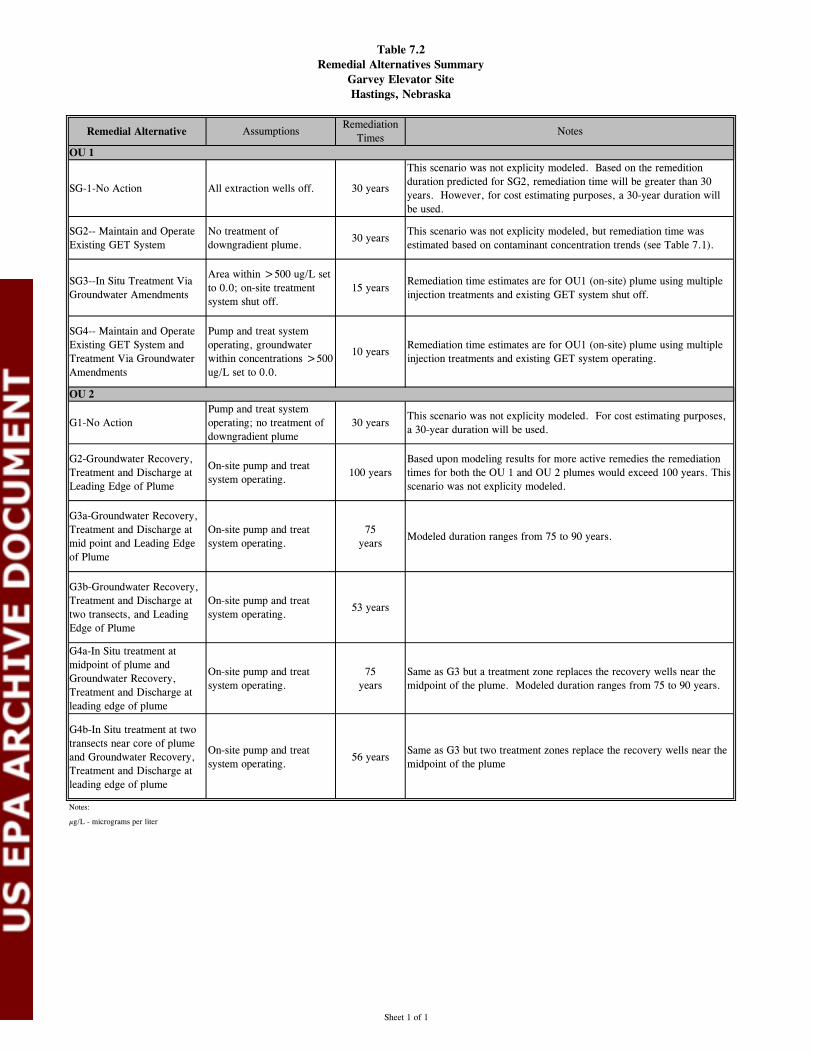
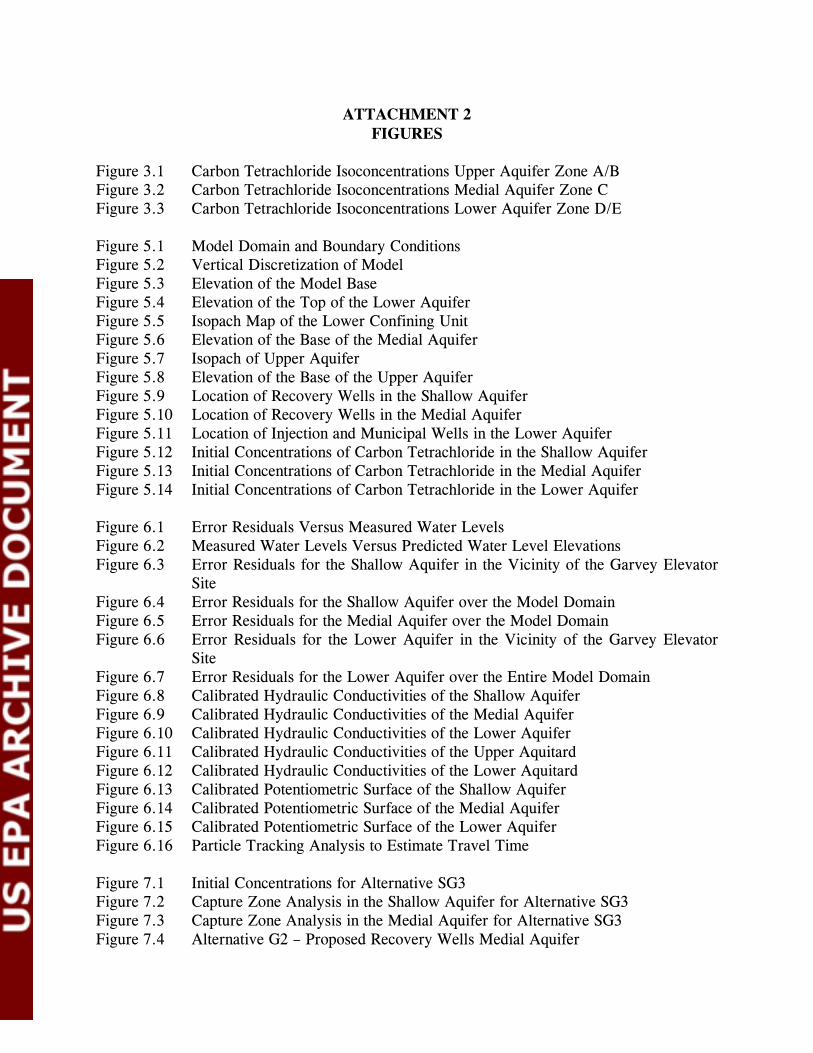

5
5
5
5
5
50
100 500
MW-6A SB-39 HGLmdashGroundwater Flow Modeling Technical MemorandumMW-2AHTW 40 (98)(ND)MW-8A MW47B ( Garvey Elevator SitemdashHastings NE(ND)
(59) SB-38
MW-19APSUS PU PPPUUU ( Figure 31 (70)MW-33 MW-3AB
Carbon Tetrachloride in the(ND53) MW49B MW-20A
+UP+UPPPP+U+U+UPPPPUUUU+UP+UPPPP+U+U+U(43) Upper Aquifer Zone AB(10)
MW-1A PU MW50B(ND) +UP+UPPPP+U+U+U September 2011 Sampling(84)
PPUUMW-4AB PPUU MW-13CE +++++UPUPPPPUUU (21640)
MW-30A (160)+UP+UPPPP+U+U+U LegendPPPUUU
1000 MW51B (1200) MW-5AB
(4119J)
Garvey Property BoundaryMW-7AB MW-31A (ND) (75) (
PPUU MW48B RailroadSB-33 (680)
Inset Ntilde Monitoring Well Location MW-47B MW-10A
(59) (ND) Multilevel Well MW-9A MW-6AHTW 40 MW-10B(ND) (98)
(ND) MW-11A S Hydraulic Conductivity
MW-33 UPPUMW-2A MW-19AU MW-14A(ND) P
(70) PU (ND) A West Highway 6 amp Highway 281 Site MW-12A AMW-106AMW-20A MW-104AMW-3A MW-8A (ND) Monitoring WellU UUU (ND)PSSU P PPP (10)(ND) (ND)(ND) U
UUUUU PUUUUP PPPPPPPPPPPPPPPPPPPPPPPUUUUPUPPPPUUUUU MW-13CE
UUUU Carbon Tetrachloride ConcentrationMW-3B MW-105A A (190)PPP A (ND)
UUUUUUUUU(53) MW-30A in micrograms per liter (microgL)PPUUPPPUUUPPPPPUUUUU
MW-12DMW-1A (160) MW-42 DEMW-45CD(ND)
MW-50B MW-49B MW-51B Carbon Tetrachloride Isoconcentration(84) PPUUPPUU(43)
PPUU(1200)
Contour (microgL)PPPUUU PPPUUUMW-46 D1D2MW-7B (5)(ND)
(Dashed Lines are Estimated)MW-7A (ND)
MW-5A (41)
MW-4A (21) MW-4B (640)
MW-48B (680)
MW-17A (ND)
MW-16A (ND) UUPP
MW-18A (ND)
MW-41 D1D2 UUPP
MW-44 DE UUPP
MW-5B
MW-31A (75)
(19)
MW-43 DE UUPP Notes
(ND) Nondetect
0 2500 5000
Feet sup3 Filename XEPA009GarveyGW_Flow_Tech_Memo Carbon_TetChl_UpperAquifer_ABmxd Project EP903401220202 Revised 061312 ST Source ENSR GDB 2008 DNR
100
5
100
SB-39MW-6AHTW 40 HGLmdashGroundwater Flow Modeling Technical Memorandum MW47C SB-38MW-33 MW-2A (62) ( Garvey Elevator SitemdashHastings NE
UUUPSUS P PPP (
U
Figure 32MW-8A MW-3ABDE MW-19C (ND) Carbon Tetrachloride in the
MW-1A +++++PPPP UPUPPPPUUUUUUU
+UP+UPPPP+U+U+U Medial Aquifer Zone CPU MW-20C +UP+UPPPP+U+U+U (ND) September 2011 SamplingMW49C
UU(ND) PPUU +++++PPPPPPPUUUUU MW50C
(ND) +UP+UPPPP+U+U+UPPPUUU LegendMW-13C
MW-4AB (130) MW-30C
MW-5AB (ND) MW48C MW51C
(ND) (ND) Garvey Property Boundary SB-33 (
MW-7AB PPUU MW-31C (ND) Railroad
Inset Ntilde Monitoring Well Location MW-47CMW-9A MW-10AB Multilevel Well(62)
HTW 40
MW-6A S Hydraulic Conductivity WellMW-11AMW-33 PPUUMW-2A
MW-19CUP (ND) P West Highway 6 amp Highway 281 SiteU MW-14A A A Monitoring WellMW-20C MW-12C MW-106CMW-104CPSS P PPP
U (ND) (ND) (90) (ND)
MW-8A MW-13C U U UUU
PMW-3ABDE PPPPPPPPUUUUPU (130) Carbon Tetrachloride ConcentrationPU UUUU UUUUUUUUUU
MW-105C A (190)MW-1A UUUUUUUUUPPPPPPPPPPPPPPPPPPP MW-30C PPPUUU MW-12D A (200) in micrograms per liter (microgL)
MW-49C UUUUPUPPPPUUPU (ND) UPPU Old Rolls MW-42 DEPP (13)(ND) Carbon Tetrachloride Isoconcentration MW-45C MW-50C (ND)
MW-51C (ND) PPUU PPUU PPUU (5) Contour (microgL)(ND)
UUU PPP MW-46 D1D2
PPP UUUMW-48C (Dashed Lines are Estimated)5MW-7AB (ND)
MW-4AB MW-17C MW-18C(ND) MW-44 DE Domestic Irrigation W ater Wells(81)MW-5AB
PPUUMW-31C MW-16C (ND)
PPUU(ND) MW-41 D1D2
PPUU
Notes MW-43 DE PPUU
(ND) Nondetect
0 2500 5000
Feet sup3 FilenameXEPA009GarveyGW_Flow_Tech_Memo Carbon_TetChl_Medial_Aquifer_Cmxd Project EP903401220202 Revised 061312 ST Source ENSR GDB 2008 DNR
50
5
5
50 100
MW-6D SB-39 HGLmdashGroundwater Flow Modeling Technical MemorandumHTW 40 (ND) SB-38MW-3DE ( Garvey Elevator SitemdashHastings NE (NDND)
UUUUPSUS P PPP MW-19AC( Figure 33MW-2A MW-33 MW47D
U (ND)
Carbon Tetrachloride in theMW-8A PPPPUUUU P Lower Aquifer Zone DEUMW-1A MW-20DEPU P
(NDND)UPUU
September 2011 Sampling MW-13EPPUUPPPU (ND)
MW50D UPMW49D (ND) UUU(ND) PPP MW-30DE Legend MW51D (ND)
(ND)MW-4AB MW48D (ND)
MW-7AB MW-5D (ND) Garvey Property Boundary
MW-31C (ND)
PPUU
(
RailroadSB-33MW-3DE (NDND)
Inset Ntilde Monitoring Well Location MW-47D
MW-9A (ND) Multilevel Well HTW 40
MW-6D MW-10AB (ND)
MW-11A S Hydraulic Conductivity Well MW-33 MW-2A UPPU
PUMW-19AC West Highway 6 amp Highway 281 Site MW-14A APU
MW-20DE MW-106D A Monitoring WellMW-104DPSSU PU PPPUUU (NDND)
MW-12C (ND)(ND)MW-8A MW-13E PU
UUUUU (ND) Carbon Tetrachloride ConcentrationU PPPPPPPPUUUUPU (190)PPUUU
PPUPPPPPPPPPPPPPPPUUUUUP
UUUUU UUUUUUU PPP A MW-105DMW-1A in micrograms per liter (microgL) AMW-30DE
PPUUPPPUUUPPPPPUUUUU(52)
(NDND) MW-12DNew RollsMW-49D (ND) (ND)
Carbon Tetrachloride Isoconcentration(ND) MW-45D PPUUMW-51D (ND)
MW-46 D1PPUU PPUU Contour (microgL)MW-50D (ND) (5)(ND)
PPPUUU (770)PPPUUU MW-42 DMW-48D (Dashed Lines are Estimated)MW-4AB (4274)(ND)
MW-44DEMW-46 D2 MW-17D (320) (19ND)MW-7AB
MW-5D Domestic Irrigation W ater Wells(94) MW-18D PPUUMW-31C(ND) (21) MW-41 D1MW-5B MW-16C PPUU (ND)
PPUUMW-41 D2 (10) Notes
MW-43DE UUPP(ND18) (ND) Nondetect
0 2500 5000
Feet sup3 Filename XEPA009GarveyGW_Flow_Tech_Memo Carbon_TetChl_LoweR_Aquifer_Dmxd Project EP903401220202 Revised 061312 ST Source ENSR GDB 2008 DNR
_L _j I I I I _j_ I I I
I l --- I 111
1
__u_ I I
1 I ~ N ----y-
+ ~ I
II L _l e11111111111 I ---1 ~lJJ I n r Igt I Constant Head Boundariesj l _Q No Flow Sound aries I I l
~ r-- I - I middot r-
- fl+- L -
0 I J ~r-
Ll-D l Garvey Site I - ~t
Ill -J
l unJprm Spacing 25 eet U~iform S pacing 1 00 feet I Constant Head Boundaries
j
middotmiddot- ~ No Flow Sound aries
J
--=J--=11-~=======2~-----~3=========4~------5 M1les 0 05
Figure 51 Model Domain Gridding and Boundaries
Figure 52 Vertical Discretization of Model
1610
1620
1 6 2 0
1630
1 6 3 0
1640
1 6 4 0
1650
1 6 5 0
1660
1660
1670
1670
1680
1680
1690
17
1698
17013
16918
169198
169118
165864
167129
168901
169482
169872
169403
169347
169374
169448
Figure 53 Elevation of the Model Base (weathered shale of the Niobrara Formation)
1111
I I
-
N
+ 0 05
I I
I 1 l
I
1 l -
2 3 4 Miles
Figure 54 Elevation of the Top of the Lower Aquifer
Figure 55 Isopach Map of Lower Confining Unit (model Layer 4)
Figure 56 Elevation of the Base of the Medial Aquifer
Figure 57 Isopach of Upper Aquitard (model layer 2)
Figure 58 Elevation of the Base of the Upper Aquifer
I I I
~ ~ t--7 t bull I I I
r I l
I EW-01 f1-m I N I bull __ j
+ twtrl I I I rl bull I I I I J I I I -r-----
- middot-- - -- -- middot------__J_--
I --- 1 Feet I 0 500 1 000 2000 3000 4000 rooo I I I I
Figure 59 Location of Recovery Wells in the Shallow Aquifer
_l ________ l I I I -1 middot ] l ~----------middotj + I j
middotmiddot= middotmiddot- ---------L -- ---- ___ _ [_ __
r--------shy1
o--~oomiddoto~bull1~oo=o ======4~oomiddoto------middot~ooco=======43oobullo -------~oo~1
Figure 510 Location of Recovery Wells in the Medial Aquifer
I I r
~~ r -
L - - - -- -1--ltmiddot --I-
I -
---- L f+r
il I
J ---1
I
N
+
Figure 511 Location of Injection and Municipal Wells in the Lower Aquifer
Figure 512 Initial Concentrations of Carbon Tetrachloride in the Shallow Aquifer
Figure 513 Initial Concentrations of Carbon Tetrachloride in the Medial Aquifer
Figure 514 Initial Concentrations of Carbon Tetrachloride in the Lower Aquifer
-40
-30
-20
-10
00
10
20
30
40
17741 17828 17915 18002 18090 18177
Res
idua
l
Layer 1
Layer 3
Layer 5
Observed Value
Figure 61 Error Residuals Versus Measured Water Levels
Layer 1
Layer 3
18090
18177
Layer 5
Mod
el V
alue
17741 17828 17915 18002 18090 18177
18002
17915
17828
17741
Observed Value
Figure 62 Measured Water Levels Versus Predicted Water Levels
bull -020
N
+ 0
h I I
-----------~----j_ _______ ___ j_94-__ _ __ I ------------- t
011
bull 005
05
bull
I
Mile 1
Figure 63 Error Residuals for the Shallow Aquifer in the vicinity of the Garvey Elevator Site
Figure 64 Error Residuals for the Shallow Aquifer Over the Model Domain
-007 bull
N
+
il _ __ ~ II
t079 i
I 1 II_ --middot--middot- J_~=====-middot 1------~
~--1 000 r-----middot- -middotmiddot ____
-021 bull
-012 007 bull bull
l middot l02
I ~~~~====~---====~---Feet _ o ___ _ $-_~_0 _ ___ _ J000 _____ 3QQ_Q_ ---4lIJOLUlJ00----ltgt5ultOOO-- middott- middot ----
I
Figure 65 Error Residuals for the Medial Aquifer Over the Model Domain
0 250
N
+
044 bullbull -042
000 bull
027 bull
013
-)35 bull
Figure 66 Error Residuals for the Lower Aquifer in the Vicinity of the Garvey Elevator Site
Figure 67 Error Residuals for the Lower Aquifer in the Entire Model Domain
Figure 68 Calibrated Hydraulic Conductivities of the Shallow Aquifer (ftd) (model layer 1)
Figure 69 Calibrated Hydraulic Conductivities of the Medial Aquifer (ftd) (model layer 3)
Figure 610 Calibrated Hydraulic Conductivities of the Lower Aquifer (ftd) (model layer 5)
Figure 611 Calibrated Hydraulic Conductivities of the Upper Aquitard (ftd) (model layer 2)
Figure 612 Calibrated Hydraulic Conductivities of the Lower Aquitard (ftd) (model layer 4)
Figure 613 Calibrated Potentiometric Surface of the Shallow Aquifer (model layer 1)
Figure 614 Calibrated Potentiometric Surface of the Medial Aquifer (model layer 3)
Figure 615 Calibrated Potentiometric Surface of the Lower Aquifer (model layer 5)
Figure 616 Particle Tracking Analysis to Estimate Travel Time
Figure 71 Initial Concentrations for Alternative SG3
E3 E3 2000feet
Figure 72 Capture Zone Analysis in the Shallow Aquifer for Alternative SG3
E3 E3 E3 2000feet
Figure 73 Capture Zone Analysis in the Medial Aquifer for Alternative SG3
Figure 74 Alternative G2-Proposed Recovery Wells Medial Aquifer
Figure 75 Alternative G2- Proposed Recovery Wells Lower Aquifer
50
5 5
5
50 100
MW-3DE (NDND)
MW-47D MW-9A (ND)
HTW 40 MW-6D MW-10AB
(ND) MW-11A
MW-2AMW-33 UPPUPU
MW-19AC MW-14A APUMW-20DE MW-106DMW-104D(NDND) MW-12CPSSU (ND)PU PPPUUU PU (ND) MW-13E
HGLmdashGroundwater Flow Modeling Technical Memorandum Garvey Elevator Superfund SitemdashHastings NE
Figure 76 Preliminary Locations for Leading
Edge Recovery Wells and Groundwater Treatment Building-Alternative G2
Legend Garvey Property Boundary
Railroad
Ntilde Monitoring Well Location
Multilevel Well
S Hydraulic Conductivity Well
A West Highway 6 amp Highway 281 Site Monitoring Well
(190) Carbon Tetrachloride Concentration in micrograms per liter (microgL)
Carbon Tetrachloride Isoconcentration Treatment Building
Technical Blvd
MW-8A UUUU UUUUU
U PPPPPPPPUUUUPU UUUUUUPUP
UUUUUPPPPPPPPPPPPPPPPPP (ND)
PPPUUU A MW-105DMW-1A UU AMW-30DE PPUUPPPUUUPPPPPUUUUU
(52)(NDND) MW-12DNew Rolls Contour (Lower Aquifer) (microgL)MW-49D (5)(ND) (ND)
(ND) MW-45D (Dashed Lines are Estimated)PPUUMW-51D (ND) MW-46 D1PPUU PPUUMW-50D
(ND) (ND)
PPPUUU (770)PPPUUU MW-42 DMW-48D Domestic Irrigation W ater WellsMW-4AB (4274) MW-44DE(ND)
(19ND)MW-46 D2 MW-17D (320)MW-7AB Carbon Tetrachloride Isoconcentration(94)MW-5D
MW-18D PPUU (5) Contour (Upper Aquifer) (microgL)(21) MW-41 D1 MW-31C(ND)
MW-5B MW-16C PPUU (Dashed Lines are Estimated)(ND)
PPUUIdlewilde Rd
MW-41 D2 Recovery Wells (Medial)
Recovery Wells (Deep)
(10)
MW-43DE PPUU(ND18)
Recovery Well Piping
Treatment Building
Notes (ND) Nondetect
Blaine A
ve
Showboa t B
lvd
sup3 Filename XEPA009GarveyGW_Flow_Tech_Memo Carbon_TetChl_LoweR_Aquifer_Dmxd Project EP903401220202 Revised 061312 ST2500 5000 Source ENSR GDB 2008 DNR
Feet
0
Figure 77 Alternative G3ab-Proposed Recovery Wells Medial Aquifer
Figure 78 Alternative G3a- Proposed Recovery Wells Lower Aquifer
50
5 5
5
50 100
HGLmdashGroundwater Flow Modeling Technical Memorandum Garvey Elevator Superfund SitemdashHastings NE
Figure 79 Preliminary Locations for Mid-Plume and
Leading Edge Recovery Wells and Groundwater Treatment Building-Alternative G3
Legend Garvey Property Boundary
Railroad
Ntilde Monitoring Well Location MW-3DE (NDND)
Multilevel Well MW-47D
MW-9A (ND) Hydraulic Conductivity WellSHTW 40 MW-6D MW-10AB
(ND) West Highway 6 amp Highway 281 SiteMW-11A
MW-33 PPUUMW-2A PUA Monitoring Well
MW-19AC MW-14A APUCarbon Tetrachloride Concentration
Technical Blvd
MW-44DE (19ND) (Dashed Lines are Estimated)
MW-20DE (190)MW-106DPSSU PU PPPUUU MW-104DMW-12C(NDND) (ND)PU in micrograms per liter (microgL)(ND) MW-13EMW-8A
U UUUU UPUPPPPUUUUUUUUP UUUUU UUUPPPPPPPPPPPPPPPPPPPPPPPUUUUUU
(ND) PPPUUU A Treatment BuildingMW-105DMW-1A Carbon Tetrachloride IsoconcentrationMW-30DE A
PPUUPPPUUUPPPPPUUUUU(52)
(NDND) MW-12DNew Rolls Contour (Lower Aquifer) (microgL)MW-49D (5)(ND) (ND)(ND) MW-45D
MW-51D PPUU(ND)
PPUU PPUUMW-50D (ND)
MW-46 D1(ND) PPPUUU (770)
PPPUUU MW-42 D (4274)
MW-48D Domestic Irrigation W ater WellsMW-4AB (ND) MW-46 D2
MW-17DMW-7AB (320)(94) Carbon Tetrachloride IsoconcentrationMW-5D
MW-18D(ND) MW-31C (21) PPMW-41 D1
UU (5) Contour (Upper Aquifer) (microgL)MW-5B MW-16C UU (ND)PP (Dashed Lines are Estimated)PPUUIdlewilde Rd
MW-41 D2 Recovery Wells (Medial)(10)
MW-43DE UUPP(ND18) Recovery Wells (Deep)
Recovery Well Piping
Treatment Building
Notes (ND) Nondetect
Blaine A
ve
Showboa t B
lvd
sup3 Filename XEPA009GarveyGW_Flow_Tech_Memo Mid-Plume_Prelim_Loc Project EP903401220202 Revised 061312 RL2500 5000 Source ENSR GDB 2008 DNR
Feet
0
Figure 710 Alternative G3b-Proposed Recovery Wells Lower Aquifer
Figure 711 Alternative G3b-Relative Positions of Proposed Recovery Wells Medial and Lower Aquifers
Figure 712 Alternative G4a-Proposed Treatment Curtain and Recovery Wells Lower Aquifer
50
5 5
5
50 100
HGLmdashGroundwater Flow Modeling Technical Memorandum Garvey Elevator Superfund SitemdashHastings NE
Figure 713 Preliminary Locations for Mid-Plume
Injection Wells Leading Edge Recovery Wells and Groundwater Treatment Building
-Alternative G4
Legend Garvey Property Boundary
Railroad
Ntilde Monitoring Well Location MW-3DE (NDND)
MW-47D MW-9A (ND)
HTW 40 MW-6D MW-10AB
(ND)
S Elm
Ave
S Wabash A
ve
Multilevel Well
S Hydraulic Conductivity Well
A West Highway 6 amp Highway 281 Site Monitoring Well
MW-11AMW-33 UPPUMW-2A PU
MW-19AC MW-14A APUMW-20DE MW-106D Carbon Tetrachloride ConcentrationPU PPPUUU (190)PSSU MW-104D(NDND) MW-12C (ND)PU in micrograms per liter (microgL)(ND)
Treatment Building Technical B
lvd MW-13EMW-8A
UUUU UUUUUU PPPPPPPPUUUUPU UUUUU
UPUP
UUUUUPPPPPPPPPPPPPPPPPP (ND)
PPPUUU A MW-105DMW-1A UU Carbon Tetrachloride IsoconcentrationAMW-30DE PPUUPPPUUUPPPPPUUUUU
(52)(NDND) MW-12DNew Rolls Contour (Lower Aquifer) (microgL)MW-49D (5)(ND) (ND)
(ND) MW-45D (Dashed Lines are Estimated)PPUUMW-51D (ND) MW-46 D1PPUU PPUUMW-50D
(ND) (ND)
PPPUUU (770)PPPUUU MW-42 DMW-48D Domestic Irrigation W ater WellsMW-4AB (4274)(ND) MW-44DEMW-46 D2
(19ND)MW-17D (320)MW-7AB Carbon Tetrachloride Isoconcentration(94)MW-5D MW-18D PPUU (5) Contour (Upper Aquifer) (microgL)(21) MW-41 D1
MW-31C(ND) MW-5B MW-16C PPUU (Dashed Lines are Estimated)(ND)
PPUUIdlewilde Rd
MW-41 D2 Recovery Wells (Medial)
Recovery Wells (Deep)
(10) Injection Area 1 MW-43DE PPUUPermanent Injection Well Spacing 40 ft (ND18)
Total Injection Wells Installed 39 Recovery Well Piping Injection Area (40 ft spacing between the wells) Treatment Building
Notes (ND) Nondetect
Blaine A
ve
Showboa t B
lvd
S Baltim
ore Ave
sup3 Filename XEPA009GarveyGW_Flow_Tech_Memo G4_Prelim_Loc_Inj_Areamxd Project EP903401220202 Revised 061312 RL2500 5000 Source ENSR GDB 2008 DNR
Feet
0
Figure 714 Alternative G4b-Proposed Treatment Curtains and Recovery Wells Lower Aquifer
Figure 715 Alternative G4b-Relative Positions of Proposed Recovery Wells and Treatment Curtains

100
5
100
SB-39MW-6AHTW 40 HGLmdashGroundwater Flow Modeling Technical Memorandum MW47C SB-38MW-33 MW-2A (62) ( Garvey Elevator SitemdashHastings NE
UUUPSUS P PPP (
U
Figure 32MW-8A MW-3ABDE MW-19C (ND) Carbon Tetrachloride in the
MW-1A +++++PPPP UPUPPPPUUUUUUU
+UP+UPPPP+U+U+U Medial Aquifer Zone CPU MW-20C +UP+UPPPP+U+U+U (ND) September 2011 SamplingMW49C
UU(ND) PPUU +++++PPPPPPPUUUUU MW50C
(ND) +UP+UPPPP+U+U+UPPPUUU LegendMW-13C
MW-4AB (130) MW-30C
MW-5AB (ND) MW48C MW51C
(ND) (ND) Garvey Property Boundary SB-33 (
MW-7AB PPUU MW-31C (ND) Railroad
Inset Ntilde Monitoring Well Location MW-47CMW-9A MW-10AB Multilevel Well(62)
HTW 40
MW-6A S Hydraulic Conductivity WellMW-11AMW-33 PPUUMW-2A
MW-19CUP (ND) P West Highway 6 amp Highway 281 SiteU MW-14A A A Monitoring WellMW-20C MW-12C MW-106CMW-104CPSS P PPP
U (ND) (ND) (90) (ND)
MW-8A MW-13C U U UUU
PMW-3ABDE PPPPPPPPUUUUPU (130) Carbon Tetrachloride ConcentrationPU UUUU UUUUUUUUUU
MW-105C A (190)MW-1A UUUUUUUUUPPPPPPPPPPPPPPPPPPP MW-30C PPPUUU MW-12D A (200) in micrograms per liter (microgL)
MW-49C UUUUPUPPPPUUPU (ND) UPPU Old Rolls MW-42 DEPP (13)(ND) Carbon Tetrachloride Isoconcentration MW-45C MW-50C (ND)
MW-51C (ND) PPUU PPUU PPUU (5) Contour (microgL)(ND)
UUU PPP MW-46 D1D2
PPP UUUMW-48C (Dashed Lines are Estimated)5MW-7AB (ND)
MW-4AB MW-17C MW-18C(ND) MW-44 DE Domestic Irrigation W ater Wells(81)MW-5AB
PPUUMW-31C MW-16C (ND)
PPUU(ND) MW-41 D1D2
PPUU
Notes MW-43 DE PPUU
(ND) Nondetect
0 2500 5000
Feet sup3 FilenameXEPA009GarveyGW_Flow_Tech_Memo Carbon_TetChl_Medial_Aquifer_Cmxd Project EP903401220202 Revised 061312 ST Source ENSR GDB 2008 DNR
50
5
5
50 100
MW-6D SB-39 HGLmdashGroundwater Flow Modeling Technical MemorandumHTW 40 (ND) SB-38MW-3DE ( Garvey Elevator SitemdashHastings NE (NDND)
UUUUPSUS P PPP MW-19AC( Figure 33MW-2A MW-33 MW47D
U (ND)
Carbon Tetrachloride in theMW-8A PPPPUUUU P Lower Aquifer Zone DEUMW-1A MW-20DEPU P
(NDND)UPUU
September 2011 Sampling MW-13EPPUUPPPU (ND)
MW50D UPMW49D (ND) UUU(ND) PPP MW-30DE Legend MW51D (ND)
(ND)MW-4AB MW48D (ND)
MW-7AB MW-5D (ND) Garvey Property Boundary
MW-31C (ND)
PPUU
(
RailroadSB-33MW-3DE (NDND)
Inset Ntilde Monitoring Well Location MW-47D
MW-9A (ND) Multilevel Well HTW 40
MW-6D MW-10AB (ND)
MW-11A S Hydraulic Conductivity Well MW-33 MW-2A UPPU
PUMW-19AC West Highway 6 amp Highway 281 Site MW-14A APU
MW-20DE MW-106D A Monitoring WellMW-104DPSSU PU PPPUUU (NDND)
MW-12C (ND)(ND)MW-8A MW-13E PU
UUUUU (ND) Carbon Tetrachloride ConcentrationU PPPPPPPPUUUUPU (190)PPUUU
PPUPPPPPPPPPPPPPPPUUUUUP
UUUUU UUUUUUU PPP A MW-105DMW-1A in micrograms per liter (microgL) AMW-30DE
PPUUPPPUUUPPPPPUUUUU(52)
(NDND) MW-12DNew RollsMW-49D (ND) (ND)
Carbon Tetrachloride Isoconcentration(ND) MW-45D PPUUMW-51D (ND)
MW-46 D1PPUU PPUU Contour (microgL)MW-50D (ND) (5)(ND)
PPPUUU (770)PPPUUU MW-42 DMW-48D (Dashed Lines are Estimated)MW-4AB (4274)(ND)
MW-44DEMW-46 D2 MW-17D (320) (19ND)MW-7AB
MW-5D Domestic Irrigation W ater Wells(94) MW-18D PPUUMW-31C(ND) (21) MW-41 D1MW-5B MW-16C PPUU (ND)
PPUUMW-41 D2 (10) Notes
MW-43DE UUPP(ND18) (ND) Nondetect
0 2500 5000
Feet sup3 Filename XEPA009GarveyGW_Flow_Tech_Memo Carbon_TetChl_LoweR_Aquifer_Dmxd Project EP903401220202 Revised 061312 ST Source ENSR GDB 2008 DNR
_L _j I I I I _j_ I I I
I l --- I 111
1
__u_ I I
1 I ~ N ----y-
+ ~ I
II L _l e11111111111 I ---1 ~lJJ I n r Igt I Constant Head Boundariesj l _Q No Flow Sound aries I I l
~ r-- I - I middot r-
- fl+- L -
0 I J ~r-
Ll-D l Garvey Site I - ~t
Ill -J
l unJprm Spacing 25 eet U~iform S pacing 1 00 feet I Constant Head Boundaries
j
middotmiddot- ~ No Flow Sound aries
J
--=J--=11-~=======2~-----~3=========4~------5 M1les 0 05
Figure 51 Model Domain Gridding and Boundaries
Figure 52 Vertical Discretization of Model
1610
1620
1 6 2 0
1630
1 6 3 0
1640
1 6 4 0
1650
1 6 5 0
1660
1660
1670
1670
1680
1680
1690
17
1698
17013
16918
169198
169118
165864
167129
168901
169482
169872
169403
169347
169374
169448
Figure 53 Elevation of the Model Base (weathered shale of the Niobrara Formation)
1111
I I
-
N
+ 0 05
I I
I 1 l
I
1 l -
2 3 4 Miles
Figure 54 Elevation of the Top of the Lower Aquifer
Figure 55 Isopach Map of Lower Confining Unit (model Layer 4)
Figure 56 Elevation of the Base of the Medial Aquifer
Figure 57 Isopach of Upper Aquitard (model layer 2)
Figure 58 Elevation of the Base of the Upper Aquifer
I I I
~ ~ t--7 t bull I I I
r I l
I EW-01 f1-m I N I bull __ j
+ twtrl I I I rl bull I I I I J I I I -r-----
- middot-- - -- -- middot------__J_--
I --- 1 Feet I 0 500 1 000 2000 3000 4000 rooo I I I I
Figure 59 Location of Recovery Wells in the Shallow Aquifer
_l ________ l I I I -1 middot ] l ~----------middotj + I j
middotmiddot= middotmiddot- ---------L -- ---- ___ _ [_ __
r--------shy1
o--~oomiddoto~bull1~oo=o ======4~oomiddoto------middot~ooco=======43oobullo -------~oo~1
Figure 510 Location of Recovery Wells in the Medial Aquifer
I I r
~~ r -
L - - - -- -1--ltmiddot --I-
I -
---- L f+r
il I
J ---1
I
N
+
Figure 511 Location of Injection and Municipal Wells in the Lower Aquifer
Figure 512 Initial Concentrations of Carbon Tetrachloride in the Shallow Aquifer
Figure 513 Initial Concentrations of Carbon Tetrachloride in the Medial Aquifer
Figure 514 Initial Concentrations of Carbon Tetrachloride in the Lower Aquifer
-40
-30
-20
-10
00
10
20
30
40
17741 17828 17915 18002 18090 18177
Res
idua
l
Layer 1
Layer 3
Layer 5
Observed Value
Figure 61 Error Residuals Versus Measured Water Levels
Layer 1
Layer 3
18090
18177
Layer 5
Mod
el V
alue
17741 17828 17915 18002 18090 18177
18002
17915
17828
17741
Observed Value
Figure 62 Measured Water Levels Versus Predicted Water Levels
bull -020
N
+ 0
h I I
-----------~----j_ _______ ___ j_94-__ _ __ I ------------- t
011
bull 005
05
bull
I
Mile 1
Figure 63 Error Residuals for the Shallow Aquifer in the vicinity of the Garvey Elevator Site
Figure 64 Error Residuals for the Shallow Aquifer Over the Model Domain
-007 bull
N
+
il _ __ ~ II
t079 i
I 1 II_ --middot--middot- J_~=====-middot 1------~
~--1 000 r-----middot- -middotmiddot ____
-021 bull
-012 007 bull bull
l middot l02
I ~~~~====~---====~---Feet _ o ___ _ $-_~_0 _ ___ _ J000 _____ 3QQ_Q_ ---4lIJOLUlJ00----ltgt5ultOOO-- middott- middot ----
I
Figure 65 Error Residuals for the Medial Aquifer Over the Model Domain
0 250
N
+
044 bullbull -042
000 bull
027 bull
013
-)35 bull
Figure 66 Error Residuals for the Lower Aquifer in the Vicinity of the Garvey Elevator Site
Figure 67 Error Residuals for the Lower Aquifer in the Entire Model Domain
Figure 68 Calibrated Hydraulic Conductivities of the Shallow Aquifer (ftd) (model layer 1)
Figure 69 Calibrated Hydraulic Conductivities of the Medial Aquifer (ftd) (model layer 3)
Figure 610 Calibrated Hydraulic Conductivities of the Lower Aquifer (ftd) (model layer 5)
Figure 611 Calibrated Hydraulic Conductivities of the Upper Aquitard (ftd) (model layer 2)
Figure 612 Calibrated Hydraulic Conductivities of the Lower Aquitard (ftd) (model layer 4)
Figure 613 Calibrated Potentiometric Surface of the Shallow Aquifer (model layer 1)
Figure 614 Calibrated Potentiometric Surface of the Medial Aquifer (model layer 3)
Figure 615 Calibrated Potentiometric Surface of the Lower Aquifer (model layer 5)
Figure 616 Particle Tracking Analysis to Estimate Travel Time
Figure 71 Initial Concentrations for Alternative SG3
E3 E3 2000feet
Figure 72 Capture Zone Analysis in the Shallow Aquifer for Alternative SG3
E3 E3 E3 2000feet
Figure 73 Capture Zone Analysis in the Medial Aquifer for Alternative SG3
Figure 74 Alternative G2-Proposed Recovery Wells Medial Aquifer
Figure 75 Alternative G2- Proposed Recovery Wells Lower Aquifer
50
5 5
5
50 100
MW-3DE (NDND)
MW-47D MW-9A (ND)
HTW 40 MW-6D MW-10AB
(ND) MW-11A
MW-2AMW-33 UPPUPU
MW-19AC MW-14A APUMW-20DE MW-106DMW-104D(NDND) MW-12CPSSU (ND)PU PPPUUU PU (ND) MW-13E
HGLmdashGroundwater Flow Modeling Technical Memorandum Garvey Elevator Superfund SitemdashHastings NE
Figure 76 Preliminary Locations for Leading
Edge Recovery Wells and Groundwater Treatment Building-Alternative G2
Legend Garvey Property Boundary
Railroad
Ntilde Monitoring Well Location
Multilevel Well
S Hydraulic Conductivity Well
A West Highway 6 amp Highway 281 Site Monitoring Well
(190) Carbon Tetrachloride Concentration in micrograms per liter (microgL)
Carbon Tetrachloride Isoconcentration Treatment Building
Technical Blvd
MW-8A UUUU UUUUU
U PPPPPPPPUUUUPU UUUUUUPUP
UUUUUPPPPPPPPPPPPPPPPPP (ND)
PPPUUU A MW-105DMW-1A UU AMW-30DE PPUUPPPUUUPPPPPUUUUU
(52)(NDND) MW-12DNew Rolls Contour (Lower Aquifer) (microgL)MW-49D (5)(ND) (ND)
(ND) MW-45D (Dashed Lines are Estimated)PPUUMW-51D (ND) MW-46 D1PPUU PPUUMW-50D
(ND) (ND)
PPPUUU (770)PPPUUU MW-42 DMW-48D Domestic Irrigation W ater WellsMW-4AB (4274) MW-44DE(ND)
(19ND)MW-46 D2 MW-17D (320)MW-7AB Carbon Tetrachloride Isoconcentration(94)MW-5D
MW-18D PPUU (5) Contour (Upper Aquifer) (microgL)(21) MW-41 D1 MW-31C(ND)
MW-5B MW-16C PPUU (Dashed Lines are Estimated)(ND)
PPUUIdlewilde Rd
MW-41 D2 Recovery Wells (Medial)
Recovery Wells (Deep)
(10)
MW-43DE PPUU(ND18)
Recovery Well Piping
Treatment Building
Notes (ND) Nondetect
Blaine A
ve
Showboa t B
lvd
sup3 Filename XEPA009GarveyGW_Flow_Tech_Memo Carbon_TetChl_LoweR_Aquifer_Dmxd Project EP903401220202 Revised 061312 ST2500 5000 Source ENSR GDB 2008 DNR
Feet
0
Figure 77 Alternative G3ab-Proposed Recovery Wells Medial Aquifer
Figure 78 Alternative G3a- Proposed Recovery Wells Lower Aquifer
50
5 5
5
50 100
HGLmdashGroundwater Flow Modeling Technical Memorandum Garvey Elevator Superfund SitemdashHastings NE
Figure 79 Preliminary Locations for Mid-Plume and
Leading Edge Recovery Wells and Groundwater Treatment Building-Alternative G3
Legend Garvey Property Boundary
Railroad
Ntilde Monitoring Well Location MW-3DE (NDND)
Multilevel Well MW-47D
MW-9A (ND) Hydraulic Conductivity WellSHTW 40 MW-6D MW-10AB
(ND) West Highway 6 amp Highway 281 SiteMW-11A
MW-33 PPUUMW-2A PUA Monitoring Well
MW-19AC MW-14A APUCarbon Tetrachloride Concentration
Technical Blvd
MW-44DE (19ND) (Dashed Lines are Estimated)
MW-20DE (190)MW-106DPSSU PU PPPUUU MW-104DMW-12C(NDND) (ND)PU in micrograms per liter (microgL)(ND) MW-13EMW-8A
U UUUU UPUPPPPUUUUUUUUP UUUUU UUUPPPPPPPPPPPPPPPPPPPPPPPUUUUUU
(ND) PPPUUU A Treatment BuildingMW-105DMW-1A Carbon Tetrachloride IsoconcentrationMW-30DE A
PPUUPPPUUUPPPPPUUUUU(52)
(NDND) MW-12DNew Rolls Contour (Lower Aquifer) (microgL)MW-49D (5)(ND) (ND)(ND) MW-45D
MW-51D PPUU(ND)
PPUU PPUUMW-50D (ND)
MW-46 D1(ND) PPPUUU (770)
PPPUUU MW-42 D (4274)
MW-48D Domestic Irrigation W ater WellsMW-4AB (ND) MW-46 D2
MW-17DMW-7AB (320)(94) Carbon Tetrachloride IsoconcentrationMW-5D
MW-18D(ND) MW-31C (21) PPMW-41 D1
UU (5) Contour (Upper Aquifer) (microgL)MW-5B MW-16C UU (ND)PP (Dashed Lines are Estimated)PPUUIdlewilde Rd
MW-41 D2 Recovery Wells (Medial)(10)
MW-43DE UUPP(ND18) Recovery Wells (Deep)
Recovery Well Piping
Treatment Building
Notes (ND) Nondetect
Blaine A
ve
Showboa t B
lvd
sup3 Filename XEPA009GarveyGW_Flow_Tech_Memo Mid-Plume_Prelim_Loc Project EP903401220202 Revised 061312 RL2500 5000 Source ENSR GDB 2008 DNR
Feet
0
Figure 710 Alternative G3b-Proposed Recovery Wells Lower Aquifer
Figure 711 Alternative G3b-Relative Positions of Proposed Recovery Wells Medial and Lower Aquifers
Figure 712 Alternative G4a-Proposed Treatment Curtain and Recovery Wells Lower Aquifer
50
5 5
5
50 100
HGLmdashGroundwater Flow Modeling Technical Memorandum Garvey Elevator Superfund SitemdashHastings NE
Figure 713 Preliminary Locations for Mid-Plume
Injection Wells Leading Edge Recovery Wells and Groundwater Treatment Building
-Alternative G4
Legend Garvey Property Boundary
Railroad
Ntilde Monitoring Well Location MW-3DE (NDND)
MW-47D MW-9A (ND)
HTW 40 MW-6D MW-10AB
(ND)
S Elm
Ave
S Wabash A
ve
Multilevel Well
S Hydraulic Conductivity Well
A West Highway 6 amp Highway 281 Site Monitoring Well
MW-11AMW-33 UPPUMW-2A PU
MW-19AC MW-14A APUMW-20DE MW-106D Carbon Tetrachloride ConcentrationPU PPPUUU (190)PSSU MW-104D(NDND) MW-12C (ND)PU in micrograms per liter (microgL)(ND)
Treatment Building Technical B
lvd MW-13EMW-8A
UUUU UUUUUU PPPPPPPPUUUUPU UUUUU
UPUP
UUUUUPPPPPPPPPPPPPPPPPP (ND)
PPPUUU A MW-105DMW-1A UU Carbon Tetrachloride IsoconcentrationAMW-30DE PPUUPPPUUUPPPPPUUUUU
(52)(NDND) MW-12DNew Rolls Contour (Lower Aquifer) (microgL)MW-49D (5)(ND) (ND)
(ND) MW-45D (Dashed Lines are Estimated)PPUUMW-51D (ND) MW-46 D1PPUU PPUUMW-50D
(ND) (ND)
PPPUUU (770)PPPUUU MW-42 DMW-48D Domestic Irrigation W ater WellsMW-4AB (4274)(ND) MW-44DEMW-46 D2
(19ND)MW-17D (320)MW-7AB Carbon Tetrachloride Isoconcentration(94)MW-5D MW-18D PPUU (5) Contour (Upper Aquifer) (microgL)(21) MW-41 D1
MW-31C(ND) MW-5B MW-16C PPUU (Dashed Lines are Estimated)(ND)
PPUUIdlewilde Rd
MW-41 D2 Recovery Wells (Medial)
Recovery Wells (Deep)
(10) Injection Area 1 MW-43DE PPUUPermanent Injection Well Spacing 40 ft (ND18)
Total Injection Wells Installed 39 Recovery Well Piping Injection Area (40 ft spacing between the wells) Treatment Building
Notes (ND) Nondetect
Blaine A
ve
Showboa t B
lvd
S Baltim
ore Ave
sup3 Filename XEPA009GarveyGW_Flow_Tech_Memo G4_Prelim_Loc_Inj_Areamxd Project EP903401220202 Revised 061312 RL2500 5000 Source ENSR GDB 2008 DNR
Feet
0
Figure 714 Alternative G4b-Proposed Treatment Curtains and Recovery Wells Lower Aquifer
Figure 715 Alternative G4b-Relative Positions of Proposed Recovery Wells and Treatment Curtains

50
5
5
50 100
MW-6D SB-39 HGLmdashGroundwater Flow Modeling Technical MemorandumHTW 40 (ND) SB-38MW-3DE ( Garvey Elevator SitemdashHastings NE (NDND)
UUUUPSUS P PPP MW-19AC( Figure 33MW-2A MW-33 MW47D
U (ND)
Carbon Tetrachloride in theMW-8A PPPPUUUU P Lower Aquifer Zone DEUMW-1A MW-20DEPU P
(NDND)UPUU
September 2011 Sampling MW-13EPPUUPPPU (ND)
MW50D UPMW49D (ND) UUU(ND) PPP MW-30DE Legend MW51D (ND)
(ND)MW-4AB MW48D (ND)
MW-7AB MW-5D (ND) Garvey Property Boundary
MW-31C (ND)
PPUU
(
RailroadSB-33MW-3DE (NDND)
Inset Ntilde Monitoring Well Location MW-47D
MW-9A (ND) Multilevel Well HTW 40
MW-6D MW-10AB (ND)
MW-11A S Hydraulic Conductivity Well MW-33 MW-2A UPPU
PUMW-19AC West Highway 6 amp Highway 281 Site MW-14A APU
MW-20DE MW-106D A Monitoring WellMW-104DPSSU PU PPPUUU (NDND)
MW-12C (ND)(ND)MW-8A MW-13E PU
UUUUU (ND) Carbon Tetrachloride ConcentrationU PPPPPPPPUUUUPU (190)PPUUU
PPUPPPPPPPPPPPPPPPUUUUUP
UUUUU UUUUUUU PPP A MW-105DMW-1A in micrograms per liter (microgL) AMW-30DE
PPUUPPPUUUPPPPPUUUUU(52)
(NDND) MW-12DNew RollsMW-49D (ND) (ND)
Carbon Tetrachloride Isoconcentration(ND) MW-45D PPUUMW-51D (ND)
MW-46 D1PPUU PPUU Contour (microgL)MW-50D (ND) (5)(ND)
PPPUUU (770)PPPUUU MW-42 DMW-48D (Dashed Lines are Estimated)MW-4AB (4274)(ND)
MW-44DEMW-46 D2 MW-17D (320) (19ND)MW-7AB
MW-5D Domestic Irrigation W ater Wells(94) MW-18D PPUUMW-31C(ND) (21) MW-41 D1MW-5B MW-16C PPUU (ND)
PPUUMW-41 D2 (10) Notes
MW-43DE UUPP(ND18) (ND) Nondetect
0 2500 5000
Feet sup3 Filename XEPA009GarveyGW_Flow_Tech_Memo Carbon_TetChl_LoweR_Aquifer_Dmxd Project EP903401220202 Revised 061312 ST Source ENSR GDB 2008 DNR
_L _j I I I I _j_ I I I
I l --- I 111
1
__u_ I I
1 I ~ N ----y-
+ ~ I
II L _l e11111111111 I ---1 ~lJJ I n r Igt I Constant Head Boundariesj l _Q No Flow Sound aries I I l
~ r-- I - I middot r-
- fl+- L -
0 I J ~r-
Ll-D l Garvey Site I - ~t
Ill -J
l unJprm Spacing 25 eet U~iform S pacing 1 00 feet I Constant Head Boundaries
j
middotmiddot- ~ No Flow Sound aries
J
--=J--=11-~=======2~-----~3=========4~------5 M1les 0 05
Figure 51 Model Domain Gridding and Boundaries
Figure 52 Vertical Discretization of Model
1610
1620
1 6 2 0
1630
1 6 3 0
1640
1 6 4 0
1650
1 6 5 0
1660
1660
1670
1670
1680
1680
1690
17
1698
17013
16918
169198
169118
165864
167129
168901
169482
169872
169403
169347
169374
169448
Figure 53 Elevation of the Model Base (weathered shale of the Niobrara Formation)
1111
I I
-
N
+ 0 05
I I
I 1 l
I
1 l -
2 3 4 Miles
Figure 54 Elevation of the Top of the Lower Aquifer
Figure 55 Isopach Map of Lower Confining Unit (model Layer 4)
Figure 56 Elevation of the Base of the Medial Aquifer
Figure 57 Isopach of Upper Aquitard (model layer 2)
Figure 58 Elevation of the Base of the Upper Aquifer
I I I
~ ~ t--7 t bull I I I
r I l
I EW-01 f1-m I N I bull __ j
+ twtrl I I I rl bull I I I I J I I I -r-----
- middot-- - -- -- middot------__J_--
I --- 1 Feet I 0 500 1 000 2000 3000 4000 rooo I I I I
Figure 59 Location of Recovery Wells in the Shallow Aquifer
_l ________ l I I I -1 middot ] l ~----------middotj + I j
middotmiddot= middotmiddot- ---------L -- ---- ___ _ [_ __
r--------shy1
o--~oomiddoto~bull1~oo=o ======4~oomiddoto------middot~ooco=======43oobullo -------~oo~1
Figure 510 Location of Recovery Wells in the Medial Aquifer
I I r
~~ r -
L - - - -- -1--ltmiddot --I-
I -
---- L f+r
il I
J ---1
I
N
+
Figure 511 Location of Injection and Municipal Wells in the Lower Aquifer
Figure 512 Initial Concentrations of Carbon Tetrachloride in the Shallow Aquifer
Figure 513 Initial Concentrations of Carbon Tetrachloride in the Medial Aquifer
Figure 514 Initial Concentrations of Carbon Tetrachloride in the Lower Aquifer
-40
-30
-20
-10
00
10
20
30
40
17741 17828 17915 18002 18090 18177
Res
idua
l
Layer 1
Layer 3
Layer 5
Observed Value
Figure 61 Error Residuals Versus Measured Water Levels
Layer 1
Layer 3
18090
18177
Layer 5
Mod
el V
alue
17741 17828 17915 18002 18090 18177
18002
17915
17828
17741
Observed Value
Figure 62 Measured Water Levels Versus Predicted Water Levels
bull -020
N
+ 0
h I I
-----------~----j_ _______ ___ j_94-__ _ __ I ------------- t
011
bull 005
05
bull
I
Mile 1
Figure 63 Error Residuals for the Shallow Aquifer in the vicinity of the Garvey Elevator Site
Figure 64 Error Residuals for the Shallow Aquifer Over the Model Domain
-007 bull
N
+
il _ __ ~ II
t079 i
I 1 II_ --middot--middot- J_~=====-middot 1------~
~--1 000 r-----middot- -middotmiddot ____
-021 bull
-012 007 bull bull
l middot l02
I ~~~~====~---====~---Feet _ o ___ _ $-_~_0 _ ___ _ J000 _____ 3QQ_Q_ ---4lIJOLUlJ00----ltgt5ultOOO-- middott- middot ----
I
Figure 65 Error Residuals for the Medial Aquifer Over the Model Domain
0 250
N
+
044 bullbull -042
000 bull
027 bull
013
-)35 bull
Figure 66 Error Residuals for the Lower Aquifer in the Vicinity of the Garvey Elevator Site
Figure 67 Error Residuals for the Lower Aquifer in the Entire Model Domain
Figure 68 Calibrated Hydraulic Conductivities of the Shallow Aquifer (ftd) (model layer 1)
Figure 69 Calibrated Hydraulic Conductivities of the Medial Aquifer (ftd) (model layer 3)
Figure 610 Calibrated Hydraulic Conductivities of the Lower Aquifer (ftd) (model layer 5)
Figure 611 Calibrated Hydraulic Conductivities of the Upper Aquitard (ftd) (model layer 2)
Figure 612 Calibrated Hydraulic Conductivities of the Lower Aquitard (ftd) (model layer 4)
Figure 613 Calibrated Potentiometric Surface of the Shallow Aquifer (model layer 1)
Figure 614 Calibrated Potentiometric Surface of the Medial Aquifer (model layer 3)
Figure 615 Calibrated Potentiometric Surface of the Lower Aquifer (model layer 5)
Figure 616 Particle Tracking Analysis to Estimate Travel Time
Figure 71 Initial Concentrations for Alternative SG3
E3 E3 2000feet
Figure 72 Capture Zone Analysis in the Shallow Aquifer for Alternative SG3
E3 E3 E3 2000feet
Figure 73 Capture Zone Analysis in the Medial Aquifer for Alternative SG3
Figure 74 Alternative G2-Proposed Recovery Wells Medial Aquifer
Figure 75 Alternative G2- Proposed Recovery Wells Lower Aquifer
50
5 5
5
50 100
MW-3DE (NDND)
MW-47D MW-9A (ND)
HTW 40 MW-6D MW-10AB
(ND) MW-11A
MW-2AMW-33 UPPUPU
MW-19AC MW-14A APUMW-20DE MW-106DMW-104D(NDND) MW-12CPSSU (ND)PU PPPUUU PU (ND) MW-13E
HGLmdashGroundwater Flow Modeling Technical Memorandum Garvey Elevator Superfund SitemdashHastings NE
Figure 76 Preliminary Locations for Leading
Edge Recovery Wells and Groundwater Treatment Building-Alternative G2
Legend Garvey Property Boundary
Railroad
Ntilde Monitoring Well Location
Multilevel Well
S Hydraulic Conductivity Well
A West Highway 6 amp Highway 281 Site Monitoring Well
(190) Carbon Tetrachloride Concentration in micrograms per liter (microgL)
Carbon Tetrachloride Isoconcentration Treatment Building
Technical Blvd
MW-8A UUUU UUUUU
U PPPPPPPPUUUUPU UUUUUUPUP
UUUUUPPPPPPPPPPPPPPPPPP (ND)
PPPUUU A MW-105DMW-1A UU AMW-30DE PPUUPPPUUUPPPPPUUUUU
(52)(NDND) MW-12DNew Rolls Contour (Lower Aquifer) (microgL)MW-49D (5)(ND) (ND)
(ND) MW-45D (Dashed Lines are Estimated)PPUUMW-51D (ND) MW-46 D1PPUU PPUUMW-50D
(ND) (ND)
PPPUUU (770)PPPUUU MW-42 DMW-48D Domestic Irrigation W ater WellsMW-4AB (4274) MW-44DE(ND)
(19ND)MW-46 D2 MW-17D (320)MW-7AB Carbon Tetrachloride Isoconcentration(94)MW-5D
MW-18D PPUU (5) Contour (Upper Aquifer) (microgL)(21) MW-41 D1 MW-31C(ND)
MW-5B MW-16C PPUU (Dashed Lines are Estimated)(ND)
PPUUIdlewilde Rd
MW-41 D2 Recovery Wells (Medial)
Recovery Wells (Deep)
(10)
MW-43DE PPUU(ND18)
Recovery Well Piping
Treatment Building
Notes (ND) Nondetect
Blaine A
ve
Showboa t B
lvd
sup3 Filename XEPA009GarveyGW_Flow_Tech_Memo Carbon_TetChl_LoweR_Aquifer_Dmxd Project EP903401220202 Revised 061312 ST2500 5000 Source ENSR GDB 2008 DNR
Feet
0
Figure 77 Alternative G3ab-Proposed Recovery Wells Medial Aquifer
Figure 78 Alternative G3a- Proposed Recovery Wells Lower Aquifer
50
5 5
5
50 100
HGLmdashGroundwater Flow Modeling Technical Memorandum Garvey Elevator Superfund SitemdashHastings NE
Figure 79 Preliminary Locations for Mid-Plume and
Leading Edge Recovery Wells and Groundwater Treatment Building-Alternative G3
Legend Garvey Property Boundary
Railroad
Ntilde Monitoring Well Location MW-3DE (NDND)
Multilevel Well MW-47D
MW-9A (ND) Hydraulic Conductivity WellSHTW 40 MW-6D MW-10AB
(ND) West Highway 6 amp Highway 281 SiteMW-11A
MW-33 PPUUMW-2A PUA Monitoring Well
MW-19AC MW-14A APUCarbon Tetrachloride Concentration
Technical Blvd
MW-44DE (19ND) (Dashed Lines are Estimated)
MW-20DE (190)MW-106DPSSU PU PPPUUU MW-104DMW-12C(NDND) (ND)PU in micrograms per liter (microgL)(ND) MW-13EMW-8A
U UUUU UPUPPPPUUUUUUUUP UUUUU UUUPPPPPPPPPPPPPPPPPPPPPPPUUUUUU
(ND) PPPUUU A Treatment BuildingMW-105DMW-1A Carbon Tetrachloride IsoconcentrationMW-30DE A
PPUUPPPUUUPPPPPUUUUU(52)
(NDND) MW-12DNew Rolls Contour (Lower Aquifer) (microgL)MW-49D (5)(ND) (ND)(ND) MW-45D
MW-51D PPUU(ND)
PPUU PPUUMW-50D (ND)
MW-46 D1(ND) PPPUUU (770)
PPPUUU MW-42 D (4274)
MW-48D Domestic Irrigation W ater WellsMW-4AB (ND) MW-46 D2
MW-17DMW-7AB (320)(94) Carbon Tetrachloride IsoconcentrationMW-5D
MW-18D(ND) MW-31C (21) PPMW-41 D1
UU (5) Contour (Upper Aquifer) (microgL)MW-5B MW-16C UU (ND)PP (Dashed Lines are Estimated)PPUUIdlewilde Rd
MW-41 D2 Recovery Wells (Medial)(10)
MW-43DE UUPP(ND18) Recovery Wells (Deep)
Recovery Well Piping
Treatment Building
Notes (ND) Nondetect
Blaine A
ve
Showboa t B
lvd
sup3 Filename XEPA009GarveyGW_Flow_Tech_Memo Mid-Plume_Prelim_Loc Project EP903401220202 Revised 061312 RL2500 5000 Source ENSR GDB 2008 DNR
Feet
0
Figure 710 Alternative G3b-Proposed Recovery Wells Lower Aquifer
Figure 711 Alternative G3b-Relative Positions of Proposed Recovery Wells Medial and Lower Aquifers
Figure 712 Alternative G4a-Proposed Treatment Curtain and Recovery Wells Lower Aquifer
50
5 5
5
50 100
HGLmdashGroundwater Flow Modeling Technical Memorandum Garvey Elevator Superfund SitemdashHastings NE
Figure 713 Preliminary Locations for Mid-Plume
Injection Wells Leading Edge Recovery Wells and Groundwater Treatment Building
-Alternative G4
Legend Garvey Property Boundary
Railroad
Ntilde Monitoring Well Location MW-3DE (NDND)
MW-47D MW-9A (ND)
HTW 40 MW-6D MW-10AB
(ND)
S Elm
Ave
S Wabash A
ve
Multilevel Well
S Hydraulic Conductivity Well
A West Highway 6 amp Highway 281 Site Monitoring Well
MW-11AMW-33 UPPUMW-2A PU
MW-19AC MW-14A APUMW-20DE MW-106D Carbon Tetrachloride ConcentrationPU PPPUUU (190)PSSU MW-104D(NDND) MW-12C (ND)PU in micrograms per liter (microgL)(ND)
Treatment Building Technical B
lvd MW-13EMW-8A
UUUU UUUUUU PPPPPPPPUUUUPU UUUUU
UPUP
UUUUUPPPPPPPPPPPPPPPPPP (ND)
PPPUUU A MW-105DMW-1A UU Carbon Tetrachloride IsoconcentrationAMW-30DE PPUUPPPUUUPPPPPUUUUU
(52)(NDND) MW-12DNew Rolls Contour (Lower Aquifer) (microgL)MW-49D (5)(ND) (ND)
(ND) MW-45D (Dashed Lines are Estimated)PPUUMW-51D (ND) MW-46 D1PPUU PPUUMW-50D
(ND) (ND)
PPPUUU (770)PPPUUU MW-42 DMW-48D Domestic Irrigation W ater WellsMW-4AB (4274)(ND) MW-44DEMW-46 D2
(19ND)MW-17D (320)MW-7AB Carbon Tetrachloride Isoconcentration(94)MW-5D MW-18D PPUU (5) Contour (Upper Aquifer) (microgL)(21) MW-41 D1
MW-31C(ND) MW-5B MW-16C PPUU (Dashed Lines are Estimated)(ND)
PPUUIdlewilde Rd
MW-41 D2 Recovery Wells (Medial)
Recovery Wells (Deep)
(10) Injection Area 1 MW-43DE PPUUPermanent Injection Well Spacing 40 ft (ND18)
Total Injection Wells Installed 39 Recovery Well Piping Injection Area (40 ft spacing between the wells) Treatment Building
Notes (ND) Nondetect
Blaine A
ve
Showboa t B
lvd
S Baltim
ore Ave
sup3 Filename XEPA009GarveyGW_Flow_Tech_Memo G4_Prelim_Loc_Inj_Areamxd Project EP903401220202 Revised 061312 RL2500 5000 Source ENSR GDB 2008 DNR
Feet
0
Figure 714 Alternative G4b-Proposed Treatment Curtains and Recovery Wells Lower Aquifer
Figure 715 Alternative G4b-Relative Positions of Proposed Recovery Wells and Treatment Curtains
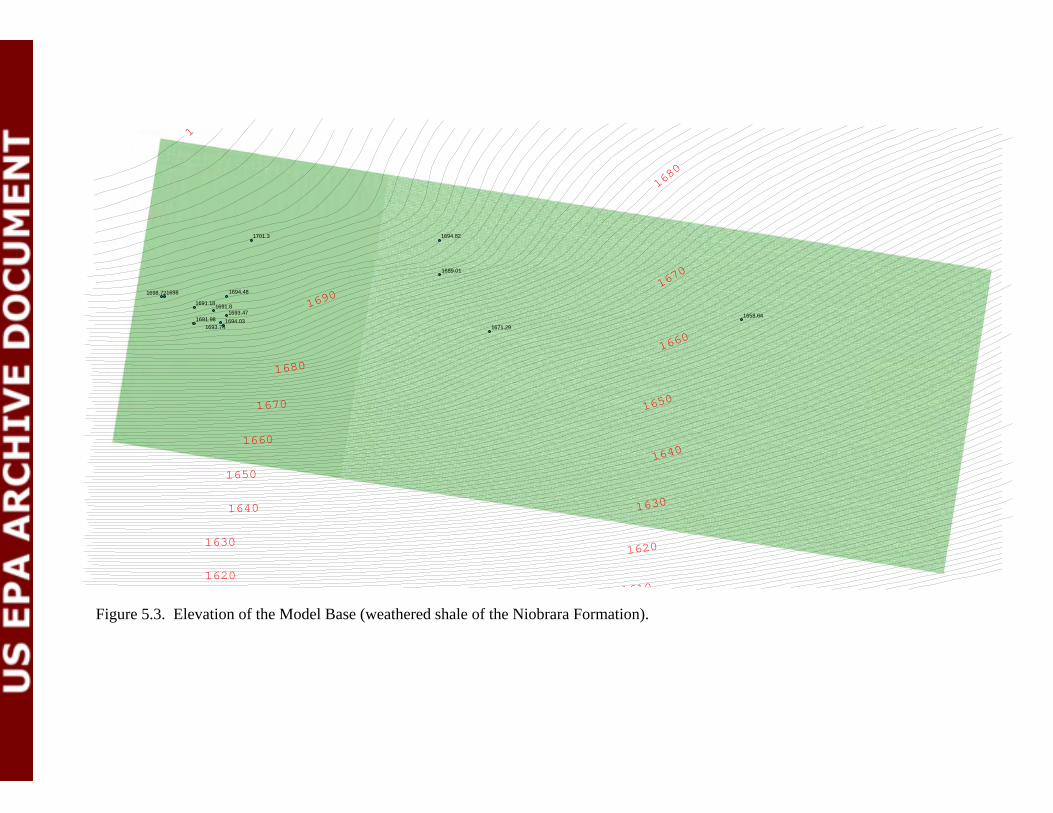
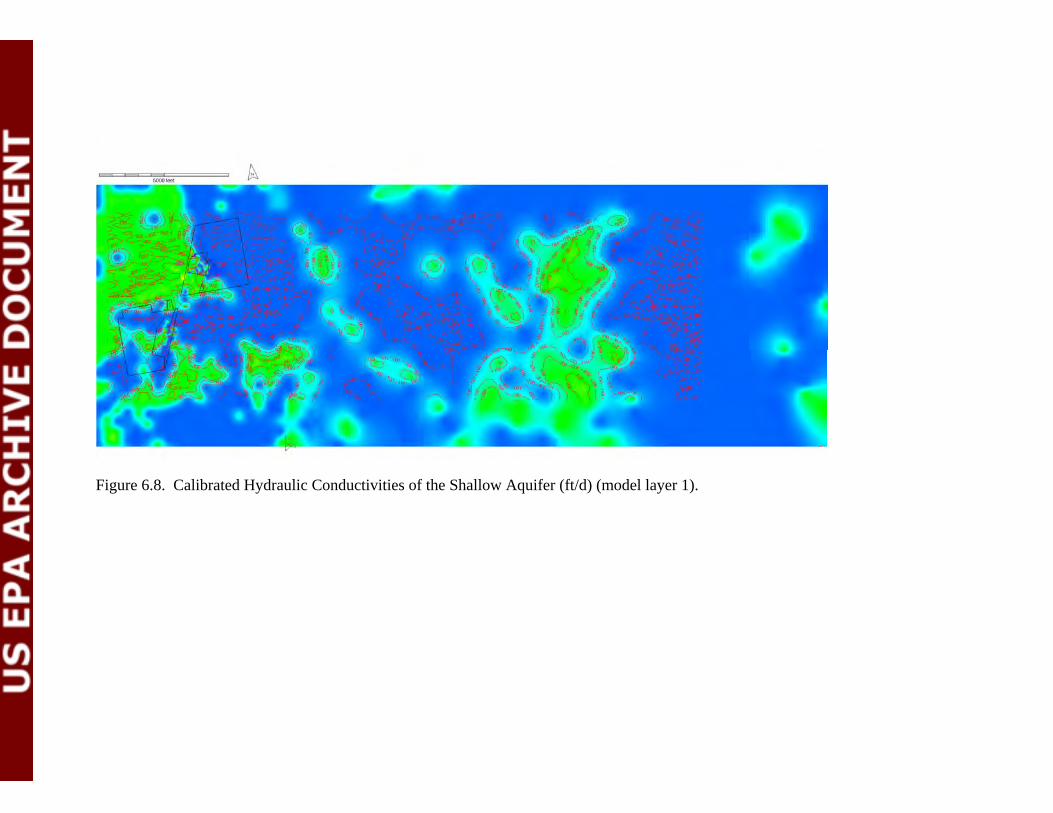

50
5 5
5
50 100
MW-3DE (NDND)
MW-47D MW-9A (ND)
HTW 40 MW-6D MW-10AB
(ND) MW-11A
MW-2AMW-33 UPPUPU
MW-19AC MW-14A APUMW-20DE MW-106DMW-104D(NDND) MW-12CPSSU (ND)PU PPPUUU PU (ND) MW-13E
HGLmdashGroundwater Flow Modeling Technical Memorandum Garvey Elevator Superfund SitemdashHastings NE
Figure 76 Preliminary Locations for Leading
Edge Recovery Wells and Groundwater Treatment Building-Alternative G2
Legend Garvey Property Boundary
Railroad
Ntilde Monitoring Well Location
Multilevel Well
S Hydraulic Conductivity Well
A West Highway 6 amp Highway 281 Site Monitoring Well
(190) Carbon Tetrachloride Concentration in micrograms per liter (microgL)
Carbon Tetrachloride Isoconcentration Treatment Building
Technical Blvd
MW-8A UUUU UUUUU
U PPPPPPPPUUUUPU UUUUUUPUP
UUUUUPPPPPPPPPPPPPPPPPP (ND)
PPPUUU A MW-105DMW-1A UU AMW-30DE PPUUPPPUUUPPPPPUUUUU
(52)(NDND) MW-12DNew Rolls Contour (Lower Aquifer) (microgL)MW-49D (5)(ND) (ND)
(ND) MW-45D (Dashed Lines are Estimated)PPUUMW-51D (ND) MW-46 D1PPUU PPUUMW-50D
(ND) (ND)
PPPUUU (770)PPPUUU MW-42 DMW-48D Domestic Irrigation W ater WellsMW-4AB (4274) MW-44DE(ND)
(19ND)MW-46 D2 MW-17D (320)MW-7AB Carbon Tetrachloride Isoconcentration(94)MW-5D
MW-18D PPUU (5) Contour (Upper Aquifer) (microgL)(21) MW-41 D1 MW-31C(ND)
MW-5B MW-16C PPUU (Dashed Lines are Estimated)(ND)
PPUUIdlewilde Rd
MW-41 D2 Recovery Wells (Medial)
Recovery Wells (Deep)
(10)
MW-43DE PPUU(ND18)
Recovery Well Piping
Treatment Building
Notes (ND) Nondetect
Blaine A
ve
Showboa t B
lvd
sup3 Filename XEPA009GarveyGW_Flow_Tech_Memo Carbon_TetChl_LoweR_Aquifer_Dmxd Project EP903401220202 Revised 061312 ST2500 5000 Source ENSR GDB 2008 DNR
Feet
0
Figure 77 Alternative G3ab-Proposed Recovery Wells Medial Aquifer
Figure 78 Alternative G3a- Proposed Recovery Wells Lower Aquifer
50
5 5
5
50 100
HGLmdashGroundwater Flow Modeling Technical Memorandum Garvey Elevator Superfund SitemdashHastings NE
Figure 79 Preliminary Locations for Mid-Plume and
Leading Edge Recovery Wells and Groundwater Treatment Building-Alternative G3
Legend Garvey Property Boundary
Railroad
Ntilde Monitoring Well Location MW-3DE (NDND)
Multilevel Well MW-47D
MW-9A (ND) Hydraulic Conductivity WellSHTW 40 MW-6D MW-10AB
(ND) West Highway 6 amp Highway 281 SiteMW-11A
MW-33 PPUUMW-2A PUA Monitoring Well
MW-19AC MW-14A APUCarbon Tetrachloride Concentration
Technical Blvd
MW-44DE (19ND) (Dashed Lines are Estimated)
MW-20DE (190)MW-106DPSSU PU PPPUUU MW-104DMW-12C(NDND) (ND)PU in micrograms per liter (microgL)(ND) MW-13EMW-8A
U UUUU UPUPPPPUUUUUUUUP UUUUU UUUPPPPPPPPPPPPPPPPPPPPPPPUUUUUU
(ND) PPPUUU A Treatment BuildingMW-105DMW-1A Carbon Tetrachloride IsoconcentrationMW-30DE A
PPUUPPPUUUPPPPPUUUUU(52)
(NDND) MW-12DNew Rolls Contour (Lower Aquifer) (microgL)MW-49D (5)(ND) (ND)(ND) MW-45D
MW-51D PPUU(ND)
PPUU PPUUMW-50D (ND)
MW-46 D1(ND) PPPUUU (770)
PPPUUU MW-42 D (4274)
MW-48D Domestic Irrigation W ater WellsMW-4AB (ND) MW-46 D2
MW-17DMW-7AB (320)(94) Carbon Tetrachloride IsoconcentrationMW-5D
MW-18D(ND) MW-31C (21) PPMW-41 D1
UU (5) Contour (Upper Aquifer) (microgL)MW-5B MW-16C UU (ND)PP (Dashed Lines are Estimated)PPUUIdlewilde Rd
MW-41 D2 Recovery Wells (Medial)(10)
MW-43DE UUPP(ND18) Recovery Wells (Deep)
Recovery Well Piping
Treatment Building
Notes (ND) Nondetect
Blaine A
ve
Showboa t B
lvd
sup3 Filename XEPA009GarveyGW_Flow_Tech_Memo Mid-Plume_Prelim_Loc Project EP903401220202 Revised 061312 RL2500 5000 Source ENSR GDB 2008 DNR
Feet
0
Figure 710 Alternative G3b-Proposed Recovery Wells Lower Aquifer
Figure 711 Alternative G3b-Relative Positions of Proposed Recovery Wells Medial and Lower Aquifers
Figure 712 Alternative G4a-Proposed Treatment Curtain and Recovery Wells Lower Aquifer
50
5 5
5
50 100
HGLmdashGroundwater Flow Modeling Technical Memorandum Garvey Elevator Superfund SitemdashHastings NE
Figure 713 Preliminary Locations for Mid-Plume
Injection Wells Leading Edge Recovery Wells and Groundwater Treatment Building
-Alternative G4
Legend Garvey Property Boundary
Railroad
Ntilde Monitoring Well Location MW-3DE (NDND)
MW-47D MW-9A (ND)
HTW 40 MW-6D MW-10AB
(ND)
S Elm
Ave
S Wabash A
ve
Multilevel Well
S Hydraulic Conductivity Well
A West Highway 6 amp Highway 281 Site Monitoring Well
MW-11AMW-33 UPPUMW-2A PU
MW-19AC MW-14A APUMW-20DE MW-106D Carbon Tetrachloride ConcentrationPU PPPUUU (190)PSSU MW-104D(NDND) MW-12C (ND)PU in micrograms per liter (microgL)(ND)
Treatment Building Technical B
lvd MW-13EMW-8A
UUUU UUUUUU PPPPPPPPUUUUPU UUUUU
UPUP
UUUUUPPPPPPPPPPPPPPPPPP (ND)
PPPUUU A MW-105DMW-1A UU Carbon Tetrachloride IsoconcentrationAMW-30DE PPUUPPPUUUPPPPPUUUUU
(52)(NDND) MW-12DNew Rolls Contour (Lower Aquifer) (microgL)MW-49D (5)(ND) (ND)
(ND) MW-45D (Dashed Lines are Estimated)PPUUMW-51D (ND) MW-46 D1PPUU PPUUMW-50D
(ND) (ND)
PPPUUU (770)PPPUUU MW-42 DMW-48D Domestic Irrigation W ater WellsMW-4AB (4274)(ND) MW-44DEMW-46 D2
(19ND)MW-17D (320)MW-7AB Carbon Tetrachloride Isoconcentration(94)MW-5D MW-18D PPUU (5) Contour (Upper Aquifer) (microgL)(21) MW-41 D1
MW-31C(ND) MW-5B MW-16C PPUU (Dashed Lines are Estimated)(ND)
PPUUIdlewilde Rd
MW-41 D2 Recovery Wells (Medial)
Recovery Wells (Deep)
(10) Injection Area 1 MW-43DE PPUUPermanent Injection Well Spacing 40 ft (ND18)
Total Injection Wells Installed 39 Recovery Well Piping Injection Area (40 ft spacing between the wells) Treatment Building
Notes (ND) Nondetect
Blaine A
ve
Showboa t B
lvd
S Baltim
ore Ave
sup3 Filename XEPA009GarveyGW_Flow_Tech_Memo G4_Prelim_Loc_Inj_Areamxd Project EP903401220202 Revised 061312 RL2500 5000 Source ENSR GDB 2008 DNR
Feet
0
Figure 714 Alternative G4b-Proposed Treatment Curtains and Recovery Wells Lower Aquifer
Figure 715 Alternative G4b-Relative Positions of Proposed Recovery Wells and Treatment Curtains

50
5 5
5
50 100
HGLmdashGroundwater Flow Modeling Technical Memorandum Garvey Elevator Superfund SitemdashHastings NE
Figure 79 Preliminary Locations for Mid-Plume and
Leading Edge Recovery Wells and Groundwater Treatment Building-Alternative G3
Legend Garvey Property Boundary
Railroad
Ntilde Monitoring Well Location MW-3DE (NDND)
Multilevel Well MW-47D
MW-9A (ND) Hydraulic Conductivity WellSHTW 40 MW-6D MW-10AB
(ND) West Highway 6 amp Highway 281 SiteMW-11A
MW-33 PPUUMW-2A PUA Monitoring Well
MW-19AC MW-14A APUCarbon Tetrachloride Concentration
Technical Blvd
MW-44DE (19ND) (Dashed Lines are Estimated)
MW-20DE (190)MW-106DPSSU PU PPPUUU MW-104DMW-12C(NDND) (ND)PU in micrograms per liter (microgL)(ND) MW-13EMW-8A
U UUUU UPUPPPPUUUUUUUUP UUUUU UUUPPPPPPPPPPPPPPPPPPPPPPPUUUUUU
(ND) PPPUUU A Treatment BuildingMW-105DMW-1A Carbon Tetrachloride IsoconcentrationMW-30DE A
PPUUPPPUUUPPPPPUUUUU(52)
(NDND) MW-12DNew Rolls Contour (Lower Aquifer) (microgL)MW-49D (5)(ND) (ND)(ND) MW-45D
MW-51D PPUU(ND)
PPUU PPUUMW-50D (ND)
MW-46 D1(ND) PPPUUU (770)
PPPUUU MW-42 D (4274)
MW-48D Domestic Irrigation W ater WellsMW-4AB (ND) MW-46 D2
MW-17DMW-7AB (320)(94) Carbon Tetrachloride IsoconcentrationMW-5D
MW-18D(ND) MW-31C (21) PPMW-41 D1
UU (5) Contour (Upper Aquifer) (microgL)MW-5B MW-16C UU (ND)PP (Dashed Lines are Estimated)PPUUIdlewilde Rd
MW-41 D2 Recovery Wells (Medial)(10)
MW-43DE UUPP(ND18) Recovery Wells (Deep)
Recovery Well Piping
Treatment Building
Notes (ND) Nondetect
Blaine A
ve
Showboa t B
lvd
sup3 Filename XEPA009GarveyGW_Flow_Tech_Memo Mid-Plume_Prelim_Loc Project EP903401220202 Revised 061312 RL2500 5000 Source ENSR GDB 2008 DNR
Feet
0
Figure 710 Alternative G3b-Proposed Recovery Wells Lower Aquifer
Figure 711 Alternative G3b-Relative Positions of Proposed Recovery Wells Medial and Lower Aquifers
Figure 712 Alternative G4a-Proposed Treatment Curtain and Recovery Wells Lower Aquifer
50
5 5
5
50 100
HGLmdashGroundwater Flow Modeling Technical Memorandum Garvey Elevator Superfund SitemdashHastings NE
Figure 713 Preliminary Locations for Mid-Plume
Injection Wells Leading Edge Recovery Wells and Groundwater Treatment Building
-Alternative G4
Legend Garvey Property Boundary
Railroad
Ntilde Monitoring Well Location MW-3DE (NDND)
MW-47D MW-9A (ND)
HTW 40 MW-6D MW-10AB
(ND)
S Elm
Ave
S Wabash A
ve
Multilevel Well
S Hydraulic Conductivity Well
A West Highway 6 amp Highway 281 Site Monitoring Well
MW-11AMW-33 UPPUMW-2A PU
MW-19AC MW-14A APUMW-20DE MW-106D Carbon Tetrachloride ConcentrationPU PPPUUU (190)PSSU MW-104D(NDND) MW-12C (ND)PU in micrograms per liter (microgL)(ND)
Treatment Building Technical B
lvd MW-13EMW-8A
UUUU UUUUUU PPPPPPPPUUUUPU UUUUU
UPUP
UUUUUPPPPPPPPPPPPPPPPPP (ND)
PPPUUU A MW-105DMW-1A UU Carbon Tetrachloride IsoconcentrationAMW-30DE PPUUPPPUUUPPPPPUUUUU
(52)(NDND) MW-12DNew Rolls Contour (Lower Aquifer) (microgL)MW-49D (5)(ND) (ND)
(ND) MW-45D (Dashed Lines are Estimated)PPUUMW-51D (ND) MW-46 D1PPUU PPUUMW-50D
(ND) (ND)
PPPUUU (770)PPPUUU MW-42 DMW-48D Domestic Irrigation W ater WellsMW-4AB (4274)(ND) MW-44DEMW-46 D2
(19ND)MW-17D (320)MW-7AB Carbon Tetrachloride Isoconcentration(94)MW-5D MW-18D PPUU (5) Contour (Upper Aquifer) (microgL)(21) MW-41 D1
MW-31C(ND) MW-5B MW-16C PPUU (Dashed Lines are Estimated)(ND)
PPUUIdlewilde Rd
MW-41 D2 Recovery Wells (Medial)
Recovery Wells (Deep)
(10) Injection Area 1 MW-43DE PPUUPermanent Injection Well Spacing 40 ft (ND18)
Total Injection Wells Installed 39 Recovery Well Piping Injection Area (40 ft spacing between the wells) Treatment Building
Notes (ND) Nondetect
Blaine A
ve
Showboa t B
lvd
S Baltim
ore Ave
sup3 Filename XEPA009GarveyGW_Flow_Tech_Memo G4_Prelim_Loc_Inj_Areamxd Project EP903401220202 Revised 061312 RL2500 5000 Source ENSR GDB 2008 DNR
Feet
0
Figure 714 Alternative G4b-Proposed Treatment Curtains and Recovery Wells Lower Aquifer
Figure 715 Alternative G4b-Relative Positions of Proposed Recovery Wells and Treatment Curtains

Figure 714 Alternative G4b-Proposed Treatment Curtains and Recovery Wells Lower Aquifer
Figure 715 Alternative G4b-Relative Positions of Proposed Recovery Wells and Treatment Curtains


