LEVEL II HYDROGEOLOGIC CHARACTERIZATION REPORT: Apple Creek near Belltown Greene County, IL (US 67, FAP 310) Bonnie J. Robinson Illinois State Geological Survey Wetlands Geology Section 615 East Peabody Drive Champaign, IL 61820-6964 Submitted Under Contract No. IDOT SWWIP FY04 to: Illinois Department of Transportation Bureau of Design and Environment, Wetlands Unit 2300 South Dirksen Parkway Springfield, IL 62764-0002 February 4, 2004 Illinois State Geological Survey Open File Series 2004-5
Transcript
LEVEL II HYDROGEOLOGIC CHARACTERIZATION REPORT:
Apple Creek near BelltownGreene County, IL (US 67, FAP 310)
Bonnie J. Robinson
Illinois State Geological SurveyWetlands Geology Section615 East Peabody Drive
Champaign, IL 61820-6964
Submitted Under Contract No. IDOT SWWIP FY04 to:
Illinois Department of TransportationBureau of Design and Environment, Wetlands Unit
2300 South Dirksen ParkwaySpringfield, IL 62764-0002
February 4, 2004
Illinois State Geological SurveyOpen File Series 2004-5
ii
EXECUTIVE SUMMARY
In December 2001, the Illinois Department of Transportation (IDOT) tasked the Wetlands GeologySection of the Illinois State Geological Survey (ISGS) to conduct a hydrogeologic charactererization ofthe potential wetland compensation site at Apple Creek near Belltown in Greene County, Illinois.
Results of this investigation indicate that floodwater from Apple Creek and upland runoff are the mainsources of water for this site. Although nearly half of the farm field exhibits wetland hydrology in yearswhen the present levee is not overtopped due to accumulated runoff, if a portion of the levee werelowered to an elevation of 137.8 m (452 ft), the entire farm field would be subject to annual flooding fromthe creek. The creation of a notch in the Apple Creek levee could be coupled with the modification ofthe current outlet pipe to allow the control of water levels inside the levee. If all the property locatedwithin the levee is not purchased, then the construction of an additional levee along the easternperimeter of the site to protect adjacent farm fields will be required.
These recommendations were prepared using limited monitoring data. Additional monitoring isrecommended to confirm the observed hydrologic conditions.
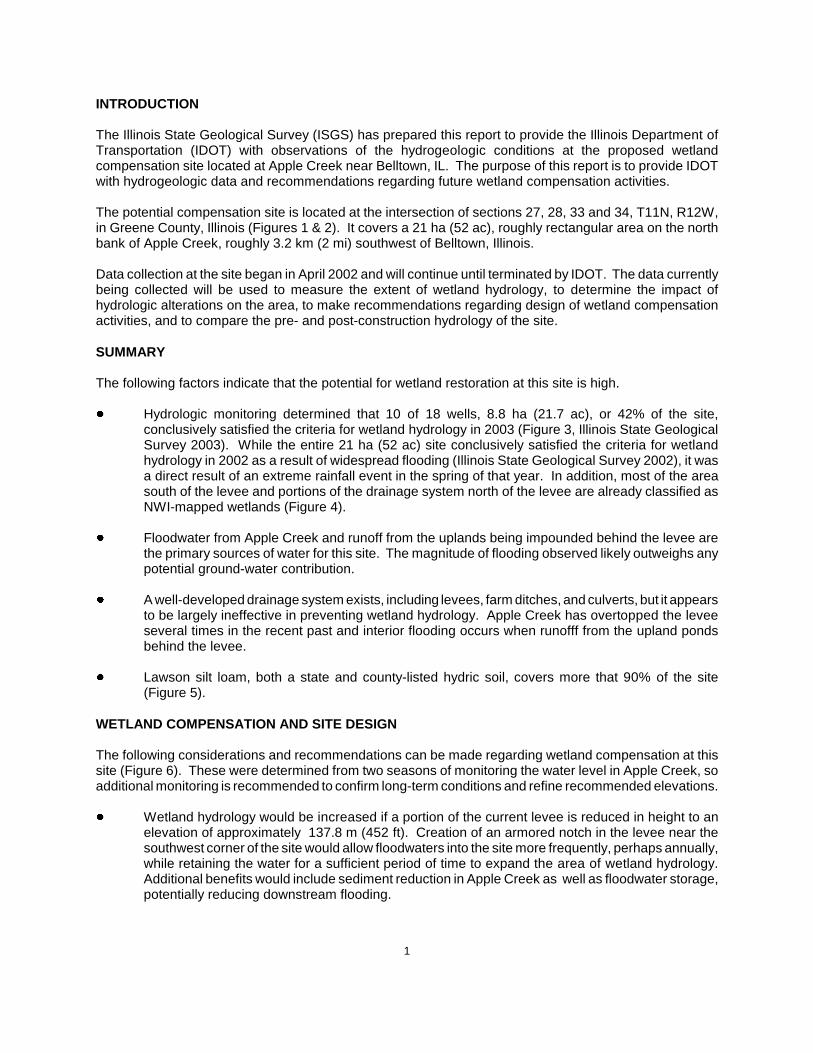
The Illinois State Geological Survey (ISGS) has prepared this report to provide the Illinois Department ofTransportation (IDOT) with observations of the hydrogeologic conditions at the proposed wetlandcompensation site located at Apple Creek near Belltown, IL. The purpose of this report is to provide IDOTwith hydrogeologic data and recommendations regarding future wetland compensation activities.
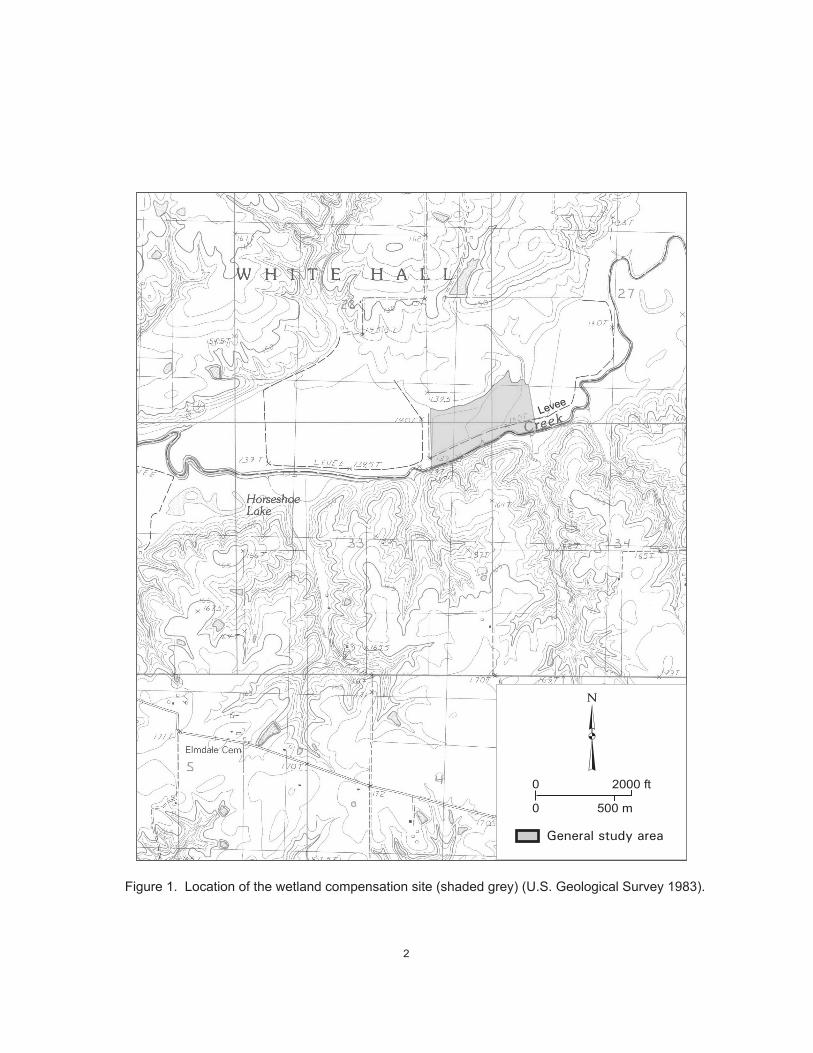
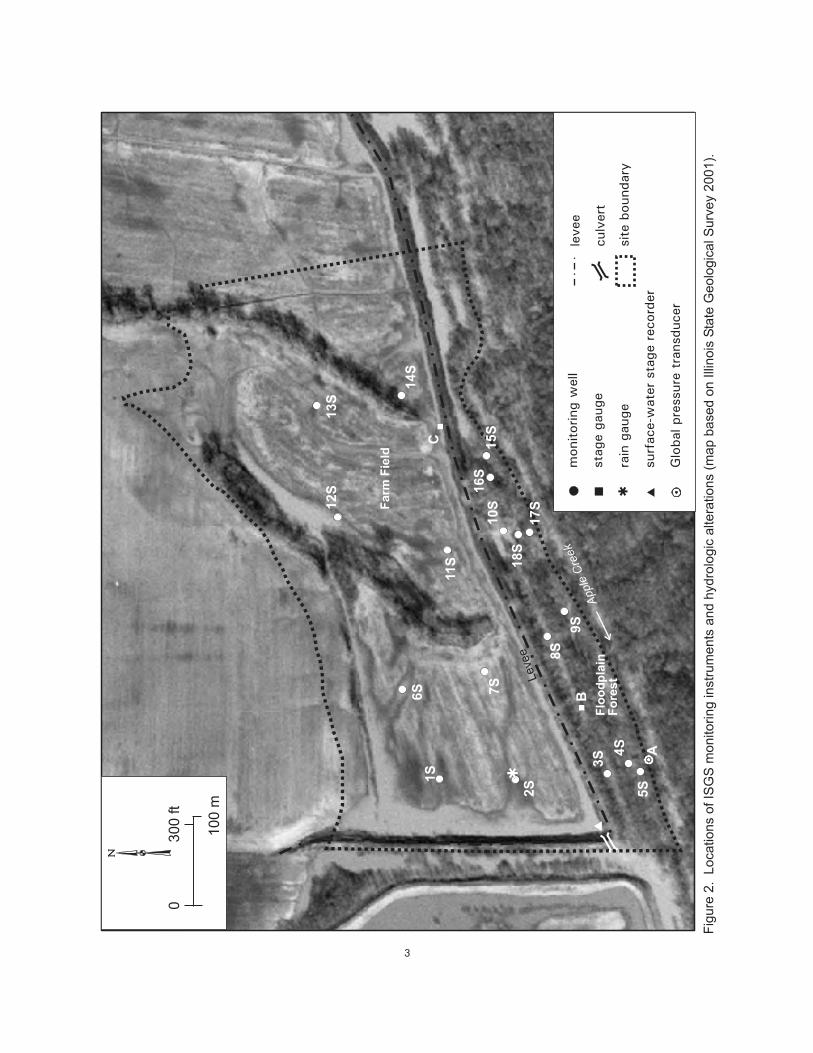
The potential compensation site is located at the intersection of sections 27, 28, 33 and 34, T11N, R12W,in Greene County, Illinois (Figures 1 & 2). It covers a 21 ha (52 ac), roughly rectangular area on the northbank of Apple Creek, roughly 3.2 km (2 mi) southwest of Belltown, Illinois.
Data collection at the site began in April 2002 and will continue until terminated by IDOT. The data currentlybeing collected will be used to measure the extent of wetland hydrology, to determine the impact ofhydrologic alterations on the area, to make recommendations regarding design of wetland compensationactivities, and to compare the pre- and post-construction hydrology of the site.
SUMMARY
The following factors indicate that the potential for wetland restoration at this site is high.
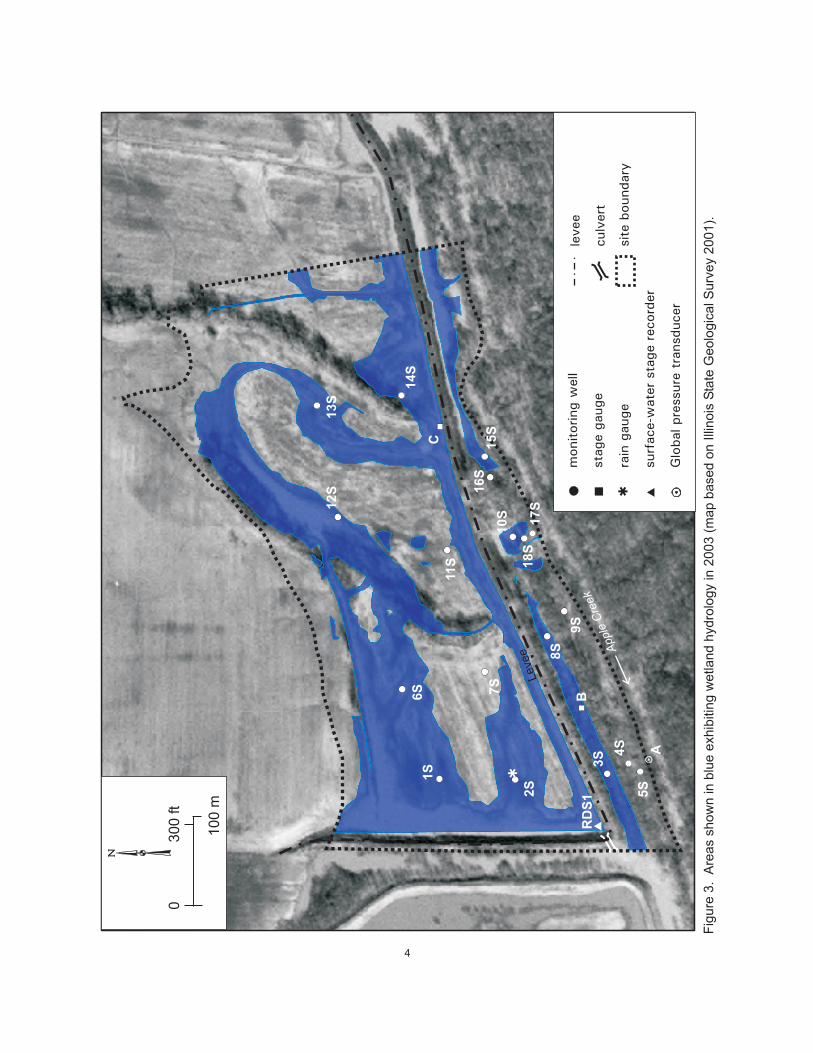
! Hydrologic monitoring determined that 10 of 18 wells, 8.8 ha (21.7 ac), or 42% of the site,conclusively satisfied the criteria for wetland hydrology in 2003 (Figure 3, Illinois State GeologicalSurvey 2003). While the entire 21 ha (52 ac) site conclusively satisfied the criteria for wetlandhydrology in 2002 as a result of widespread flooding (Illinois State Geological Survey 2002), it wasa direct result of an extreme rainfall event in the spring of that year. In addition, most of the areasouth of the levee and portions of the drainage system north of the levee are already classified asNWI-mapped wetlands (Figure 4).
! Floodwater from Apple Creek and runoff from the uplands being impounded behind the levee arethe primary sources of water for this site. The magnitude of flooding observed likely outweighs anypotential ground-water contribution.
! A well-developed drainage system exists, including levees, farm ditches, and culverts, but it appearsto be largely ineffective in preventing wetland hydrology. Apple Creek has overtopped the leveeseveral times in the recent past and interior flooding occurs when runofff from the upland pondsbehind the levee.
! Lawson silt loam, both a state and county-listed hydric soil, covers more that 90% of the site(Figure 5).
WETLAND COMPENSATION AND SITE DESIGN
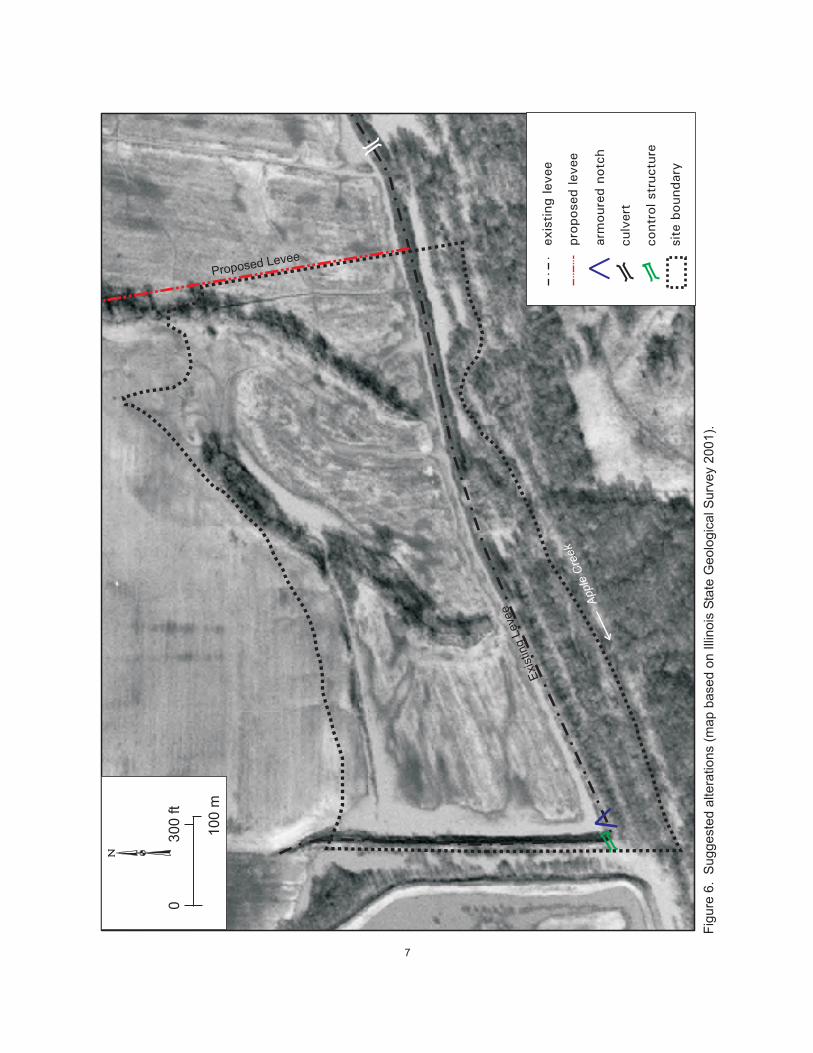
The following considerations and recommendations can be made regarding wetland compensation at thissite (Figure 6). These were determined from two seasons of monitoring the water level in Apple Creek, soadditional monitoring is recommended to confirm long-term conditions and refine recommended elevations.
! Wetland hydrology would be increased if a portion of the current levee is reduced in height to anelevation of approximately 137.8 m (452 ft). Creation of an armored notch in the levee near thesouthwest corner of the site would allow floodwaters into the site more frequently, perhaps annually,while retaining the water for a sufficient period of time to expand the area of wetland hydrology.Additional benefits would include sediment reduction in Apple Creek as well as floodwater storage,potentially reducing downstream flooding.
�0
0
500 m
2000 ft
General study area
Figure 1. Location of the wetland compensation site (shaded grey) (U.S. Geological Survey 1983).
Levee
2
Fa
rmF
ield
Flo
od
pla
inF
ore
st
1S
2S
6S 7S
11
S
12
S1
3S
14
S
3S 4
S
5S
8S
9S
17
S
18
S
10
S1
5S
16
S
�
�
A
Levee
B
C
Apple
Cre
ek
Glo
balp
ress
ure
tran
sduc
er
�
mon
itor
ing
wel
l
stag
ega
uge
�ra
inga
uge
surf
ace-
wat
erst
age
reco
rder
site
boun
dary
leve
e
culv
ert
0
100
m
300
ft
Fig
ure
2.
Locations
ofIS
GS
monitoring
instr
um
ents
and
hydro
logic
altera
tions
(map
based
on
2001).
Illin
ois
Sta
teG
eolo
gic
alS
urv
ey
3
1S
2S
6S 7S
11S
12S
13S
14S
RD
S1
3S 4
S
5S
8S
9S
17S
18S
10S
15S
16S
�
�
A
Levee
B
C
Glo
balp
ress
ure
tran
sduc
er
�
mon
itor
ing
wel
l
stag
ega
uge
�ra
inga
uge
surf
ace-
wat
erst
age
reco
rder
site
boun
dary
leve
e
culv
ert
Apple
Cre
ek
0
100
m
300
ft
Fig
ure
3.
Are
as
show
nin
blu
eexhib
itin
gw
etland
hydro
logy
in2003
(map
based
on
2001).
Illin
ois
Sta
teG
eolo
gic
alS
urv
ey
4
Apple
Cre
ek
PE
MA
F
PF
O1C
PF
O1A
PE
MC
PFO1A
0
100
m
300
ft
Fig
ure
4.
NW
I-m
apped
wetlands
onsite
(map
based
on
2001,U
.S.F
ish
and
Wild
life
Serv
ice
1996).
Illin
ois
Sta
teG
eolo
gic
alS
urv
ey
5
Fig
ure
5.
Soil
types
(map
based
on
U.S
.D
epart
mentofA
griculture
1974).
Law
son
silt
loam
(sta
teand
county
-lis
ted
hydric
soil)
Cam
den
silt
loam
(nothydric)
site
boundary
451
134D
2
str
eam
levee
0
200
m
600
ft
Apple
Cre
ek
6
Exi
stin
gLeve
e
Proposed Levee
Apple
Cre
ek
site
boun
dary
exis
ting
leve
e
cont
rols
truc
ture
prop
osed
leve
e
arm
oure
dno
tch
0
100
m
300
ft
Fig
ure
6.
Suggeste
daltera
tions
(map
based
on
Illin
ois
Sta
teG
eolo
gic
alS
urv
ey
2001).
culv
ert
7
8
! The current outlet pipe should be modified to allow the control of water levels inside the levee. Agate valve or similar control measure could allow water to enter the site and not drain from it, whendesired. In this fashion, the flow of water entering and exiting the site could be controlled based onconditions in Apple Creek and onsite.
! If the entire floodplain area currently protected by the levee is not purchased, a new levee will haveto be constructed to protect the remaining farm fields to the east. The new levee will need to besimilar in construction as the current levee and extend to the upland, while an outlet pipe from theunpurchased area to Apple Creek will also need to be installed. These structures will requireregular maintenance, which may be costly. Therefore, obtaining the remainder of the leveed areato the east would likely be a more economical solution, and would provide additional mitigationacreage.
METHODS
A variety of instruments was installed at the site in order to monitor water-level fluctuations and map theextent of wetland hydrology (Figure 2) .
Ground-Water Instrumentation
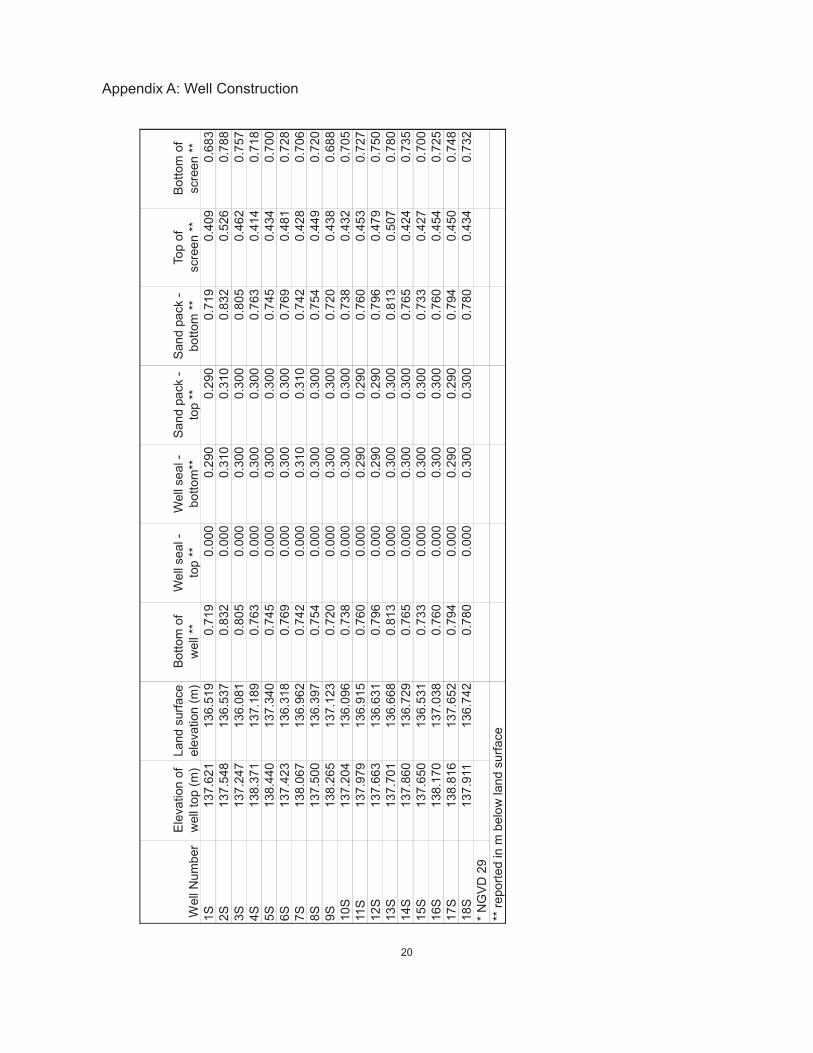
Soil-zone wells (S-wells) were installed at 18 locations throughout the site (Figure 2). Eight wells wereinstalled in a regularly spaced grid in the farm field, ten wells were installed in transects at various elevationsin the floodplain forest. These wells are generally 0.75-m (2.5-ft) deep with screens 0.30-m (1.0-ft) in.length. S-wells are specifically designed to monitor near-surface saturation. Samples from the borings weredescribed in the field using the Munsell Soil Color Chart (1994 edition) and other standard techniques.
S-wells were constructed with 2.54-cm (1-in) PVC casing and 10-slot PVC screens. All well screens werecapped at the base with a 2.54-cm (1-in) PVC cap, with a single drainage hole. Well screens were packedwith quartz sand with a grain size of 0.9-mm (0.038-in) and the annulus was then back-filled with d”bentonite chips. Well-construction details are provided in Appendix A. Water levels were measured usinga Solinst electronic water-level tape.
Surface-Water Instrumentation
Two dataloggers and two stage gauges were installed to monitor surface-water fluctuations onsite (Figure2), a Global pressure transducer was installed in Apple Creek to monitor fluctuations in the water level, anda Remote Data Systems Ecotone surface-water stage recorder was installed in the ditch north of the levee,in the southwest corner of the farm field.
Stage gauge C was installed in the ditch on the north side of the levee and gauge B was installed in thedepression in the woods on the south side of the levee, in an area of semi-permanent inundation.
Site Monitoring and Surveying
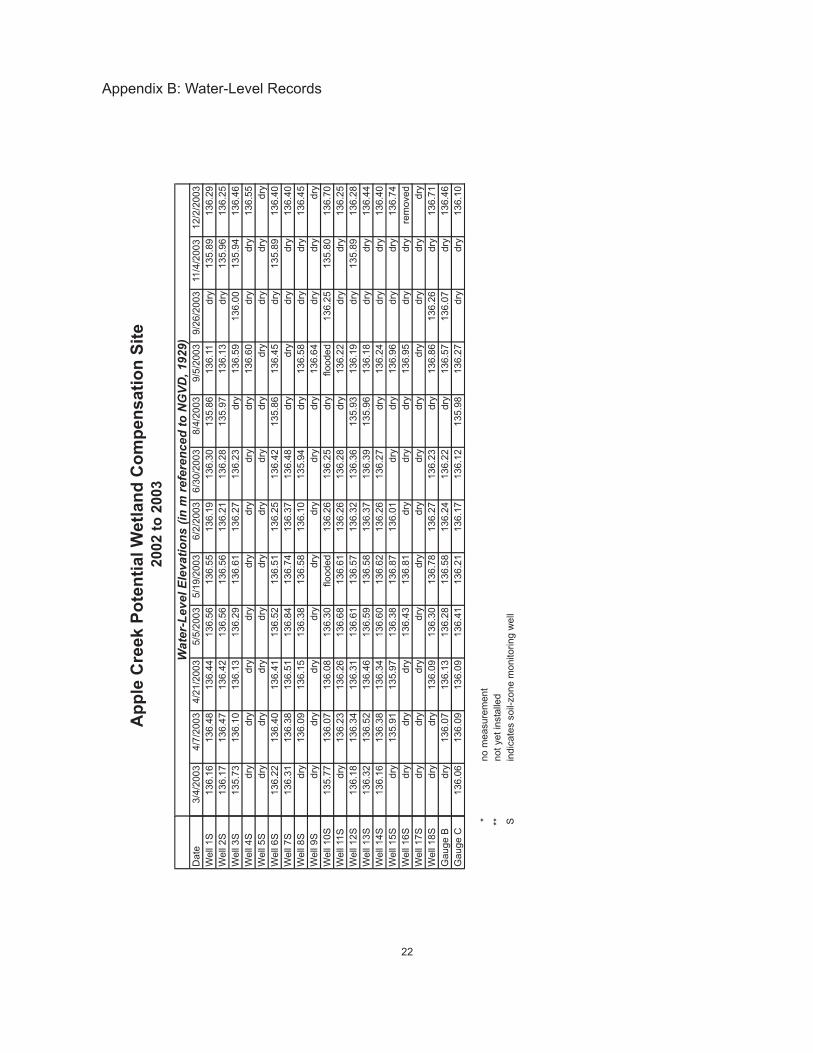
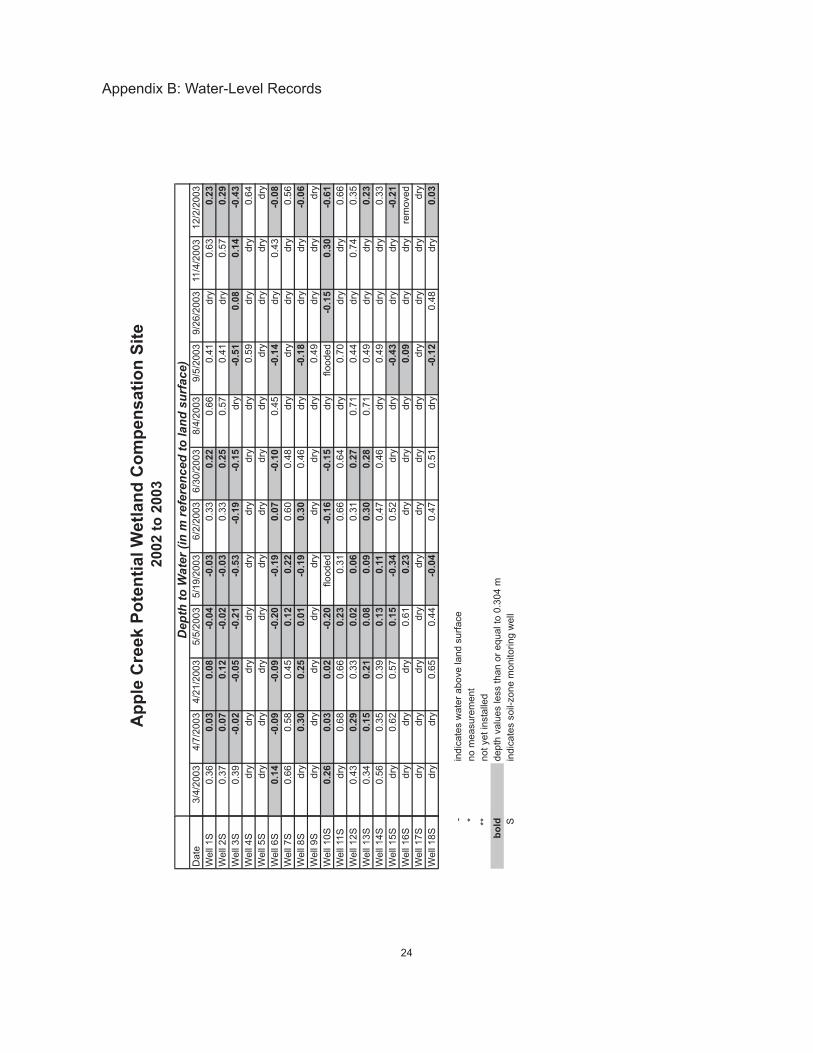
The wells, data loggers, and stage gauges were monitored twice per month during the spring (April to June)and monthly thereafter. The entire record of surface-water elevations from stage gauges and depth to waterin wells are reported in Appendix B.
The Global pressure transducer was programmed to monitor the water level of Apple Creek at 1-hourintervals, while the Ecotone datalogger monitored the water level in the ditch north of the levee at 3-hourintervals. These intervals help identify short-term events that may not have been detected by the monthlyor biweekly readings.
9
On-site precipitation was measured with a tipping-bucket rain gauge equipped with a datalogger. The on-site data supplemented the precipitation data recorded at White Hall, Illinois (Station #119241), locatedabout 5 miles north of the site. These data were obtained from the National Water and Climate Center(NWCC) of the Natural Resources Conservation Service (NRCS) and the Midwestern Climate Center (MCC)at the Illinois State Water Survey (ISWS). Normal precipitation values are calculated by the NWCC and arebased on the 30-year period between 1971-2000. The precipitation data were used to determine the effectof monthly, seasonal, and annual precipitation trends on surface- and ground-water levels.
Temperature data from the White Hall, Illinois station (Station #119241) were obtained to determine thelength of the growing season for the region. The growing season (U.S. Army Corps of Engineers 1987) isthe period between the last occurrence of -2.2 EC (28EF) temperatures in the spring and the first occurrencein the fall. The median length (5 out of 10 years) of the growing season for the region was 210 days, withthe median starting date of April 6 and the median ending date of November 2 (National Water and ClimateCenter 2003).
The elevations of the monitoring wells, stage gauges, and dataloggers were surveyed each spring with aSokkia B1 Automatic Level and/or Leica TC702 total station using the NGVD 1929 datum plane. In March2003, instrument locations were surveyed using a Trimble Pathfinder ProXR GPS unit. To increase positionaccuracy, these locations were differentially corrected using the Trimble Pathfinder software.
Interpretation of Water-Level Data for Wetland Hydrology
Inundation and/or saturation to land surface must occur for 12.5% of the growing season to conclusivelysatisfy wetland hydrology criteria as outlined in the 1987 Corps of Engineers Wetland Delineation Manual(Environmental Laboratory 1987). Saturation and/or inundation to land surface for between 5% and 12.5%of the growing season may meet wetland hydrology criteria if other vegetation and soils criteria are also met,but those data are not included in this report. Water levels within 30 cm (1 ft) of land surface in wells areinterpreted to show saturation to land surface due to the presence of a capillary fringe, as suggested byinformal Corps guidance. Interpolation or extrapolation will be performed to determine the duration ofsaturation for wells where manual water-level measurements were collected.
SITE CHARACTERIZATION
Setting
The compensation site is located within the Lower Illinois Watershed, in the floodplain of Apple Creek.Apple Creek flows to the west, towards the Illinois River.
The site is on the north bank of Apple Creek (Figure 1). Most of the site is a farm field protected as part ofa large leveed area, but also includes a small portion of floodplain forest not protected by the levee. Thelevee system includes additional farm fields to the east and connects to the uplands at both ends.
Several north-south ditches extend from the uplands across the farm field into a ditch along the base of thelevee. A culvert in the southwest corner of the site drains these ditches into a slough outside of the leveethat drains into Apple Creek (Figure 2).
The floodplain forest is characterized by numerous areas of erosion and deposition. A small, approximately1 m (3.3 ft ) high, natural levee is present on the bank of Apple Creek. Areas of scour are interspersed withconsiderable amounts of woody flood debris, suggesting that large floods with high velocity are relativelycommon in this area. A ditch is present along the outside of the levee, from the center of the site to thewestern boundary.
10
Topography
Not including the levee, the majority of the overall site ranges in elevation from 135.7m to 137.2 m (445.1to 450.2 ft). North of the levee, the overall land-surface trend is generally to the southwest. The highestpoint is along the levee close to the eastern site boundary (140.3 m or 460.2 ft), while the lowest point is atthe base of the farm ditch at its south west corner (135.7 m or 445.1 ft). From this point, the farm fieldranges up to an elevation of 139.6 m (458 ft) where it connects with the uplands on the north end of the site.Elevations in the floodplain forest range from a minimum of 136.0 m (446.2 ft) to a maximum of 138.4 m(454 ft). Despite the localized areas of scour and fill, the land surface slopes generally to the north, towardsthe base of the levee.
Although the range of elevation in the floodplain forest is more limited, the forest is marginally higher thanthe farm field. The lowest point in the forest is at least 0.3 m (1 ft) higher than the lowest point in the farmfield. Furthermore, most of the area below 136.9 m (449 ft) south of the levee is confined to the ditches andlocalized depressions, whereas roughly half of the farm field is below this elevation.
Geology
The modern day valley occupied by Apple Creek mimics a tributary to the Lower Illinois Bedrock Valley(Herzog et al. 1994). Bedrock consists of the Mississippian-age lower Valmeyeran Formation (Willman etal. 1967), which is mainly limestones and some sandstones.
Bedrock in the general vicinity is overlain by between 15.2 and 30.5 m (50 and 100 ft) of Quaternarydeposits (Piskin and Bergstrom 1975). The uplands to the north of the site are underlain by Peoria Loessand Roxanna Silt less than 6.0 m (19.7 ft) thick overlying less than 6.0 m (19.7 ft) of loamy and sandydiamictons of the Glasford Formation. Sediments onsite consist of Cahokia Formation alluvium less than6.0 m (19.7 ft) thick overlying more than 6.0 m (19.7 ft) of outwash sand and gravel of the Henry Formation(Berg and Kempton 1988, Hansel and Johnson 1996). Borings made onsite confirm the nature of thesurficial sediments, composed primarily of silty clay and clayey silt.
Soils
The site is primarily underlain by Lawson silt loam (Figure 5), a state and county-listed hydric soil that ispoorly drained and frequently flooded for long durations. A strip along the northern edge of the site consistsof non-hydric Camden silt loam. This is a well-drained to moderately well-drained soil generally found onstream terraces and foot slopes (U.S. Department of Agriculture 1974, 1995a, 1995b, 1995c).
Wetlands
NWI maps (Figure 4) indicate that most of the 4.0 ha (10 ac) south of the levee is classified as palustrine,broad leafed deciduous, temporarily or seasonally flooded wetland (PFO1A and PFO1C, respectively).Because large portions of the farm field are located below the elevation of these areas, it is possible thatthe floodplain could be used as an model for wetlands created in the farm field. Small areas of NWI-mappedwetlands are also present north of the levee; a narrow strip of PFO1A in the center of the site, an area ofpalustrine, emergent, temporarily, semipermanent flooded wetland (PEMAF) in the northwest corner, andan area of palustrine, emergent, seasonally flooded wetland (PEMC) toward the east side of the site (U.S.Fish and Wildlife Service 1996). These suggest that the farm field is not completely drained.
Precipitation
Average annual precipitation at the nearby White Hall station is 35.6 in. (90.4 cm) (Midwestern ClimateCenter 2003). Rainfall is typically highest between March and July, peaking in May. Total precipitation atWhite Hall from April 2002 through November 2003 was 71.9 in. (182.6 cm), which is 105% of the averagebased on summing monthly averages for that period. The wettest month was May 2002 (196% of the May
Jan2000
Mar2000
May2000
Jul2000
Sep2000
Nov2000
Jan2001
Mar2001
May2001
Jul2001
Sep2001
Nov2001
Jan2002
Mar2002
May2002
Jul2002
Sep2002
Nov2002
Jan2003
Mar2003
May2003
Jul2003
Sep2003
Nov2003
-6-5-4-3-2-10123456
Precipitation(in.)
-15
-10
-50510
15
Precipitation (cm)
200
02
00
12
00
2
Fig
ure
7.T
ota
lann
ua
lpre
cip
itatio
nan
dde
via
tio
nfr
om
mo
nth
lyave
rag
efr
om
200
0th
rough
200
3re
cord
ed
atW
hite
Hall,IL
(MC
C2
00
3).
Annu
alT
ota
l3
5.0
in.
Ann
ua
lT
ota
l41
.2in
.A
nnu
alT
ota
l3
6.2
in.
200
3
+5
.6in
.-0
.7in
.+
0.6
in.
+2.5
7in
.A
nnu
alT
ota
lto
Da
te3
5.7
in.
11
12
average) while the driest month was January 2003 (20% of the January average).
Figure 7 depicts how monthly precipitation at White Hall from January 2000 through November 2003deviated from the average monthly precipitation. In addition, the deviation from the average annualprecipitation is presented as a negative or positive number (Midwestern Climate Center 2003). Dryconditions in the spring of 2003 were offset by above average summer and fall precipitation, resulting in anoverall surplus of 2.57 in. (6.5 cm). In 2002, particularly high precipitation values in April, May, and August(175%, 196%, and 175% of monthly averages, respectively) offset the near- to below-average valuesobtained in the rest of the year. Over the period of monitoring, data from the rain gauge onsite (presentedlater) indicated overall agreement with the nearby White Hall station.
Hydrology
Wetland Hydrology
In 2002, surface- and ground-water elevations and field observations indicate that saturation and/orinundation occurred over the entire 21.0 ha (52 ac) site for a duration sufficient to conclusively satisfy thecriteria for wetland hydrology. This resulted from abnormally high springtime precipitation. Furthermore,the duration of inundation may have been prolonged because the levee may have prevented drainage fromthe farm field after Apple Creek had receded.
While Apple Creek also flooded in 2003, it did not reach an elevation sufficient to overtop the levee. Despitethis lack of flooding, water levels in ten wells met wetland hydrology criteria due to the accumulation of runoffbehind the levee or in localized depressions, over a total area of 8.8 ha (21.7 ac) (Figure 3). The extent ofwetland hydrology was determined using water levels measured during the longest period of sustained highwater levels in 2003. Surface-water levels that were recorded on May 5, 2003 were combined with land-surface data and used to mathematically contour the area that met wetland hydrology criteria, using theSURFER TM computer program. Manual interpretations of water levels in wells agreed with thisinterpretation, finding that all wells located within the polygon shown in Figure 3 met wetland hydrologycriteria (Environmental Laboratory 1987), and all wells outside the polygon did not meet the criteria. Manualinterpretations are based on multiple springtime measurements.
While the majority [7.8 ha (19.2 ac)] of the area that exhibited wetland hydrology in 2003 was located northof the levee, it is only roughly half of the total area of the 16.6 ha (41.0 ac) farm field. In order to restorewetland hydrology to the remaining portion of the farm field in years with average precipitation, alterationsto the site are required.
Only a small portion, 1.0 ha (2.5 ac), of the area exhibiting wetland hydrology is located within the floodplainforest. Only four out of ten wells in the forest conclusively satisfied the criteria for jurisdictional wetlandhydrology, and only two additional wells displayed wetland hydrology for periods between 5 and 12.5% ofthe growing season. The remaining forest wells did not display wetland hydrology at all. It is thereforepossible that on this site, areas that demonstrate wetland hydrology for less that 12.5% of the growingseason may exhibit characteristics of jurisdictional wetlands, or that much of the floodplain forest does notconclusively meet wetland hydrology criteria under the current flooding regime. No alterations to thefloodplain forest are planned.
Ground-Water Hydrology
Water-level elevations varied little within and between areas in the floodplain forest and the farm field(Figure 8). Overall, the two areas mimicked each other closely, with the largest difference between thehighest and the lowest water-level measurement being 0.61 m (2 ft) on April 7, 2003. Overall, water levelsfollowed the general climatic trends, the lowest values were observed in the winter months gradually risingto yearly highs in May and June.
135.5
136.0
136.5
137.0
137.5
Jan2002
Feb2002
Mar2002
Apr2002
May2002
Jun2002
Jul2002
Aug2002
Sep2002
Oct2002
Nov2002
Dec2002
Jan2003
Feb2003
Mar2003
Apr2003
May2003
Jun2003
Jul2003
Aug2003
Sep2003
Oct2003
Nov2003
Dec2003
Jan2004
Elevation(inmreferencedtoNGVD,1929)
Well
1S
Well
2S
Well
3S
Well
4S
Well
5S
Well
6S
Well
7S
Well
8S
Well
9S
Well
10S
Well
11S
Well
12S
Well
13S
Well
14S
Well
15S
Well
16S
Well
17S
Well
18S
13
Fig
ure
8b.D
epth
tow
ate
rin
all
wells
.
-1.0
-0.5
0.0
0.5
1.0
Jan2002
Feb2002
Mar2002
Apr2002
May2002
Jun2002
Jul2002
Aug2002
Sep2002
Oct2002
Nov2002
Dec2002
Jan2003
Feb2003
Mar2003
Apr2003
May2003
Jun2003
Jul2003
Aug2003
Sep2003
Oct2003
Nov2003
Dec2003
Jan2004
Depth(inmreferencedtolandsurface)
Well
1S
Well
2S
Well
3S
Well
4S
Well
5S
Well
6S
Well
7S
Well
8S
Well
9S
Well
10S
Well
11S
Well
12S
Well
13S
Well
14S
Well
15S
Well
16S
Well
17S
Well
18S
14
Apr 2002
May 2002
Jun 2002
Jul 2002
Aug 2002
Sep 2002
Oct 2002
Nov 2002
Dec 2002
Jan 2003
Feb 2003
Mar 2003
Apr 2003
May 2003
Jun 2003
Jul 2003
Aug 2003
Sep 2003
Oct 2003
Nov 2003
135.
0
136.
0
137.
0
138.
0
139.
0
140.
0Water level (m)
0.0
1.0
2.0
3.0
Daily total precipitation (in)
Wat
er le
vel i
n A
pple
Cre
ek
Wat
er le
vel i
n di
tch
440
442
444
446
448
450
452
454
456
458
460
Water level (ft)
05
Daily total precipitation (cm)
Leve
e ov
erto
pped
Fig
ure
9. W
ater
leve
l in
App
le C
reek
and
the
farm
ditc
h ve
rsus
dai
ly to
tal p
reci
pita
tion:
Apr
il 20
02-N
ovem
ber
2003
.
Pro
pose
d el
evat
ion
of n
otch
15
16
Surface-Water Hydrology
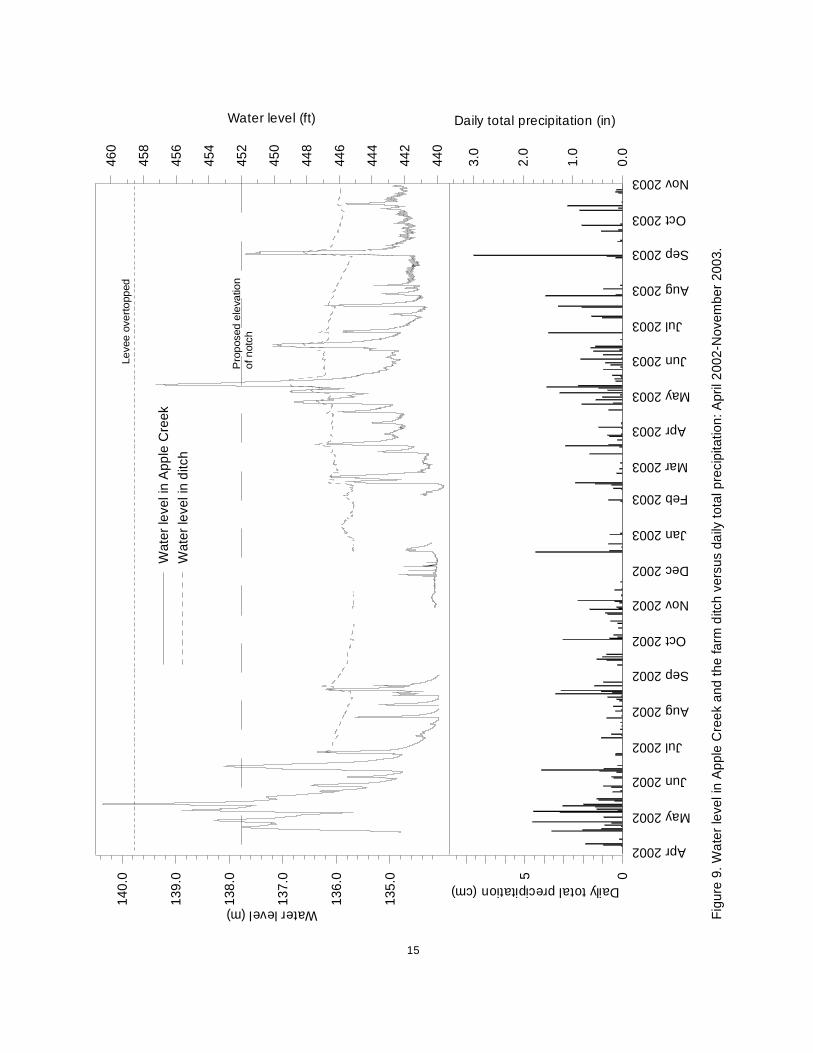
The hydrograph for Apple Creek from April 2002 until November 2003 is shown in Figure 9, along with dailyprecipitation. The baseflow elevation hovers around 134.2 m (440.3 ft). As a result of the natural levee, thewater level in Apple Creek must reach an elevation of roughly 137.5 m (451 ft) to exceed its banks. Thewater level in the creek exceeded this elevation four times during 2002 and twice in 2003.
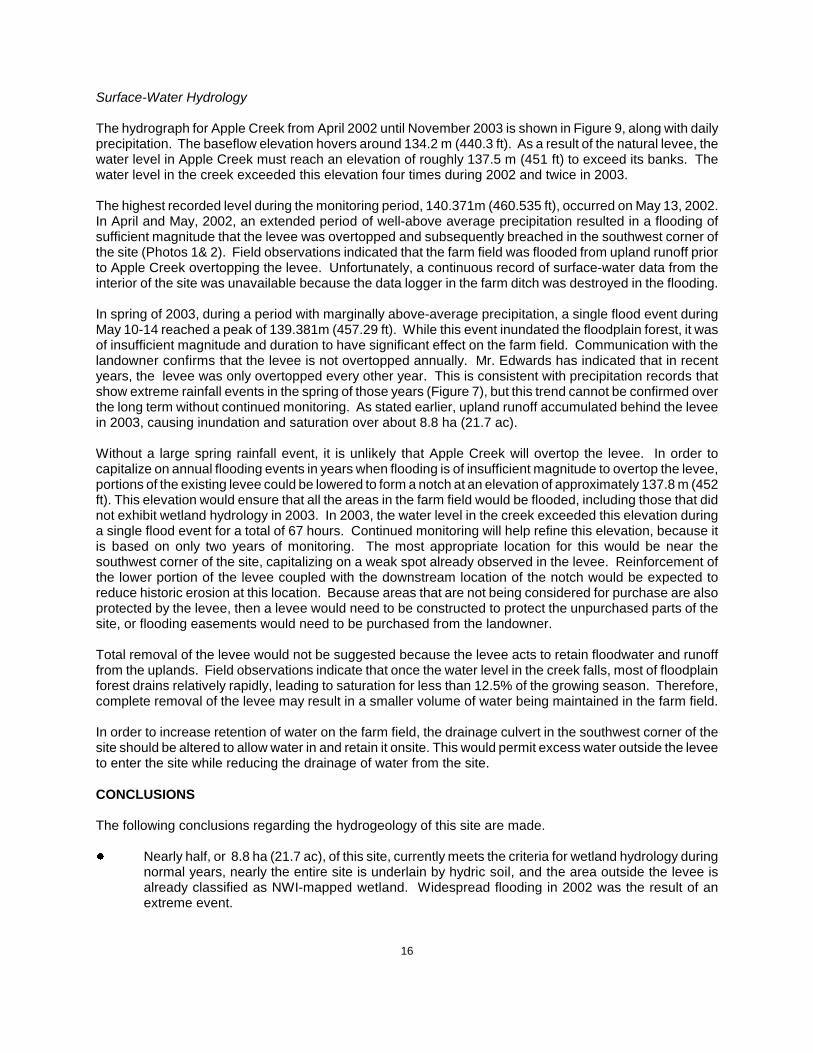
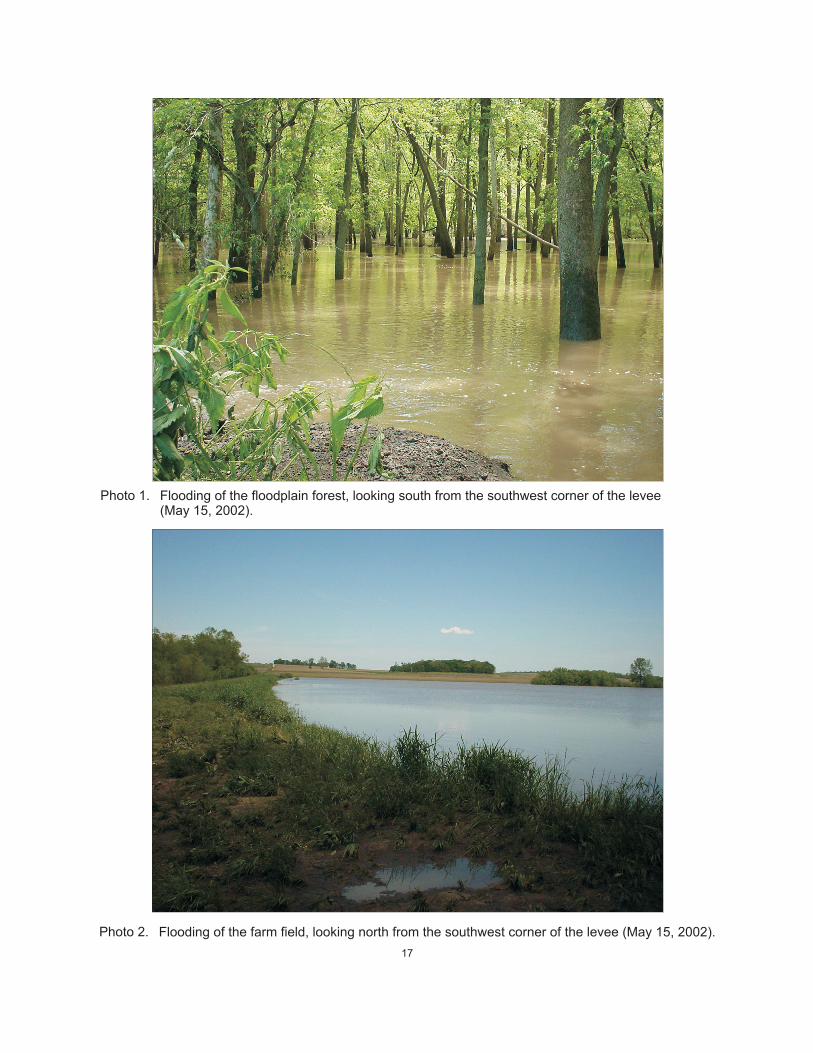
The highest recorded level during the monitoring period, 140.371m (460.535 ft), occurred on May 13, 2002.In April and May, 2002, an extended period of well-above average precipitation resulted in a flooding ofsufficient magnitude that the levee was overtopped and subsequently breached in the southwest corner ofthe site (Photos 1& 2). Field observations indicated that the farm field was flooded from upland runoff priorto Apple Creek overtopping the levee. Unfortunately, a continuous record of surface-water data from theinterior of the site was unavailable because the data logger in the farm ditch was destroyed in the flooding.
In spring of 2003, during a period with marginally above-average precipitation, a single flood event duringMay 10-14 reached a peak of 139.381m (457.29 ft). While this event inundated the floodplain forest, it wasof insufficient magnitude and duration to have significant effect on the farm field. Communication with thelandowner confirms that the levee is not overtopped annually. Mr. Edwards has indicated that in recentyears, the levee was only overtopped every other year. This is consistent with precipitation records thatshow extreme rainfall events in the spring of those years (Figure 7), but this trend cannot be confirmed overthe long term without continued monitoring. As stated earlier, upland runoff accumulated behind the leveein 2003, causing inundation and saturation over about 8.8 ha (21.7 ac).
Without a large spring rainfall event, it is unlikely that Apple Creek will overtop the levee. In order tocapitalize on annual flooding events in years when flooding is of insufficient magnitude to overtop the levee,portions of the existing levee could be lowered to form a notch at an elevation of approximately 137.8 m (452ft). This elevation would ensure that all the areas in the farm field would be flooded, including those that didnot exhibit wetland hydrology in 2003. In 2003, the water level in the creek exceeded this elevation duringa single flood event for a total of 67 hours. Continued monitoring will help refine this elevation, because itis based on only two years of monitoring. The most appropriate location for this would be near thesouthwest corner of the site, capitalizing on a weak spot already observed in the levee. Reinforcement ofthe lower portion of the levee coupled with the downstream location of the notch would be expected toreduce historic erosion at this location. Because areas that are not being considered for purchase are alsoprotected by the levee, then a levee would need to be constructed to protect the unpurchased parts of thesite, or flooding easements would need to be purchased from the landowner.
Total removal of the levee would not be suggested because the levee acts to retain floodwater and runofffrom the uplands. Field observations indicate that once the water level in the creek falls, most of floodplainforest drains relatively rapidly, leading to saturation for less than 12.5% of the growing season. Therefore,complete removal of the levee may result in a smaller volume of water being maintained in the farm field.
In order to increase retention of water on the farm field, the drainage culvert in the southwest corner of thesite should be altered to allow water in and retain it onsite. This would permit excess water outside the leveeto enter the site while reducing the drainage of water from the site.
CONCLUSIONS
The following conclusions regarding the hydrogeology of this site are made.
! Nearly half, or 8.8 ha (21.7 ac), of this site, currently meets the criteria for wetland hydrology duringnormal years, nearly the entire site is underlain by hydric soil, and the area outside the levee isalready classified as NWI-mapped wetland. Widespread flooding in 2002 was the result of anextreme event.
Photo 2. Flooding of the farm field, looking north from the southwest corner of the levee (May 15, 2002).
Photo 1. Flooding of the floodplain forest, looking south from the southwest corner of the levee(May 15, 2002).
17
18
! Runoff from the uplands and flooding from Apple Creek are the primary sources of water for thissite. Lowering the levee along the southern portion of the site to an elevation of approximately137.8 m (452 ft) would allow floodwaters to enter the site annually, resulting in nearly the entire sitemeeting the criteria for wetland hydrology under normal conditions.
! Any farmed areas on the floodplain not purchased by IDOT should be appropriately protected withnewly constructed levees of similar elevation as the current levee, including drainage outlets. Thisis expected to be less economical than purchasing the entire leveed area due to continuedmaintenance and liability issues.
ACKNOWLEDGMENTS
Geoff Pociask, Paula Sabatini, Brad Ketterling, Kelli Weaver and Kara Hart-Carstens assisted with field workand read water levels. James Miner, Marshall Lake and Katy Werner provided assistance with wellinstallation.
REFERENCES
Berg, R. C., and J.P. Kempton, 1988, Stack Unit Mapping of Geologic Materials in Illinois to a Depth of 15Meters: Illinois State Geological Survey Circular 542, Champaign, Illinois, 23 p.
Hansel, A. and W.H. Johnson, 1996, Wedron and Mason Groups: Lithostratigraphic Reclassification ofDeposits of the Wisconsin Episode, Lake Michigan Lobe Area: Illinois State Geological SurveyBulletin 104, 116 p.
Herzog, B., B. Stiff, C. Chenoweth, K. Warner, J. Sieverling, and C. Avery, 1994, Buried Bedrock Surfaceof Illinois: Illinois State Geological Survey, Illinois Map 5, Champaign, Illinois, map scale 1:500,000,1 sheet.
Illinois State Geological Survey, 2001, Illinois Natural Resources Geospatial Data Clearinghouse, CarrolltonNE Digital Orthophoto Quarter Quadrangle, 1998 Data: Illinois State Geological Survey,Champaign, Illinois, available on line at http://www.isgs.uiuc.edu/nsdihome/webdocs/doqs/.
Illinois State Geological Survey, 2002, Annual Report for Active IDOT Wetland Compensation andHydrologic Monitoring Sites, September 1, 2001 to September 1, 2002: Submitted Under ContractNumber IDOT SW WIP FY03 ANTC to Illinois Department of Transportation, Illinois StateGeological Survey Open File Series 2002-3, Champaign, Illinois, 341 p.
Illinois State Geological Survey, 2003, Annual Report for Active IDOT Wetland Compensation andHydrologic Monitoring Sites, September 1, 2002 to September 1, 2003: Submitted Under ContractNumber IDOT SW WIP FY04 to Illinois Department of Transportation, Illinois State GeologicalSurvey Open File Series 2003-16, Champaign, Illinois, 300 p.
Midwestern Climate Center, December 2003, Midwestern Climate Information System: Illinois State WaterSurvey, Champaign, Illinois, available online at http://mcc.sws.uiuc.edu/.
National Water and Climate Center, June 2003, National Resource Conservation Service, Climate Analysisfor Wetlands by County, available online at http://www.wcc.nrcs.usda.gov/climate/wetlands.html.
Piskin, K., and R. Bergstrom, 1975, Thickness of Glacial Drift in Illinois: Illinois State Geological SurveyCircular 490, Champaign, Illinois, 34 p.
U.S. Army Corps of Engineers, 1987, Corps of Engineers Wetlands Delineation Manual: U.S. Army Corpsof Engineers Technical Report Y-87-1, Washington D.C., 100 p.
19
U.S. Department of Agriculture, 1974, Soil Survey of Greene County, Illinois, Soil Conservation Service,Washington D.C., 85 p.
U.S. Department of Agriculture, 1995a, Hydric Soils of Illinois (revised December 15, 1995), Hydric Soils ofthe United States, National Resources Conservation Service, National Soil Data Access Facility,available online http://soils.usda.gov/soil_use/hydric/states/il.htm.
U.S. Department of Agriculture, 1995b, County List of Hydric Soils in Illinois, National ResourcesConservation Service,
U.S. Department of Agriculture, 1995c, County List of Soils with Hydric Inclusions in Illinois, NationalResources Conservation Service
U.S. Fish and Wildlife Service, 1996, National Wetlands Inventory Map, Carrollton Quadrangle, Illinois, mapscale 1:24,000, 1 sheet, available online at http://www.isgs.uiuc.edu/nsdihome/.
U.S. Geological Survey, 1983, Carrollton, Illinois, 7.5-Minute Series (Topographic): U.S. Department of theInterior, Geological Survey, Reston, Virginia, map scale 1:24,000. 1 sheet, available online athttp://www.isgs.uiuc.edu/nsdihome/.
Willman, H., J. Frye, J. Simon, K. Clegg, D. Swann, E. Atherton, C. Collinson, J. Lineback, andT. Buschbach, 1967, Geologic map of Illinois: Illinois State Geological Survey, Champaign, Illinois,map scale 1:500,000, 1 sheet.