24
Tuesday, September 23, 2014 Augustine Doe Ron Marx Leveraging an organization’s current risk management to create a sustainable ERM program

Tuesday, September 23, 2014
Augustine Doe Ron Marx
Leveraging an organization’s current risk management to create a sustainable ERM program

AGENDAImportant considerations for ERMTransition from traditional risk management to ERM – best practicesKey enterprise risk management and monitoring toolsSustainable ERMDistilling top-tier enterprise-wide risksMapping top-tier risks on risk heat map to prioritize risk treatmentGenerating risk register to track ongoing risk management and monitoringCreating risk dashboards to monitor risk management’s performanceEstablishing risk tolerance policy to convey acceptable risk limitsDraft formal risk appetite statement to express the organization’s risk strategyQuestionsContact information
378
1011131 51719212324
2

8.3%10.6%
7.4%
Important considerations for ERM - Study
2013 Ernst & Young “Turning risks into results”* 2 0 1 1 Y T D r e p o r t e d a s o f 1 8 N o v e m b e r 2 0 1 1 .
Compound annual growth rates 2004–11* by risk maturity level
Revenue
16.8%Top 20%Middle 60%Bottom 20%
EBITDA
20.3%
9.5%
EBITDA/EV
4.1%2.5% 2.1%
• Do organizations with mature risk management practices outperform their peers financially?• Ernst & Young study suggests YES• Mature risk management drives financial results• Findings: companies with more mature risk management practices generated the highest growth
in revenue, EBITDA and EBITDA/EV
3

Total implementation timeline = 55 weeksBased on:
• $2 Billion in revenues• 40 executives interviewed during enterprise risk assessment• One internal full-time person• No mature traditional risk management program• Risk culture – perceives ERM as a checklist and an additional
cost that needs to be avoided
Important considerations for ERM - Timeline
Phase 1Identify Risks12-18 Weeks
Phase 2Assess Risks13-19 Weeks
Phase 3Monitoring/ Reporting12-18 Weeks
4
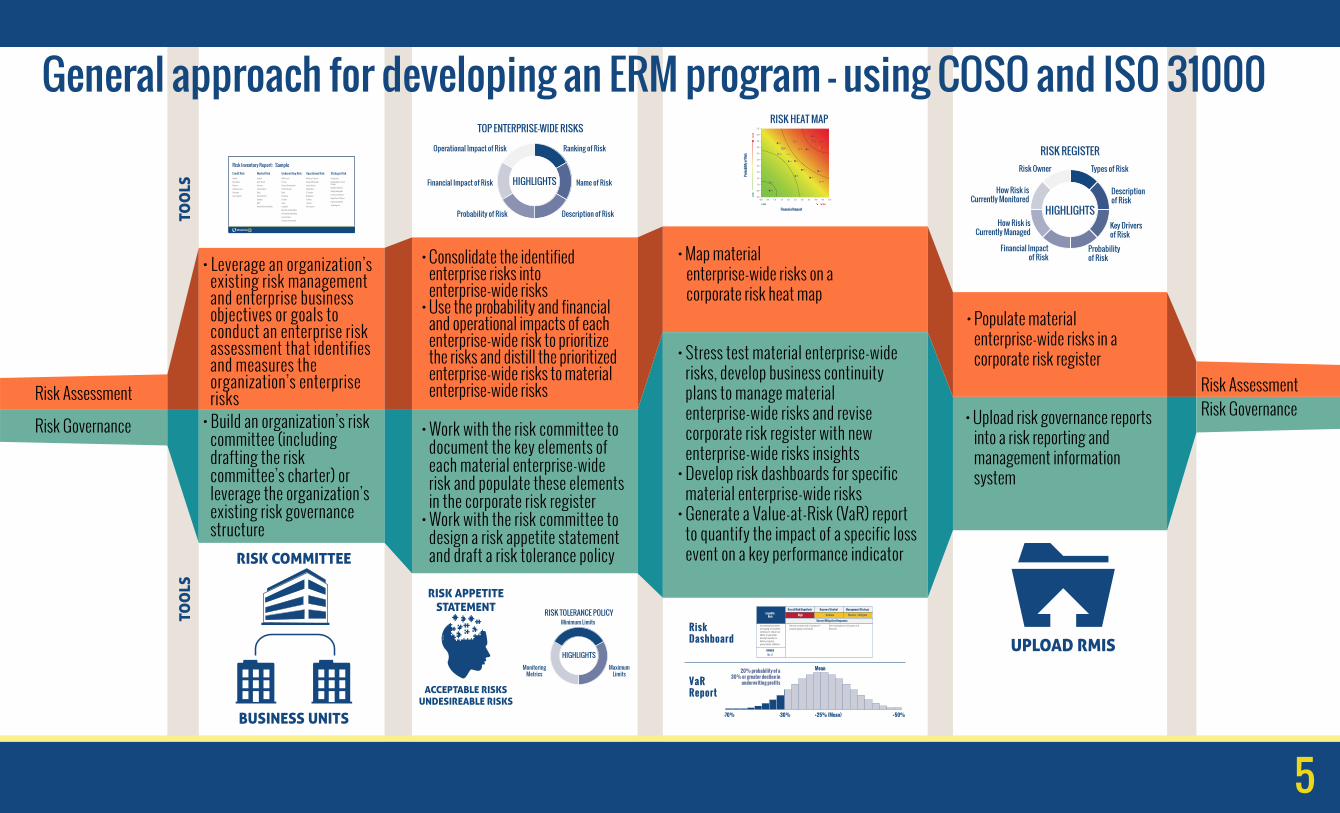
• Leverage an organization’s existing risk management and enterprise business objectives or goals to conduct an enterprise risk assessment that identifies and measures the organization’s enterprise risks
• Consolidate the identified enterprise risks into enterprise-wide risks
• Use the probability and financial and operational impacts of each enterprise-wide risk to prioritize the risks and distill the prioritized enterprise-wide risks to material enterprise-wide risks
• Work with the risk committee to document the key elements of each material enterprise-wide risk and populate these elements in the corporate risk register
• Work with the risk committee to design a risk appetite statement and draft a risk tolerance policy
• Map material enterprise-wide risks on a corporate risk heat map
• Upload risk governance reports into a risk reporting and management information system
• Populate material enterprise-wide risks in a corporate risk register• Stress test material enterprise-wide
risks, develop business continuity plans to manage material enterprise-wide risks and revise corporate risk register with new enterprise-wide risks insights
• Develop risk dashboards for specific material enterprise-wide risks
• Generate a Value-at-Risk (VaR) report to quantify the impact of a specific loss event on a key performance indicator
• Build an organization’s risk committee (including drafting the risk committee’s charter) or leverage the organization’s existing risk governance structure
Risk Assessment
Risk Governance
Risk AssessmentRisk Governance
Credit Risk Market Risk Underwriting Risk Operational Risk Strategic RiskDefault
Downgrade
Disputes
Settlement Lag
Sovereign
Concentration
Equities
Other Assets
Currency
Concentration
Basis
Re-investment
Liquidity
ALM
Interest Rate Sensitivity
UW Process
Pricing
Reserve Development
Product Design
Basis
Frequency
Severity
Lapse
Longevity
Mortality and Morbidity
Policyholder Optionality
Concentration
Economic Environment
Monetary Controls
Financial Reporting
Legal Controls
Distribution
IT Systems
Regulatory
Training
Turnover
Data Capture
Competition
Demographic / Social Change
Negative Publicity
Rating Downgrade
Customer Demands
Regulatory / Political
Capital Availability
Technological
Risk Inventory Report: Sample
Increasing bad debts and aging receivables continue to impair our ability to generate enough liquidity to defray ongoing policyholder liabilities
Review contract with Customer Y (largest aging receivable)
Sell receivable to third party at a discount
Liquidity Risk
Overall Risk Magnitude
OWNERMr. X
Current Mitigation Responses
Degree of Control Management Strategy
High Medium Monitor / Mitigate
20% probability of a30% or greater decline in
underwriting profits
Mean
-70% -30% +25% (Mean) +50%
VaRReport
RiskDashboard
Types of RiskRisk Owner
Descriptionof Risk
How Risk isCurrently Monitored
Key Driversof Risk
How Risk isCurrently Managed
Probabilityof Risk
Financial Impactof Risk
RISK REGISTER
HIGHLIGHTSFinancial Impact
Prob
abili
ty of
Risk
0.0
0.5
0.50.0 1.0 1.5 2.0 2.5 3.0 3.5 4.0 4.5 5.0
1.0
1.5
2.0
2.5
3.0
3.5
4.0
4.5
5.0
5.5
HIGHLOW
HIGH
LOW
H1
H4
H2
H3
M1
M2
M4
M3
C2
C1
IT1 L1
L4
L2
L3
R1
R2
F1
F2
O1
UPLOAD RMIS
RISK APPETITESTATEMENT
ACCEPTABLE RISKSUNDESIREABLE RISKS
RISK COMMITTEE
BUSINESS UNITS
TOP ENTERPRISE-WIDE RISKS
HIGHLIGHTS Name of Risk
Description of Risk
Ranking of Risk
Financial Impact of Risk
Probability of Risk
Operational Impact of Risk
RISK HEAT MAP
RISK TOLERANCE POLICY
HIGHLIGHTS
Minimum Limits
MaximumLimits
MonitoringMetrics
TOO
LSTO
OLS
5
General approach for developing an ERM program - using COSO and ISO 31000
Risk Assessment Deliverables
Solvency Assessment DeliverablesLiquidity &Liquidity RiskManagementReport
Risk- BasedCapital Report
Risk Governance Tools
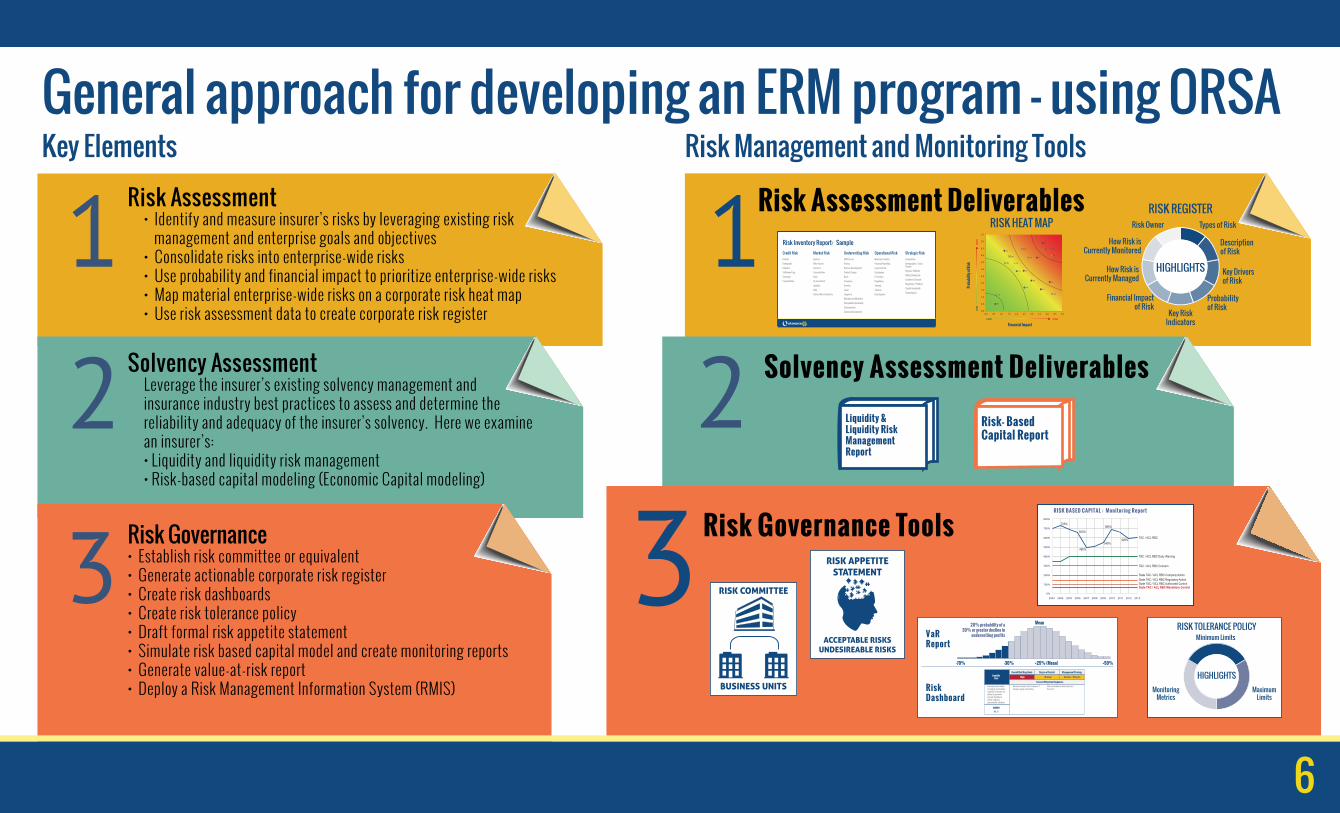
General approach for developing an ERM program – using ORSARisk Assessment
• Identify and measure insurer’s risks by leveraging existing risk management and enterprise goals and objectives
• Consolidate risks into enterprise-wide risks• Use probability and financial impact to prioritize enterprise-wide risks• Map material enterprise-wide risks on a corporate risk heat map• Use risk assessment data to create corporate risk register
Key Elements Risk Management and Monitoring Tools
Credit Risk Market Risk Underwriting Risk Operational Risk Strategic RiskDefault
Downgrade
Disputes
Settlement Lag
Sovereign
Concentration
Equities
Other Assets
Currency
Concentration
Basis
Re-investment
Liquidity
ALM
Interest Rate Sensitivity
UW Process
Pricing
Reserve Development
Product Design
Basis
Frequency
Severity
Lapse
Longevity
Mortality and Morbidity
Policyholder Optionality
Concentration
Economic Environment
Monetary Controls
Financial Reporting
Legal Controls
Distribution
IT Systems
Regulatory
Training
Turnover
Data Capture
Competition
Demographic / Social Change
Negative Publicity
Rating Downgrade
Customer Demands
Regulatory / Political
Capital Availability
Technological
Risk Inventory Report: Sample
Types of RiskRisk Owner
Descriptionof Risk
How Risk isCurrently Monitored
Key Driversof Risk
How Risk isCurrently Managed
Probabilityof Risk
Financial Impactof Risk
RISK REGISTER
HIGHLIGHTS
Key RiskIndicatorsFinancial Impact
Prob
abili
ty of
Risk
0.0
0.5
0.50.0 1.0 1.5 2.0 2.5 3.0 3.5 4.0 4.5 5.0
1.0
1.5
2.0
2.5
3.0
3.5
4.0
4.5
5.0
5.5
HIGHLOW
HIGH
LOW
H1
H4
H2
H3
M1
M2
M4
M3
C2
C1
IT1 L1
L4
L2
L3
R1
R2
F1
F2
O1
RISK HEAT MAP
Solvency AssessmentLeverage the insurer’s existing solvency management and insurance industry best practices to assess and determine the reliability and adequacy of the insurer’s solvency. Here we examine an insurer’s:• Liquidity and liquidity risk management• Risk-based capital modeling (Economic Capital modeling)
Risk Governance• Establish risk committee or equivalent• Generate actionable corporate risk register• Create risk dashboards• Create risk tolerance policy• Draft formal risk appetite statement• Simulate risk based capital model and create monitoring reports• Generate value-at-risk report• Deploy a Risk Management Information System (RMIS)
RISK BASED CAPITAL : Monitoring Report800%
700%
600%
500%
400%
300%
200%
100%
0%
2003 2004 2005 2006 2007 2008 2009 2010 2011 2012 2013
TAC / ACL RBC
725%
650%
495%
549%
685%
595%
TAC / ACL RBC Early Warning
TAC / ACL RBC Concern
State TAC / ACL RBC Company ActionState TAC / ACL RBC Regulatory ActionState TAC / ACL RBC Authorized ControlState TAC / ACL RBC Mandatory Control
RISK APPETITESTATEMENT
ACCEPTABLE RISKSUNDESIREABLE RISKS
RISK TOLERANCE POLICY
HIGHLIGHTS
Minimum Limits
MaximumLimits
MonitoringMetrics
RISK COMMITTEE
BUSINESS UNITS Increasing bad debts and aging receivables continue to impair our ability to generate enough liquidity to defray ongoing policyholder liabilities
Review contract with Customer Y (largest aging receivable)
Sell receivable to third party at a discount
Liquidity Risk
Overall Risk Magnitude
OWNERMr. X
Current Mitigation Responses
Degree of Control Management Strategy
High Medium Monitor / Mitigate
20% probability of a30% or greater decline in
underwriting profits
Mean
-70% -30% +25% (Mean) +50%
VaRReport
RiskDashboard
6

• Understand your organizational culture – culture survey• Senior management must set the tone for implementing ERM• Must measure risk in order to effectively manage and monitor it• Leverage the organization’s existing risk management and don’t
reinvent the wheel• Do not try to do too much at once – implement ERM in
reasonable phases• Have a roadmap and execute so that management stays
continuously engaged with the process
Transition from traditional risk management to ERM – best practices
7
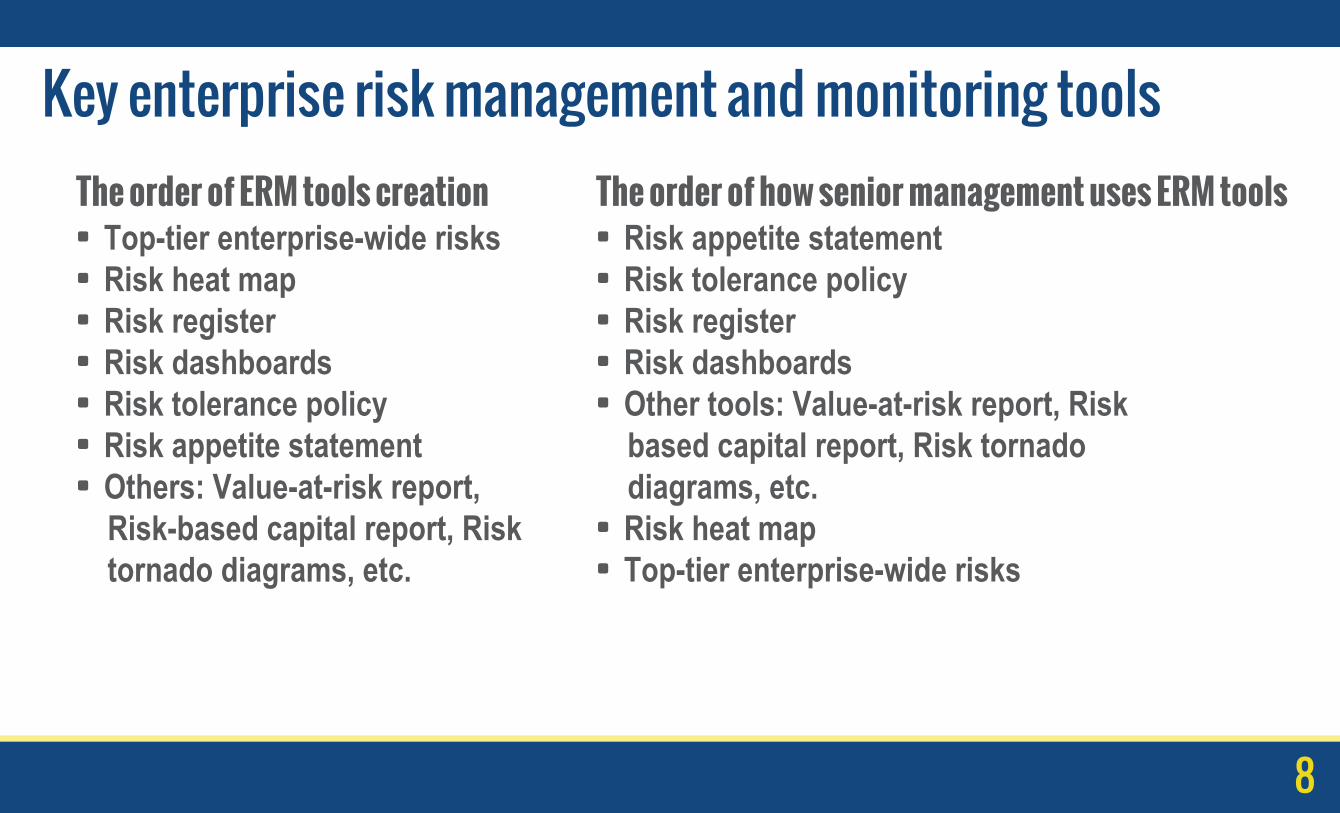
• Top-tier enterprise-wide risks• Risk heat map• Risk register• Risk dashboards• Risk tolerance policy• Risk appetite statement• Others: Value-at-risk report,
Risk-based capital report, Risk tornado diagrams, etc.
Key enterprise risk management and monitoring toolsThe order of ERM tools creation
• Risk appetite statement• Risk tolerance policy• Risk register• Risk dashboards• Other tools: Value-at-risk report, Risk
based capital report, Risk tornado diagrams, etc.
• Risk heat map• Top-tier enterprise-wide risks
The order of how senior management uses ERM tools
8
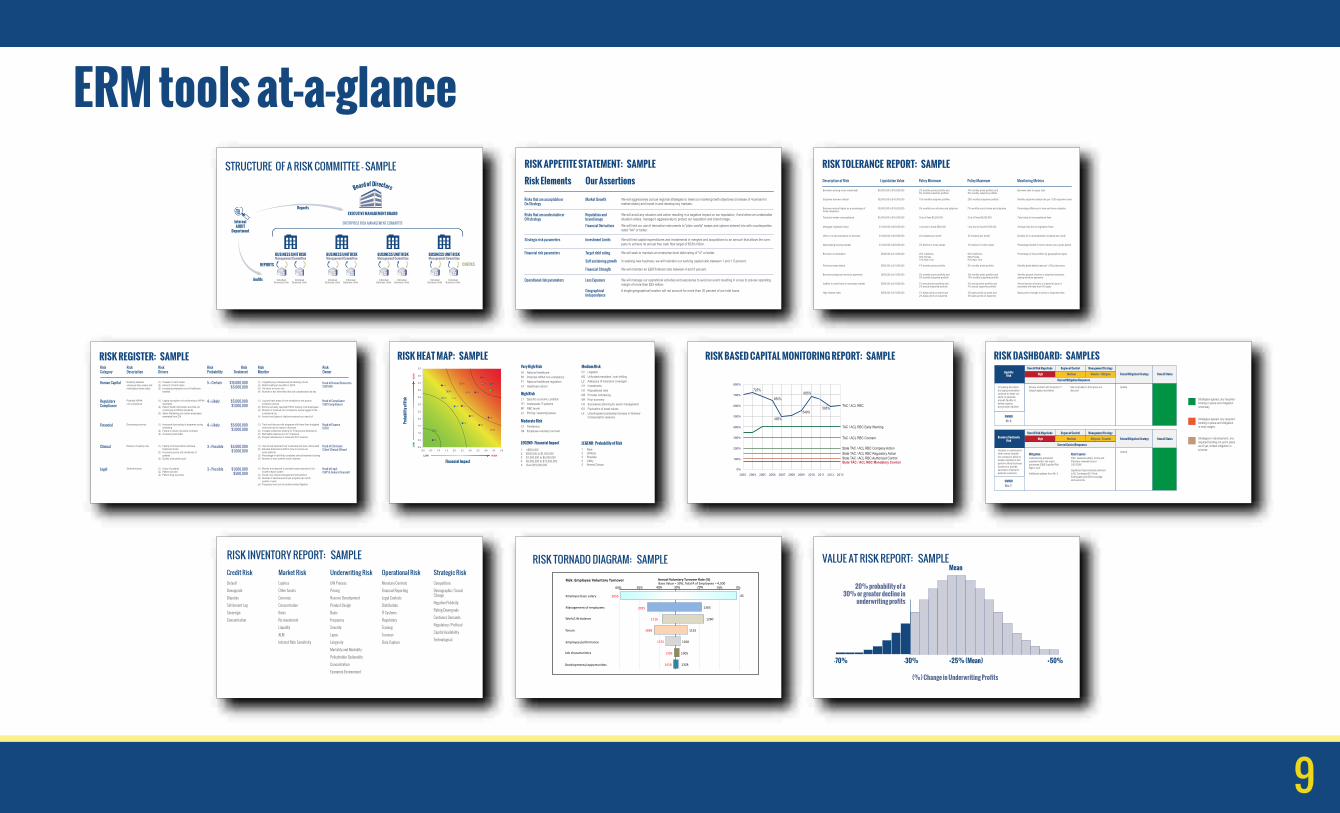
ERM tools at-a-glance
Credit Risk Market Risk Underwriting Risk Operational Risk Strategic RiskDefault
Downgrade
Disputes
Settlement Lag
Sovereign
Concentration
Equities
Other Assets
Currency
Concentration
Basis
Re-investment
Liquidity
ALM
Interest Rate Sensitivity
UW Process
Pricing
Reserve Development
Product Design
Basis
Frequency
Severity
Lapse
Longevity
Mortality and Morbidity
Policyholder Optionality
Concentration
Economic Environment
Monetary Controls
Financial Reporting
Legal Controls
Distribution
IT Systems
Regulatory
Training
Turnover
Data Capture
Competition
Demographic / Social Change
Negative Publicity
Rating Downgrade
Customer Demands
Regulatory / Political
Capital Availability
Technological
RISK INVENTORY REPORT: SAMPLE
BUSINESS UNIT RISKBUSINESS UNIT RISKBUSINESS UNIT RISKBUSINESS UNIT RISKManagement CommitteeManagement CommitteeManagement CommitteeManagement Committee
STRUCTURE OF A RISK COMMITTEE - SAMPLE
IndividualBusiness Units
IndividualBusiness Units
IndividualBusiness Units
IndividualBusiness Units
IndividualBusiness Units
IndividualBusiness Units
IndividualBusiness Units
IndividualBusiness Units
EXECUTIVE MANAGEMENT BOARDReports
Audits
InternalAUDIT
Department
ENTERPRISE RISK MANAGEMENT COMMITTEE
REPORTS CHECKS
Board of DirectorsRisk Elements
RISK APPETITE STATEMENT: SAMPLE
Risks that are acceptable orOn-Strategy
Market Growth We will aggressively pursue regional strategies to meet our market growth objectives (increase of 4 percent in market share) and invest in and develop key markets.
Risks that are undesirable or Off-strategy
Reputation and brand image
We will avoid any situation and action resulting in a negative impact on our reputation, if and when an undesirable situation arises, manage it aggressively to protect our reputation and brand image.
Financial Derivatives We will limit our use of derivative instruments to "plain vanilla" swaps and options entered into with counterparties rated "AA" or better.
Strategic risk parameters Investment Limits We will limit capital expenditures and investments in mergers and acquisitions to an amount that allows the com-pany to achieve its annual free cash flow target of $330 million.
Financial risk parameters Target debt rating We will seek to maintain an enterprise-level debt rating of "A" or better.
Self sustaining growth In seeking new business, we will maintain our working capital ratio between 1 and 1.5 percent.
Operational risk parameters Loss Exposure We will manage our operational activities and exposures to avoid an event resulting in a loss to pre-tax operating margin of more than $25 million.
Geographical Independence
A single geographical location will not account for more than 20 percent of our total loans.
Financial Strength We will maintain an EBIT/Interest ratio between 4 and 5 percent.
Our Assertions Description of Risk Liquidation Value Policy Minimum Policy Maximum Monitoring Metrics
Borrower carrying more overall debt $5,000,000 to $15,000,000 2% monthly prime portfolio and 5% monthly subprime portfolio
4% monthly prime portfolio and 8% monthly subprime portfolio
Borrower debt to equity ratio
Subprime borrower default $5,000,000 to $15,000,000 10% monthly subprime portfolio 20% monthly subprime portfolio Monthly subprime default rate per 1,000 subprime loans
Borrower amount higher as a percentage of home valuations
$5,000,000 to $15,000,000 5% monthly sum of prime and subprime 7% monthly sum of prime and subprime Percentage difference in loan and home valuation
Particular lender noncompliance $5,000,000 to $15,000,000 Cost of fines $5,000,000Cost of fines $2,500,000 Total value of noncompliance fines
Mortgage origination fraud $1,000,000 to $5,000,000 Loss due to fraud $500,000 Loss due to fraud $2,500,000 Average loss due to origination fraud
Little or no documentation on borrower $1,000,000 to $5,000,000 20 incidents per month 30 incidents per month Number of no documentation incidents per month
Depreciating housing market $1,000,000 to $5,000,000 3% decline in home values 4% decline in home values Percentage decline in home values over a given period
Borrower concentration $625,000 to $1,000,000 20% California, 30% Florida 15% New York
30% California, 35% Florida, 20% New York
Percentage of loan portfolio by geographical region
Prime borrower default $500,000 to $1,000,000 4% monthly prime portfolio 6% monthly prime portfolio Monthly prime default rate per 1,000 prime loans
Borrower paying low minimum payments $500,000 to $1,000,000 2% monthly prime portfolio and 5% monthly subprime portfolio
4% monthly prime portfolio and 10% monthly subprime portfolio
Monthly percent of prime or subprime borrowers paying minimum payments
Inability to resell loans in secondary market $500,000 to $1,000,000 1% annual prime portfolio and 2% annual subprime portfolio
2% annual prime portfolio and 4% annual subprime portfolio
Annual percent of prime or subprime loans of borrowers with less than 5% equity
High interest rates $500,000 to $1,000,000 1% basis points on prime and 2% basis points on subprime 4% basis points on subprime
Basis points changes in prime or subprime rates2% basis points on prime and
RISK TOLERANCE REPORT: SAMPLE
Risk Category
Risk Description
Risk Drivers
Risk Probability
Risk Treatment
Risk Monitor
Risk Owner
Human Capital 5 = Certain $15,000,000$5,000,000
Head of Human Resources (SVP, HR)
Head of Compliance (SVP, Compliance)
Head of Finance (CFO)
Head of Clinicians (Chief Clinical Officer)
Head of Legal (SVP & General Counsel)
$5,000,000$1,000,000
$5,000,000$1,000,000
$5,000,000$1,000,000
$1,000,000$500,000
4 = Likely
4 = Likely
3 = Possible
3 = Possible
Regulatory Compliance
Financial
Clinical
Legal
Disparity between employee base salary and marketplace base salary
Potential HIPAA non-compliance
Decreasing revenue
Delivery of quality care
Sentinel events
(1) Freezes in merit raises(2) Amount of merit raises(3) Increasing employee cost of healthcare
benefits
(1) Laptop encryption not conforming to HIPAA standards
(2) Patient health information and files not conforming to HIPAA standards
(3) Sales, Marketing and certain employees exempted from ZIX
(1) Increased discounting of programs during marketing
(2) Failure to obtain insurance contracts(3) Increasing bad debts
(1) Failure of clinical staff to embrace treatment model
(2) Increasing acuity and complexity of patients
(3) Quality of physician pool
(1) Acuity of patients(2) Patient suicides(3) Patient drug overdose
(1) Targeted pay increases and job leveling roll-out(2) Rebid healthcare benefits in 20XX (3) Voluntary turnover rate(4) Number of exit interviews that cite compensation as key
(1) Log and track areas of non-compliance and pursue corrective actions
(2) Enforce annually required HIPAA training of all employees(3) Number of resolved non-compliance issues logged in the
compliance log(4) Amount and types of citations received as a result of
(1) Track and discuss with programs with lower than budgeted revenues how to improve revenues
(2) Increase collections training for Finance and Admissions(3) Bad debts expense as a % of revenue(4) Program allowances or discounts from revenue
(1) Use clinical treatment tool to educate and train clinical staff(2) Educate Admissions staff on how to screen-out
acute patients (3) Percentage of staff that completes clinical treatment training(4) Number of new sentinel event incidents
(1) Monitor and respond to sentinel events reported in the incident report system
(2) Create new clinical management interventions (3) Number of sentinel events per program per month,
quarter or year(4) Frequency and cost of sentinel-related litigation
RISK REGISTER: SAMPLE RISK BASED CAPITAL MONITORING REPORT: SAMPLE
800%
700%
600%
500%
400%
300%
200%
100%
0%
2003 2004 2005 2006 2007 2008 2009 2010 2011 2012 2013
TAC / ACL RBC
725%
650%
495%
549%
685%
595%
TAC / ACL RBC Early Warning
TAC / ACL RBC Concern
State TAC / ACL RBC Company ActionState TAC / ACL RBC Regulatory ActionState TAC / ACL RBC Authorized ControlState TAC / ACL RBC Mandatory Control
H1 National healthcareR1 Potential HIPAA non-complianceF1 National healthcare regulationC1 Healthcare reform
Financial Impact
Very High Risk Medium Risk
Moderate Risk
LEGEND: Financial Impact LEGEND: Probability of Risk
High Risk
Prob
abili
ty of
Risk
0.0
0.5
0.50.0 1.0 1.5 2.0 2.5 3.0 3.5 4.0 4.5 5.0
1.0
1.5
2.0
2.5
3.0
3.5
4.0
4.5
5.0
5.5
HIGHLOW
HIGH
LOW
H1
H4
H2
H3
M1
M2
M4
M3
C2
C1
IT1 L1
L4
L2
L3
R1
R2
F1
F2
O1
L1 Specific economic conditionIT1 Inadequate IT systemsM1 RBC levelsL3 Pricing / reserving issues
1 <$500,0002 $500,000 to $1,000,0003 $1,000,000 to $5,000,0004 $5,000,000 to $15,000,0005 Over $15,000,000
1 Rare2 Unlikely3 Possible4 Likely5 Almost Certain
F2 LitigationM2 Unfunded mandates / cost shiftingL2 Adequacy of insurance coveragesO1 InvestmentsH2 Reputational risksM3 Provider contractingM4 Poor economyH3 Succession planning for senior managementR2 Fluctuation of asset valuesL4 Unanticipated substantial increase in Workers’
Compensation reserves
C1 PandemicsH4 Employee voluntary turnover
RISK HEAT MAP: SAMPLE
VALUE AT RISK REPORT: SAMPLE
20% probability of a30% or greater decline in
underwriting profits
(%) Change in Underwriting Profits
Mean
-70% -30% +25% (Mean) +50%
RISK DASHBOARD: SAMPLES
Increasing bad debts and aging receivables continue to impair our ability to generate enough liquidity to defray ongoing policyholder liabilities
Review contract with Customer Y (largest aging receivable)
Strategies agreed, any required funding in place and mitigation underway
Strategies agreed, any required funding in place and mitigation in early stages
Strategies in development, any required funding not yet in place as of yet, limited mitigation in process
Sell receivable to third party at a discount
Update
Liquidity Risk
Overall Risk Magnitude
OWNERMr. X
Current Mitigation Responses
Degree of Control Management Strategy
Future Mitigation Strategy Overall StatusHigh Medium Monitor / Mitigate
Hazards or catastrophic/ other events threaten the company’s ability to sustain operations and perform critical business functions or provide services to internal or external customers
Implementing enhanced supplier/vendor risk mgmt. processes (D&B Supplier Risk Mgmt. tool)
Additional updates from Mr. X
Update
Business ContinuityRisk
Overall Risk Magnitude
OWNERMrs. Y
Current Control Responses
MitigationP&C, General Liability, Crime and Fiduciary renewals bound 3/31/20XX
Significant improvements achieved in BI, Contingent BI, Flood, Earthquake and Wind coverage and sub-limits
Risk Transfer
Degree of Control Management Strategy
Future Mitigation Strategy Overall StatusHigh Medium Mitigate / Transfer
Annual Voluntary Turnover Rate (%) Risk: Employee Voluntary Turnover
60% 50% 40% 30% 20% 10% 0% Base Value = 30%, Total # of Employees = 4,500
Employee base salary 2655 45
Management of employees 2025 1305
Work/Life balance 1260
Tenure 1868 1125
Employee performance 1575 1260
Job characteristics 1395 1305
Developmental opportunities 1418 1328
1710
RISK TORNADO DIAGRAM: SAMPLE
9

Sustainable ERMLeverage your risk management knowledge and experience to move ERM forward
Distill many, many risks to arrive at your organization’s top-tier risks
• You have overall knowledge of the organization• You are the repository for exposure information and loss data• Gain knowledge of your business continuity, emergency response
and disaster recovery• You have the ability to prioritize risk based on probability and impact• You have the contacts throughout the organization
10
Distilling risks to arrive at top-tier enterprise-wide risks
• Risk assessment questionnaire• Consolidating risks• Determining enterprise-wide risks• Prioritizing enterprise-wide risks based on probability and impact• Arrive at top-tier enterprise-wide risks
11

Ranking Description of Risk Probability Financial Impact
1 Ineffectively managed subsidiary results cause liquidity pressures 5 5
2 Experience reputational incidents that tarnish brand image 4 5
3 Data loss at parent and subsidiaries exposes Company XYZ to privacy breaches 4 4
4 Decreasing RBC may affect Company XYZ’s solvency 4 3
5 The increased risk of underwriting health insurance in the post-ACA market environment may negatively impact Company XYZ’s financial strength and liquidity
3 4
Company XYZ’s top-tier enterprise-wide risks
12

Mapping top-tier enterprise-wide risks on risk heat map toprioritize risk treatment
• Use Excel and PowerPoint• Use Riskonnect and other GRC softwares
13
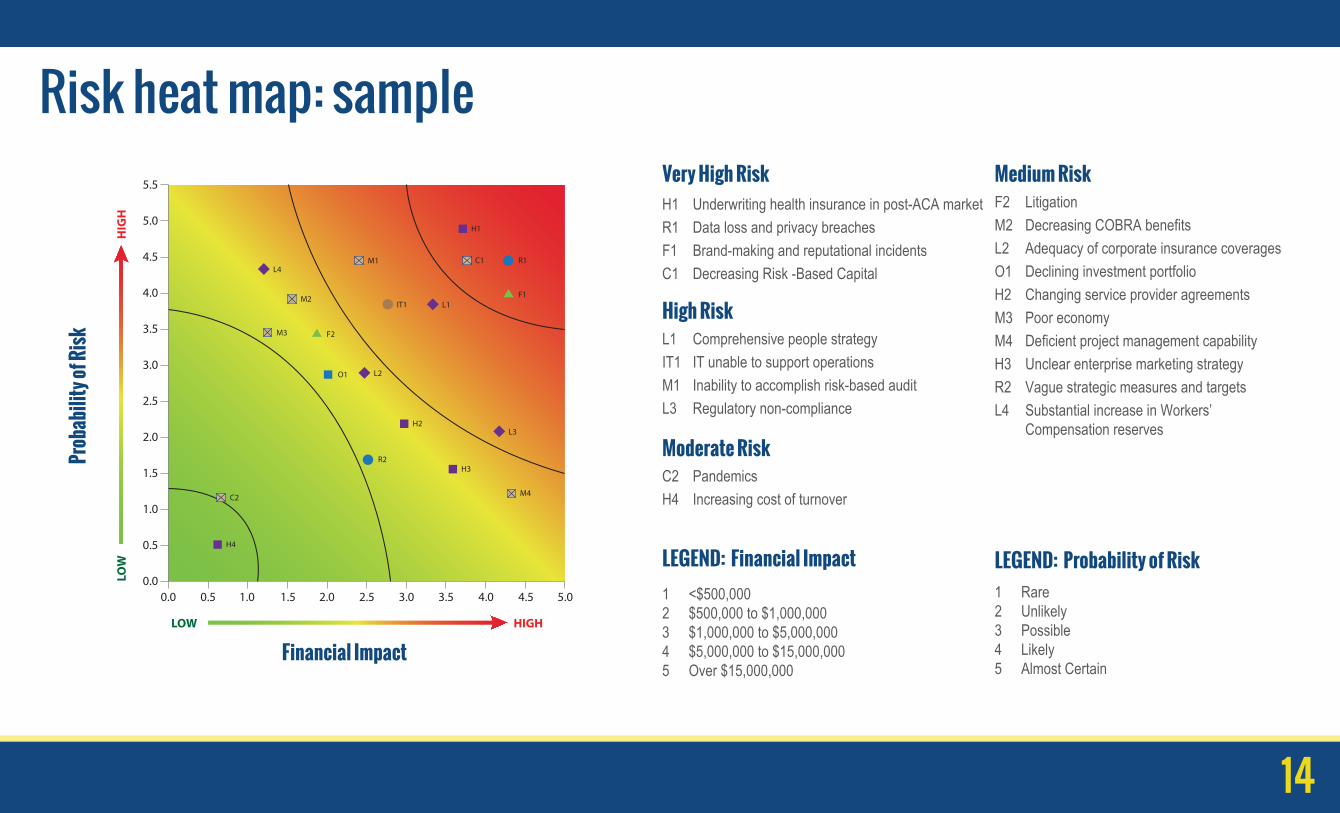
H1 Underwriting health insurance in post-ACA marketR1 Data loss and privacy breachesF1 Brand-making and reputational incidentsC1 Decreasing Risk -Based Capital
Financial Impact
Very High Risk Medium Risk
Moderate Risk
LEGEND: Financial Impact LEGEND: Probability of Risk
High Risk
Prob
abili
ty of
Risk
0.0
0.5
0.50.0 1.0 1.5 2.0 2.5 3.0 3.5 4.0 4.5 5.0
1.0
1.5
2.0
2.5
3.0
3.5
4.0
4.5
5.0
5.5
HIGHLOW
HIGH
LOW
H1
H4
H2
H3
M1
M2
M4
M3
C2
C1
IT1 L1
L4
L2
L3
R1
R2
F1
F2
O1
L1 Comprehensive people strategyIT1 IT unable to support operationsM1 Inability to accomplish risk-based auditL3 Regulatory non-compliance
1 <$500,0002 $500,000 to $1,000,0003 $1,000,000 to $5,000,0004 $5,000,000 to $15,000,0005 Over $15,000,000
1 Rare2 Unlikely3 Possible4 Likely5 Almost Certain
F2 LitigationM2 Decreasing COBRA benefitsL2 Adequacy of corporate insurance coveragesO1 Declining investment portfolioH2 Changing service provider agreementsM3 Poor economyM4 Deficient project management capabilityH3 Unclear enterprise marketing strategyR2 Vague strategic measures and targetsL4 Substantial increase in Workers’
Compensation reserves
C2 PandemicsH4 Increasing cost of turnover
Risk heat map: sample
14

Generating risk register to track ongoingrisk management and monitoring
• Create Key Risk Indicators and risk metrics• Link each top-tier risk to a Key Performance Indicator (KPI)• Appoint risk owners – makes management more accountable• Develop an actionable risk register – actions required and dates
15

Ranking Description
1
2
3
4
5
Key Drivers of Risk Probability Financial ImpactKey Performance andRisk Indicators (KPIs & KRIs) Actions Required Owner
Head ofActuary
Head of IT
Head ofCommunications
Head ofFinance
Head ofHuman
Resources
5 = Certain $15,000,000$5,000,000
$5,000,000$1,000,000
$5,000,000$1,000,000
$5,000,000$1,000,000
$1,000,000$500,000
4 = Likely
4 = Likely
3 = Possible
3 = Possible
(1) Adverse selection(2) Competition(3) Premium constraints
(2) Employee security practices(3) Hackers
(1) Vendor security
(1) Lack of effective controls around employee agreements(2) Ineffective governance structure
(3) Talent acquisition and recruitment plans
(3) Major adverse event
(1) Subsidiary results(2) Subsidiary losses and cost overruns(3) Investment portfolio variability
(1) Unclear compensation program(2) Employee relations/engagement
(1) Monthly loss ratio analysis(2) Monthly claims trend analysis
(1) Number of vendors reviewed by security per month(2) Number of employee non-compliance with IT security practices per month
(1) Customer satisfaction (CSAT) score(2) Employee satisfaction (ESAT) score
(1) Quarterly ratio (%) of TAC/ ACL RBC(2) Month end budget variance
(1) Current month employee turnover (voluntary)(2) Revenue per employee
(1) Review reinsurance annually for adequacy of coverage(2) Report to board new business and renewal quotes
(1) Implement security management and controls by 20XX(2) Implement software that monitors emails real time by 20XX
(1) HR report to Board unique employee agreements(2) Continue to monitor CSAT and ESAT scores and implement corrective measures
(1) Purchase catastrophic reinsurance by 20XX(2) Finance sign-off on all major projects
(1) Beginning 20XX establish process for approving positions(2) Acquire new talent
Risk register: sample
Increased risk of underwriting health insurance in post -ACA market
Data loss that exposes company to privacy breaches
Brand-making and reputational incidents that impact brand health
Decreasing risk-based capital that may impact liquidity
Lack comprehensive people strategy
16

Creating risk dashboards to monitor risk management’sperformance
• KRIs and KPIs for board-level reporting• Risk metrics for executive-level reporting• Current value, target minimum and target maximum
17
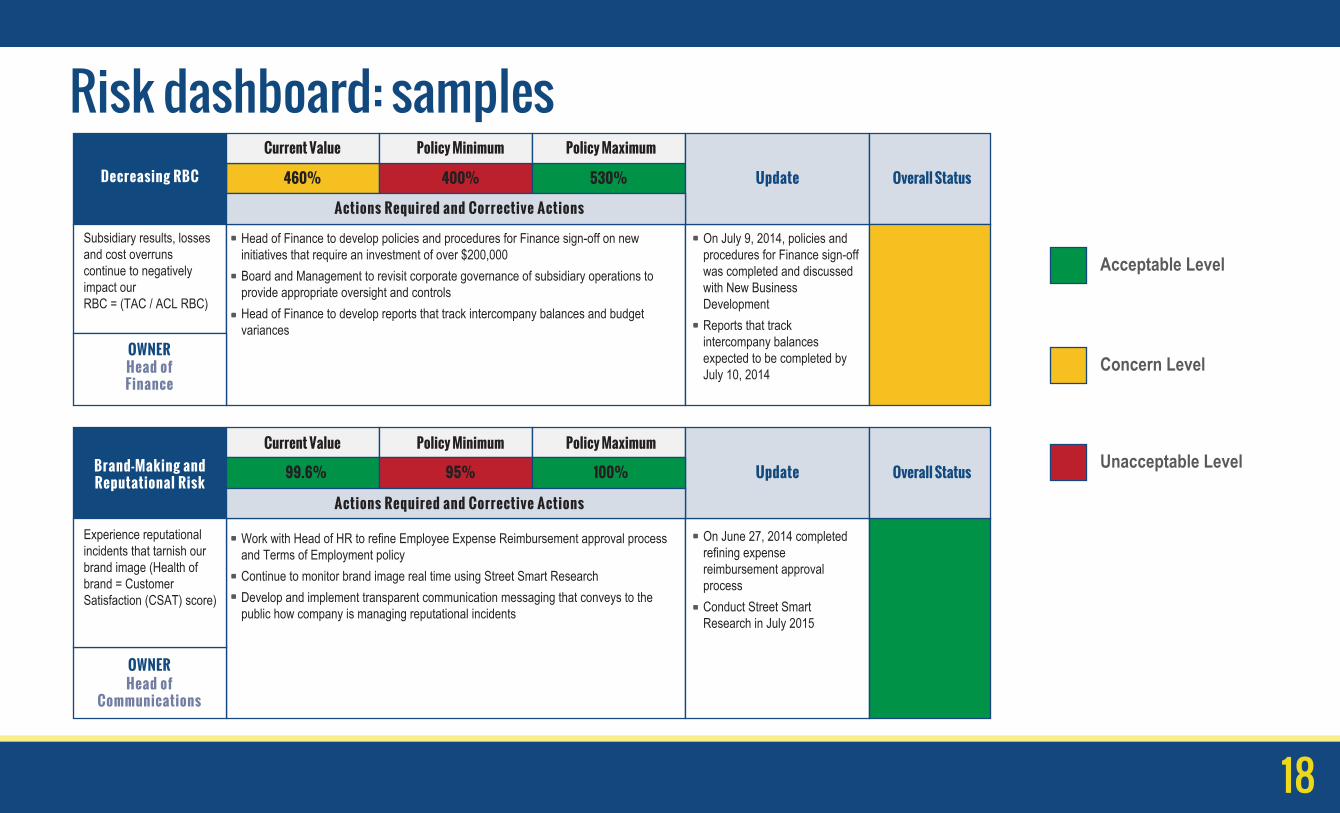
Acceptable Level
Concern Level
Unacceptable Level
Decreasing RBC
Brand-Making andReputational Risk
OWNERHead ofFinance
Actions Required and Corrective Actions
Update Overall Status460% 400% 530%
OWNERHead of
Communications
Update Overall Status99.6% 95% 100%
Risk dashboard: samples
Current Value Policy Minimum Policy Maximum
Current Value Policy Minimum Policy Maximum
Actions Required and Corrective Actions
Subsidiary results, losses and cost overruns continue to negatively impact our RBC = (TAC / ACL RBC)
Experience reputational incidents that tarnish our brand image (Health of brand = Customer Satisfaction (CSAT) score)
Work with Head of HR to refine Employee Expense Reimbursement approval process and Terms of Employment policyContinue to monitor brand image real time using Street Smart ResearchDevelop and implement transparent communication messaging that conveys to the public how company is managing reputational incidents
•
••
Head of Finance to develop policies and procedures for Finance sign-off on new initiatives that require an investment of over $200,000Board and Management to revisit corporate governance of subsidiary operations to provide appropriate oversight and controlsHead of Finance to develop reports that track intercompany balances and budget variances
• On July 9, 2014, policies and procedures for Finance sign-off was completed and discussed with New Business DevelopmentReports that track intercompany balances expected to be completed by July 10, 2014
•
•
On June 27, 2014 completed refining expense reimbursement approval processConduct Street Smart Research in July 2015
•
•
•
•
18

Establishing risk tolerance policy to convey acceptablerisk limits
• Meet with risk owners and determine the minimum and maximum limits for each KRI, KPI and risk metrics
• Determine appropriate corrective actions needed to normalize KRIs, KPIs and risk metrics
19
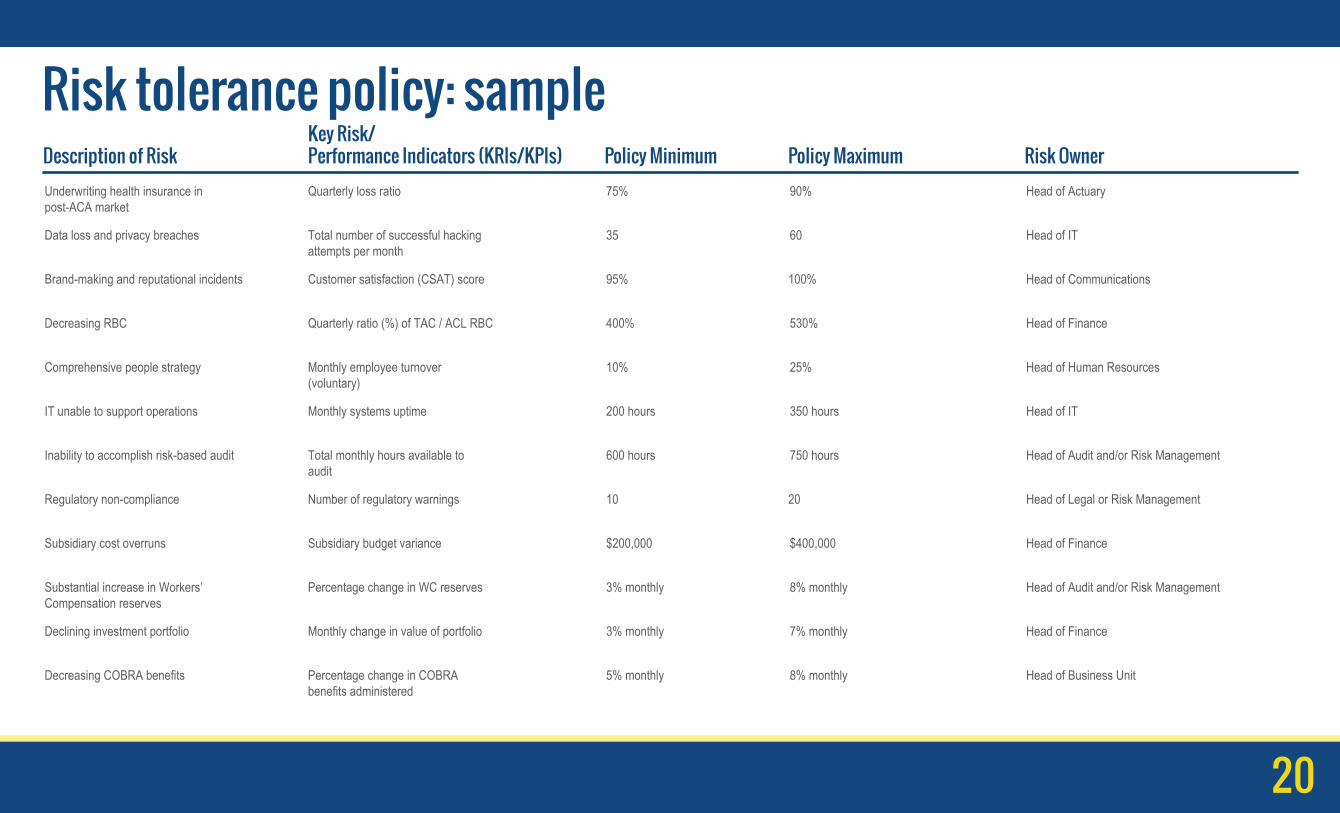
Description of RiskKey Risk/Performance Indicators (KRIs/KPIs) Policy Minimum Policy Maximum Risk Owner
Underwriting health insurance inpost-ACA market
Quarterly loss ratio 75% 90% Head of Actuary
Data loss and privacy breaches Total number of successful hackingattempts per month
35 60 Head of IT
Brand-making and reputational incidents Customer satisfaction (CSAT) score 95% 100% Head of Communications
Decreasing RBC Quarterly ratio (%) of TAC / ACL RBC 530%400% Head of Finance
Comprehensive people strategy Monthly employee turnover(voluntary)
10% 25% Head of Human Resources
IT unable to support operations Monthly systems uptime 200 hours 350 hours Head of IT
Inability to accomplish risk-based audit Total monthly hours available toaudit
600 hours 750 hours Head of Audit and/or Risk Management
Regulatory non-compliance Number of regulatory warnings 10 20 Head of Legal or Risk Management
Subsidiary cost overruns Subsidiary budget variance $200,000 $400,000 Head of Finance
Substantial increase in Workers’Compensation reserves
Percentage change in WC reserves 3% monthly 8% monthly Head of Audit and/or Risk Management
Declining investment portfolio Monthly change in value of portfolio 3% monthly 7% monthly Head of Finance
Decreasing COBRA benefits Percentage change in COBRAbenefits administered
5% monthly Head of Business Unit8% monthly
Risk tolerance policy: sample
20
• General counsel involvement in risk appetite statement• Guiding statement• Risk appetite elements• Risk assertions• Listing additional support
Draft formal risk appetite statement to express theorganization’s risk strategy
21

Risk Elements Our Assertions Additional Support
Formal risk appetite statement: sampleGuiding Statement
Brand-making and reputation
Contribution to Surplus
Network Provider Penetration
Operational Risk Parameters
Human Resources Risk Parameters
Capital Adequacy
22
This Formal Risk Appetite Statement is drafted solely for the purpose of providing Company XYZ, its subsidiaries and affiliates guidance on how to manage enterprise-wide risks. No statements made herein bind Company XYZ, its subsidiaries and affiliates to any contemplated contracts or agreements. Company XYZ, its subsidiaries and affiliates reserve the right to change any statements made herein with or without notice to any third parties.
Company XYZ is an insurance company that exists for the benefit of its policyholders. We protect our brand, maintain adequate capital, run sustainable subsidiary and affiliate operations, carry-out core operations and leverage our market share to ensure we return value to our policyholders.
Brand protection and enhancements: We strive to proactively avoid any situation or action that has the potential to unnecessarily impair our brand and reputation. This involves ensuring our employees, business partners and policyholders are committed to our values and that their actions and behaviors reflect these values. We believe this is what would allow us to take appropriate actions to preserve the strength of our brand and reputation in the areas of corporate compliance, customer privacy, corporate information security, governance and positive public image.
Risk-based capital: We will strive to grow to an RBC level appropriate to the risk of our core operations to ensure our sustainability in our market.(1) Controlled subsidiaries: Controlled subsidiaries are expected to manage their businesses and operations with the best interest of the shareholder and other appropriate stakeholders in mind. This expectation includes analysis and understanding of the risks associated with business initiatives to be undertaken by the controlled subsidiary. Further, controlled subsidiaries should comply with defined agreements (e.g. inter-company agreements, dividend policies, etc.) and governance processes as established with their shareholder.(2) External Portfolio risk: Must contemplate the risk profile of our controlled subsidiaries, the risk profile of our core business and Company XYZ's capital position.
Income/earnings: In order to remain viable in our market, we target an annual operating margin of 5% across all core operations. Product segments (both core and non-core) are expected to have a positive contribution to RBC.
Provider reimbursements: We will maintain adequate market share to provide the best value to our policyholders. We target no less than 50% of aggregate California health care providers' private payer revenue.
Contract management and bid and proposal review: No projects or bids will be pursued without appropriate review and analysis based on defined governance processes, which should include an assessment of material risks and financial impact.
Human Capital: We will ensure Company XYZ has identified key talent and leadership to develop new leaders through defined succession plans and development. We will maintain the resources and tools to attract, develop and retain the employees necessary to fulfill our mission.
Vision andMission Statements
Employee Expenses Reimbursement Policies Employment Policies
Investment Policy Intercompany Agreements and Dividend Policies with Subsidiaries
Human Resources Policies

QUESTIONS
23

Augustine [email protected](949) 466-6968
CONTACT INFORMATION
Ron [email protected](858) 552-3710
24


