Business Analytics IBM Software Government Leveraging data for internal and external threat detection Executive summary Information analysis is the brain behind homeland security. The goal of intelligence and counterterrorism activities is to uncover security threats in time to take action against them. But the patterns that point to these threats are often hidden in massive amounts of data. To meet this challenge, one form of information analysis, predictive analytics, is particularly useful. Predictive analytics solutions apply sophisticated statistical, data exploitation, and machine-learning techniques to historical information in order to uncover hidden patterns and trends – even in large, complex datasets. In contrast to rules-based analysis and detection methods, predictive analytics can identify relatively unusual behaviors, even those with subtle differences that other methods often miss. Predictive analytics techniques explore and learn from all dimensions of data, thus allowing analysts to combine human knowledge, first-hand experience, and intuition to guide the application of analytical techniques. The most effective predictive analytics solutions can analyze not only tabular data but also textual data. Because of predictive analytics’ ability to combine a wide variety of data dimensions, types, and sources on an ongoing basis, it is possible to quickly and reliably detect inadvertent signatures from hackers, criminals, or terrorists generating new cyber chatter or trying new tactics to gain improper access to sensitive information. This white paper will attempt to define various security and intelligence risk assessment challenges that can be partially or fully addressed through the use of predictive analytics techniques. It will include examples of both internal and external threat detection, and present specific data manipulation and data modeling methods. Examples and graphics will be provided from sample data. Insider threat detection methods The cost associated with an attack by a “bad actor” with privileged insider information or access can often have a greater and more prolonged impact on an organization than an external threat. Malicious insiders have had a devastating impact, including violation of confidentiality, undermining of intelligence integrity, adverse influence on U.S. policy, the revelation of sources and methods, and the death and compromise of field agents. 1 Contents: 1 Executive summary 1 Insider threat detection methods 8 External threat detection methods 16 Operationalizing insider and external risk assessment 17 About IBM SPSS solutions for predictive analytics 19 About IBM Business Analytics
Transcript
Business AnalyticsIBM Software Government
Leveraging data for internal and external threat detection
Executive summaryInformation analysis is the brain behind homeland security. The goal of intelligence and counterterrorism activities is to uncover security threats in time to take action against them. But the patterns that point to these threats are often hidden in massive amounts of data. To meet this challenge, one form of information analysis, predictive analytics, is particularly useful. Predictive analytics solutions apply sophisticated statistical, data exploitation, and machine-learning techniques to historical information in order to uncover hidden patterns and trends – even in large, complex datasets. In contrast to rules-based analysis and detection methods, predictive analytics can identify relatively unusual behaviors, even those with subtle differences that other methods often miss.
Predictive analytics techniques explore and learn from all dimensions of data, thus allowing analysts to combine human knowledge, first-hand experience, and intuition to guide the application of analytical techniques. The most effective predictive analytics solutions can analyze not only tabular data but also textual data. Because of predictive analytics’ ability to combine a wide variety of data dimensions, types, and sources on an ongoing basis, it is possible to quickly and reliably detect inadvertent signatures from hackers, criminals, or terrorists generating new cyber chatter or trying new tactics to gain improper access to sensitive information.
This white paper will attempt to define various security and intelligence risk assessment challenges that can be partially or fully addressed through the use of predictive analytics techniques. It will include examples of both internal and external threat detection, and present specific data manipulation and data modeling methods. Examples and graphics will be provided from sample data.
Insider threat detection methodsThe cost associated with an attack by a “bad actor” with privileged insider information or access can often have a greater and more prolonged impact on an organization than an external threat. Malicious insiders have had a devastating impact, including violation of confidentiality, undermining of intelligence integrity, adverse influence on U.S. policy, the revelation of sources and methods, and the death and compromise of field agents.1
Contents:
1 Executive summary
1 Insider threat detection methods
8 External threat detection methods
16 Operationalizing insider and external risk assessment
17 About IBM SPSS solutions for predictive analytics
19 About IBM Business Analytics
Business AnalyticsIBM Software Government
2
In a 2004 e-crime survey conducted by CSO Magazine in cooperation with the U.S. Secret Service and the CERT® Coordination Center, fifty-nine percent (59 percent) of security and law enforcement executives responding reported some type of adverse impact to their organizations as a result of insider intrusions.2
Insider electronic crimes tend to be particularly difficult to detect since the perpetrator often has a legitimate reason to be accessing, modifying, and manipulating critical and/or sensitive data. However, despite these challenges, most organizations have a substantial amount of data that can be used to characterize and potentially mitigate an attack by a malicious insider. This data may include information such as demographics, performance reviews, past and current project assignments, internal and external electronic communications, and file usage logs.
Modeling past behavior to predict future behaviorOne method of insider threat detection through data analysis works by taking known cases of malicious behavior and characterizing the difference between these and known “normal” cases. While this approach is ideal, in that data mining algorithms can quickly and easily learn to recognize past behavior, there are inherent difficulties in using this approach alone. Malicious insider activity is typically a very rare event. The historical data available to model future behavior is often lacking sufficient cases to accurately predict cases that are similar but not exactly the same as previous cases of known malicious activity.
When dealing with insider threat or fraud detection, a “bad actor” may have normal patterns of behavior that are dynamic and complex. In these situations, the crime can be very difficult to detect because that person’s behavior may continue to appear legitimate, with only subtle changes over time. As a result, it is important not only to determine what behavior people are exhibiting, but also whose behavior has recently changed from that of their peer group.
If a company or agency is concerned about insider access to sensitive electronic data, the company will often use a set of hard-coded rules to identify potentially anomalous behavior. For example, a person who normally works with records from human resources might be flagged for audit if they make multiple attempts to access files with sensitive data from the engineering department. However, potentially malicious activity is often much more subtle and difficult to detect.
Clustering to identify significant groupsOne technique that can be very effective in identifying changes in behavior over time is saving a snapshot of a cluster at regular intervals. Clustering models focus on identifying groups of similar records and labeling the records according to the group to which they belong. This is done without the benefit of prior knowledge about the groups and their characteristics. In fact, you may not even know exactly how many groups to look for.
GovernmentBusiness AnalyticsIBM Software
3
This is what distinguishes clustering models from the other machine-learning techniques – there is no predefined output or target field for the model to predict. These models are often referred to as unsupervised learning models, since there is no external standard by which to judge the model’s classification performance. There is no right or wrong answer for these models. Their value is determined by their ability to capture interesting groupings in the data and provide useful descriptions of those groupings.
Behavioral changes are always expected as groups of people are assigned to different projects and tasks over time. However, when the changes by an individual are not similar to his/her peers, it may indicate a potential problem that might warrant investigation.
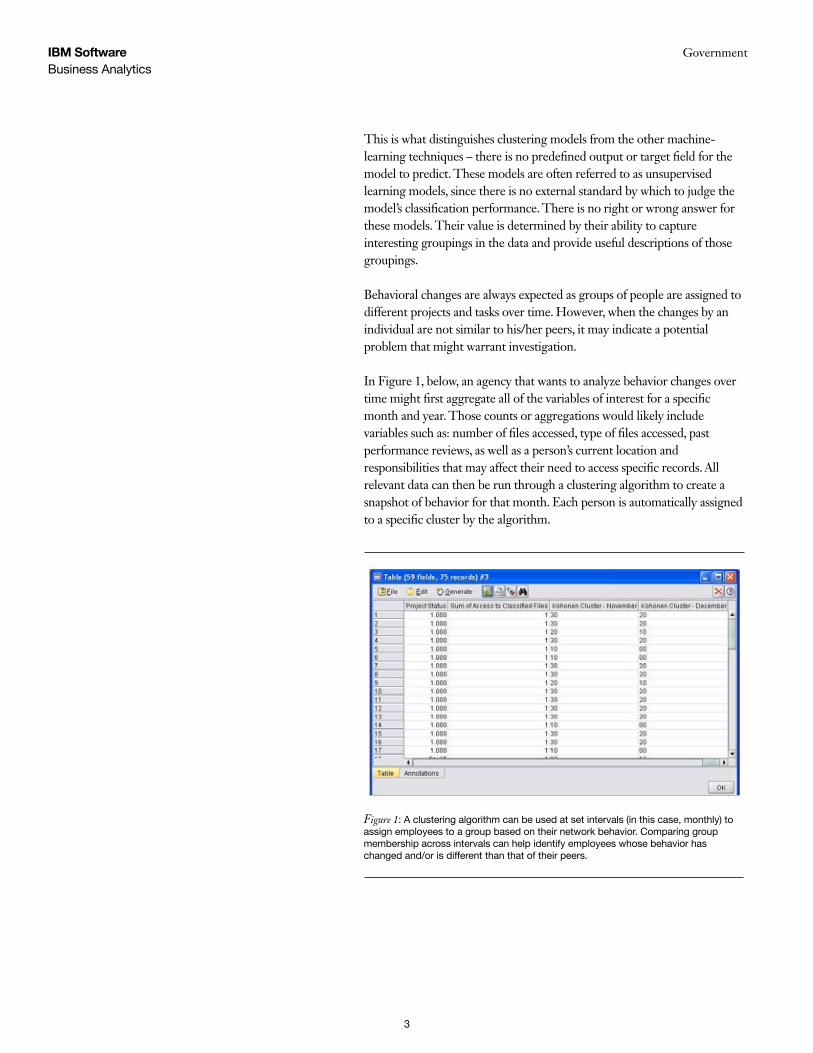
In Figure 1, below, an agency that wants to analyze behavior changes over time might first aggregate all of the variables of interest for a specific month and year. Those counts or aggregations would likely include variables such as: number of files accessed, type of files accessed, past performance reviews, as well as a person’s current location and responsibilities that may affect their need to access specific records. All relevant data can then be run through a clustering algorithm to create a snapshot of behavior for that month. Each person is automatically assigned to a specific cluster by the algorithm.
Figure 1: A clustering algorithm can be used at set intervals (in this case, monthly) to assign employees to a group based on their network behavior. Comparing group membership across intervals can help identify employees whose behavior has changed and/or is different than that of their peers.
Business AnalyticsIBM Software Government
4
The following month, data on the same group of people is collected. The new month’s data is aggregated and scored through the same algorithm built in the previous month. The cluster membership of the initial month is compared to the cluster membership of the second month and an exception report is generated for people whose behavior changed enough for them to fall out of one cluster and into the other. These individuals can then be investigated further.
The benefit to clustering over time is that, unlike a time-series model, any variable, categorical or continuous, can help determine cluster membership. In a time-series model, all of the fields must be numeric. Potentially important predictors, such as current project, location and security level, cannot be used within a time series model, but can be incorporated into a clustering model that tracks changes over time. A clustering model also does not require the investigator or analyst to focus on a specific output variable, such as “number of files accessed,” in order to identify unusual behavior.
The cluster membership results generated by a clustering model are often used as inputs for models created in subsequent analyses. Their usefulness in exploratory analysis makes them an important part of any analysis where high-risk events need to be isolated from a large amount of other data.
Anomaly detection to discover unusual casesThere are multiple methods of clustering and anomaly detection. The example below highlights a method in which an algorithm first clusters the data and then finds outliers among those clusters. This is particularly useful for intelligence work because the process can be automated, allowing analysts to comb through millions of records to find outliers or abnormalities within specific sub-groups of people. Automated methods for anomaly detection are available in some data mining tools as part of the clustering family of algorithms.
While traditional methods of identifying outliers generally look at only one or two variables at a time, an automated anomaly detection algorithm can examine large numbers of fields to identify clusters or peer groups into which similar records fall. Each record can then be compared to others in its peer group to identify possible anomalies. The further away a case is from the normal center, the more likely it is to be unusual. For example, the algorithm might lump records into three distinct clusters and flag those that fall far from the center of any one cluster.
Business AnalyticsIBM Software Government
5
In the example shown in Figure 2, five cases have been identified as being anomalous to their peers. An anomaly index identifies the deviation of the case’s fields from the norm of that case’s peer group. In addition, information is provided on the variables that had the greatest impact in moving each case away from the center of its peer group.
Another form of anomaly detection can be carried out using text mining in combination with correspondence analysis to conduct a social network analysis. When it’s important to determine the relative distance between categories of interest, correspondence analysis can be used to provide that additional insight within a network. One of the goals of correspondence analysis is to describe the relationships between two nominal variables in a correspondence table in a low-dimensional space, while simultaneously describing the relationships between the categories for each variable.
For each variable, the distances between category points in a plot reflect the strength of relationships between the categories, with categories that are similar plotted closer to each other.
Figure 2: In these five anomalous cases, the anomaly index identifies the deviation of the case’s fields from the norm of that case’s peer group. Fields 1 and 2 describe the variables that had the greatest impact on the determination of abnormal behavior.
GovernmentBusiness AnalyticsIBM Software
6
To determine the distance between categories, correspondence analysis considers the individual cell frequencies as well as a number of other factors. The calculation of cell frequencies is similar to cross-tabulation (cross-tabs) analysis. Correspondence analysis also creates a number of intermediate statistics that, among other things, measure influence, variance, and distance from one object to another.
Correspondence analysis helps analysts to understand the differences between categories of a variable as well as the differences between variables.
The plot shown in Figure 3, above, is the result of correspondence analysis performed on employees involved in a specific project and subject categories extracted from text analysis. Row and column points that are closer to each other represent a closer correspondence or association than points that are farther apart. In this plot, the employee SRiley is closely associated to documents related to “Asia,” whereas the rest of his peers appear to be accessing (are more closely associated to) other topics.
The benefit of text mining to this type of analysis is that it allows analysts to “read” and sift through literally thousands of documents in order to map out by subject who is accessing what content in comparison to their peer group.
Figure 3: Vector mapping visually displays the results of text analysis to understand what topic areas employees have been accessing.
GovernmentBusiness AnalyticsIBM Software
7
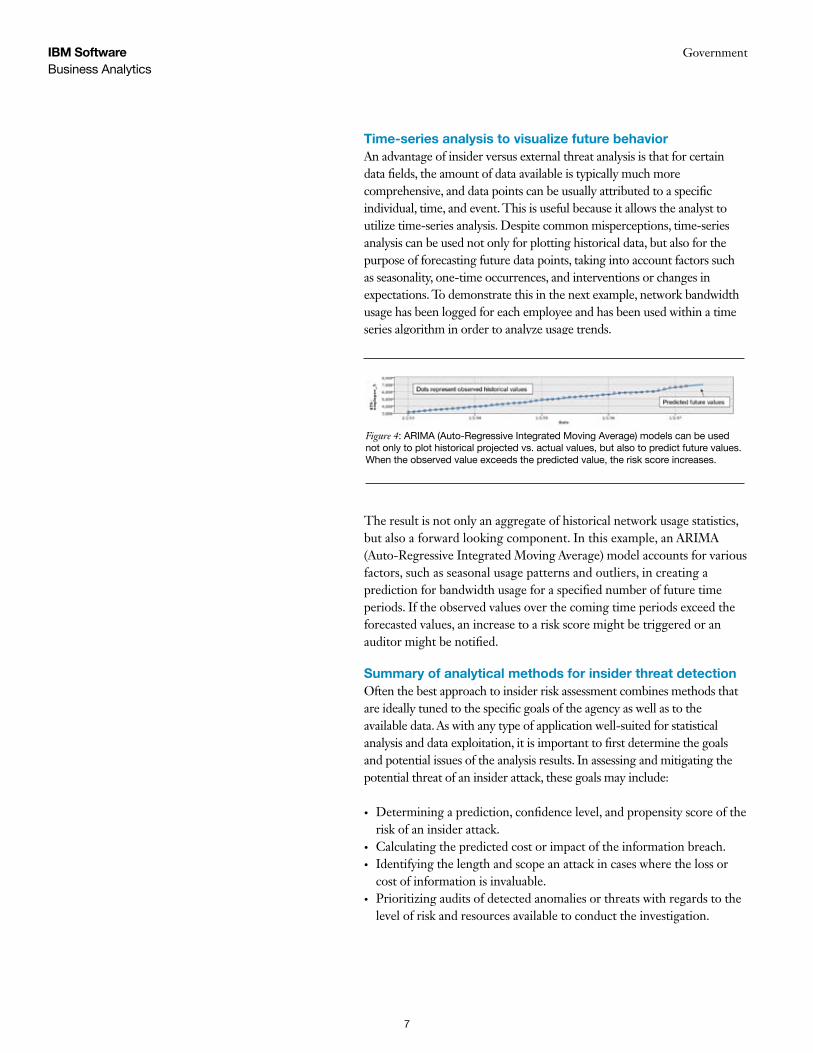
Time-series analysis to visualize future behaviorAn advantage of insider versus external threat analysis is that for certain data fields, the amount of data available is typically much more comprehensive, and data points can be usually attributed to a specific individual, time, and event. This is useful because it allows the analyst to utilize time-series analysis. Despite common misperceptions, time-series analysis can be used not only for plotting historical data, but also for the purpose of forecasting future data points, taking into account factors such as seasonality, one-time occurrences, and interventions or changes in expectations. To demonstrate this in the next example, network bandwidth usage has been logged for each employee and has been used within a time series algorithm in order to analyze usage trends.
The result is not only an aggregate of historical network usage statistics, but also a forward looking component. In this example, an ARIMA (Auto-Regressive Integrated Moving Average) model accounts for various factors, such as seasonal usage patterns and outliers, in creating a prediction for bandwidth usage for a specified number of future time periods. If the observed values over the coming time periods exceed the forecasted values, an increase to a risk score might be triggered or an auditor might be notified.
Summary of analytical methods for insider threat detectionOften the best approach to insider risk assessment combines methods that are ideally tuned to the specific goals of the agency as well as to the available data. As with any type of application well-suited for statistical analysis and data exploitation, it is important to first determine the goals and potential issues of the analysis results. In assessing and mitigating the potential threat of an insider attack, these goals may include:
Determining a prediction, confidence level, and propensity score of the •
risk of an insider attack.Calculating the predicted cost or impact of the information breach.•
Identifying the length and scope an attack in cases where the loss or •
cost of information is invaluable.Prioritizing audits of detected anomalies or threats with regards to the •
level of risk and resources available to conduct the investigation.
Figure 4: ARIMA (Auto-Regressive Integrated Moving Average) models can be used not only to plot historical projected vs. actual values, but also to predict future values. When the observed value exceeds the predicted value, the risk score increases.
GovernmentBusiness AnalyticsIBM Software
8
External threat detection methodsThe same techniques that are applied to analysis of insider threats are often useful for analysis of external threats. The primary difference between insider and external threat analysis is data availability. Attacks coming from external sources rarely provide the type of demographic data available for insider threat analysis. Data fields, such as age, group affiliation, location, and historical behavior patterns that can be attributed to an individual or group are much more difficult to obtain when analyzing external threats.
Analysis of social networks to fill in data gapsWhen external threats do not provide sufficient information about the individual or group responsible for an attack or a potential attack, the use of Social Network Analysis (SNA) techniques can help investigators better assess the risk of a particular external threat by making associations to other known individuals, groups, or prior attack attempts.
A social network is a social structure made of nodes (which are generally individuals or organizations) that are tied by one or more specific types of interdependency, such as values, visions, ideas, financial exchange, friendship, kinship, dislike or conflict.3
Analytical functions within SNA can include graph theory as well as link analysis. Other approaches to SNA include association rules, correspondence analysis, and regression and time-series analyses.
Using a generalized predictive analytic workbench, we can perform certain types of SNA through the combination of classification and regression algorithms, association algorithms, and correspondence analysis. Association algorithms, such as apriori algorithms, are useful when predicting multiple outcomes – for example, people with a specific set of characteristics are likely to be associated to a specific person, location, or organization.
GovernmentBusiness AnalyticsIBM Software
9
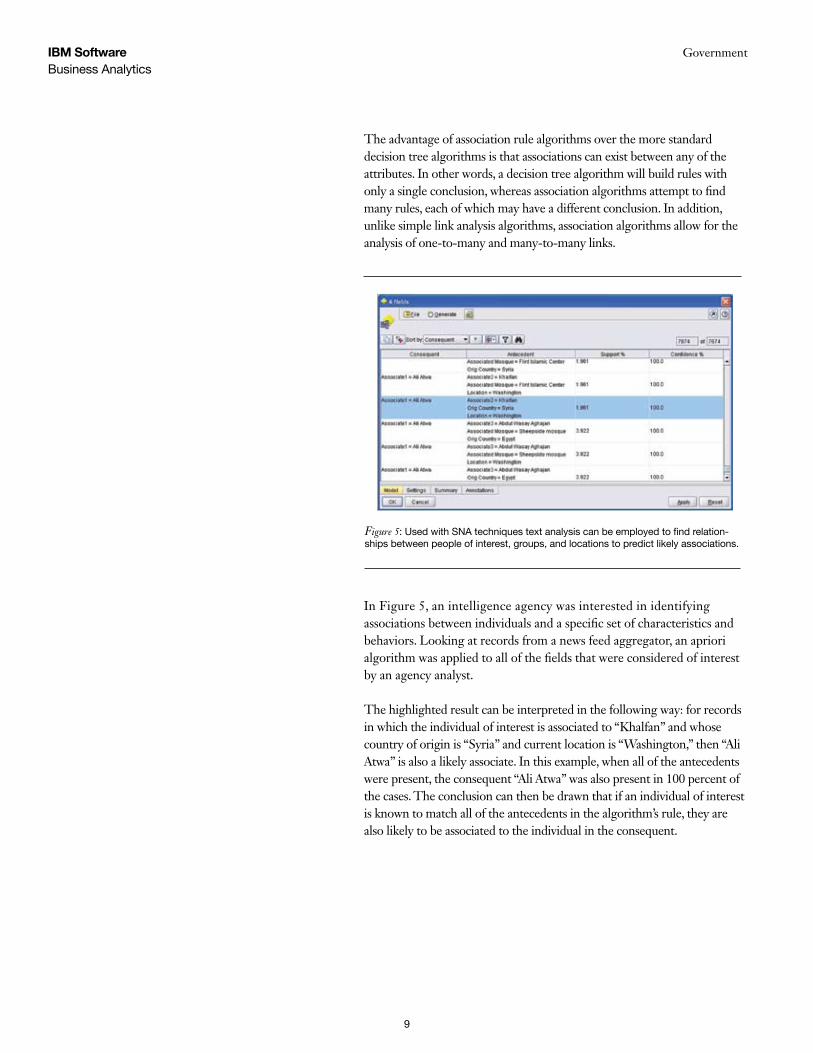
The advantage of association rule algorithms over the more standard decision tree algorithms is that associations can exist between any of the attributes. In other words, a decision tree algorithm will build rules with only a single conclusion, whereas association algorithms attempt to find many rules, each of which may have a different conclusion. In addition, unlike simple link analysis algorithms, association algorithms allow for the analysis of one-to-many and many-to-many links.
In Figure 5, an intelligence agency was interested in identifying associations between individuals and a specific set of characteristics and behaviors. Looking at records from a news feed aggregator, an apriori algorithm was applied to all of the fields that were considered of interest by an agency analyst.
The highlighted result can be interpreted in the following way: for records in which the individual of interest is associated to “Khalfan” and whose country of origin is “Syria” and current location is “Washington,” then “Ali Atwa” is also a likely associate. In this example, when all of the antecedents were present, the consequent “Ali Atwa” was also present in 100 percent of the cases. The conclusion can then be drawn that if an individual of interest is known to match all of the antecedents in the algorithm’s rule, they are also likely to be associated to the individual in the consequent.
Figure 5: Used with SNA techniques text analysis can be employed to find relation-ships between people of interest, groups, and locations to predict likely associations.
GovernmentBusiness AnalyticsIBM Software
10
One inherent difficulty in SNA is the inability to effectively create associations from an unlimited universe of available data. As in most data analysis functions, the tool is most effective when leveraged by a subject matter expert who can focus the analysis on a specific set of data or fields.
As an example, it is said that one of the most common observations in SNA is that demographically similar individuals are more likely to form social ties.4 This type of observation might be obvious to an analyst with some experience in SNA, and it is the type of knowledge that can significantly improve the likelihood of obtaining actionable results from SNA on large and complex databases. Association algorithms can leverage this experience by generating a richer set of interactions and measures than simple one-to-one link analysis.
For example, in the analysis of demographically similar people, a listing or chart of every person that is linked by a common nationality can quickly overwhelm the analyst with noisy data. By contrast, an association algorithm might account for nationality, social or professional group affiliation, and current city of residence to provide a concise set of characteristics that have historically indicated an association between a group of individuals.
Like the example cited earlier for correspondence analysis of insider threat, Figure 6 represents the same technique applied to external threats. Free-form text documents collected from newsfeeds, blogs, and Internet chat forums are passed through a text analysis (natural language processing) algorithm in order to determine the subject(s) being discussed in those documents. A dedicated Text Link Analysis algorithm is then applied to the data in order to connect the mention of specific security to locations of interest (cities, in this case). The resulting data points are passed to a correspondence analysis algorithm in order to better determine the subjects most closely correlated to specific cities of interest.
GovernmentBusiness AnalyticsIBM Software
11
Scoring models to measure potential impactAfter a model is created, the next step is to measure the likelihood and potential impact of an event identified or predicted by the model.
When modeling security events, the characteristics of a case seldom are clear enough to make an absolute statement about whether the case is good or bad, or an event versus a non-event. Since most cases fall into a gray scale instead of a black or white decision, it is often useful to convert a no or yes event into a propensity scale of 0 to 1 by using the confidence figures provided by the predictive algorithm. Propensity scores indicate the likelihood of a particular outcome or response. This can provide a measure of certainty rather than an absolute classification for a specific case. Decisions near the extremes (1.0 or 0.0) are clear and those in the middle are more uncertain.
1.0 0.0
Figure 6: Correspondence analysis of newsfeeds, blogs, Internet chat forums, and other text sources can be plotted to show topic areas that are commonly linked to cities of interest.
GovernmentBusiness AnalyticsIBM Software
12
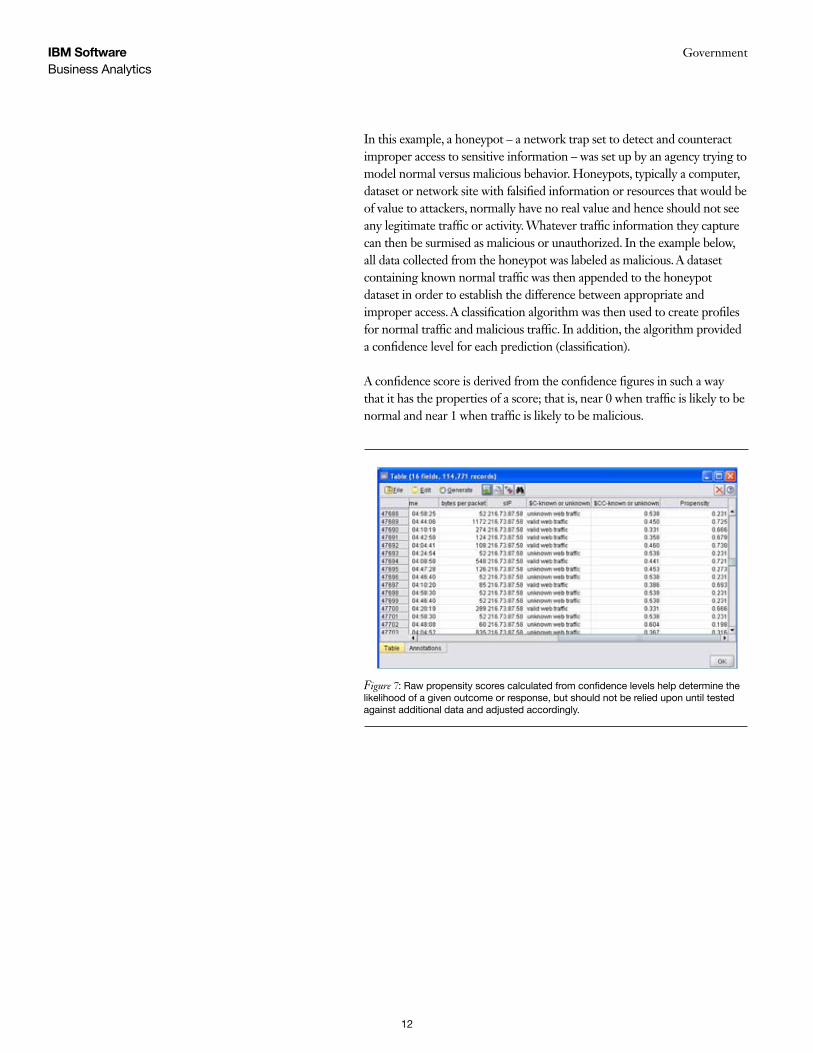
In this example, a honeypot – a network trap set to detect and counteract improper access to sensitive information – was set up by an agency trying to model normal versus malicious behavior. Honeypots, typically a computer, dataset or network site with falsified information or resources that would be of value to attackers, normally have no real value and hence should not see any legitimate traffic or activity. Whatever traffic information they capture can then be surmised as malicious or unauthorized. In the example below, all data collected from the honeypot was labeled as malicious. A dataset containing known normal traffic was then appended to the honeypot dataset in order to establish the difference between appropriate and improper access. A classification algorithm was then used to create profiles for normal traffic and malicious traffic. In addition, the algorithm provided a confidence level for each prediction (classification).
A confidence score is derived from the confidence figures in such a way that it has the properties of a score; that is, near 0 when traffic is likely to be normal and near 1 when traffic is likely to be malicious.
Figure 7: Raw propensity scores calculated from confidence levels help determine the likelihood of a given outcome or response, but should not be relied upon until tested against additional data and adjusted accordingly.
GovernmentBusiness AnalyticsIBM Software
13
Raw propensity scores provided by an analysis tool are based purely on estimates given by the model – in other words, they are only based on one set of data, and as a result may be over-fitted, leading to inaccurate estimates of propensity. Adjusted propensities attempt to compensate by looking at how the model performs on the test or validation partitions and adjusting the propensities to give a better estimate accordingly.
Risk matrices to classify threat severityUp to this point, we have focused the analysis on identifying anomalies, predicting events, and identifying associations between individuals and groups. With most of these techniques, we are typically provided a measure of distance for anomalies, a confidence level for predictions and classifications (as in the above example), and measures of nearness and strength of relationships for associations and network analysis.
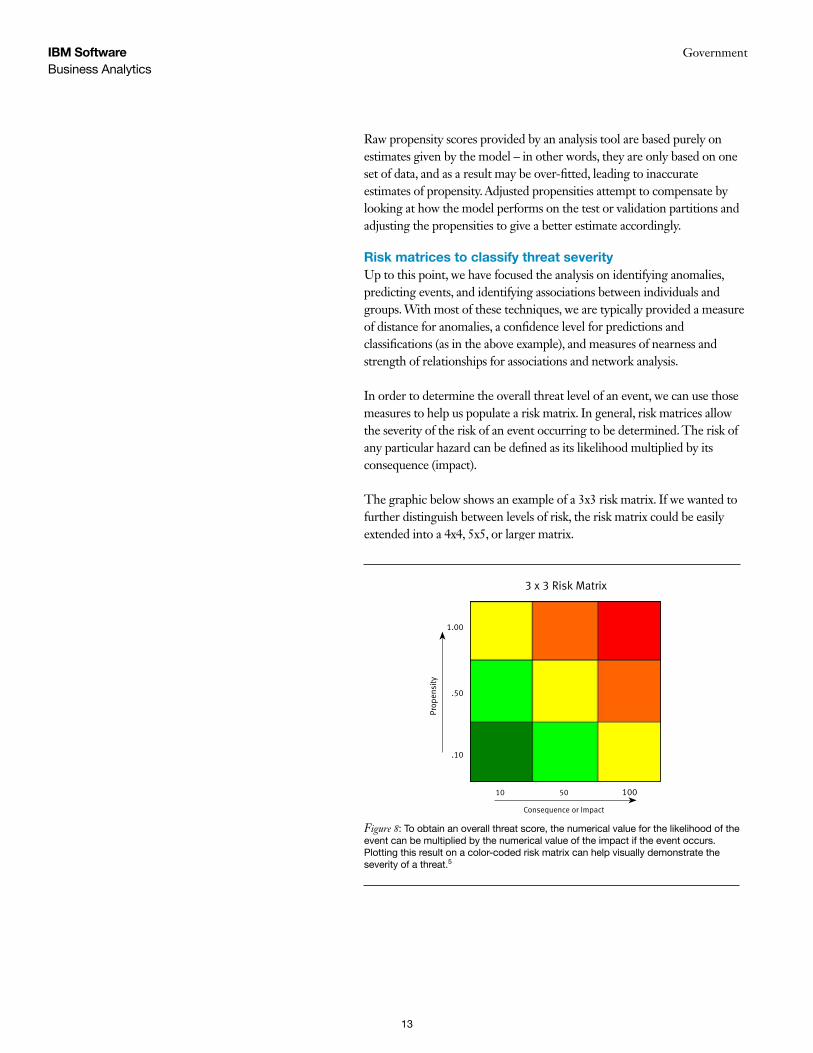
In order to determine the overall threat level of an event, we can use those measures to help us populate a risk matrix. In general, risk matrices allow the severity of the risk of an event occurring to be determined. The risk of any particular hazard can be defined as its likelihood multiplied by its consequence (impact).
The graphic below shows an example of a 3x3 risk matrix. If we wanted to further distinguish between levels of risk, the risk matrix could be easily extended into a 4x4, 5x5, or larger matrix.
Figure 8: To obtain an overall threat score, the numerical value for the likelihood of the event can be multiplied by the numerical value of the impact if the event occurs. Plotting this result on a color-coded risk matrix can help visually demonstrate the severity of a threat.5
3 x 3 Risk Matrix
1.00
.50
.10
Prop
ensi
ty
Consequence or Impact
10 50 100
GovernmentBusiness AnalyticsIBM Software
14
If we want to express the values of a risk matrix numerically, there are a number of mathematical formulas and risk assessment calculators available for specific applications and industries. In order to keep this example relatively straightforward, we will use a simple formula that measures impact values on a scale of 1-100 and propensity (likelihood) values on a scale of 0 to 1.00. To obtain an overall threat score, we can multiply the numerical value for the likelihood of the event by the numerical value of the impact if the event occurs.
As an example, the impact of an insider leaking highly sensitive information from an intelligence agency might be considered to be “high” in a 3x3 matrix. However, the likelihood of this event might be considered to be “low.” In this case, the overall threat level expressed numerically is derived by multiplying 100 (high impact) by .10 (low likelihood) for an overall threat level of 10.
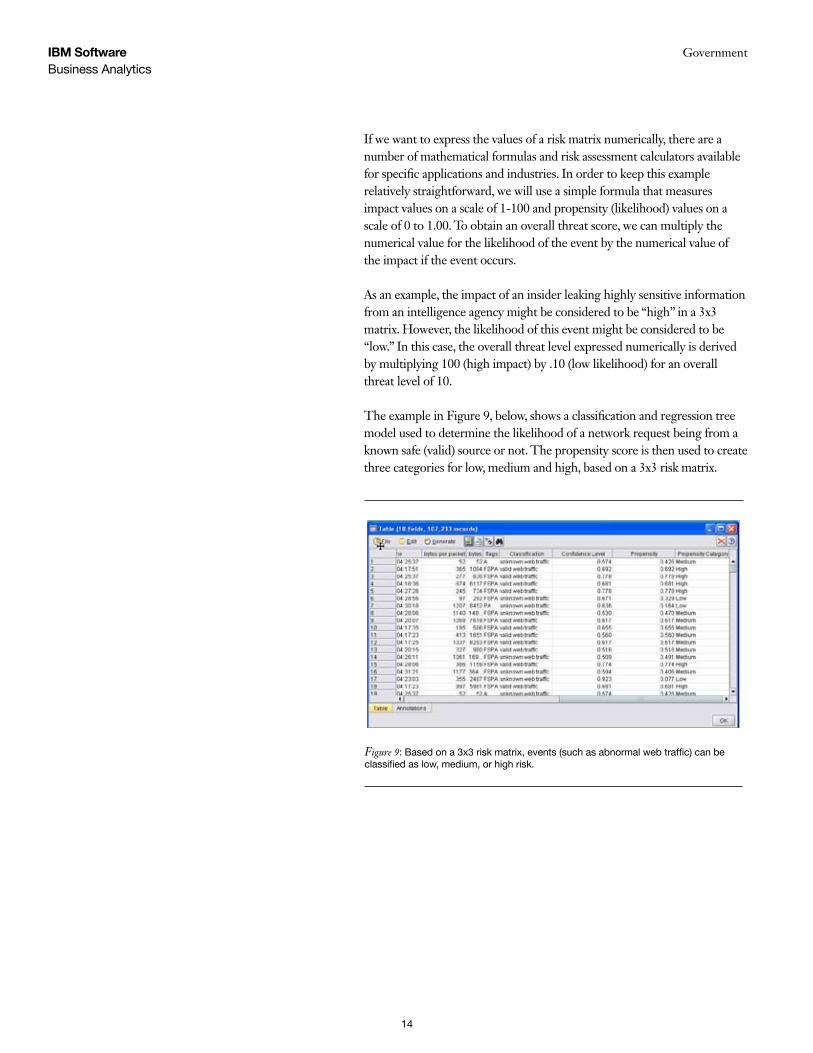
The example in Figure 9, below, shows a classification and regression tree model used to determine the likelihood of a network request being from a known safe (valid) source or not. The propensity score is then used to create three categories for low, medium and high, based on a 3x3 risk matrix.
Figure 9: Based on a 3x3 risk matrix, events (such as abnormal web traffic) can be classified as low, medium, or high risk.
GovernmentBusiness AnalyticsIBM Software
15
For this example, we will assume that the overall impact of a network request from an unknown or unconfirmed source poses a “medium” risk to the security of the network. A new field will be created that classifies the overall impact as “Medium” for a 3x3 matrix or, expressed numerically, an impact score of 50.
In order to calculate the overall threat, we create a field that multiplies the “Impact” (50 in this model) by the “Propensity.” The result is an overall threat score (Figure 10) that can be put into an operational environment alongside other models that measure different types of security events (possibly with different impact levels). When all of the models are combined, we can sort and rank every incoming event by its overall threat score. This value allows us to prioritize a response to the event while accounting for event type, criticality, and likelihood in one combined score.
Summary of analytical methods for external threat detectionAs in the analysis of internal threats, the best approach to external risk assessment is to focus on a specific goal that can be achieved, or at least improved, through the use of data analysis. This is not always an easy task. In the analysis of external threats, there is sometimes more data available than can be effectively analyzed. Other times, in the analysis of very rare events, such as a chemical attack, there is little historical data and very poor or no correlation between one event and another.
Figure 10: Algorithms can be set up to calculate the overall threat score, taking into account event type, criticality, and likelihood in one combined score.
GovernmentBusiness AnalyticsIBM Software
16
In assessing and mitigating the potential threat of an external attack, goals may include:
Determining whether a model can be successfully built using historical •
data or whether it is more effective to focusdetecting changes in current behaviorConsidering the use of a stimulus/response approach for which no •
historical data is available, you can collect data by providing a stimulus for the event of interest within a controlled environment – for example, creating a honeypot within a network environmentAssuring that a subject matter expert is available to help determine the •
proper inputs for data analysis. Data mining tools are very powerful, but they are ultimately driven by a domain expert. A model can easily come to a false conclusion if too many, too few, or the wrong set of fields are used in the model creation process
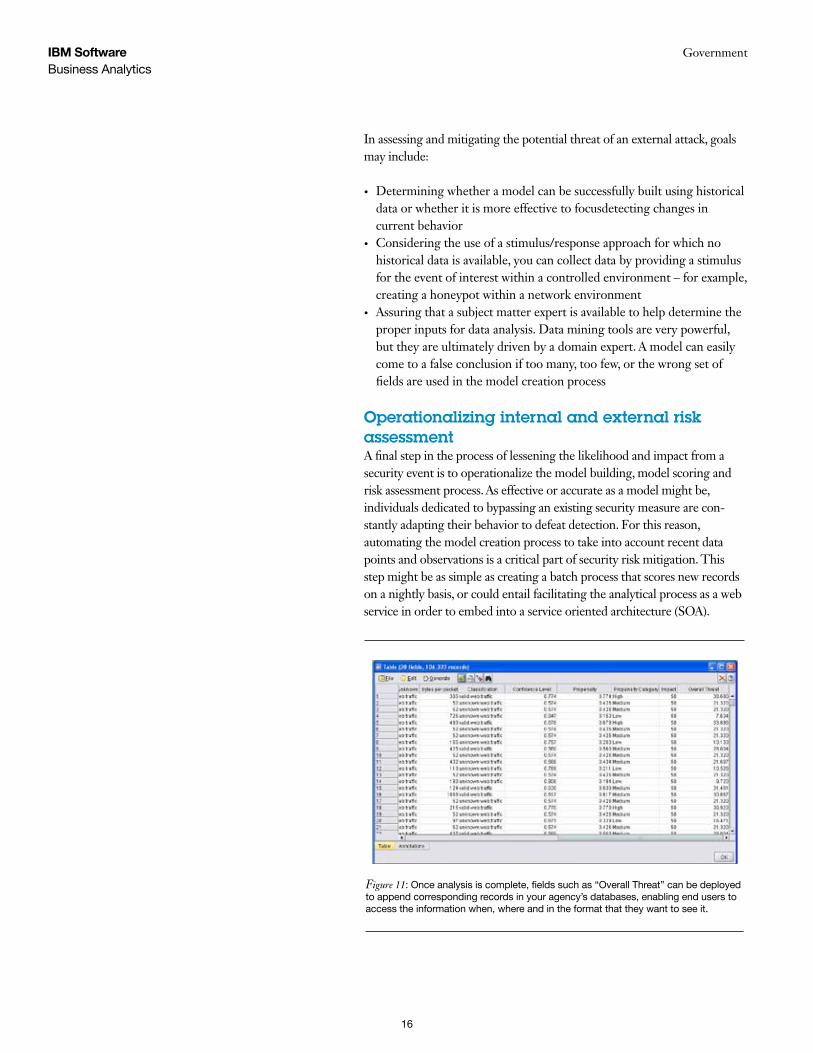
Operationalizing internal and external risk assessmentA final step in the process of lessening the likelihood and impact from a security event is to operationalize the model building, model scoring and risk assessment process. As effective or accurate as a model might be, individuals dedicated to bypassing an existing security measure are con-stantly adapting their behavior to defeat detection. For this reason, automating the model creation process to take into account recent data points and observations is a critical part of security risk mitigation. This step might be as simple as creating a batch process that scores new records on a nightly basis, or could entail facilitating the analytical process as a web service in order to embed into a service oriented architecture (SOA).
Figure 11: Once analysis is complete, fields such as “Overall Threat” can be deployed to append corresponding records in your agency’s databases, enabling end users to access the information when, where and in the format that they want to see it.
GovernmentBusiness AnalyticsIBM Software
17
In addition to making the constant variation of attack schemes easier to detect, operationalizing these processes has the added benefit of streamlining the deployment of results. To elaborate: when a model is deployed into an agency’s business processes, it is not simply running on its own accord.
Instead, the predictive analytic workbench is actively pulling and distributing information in a bidirectional fashion. In other words, when a model is deployed in either real-time or batch mode, it not only automatically pulls in information from other data sources (such as BI and ERP systems), but can also push its results back out to these systems to update records with propensity scores and/or other classifying variables. By adding new variables to records in other data sets, this deployment of results enables end users to access the information when, where, and in the format that they want to see it.
About IBM SPSS solutions for predictive analytics
Achieve better insight and predictionPredictive analytics provides organizations with a clearer view of current conditions and deeper insight into future events. With our market-leading predictive analytic workbench IBM SPSS® Modeler, your agency can conduct analyses that incorporate many types of data, resulting in more in-depth knowledge of every aspect of your operations – including more complete understanding of your intelligence data.
IBM SPSS Modeler is an open, standards-based solution. It integrates with your organization’s existing information systems, both when accessing data and when deploying results. You don’t need to move data into and out of a proprietary format. This helps you conserve resources, deliver results faster, and reduce infrastructure costs.
Additionally, IBM SPSS Modeler is popular worldwide with analysts and business users alike because it enables you to:
Easily access, prepare, and integrate structured data and also text, web •
and survey data.Rapidly build and validate models, using the most advanced statistical •
and machine-learning techniques available.Efficiently deploy insight and predictive models on a scheduled basis or •
in real time to the people that make decisions and recommendations, and the systems that support them.
GovernmentBusiness AnalyticsIBM Software
18
Leverage all of your data for improved modelsOnly with IBM SPSS Modeler can you directly and easily access text, web, and survey data, and integrate these additional types of data in your predictive models. IBM SPSS customers have found that using additional types of data increases the “lift” or accuracy of predictive models, leading to more useful recommendations and improved outcomes. With the fully integrated IBM SPSS Text Analytics** product, you can extract concepts and opinions from any type of text – such as internal reports, news feed aggregators, emails, chat room dialogue, blogs, and more.
Automate critical analytical processes The tasks associated with analytics and predictive model development and deployment are often repeated on a regular basis. IBM SPSS Collaboration and Deployment Services** helps you improve productivity, ensure consistency, and achieve greater accuracy in these processes by providing a powerful environment for automating the various steps of the analytic process – such as data preparation, transformations, model creation, evaluation, and scoring. As a result, your analysts can focus on solving business problems, rather than creating and manually executing the processes for each new project.
Additionally, your analysts produce a great deal of valuable output in the course of their work – including scores, rules, charts, graphs, reports and other types of analytical output. To gain the most value from your analytics, the results need to be delivered or deployed to decision makers throughout the agency in a way that helps them make better decisions.
To do this, IBM SPSS Collaboration and Deployment Services enables you to deliver:
Scores to records for persons of interest, which might show the likelihood •
of their having ties to a known terrorist organization Sets of rules or criteria that define a profile of normal activities for a •
particular employee segmentCharts that compare the accuracy of a number of risk models•
Reports that show the accuracy of a prediction compared to actual results•
** IBM SPSS Text Analytics and IBM SPSS Collaboration and Deployment Services were formerly called PASW ® Text Analytics and PASW ® Collaboration and Deployment Services.
GovernmentBusiness AnalyticsIBM Software
19
About IBM Business Analytics IBM Business Analytics software delivers complete, consistent and accurate information that decision-makers trust to improve business performance. A comprehensive portfolio of business intelligence, predictive analytics, financial performance and strategy management, and analytic applications provides clear, immediate and actionable insights into current performance and the ability to predict future outcomes. Combined with rich industry solutions, proven practices and professional services, organizations of every size can drive the highest productivity, confidently automate decisions and deliver better results.
As part of this portfolio, IBM SPSS Predictive Analytics software helps organizations predict future events and proactively act upon that insight to drive better business outcomes. Commercial, government and academic customers worldwide rely on IBM SPSS technology as a competitive advantage in attracting, retaining and growing customers, while reducing fraud and mitigating risk. By incorporating IBM SPSS software into their daily operations, organizations become predictive enterprises – able to direct and automate decisions to meet business goals and achieve measurable competitive advantage. For further information or to reach a representative visit www.ibm.com/spss.
Notes:1. 2005 ARDA Challenge Workshop. “Insider Threat: Analysis and Detection of Malicious Insiders”.2. 2004 eCrime Watch Survey. Conducted by CSO magazine in cooperation with the U.S. Secret Service & CERT®
Coordination Center “Insider Threat Study: Computer System Sabotage in Critical Infrastructure Sectors”.3. Peter Sheridan Dodds, Roby Muhamad, Duncan J. Watts. “An Experimental Study of Search in Global Social
Networks”. (August 8, 2003)4. Aili E. Malm et al. “Social Network and Distance Correlation of Drug Production”.5. Wikipedia. “Risk Matrix”. http://en.wikipedia.org/wiki/Risk_Matrix
US Government Users Restricted Rights - Use, duplication of disclosure restricted by GSA ADP Schedule Contract with IBM Corp.
Produced in the United States of America May 2010 All Rights Reserved
IBM, the IBM logo, ibm.com, WebSphere, InfoSphere and Cognos are trademarks or registered trademarks of International Business Machines Corporation in the United States, other countries, or both. If these and other IBM trademarked terms are marked on their first occurrence in this information with a trademark symbol (® or TM), these symbols indicate U.S. registered or common law trademarks owned by IBM at the time this information was published. Such trademarks may also be registered or common law trademarks in other countries. A current list of IBM trademarks is available on the web at “Copyright and trademark information” at www.ibm.com/legal/copytrade.shtml.
SPSS is a trademark of SPSS, Inc., an IBM Company, registered in many jurisdictions worldwide.
Other company, product or service names may be trademarks or service marks of others.