12
EDUCATION & RESEARCH FOUNDATION Leveraging Your Data FRANK LYNN & ASSOCIATES
EDUCATION &RESEARCH FOUNDATION
Leveraging Your DataFR A N K LY N N & A SS O CIAT E S
EDUCATION &RESEARCH FOUNDATION
Overview
Collecting and studying data may provide a path to greater business success. What does that mean for electrical distributors? This project aims to define, assess and recommend further action regarding data and analytics by:
Profiling the current state of the data analytics market, specifically in the electrical wholesaling market, but broadly in other markets.
Assessing the benefits, costs, barriers, risks, and timing to electrical distributors considering the use of data analytics.
Evaluating the potential implications of “big data.”
Examining new revenue-generating businesses based on data analytics.
Recommending the best ways for electrical distributors to proceed with data analytics.
EDUCATION &RESEARCH FOUNDATION
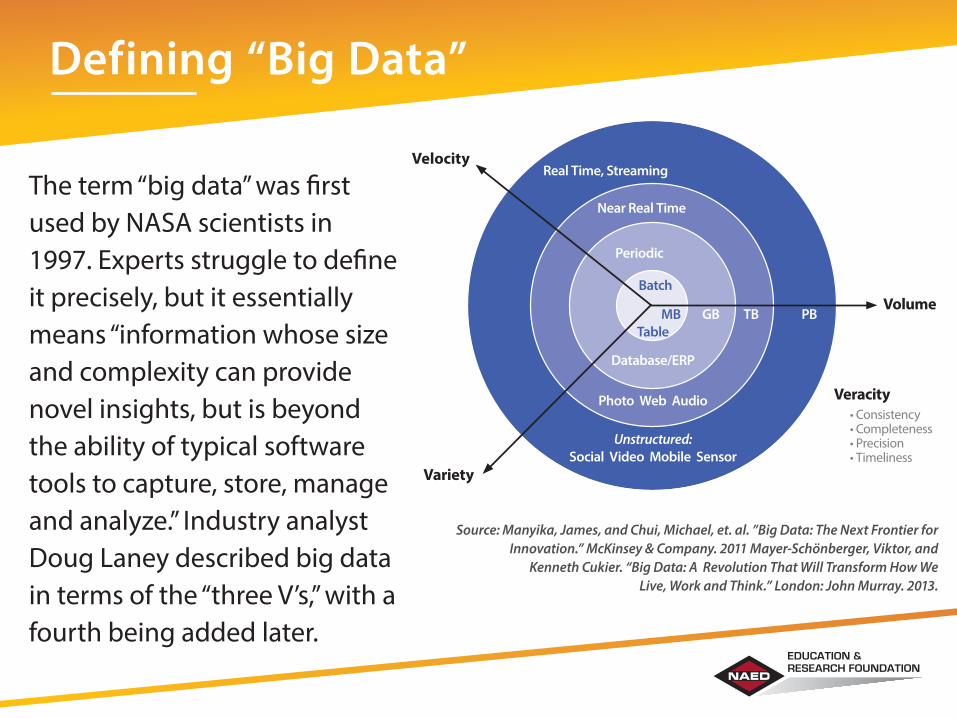
Defining “Big Data”
The term “big data” was first used by NASA scientists in 1997. Experts struggle to define it precisely, but it essentially means “information whose size and complexity can provide novel insights, but is beyond the ability of typical software tools to capture, store, manage and analyze.” Industry analyst Doug Laney described big data in terms of the “three V’s,” with a fourth being added later.
Source: Manyika, James, and Chui, Michael, et. al. ”Big Data: The Next Frontier for Innovation.” McKinsey & Company. 2011 Mayer-Schönberger, Viktor, and
Kenneth Cukier. “Big Data: A Revolution That Will Transform How We Live, Work and Think.” London: John Murray. 2013.
Velocity
Variety
Volume
Veracity• Consistency• Completeness• Precision• Timeliness
Real Time, Streaming
Near Real Time
Periodic
Batch
TableMB GB TB PB
Database/ERP
Photo Web Audio
Social Video Mobile SensorUnstructured:
EDUCATION &RESEARCH FOUNDATION
Def
inin
g D
ata
Ana
lyti
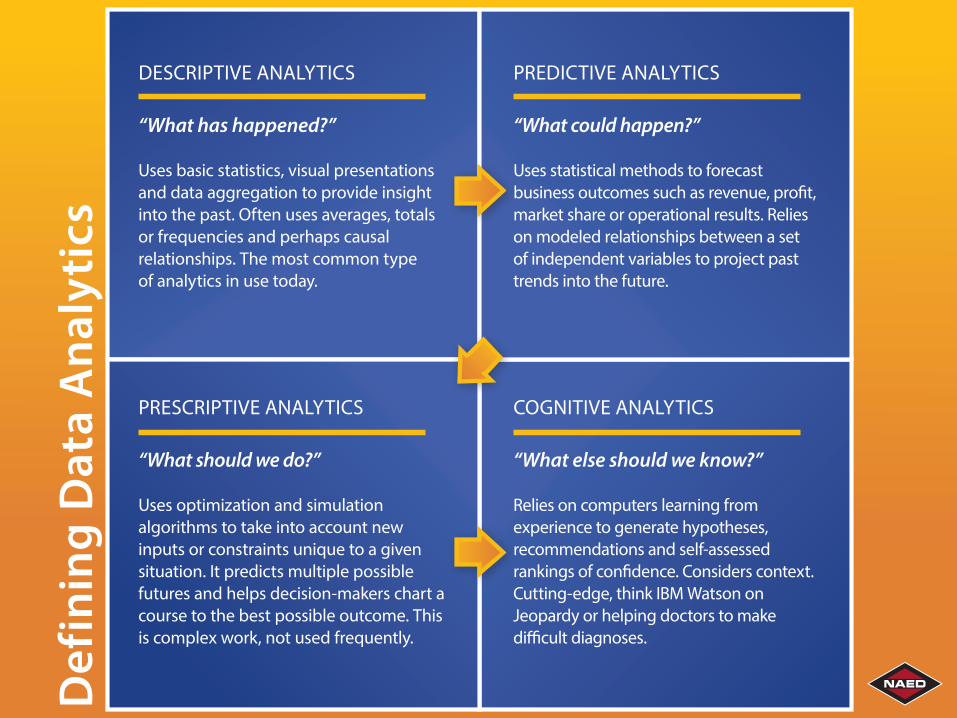
csDESCRIPTIVE ANALYTICS
“What has happened?”
Uses basic statistics, visual presentations and data aggregation to provide insight into the past. Often uses averages, totals or frequencies and perhaps causal relationships. The most common type of analytics in use today.
PREDICTIVE ANALYTICS
“What could happen?”
Uses statistical methods to forecast business outcomes such as revenue, profit, market share or operational results. Relies on modeled relationships between a set of independent variables to project past trends into the future.
PRESCRIPTIVE ANALYTICS
“What should we do?”
Uses optimization and simulation algorithms to take into account new inputs or constraints unique to a given situation. It predicts multiple possible futures and helps decision-makers chart a course to the best possible outcome. This is complex work, not used frequently.
COGNITIVE ANALYTICS
“What else should we know?”
Relies on computers learning from experience to generate hypotheses, recommendations and self-assessed rankings of confidence. Considers context. Cutting-edge, think IBM Watson on Jeopardy or helping doctors to make difficult diagnoses.
EDUCATION &RESEARCH FOUNDATION
EDUCATION &RESEARCH FOUNDATION
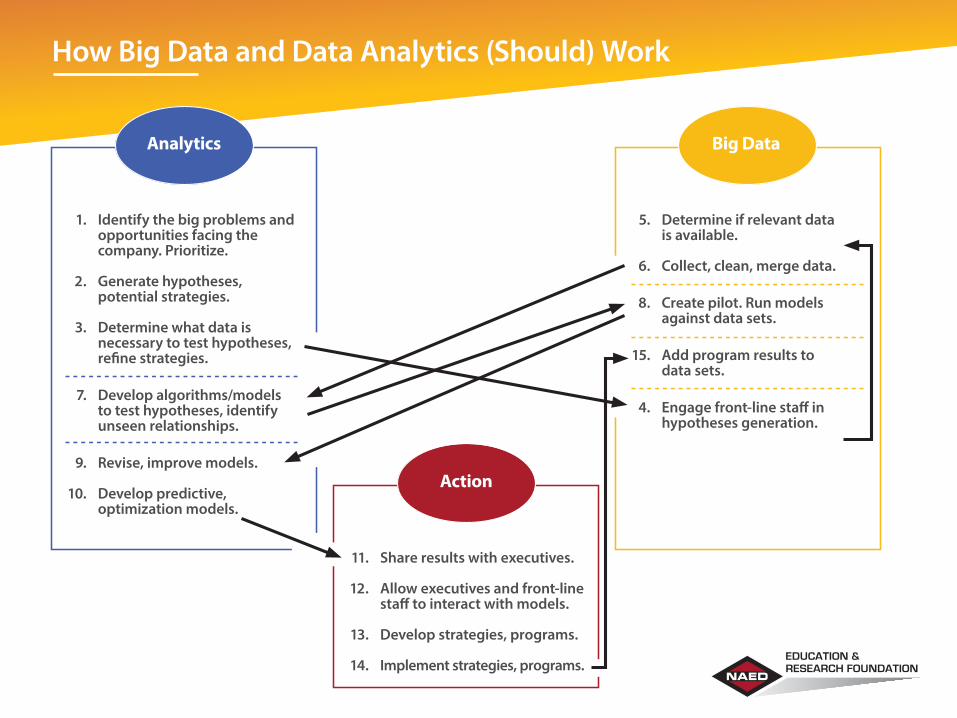
How Big Data and Data Analytics (Should) Work
Analytics
Share results with executives.
Allow executives and front-line staff to interact with models.
Develop strategies, programs.
Implement strategies, programs.
11.
12.
13.
14.
Action
Identify the big problems and opportunities facing the company. Prioritize.
Generate hypotheses, potential strategies.
Determine what data is necessary to test hypotheses, refine strategies. Develop algorithms/models to test hypotheses, identify unseen relationships.
Revise, improve models.
Develop predictive, optimization models.
1.
2.
3.
7.
9.
10.
Determine if relevant data is available.
Collect, clean, merge data.
Create pilot. Run models against data sets.
Add program results to data sets.
Engage front-line staff in hypotheses generation.
5.
6.
8.
15.
4.
Big Data
EDUCATION &RESEARCH FOUNDATION
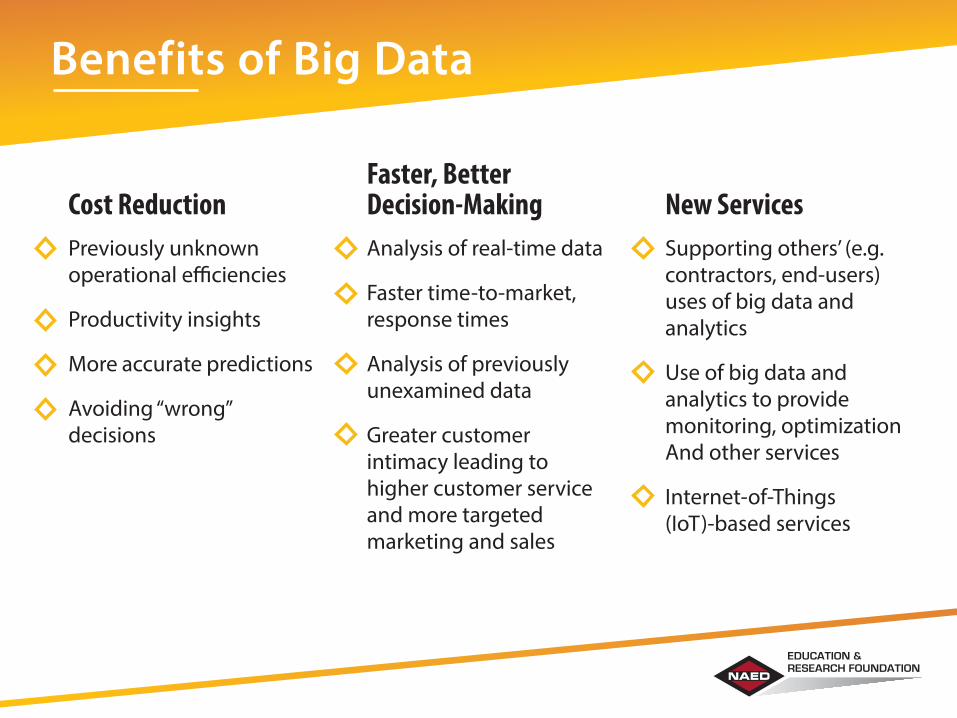
Benefits of Big Data
Cost ReductionFaster, Better Decision-Making New Services
Previously unknown operational efficiencies
Productivity insights
More accurate predictions
Avoiding “wrong” decisions
Analysis of real-time data
Faster time-to-market, response times
Analysis of previously unexamined data
Greater customer intimacy leading to higher customer service and more targeted marketing and sales
Supporting others’ (e.g. contractors, end-users) uses of big data and analytics
Use of big data and analytics to provide monitoring, optimization And other services
Internet-of-Things (IoT)-based services
EDUCATION &RESEARCH FOUNDATION
The ROI of Big Data and Analytics
ROI is extremely difficult to measure for big data and analytics projects. In a recent study researchers found that only 3% of respondents could quantify the ROI business case for big data analytics, while 47%could not and 9% reported “no clear vision.”
However, from a P & L (profit and loss) perspective, over half saw a 1-3% increase in revenue and a similar decrease in costs.
EDUCATION &RESEARCH FOUNDATION
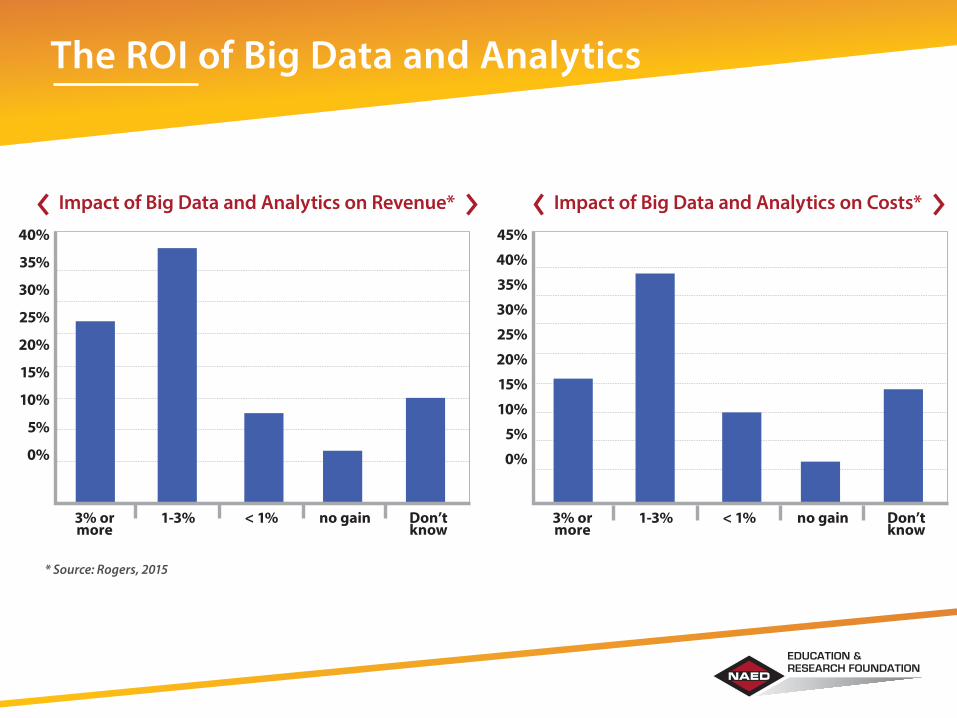
The ROI of Big Data and Analytics
* Source: Rogers, 2015
Impact of Big Data and Analytics on Revenue*40%
35%
30%
25%
20%
15%
10%
5%
0%
3% or more
1-3% < 1% no gain Don’t know
Impact of Big Data and Analytics on Costs*45%
40%
35%
30%
25%
20%
15%
10%
5%
0%
3% or more
1-3% < 1% no gain Don’t know
EDUCATION &RESEARCH FOUNDATION
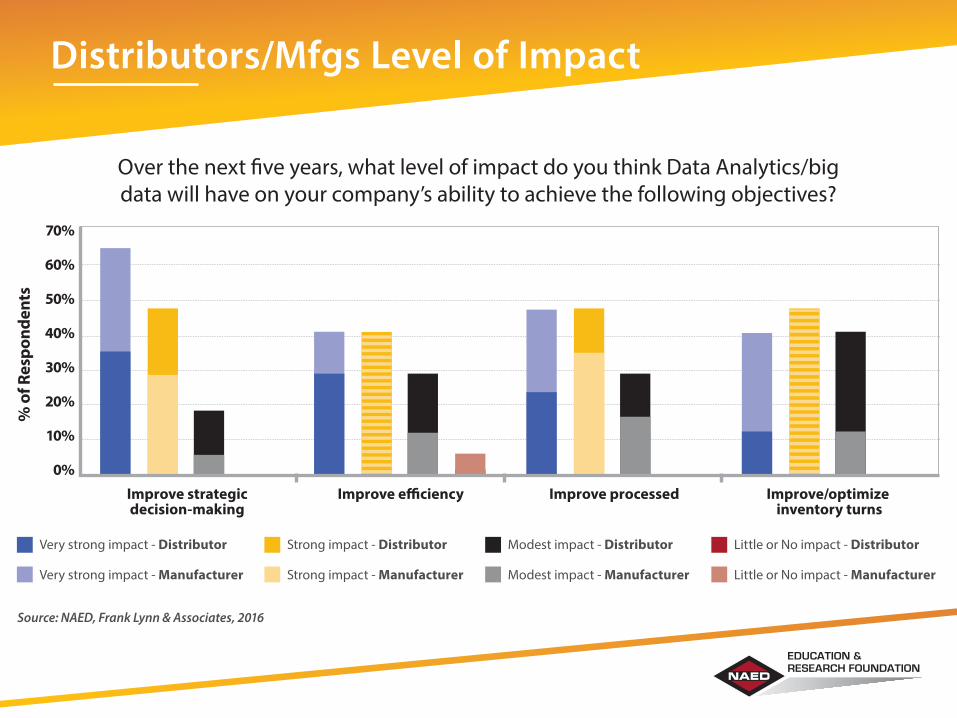
Distributors/Mfgs Level of Impact
Over the next five years, what level of impact do you think Data Analytics/big data will have on your company’s ability to achieve the following objectives?
Source: NAED, Frank Lynn & Associates, 2016
70%
60%
50%
40%
30%
20%
10%
0%
% o
f Res
pond
ents
Improve strategic decision-making
Improve efficiency Improve processed Improve/optimize inventory turns
Very strong impact - Distributor
Very strong impact - Manufacturer
Strong impact - Distributor
Strong impact - Manufacturer
Modest impact - Distributor
Modest impact - Manufacturer
Little or No impact - Distributor
Little or No impact - Manufacturer
EDUCATION &RESEARCH FOUNDATION
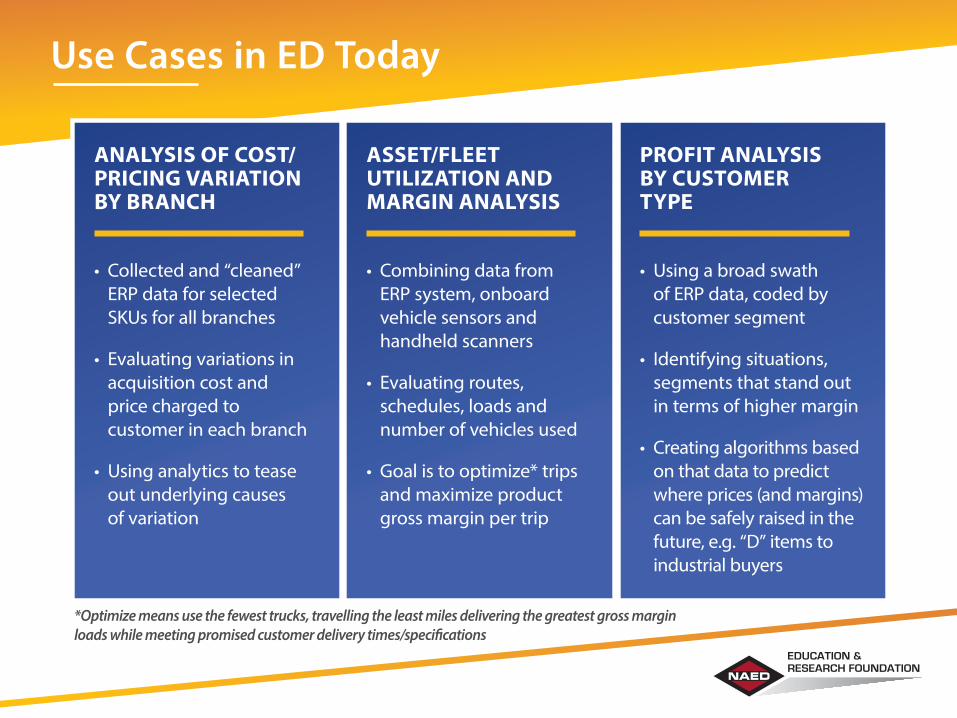
Use Cases in ED Today
ANALYSIS OF COST/PRICING VARIATION BY BRANCH
• Collected and “cleaned” ERP data for selected SKUs for all branches
• Evaluating variations in acquisition cost and price charged to customer in each branch
• Using analytics to tease out underlying causes of variation
ASSET/FLEET UTILIZATION AND MARGIN ANALYSIS
• Combining data from ERP system, onboard vehicle sensors and handheld scanners
• Evaluating routes, schedules, loads and number of vehicles used
• Goal is to optimize* trips and maximize product gross margin per trip
PROFIT ANALYSIS BY CUSTOMER TYPE
• Using a broad swath of ERP data, coded by customer segment
• Identifying situations, segments that stand out in terms of higher margin
• Creating algorithms based on that data to predict where prices (and margins) can be safely raised in the future, e.g. “D” items to industrial buyers
*Optimize means use the fewest trucks, travelling the least miles delivering the greatest gross margin loads while meeting promised customer delivery times/specifications
EDUCATION &RESEARCH FOUNDATION
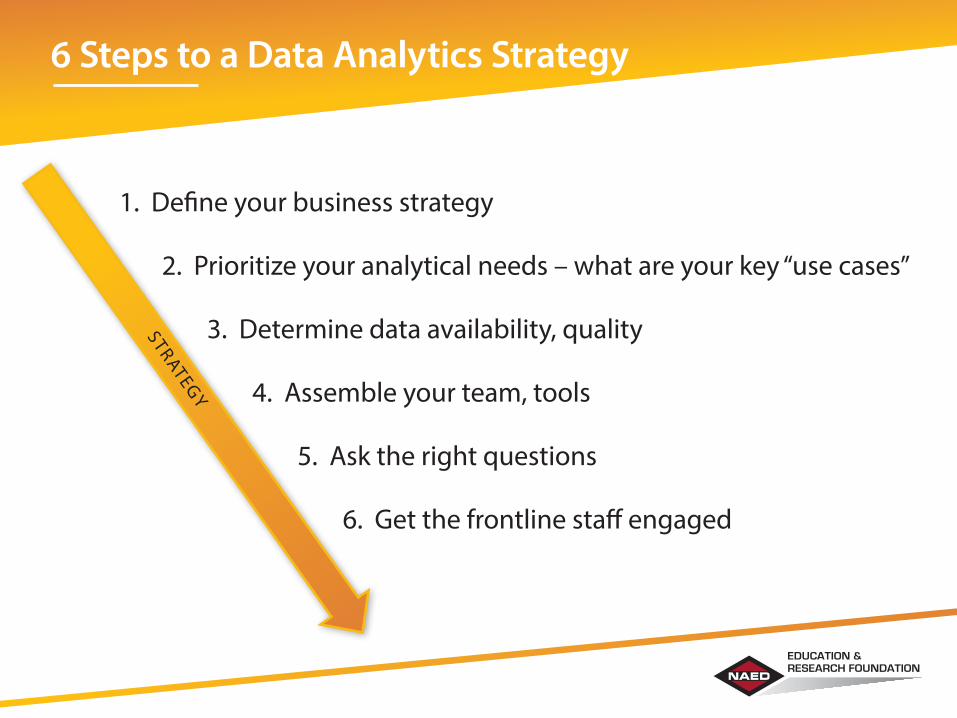
6 Steps to a Data Analytics Strategy
1. Define your business strategy
2. Prioritize your analytical needs – what are your key “use cases”
3. Determine data availability, quality
4. Assemble your team, tools
5. Ask the right questions
6. Get the frontline staff engaged
STRATEGY
EDUCATION &RESEARCH FOUNDATION
Download the full report at naed.org/leveragedata
EDUCATION &RESEARCH FOUNDATION


