Page 1
LF Economics 2015
LF Economics
The Great Australian Household Debt Trap
Why Housing Prices Have Increased
House of Representatives
Standing Committee on Economics
2015 Inquiry into Home Ownership
Lindsay David and Philip Soos*
20th May 2015
www.lfeconomics.com
Home OwnershipSubmission 1
Page 2
LF Economics 2015
1
Section 1: Introduction
Over the last decade, Australians have debated the causes of the rapid housing price
inflation and perceived lack of affordability. Since 1996, prices have outpaced inflation,
incomes, rents and GDP, making it difficult for potential first home buyers (FHBs) to enter
the market while lower income households and marginal groups struggle to afford decent
shelter. The Australian housing market shares similarities with countries that experienced
real estate bubbles, such as the United States, Spain, Denmark, the Netherlands and Ireland.
Government, the FIRE sector (finance, insurance and real estate) and the mainstream
economics profession predictably deny the existence of a housing bubble, but Australia’s
economic history demonstrates they occurred during the 1830s, 1880s, 1920s, mid-1970s
and late 1980s. The bursting of these bubbles invariably caused economic recessions and
depressions. Contrary to the analyses of the vested interests, the data clearly establishes
Australia is in the midst of the largest housing bubble on record. Policymakers are caught
between a rock and a hard place, as implementing needed reforms will likely burst the
bubble, causing severe financial and economic fallout as residential land prices revert to
mean. The FIRE sector will surely blame policymakers for the bust and deflect attention
away from debt-financed speculation.
Previous inquiries into the housing sector in 2004, 2008 and 2015 identified both supply and
demand-side variables as contributing to high housing prices: availability of finance, lower
nominal interest rates and inflation, preferential taxation treatment for all land owners,
developer charges and levies, the composition and rate of employment, demographic
change (population growth, household size and age structure), cash grants to FHBs, rezoning
policies and the returns from other investments.1 Current housing prices cannot be
explained by these fundamental factors, however, as both the nominal rent to inflation and
rent to income ratios have remained steady over the course of the housing price boom. It is
argued there are two primary causes for the housing bubble: a rapid acceleration in
mortgage debt and perverse taxation policies encouraging speculation.
1 PC (2004); Senate (2008; 2015).
Home OwnershipSubmission 1
Page 3
LF Economics 2015
2
Section 2: Defining a Housing Bubble
One of the faults of real estate analysis is the failure to distinctly define an asset bubble, so
debate on the matter is kept necessarily vague. If specific criteria are not carefully
delineated, then no one can say with certainty if a bubble exists or not. This plays nicely into
the hands of those making a living from the manipulation of asset prices, including
neoclassical economists who like to think the neoliberal program of deregulation,
liberalisation and privatisation of the banking and financial sector has resulted in a more
efficient market economy where asset bubbles do not form.
To this day, housing bubbles are still poorly defined, if at all, on the basis of ‘irrational
exuberance’ or ‘chasing capital gain’.2 The definition articulated by the economist Hyman
Minsky decades ago has been routinely ignored. Minsky defined an asset bubble on the
basis of Ponzi finance, when the income flows from an asset are unable to cover both
expenses and debt payments.3 If investors cannot profit from net rental income, they
become reliant on realising future capital growth to profit. As will be shown, all three
conditions of Minsky’s definition have been explicitly met: an increase in real housing prices,
a rising mortgage debt to GDP ratio and net rental income losses.
Only a couple of housing market metrics is needed to identify a bubble, and are now
considered commonplace when investigating the housing market: nominal price to inflation,
price to income and price to rent.4 The following analysis provides an additional array of
metrics to confirm the housing bubble: the mortgage debt to GDP ratio, net rental income
flows, Kavanagh-Putland Index, total land values to GDP ratio, housing stock value to GDP
ratio, housing debt to cash flow ratio and the Speculative Index. If economists are serious
about considering the possibility of a housing bubble, the research of the few economists
who identified the US housing bubble and predicted the GFC should be of interest.5
2 For example, Shiller (2005); Stiglitz (1990).
3 Minsky (1992).
4 For example, Baker (2002); Cox and Pavletich (2014); Shiller (2005).
5 Bezemer (2009; 2010); Foldvary (1997); Hartcher (2005); Ratajczak (2006); Talbott (2003; 2006).
Home OwnershipSubmission 1
Page 4
LF Economics 2015
3
Section 3: The Metrics
When adjusted for inflation and quality, housing prices have boomed nationwide since
1996, hitting a peak in 2010, before undergoing a slight fall and rise. On current trends, a
new, higher peak is likely to be set in 2015.
Home OwnershipSubmission 1
Page 5
LF Economics 2015
4
The other capital cities have not followed the trend in real housing prices of Sydney and
Melbourne in the post-GFC era; for instance, Perth has yet to regain the peak reached in
2007Q1. It should be noted that, while the ABS estimate of housing prices is stratified, it is
not quality-adjusted, so the indexes overstate the trend.
Home OwnershipSubmission 1
Page 6
LF Economics 2015
5
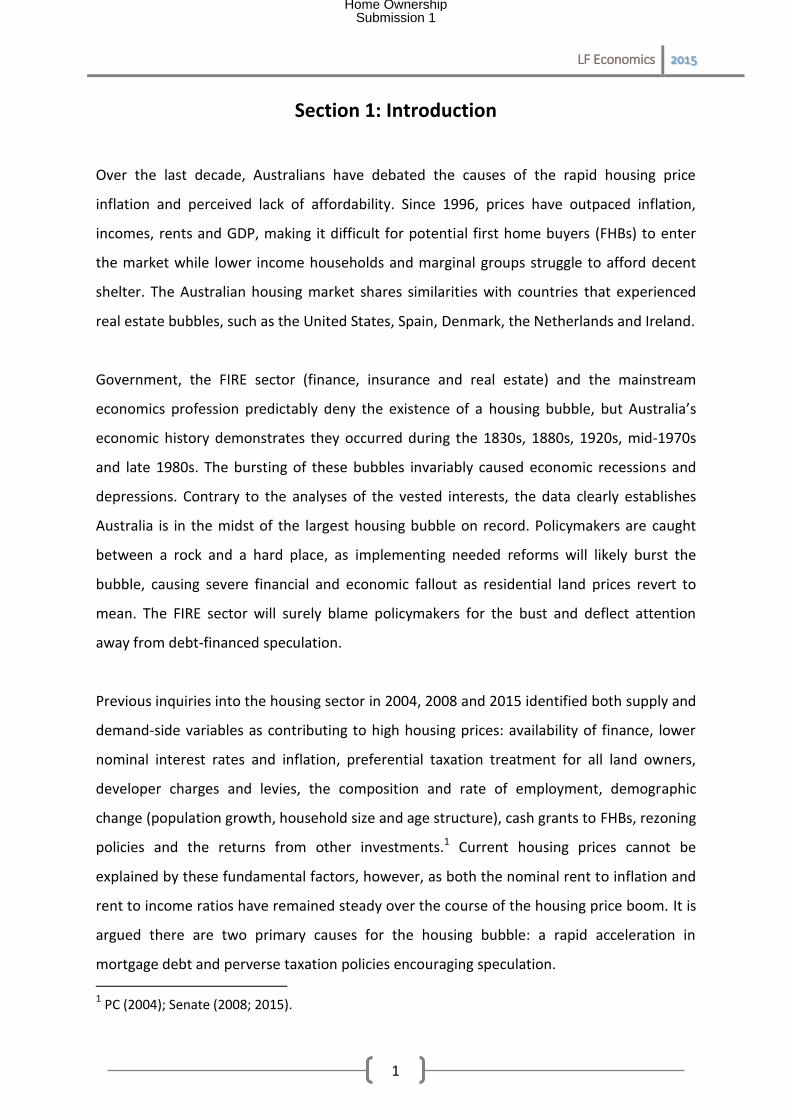
The household and mortgage debt to GDP ratios have boomed exponentially over the last
two decades, driving the largest housing and residential land market bubble in post-WW2
history. A new peak was set in 2014 for the mortgage debt ratio.
Home OwnershipSubmission 1
Page 7
LF Economics 2015
6
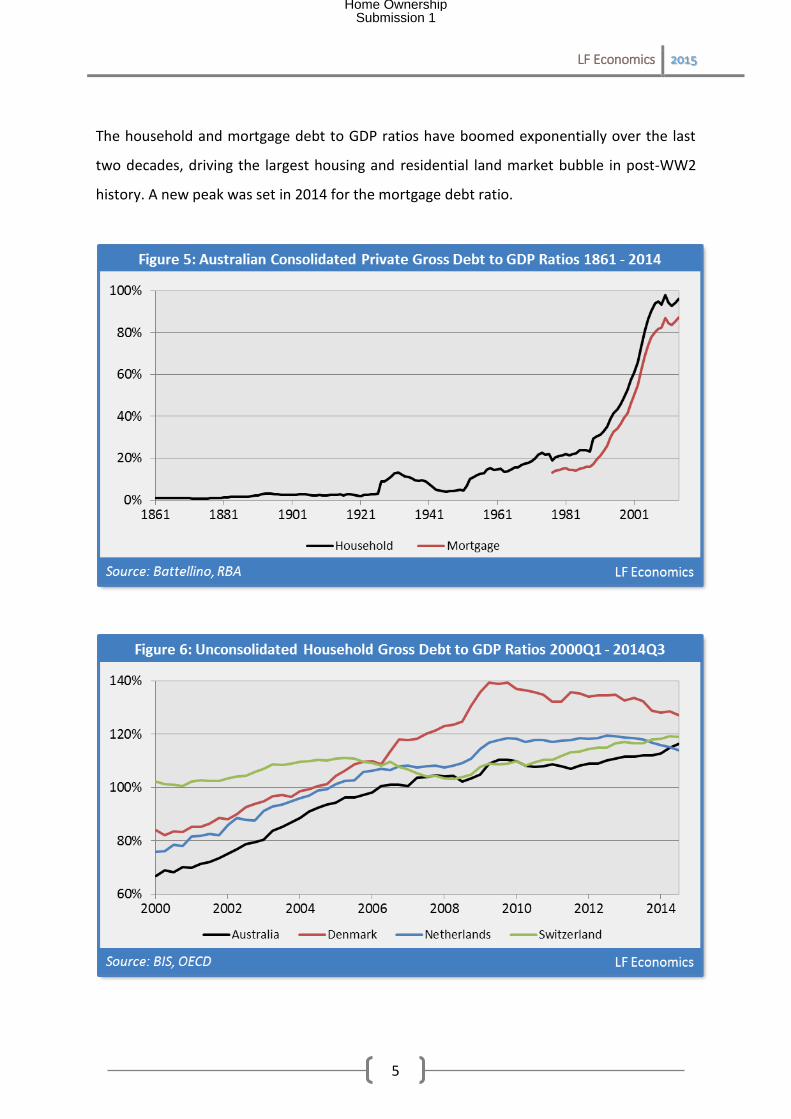
Globally, Australia’s household sector has accumulated significant and rising debt. Indeed,
as of 2014Q3, Australia has the world’s third most indebted household sector relative to
GDP, edging closer to Denmark (1st) and Switzerland (2nd), having recently surpassed the
Netherlands in that quarter. Given the current boom in Sydney and Melbourne, it is possible
Australia will soon exceed Switzerland to become 2nd, and with enough time, perhaps 1st. As
of 2014Q4, Australia’s unconsolidated household debt to GDP ratio is 118%.
As private debts have risen, so too has the debt to disposable income ratios. All the ratios
reached a new peak as of 2014Q4, as household debt continues to relentlessly increase
while nominal wage growth slows as the mining sector downturn gathers pace.
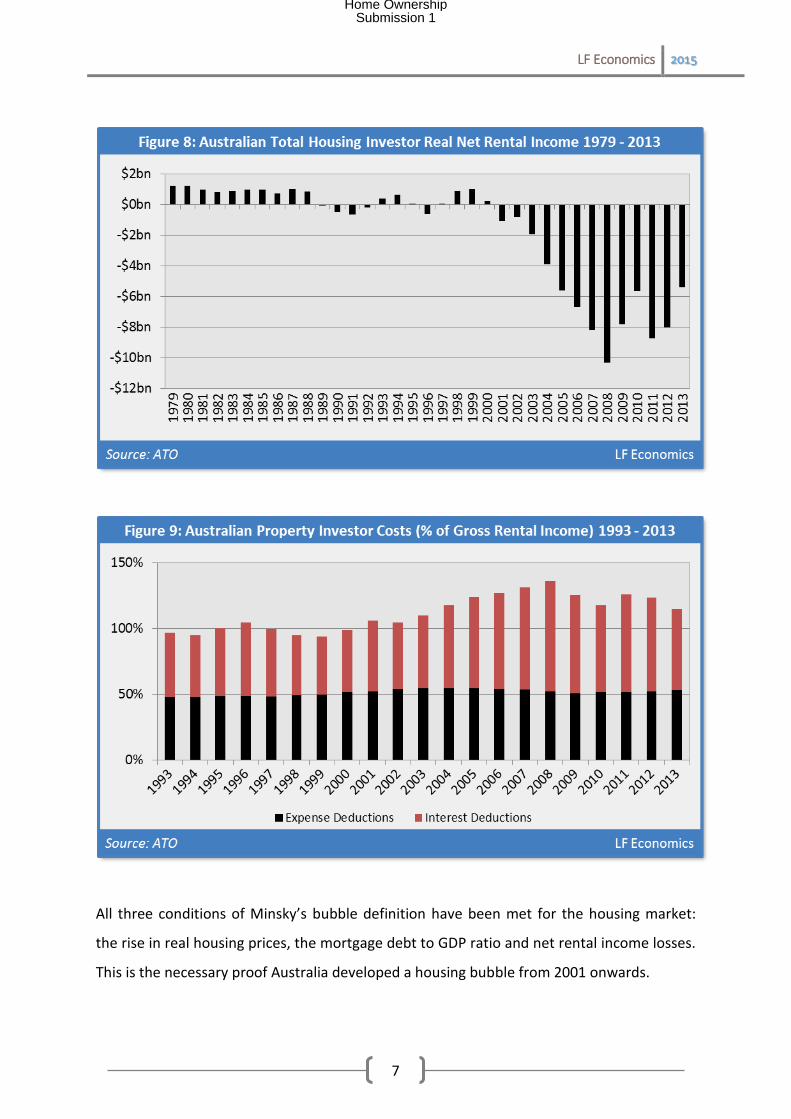
Net rental income losses have mounted for residential investors, as rental prices have
generally tracked the rate of inflation while housing prices and mortgage debt have
simultaneously boomed. The losses are larger than indicated because the ATO does not
record data on principal payments, as it is not a legal tax deduction. Two-thirds of investors
were negatively-geared in 2013, a significant rise from the 1990s when only half were in the
same position. The fall in interest rates since 2008 has reduced the debt payment burden
but perversely provides incentive to increase leverage.
Home OwnershipSubmission 1
Page 8
LF Economics 2015
7
All three conditions of Minsky’s bubble definition have been met for the housing market:
the rise in real housing prices, the mortgage debt to GDP ratio and net rental income losses.
This is the necessary proof Australia developed a housing bubble from 2001 onwards.
Home OwnershipSubmission 1
Page 9
LF Economics 2015
8
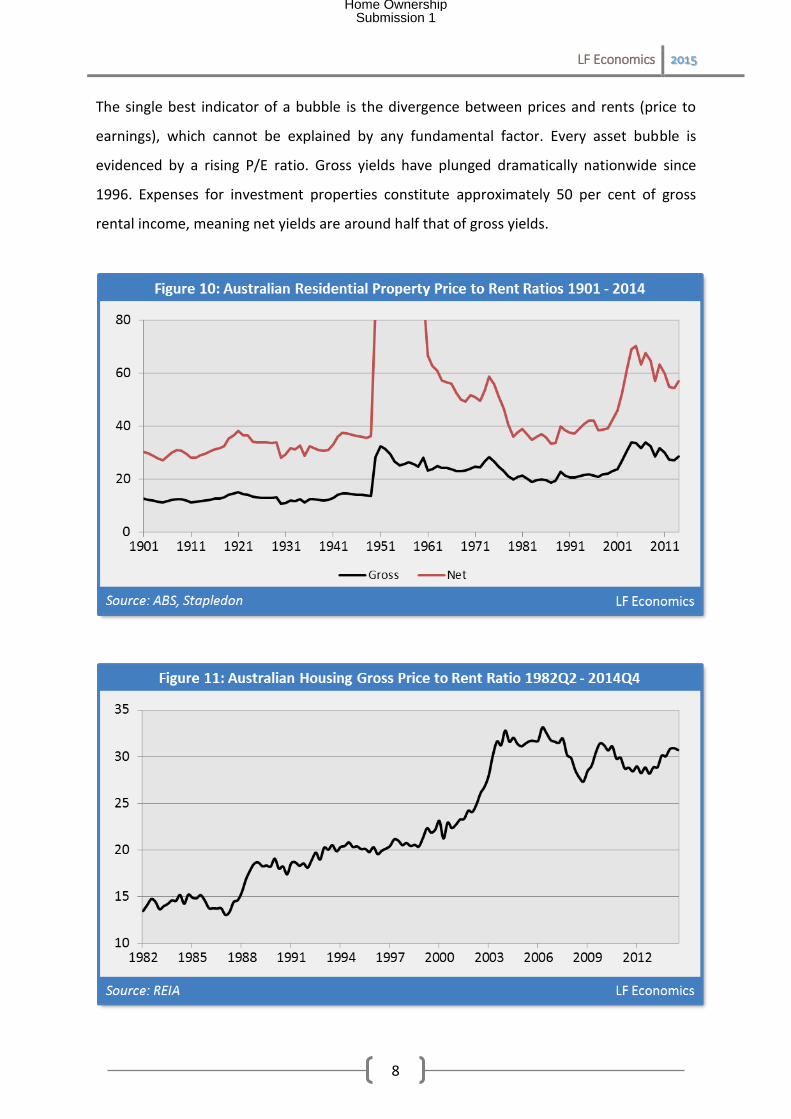
The single best indicator of a bubble is the divergence between prices and rents (price to
earnings), which cannot be explained by any fundamental factor. Every asset bubble is
evidenced by a rising P/E ratio. Gross yields have plunged dramatically nationwide since
1996. Expenses for investment properties constitute approximately 50 per cent of gross
rental income, meaning net yields are around half that of gross yields.
Home OwnershipSubmission 1
Page 10
LF Economics 2015
9
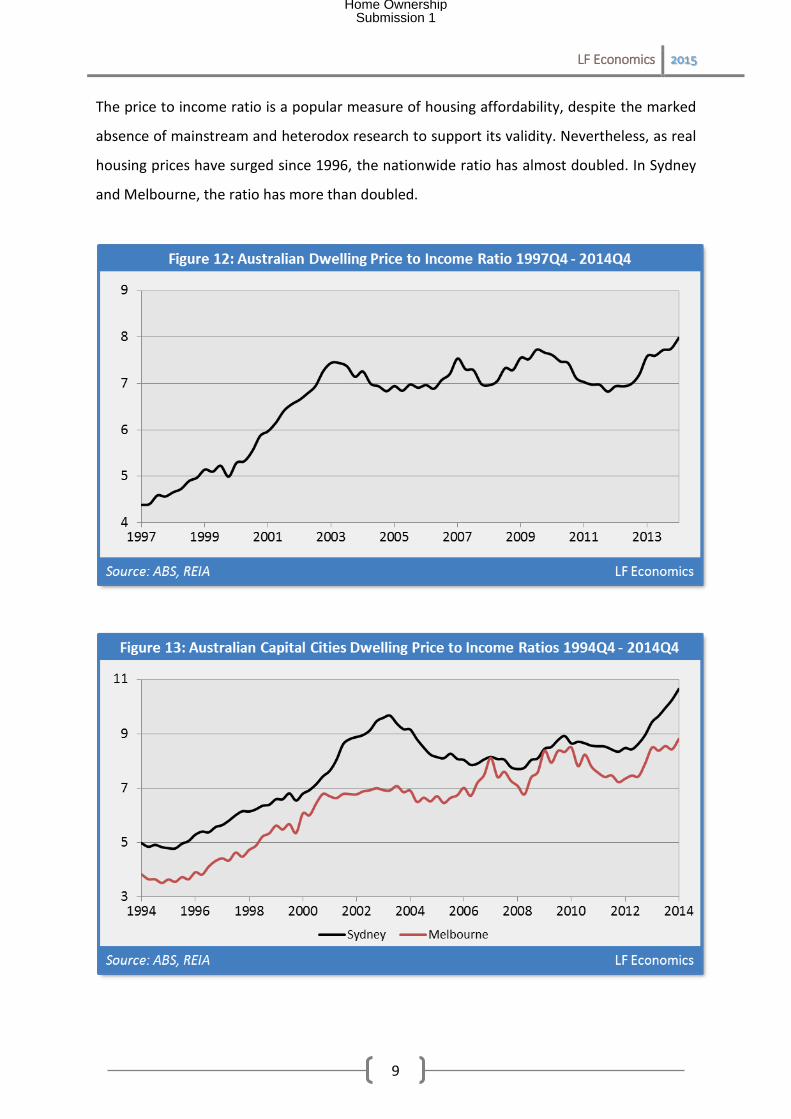
The price to income ratio is a popular measure of housing affordability, despite the marked
absence of mainstream and heterodox research to support its validity. Nevertheless, as real
housing prices have surged since 1996, the nationwide ratio has almost doubled. In Sydney
and Melbourne, the ratio has more than doubled.
Home OwnershipSubmission 1
Page 11
LF Economics 2015
10
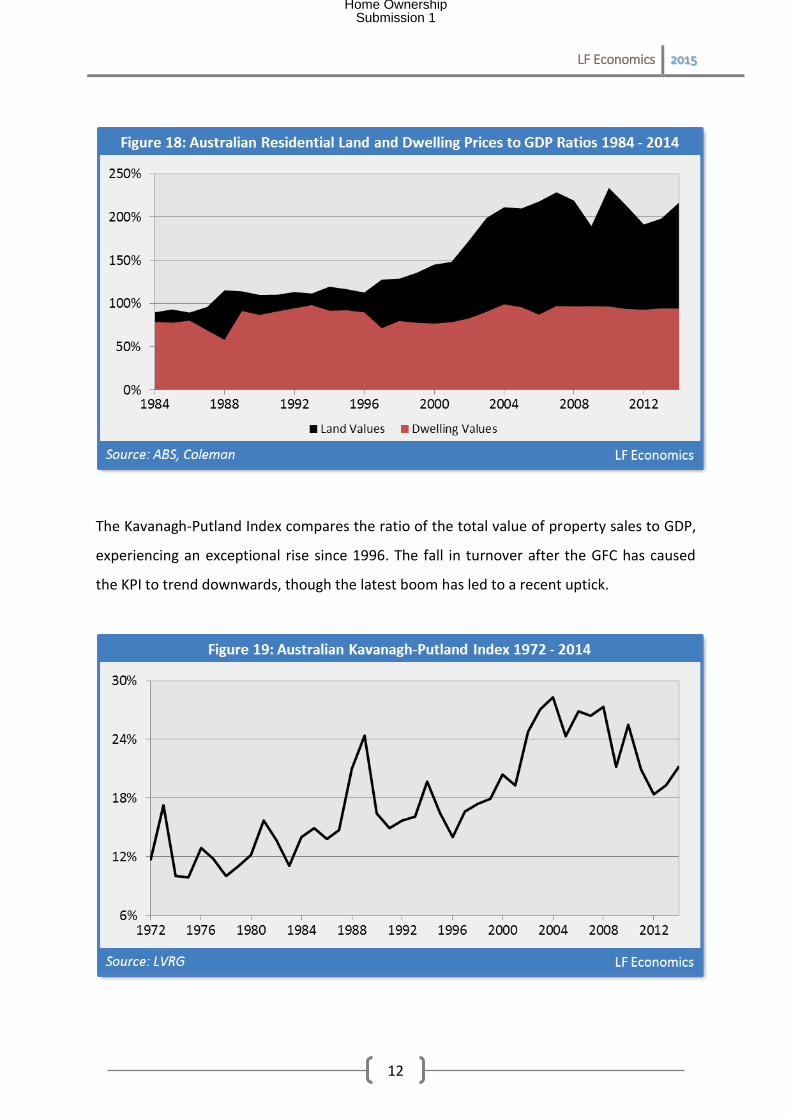
The housing price boom is driven by escalating land prices rather than dwelling values,
reaching a peak in 2010 at 298 per cent of GDP. Previous land market bubbles peaking in
1974, 1989 and today are clearly demonstrated in the figure below. The peak in 1931 is
more a case of collapsing nominal GDP rather than falling nominal aggregate land prices.
Home OwnershipSubmission 1
Page 12
LF Economics 2015
11
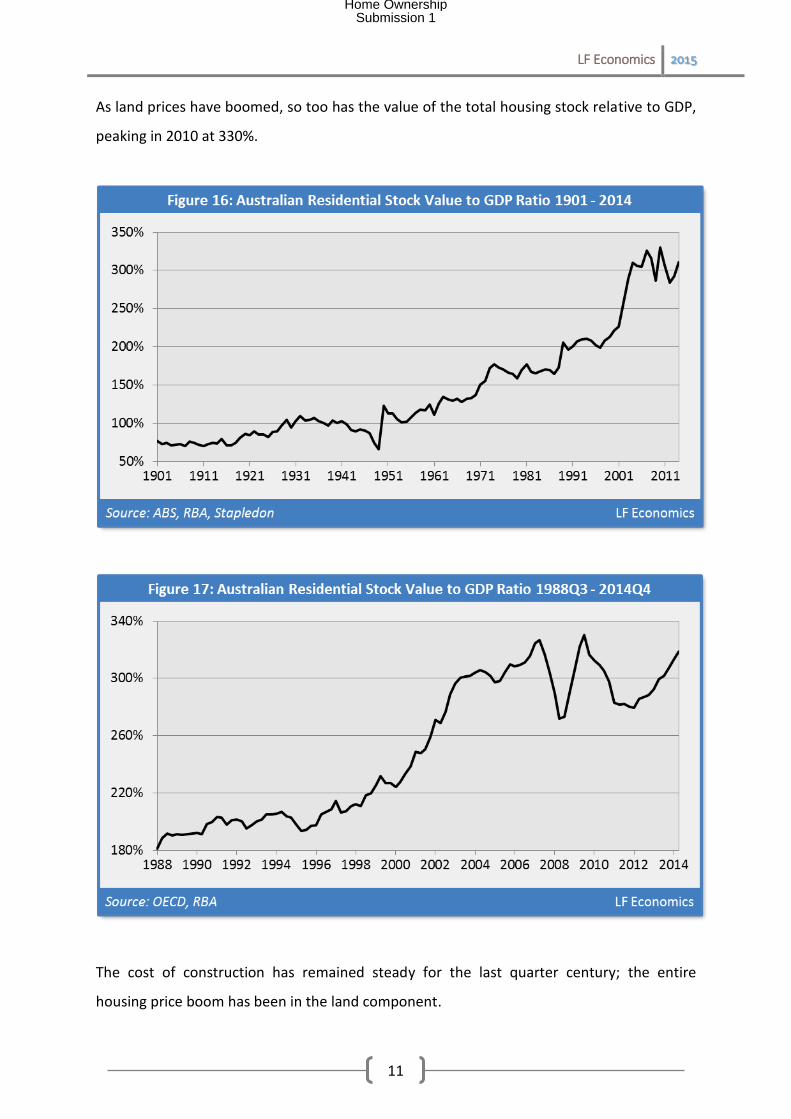
As land prices have boomed, so too has the value of the total housing stock relative to GDP,
peaking in 2010 at 330%.
The cost of construction has remained steady for the last quarter century; the entire
housing price boom has been in the land component.
Home OwnershipSubmission 1
Page 13
LF Economics 2015
12
The Kavanagh-Putland Index compares the ratio of the total value of property sales to GDP,
experiencing an exceptional rise since 1996. The fall in turnover after the GFC has caused
the KPI to trend downwards, though the latest boom has led to a recent uptick.
Home OwnershipSubmission 1
Page 14
LF Economics 2015
13
The debt to cash flow ratio indicates how many dollars of debt an investor holds relative to
net earnings. The ratios suggest the total housing and property investment stocks are
dangerously overleveraged.
Interest-only loans have reached new heights for owner-occupiers in 2014.
Home OwnershipSubmission 1
Page 15
LF Economics 2015
14
Housing prices should rise further given the mortgage interest rate has fallen significantly
since 2008. To measure the degree to which prices reflect expectations of capital gains, the
ratio of the mortgage interest rate to the residential gross yield is a useful indicator. When
the ratio is relatively high, prices are mostly reflecting expectations of capital gains;
conversely, when the ratio is low, prices mostly reflect rental yields.
Home OwnershipSubmission 1
Page 16
LF Economics 2015
15
It is unrealistic to expect real housing prices to revert precisely to mean following the surge
in real rents between 2007 and 2010. This rise, however, was not large enough to offset
inflated housing prices, demonstrated by the elevated P/R ratio. Given the recent boom in
dwelling construction post-GFC, real rents will remain steady or fall, compounded by
weakening wage and household income growth as the mining sector downturn continues.
Australian economic history and recent international events illustrate collapsing housing
bubbles can quickly increase the number of unsold properties (stale stock), shattering the
pervasive myth of a deleterious dwelling shortage. Should this occur alongside rising
unemployment and underemployment, reduced aggregate demand and falling net overseas
migration, the combination of declining population growth and an oversupply of investment
properties would place further downwards pressure on rental prices. Falling housing and
rental prices, including sales, would be a doomsday trifecta for investors as they suffer
losses in both capital prices and net rental incomes.
This calamitous outcome is especially likely in Melbourne where rents have not increased in
real terms since 2010. Melbourne is primed to become the epicentre of a legendary housing
market crash due to the combination of a staggering boom in real housing prices (178 per
cent). Perth is also in a serious predicament following price stagnation and substantial net
income losses since the market peaked in 2007Q1. On average, investors purchasing after
the peak have lost in terms of both prices and rental income. Other capital cities will
experience a downturn, though not as large in percentage terms as Melbourne or Perth.
These metrics point to the beginning of the housing boom in 1996 and peaking in 2010,
though the latest booms in Sydney and Melbourne could result in posting new peaks in
terms of the P/R ratio. Housing prices across all capital cities remain grossly inflated relative
to rents, income, inflation and GDP. What event or set of events triggers the beginning of
the end of the housing bubble is not yet known. A bloodbath in the housing market,
however, appears a near certainty due to the magnitude of falls required for housing prices
to again reflect economic fundamentals. The largest residential land market bubble on
record is truly incomparable and dwarfs earlier speculative episodes in the commercial and
industrial land market.
Home OwnershipSubmission 1
Page 17
LF Economics 2015
16
Section 4: Housing Taxation
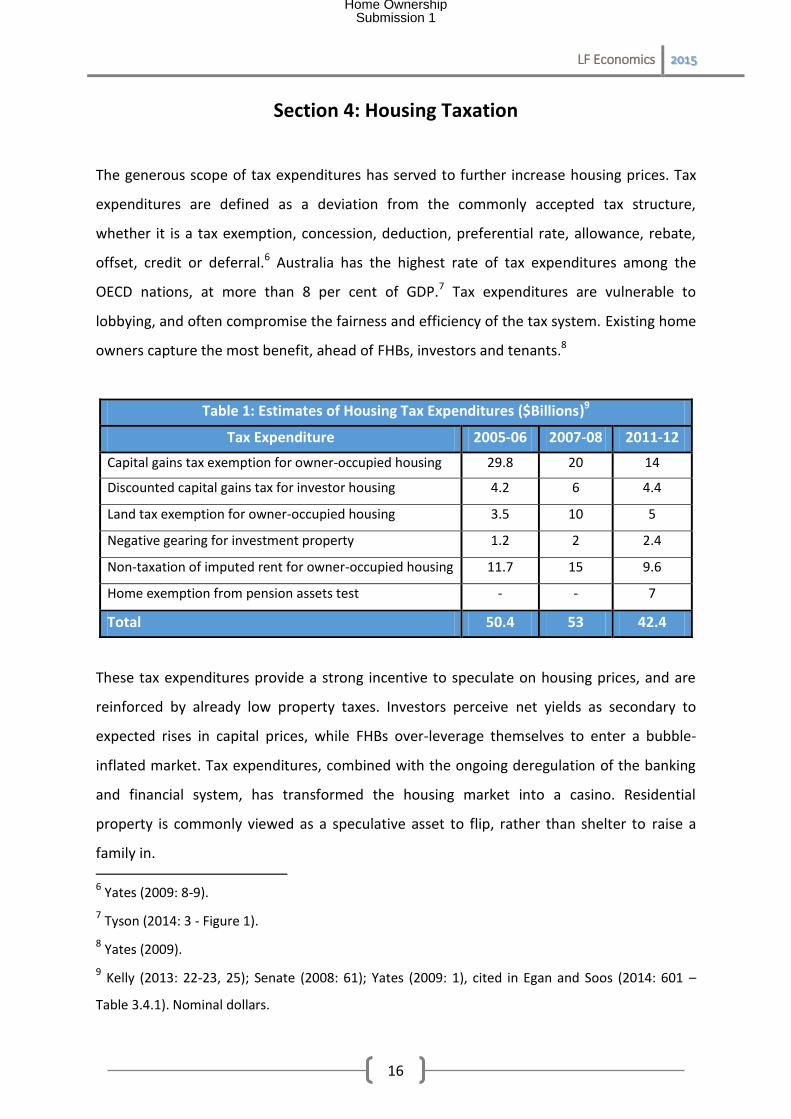
The generous scope of tax expenditures has served to further increase housing prices. Tax
expenditures are defined as a deviation from the commonly accepted tax structure,
whether it is a tax exemption, concession, deduction, preferential rate, allowance, rebate,
offset, credit or deferral.6 Australia has the highest rate of tax expenditures among the
OECD nations, at more than 8 per cent of GDP.7 Tax expenditures are vulnerable to
lobbying, and often compromise the fairness and efficiency of the tax system. Existing home
owners capture the most benefit, ahead of FHBs, investors and tenants.8
Table 1: Estimates of Housing Tax Expenditures ($Billions)9
Tax Expenditure 2005-06 2007-08 2011-12
Capital gains tax exemption for owner-occupied housing 29.8 20 14
Discounted capital gains tax for investor housing 4.2 6 4.4
Land tax exemption for owner-occupied housing 3.5 10 5
Negative gearing for investment property 1.2 2 2.4
Non-taxation of imputed rent for owner-occupied housing 11.7 15 9.6
Home exemption from pension assets test - - 7
Total 50.4 53 42.4
These tax expenditures provide a strong incentive to speculate on housing prices, and are
reinforced by already low property taxes. Investors perceive net yields as secondary to
expected rises in capital prices, while FHBs over-leverage themselves to enter a bubble-
inflated market. Tax expenditures, combined with the ongoing deregulation of the banking
and financial system, has transformed the housing market into a casino. Residential
property is commonly viewed as a speculative asset to flip, rather than shelter to raise a
family in. 6 Yates (2009: 8-9).
7 Tyson (2014: 3 - Figure 1).
8 Yates (2009).
9 Kelly (2013: 22-23, 25); Senate (2008: 61); Yates (2009: 1), cited in Egan and Soos (2014: 601 –
Table 3.4.1). Nominal dollars.
Home OwnershipSubmission 1
Page 18
LF Economics 2015
17
The scale of benefits for investors is proportionately lower because they are not exempt
from taxation on rental income and capital gains, and also incur the state-based land tax.
Despite the public backlash against negative gearing, at a few billion dollars per year, it pales
in comparison with the exemption and discount on capital gains tax for owner-occupiers
and investors, suggesting the taxation treatment of capital gains is a priority for future
reform.10
The committee of the recent inquiry into housing affordability claimed that taxing capital
gains on owner-occupied property was inconsistent with the community view that the home
should not be treated like an investment asset; yet, this is exactly what occurs when owners
are allowed to capture the unearned increments in capital and rental prices.11 As the above
metrics indicate, owner-occupier debt has risen significantly, and 31 per cent of all new
owner-occupier loans are interest-only as of 2014Q4, indicating the intent to speculate.
Government and industry have designed an intricate public relations propaganda campaign
to convince the common person that their only interest is in their capacity as a landowner.
Concerns about their capacity as an employee or small business owner is carefully removed
from the frame, given the pathologically insane 419 tax and tax-like fees the state stifles the
public under to allow the rent extractors of Australia a free ride from economic rents, which
overwhelmingly benefits the wealthy.12
There is evidence to suggest the wealthy pay no tax at all because, several years into an
economic boom, they can recoup decades of so-called progressive taxes through the
capture of unearned uplifts in the capital and rental prices of their real estate assets the tax
system strongly benefits, let alone the multitude of other sources of economic rents.13
10 Brown et al. (2011); PC (2004: Chapter 5).
11 Senate (2015: 145).
12 TAI (2015).
13 Fitzgerald (2013); Harrison (2006). See Riley (2001) for an example of this.
Home OwnershipSubmission 1
Page 19
LF Economics 2015
18
Section 5: Australia’s Fictitious Housing Shortage Chimera
Government, industry and academia have claimed the housing price boom is based upon
fundamental factors, for instance, high population growth, demographic change, falling
nominal interest rates, a low rate of inflation, restrictive land supply regulation, foreign
investment, and last, but not least, a dire shortage of dwellings. For those familiar with the
numerous global housing cycles in recent years, these factors were considered by
policymakers and mainstream property commentators as providing a floor under the
housing market which prices could not fall below.
Central to this argument is that a continual deficit of dwellings across Australia’s capital
cities has been a major cause of the structural rise in real housing prices. Government and
the FIRE sector are adamant that a housing shortage is responsible. Given the importance of
the housing market to the economy, it is surprising that no economist has constructed a
model of dwelling supply to determine whether a net surplus or deficit exists within a
specified time period, or to calculate the cumulative net surpluses or deficits across a
specified time span. Oddly enough, this has not prevented the housing lobby from strongly
proclaiming the existence of a shortage. Without a model of housing supply that can
concretely determine whether a cumulative net surplus or deficit exists, it is difficult to
claim an oversupply or shortage of dwellings exists, let alone determining the impact upon
housing prices.
Australia is not the only country where assertions of dwelling shortages surfaced. The US is a
classic example whereby its largest housing bubble on record was blamed on a phantom
shortage, allegedly caused by government regulation of the housing market. Mainstream
organisations - the Federal Reserve, National Association of Realtors, California Building
Industry Association and Harvard University’s Joint Center for Housing Studies - produced
sophisticated studies to show this to be the case. These studies were authored by the most
credentialed and experienced housing economists in the country. That the US had a major
oversupply of dwellings was obvious only after the bubble had burst, dashing the reliability
of housing economists.
Home OwnershipSubmission 1
Page 20
LF Economics 2015
19
Another obvious case example is Ireland. This country experienced a tremendous real estate
bubble which peaked in 2007 and then burst, throwing the economy into a severe economic
downturn. The housing price inflation, however, was blamed on a fabled dwelling shortage
by the luminaries of the Irish economics profession. The shortage argument, however, is not
new. Every country that has suffered through a housing cycle in recent years had so-called
experts claiming capital prices were based upon fundamental factors of supply and demand.
Unfortunately, economists considered these housing price booms to be efficiently based, so
there was no need to actually test for a shortage – they are considered to exist by definition.
What these housing markets experienced was artificial demand generated by their banking
and financial systems, having lent colossal sums of private debt to speculators to bid up
housing prices which led to the entry of ever-more buyers. It is during this period these
institutions claim a dwelling shortage is the cause of record high housing prices. The failure
of the RBA and government to identify the oversupply of mortgage debt in the household
sector as the real culprit has now left the housing market and economy exposed to financial
instability and a severe downturn.
Considering the blatant failures of housing economists and the legion of analysts and
researchers on the government and corporate payrolls to test for dwelling shortages in
international jurisdictions, it is a sound course of action to not fall into the same trap. Given
the oft-repeated assertion that Australia’s high housing prices stem, in part, from a dwelling
shortage, the chosen baseline for the analysis is 1996Q2, when real housing prices began to
rise. The latest data point available is 2014Q3.
The best method to determine whether a surplus or deficit exists is to compare the flow of
new net dwellings to new net households, once appropriate adjustments have been made.14
To err on the side of caution, the estimates are based on extremely conservative (restrictive)
assumptions, whereby:
14 Belsky (2009); Hargreaves (2008); Stapledon (2012: 304, n. 34).
Home OwnershipSubmission 1
Page 21
LF Economics 2015
20
Only private dwellings are included (the small proportion of public dwellings are
excluded).
Dwelling completions, not approvals or commencements, are used.
Completions are adjusted for estimated replacements/demolitions.
Completions are further adjusted for secondary dwellings (vacant and/or holiday
homes).
Renovations, alterations and additions are excluded (making dwellings larger and/or
adding new bedrooms).
Dwellings that are created through non-residential construction activity are excluded.
Births are included in new household formation, even though they don’t result in
demand for new supply (perhaps causing some families to transition to larger, existing
dwellings).
Given the conservative nature of the estimates, the data likely understates the supply of
dwellings available for occupancy across Australia’s housing markets. More liberal (relaxed)
assumptions would show a larger number of dwellings relative to new household formation.
Between 1996 and 2014, Australia was required to build a new dwelling for approximately
every 2.6 new residents to sufficiently accommodate its growing population.
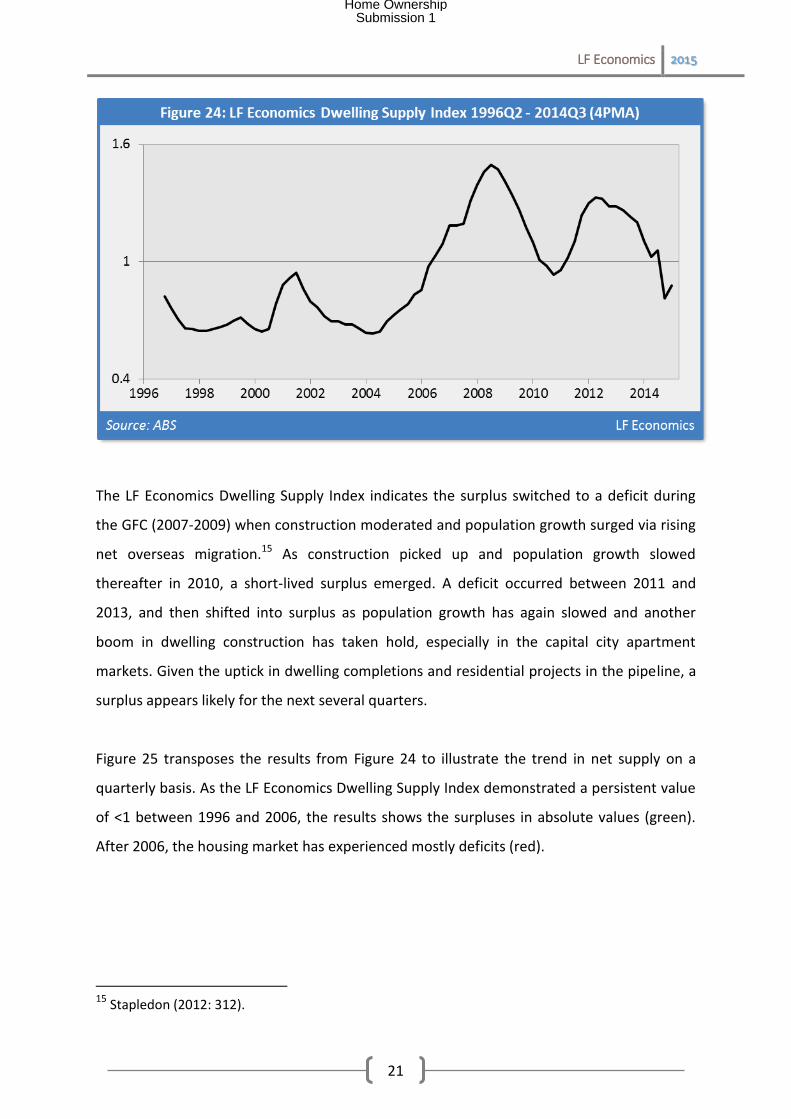
The LF Economics Dwelling Supply Index is interpreted as following: a value of 1 indicates a
balanced market, a value less than one indicates a surplus, while a value greater than one
indicates a deficit. A 4-period moving average has been used to smooth the volatility of the
data series. It demonstrates that, for the majority of the housing price boom, the national
housing market was in surplus. Between 1996 and 2014, Australian housing prices, adjusted
for inflation and quality, surged by 121 per cent. Yet, 86 per cent, or almost three-quarters,
of that boom occurred over a ten-year period between 1996 and 2006 when the housing
market was in persistent surplus.
Home OwnershipSubmission 1
Page 22
LF Economics 2015
21
The LF Economics Dwelling Supply Index indicates the surplus switched to a deficit during
the GFC (2007-2009) when construction moderated and population growth surged via rising
net overseas migration.15 As construction picked up and population growth slowed
thereafter in 2010, a short-lived surplus emerged. A deficit occurred between 2011 and
2013, and then shifted into surplus as population growth has again slowed and another
boom in dwelling construction has taken hold, especially in the capital city apartment
markets. Given the uptick in dwelling completions and residential projects in the pipeline, a
surplus appears likely for the next several quarters.
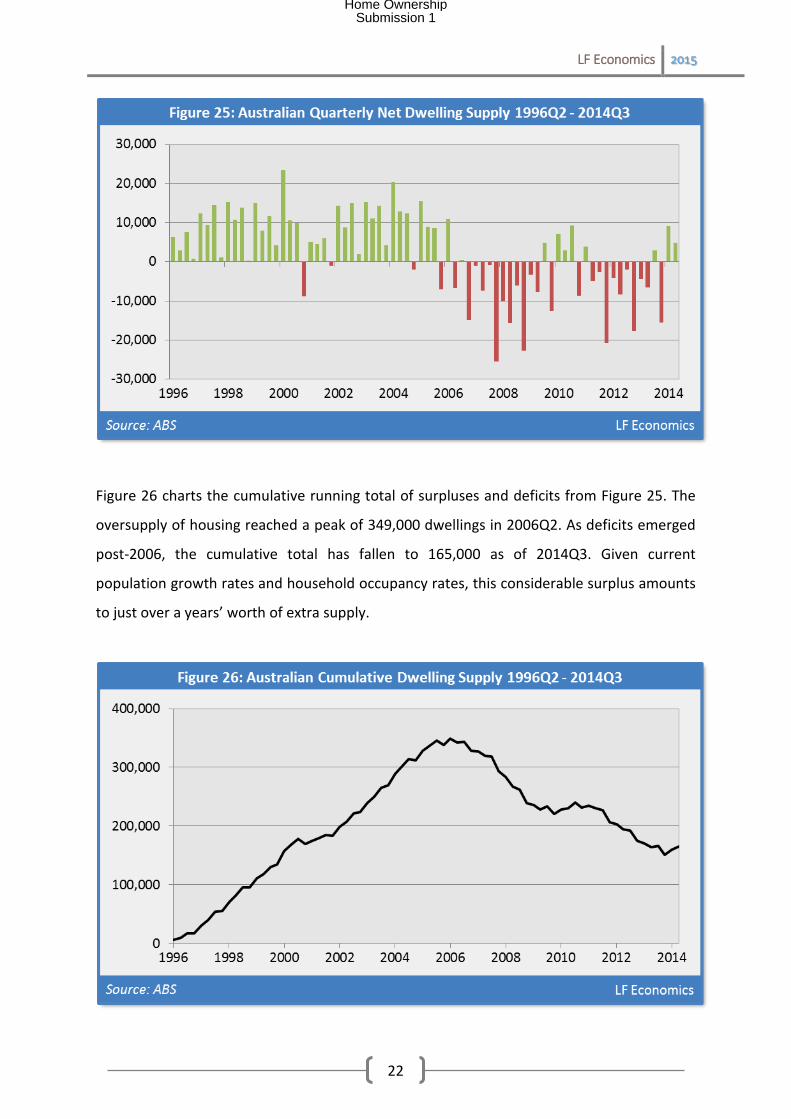
Figure 25 transposes the results from Figure 24 to illustrate the trend in net supply on a
quarterly basis. As the LF Economics Dwelling Supply Index demonstrated a persistent value
of <1 between 1996 and 2006, the results shows the surpluses in absolute values (green).
After 2006, the housing market has experienced mostly deficits (red).
15 Stapledon (2012: 312).
Home OwnershipSubmission 1
Page 23
LF Economics 2015
22
Figure 26 charts the cumulative running total of surpluses and deficits from Figure 25. The
oversupply of housing reached a peak of 349,000 dwellings in 2006Q2. As deficits emerged
post-2006, the cumulative total has fallen to 165,000 as of 2014Q3. Given current
population growth rates and household occupancy rates, this considerable surplus amounts
to just over a years’ worth of extra supply.
Home OwnershipSubmission 1
Page 24
LF Economics 2015
23
Table 2: The State of Supply in Australia by Region (2014Q3)
Region Supply Index Surplus/Deficit Cumulative Over/Undersupply NSW 0.97 285 40,537
VIC 0.82 2,151 123,242
QLD 0.77 2,107 -3,126
SA 0.64 697 28,302
WA 1.15 -797 -44,509
TAS 0.23 309 17,317
NT 0.90 49 -7,244
ACT 0.76 133 14,443
Australia 0.88 4,865 165,032
Source: ABS LF Economics
The same oversupply of dwellings has surfaced in all the states and territories except for
WA, QLD and NT, where the influx of population growth to service the mining boom has
resulted in a relative shortage of dwellings. These shortages have been evidenced by the
strong growth in rental prices, which are now falling as the mining boom unwinds in the face
of commodity oversupply. Of particular concern is Victoria, which has experienced the
biggest housing price boom of all the states and territories, but yet has the largest
cumulative oversupply of dwellings at 123,000. This is equivalent to approximately three
years’ worth of extra supply.
Despite these conservative estimates that demonstrate an oversupply of dwellings over the
period of the real housing price boom, government, industry and academia have yet to
acknowledge the obvious discrepancy between economic theory and reality. Between 1996
and 2006, the housing market produced persistent dwelling surpluses, even as real housing
prices boomed. Rental prices, in contrast, tracked the rate of inflation and occasionally fell
in real terms. If a dwelling shortage did occur, the effect would be demonstrated by rising
rental prices as tenants competed to secure scarce shelter via increasingly greater
proportions of their incomes. This would be evidenced by significant increases in the
nominal rent to inflation and rent to income ratios.16
16 This occurred in the capital cities during the GFC and for regional towns during the mining boom.
Home OwnershipSubmission 1
Page 25
LF Economics 2015
24
The problem is that economists assume housing markets operate in a static state of
equilibrium, where aggregate supply equals aggregate demand. In this model, inefficiencies
are only caused by exogenous or external interventions, for instance, government
regulations.17 It is assumed the housing market cannot transition from an equilibrium state
to a disequilibrium state without an external shock. By assuming static equilibrium models
are valid representations of the real world, mainstream economists use a spurious chain of
logic to arrive at the conclusion that housing prices must be high because government
regulations are limiting the supply of dwellings relative to demand. This is usually
demonstrated by means of the popular supply and demand model.
It has been known for decades, however, that static equilibrium models (including dynamic
stochastic general equilibrium models) do not accurately reflect the operation of any known
market, let alone one as complex as the housing market, especially in its interactions with
the banking and financial system.18 For a housing market to operate in equilibrium, a host of
patently absurd assumptions have to be made, with the resulting unrealism and
simplification ensuring limited comprehension of how housing and land markets actually
function in the real world:
1. The existence of equilibrium prices and quantities;
2. The market will always return to a deterministic equilibrium state;19
3. Banks, money and debt do not exist;
4. All housing is bartered (exchanged) without the use of debt;
5. All transactions are made at time = 0, as time does not exist;
6. There is no uncertainty, only probabilistic risk;
7. There is no asymmetry of information;
8. The acceleration and deceleration of mortgage debt does not affect housing prices;
17 Notwithstanding that the allocation of private property rights is a government intervention,
probably the largest and most significant one of all.
18 Bergmann (2009); Blaug (1998); Colander et al. (2009); Keen (2011); McCauley (2006; 2009);
Ormerod (1994).
19 Wayne (2015).
Home OwnershipSubmission 1
Page 26
LF Economics 2015
25
9. Decision-making is rational;
10. There is only one actor in the model, the representative consumer;
11. Preferences are static, irrespective of the change in income;
12. Utility is always maximised;
13. The rational agent knows the exact and entire future into infinity;
14. An almost infinite number of calculations are made by the rational agent to sort through
all possible combinations to maximise utility – the curse of dimensionality;20
15. The rational agent always spends the same proportion of their income on housing and
transportation costs, assuming there is always a fixed trade-off;
16. Land is modelled as capital or a commodity;
17. Land is modelled as if it were produced by a capitalist firm, rather than acquired from
nature;21
18. Land depreciates like capital, as if it were not a durable goods monopoly lacking a supply
curve;22
19. The returns to land are defined as earned as if it were a competitive market for capital,
rather than unearned economic rents;
20. The dwelling stock is perfectly malleable, which means that when a marginal change is
made, the entire dwelling stock is wiped out, then rebuilt incorporating that marginal
change;23
21. Land is continually utilised within urban boundaries and boundaries are continuously
expanded in line with income and population growth, which means leap-frog sprawl and
other irregular developments cannot be explained;24
22. Every plot of land is put to its highest use (never vacant) so no development
opportunities can exist;25
20 Keen (2003).
21 Gaffney and Harrison (2006).
22 Bagnoli et al. (1989).
23 Pines (1989).
24 Pines (1989).
25 Titman (1985).
Home OwnershipSubmission 1
Page 27
LF Economics 2015
26
23. There is never surplus inventory – if housing inventory does exist, the supply curve can
never meet the demand curve.26
The result of these unrealistic assumptions is a model which says nothing about any known
housing market, so the conclusions that follow cannot be correct, unless by coincidence.
Yet, because mainstream economists have not been taught any different, equilibrium
models comprise the conventional method for analysing housing markets. It is little wonder
the economics profession and industry has a profound attachment to these models, as it is
easy to show that high housing prices stem from government regulations that purport to
restrict dwelling and land supply.27
Equilibrium models should be discarding in favour of disequilibrium price dynamic models,
preferably supplemented with real options theory, as a more realistic approach to analysing
the dynamics of housing and land markets. Dynamic disequilibrium urban economic models
can advance the understanding of the fundamental drivers of the real estate cycle,
particularly when usury and land rent are incorporated. Economists must begin heeding
factors they have intentionally ignored for well over a century and which do not feature in
modern economics textbooks or university curriculums.
Another method by which the mainstream economics profession has twisted the housing
market debate is by asserting the affordability crisis is the result of supply-side rigidities
caused by regulations, assuming that many cannot afford shelter because of the resulting
high housing prices. Concerns over affordability are primarily centred on low income
households, as wealthier cohorts have the choice to delay purchase and rent instead. The
poor have little option but to rent, given few have the sustained income to purchase.
26 Wayne (2015).
27 Lithuania presents a falsification of this. Since independence, it has recorded a persistent outflow
of net population, resulting in significant effective increases in supply (as dwellings don’t disappear
when people leave). Yet, real housing prices ballooned by 700 per cent between 2001 and 2007 and
then collapsed - possibly the largest housing bubble in recorded history (Scatigna et al. 2014: 71 –
Graph 1).
Home OwnershipSubmission 1
Page 28
LF Economics 2015
27
As the data shows, the fundamental value of land (rental income) has generally kept in line
with inflation and household incomes.28 Yet, there will always be some persons and
households who are too poor to even rent modest dwellings. That this occurs is not the fault
of any perceived faults in the supply of dwellings, but is actually the result of the market’s
filtering process (ability to pay) which allocates the best accommodation to those with high
incomes and the worst dwellings to those who are poorest (or none at all).29 Property
developers and builders are not charities; they are capitalists who must make a profit or go
out of business. They can only respond to effective demand, not underlying demand (need).
If many secondary homes are built for the wealthy, and perhaps a holiday home for some in
the middle class while the poor reside in marginal housing or are rendered homeless, this is
neither caused by dwelling shortages nor supply-side rigidities but by the lack of effective
demand from low income persons and households.
The situation is similar to the market for food: the wealthy can purchase the highest-quality
and most expensive food, the broad middle class is likewise able to satisfy preferences, but
there will always be some who either go hungry or starve, not because of faults in the
supply of food, let alone enormous food wastage, but because they lack the ability to
transform their needs into effective demand on the market. Moreover, comparing the
market for dwellings to food is a poor analogy, given food prices should generally fall as an
economy becomes more productive and competition equates prices to marginal costs. Land
is not capital or a commodity, however; its value is instead determined by owners and
tenants competing to secure scarce sites. As nominal wage and household incomes almost
always grows in a capitalist economy, so do site values. The greater the productivity of an
economy, the more site values increase.
This is the same reasoning for dwellings that are vacant or derelict – that they are not in
current use and thus unsuitable for a potential household is not a reason for excluding them
from the supply estimates. Whether a dwelling is vacant or derelict is not the fault of the
28 Kearns (2012: Graph 5); Kent (2013: Graph 14).
29 Yates (2013: 121-122).
Home OwnershipSubmission 1
Page 29
LF Economics 2015
28
market to supply housing, but government policy that allows owners to let them remain
empty while collecting the unearned increments of future capital and rental prices (hence
the argument for the land value tax).
What is often crouched in terms of supply-side rigidities is actually an argument for reducing
inequality to ensure the poor can afford secure shelter. Unfortunately, there will always be
a significant proportion of people with insufficient incomes, often due to complex long-term
physical and/or mental issues, or are caring for others (the elderly or children) and have
little time to spare for wage labour. To translate their needs into effective demand, their
incomes can be boosted through social welfare transfers and have rents set at a sustainable
proportion of income (social and public housing).
Home OwnershipSubmission 1
Page 30
LF Economics 2015
29
Section 6: Recommendations
All levels of government must engage in significant policy reform regarding the FIRE sector
and taxation system to supress debt-financed speculation. A return to housing affordability
in Australia requires directly targeting the impulse of the banking system to lend out too
much credit and landowners’ capture of economic rent. Policymakers can begin by heeding
the many credible recommendations found in previous inquiries.30
Housing Market Recommendations
Recommendation #1: More efficient use of the State Land Tax (SLT).
The SLT is an ideal tool to moderate both land price bubbles and their subsequent
devastating busts, and is already in the toolkit of state and territory governments.
Unfortunately, this tax has been rendered comatose by a host of exemptions and
concessional treatments. The SLT requires broadening to include owner-occupied housing
and agricultural land, calculated on a per-square-metre value basis. The narrow existing
base and progressivity of the SLT incurs only a small deadweight loss; the complete removal
of exemptions and concessions would reduce this deadweight loss to zero.
On the other hand, the federal government could take charge by imposing a comprehensive
Land Value Tax (LVT) on all land. An increasing marginal rate schedule taxes the least
valuable land at 0 per cent, with rising rates calculated on a per-square-metre value basis.
Land taxes apply per land holding, but not on an entity’s total holdings, to encourage
development.31
Recommendation #2: Changes to municipal rates calculations.
30 Including those detailed in Egan and Soos (2014: 686-702).
31 Treasury (2009). Recommendations 51-54.
Home OwnershipSubmission 1
Page 31
LF Economics 2015
30
Municipal rates should be levied using site value (SV) rating, taxing the underlying land only.
Under the capital improved value (CIV) or net annual value (NAV) system, construction is
taxed, suppressing building activity and imposing widespread deadweight losses.32 Use of
Minimum Rates provides a direct subsidy to those owning more valuable sites. Ratepayers
should oppose this wealth transfer - an impost on their capital values as well as annual
charges. Rates should not be capped to the rate of inflation given residential land prices
have far outstripped inflation.
Recommendation #3: Reform stamp duty tax.
Unlike most recommendations regarding stamp duty, it is a tax worth keeping. Theoretical
studies on the deadweight losses of taxation will indicate stamp duty is an inefficient
transactions tax, but this only holds on the unrealistic assumption that the housing market is
efficient. As Australia is at the peak of its largest housing bubble on record (revealing the
housing market is not efficient), stamp duty instead acts similarly to a Tobin tax: it reduces
both prices and volatility. Evidence demonstrates stamp duty in Australia reduces housing
prices equal to or greater than the value of the stamp duty, rather than increasing prices as
is commonly believed.33 This is precisely why the housing lobby seeks to reduce and
eliminate this tax.
Given the inefficiencies currently wrought in the housing market, stamp duty is likely to be
welfare-enhancing, and thus should be retained. A reformist approach would be to increase
stamp duty on the more speculative transactions, for instance, owner-occupier and
investment property purchases with a loan to value (LVR) ratio above 80%, rising further if
interest-only loans are used, while reducing stamp duty for transactions with lower LVRs
and amortizing principal and interest mortgages. If a sufficiently large, broad-based LVT
proved it could quell an inefficient housing market, stamp duty could be gradually reduced.
It should also be noted that the incidence of stamp duty results in a portion falling on the
32 Harrison (1983).
33 Davidoff and Leigh (2013).
Home OwnershipSubmission 1
Page 32
LF Economics 2015
31
dwelling structure, which results in inefficiency as with council rates based on the CIV or
NAV system.
Recommendation #4: Reform housing tax expenditures.
The capital gains and land value tax exemptions for owner-occupiers and the capital gains
tax discount for investors should be removed.34 Owner-occupier mortgage interest
deductibility is ruled out because it is the equivalent of the negative gearing benefit for
investors, and therefore likely to encourage larger private debt burdens.
SMSF tax concessions should be modified by bringing them into line with the benchmark
treatment for property investment.35 Provisions allowing SMSFs to borrow for investment
purposes are removed to limit risk and losses during future real estate corrections.
Recommendation #5: Quarantine negative gearing.
Negative gearing is a Ponzi-amplification mechanism that provides incentive to increase
mortgage debt to speculate on the movements of future capital prices. The ability of
property investors to write off net rental income losses against labour income tax should be
disallowed. The ability of investors to claim depreciation on buildings should be reviewed, as
it allows income that otherwise would have been taxed at the full rate to be converted into
capital gains that are only taxed at 50 per cent of the nominal rate.
Recommendation #6: Removal of all first home buyer subsidies.
The FHB grant and boost, including the first home savers accounts, should be removed.
These housing subsidies act as a demand-side stimulus that further erodes affordability.
When combined with highly-leveraged mortgages, the result is rapid housing price inflation
34 Kelly (2013); Senate (2008); Yates (2009).
35 Before retirement, capital gains and income tax rates are 15 per cent, falling to 10 per cent if held
for more than one year. After retirement, there is no tax liability on either (ATO 2013).
Home OwnershipSubmission 1
Page 33
LF Economics 2015
32
that substantially outstrips the size of the grant. These grants are a gift to vendors, not
FHBs.
Recommendation #7: Prevent superannuation lump-sum withdrawals.
Disallow the use of lump-sum withdrawals from superannuation accounts to finance
purchases of owner-occupied property or to prevent foreclosure (while allowing SMSF
purchases as noted above). The former acts like a FHB grant, while the latter is another gift
to bankers.
Recommendation #8: Increase the Commonwealth Rent Assistance (CRA) scheme.
The CRA should be increased to assist low and moderate income tenants, and index it to
nominal rental price growth. The CRA is better targeted than NG and the NRAS because it
provides direct cash assistance to tenants. The program may place upwards pressure on
rental prices as it increases eligible tenants’ purchasing power.
Recommendation #9: Greater investment in public housing.
A substantial increase in funding for public housing would assist long-term, low-income
individuals and families reliant on social welfare to exit the private rental market,
ameliorating their financial stress. We have an obligation to look after those who have
difficulty managing their affairs.
Recommendation #10: Tenancy law reform.
Australian tenancy laws should adopt the higher standards enjoyed by other Western
nations. Tenants’ limited rights include less stability and security in tenure due to shorter
lease terms (6 to 12 months on average), lower rental vacancy rates favouring landlords
Home OwnershipSubmission 1
Page 34
LF Economics 2015
33
during contractual negotiations, termination of leases for no reason, and requisite landlord
permission for minor alterations and pet ownership.36
Recommendation #11: The adoption of ‘right to build’ laws.
This policy encourages timely development of residential property. Planning delays and
uncertainties may raise land costs, thus, this effect is negated by a right (positive
presumption) for developers and home builders to undertake activity, within specified local
and state government guidelines. If a development is opposed, then the onus is upon the
aggrieved party to take the developer to the civil tribunal to modify or prevent construction.
Recommendation #12: Elimination of state/local government infrastructure charges and
levies.
Governments should reverse its preference for imposing direct charges on developers,
instead financing local infrastructure directly. Governments can either adopt the Texan
Municipal Utility District (MUD) model or return to the original system of issuing municipal
bonds to finance local infrastructure and paying down debts through council rates.
It should be noted that developer levies and charges do not feed through into higher
housing prices as is commonly believed; rather, developers subsume the levies and charges
through lower profit margins which explains why they oppose them. Regardless, those who
benefit from local infrastructure should finance its provision through the benefits-pays
system: landowners through council rates and SLT/LVT.
Recommendation #13: Streamlining of zoning processes.
Land subdivision and zoning vacant land for residential use in capital cities takes too long,
generating considerable costs, uncertainty and reducing developer competition.
36 Kelly (2013).
Home OwnershipSubmission 1
Page 35
LF Economics 2015
34
Comprehensive betterment taxes should be applied to agricultural land that is rezoned for
commercial and residential purposes.
Recommendation #14: Removal of most urban growth boundaries (UGBs).
Except for ecologically or culturally sensitive regions of land, there is no sound rationale for
UGBs, as only a tiny fraction of Australia’s land mass is urbanised. Building further out on
the fringe may lower housing costs, but this will likely be more than offset by the rise in
transportation costs.37
Recommendation #15: Establish the ‘Right to Rent’ program.
The Right to Rent program allows any household in danger of foreclosure to remain in their
home for a period of 5 to 10 years (or longer), paying the market rate of rent to the new
owner (the bank). This policy helps protect owner-occupiers from the injurious effects of
lenders’ control frauds. The plan does not bailout the banks or home owners, can be
implemented straight away, does not create more bureaucracy and protects property from
theft, squatting and vandalism. It also gives owner-occupiers more power in working
through mortgage modifications, potentially reducing the number of delinquencies,
insolvencies and foreclosures.38
Banking Recommendations
Recommendation #1: Prepare legislation for the implementation of a future Chicago Plan-
style reform in the event of a severe banking crisis. This includes a progression to 100 per
cent reserve lending and backing for deposits, and public control of the money supply via
issuance of government money (equity) when banks want to lend, unless they wish to pay
an increased premium for private debt liabilities. Forcing the requirement that banks issue
debt instruments to the government, rather than the private sector, is a blueprint for
37 See CNT (2015) and USHUD (2015) for the evidence from US housing markets.
38 Baker (2011).
Home OwnershipSubmission 1
Page 36
LF Economics 2015
35
removing the noxious impact of usurious fees and interest charges, and rapid inflation in the
money supply that causes asset bubbles and financial instability.39
Recommendation #2: A range of macro-prudential tools should be implemented to
moderate housing price inflation and subdue credit growth in a pro-cyclical financial system,
particularly those affecting the loan to value (LVR), debt servicing (DSR) and debt servicing
to income (DSTI) ratios.40 Quantitative restrictions are placed on the share of new
mortgages with moderately high LVRs (60 to 79 per cent), and significantly strengthened for
mortgages with an LVR of 80 to 89 per cent. Mortgages with an LVR of 90 per cent and
above, interest-only loans and those backed by parental guarantee are disallowed.
Mortgage debt is capped at a multiple of ten times the imputed or actual annual rental
income of the property being purchased to prevent a positive feedback loop forming
between rising housing prices and debt.41 The ’30-10-30 Plan’ should be a future policy
consideration following a severe downturn in the housing market.42
Recommendation #3: To reduce systemic risk, a large rise in capital and liquidity ratios
(buffers) is implemented so banks can withstand a future economic downturn, bank run,
credit market freeze or large fall in the value of collateral. Research suggests the probability
of a banking crisis can be reduced to a 1 in 100 year event by raising core equity (Tier 1)
capital ratios to 11 per cent in isolation or raising core equity to 10 per cent with an
additional rise in liquid assets of 12.5 per cent (the rise in liquid assets over total assets).43
For the Big Four banks, this represents a rise of around 3 per cent in core equity. Liquidity
and capital buffers (and general debt provisioning) must rise during the expansionary phase
of the credit cycle, taming the size and duration of a debt-financed asset price boom.
39 Benes and Kumhof (2012).
40 Rogers (2013: 16-17).
41 Keen (2011: 398-400).
42 David (2015).
43 BIS (2010: 4-5); IMF (2012: 22).
Home OwnershipSubmission 1
Page 37
LF Economics 2015
36
Recommendation #4: APRA enforces a transparent and prudent risk-weighting
methodology for determining capital ratios. APRA rescinds banks’ authority to calculate
their own risk-weights with advanced internal methods (APS 113) and enforces all new bank
lending under APS 112, applying more conservative criteria and risk weights for residential
mortgages. Requisite modifications to APS 112 include higher risk-weights when asset prices
significantly diverge from the long-term mean (25-30 year minimum), and re-calculation of
potential super-sized LGD, PD and EAD during a large housing correction.
Recommendation #5: Significant capital allocations arising from conservative risk-weights
imposed on financial derivatives, with prudential regulations requiring derivatives to be
placed on-balance sheet in SPVs.
Recommendation #6: Development of a new RBA risk assessment framework including a
range of macroeconomic, banking, market-priced and qualitative indicators:
Macroeconomic metrics include the stock and flow of credit to all sectors of the
economy (household, non-banking financial, non-financial business, and government
sectors), sectoral leverage, associated DSRs and estimations of credit quality.
Banking sector metrics include capital adequacy as a proportion of total asset value (not
RWAs), liquidity ratios, non-performing loan rate, asset quality in high-risk sectors (e.g.
residential housing), proportion of high-LVR and interest-only lending, asset
concentration on bank balance sheets, and the level of specific provisions for bad debts.
Market-priced metrics include the divergence of asset prices from long-term averages
(e.g. P/I and P/R ratios), credit spread between market/deposit and lending rates,
proportion of securitised, offshore and short-term wholesale funding, degree of foreign
investment, loan to deposit ratios, and the average maturity profile of debt.
Qualitative measures include lending standards and risk appetite, ratio of prime to non-
prime/subprime lending, trends in loan control frauds, rapid bank network growth and
the intensity of financial sector competition.44
44 Rogers (2013: 17 - Table 2).
Home OwnershipSubmission 1
Page 38
LF Economics 2015
37
Recommendation #7: Strict limits are placed on the Big Four banks to prevent any further
mergers or acquisitions due to the high concentration of Australian financial system assets
under management and the already non-competitive operating environment. A maximum
threshold is established for the proportion of credit aggregates directed towards any single
asset class.
Recommendation #8: APRA enforces less reliance on wholesale borrowing, particularly
short-term foreign debt, via existing regulatory powers. The average maturity of wholesale
funding is lengthened by adopting suitable benchmarks for short and long-term wholesale
borrowing, and imposing restrictions on off-shore bond issuance. A minimum level is also
set for ‘stickier’ funding sources like domestic deposits.
Recommendation #9: Covered bonds are phased out, as this dual recourse funding
arrangement poses significant over-collateralisation risks. The numerous funding
advantages of the Big Four banks over second-tier lenders indicate they are not
disadvantaged by this reform. Legislative amendments to the Banking Act 1959
subordinating depositors in the creditor hierarchy are unwound.
Recommendation #10: RMBS funding arrangements are reviewed and a maximum 10 per
cent limit set for total RMBS financing in any asset class. The AOFM explicitly rules out any
future support for RMBS.
Recommendation #11: Establishment of a Royal Commission to conduct an exhaustive
investigation of the financial system and regulatory bodies. The Terms of Reference are
broad and explore accusations of extensive subprime mortgage fraud, predatory lending,
and regulatory agency culpability and negligence in addressing systemic risk and
unconscionable financier conduct.
Recommendation #12: External dispute resolution (EDR) organisation regulations are
reformed to better assist victims of predatory lending. Arbitrary caps on mortgages are
removed, allowing EDRs to write-off the entirety of loans in the worst cases of fraud. The
powers of EDRs are significantly expanded to deal with recalcitrant lenders.
Home OwnershipSubmission 1
Page 39
LF Economics 2015
38
Recommendation #13: The Financial Claims Scheme (FCS) is broadened to include
significant ex-ante funding from banks to provide depositor and general policy insurance. A
financial contribution from banks discourages moral hazard and guarantees they bear a
greater loss for subsequent failures.
Recommendation #14: Economists in senior and executive public roles are subject to a
suitable incentive structure to ensure appropriate management of the economy and
commentary. A range of key performance indicators can be adopted and benchmarked
against the performance of the economy. Economists are held accountable for the quality of
their work, with a number of penalties being introduced for poor performance: fines, loss of
employment and even imprisonment in the worst cases of financial and economic collapse.
Recommendation #15: The development of a more transparent and empirically-validated
stress-testing framework. Primary variables that predict future instability include the size of
the credit-to-GDP gap (breaching 6 per cent), DSRs greater than 20 per cent (related to
more severe recessions), a large proportion of credit aggregates directed towards real
estate (42 per cent of all Australian banking assets are housing loans), large deviations of
asset prices from the long-term mean, and low equity to deposit ratios (a greater number of
creditors have a claim on banking assets). APRA ceases to use ‘soft stress-testing
assumptions’ for liquidity as noted in the 2012 IMF Financial Stability Report.
Recommendation #16: The APRA stress-testing framework includes the following secondary
variables: large ToT shocks precipitating a significant fall in national income, persistent tepid
or negative economic growth, steep rises in unemployment stressing high DSR households,
and significant Australian bank exposure to the New Zealand market.45 A mining sector
downturn would increase the likelihood of rising personal and commercial defaults,
declining credit quality, and rising bank funding costs as credit ratings agencies lose
confidence in credit quality. New Zealand’s housing bubble is also heavily dependent on
45 The NZ market represents 40 per cent of banks’ cross-border exposure, and 90 per cent of NZ
banking assets are controlled by Australian banks.
Home OwnershipSubmission 1
Page 40
LF Economics 2015
39
capital inflows for funding, suggesting a simultaneous property downturn could amplify
difficulties for the Australian parent companies, despite legal ring-fencing.46
Recommendation #17: The decision to implement a CLF is reviewed, alongside the
conditions of access and possible taxpayer risk. At a minimum, the cost of accessing CLF
liquidity should be substantially increased, as there is a spread of well over 100bps between
the wholesale funding and cash rates. Banks may otherwise try to access the CLF for
cheaper funding, instead of as a last resort measure. The RBA could also threaten to convert
debt into equity following a large fall in the value of collateral pledged to access liquidity.
Abolishing the CLF is the most prudent measure as it is a thinly-disguised, taxpayer-funded
bailout mechanism. If financial institutions require capitalisation at taxpayer expense, they
should be nationalised rather than bailed out.
Recommendation #18: Bail-in provisions overseen by the FSB and endorsed by APRA are
repealed, despite Australia’s implementation of the new global liquidity framework (Basel III
International Framework for Liquidity Risk Measurement, Standards and Monitoring). An
independent panel of experts considers a range of alternative policy measures that
contribute to financial stability, outside of the costly bailout/bail-in paradigm.
Recommendation #19: A ‘true cost of service provision’ regulation is implemented
regarding the pricing of essential bank services. The banking and financial sector is regulated
like utilities, rather than viewed as profit centres yielding infinitely rising returns for
management and shareholders.
Recommendation #20: A levy is imposed on the financial sector for the government deposit
guarantee, and calculated to be the approximate size of the derived market benefit. The Big
46 IMF (2012: 33, Appendix 1). Australia has the highest global percentage of real estate assets on
bank balance sheets.
Home OwnershipSubmission 1
Page 41
LF Economics 2015
40
Four’s heavy concentration and majority control over financial system assets means they
already reap significant cost savings due to economies of scale.47
Recommendation #21: The alleged benefits and costs of high frequency trading are
reviewed. Algorithm-based trading has led to heightened volatility in many of the world’s
markets and innumerable cases of market manipulation, such as front-running of orders by
large institutional players with computerised infrastructure advantages.
Recommendation #22: Lender’s mortgage insurance (LMI) is disallowed. The shifting of risk
to mortgage insurers is a form of private moral hazard providing banks with an incentive to
lend without considering the capacity to repay. LMI does not afford lenders any real
protection in a major crisis as these companies are often severely under-capitalised for the
sizeable real estate risks they are insuring.
Recommendation #23: The RBA raises the interest rate. The current speculative housing
price booms in Sydney and Melbourne are amplified by the cuts to the cash rate in recent
times and thus should be reversed in an attempt to dampen speculation. This may provide
an incentive to many highly-leveraged and negatively-geared investors to offload their
properties and dissuade new entrants into the market. The knock-on effects of record low
interest rates also negate the ability of retirees, dependant on their cash savings, to spend
within the domestic economy. By sustaining housing price growth through lower interest
rates, the RBA has reduced incomes which will inevitably push more retirees onto the
pension as their bank accounts yield increasingly fewer returns.
47 IMF (2012: 12). Interestingly, economies of scale have not translated into lower financial
intermediation costs for consumers.
Home OwnershipSubmission 1
Page 42
LF Economics 2015
41
Section 7: Conclusion
Governments have worsened market inefficiencies by cynically enacting and maintaining
policies to inflate housing prices. The inertia regarding housing and tax reform is due to the
recognition from the first Rudd government onwards that the nation is in the midst of its
largest housing bubble on record. The tolerance of housing policies that maintain bubble-
inflated prices, ignore objective evidence, contradict the recommendations of earlier
inquiries and erode housing affordability are entirely predictable. Property ownership and
speculation has been elevated to the status of religion in Australia, compounded by a
perverse culture of homeowner entitlement driven by a degenerate taxation system that
penalises work and effort while rewarding unearned wealth and income.
This latest housing inquiry is a transparent political ploy to avert implementing a raft of
genuine policies that would impinge upon the government-supported ability of the FIRE
sector to siphon record-breaking profits from the economy and labour through the
extraction of economic rents, primarily usury and land rent. Given that very few, if any,
recommendations from previous inquiries have been implemented, there was little need to
hold the recent inquiry into the housing sector. There is no need, therefore, for this inquiry
to take place at all, especially considering it has been known since 1879 with the publication
of the world’s most popular economics book, Henry George’s Progress and Poverty, what
the most effective approach is in terms of efficiency and equity in dealing with the issues
that afflict Australia’s real estate market.
The Australian public would be far better served if an alternate inquiry were to be held that
investigated ways to democratise the clearly malfunctioning political system which
regressively only assists Australia’s army of private monopolists, usurers, speculators, rent
seekers, free riders, financial robber barons, control frauds, inheritors and indolent rich. It is
high time the nation’s politicians, political parties, public executives, top-level public
economists, regulators and bureaucrats have their power over policymaking significantly
restricted by and for the benefit of the public and common good. It is this self-interest that
has helped to perpetuate the largest debt-financed real estate bubble in Australia’s history.
Home OwnershipSubmission 1
Page 43
LF Economics 2015
42
Section 8: References
ATO. (2013). “Self-managed super funds”, Australian Tax Office, Canberra.
Bagnoli, Mark, Stephen W. Salant and Joseph E. Swierzbinski. (1989). “Durable-Goods
Monopoly with Discrete Demand”, The Journal of Political Economy, 97(6): 1459-1478.
Baker, Dean. (2002). “The Run-Up in Home Prices: Is it Real or Is it Another Bubble?”, Center
For Economic and Policy Research, Washington D.C.
Baker, Dean. (2011). “The Right to Rent Plan”, Center for Economic and Policy Research,
Washington D.C.
Belsky, Eric S. (2009). “Demographics, Markets, and the Future of Housing Demand”, Journal
of Housing Research, 18(2): 99-119.
Benes, Jaromir and Michael Kumhof. (2012). “The Chicago Plan Revisited,” IMF Working
Paper 12/202, International Monetary Fund, Washington D.C.
Bergmann, Barbara R. (2009). “The Economy and the Economics Profession: Both Need
Work”, Eastern Economic Journal, 35(1): 2-9.
Bezemer, Dirk J. (2009). “No One Saw This Coming: Understanding Financial Crisis Through
Accounting Models”, Munich Personal RePEc Archive, 16th June.
Bezemer, Dirk J. (2010). “Understanding financial crisis through accounting models”,
Accounting, Organizations and Society, 35(7): 676-688.
BIS. (2010). “An assessment of the long-term economic impact of stronger capital and
liquidity ratios”, Bank for International Settlements, Switzerland.
Home OwnershipSubmission 1
Page 44
LF Economics 2015
43
Blaug, Mark. (1998). “Disturbing Currents in Modern Economics”, Challenge, 41(3): 11-34.
Brown, Rayna, Rob Brown, Ian O’Connor, Gregory Schwann and Callum Scott. (2011). “The
Other Side of Housing Affordability: The User Cost of Housing in Australia”, The Economic
Record, 87(279): 558-574.
CNT. (2015). “H+T Affordability Index”, Center for Neighborhood Technology, United States.
Colander, David, Michael Goldberg, Armin Haas, Katarina Juselius, Alan Kirman, Thomas Lux
and Brigitte Sloth. (2009). “The Financial Crisis and the Systemic Failure of the Economics
Profession”, Critical Review, 21(2-3): 249-267.
Cox, Wendell and Hugh Pavletich. (2014). “10th Annual Demographia International Housing
Affordability Survey: 2014”, Demographia, Illinois.
David, Lindsay. (2015). Print: The Central Bankers Bubble. United States: CreateSpace
Independent Publishing Platform.
Davidoff, Ian and Andrew Leigh. (2013). “How Do Stamp Duties Affect the Housing
Market?”, Economic Record, 89(286): 396-410.
Egan, Paul D. and Philip Soos. (2014). Bubble Economics: Australian Land Speculation 1830 -
2013. UK: World Economics Association.
Fitzgerald, Karl. (2013). “Total Resource Rents of Australia”, Prosper Australia, Melbourne.
Foldvary, Fred. E. (1997). “The Business Cycle: A Georgist-Austrian Synthesis”, American
Journal of Economics and Sociology, 56(4): 521-541.
Gaffney, Mason and Fred Harrison. (2006). The Corruption of Economics. London: Shephead-
Walwyn.
Home OwnershipSubmission 1
Page 45
LF Economics 2015
44
Hargreaves, Bob. (2008). “What do rents tell us about house prices?”, International Journal
of Housing Markets and Analysis, 1(1): 7-18.
Harrison, Fred. (1983). The Power in the Land: Unemployment, the Profits Crisis and the Land
Speculator. New York: Universe Books.
Harrison, Fred. (2006). Ricardo’s Law: House Prices and the Great Tax Clawback Scam.
London: Shepheard-Walwyn Publishers.
Hartcher, Peter. (2005). Bubble Man: Alan Greenspan & The Missing 7 Trillion Dollars.
Melbourne, Victoria: Black Inc.
IMF. (2012). “Australia: Financial system stability report”, International Monetary Fund,
Washington D.C.
Kearns, Jonathan. (2012). “The Outlook for Dwelling Investment”, Address to the Australian
Business Economists’ Lunchtime Briefing, Reserve Bank of Australia, Sydney.
Keen, Steve. (2003). “Standing on the toes of pygmies: Why econophysics must be careful of
the economic foundations on which it builds”, Physica A, 324(1-2): 108-116.
Keen, Steve. (2011). Debunking Economics: The Naked Emperor Dethroned?, 2nd edition.
London: Zed Books.
Kelly, Jane-Frances. (2013). “Renovating housing policy”, Grattan Institute, Melbourne.
Kent, Christopher. (2013). “Recent Developments in the Australian Housing Market”,
Address to the Australian Institute of Building, Reserve Bank of Australia, Sydney.
McCauley, Joseph L. (2006). “Response to ‘Worrying Trends in Econophysics’”, Physica A,
371(2): 601-609.
Home OwnershipSubmission 1
Page 46
LF Economics 2015
45
McCauley, Joseph L. (2009). Dynamics of Markets: The New Financial Economics, 2nd edition.
New York: Cambridge University Press.
Minsky, Hyman. (1992). “The Financial Instability Hypothesis”, Working Paper No. 74,
Jerome Levy Economics Institute, Bard College, New York.
PC. (2004). “First Home Ownership”, Productivity Commission, Melbourne.
Pines, David. (1989). “Review on: E. S. Mills (Ed.), Handbook of Regional and Urban
Economics, Volume II: Urban Economics”, Regional Science and Urban Economics, 19(4):
646-658.
Ratajczak, Donald. (2006). “Is There a Housing Bubble?”, Journal of Financial Service
Professionals, 60(1): 39-44.
Riley, Don. (2001). Taken for a Ride. London: Centre for Land Policy Studies.
Rogers, Lamorna. (2013). “A new approach to macro-prudential policy for New Zealand”,
Reserve Bank of New Zealand Bulletin, 76(3): 12-22.
Scatigna, Michela, Robert Szemere and Kostas Tsatsaronis. (2014). “Residential property
price statistics across the globe”, BIS Quarterly Review, September: 61-76.
Senate. (2008). “A good house is hard to find: Housing affordability in Australia”, Select
Committee on Housing Affordability in Australia, Canberra.
Senate. (2015). “Out of reach? The Australian housing affordability challenge”, Senate
Economics References Committee, Canberra.
Shiller, Robert J. (2005). Irrational Exuberance, 2nd edition. New York: Broadway Books.
Home OwnershipSubmission 1
Page 47
LF Economics 2015
46
Stapledon, Nigel. (2012). “Trends and Cycles in Sydney and Melbourne House Prices From
1880 to 2011”, Australian Economic History Review, 52(3): 293-317.
Stiglitz, Joseph E. (1990). “Symposium on Bubbles”, The Journal of Economic Perspectives,
4(2): 13-18.
TAI. (2015). “Top Gears: How negative gearing and the capital gains tax discount benefit the
top 10 per cent and drive up house prices”, The Australia Institute, Canberra.
Talbott, John R. (2003). The Coming Crash in the Housing Market. United States: McGraw-
Hill.
Talbott, John R. (2006). Sell Now! The End of the Housing Bubble. New York: St. Martin’s
Press.
Titman, Sheridan. (1985). “Urban Land Prices Under Uncertainty”, The American Economic
Review, 75(3): 505-514.
Treasury. (2009). “Australia’s future tax system: Report to the Treasurer”, Part One
Overview, Australian Treasury, Canberra.
Tyson, Justin. (2014). “Reforming Tax Expenditures in Italy: What, Why, and How?”, Working
Paper 14/07, International Monetary Fund, Washington D.C.
USHUD. (2015). “Location Affordability Portal”, U.S. Department of Housing and Urban
Development, Washington D.C.
Wayne, James J. (2015). “Predicting Major Economic Events with Accuracy: A New
Framework for Scientific Macroeconomic Models”, American Journal of Economics and
Sociology, 74(2): 419-456.
Home OwnershipSubmission 1
Page 48
LF Economics 2015
47
Yates, Judith. (2009). “Tax expenditures and housing,” Australian Housing and Urban
Research Institute, Melbourne.
Yates, Judith. (2013). “Evaluating social and affordable housing reform in Australia: lessons
to be learned from history”, International Journal of Housing Policy, 13(2): 111-133.
Home OwnershipSubmission 1