First LGAD timing/jitter measurement at ELI with fs-lasers of 800 nm and 1450 nm Gordana Medin, University of Montenegro Gregor Kramberger, Jozef Stefan Institute in collaboration with people listed on the next page RD50 35 th Workshop, June 2020
Transcript
First LGAD timing/jitter measurement at ELI with fs-lasers of
800 nm and 1450 nm
Gordana Medin, University of Montenegro
Gregor Kramberger, Jozef Stefan Institute
in collaboration with people listed on the next page
RD50 35th Workshop, June 2020
Collaboration ELI Beamline, CZ – RP4 group (Application in Molecular, Bio-
medical and Material Science) and BIS groupMateusz Rebarz, Jakob Andreasson Tomáš Laštovička, Jakub Černý, Kamil Kropielniczki
Institute of Physics, Academy of Sciences, CZ Jiří Kroll, Michal Tomášek
University of Montenegro Gordana Medin
JSI Gregor Kramberger
INFN Torino Nicolo Cartiglia, Valentina Sola
Motivation
LGAD sensors (ATLAS HPK R4 Type1.1 samples for now)
fs-laser facility: ELI Beamlines (Dolní Břežany, CZ)
Collaboration with (Institute of Physics, CZ - assembly)
Femtosecond Laser based SPA-TCT and possibly TPA-TCT (?)
First measurements – understanding the potential of ELI for LGAD
studies
LGAD jitter study and SPA at 800 nm
Hunting for TPA LGAD at 1450 nm
Future steps
Conclusions
Outlook
Background/Motivation
Original motivation Timing and jitter measurements of LGADs with fs-lasers
Setting up infrastructure for future tests
Side-product Since ELI Beamlines provides suitable fs lasers with additional
equipment allowing to experiment with wavelength, power, etc.
TPA at 1450 nm (and 1750 nm, tunable wavelength)
Explore possible use of LGADs in laser/x-ray physics
LGAD samples (Unirradiated)
LGAD Samples (sent to ELI)Sensors FBK UFSD2 production, with different geometries and different design of the gain layer ( a detailed description of the
production in http://dx.doi.org/10.1016/j.nima.2018.07.060 (arXiv: 1802.03988)); not yet used; will be in the next tests; ATLAS/HGTD – HPK 35 microns (Type 1.1 singles)
The one we used in this research is produced in Ljubljana
Image taken fromhttps://cds.cern.ch/record/2653604/files/ATL-LARG-SLIDE-2019-005.pdf
A high bandwidth TransImpedance Amplifier (TIA)
is based on a differential amplifier with resistive
load and gain boost current sources, and a resistive feedback.
We used Particulars 35 dB
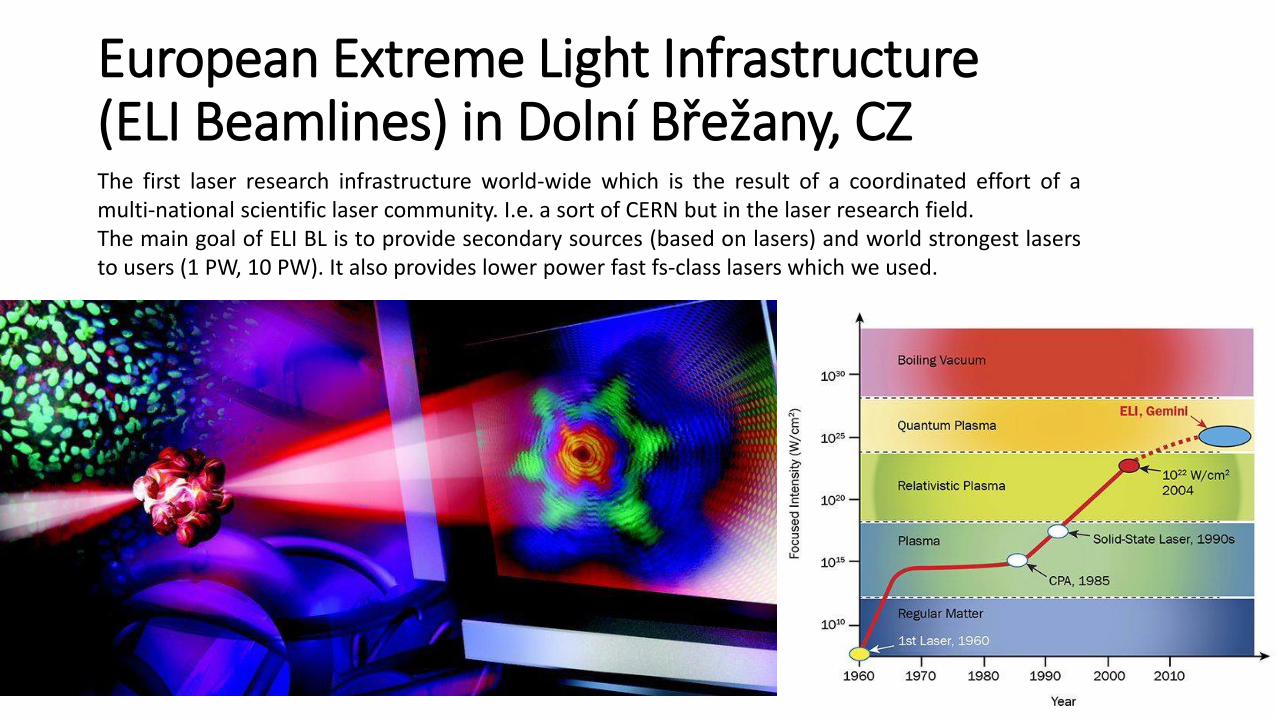
European Extreme Light Infrastructure (ELI Beamlines) in Dolní Břežany, CZThe first laser research infrastructure world-wide which is the result of a coordinated effort of amulti-national scientific laser community. I.e. a sort of CERN but in the laser research field.The main goal of ELI BL is to provide secondary sources (based on lasers) and world strongest lasersto users (1 PW, 10 PW). It also provides lower power fast fs-class lasers which we used.
ELI Beamlines
RP4 Research Programme (special thanks Mateusz Rebarz) - we could use
their new fs-laser and got some first signal from LGAD.
The laser system is 1 kHz 35 fs system with fundamental wavelength 800 nm.
Using Optical Parametric Amplifier (OPA) system Topas Prime one can easily
alter the wavelength and generate wavelengths above 1100 nm. Thus one canswitch between the two beams using a removable mirror:
Fundamental wavelength of laser 800 nm (removable mirror is “out” and OPA output is blocked). This wavelength has horizontal polarization and 1 % power stability. We estimate 50-60 fs pulse length on target (corresponds to 15 mm).
Wavelength > 1100 nm generated by OPA (then removable mirror is “in” and fundamental wavelength is blocked). This wavelength has vertical polarization.
Set-up for LGAD timing (SPA) & for LGAD TPA
The main advantages of OPA are:Scalability to high power levelsTunability of broadband amplification bandwidth and wavelengthHigh amplification gain over a short distanceGood temporal contrast in the signal beamSmall heat load of the nonlinear medium, since the excess energy
The 2nd beam splitter: this is 50/50 splitter and both beams have identical polarization and nearly the same intensity; it is broadband splitter and works for all tested wavelengths.
Optical Set-up Scheme
“Disadvantage:” The problem with OPA is that it always contains a bit of residual fundamental beam (800 nm). To reject it we use bandpass filters for 1450 nm. The filter should reject 99.999% of residual 800 nm but this transmitted 0.001% can be still enough to be detected because LGAD detector is extremely sensitive. This can be improved.
More on the parameters of the setup
Repetition rate: 1 kHz (power 1 mW means energy 1 uJ/pulse) The repetition rate also implies a high speed in data acquisition.
We used 0.4 nW @ 800 nm (not all deposited onto the chip); with this we saw about 100 mV amplitude straight from the 1st stage amplifier, from the board.
The first tests with non-focused 3 mm beam, the last test with beam focused to 50 umWe used -150V bias voltage.
Close to full depletion of the sensors
Very high gain of 70
At the time only room temperature operation is possible – in the future cold
operation is foreseen.
Optical Parametric Amplifier TOPAS Prime and two table-top fs-lasers (Legend and Hidra) in BioLab
Jakub designed and 3D printed a better holder for the LGAD readout board.
Mateusz and Jakub: hunting for LGAD signal during the epidemy of coronavirus.
First LGAD signal, without 2nd stage amplification
First measurement, delay line included, 2nd amp stage included
The first plot after beam splitting.
2nd stage amplifier in place –the two pulses correspond to split pulse.
Delay line approximately set to generate delay of about 8 ns.
Note: 2nd state amplifier is
linear to some 700 mV and
from there on it starts to
saturate. Is visible we went
already in the saturation in
this plot.
First Jitter Measurement: SPA at 800 nm
Second pulse used to measure the jitter
First pulse used to trigger
Bias = -170VJitter 6.60 psVoltage p-p 750mv
Bias -150VJitter 7.8 psSecond pulse, zoomed
Jitter: 6.6 - 7.8 ps
Beam power: 0.5 nW
beam 4mm2
Power - below 1nWTemp 22.4 CJumping amplitude up to 25 mV Noise jumping cca 11mV
Timing Jitter Vs. Bias Voltage
With the increase of bias voltage, jitters of both sensors become better, as expected.
This is the consequence of the fact that the electrical field in sensor volume is stronger and the gain is higher.
Also, the velocity of carriers becomes saturated with higher bias, and contribution of distortion to the time resolution is reduced.
Signal Amplitude Dependence on the Laser Intensity
Clear feature of the Single Photon Absorption at the laser wavelength of 800 nm.
Two-Photon Absorption
Theoretically predicted in 1931 by Maria Goppert Mayer in her Ph.D. thesis at Göttingen
Experimentally observed in CaF2:Eu2+ by Kaiser and Garret at Bell Labs in 1961
The First Test Conducted With 1450 nm
The opening in the sensor where our
laser should shoot is 100 x 100 um2
indicated in the plot as “TCT
opening”.
As it can be seen from the beam
profile the beam is wider (3mm).
This means that part of the sensor
close to guard rings (between guard
ring and a pad) is also illuminated
and part of the signal can come from
there. That region is without internal gain and getting the signal from
both, guard region and gain layer, makes analysis complicated
Learned lesson:Beam size too wide - 3mm2
No obvious quadratic dependence on power is visible, but linear – residuals of 800 nm due to its large absorption coefficient in Si
99.999% of 1450 nm & 0.001% of 800 nm
1st Signal Amplitude vs. Laser Intensity Scan
TCT Opening
Second attempt/ adjustment to more narrow beam spot: 50 µm
Paramount importance for TPA– Good Beam Focus
camera with
microscopic lens
focusing parabola
The laser spot is still far from optimal (yellow arrow), so the further improvements are necessary.
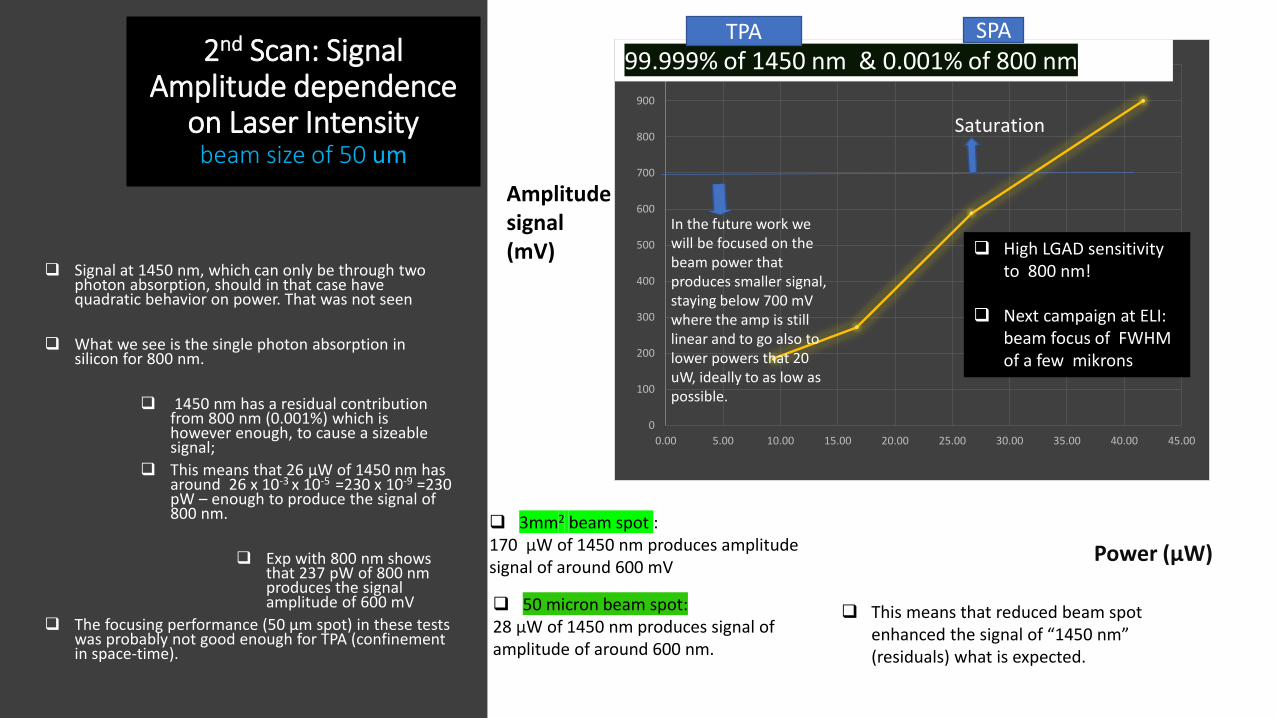
2nd Scan: Signal Amplitude dependence
on Laser Intensitybeam size of 50 um
Signal at 1450 nm, which can only be through two photon absorption, should in that case have quadratic behavior on power. That was not seen
What we see is the single photon absorption in silicon for 800 nm.
1450 nm has a residual contribution from 800 nm (0.001%) which is however enough, to cause a sizeable signal;
This means that 26 μW of 1450 nm has around 26 x 10-3 x 10-5 =230 x 10-9 =230 pW – enough to produce the signal of 800 nm.
Exp with 800 nm shows that 237 pW of 800 nm produces the signal amplitude of 600 mV
The focusing performance (50 µm spot) in these tests was probably not good enough for TPA (confinement in space-time).
3mm2 beam spot : 170 μW of 1450 nm produces amplitude signal of around 600 mV
50 micron beam spot:28 μW of 1450 nm produces signal of amplitude of around 600 nm.
This means that reduced beam spot enhanced the signal of “1450 nm” (residuals) what is expected.
In the future work we will be focused on the beam power that produces smaller signal, staying below 700 mV where the amp is still linear and to go also to lower powers that 20 uW, ideally to as low as possible.
High LGAD sensitivity to 800 nm!
Next campaign at ELI: beam focus of FWHM of a few mikrons
TPA SPA
I(r,z,t) – Laser Beam Irradiance PE – Laser pulse energy A(r,z) – area r(z) – Beam radius (spot size) Δτ – pulse width
Qdep(…) ∼ I2(…)
I(r,z,t)=𝑷𝑬
𝑨 𝒓,𝒛 ∗𝜟𝝉
Qdep ~ (PE)2
Qdep ~ 1/ τ2
Qdep ~ 1/r4
So, where does it leave us?
We need TPA dosimetry for LGAD!
Further steps:
Purity of the wavelength A new filter to be used to fully reject residuals in addition, polarizer can help to reject 800 nm because it has a
different polarization.
Selection of the wavelength The choice of 1450 nm was determined by the availability of the
filters at the time of tests. In principle, we can use 1530-1570 nm band if we find the proper
filters.
Focal spot size To control better what part of detector is actually illuminated we also need proper
focusing optics and microscope to clearly see what part of the detector we illuminate. In our first tests this aspect was controlled only partially.
We tried to keep the spot in the middle of the chip but it was difficult to precisely control the position with the microscope we had. There is a space for improvement in this aspect.
Pulse duration This is probably not a big problem. Our native pulses have 35 fs (about 10 µm length)
but they go through a few mm of optics so they are stretched (chirped). It’s possible to slightly improve the compression of the pulse on the detector to
increase probability of multiphoton process.
Study of mortality of the irradiated sensors at high pulses
The fact that we can create lots of e-h pairs very fast makes our setup ideal to
study mortality of the irradiated sensors at high pulses. At very high bias voltages
ATLAS/HGTD detectors break down sooner at test beam than in the 90Sr test
bench
The standard lasers are not fast enough to create so highly dense ionization
both in time and space while ELI’s is (e-h generation of the same speed as
for particles, pulse energy can be increased to hundreds M e-h/pulse even
higher than fragments of inelastic nuclear collisions that can be a reason)
The setup presented here is able to tune/change the wavelength (to a certain
extent) and by that the penetration depth too.
Gain layer profiling with TPA and understanding the changes after irradiations.
Impact ionization measurements (possible generation close to the edge of gain
layer).
Understanding acceptor removal.
TPA and SPA studies of inter-pad region – understanding the edge effects
More to come ..
Main messages
In collaboration with ELI teams we conducted preliminary research on LGAD timing and TPA/SPA contributions.
The first results are optimistic. We see a clear and reasonable signal with 800 nm, the laser intensity is stable to 1%,
it can be used to study timing properties of LGADs, fast data acquisition due to 1kHz rate.
We should be able to observe TPAs although this was not confirmed yet. Ideas to follow in both timing measurements with SAP, TPAs and also other. Official user call application to ELI for an experimental campaign – either as an open
call or as friendly-users. Campaign = a couple of weeks of devoted beam time (rather than continuous long term laser availability).
Ultrafast Optical
spectroscopy
HARD X-ray
applications
SOFT X-ray
applications
Future campaign locations: Experimental Hall E1 or BioLab
Acknowledgment
Special thanks to Jakob Andreasson from ELI Beamlines, CZ – RP4group for providing us with fs-laser and a space in their lab that allowed us to perform this experiment.