Li-Ion Cell Operation at Low TemperaturesYan Ji,∗ Yancheng Zhang,∗∗ and Chao-Yang Wang∗∗,z
Electrochemical Engine Center (ECEC) and Department of Mechanical and Nuclear Engineering, The PennsylvaniaState University, University Park, Pennsylvania 16802, USA
Manuscript submitted December 18, 2012; revised manuscript received January 22, 2013. Published February 13, 2013.
Increases in gasoline price and greenhouse gas emissions havespurred the growth of hybrid electric vehicles (HEV) and pure electricvehicles (EVs). Rechargeable Li-ion batteries are the leading candi-date for these vehicles due to their high energy and power densityrelative to other battery chemistries. A large market penetration ofHEVs and EVs requires overcoming a series of technical barriers forLi-ion batteries. One issue is significantly reduced energy and powerdensities at low temperatures.1 For plug-in HEVs, batteries are re-quired to function under unassisted operation, charge at −30◦C, andsurvive at −46◦C. For power assist HEVs, batteries should be ableto deliver 5 kW cold-cranking power (three 2-s pulses, 10-s restsbetween) at −30◦C.2
Much work has been conducted to improve performance and un-derstand the rate-limiting factors of Li-ion batteries at low tempera-tures. Due to the high freezing points of widely used carbonate-basedsolvents (EC, DMC), a prevalent area of research is to seek elec-trolytes with lower freezing point and higher conductivity. With theuse of solvent blends, co-solvent, novel electrolyte salts and electrolyteadditives, the Li-ion cells are able to survive and even show goodperformance down to −60◦C.3–8 At the same time, electrochemicaltechniques are employed to examine cell resistances. Electrochemicalimpedance spectroscopy (EIS) is popular because of its ability to sep-arate cell impedances according to their rate constants.9–13 Analysisof EIS data shows the dominance of charge-transfer resistance at sub-zero temperature, due to its high activation energy.14–16 In addition,investigations on graphite anode found considerable loss of lithia-tion capacity below −20◦C. Cell limitations might also arise from thesubstantially lowered Li diffusivity in the graphite active material.17–22
It is generally believed that the poor performance of Li-ion cellsat low temperatures are associated with: poor electrolyte conductiv-ity, sluggish kinetics of charge transfer, increased resistance of solidelectrolyte interphase (SEI), and slow Li diffusion through the surfacelayers and through the bulk of active material particles. Based on thisunderstanding, extensive work is carried out to boost performancegenerally in two ways: (1) to modify interfacial property to reduce thehigh activation energy of charge-transfer kinetics and SEI resistance,by surface coating23–25 or changing electrolyte composition;3,6,8,26,27
and (2) to increase interfacial area by using nanostructured electrodesor different electrode morphology.14,15,28,29
Until now, investigations of low-temperature behaviors of Li-ioncells have been limited to experimental measurements and obser-vations. A basic understanding of cell behavior is absent, due tothe inherent limitations of available experimental techniques. For
∗Electrochemical Society Student Member.∗∗Electrochemical Society Active Member.
instance, the prevailing electrochemical techniques include electro-chemical impedance spectroscopy (EIS), direct current (DC) polar-ization and cyclic voltammetry (CV). All of these measurements areconducted in the vicinity of equilibrium states, where large concentra-tion polarizations in the electrolyte and solid particles have not beenestablished. In contrast, large concentration polarizations exist duringcell operation at high rates or low temperatures. These polarizationswould induce very different cell behaviors, when electrochemical pro-cesses are coupled with the concentration dependence of equilibriumpotential, ionic conductivity, salt diffusivity and solid state diffusivity.
Moreover, Li-ion cell operation at low temperatures is inherentlylinked to thermal effects, where internal heat generation is significantdue to greatly increased cell resistance and very strong dependency ofkinetic and transport properties on temperature in the subzero range.For instance, a tenfold increase in resistance relative to room tem-perature has been measured in commercial cells at −20◦C.13 Suchinteractions between electrochemical and thermal dynamics in Li-ioncells have not heretofore been explored in the literature.
In tandem with experimental studies, fundamental modeling basedon concentrated solution theory and the technique of volume av-eraging for porous electrodes was pioneered by Newman and hisco-workers30–32 in early 1990s and widely used in the subsequent lit-erature. In 2000 Gu and Wang33 proposed an electrochemical-thermal(ECT) fully coupled framework able to simultaneously predict bat-tery electrochemical and thermal behaviors. Song and Evans34 alsoattempted the modeling of lithium polymer batteries by solving elec-trochemical and thermal equations simultaneously, although onlyelectrolyte conductivity and salt diffusivity are considered as func-tions of temperature. In 2003 Srinivasan and Wang35 incorporated allrelevant kinetic and transport properties as dependences on tempera-ture, as well as the state of charge (SOC) dependence of entropic heat.In 2008 Kumaresan et al.36 updated the temperature and concentra-tion dependence of electrolyte properties obtained from recent exper-imental data. However, the model is validated only at low dischargerates (no larger than 1 C) from 15◦C to 45◦C, where electrochemical-thermal coupling is insignificant. Recently, due to the revived interestin large-format batteries, their modules and packs for electric and hy-brid vehicles, ECT modeling of Li-ion batteries in multi-dimensionswas exercised by Gerver et al.,37 Kim et al.,38 and Luo and Wang.39
Despite the decade-long progress in ECT models,34–46 no mod-eling study of Li-ion performance at subzero temperatures has beenattempted. In particular, there has been no exploration of cell per-formance in the presence of remarkable temperature rise that natu-rally occurs in Li-ion cell usage at low temperatures. The overrid-ing objective of the present work is to explore the basic nature ofLi-ion cell operation at low temperatures, both experimentally andnumerically.
To explore the strong interplay between electrochemical and ther-mal dynamics, 18650 cylindrical cells of 2.2Ah are used in the presentstudy. These cells consist of LiNi1/3Mn1/3Co1/3O2 (NCM) cathode andgraphite anode, have a nominal capacity of 2.2Ah, ∼600 cm2 elec-trode area and 50 cm coating length, and weigh 44g. A list of designparameters for the test cells is given in Table I. Details of cell fab-rication have been extensively described in the literature, e.g. in theauthors’ own work,47 and thus are not repeated here.
Battery charge is performed at room temperature by a constantcurrent (0.7 C) followed by constant voltage (4.2V) protocol with1/20 C cutoff current. The cutoff voltage for discharge is 2.5V. ATenney Environmental Chamber (with Watlow Series 942 Controller)is used to provide constant temperature environment for all the tests.Thermocouples are used to measure the cell surface temperature,located midway along the length of the 18650 cells. In order forthe cell to reach thermal equilibrium before each charge or dischargeoperation, cells are kept for 4 h rest at each temperature except at25◦C, where 1 h rest is used.
Electrochemical-Thermal (ECT) Coupled Model
Applying the fully coupled electrochemical-thermal model of Guand Wang,33 the following conservation equations are solved:
Charge conservation in solid electrodes:
∇ · (σe f f
s ∇φs
) − j = 0 [1]
Charge conservation in electrolyte:
∇ ·(κe f f ∇φe + κ
e f fD ∇ ln ce
)+ j = 0 [2]
in which the effective diffusional ionic conductivity:
κe f fD = 2RT κe f f
F
(t+ − 1
) (1 + d ln f±
d ln ce
)[3]
Material conservation in electrolyte:
ε∂ce
∂t= ∇ · (
Def fe ∇ce
) + 1 − t+F
j [4]
Material conservation in solid particles:
∂cs
∂t= 1
r 2
∂
∂r
(Dsr
2 ∂cs
∂r
)[5]
with boundary condition on particle surface:
−Ds,i∂cs,i
∂r
∣∣∣∣r=Ri
= i
F[6]
Butler-Volmer equation for charge transfer kinetics:
i = i0
[exp
(αa F
RTη
)− exp
(−αc F
RTη
)][7]
in which the kinetic overpotential:
η = φs − φe − Ui (cs,i ) − i R f [8]
and exchange current density:
i0 = k (T ) cαcs,i c
αae (cs,max − cs,i )
αa [9]
Mapping between reaction current density on particle surface andvolumetric current density in the electrodes:
j = ai [10]
Energy conservation of the whole cell (lumped thermal model):
mcpdT
dt= Q + h As (T∞ − T ) [11]
where h is the convective heat transfer coefficient, As the cell surfacearea, h As (T∞ − T ) is the convective heat. The heat generation power:
Q = Ae
∫ L
0j (φs − φe − U ) + j
(T
dU
dT
)+ σe f f
s ∇φs · ∇φs
+ κe f f ∇φe · ∇φe + κe f fD ∇ ln ce · ∇φe dx [12]
in which L is the sum of the anode, separator and cathode thick-nesses, Ae is the electrode area, j(φs − φe − U ) represents kineticheat, j(T dU
dT ) is the reversible heat, σe f fs ∇φs · ∇φs , κe f f ∇φe · ∇φe
and κe f fD ∇ ln ce · ∇φe are joule heat from electronic resistance, ionic
resistance and concentration overpotential respectively.This ECT model is supplemented by the list of cell design pa-
rameters given in Table I, and the electrochemical and material prop-erties described in Appendix B as well as in Table II. In addition,thermal parameters also required by the ECT model are estimatedbelow. Numerical solutions of the present model over a very widerange of operating conditions, cell designs, and material properties,as presented in the following, are made possible by robust algorithms
Table II. Electrochemical Properties.
Properties Graphite (LixC6) LiyNi1/3Mn1/3Co1/3O2
Exchange current density i0 (A/m2) 1235 (x = 0.5) 2b (y = 0.5)Activation energy of i0 (kJ/mol) 6816 5016
Charge transfer coefficient αa αc 0.5 0.5a 0.5 0.5a
aassumed valuesbextracted from model-experimental comparison
A638 Journal of The Electrochemical Society, 160 (4) A636-A649 (2013)
Time (s)
T-
T∞
(K)
0 200 400 600 800100
101
102
-10°C 3C25°C 3C-20°C 1C25°C 1C
τ =317s
τ =330s
τ =299s
τ =340s
T - T∞ = e-t/ τ
Figure 1. Cell temperature evolution after current interruption for estimationof surface heat transfer coefficient.
offered in AutoLion, a commercial software package for analysesof electrochemical and thermal interactions of Li-ion batteries andsystems.
Estimation of thermal parameters.— In the present work, we ap-ply a lumped thermal model, assuming spatially uniform temperaturewithin the 18650 cell. Consequently, we eliminate the need for thermalconductivity in the cell; however, the heat capacity and heat transfercoefficient between the cell and ambient are still needed in the energybalance equation. An extensive literature survey found that the heatcapacity of 18650 cells falls in the range of 800 ∼ 1000J/(KgK);48,49
thus the value of 823J/(KgK)49 is selected in the presentstudy.
The external heat transfer coefficient, indicative of the cell cool-ing capability, can be measured by monitoring the cell temperatureevolution after interruption of the discharge current at cutoff volt-age. The heat of mixing during the relaxation process is small ifthe transport properties are sufficiently high.43 To minimize the ef-fect of heat mixing, cell data at room temperature and low C ratesis preferred. Cell data at other conditions are also collected to seetheir applicability. The energy balance during the relaxation is writtenas:
mcpdT
dt= h As(T∞ − T ) [13]
in which h is the convective heat transfer coefficient, As the cellsurface area, m the cell mass, and cp the specific heat. The solution tothis equation has a simple exponential form:
T − T∞ = e−t/τ [14]
where the characteristic cooling time τ = mcp/h As .The temperature evolutions after the interruption of current have
been analyzed using equation 14, as shown in Figure 1. The tempera-ture data are sampled at the end of 25◦C (1 C, 3 C) discharge, −10◦C(3 C) discharge and −20◦C (1 C) discharge respectively. The datafrom these four cases show a trend of straight lines in the logarithmplot, except for a few points at the beginning of the cooling process.Here, a much gentler decrease of temperature (especially after thelow temperature high rate discharge) is seen probably owing to theheat of mixing. Using the least-squares algorithm, curve fittings areperformed in the time range of 100s ∼ 600s to avoid the mixing effectat the beginning and larger error due to smaller temperature differ-ence at later times. As shown in Figure 1, the characteristic coolingtimes τ for the four cases are very close to each other. The averageτ value of 322s has been used as the initial guess to fit experimentaldata. It is found later that τ = 312s offers the best fitting result. The
Discharge Capacity (mAh)
Vo
ltag
e(V
)
Tem
per
atu
reIn
crea
se(°
C)
0 500 1000 1500 2000 25002
2.5
3
3.5
4
0
20
40
60
80
0.1C(0.22A)
1C(2.2A)3C(6.6A)
4.6C(10A)
discharge at 25 °Cmodelexperimental data
Figure 2. Validation A: C-rate effect for cell discharge from 25◦C.
corresponding heat transfer coefficient is 28.4W/(m2K), as calculatedby the given value of cell specific heat, mass and dimensions.
Model Validation
Model validation in the present work covers a wide range of C-rates and ambient temperatures, divided into three subgroups: (A) C-rate effect at room temperature, (B) temperature effect at a moderatedischarge rate, and (C) C-rate effect from a subzero temperature. Tofully delineate electrochemical performance that is strongly coupledwith thermal behaviors in low-temperature operation, both voltageand temperature curves are compared between model predictions andexperimental data.
Validation group A involves cells discharged at 0.1 C, 1 C, 3 Cand 4.6 C rates, starting from 25◦C. Cell voltage and temperature asa function of discharge capacity (or state of charge, SOC) are plottedin Figure 2, showing excellent agreement between model predictionsand experimental data in both voltage and temperature evolutions.As expected, the cell temperature rise is more significant at higherdischarge rate, due to a larger amount of heat generated from increasedvoltage loss. The cell discharge capacity, however, reduces minimallyeven at 4.6 C rate, owing to the increased temperature that enhanceselectrochemical kinetics and mass transport.
Validation B is intended to assess the temperature effect, wherecells are discharged at 1 C rate but start with different temperatures:45◦C, 25◦C, 0◦C, −10◦C and −20◦C, as shown in Figure 3. The agree-ment between model and experiment is also good, except for a slightover-prediction on voltage near the cutoff voltage for 0◦C and −10◦Ccases. Both cell voltage and capacity are lowered with the decrease
Discharge Capacity (mAh)
Vo
ltag
e(V
)
Tem
per
atu
reIn
crea
se(°
C)
0 500 1000 1500 2000 25002
2.5
3
3.5
4
0
20
40
601C (2.2A) discharge
modelexperimental data
45°C
25°C0°C
-10°C
-20°C
Figure 3. Validation B: Discharge with 1 C rate starting from varioustemperatures.
Journal of The Electrochemical Society, 160 (4) A636-A649 (2013) A639
Discharge Capacity (mAh)
Vo
ltag
e(V
)
Tem
per
atu
reIn
crea
se(°
C)
0 500 1000 1500 2000 25001.5
2
2.5
3
3.5
0
20
40
60
80
100discharge at -10 °C
modelexperimental data
4.6C
1C(2.2A)
2C
3C
Figure 4. Validation C: C-rate effect for cell discharge from −10◦C.
of temperature, especially at subzero temperatures. Accordingly, celltemperature rise is more marked at a lower ambient temperature dueto higher cell resistance and larger voltage loss.
Validation C is used to study the rate effect at subzero temperatures.−10◦C is selected as the ambient temperature since it is representativeof a subzero temperature in automotive applications and at the sametime is still capable of delivering reasonably high rate performance.The cell is subjected to discharge at 1 C, 2 C, 3 C and 4.6 C rates, asshown in Figure 4. Model predictions match well with experimentaldata at 1 C and 2 C rates, despite a little voltage over prediction nearcutoff voltage. At 3 C rate, the deviation in cell voltage develops after500 mAh discharge capacity. Experimental data shows more rapidvoltage decay after rebound to 3.22 V, resulting in 1/3 lower cell ca-pacity than model prediction. At 4.6 C rate, the discrepancy in cellvoltage starts earlier, at ∼250 mAh discharge capacity, where a mildvoltage rebound is observed experimentally. After that, the predictedcell voltage rebounds more significantly than the experimental data,leading to large deviation in discharge capacity. Both 3 C and 4.6 Ccases show strong interaction of cell electrochemical and thermal dy-namics, as demonstrated by voltage recovery and marked temperaturerise in low-temperature operation.
We hypothesize that the large discrepancy between the predictedand measured voltage curves shown in Figure 4 is caused by extremelyhigh sensitivity of cell performance at sub-freezing temperatures tooperating conditions, cell design parameters, and material properties,as to be shown later. Because of such high sensitivity, any spatiallynon-uniform temperature field existing in a 18650 cylindrical cellmay dramatically impact the cell’s discharge characteristics. Work isunderway to explore this hypothesis by setting up a three-dimensionalmodel with full electrochemical and thermal coupling and results willappear in a future publication.
In addition to cell discharge behaviors, validation is also performedduring charge operation. Cells are charged at 25◦C with the CC-CV protocol described in the experimental section. A comparisonbetween the model predictions and experimental data is also madefor this charge process, as shown in Figure 5. Good agreement isseen in cell voltage, current, capacity, and temperature. Over 90%SOC is completed during the CC period, which takes about 78% ofthe total charge time, indicating good charge performance. Despitesmall temperature rise in this case, good agreement is seen for thetemperature curve, implying reliable material properties used, suchas electrolyte conductivity and reversible entropic heat, which aredominant factors during low-rate charge.
In summary, the present ECT model provides good prediction forrate effects at room temperature (4.6 C or higher), and temperatureeffects (ranging from −20◦C to 45◦C) at moderate rates (1 C ∼ 2 C).For very high-rate operation at very low temperatures, there still existsdiscrepancy between model and experiment, which is a research topiccurrently under investigation.
Time (hour)
Vo
ltag
e(V
)
Cu
rren
t(A
),C
apac
ity
(Ah
)
Tem
per
atu
re(°
C)
0 0.5 1 1.5 22.5
3
3.5
4
4.5
5
0
0.5
1
1.5
2
2.5
25
26
27
28
29
30
experimental datamodel
Voltage
Current
Capacity
Temperature
CCCV charge at 25 °C0.7C(1.5A), 4.2V max. 0.11A cut-off
Figure 5. Validation of CC-CV charge at 25◦C.
Analysis of Low-Temperature Characteristics
In this section, we use the experimentally validated ECT modelto explore low-temperature cell behaviors, specifically in terms ofvoltage loss and heat generation.
One can divide the cell voltage loss into those due to: (1) electricalresistance in electrodes �Vs , (2) charge transfer kinetics on the activematerial-electrolyte interface �Vk , (3) ionic resistance and concen-tration polarization in electrolyte �Ve, (4) concentration polarizationinside active material particles �Vp , as well as (5) electrical resistancefrom the imperfect contact of electrodes, current collectors and tabs�Vc. Mathematical definitions of these individual voltage losses aregiven in Appendix A. In according with these voltage losses, eacharea-specific resistance is defined by dividing the voltage drop by theoperational current:
Ri = �Vi
IAe [15]
Cell behaviors are analyzed for C-rate and thermal effects, respec-tively. The rate effect is examined by comparing the cell resistance atan infinitely small discharge rate with that at higher discharge rate as-suming no temperature rise, i.e. under the isothermal condition whichcan be simulated by setting an infinitely large heat transfer coefficientbetween the cell and the ambient. The dependence of resistance ondischarge rate would vanish if the cell were ohmically controlled. Thethermal effect is delineated by comparing the cell resistance at theisothermal condition with that at a convective heat transfer condition.The ambient temperatures of 25◦C and −20◦C are chosen to representroom-temperature and subzero performance, respectively.
Low rate resistances.— C/1000 rate (2.2 mA) is used to simulatelow rate discharge. At such low rate, electrolyte concentration po-larizations are negligible. The electrolyte becomes an ohmic resistorwhose resistance is determined by ionic conductivityκ and currenttransport length l:
Re = cl
κεp[16]
Regarding interfacial kinetics, low discharge rate implies smalloverpotential on particle interface, which allows using linear formof Butler-Volmer equation for interfacial kinetics with good approx-imation. Accordingly, the equivalent resistance for charge transfer isobtained:
Rk = 1
La
RT
i0(αa + αc)F[17]
where L is the electrode thickness, a is the specific surface area,i0 is the exchange current density, αa and αc are reaction transfercoefficient, R is the universal gas constant, T is the temperature, andF is the Faraday constant.
A640 Journal of The Electrochemical Society, 160 (4) A636-A649 (2013)
For solid-state diffusion inside active material particles, with thehelp of diffusion length concept,50 the lithiation/delithiation rate onthe particle surface is expressed as:
− Dscsi − cs
lD= I
a Ae L[18]
where Ds is the solid-state diffusivity, lD is the diffusion length equalto one fifth of particle radius rp at steady state,50 specific surfacearea a can be expressed as 3ε/rp . csi and c are interfacial Li-ionconcentration and average Li-ion concentration in the particles. Atlow discharge rate, the deviation of csi to cs is small. It is thereforesafe to use:
U (csi ) = U (cs) + dU
dcs(csi − cs) [19]
Combining equation 18, 19 gives cell resistance due to concentrationpolarization inside particles:
Rp = |U (csi ) − U (cs)|I
= dU
dcs
r 2p
15DεL[20]
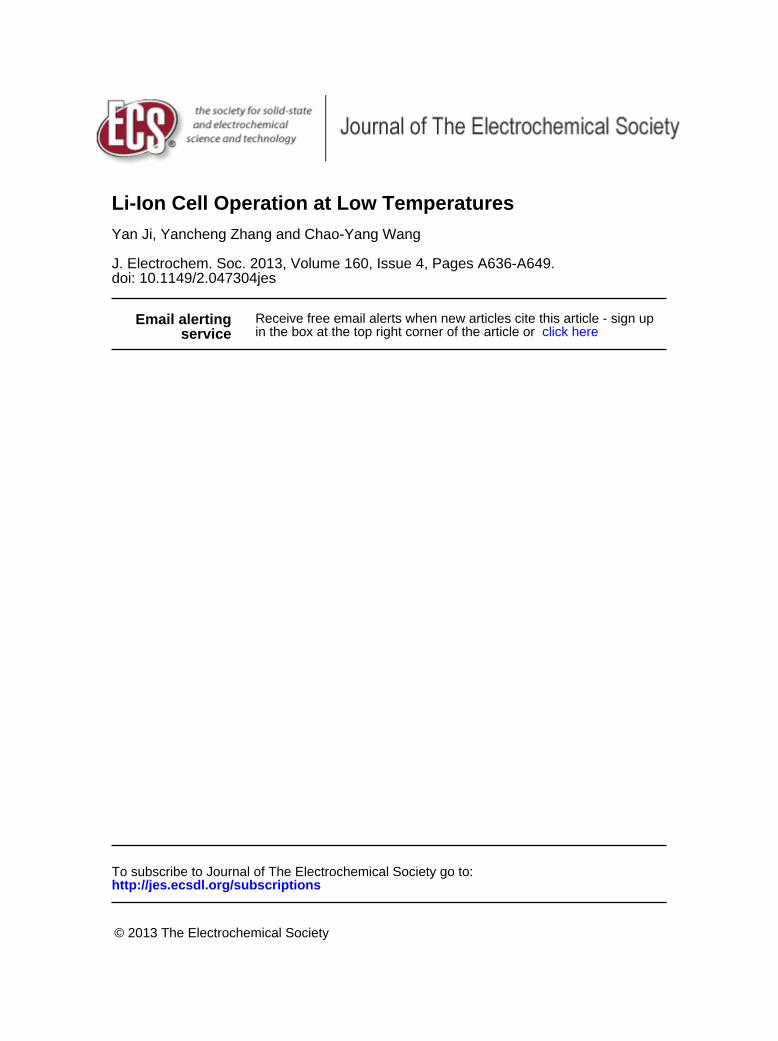
At 25◦C, cell resistances as a function of SOC during low rate dis-charge are shown in Figure 6a. As expected, the electrolyte acts as aresistor. Its resistance remains constant throughout discharge becauseof negligible electrolyte concentration polarization. The anode pos-sesses higher electrolyte resistance than the cathode, due to its lowerporosity (0.26 vs. 0.28) and larger thickness (81 μm vs. 77 μm). Themuch larger porosity (0.46) and smaller thickness (20 μm) of theseparator gives rise to lower electrolyte resistance. The combinationof electrolyte resistance from anode, cathode and separator, as wellas the contact resistance constitutes the bulk resistance of the cell,which is 28� cm2 according to the model prediction. The bulk resis-tance dominates at room temperature. The kinetic resistance, mainlyfrom the cathode, is low and varies with SOC due to the dependenceof exchange current density on SOC. The kinetic resistance reachesmaximum at discharged state. The above analysis on bulk and kineticresistance coincides with Zhang’s EIS study13 on 18650 cells at 20◦C.
At −20◦C resistances display different trends as shown inFigure 6b. Kinetic resistances are more than an order of magnitudehigher than room temperature and dominate all resistances. This isa result of the large kinetic activation energy, which is 68kJ/mol atthe graphite anode and ∼50kJ/mol at the NCM cathode accordingto the recent study of Jow et al.16 These two values are also used inthe present model. The activation energy for charge transfer kinet-ics is much higher than those characteristic of other electrochemicaland transport processes (∼30 kJ/mol for solid-state diffusion and 20kJ/mol for electrolyte properties). In contrast to low-rate discharge atroom temperature where anode kinetics are much faster than that ofthe cathode, at −20◦C the kinetics of the graphite anode and NCMcathode reach a similar level because of the higher activation energyof graphite. At even lower temperature, anode kinetics would be rate-limiting. These analytical results of the charge-transfer resistance arein a good agreement with Tafel polarization measurements by Smartet al.8 across a wide range of temperatures, as well as Zhang’s EISstudy13 on 18650 cells at −20◦C. From 25◦C to −20◦C, the elec-trolyte resistances experience seven times increases, from 22� cm2 to155� cm2. They are fairly constant throughout discharge, except fora little fluctuation inside the anode, which is due to the non-uniformreaction there. The reaction front generated at the anode-separatorinterface moves toward the anode current collector, thereby extend-ing the ionic current path. It seems that 1/1000 C discharge rate isinsufficient to eliminate all non-uniformities at −20◦C.
Additionally, our model predicts the resistance pertinent to theactive material particles, as described in equation 20. This resistance isthe combined effect of solid-phase diffusion and the variation of OCPwith Li+ concentration. In the entire SOC range, the anode particleresistance shows two peaks, which are closely related to the threeplateaus (85 mV, 120 mV and 210 mV) in graphite OCP.51 dU/dcs
values are fairly low in plateau regions, but become very large in thetransition regions between two adjacent plateaus. At the same time, the
uniform utilizations of graphite particles are expected at low dischargerates. The OCP influences are therefore superimposed by particles atdifferent electrode locations, allowing the averaged graphite particleresistance to exhibit three troughs and two peaks. In the same way,the much higher starting particle resistance of NCM cathode is dueto its large dU/dcs compared with the graphite anode at the samecell SOC, in spite of smaller particle radius and two times largersolid-state diffusivity. These ups and downs in particle resistance areinduced by thermodynamic OCP, and therefore are independent oftemperature. This is why similar profiles of particle resistances areobserved at both 25◦C and −20◦C, though with different magnitudesbecause of different solid state diffusivity at different temperatures.Both anode and cathode particle resistances increase rapidly at theend of discharge, due to the sharp change of voltage in graphite andNCM OCP curves at a discharged state. That of the anode increasesmore rapidly, implying anode-limited cell capacity.
The above simple analysis of low-rate resistances does not mini-mize its importance in description of the influence of thermodynamicand kinetic material properties on cell performance. The low dis-charge rate condition is a good approximation of equilibrium state,where large concentration polarizations and strong non-uniformitiesdo not exist. Non-linear behaviors are simplified by linear approxi-mation. Experimental analyzes, such as EIS, DC polarization and CV,are all performed close to cell’s equilibrium state. It is possible tocompare model prediction with electrochemical analysis data at/nearthis state.
High rate resistances.— During high-rate discharge, the large con-centration polarization combined with sluggish kinetics results instrong non-linear and non-ohmic behaviors. Cell resistances during4.6 C discharge at 25◦C are shown in Figure 6c. A comparison withFigure 6a shows 40% reduction of discharge capacity due to largeincrease of electrolyte resistance and particle resistance in the anode.Herein �U/�cs should be used in equation 20 instead of dU/dcs athigh rate discharge because of a large concentration polarization. Inaddition, the non-uniform active material utilization distribution im-plies a large variation of �U/�cs for particles at different locationswithin an electrode. Whenever an average is taken here, the influenceof OCP curve on particle resistance diminishes. As seen in Figure 6c,the anode particle resistance varies monotonically. Peaks and troughsthat are shown at low-rate discharge are no longer displayed here, dueto the dominant effect of solid phase diffusivity varying with SOC.The low value of dU/dcs in the graphite plateau regions does not helpto reduce the particle resistance during high-rate discharge. Instead,larger particle radius and smaller solid state diffusivity of graphitemakes the anode solid diffusion limited. The cell capacity is actuallydetermined by anode solid-state diffusion. As seen in Figure 6c, itis the anode solid particle resistance that has the most rapid increasebefore cutoff voltage is reached.
The electrolyte does not behave like a resistor during high-ratedischarge. The electrolyte resistance in both the anode and cathodekeeps increasing as discharge continues. The anode side increase ismore marked. Compared with low rate discharge, the lower startingvalue of electrolyte resistance is attributed to shorter ionic currenttransport path because most of the reaction current is initially gen-erated at locations close to the separator. To better explain the resis-tance increase, relevant electrolyte-parameter distributions along thecell thickness direction x at 2.5 V (just before cutoff) are shown inFigure 7. The voltage loss in the electrolyte is reflected by the decreaseof electrolyte potential φe along x direction. The anode φe producesthe largest potential drop, followed by cathode φe. The solution po-tential gradient can be expressed as:
− ∇φe = ie
κ+ κD
κ∇ ln ce [21]
which states that the electrolyte potential drop arises from two sources:ohmic loss and concentration overpotential. For ohmic loss, as ob-served in Figure 7, the ionic conductivity exhibits low values in bothanode and cathode, since Li+ ions accumulate in the anode electrolyte
Journal of The Electrochemical Society, 160 (4) A636-A649 (2013) A641
Discharge Capacity (mAh)
Are
a-sp
ecif
icre
sist
ance
(Ωcm
2 )
0 500 1000 1500 2000 25000
5
10
15
20AnodeSeparatorCathode
Electrolyte
Interfacial Kinetics
Solid Particle
Contact
0.001C rate discharge at 25°C
(a)
Discharge Capacity (mAh)
Are
a-sp
ecif
icre
sist
ance
( Ωcm
2 )
0 500 1000 1500 2000 25000
50
100
150
200
AnodeSeparatorCathode
Electrolyte
Interfacial Kinetics
Solid Particle
Contact
0.001C rate discharge at -20°C
(b)
Discharge Capacity (mAh)
Are
a-sp
ecif
icre
sist
ance
(Ωcm
2 )
0 500 1000 1500 2000 25000
5
10
15
20AnodeSeparatorCathode
Electrolyte
Interfacial Kinetics
Solid Particle
Contact
4.6C rate discharge at 25°Cisothermal
(c)
Discharge Capacity (mAh)
Are
a-sp
ecif
icre
sist
ance
(Ωcm
2 )
0 50 100 150 2000
50
100
150
200AnodeSeparatorCathode
Electrolyte
Interfacial Kinetics
Solid Particle
Contact
1C rate discharge at -20°C
(d)
isothermal
Discharge Capacity (mAh)
Are
a-sp
ecif
icre
sist
ance
(Ωcm
2 )
0 500 1000 1500 2000 25000
5
10
15
20AnodeSeparatorCathode
Electrolyte
Interfacial Kinetics
Solid Particle
Contact
4.6C rate discharge at 25°CNonisothermal
(e)
Discharge Capacity (mAh)
Are
a-sp
ecif
icre
sist
ance
(Ωcm
2 )
0 500 1000 1500 2000 25000
50
100
150
200AnodeSeparatorCathode
Electrolyte
Interfacial Kinetics
Solid Particle
Contact
1C rate discharge at -20°C
(f)
Nonisothermal
Figure 6. Cell resistance analysis at 25◦C and −20◦C.
(deintercalation from graphite particles) and are consumed in the cath-ode electrolyte (intercalation to NCM particles), both of which resultin departures from the optimal concentration where maximum ionicconductivity is reached. In addition to the decreased ionic conduc-tivity, concentration overpotential due to relatively large diffusionalionic conductivity in the anode aggravates the potential loss there.This diffusional ionic current is going in the reverse direction, thuslarger electrolyte potential gradient is needed in the anode to balancethis reverse current. The large diffusional ionic current is caused bythe increased thermodynamic factor (1 − t+) (1 + d ln f±/d ln ce) thatcontributes to higher diffusional ionic conductivity. d ln f±/d ln ce isan indication of short-range ion-solvent interactions, which can beignored in dilute solutions, but may become dominant in high con-
centrated (>2.5mol/L) solutions.52 As is observed in Figure 7, theelectrolyte concentration ce at the anode current collector reaches3.6mol/L or three times the optimal level. This high concentration, onone hand, is due to the large Li-ion accumulation rate generated byhigh-rate discharge. On the other hand, it leads to the decreased saltdiffusivity, which in turn increases the concentration gradient. Thispositive feedback between the salt diffusivity and electrolyte concen-tration induces an instability that might lead to cell shutdown if athreshold concentration is exceeded.
At −20◦C, 1 C rate is used to study high rate resistances at subzerotemperatures. During isothermal discharge, the cell voltage decreasesquickly and reaches cutoff voltage at 140 mAh, which is only 6% ofthe room temperature capacity. The capacity loss is due to the large
A642 Journal of The Electrochemical Society, 160 (4) A636-A649 (2013)
x (μm)
c e(m
ol/L
),κ
(S/m
)
φ e(V
)
De
(10-1
0 m2 /s
)
0 50 100 1500
1
2
3
4
-1.4
-1.2
-1
-0.8
-0.6
-0.4
-0.2
0
0
2
4
6
8Anode Separator Cathode
ce
De
κ
-κD
φe
4.6C isothermal discharge at 25 °Cat 2.5V cell voltage
Figure 7. Electrolyte parameter distributions at the cutoff voltage of 4.6 Cdischarge at 25◦C.
electrolyte resistance increase in the anode as shown in Figure 6d.To understand this, electrolyte parameter distributions at cell’s cutoffvoltage (2.5 V) are plotted in Figure 8. A steep drop in the elec-trolyte potential (∼0.9 V) occurs in the anode region close to theseparator. The potential drop partially arises from the sharp decreaseof ionic conductivity (by an order of magnitude), due to the ele-vated local concentration. Based on electrolyte property data fromexperiments,52 at −20◦C temperature, the electrolyte ionic conductiv-ity is lowered significantly over a threshold concentration (3 mol/L).Careful examination of the concentration profile reveals that the elec-trolyte concentration exceeds 3 mol/L in the region where electrolytepotential drops significantly. On the other hand, part of the potentialloss is contributed by concentration overpotential, due to the largevalue of κD/κ in concentrated solution, according to equation 21.
The electrolyte concentration drops rapidly in the cathode. At thecathode current collector interface, the electrolyte concentration re-duces to depletion level (0.002 mol/L), which induces a large concen-tration gradient in the cathode, implying possible large concentrationoverpotential. However, κD/κ is small in this dilute solution. Thuspotential loss from concentration polarization is limited. The ionicconductivity is also very low in dilute solutions, as seen in Figure 8.The ionic conductivity at cathode current collector reduces to the samelevel as it is in the anode. However, the total ionic current is smallnear current collector. The relevant ohmic potential drop is thus notthat large as it is in the anode.
It is interesting to note a different kinetic resistance (around 60�cm2) during 1 C discharge compared to the resistance (180� cm2)during low (C/1000) rate discharge at −20◦C, although the exchangecurrent density remains the same without temperature change. Indeed,
x (μm)
c e(m
ol/L
),κ
(S/m
)
φ e(V
)
De
(m2 /s
)
0 50 100 15010-4
10-3
10-2
10-1
100
101
-1.6
-1.4
-1.2
-1
-0.8
-0.6
-0.4
-0.2
0
10-12
10-11
10-10
Anode Separator Cathode
ce
De
κ
-κD
φe
1C isothermal discharge at -20°Cat 2.5V cell voltage
Figure 8. Electrolyte parameter distributions at the cutoff voltage of 1 Cdischarge at −20◦C.
Discharge Capacity (mAh)Vo
lum
etri
ch
eati
ng
rate
(W/c
m3 )
0 500 1000 1500 2000 2500
-1
0
1
2
3 4.6C discharge at 25 °C
Joule
Reaction
Reversible
Convective
Contact
Figure 9. Heat generation during 4.6 C rate discharge starting from 25◦C.
the charge transfer kinetics for 1 C rate discharge falls in the Tafelregion, where the reaction current increases exponentially with over-potential, leading to lower kinetic resistance than that in linear region.Experimental investigations using EIS11,13,14,27 and dc polarizations3,27
are all performed using very small current as perturbations, where lin-ear kinetics are studied. However, at higher rates, the Tafel kineticsis in control. Thus, caution should be exercised in interpreting theseexperimental results for cell operation at high rates.
Electrochemical-thermal coupling.— The above analysis showslarge cell resistances when operating at high rates or low temperatures.It follows that heat generation from these resistances is significant andnon-negligible, potentially leading to substantial cell temperature riseunder practical heat-transfer conditions. The strong dependence ofthermodynamic, kinetic and transport properties on temperature, onthe other hand, provides feedback to cell performance due to tem-perature rise. In this way, electrochemical performance and thermalbehaviors are intimately coupled.
Consider cells discharged at 4.6 C rate from 25◦C with the thermaleffect fully accounted for. Figure 6e shows cell resistance evolutions atthis condition. Comparing with the isothermal condition (Figure 6c),the increase of electrolyte resistance and particle resistance slowsdown after ∼200 mAh discharge capacity with 10◦C temperature riseseen from Figure 2. The anode electrolyte resistance still increasesduring discharge, but much slower, as a result of cell warmup. Thecharge-transfer kinetic resistance keeps decreasing with temperaturerise due to its high activation energy. The anode particle resistance alsodecreases and its profile exhibit two small ups and downs, which arereflections of thermodynamic OCP characteristics, suggesting moreuniform active material utilization and low solid-state concentrationpolarization. Overall, the electrolyte resistance is dominating at roomtemperature, high-rate discharge with electrochemical-thermal cou-pling fully considered. The contact resistance comes next. The resis-tance trend is quite similar to that at extremely low rate dischargeshown in Figure 6a, where the electrolyte and contact resistance aredominating and staying at a constant level. From this point of view,with thermal effect considered at room temperature, the cell behaveslike an ohmic resistor because cell resistances are roughly independentof discharge rates.
Heat generation rates from various sources are plotted against dis-charge capacity in Figure 9. The definitions of these heat terms canbe found in equation 12. In according with resistance characteristics,joule heating and contact resistance heating are the primary heat gen-eration sources. The reversible entropic heat is negligible during thefirst 1500 mAh discharge capacity, but increases significantly whenapproaching the end of discharge, owing to the large value of dU/dTof graphite at fully discharged state. The convective heat is the heatdissipated by convective air cooling. Most of the heat generated isused to heat up the cell due to small heat dissipation rate.
Journal of The Electrochemical Society, 160 (4) A636-A649 (2013) A643
Discharge Capacity (mAh)Vo
lum
etri
ch
eati
ng
rate
(W/c
m3 )
0 500 1000 1500 2000 2500
-1
0
1
2
3 1C discharge at -20°C
JouleReaction
Reversible
Convective
Contact
Figure 10. Heat generation during 1 C rate discharge starting from −20◦C.
At −20◦C and 1 C discharge, various cell resistances and heatsources are plotted in Figure 6f and Figure 10, respectively, with ther-mal effect. Benefiting from cell self-heating, the discharge capacityincreased from 140 mAh at the isothermal condition to 1500 mAh.The capacity gain is mainly attributed to the suppression of anode elec-trolyte resistance due to higher ionic conductivity and salt diffusivityresulting from temperature rise. Despite large activation energy of ex-change current density, the kinetic resistances do not show significantdecrease with temperature increase, possibly because of the transitionfrom Tafel region to linear kinetics. The solid particle resistance inthe anode, however, increases continuously and induces large poten-tial drop after 1000 mAh discharge capacity, in spite of more than10◦C rise of cell temperature. With the transition from isothermalcondition to convective heat transfer condition, the cell limiting stepswitches from the anode electrolyte to the anode solid-state diffusion.
Heat generation in discharge from −20◦C (Figure 10) behaves dif-ferently from the room temperature case. Instead of the dominance ofohmic heating throughout the discharge process at room temperature,irreversible reaction heat contributes to most of heat generation for thefirst half for discharge starting at −20◦C, though joule heating takesover in the remainder of discharge. The contact heating and reversibleheating become negligible since they are small compared to otherresistances that increase drastically with lowering temperature.
At subzero temperatures the dependence of cell resistance on dis-charge rates is strong due to non-linear kinetics, large concentrationpolarizations in solid particles and electrolyte, in spite of cell self-heating. Figure 4 provides a visual look at the non-ohmic behaviorstarting at −10◦C. Unlike room temperature case, the discharge curvesat various rates are not similar.
Nonisothermal Ragone plot.— Cell discharge performance atother heat-transfer conditions is studied to explore the performancesensitivity to thermal conditions. Figure 11 and Figure 12 display cell1 C rate discharge performance at 0◦C and −20◦C, respectively. Fiveheat transfer conditions are simulated at each temperature, includingtwo extreme cases: adiabatic (i.e. h = 0) and isothermal (i.e. h→∞).At −20◦C, cell performance is highly sensitive to heat transfer coef-ficients. The cell capacity increaes from 140 to 2250 mAh when thethermal condition is switched from isothermal to adiabatic. At 0◦C,however, the difference becomes smaller. The temperature increasefrom 0◦C is also much smaller than it is from −20◦C due to smallerresistance. The low isothermal performance at −20◦C implies largecell resistance, and consequently stronger electrochemical-thermal in-teractions and larger performance boost, which is most significant atadiabatic condition. For instance, staring at −20◦C with adiabaticcondition, the cell is able to discharge most of its nominal capacity atroom temperature. For starting temperature higher than 0◦C, 1 C rateis not large enough to induce noticeable performance differences atvarious cooling conditions because of reduced cell resistances.
Discharge Capacity (mAh)
Vo
ltag
e(V
)
Tem
per
atu
re(°
C)
0 500 1000 1500 2000 25001.5
2
2.5
3
3.5
4
0
20
40
60
80
100
h=0 (adiabatic)h=14
heat transfer coefficienth: [W/m2K]
h=28h=56h=∞ (isothermal)
1C(2.2A) dischargestarting at 0°C
Figure 11. Cell performance at various cooling conditions (1 C dischargestarting from 0◦C).
The above investigation shows strong dependence of cell perfor-mance on thermal boundary condition at subzero temperatures. Hence,it is necessary to prescribe cell thermal parameters when evaluatingits performance at subzero temperature or during high-rate operation.The Ragone plot, defined as the specific energy vs. the specific power,is widely used for comparison of energy storage devices in terms ofenergy and power capabilities. However, when it is used for thermallycoupled batteries such as Li-ion cells, important cell self-heating effectis not included. In this study, we introduce a nonisothermal Ragoneplot to include thermal effects under normal heat-transfer conditions.We shall show that this nonisothermal plot is more relevant for Li-ioncells designed to operate at subzero temperatures.
To generate the nonisothermal Ragone plot, the present cell is dis-charged under constant power over a vast range of power values untila cutoff voltage of 2.5 V. The discharge energy is then calculated bytime integration of the power. To calculate specific energy and specificpower, the mass of the whole cell (44g) is used, including the jellyroll as well as can and other packaging masses. Model calculationsare performed at four different temperatures: 25◦C, 0◦C, −10◦C and−20◦C. At each temperature, an isothermal curve and a nonisothermalcurve under the experimental cooling conditions are plotted, as shownin Figure 13. As expected, with the increase of the specific power, thespecific energy decreases for all cases. At the isothermal condition, thedecrease in specific energy becomes prominent from 3 C rate at 25◦C,1 C rate at −10◦C and even lower rate at −20◦C. With the self-heatingeffect included, the decline points of the specific energy are largelydeferred. The nonisothermal Ragone plot suggests that starting from−20◦C or higher temperatures, the cell suffers no significant energy
Discharge Capacity (mAh)
Vo
ltag
e(V
)
Tem
per
atu
re(°
C)
0 500 1000 1500 2000 25001.5
2
2.5
3
3.5
4
-20
0
20
40
60
80
h=0 (adiabatic)
h=14
heat transfer coefficienth: [W/m2K]
h=28
h=56h=∞
isothermal
1C(2.2A) dischargestarting at -20°C
Figure 12. Cell performance at various cooling conditions (1 C dischargestarting from −20◦C).
A644 Journal of The Electrochemical Society, 160 (4) A636-A649 (2013)
Specific Power (W/Kg)
Sp
ecif
icE
ner
gy
(Wh
/ Kg
)
101 102 10310-1
100
101
102
-20°C
-10°C
0°C
25°C
Nonisothermal Ragone Plot
self heating (h=28W/mK)
isothermal (h =∞)
1h (1C)
1/ 3h (3C)
symbols: experimental data
Figure 13. Nonisothermal Ragone Plot.
loss provided that the cell is operated at 3 C rate and lower. This isa new insight for Li-ion cell operation at low temperatures. A salientfeature in the nonisothermal Ragone curve is a “power cliff”, overwhich a steep reduction in the specific energy is triggered. The cliffis a result of competitions between the voltage loss induced by highpower and the performance gain due to temperature increase from cellself-heating. The benefit from the thermal effect is small at low powerwhere the self-heating effect is negligible. It is also irrelevant at veryhigh power where fast voltage drop does not provide enough time toinduce meaningful temperature rise. Only at moderate to high powercould the electrochemical-thermal coupling provide significant booston cell energy-power capability.
Cell Optimization for Subzero Operation
The significantly reduced energy-power capability of Li-ion cellsat subzero temperatures has spurred research and development to im-prove cell performance in a variety of ways, including synthesizingnovel electrolytes and using nanoparticles and surface coating for ac-tive materials. However, there is a lack of basic understanding of howmuch performance boost may be expected from these measures. Thepresent study has found that the limiting mechanism at subzero tem-peratures depends on cell operation rates as well as thermal parametersincluding heat transfer to the ambient. Conventional electrochemicaltechniques are useful tools to characterize cell performance at lowrates or near equilibrium state, but may not be able to accuratelyrepresent cell operation at higher rates, where capture and precisecharacterization of strong non-ohmic behaviors and thermal effectsare beyond the scope of these tools. In this section, with the helpof the experimentally validated ECT model, we attempt to optimizelow-temperature cell performance.
Cell performance improvement at subzero temperatures can beachieved chiefly in three ways: developing new battery materials withdesired properties, optimizing cell design and fabrication parameters,and preheating cells with innovative heating strategies (i.e. systemapproaches). This section is focused on the first two methods, whileeffective heating strategies will be pursued in a separate publication.The optimization will be conducted by modeling the influence of avariety of design parameters and material properties on cell dischargebehavior separately. For each parameter or property investigation, thecell is subjected to discharge starting from −20◦C with 1 C rate usingtwo heat transfer settings (isothermal and self-heating), respectively.The isothermal condition represents cells with infinitely large coolingrate, which effectively eliminates any temperature rise in the cell. Theself-heating case describes a realistic heat-transfer condition wheresignificant temperature rise accompanies cell operation.
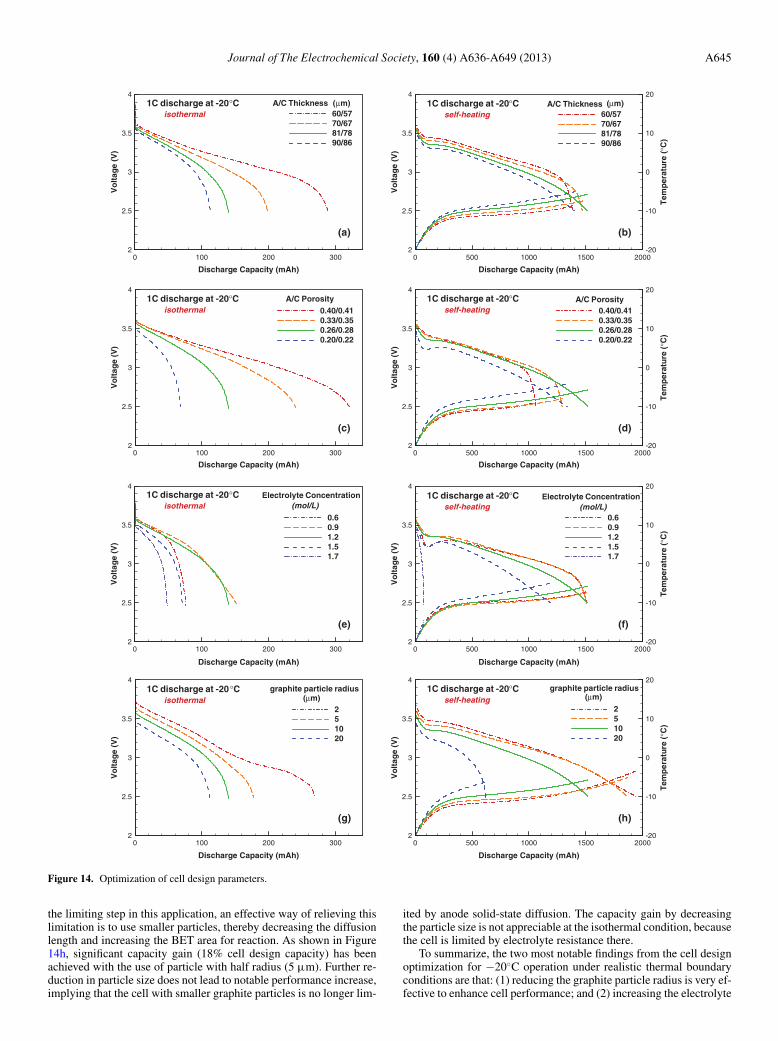
Design parameters.— For cell design optimization, we study influ-ences of the electrode thickness, electrode porosity, electrolyte con-centration, and particle size of active materials. The present 18650test cells are used as the baseline. For each parameter study, only oneparameter is varied around the baseline value while all other parame-ters remain at the baseline. Cell voltage and temperature curves as afunction of discharge capacity are displayed in Figure 14.
Figure 14a, 14b demonstrates optimization results on the electrodethickness. The anode thickness of 60 μm, 70 μm, 81 μm, 90 μm isused and the cathode thickness is adjusted accordingly to maintain the(negative to positive) NP ratio of 1.15. The thickness changes are re-alized by adjusting active material loading amount without changingelectrode porosities. Thinner electrodes demonstrate improved low-temperature performance at both isothermal and self-heating condi-tions. Physically, thinner electrodes imply shorter ionic current trans-port path and smaller current density due to enlarged electrode coatingarea, both of which are effective ways to reduce the voltage loss in theelectrolyte. Indeed, significant improvement due to thinner electrodesis seen at the isothermal condition (Figure 14a). However, the capacitygain from the thinner electrode design at the self-heating condition(Figure 14b) is negligible because solid-state diffusion in graphite isthe capacity-limiting step and is minimally affected by thinner elec-trodes. Finally, comparison of Figure 14a with Figure 14b clearlyindicates that it is quite misleading to optimize cell design parametersbased on isothermal electrochemical models for Li-ion cell operationat low temperatures.
Optimization of electrode porosities is shown in Figure 14c, 14d.The anode electrode porosity varies from 0.2 to 0.4 by changing ac-tive material loading amount, while electrode thicknesses are keptthe same, i.e. electrodes of varying loadings are calendared to thesame thickness. Large variations of cell performances are observed inFigure 14c. High porosity electrode leads to both increased voltageand capacity during isothermal discharge at −20◦C. The performancegain comes from the reduced effective electrolyte conductivity and saltdiffusivity, due to less torturous transport paths in porous electrodeswith larger void space. For the self-heating condition (Figure 14d),however, the cell capacity begins to decrease when electrode porosityis higher than the baseline case. This happens because cell capacityis limited by solid-state diffusion in graphite for the self-heating case.The specific surface area (BET area divided by the electrode vol-ume) for lithium intercalation is lowered when the void space volumeincreases, implying higher concentration polarization due to largerinterfacial flux. In addition, the cell capacity decreases because of lessactive material loaded at higher porosity. The cell capacity is moresensitive to electrode porosity than electrode thickness (20% capac-ity loss if anode porosity increases from 0.26 to 0.4). This capacityloss outweighs the voltage gain from increased electrolyte conductiv-ity and salt diffusivity. Again, the porosity optimization results differsharply between the isothermal and self-heating cases.
The idea of changing electrolyte concentration is prompted fromthe dependence of electrolyte conductivity and salt diffusivity on so-lution concentrations. For isothermal discharge at −20◦C, as analyzedin Figure 8, large electrolyte potential drop is induced by significantlyreduced conductivity and diffusivity at the location where electrolyteconcentration exceeds 3 mol/L. It is expected that using a dilute solu-tion, the decrease of electrolyte conductivity and salt diffusivity maybe avoided. The modeling result from Figure 14e, 14f does indicateslightly improved performance for concentration of 0.9 mol/L, forboth the isothermal and self-heating cases. However, more decreaseor increase in the solution concentration would lead to worse perfor-mance. For the 0.6 mol/L case, cell voltage keeps decreasing at theisothermal condition, and rebounds when self-heating is included. Forthe 1.7 mol/L case, the cell voltage fails to rebound at self-heating con-dition, where discharge capacity is substantially limited (<100 mAh).Overall, the optimized electrolyte concentration exists between 0.9and 1.2 mol/L. A relatively lower value is preferred whenever theanode electrolyte resistance is limiting, and vice versa.
The last design optimization aims to increase cell capacity underthe self-heating condition. Since solid-state diffusion in the anode is
Journal of The Electrochemical Society, 160 (4) A636-A649 (2013) A645
Discharge Capacity (mAh)
Vo
ltag
e(V
)
0 100 200 3002
2.5
3
3.5
4
60/5770/6781/7890/86
A/C Thickness (μm)1C discharge at -20°Cisothermal
(a)
Discharge Capacity (mAh)
Vo
ltag
e(V
)
Tem
per
atu
re(°
C)
0 500 1000 1500 20002
2.5
3
3.5
4
-20
-10
0
10
20
60/5770/6781/7890/86
A/C Thickness (μm)1C discharge at -20°Cself-heating
(b)
Discharge Capacity (mAh)
Vo
ltag
e(V
)
0 100 200 3002
2.5
3
3.5
4
0.40/0.410.33/0.350.26/0.280.20/0.22
A/C Porosity1C discharge at -20°Cisothermal
(c)
Discharge Capacity (mAh)
Vo
ltag
e(V
)
Tem
per
atu
re(°
C)
0 500 1000 1500 20002
2.5
3
3.5
4
-20
-10
0
10
20
0.40/0.410.33/0.350.26/0.280.20/0.22
A/C Porosity1C discharge at -20°Cself-heating
(d)
Discharge Capacity (mAh)
Vo
ltag
e(V
)
0 100 200 3002
2.5
3
3.5
4
0.60.91.21.51.7
Electrolyte Concentration(mol/L)
1C discharge at -20°Cisothermal
(e)
Discharge Capacity (mAh)
Vo
ltag
e(V
)
Tem
per
atu
re(°
C)
0 500 1000 1500 20002
2.5
3
3.5
4
-20
-10
0
10
20
0.60.91.21.51.7
Electrolyte Concentration(mol/L)
1C discharge at -20°C
(f)
self-heating
Discharge Capacity (mAh)
Vo
ltag
e(V
)
0 100 200 3002
2.5
3
3.5
4
251020
graphite particle radius1C discharge at -20°Cisothermal (μm)
(g)
Discharge Capacity (mAh)
Vo
ltag
e(V
)
Tem
per
atu
re(°
C)
0 500 1000 1500 20002
2.5
3
3.5
4
-20
-10
0
10
20
251020
graphite particle radius1C discharge at -20°C(μm)self-heating
(h)
Figure 14. Optimization of cell design parameters.
the limiting step in this application, an effective way of relieving thislimitation is to use smaller particles, thereby decreasing the diffusionlength and increasing the BET area for reaction. As shown in Figure14h, significant capacity gain (18% cell design capacity) has beenachieved with the use of particle with half radius (5 μm). Further re-duction in particle size does not lead to notable performance increase,implying that the cell with smaller graphite particles is no longer lim-
ited by anode solid-state diffusion. The capacity gain by decreasingthe particle size is not appreciable at the isothermal condition, becausethe cell is limited by electrolyte resistance there.
To summarize, the two most notable findings from the cell designoptimization for −20◦C operation under realistic thermal boundaryconditions are that: (1) reducing the graphite particle radius is very ef-fective to enhance cell performance; and (2) increasing the electrolyte
A646 Journal of The Electrochemical Society, 160 (4) A636-A649 (2013)
Discharge Capacity (mAh)
Vo
ltag
e(V
)
0 100 200 3002
2.5
3
3.5
4
4x2x1x0.5x
electrolyte conductivity1C discharge at -20°Cisothermal
(relative to default)
(a)
Discharge Capacity (mAh)
Vo
ltag
e(V
)
Tem
per
atu
re(°
C)
0 500 1000 1500 20002
2.5
3
3.5
4
-20
-10
0
10
20
4x2x1x0.5x
electrolyte conductivity1C discharge at -20°C(relative to default)self-heating
(b)
Discharge Capacity (mAh)
Vo
ltag
e(V
)
0 200 400 600 800 10002
2.5
3
3.5
4
4x2x1x0.5x
salf diffusivity1C discharge at -20°Cisothermal
(relative to default)
(c)
Discharge Capacity (mAh)
Vo
ltag
e(V
)
Tem
per
atu
re(°
C)
0 500 1000 1500 20002
2.5
3
3.5
4
-20
-10
0
10
20
4x2x1x0.5x
salt diffusivity1C discharge at -20°C(relative to default)self-heating
(d)
Discharge Capacity (mAh)
Vo
ltag
e(V
)
0 100 200 3002
2.5
3
3.5
4
0x0.5x1x2x
dlnf±/dlnc1C discharge at -20°Cisothermal (relative to default)
(e)
Discharge Capacity (mAh)
Vo
ltag
e(V
)
Tem
per
atu
re(°
C)
0 500 1000 1500 20002
2.5
3
3.5
4
-20
-10
0
10
20
0x0.5x1x2x
dlnf±/dlnc1C discharge at -20°C(relative to default)self-heating
(f)
Discharge Capacity (mAh)
Vo
ltag
e(V
)
0 100 200 3002
2.5
3
3.5
4
0.300.380.500.60
Li+ transference number1C discharge at -20°Cisothermal
(g)
Discharge Capacity (mAh)
Vo
ltag
e(V
)
Tem
per
atu
re(°
C)
0 500 1000 1500 20002
2.5
3
3.5
4
-20
-10
0
10
20
0.300.380.500.60
Li+ transference number1C discharge at -20°Cself-heating
(h)
Figure 15. Optimization of electrolyte properties.
concentration beyond 1.2 M may substantially lower the cell dischargecapacity.
Material properties.— Search for novel materials with optimalproperties is of great interest to improve cell performance at lowtemperatures. Of all cell materials, active materials and electrolytedirectly impact cell performance. The electrolyte properties includeionic conductivity, salt diffusivity, Li+ transference number, etc. These
properties can be modified by employing different salt and solvent, oradding co-solvents and additives in the electrolyte. For active materi-als, relevant properties include the exchange current density describ-ing charge transfer kinetics and solid-state diffusivity for Li diffusion.Alteration of these properties can be practically achieved by doping,surface coating, or modifying synthesis methods or conditions.
Optimization results of electrolyte properties are summarized inFigure 15. The property data used for experimental validation serve
Journal of The Electrochemical Society, 160 (4) A636-A649 (2013) A647
Discharge Capacity (mAh)
Vo
ltag
e(V
)
0 100 200 3002
2.5
3
3.5
4
100x10x1x0.1x
graphite kinetics1C discharge at -20°Cisothermal (relative to default)
(a)
Discharge Capacity (mAh)
Vo
ltag
e(V
)
Tem
per
atu
re(°
C)
0 500 1000 1500 20002
2.5
3
3.5
4
-20
-10
0
10
20
100x10x1x0.1x
graphite kinetics1C discharge at -20°C(relative to default)self-heating
(b)
Discharge Capacity (mAh)
Vo
ltag
e(V
)
0 100 200 3002
2.5
3
3.5
4
4x2x1x0.5x
graphite solid state diffusivity1C discharge at -20°Cisothermal (relative to default)
(c)
Discharge Capacity (mAh)
Vo
ltag
e(V
)
Tem
per
atu
re(°
C)
0 500 1000 1500 20002
2.5
3
3.5
4
-20
-10
0
10
20
4x2x1x0.5x
graphite solid state diffusivity1C discharge at -20°C(relative to default)self-heating
(d)
Figure 16. Optimization of active material properties.
as the baseline case, whose discharge curves are plotted as solid greenlines. Three multipliers are applied to the baseline value for eachparametric study without changing their dependences on concentra-tion and temperature. For all optimization studies, cells are dischargedat 1 C rate and starting from −20◦C under the isothermal conditionand self-heating condition, respectively.
As shown in Figure 15a, 15b, the electrolyte conductivity, althoughwidely perceived as the most important property of electrolytes, doesnot show significant effect on cell discharge at the isothermal con-dition, and has even less effect under the self-heating condition. Onthe other hand, as shown in Figure 15c, with use of 4× baselinesalt diffusivity, the cell discharge capacity at isothermal condition in-creases from 150 to 900 mAh. That is the largest increase found inthe present study and thus, a huge step forward in optimization. Itimplies that the anode electrolyte resistance, which is the primary re-sistance for 1 C rate discharge at −20◦C, is induced by the limited saltdiffusion rate. Returning to Figure 8, although the ionic conductivityis apparently the reason for electrolyte potential drop, the low saltdiffusivity is the underlying reason for local Li+ accumulation andultimately leads to much reduced conductivity locally. The elevationof salt diffusivity is far more beneficial than increasing the conduc-tivity since the cell performance is more mass transport limited thanohmic resistance limited. At the self-heating condition, the salt diffu-sivity also exhibits great importance. As shown in Figure 15d, withhalf salt diffusivity used, the cell voltage keeps decreasing until 3 Vcell voltage is reached. Without benefitting from 10◦C cell tempera-ture rise, or with larger cell cooling rate, the cell voltage may not beable to recover and the cell would shut down at a very low dischargecapacity.
In the optimization study described above, the ionic conductivityand salt diffusivity are treated to vary independently. In reality, the twoproperties are not independent, but interconnected by the ion mobility.Their link is complex for concentrated solutions or in the presence ofco-solvents and additives. At any rate the salt diffusivity merits fullattention in evaluation of novel electrolytes for Li-ion cells, especiallyduring low-temperature operation.
Additionally, we investigate effects of two other electrolyte prop-erties: the salt activity f± and cation transference number t+. Theactivity coefficient f±, which is a representative of short-range ion-solvent interactions, increases rapidly with concentration in concen-trated solutions. Accordingly, d ln f±/d ln c, approaches zero in verydilute solutions but becomes non-negligible in concentrated solutions.As shown in Figure 15e, 15f, cell voltage displays little change evenif ideal behaviors (i.e. the 0× case) are assumed. These results indi-cate small influences of salt activity, implying that the concentrationoverpotential is not that significant for 1 C discharge at −20◦C. Thecation transfer number determines the source or sink of the solutiontransport equations. There would be no solution concentration polar-izations if unity cation transfer number were used. The influences ofcation transfer number are shown in Figure 15g, 15h. At the isother-mal condition, the cell capacity is doubled when cation transferencenumber increases to 0.6. Since cell performance is solution phase dif-fusion limited at −20◦C, the large value of cation transference numberalleviates concentration polarization, leading to increased cell capac-ity. At the self-heating condition, the cell capacity changes little, buthigher voltages are observed, because of decreased electrolyte resis-tance from less polarized concentration.
In addition to the electrolyte properties, optimization of active ma-terial properties is also conducted. Under the isothermal condition at−20◦C, as shown in Figure 6d, interfacial kinetic resistance dominatesduring the first half of discharge. Under the self-heating condition, asshown in Figure 6f, large kinetic resistance is observed at the be-ginning of discharge while the anode particle resistance increasesrapidly and becomes controlling during the rest of discharge. To re-duce these major resistances, optimization of the exchange currentdensity and solid-state Li diffusivity in graphite anode is performed,as shown in Figure 16. Since the charge transfer kinetics falls in theTafel regime, to produce visible differences in cell voltage, the ex-change current density is changed by orders of magnitude. It is seenthat at the isothermal condition (Figure 16a), charge transfer kineticsimpact on cell voltage is insignificant (∼100 mV when kinetics is10 times faster); there is also little benefit to cell discharge capacity.
A648 Journal of The Electrochemical Society, 160 (4) A636-A649 (2013)
Under the self-heating condition (Figure 16b), the cell capacity evendecreases by 7% because of less benefit from insufficient temperaturerise owing to reduced kinetic resistance. Optimization of the graphitesolid state diffusivity yields an entirely different scenario. As shownin Figure 16c, 16d, when the diffusivity is doubled, the cell is able todischarge 16% higher capacity at the isothermal condition and 20%higher capacity at the self-heating condition.
Conclusions
Li-ion cell operation at subzero temperatures has been studiedexperimentally and theoretically. An electrochemical-thermal coupled(ECT) model was validated against experimental data on a 2.2Ah18650 cell over a wide range of C-rates and ambient temperatures, withgenerally good agreement. The experimentally validated ECT modelwas subsequently used to gain insight into and for optimization ofLi-ion cells operated at low temperatures. The following conclusionsare drawn:
(1) Cell behavior depends not only on the ambient temperature, butalso on the operation rate and thermal conditions. At −20◦C,charge transfer kinetics is the limiting factor in low-rate (C/1000)operation. For 1 C discharge under the isothermal condition,however, the anode electrolyte resistance becomes dominant,due to highly reduced ionic conductivity from large electrolyteconcentration polarizations. When cell self-heating effect is in-cluded, the electrolyte concentration polarization is alleviated,making the resistance in anode solid particles a limit for bothcell voltage and capacity.
(2) The ECT coupling becomes stronger with increasing C-rate anddecreasing ambient temperature. The cell performance is moresensitive to the heat transfer condition at low temperatures, dueto the enhanced self-heating from higher resistance and strongertemperature dependence of material properties in that tempera-ture range. At −20◦C, the change of heat transfer condition fromisothermal to adiabatic leads to a huge increase in discharge ca-pacity, e.g. from 140 to 2200 mAh.
(3) The non-isothermal Ragone plot is proposed for the first time forapplications at high rates and/or low temperatures, where sub-stantial performance enhancement can be realized by cell self-heating. The nonisothermal Ragone plot indicates no significantenergy loss down to −20◦C (ambient temperature) provided thatthe cell is operated at 3 C rate or lower.
(4) For operation at −20◦C, decreasing the graphite particle radiusis very effective to enhance cell performance, while increasingthe electrolyte concentration beyond a critical level (1.2 M inthe present study) may substantially lower the cell dischargecapacity.
(5) For material property optimization for cell operation at −20◦C,increasing salt diffusivity in electrolyte and solid-state Li diffu-sivity in graphite particles are most beneficial to improve celldischarge capacity.
Acknowledgments
Partial support of this work by DOE CAEBAT program and KoreanAgency of Defense Development (ADD) is greatly acknowledged. Weare also grateful to EC Power for offering numerical algorithms andmaterials database through its AutoLion software.
Appendix A: Mathematical Definitions of VariousCell Resistances
To analyze the contributions from various transport and kinetic processes, breakdownof the cell voltage drop relative to open circuit potential (OCP) is necessary. Consideringnon-uniform distributions in each electrode and the separator, for any physical quantityξ, average is taken over the thickness to represent its level in an electrode or separator:
ξ =∫L
ξ dl [A1]
where L is the thickness of an electrode or separator. Voltage losses due to electronicresistance in the two electrodes are:
�V As = V A − φA
s �V Cs = φC
s − V C [A2]
in which V A and V C are potentials at the anode-foil interface and the cathode-foil interfacerespectively. Voltage losses induced by ionic resistance and concentration overpotentialin electrolyte are:
�V Ae = φA
e − φASe �V S
e = φASe − φSC
e �V Ce = φSC
e − φCe [A3]
where φASe and φSC
e are electrolyte potential at the anode-separator interface and thecathode-separator interface respectively. The kinetic over-potentials in the anode andcathode are:
�V Ak = φA
s − φAe − U A �V C
k = −φCs + φC
e + U C [A4]
where U = U (cs,i ) is the equilibrium potential at the stoichiometry (or equivalentlySOC) on the particle surface. Concentration polarization in active material particles leadsto voltage derivations from open circuit at the same state of charge:
�V Ap = U A − E A �V C
p = EC − U C [A5]
where E A and EC are open circuit potentials of anode and cathode at the same SOC.In addition, there are contact resistances between foil and electrodes, foil and currentcollectors. Voltage losses due to all these contact resistances are:
�Vc = (V − − V A) + (V C − V +) [A6]
where V − and V + are potentials of negative current collector and positive current collector.Their difference is the cell voltage. Based on the above definitions, the sum of all voltagelosses is exactly equal to the difference between cell OCP (EC − E A) and cell voltage(V + − V −).
Appendix B: Material and Electrochemical Properties
The open circuit potentials (OCP) of graphite (LixC6) and NCM(LiyNi1/3Mn1/3Co1/3O2) are obtained from experimental measurements reportedby Verbrugge et al.53 and Yabuuchi et al.54 respectively, and have been fitted to empiricalequations:
U (Graphite) = 0.1493 + 0.8493e−61.79x + 0.3824e−665.8x − e39.42x−41.92
U (NCM) = −10.72y4 +23.88y3 −16.77y2 +2.595y+4.563 (0.3 ≤ y ≤ 1) [B2]
The reversible heat of graphite and NCM as a function of stoichiometric are obtainedfrom the entropy change reported by Reynier et al.55 and Lu et al.56 respectively. Insteadof fitting these data into empirical relations, discrete data points with linear interpolationare used in the present study.
With regard to electrolyte properties, Valoen and Reimers52 reported experimen-tally a full description of electrolyte properties (ionic conductivity, salt diffusivity, cationtransference number and activity coefficient) with dependency on concentration and tem-perature in the solution of PC (10%), EC (27%) and DMC (63%) (by vol) with LiPF6 salt.The empirical data fittings given by Valoen and Reimers have been used for ionic con-ductivity and activity coefficient. For salt diffusivity, we have developed new correlationsat low temperatures due to the fact that the electrolyte used in the present study contains20% EMC, 20% EC and 60% DMC, slightly different composition optimized for enhanc-ing salt diffusivity at low temperatures. These new correlations are shown in Figure B1
1000/T (K-1)
Sal
tD
iffu
sivi
ty(m
2 /s)
3 3.2 3.4 3.6 3.8 410-13
10-12
10-11
10-10
10-9
0.396M1.74M3.33M
fitted (Valoen)fitted (this study)
experimental data (Valoen)
Figure B1. Salt diffusivity as a function of temperature.
Journal of The Electrochemical Society, 160 (4) A636-A649 (2013) A649
along with the original experimental data of Valoen and Reimers and their fitted curvesfor comparison. Other active material properties are listed in Table II.
References
1. G. Nagasubramanian, J. Appl. Electrochem., 31, 99 (2001).2. DOE, Energy storage R&D annual progress report, 81 (2011).3. M. C. Smart, B. V. Ratnakumar, and S. Surampudi, J. Electrochem. Soc., 146, 486
(1999).4. E. J. Plichta and W. K. Behl, J. Power Sources, 88, 192 (2000).5. H. C. Shiao, D. Chua, H. P. Lin, S. Slane, and M. Salomon, J. Power Sources, 87,
167 (2000).6. M. C. Smart, B. V. Ratnakumar, and S. Surampudi, J. Electrochem. Soc., 149, A361
(2002).7. S. S. Zhang, K. Xu, J. L. Allen, and T. R. Jow, J. Power Sources, 110, 216 (2002).8. M. C. Smart, B. V. Ratnakumar, K. B. Chin, and L. D. Whitcanack, J. Electrochem.
Soc., 157, A1361 (2010).9. S. S. Zhang, K. Xu, and T. R. Jow, Electrochem. Commun., 4, 928 (2002).
10. S. S. Zhang, K. Xu, and T. R. Jow, J. Power Sources, 115, 137 (2003).11. S. S. Zhang, K. Xu, and T. R. Jow, Electrochim. Acta, 49, 1057 (2004).12. S. S. Zhang, K. Xu, and T. R. Jow, J. Power Sources, 159, 702 (2006).13. S. S. Zhang, K. Xu, and T. R. Jow, J. Power Sources, 160, 1403 (2006).14. A. N. Jansen, D. W. Dees, D. P. Abraham, K. Amine, and G. L. Henriksen, J. Power
Sources, 174, 373 (2007).15. D. P. Abraham, J. R. Heaton, S. H. Kang, D. W. Dees, and A. N. Jansen, J. Elec-
trochem. Soc., 155, A41 (2008).16. T. R. Jow, M. B. Marx, and J. L. Allen, J. Electrochem. Soc., 159, A604 (2012).17. C. K. Huang, J. S. Sakamoto, J. Wolfenstine, and S. Surampudi, J. Electrochem. Soc.,
147, 2893 (2000).18. H. P. Lin, D. Chua, M. Salomon, H. C. Shiao, M. Hendrickson, E. Plichta, and
S. Slane, Electrochem. Solid St, 4, A71 (2001).19. S. S. Zhang, K. Xu, and T. R. Jow, Electrochim. Acta, 48, 241 (2002).20. C. S. Wang, A. J. Appleby, and F. E. Little, J. Electrochem. Soc., 149, A754 (2002).21. J. Fan, J. Power Sources, 117, 170 (2003).22. J. Fan and S. Tan, J. Electrochem. Soc., 153, A1081 (2006).23. M. Mancini, F. Nobili, S. Dsoke, F. D’Amico, R. Tossici, F. Croce, and R. Marassi,
J. Power Sources, 190, 141 (2009).24. J. W. Yao, F. Wu, X. P. Qiu, N. Li, and Y. F. Su, Electrochim. Acta, 56, 5587 (2011).25. T. Yuan, X. Yu, R. Cai, Y. K. Zhou, and Z. P. Shao, J. Power Sources, 195, 4997
(2010).26. M. C. Smart, B. V. Ratnakumar, L. D. Whitcanack, K. B. Chin, S. Surampudi,
H. Croft, D. Tice, and R. Staniewicz, J. Power Sources, 119, 349 (2003).27. M. C. Smart, J. F. Whitacre, B. V. Ratnakumar, and K. Amine, J. Power Sources,
168, 501 (2007).
28. C. R. Sides and C. R. Martin, Adv. Mater., 17, 125 (2005).29. J. L. Allen, T. R. Jow, and J. Wolfenstine, J. Power Sources, 159, 1340
(2006).30. M. Doyle, T. F. Fuller, and J. Newman, J. Electrochem. Soc., 140, 1526 (1993).31. T. F. Fuller, M. Doyle, and J. Newman, J. Electrochem. Soc., 141, 1 (1994).32. M. Doyle, J. Newman, A. S. Gozdz, C. N. Schmutz, and J. M. Tarascon, J. Elec-
trochem. Soc., 143, 1890 (1996).33. W. B. Gu and C. Y. Wang, J. Electrochem. Soc., 147, 2910 (2000).34. L. Song and J. W. Evans, J. Electrochem. Soc., 147, 2086 (2000).35. V. Srinivasan and C. Y. Wang, J. Electrochem. Soc., 150, A98 (2003).36. K. Kumaresan, G. Sikha, and R. E. White, J. Electrochem. Soc., 155, A164
(2008).37. R. E. Gerver and J. P. Meyers, J. Electrochem. Soc., 158, A835 (2011).38. G. H. Kim, K. Smith, K. J. Lee, S. Santhanagopalan, and A. Pesaran, J. Electrochem.
Soc., 158, A955 (2011).39. G. Luo and C. Y. Wang, in Lithium-ion Batteries : Advanced Materials and Tech-
nologies, X. Yuan, H. Liu, and J. Zhang Editors, p. 303, CRC Press, Boca Raton(2012).
40. C. R. Pals and J. Newman, J. Electrochem. Soc., 142, 3274 (1995).41. M. W. Verbrugge, Aiche J., 41, 1550 (1995).42. G. G. Botte, B. A. Johnson, and R. E. White, J. Electrochem. Soc., 146, 914
(1999).43. K. E. Thomas and J. Newman, J. Electrochem. Soc., 150, A176 (2003).44. K. Smith and C. Y. Wang, J. Power Sources, 160, 662 (2006).45. W. F. Fang, O. J. Kwon, and C. Y. Wang, Int. J. Energ. Res., 34, 107 (2010).46. T. M. Bandhauer, S. Garimella, and T. F. Fuller, J. Electrochem. Soc., 158, R1 (2011).47. J. Y. Eom, L. Cao, and C. Y. Wang, J. Power Sources, submitted for publication
(2013).48. H. Maleki, S. Al Hallaj, J. R. Selman, R. B. Dinwiddie, and H. Wang, J. Electrochem.
Soc., 146, 947 (1999).49. E. P. Roth, Thermal Abuse Performance of MOLI, Panasonic and Sanyo 18650 Li-Ion
Cells, in Sandia Report SAND2004-6721, Sandia National Laboratories (2005).50. C. Y. Wang, W. B. Gu, and B. Y. Liaw, J. Electrochem. Soc., 145, 3407 (1998).51. T. Ohzuku, Y. Iwakoshi, and K. Sawai, J. Electrochem. Soc., 140, 2490 (1993).52. L. O. Valoen and J. N. Reimers, J. Electrochem. Soc., 152, A882 (2005).53. M. W. Verbrugge and B. J. Koch, J. Electrochem. Soc., 150, A374 (2003).54. N. Yabuuchi, Y. Makimura, and T. Ohzuku, J. Electrochem. Soc., 154, A314
(2007).55. Y. F. Reynier, R. Yazami, and B. Fultz, J. Electrochem. Soc., 151, A422 (2004).56. W. Lu, I. Belharouak, D. Vissers, and K. Amine, J. Electrochem. Soc., 153, A2147
(2006).57. K. M. Shaju, G. V. S. Rao, and B. V. R. Chowdari, J. Electrochem. Soc., 151, A1324
(2004).58. T. L. Kulova, A. M. Skundin, E. A. Nizhnikovskii, and A. V. Fesenko, Russ. J. Elec-