18
LiDAR DATA COLLECTION LC WEST MALHEUR NATIONAL FOREST, OREGON July 27 – August 19, 2010 Submitted by: Aero-Graphics, Inc. 40 W. Oakland Avenue Salt Lake City, UT 84115
LiDAR DATA COLLECTION
LC WEST MALHEUR NATIONAL FOREST, OREGON
July 27 – August 19, 2010
Submitted by: Aero-Graphics, Inc.
40 W. Oakland Avenue Salt Lake City, UT 84115

LiDAR Data Collection LC West, Oregon
Table of Contents
1. Overview..........................................................................................................3
2. Acquisition .......................................................................................................4 2.1 Airborne Acquisition – Equipment and Methodology ...............................4
2.2 Ground Survey – Equipment and Methodology ........................................6
2.2.1 Base Stations ....................................................................................6
2.2.2 Ground Survey Control .....................................................................7
3. LiDAR Processing Workflow and Software .......................................................9
4. Results .............................................................................................................10
4.1 Relative Calibration Accuracy Results ........................................................10
4.2 Absolute Accuracy .....................................................................................11
4.3 Data Density ..............................................................................................12
4.4 Data Density Summary ..............................................................................16
4.5 Projection, Datum, and Units ....................................................................16
5. Deliverables .....................................................................................................17
6. Selected Images ...............................................................................................18

LiDAR Post-Deliverable Report – LC West, Mahleur National Forest, Oregon 3 Aero-Graphics, Inc.: Geospatial Services
1. Overview Between July 27 and August 19, 2010, Aero-Graphics acquired LiDAR data over a portion of the Mahleur National Forest called LC West. The acquisition covers roughly 323 square miles (206,724 acres).
Exhibit 1: LC West project boundary (in green)
LiDAR Post-Deliverable Report – LC West, Mahleur National Forest, Oregon 4 Aero-Graphics, Inc.: Geospatial Services
2. Acquisition 2.1 Airborne Acquisition – Equipment and Methodology LiDAR acquisition of LC West was performed with an Optech ALTM Orion sensor. Aero-Graphics
flew at an average altitude of 3280 ft AGL (above ground level) and made appropriate
adjustments to compensate for topographic relief. The PRF (pulse rate frequency) used for
collection was 100 kHz, scan frequency of 70 Hz, and scan angle of +/- 11° from the nadir
position (full scan angle 22°). The ALTM Orion features roll compensation that adjusts the
mirror to maintain the full scan angle integrity in relation to nadir, even when less than perfect
weather conditions push the sensor off nadir. Acquisition was performed with a 50% side lap
and yielded >12.5 points per square meter throughout the project boundary. The Optech ALTM
Orion is capable of receiving up to four range measurements, including 1st, 2nd, 3rd, and last
returns for every pulse sent from the system.
Exhibit 2: Summary of flight parameters
Altitude (ft AGL)
Overlap (%)
Speed (kts)
PRF (kHz)
Scan Freq (Hz)
Scan Angle ° (full)
PPM2
(nominal)
3280 50 110 100 70 22 9.1
The ALTM Orion is also equipped with a GPS/IMU unit that continually records the XYZ position
and roll, pitch and yaw attitude of the plane throughout the flight. This information allows us
to correct laser return data positions that may have been thrown off by the plane’s natural
movement.
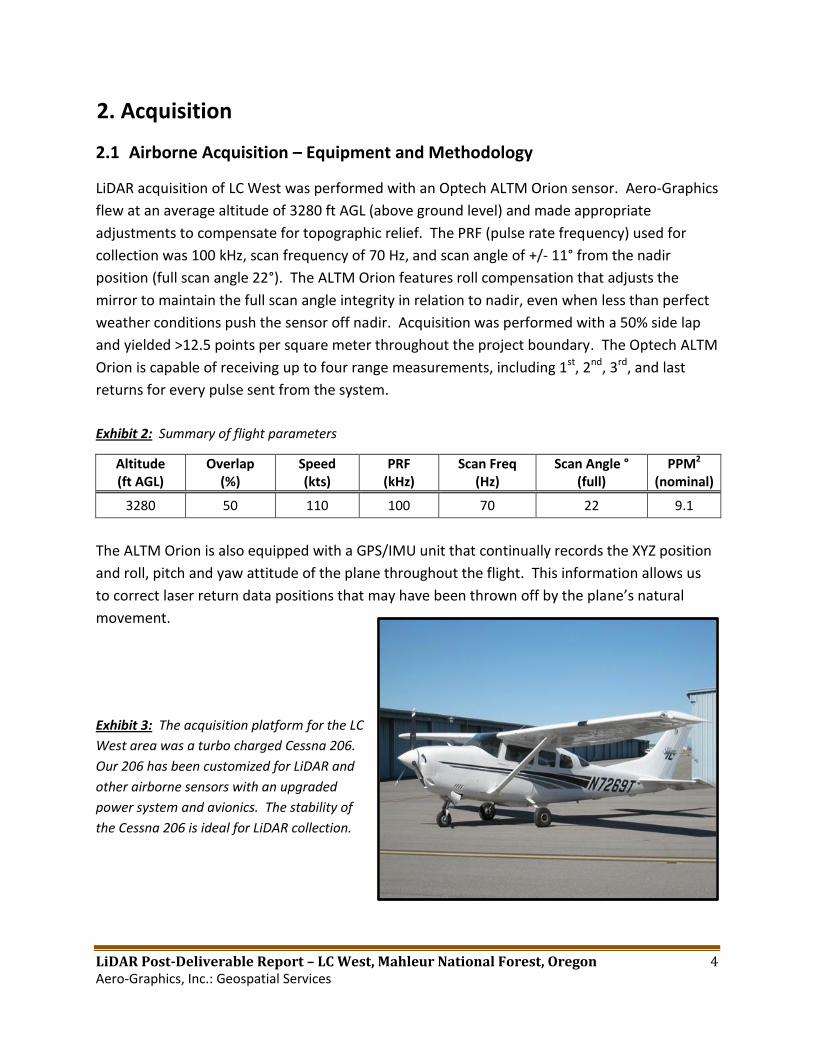
Exhibit 3: The acquisition platform for the LC
West area was a turbo charged Cessna 206.
Our 206 has been customized for LiDAR and
other airborne sensors with an upgraded
power system and avionics. The stability of
the Cessna 206 is ideal for LiDAR collection.

LiDAR Post-Deliverable Report – LC West, Mahleur National Forest, Oregon 5 Aero-Graphics, Inc.: Geospatial Services
The ALTM Orion LiDAR sensor is equipped
with ALTM-Nav Flight Management System
Software. ALTM-Nav is not only used to guide
the airborne mission in flight, but our office
flight planning is performed using a
combination of Nav and traditional flight
planning practices. The smooth transition
from flight planning to aerial operations
eliminates discrepancies between the flight
plan and what is actually acquired. The use of
ALTM-Nav helps ensure an accurate and
consistent acquisition mission with real-time
quality assurance while still airborne. The system operator can monitor the point density and
swath during the mission to confirm adequate coverage within the area of interest, as shown in
Exhibit 4.
Exhibit 4: Real time swath data for LC West was recorded and viewed real-time by the
operator.

LiDAR Post-Deliverable Report – LC West, Mahleur National Forest, Oregon 6 Aero-Graphics, Inc.: Geospatial Services
2.2 Ground Survey – Equipment and Methodology Aero-Graphics used the following survey data to differentially correct the aircraft’s trajectory
data and to ensure that the LiDAR data maintained its true geographic integrity.
2.2.1 Base Stations Using our own static base stations at strategic points in the project area, with data collected
during the time of the LiDAR mission, we used Multi-Base processing in Applanix’s POS GNSS
software to accurately correct the aircraft’s real-time GPS trajectory.
Exhibit 5: Ground bases and their geographic positions (#116 pictured)
Base Station Datum: WGS84 WGS84
Latitude Longitude Ellipsoid Height (m)
112 44° 35’ 49.22318” -119° 07’ 55.42067” 1427.375
116 44° 41’ 34.58673” -118° 47’ 33.09639” 1039.209

LiDAR Post-Deliverable Report – LC West, Mahleur National Forest, Oregon 7 Aero-Graphics, Inc.: Geospatial Services
2.2.2 Ground Survey Control Aero-Graphics collected the following static measurements, which allowed us to ensure
project-specified accuracy on the final LiDAR and surface deliverables. This final accuracy is
presented in section 4.2.
Exhibit 6: Static ground survey measurements (#109 & #118 pictured)
Survey Point Datum: WGS84 WGS84
Latitude Longitude Ellipsoid Height (m)
101 44° 32’ 10.50998” -118° 35’ 57.86882” 1582.925
102 44° 45’ 23.11077” -118° 42’ 57.03079” 1888.829
103 44° 31’ 15.13124” -118° 37’ 37.87388” 1429.174
104 44° 30’ 28.12114” -118° 47’ 46.44403” 1413.356
105 44° 32’ 20.64869” -118° 50’ 26.72720” 1591.409
106 44° 34’ 04.49330” -118° 53’ 30.74885” 1596.583
107 44° 38’ 02.78410” -118° 55’ 39.90817” 1494.185
108 44° 40’ 18.58388” -118° 56’ 22.52248” 1353.463
109 44° 31’ 17.17779” -119° 02’ 18.15659” 1059.013
110 44° 33’ 01.16570” -119° 04’ 13.59181” 1197.251
111 44° 34’ 10.05619” -119° 07’ 07.75776” 1393.074
112B 44° 35’ 47.90119” -119° 08’ 06.93225” 1416.862
113 44° 40’ 47.66487” -119° 07’ 54.95503” 1537.248
114 44° 41’ 19.90564” -119° 09’ 27.26509” 1616.958
115 44° 41’ 43.67090” -119° 15’ 53.24584” 1492.167
117 44° 43’ 53.62710” -118° 50’ 27.31768” 1003.928
118 44° 46’ 39.53588” -118° 50’ 20.37597” 1074.212
119 44° 34’ 41.59962” -119° 18’ 21.80098” 1452.183
120 44° 47’ 39.55090” -118° 57’ 13.63137” 912.066

LiDAR Post-Deliverable Report – LC West, Mahleur National Forest, Oregon 8 Aero-Graphics, Inc.: Geospatial Services
Exhibit 7: AGI static ground control and base locations for LC West

LiDAR Post-Deliverable Report – LC West, Mahleur National Forest, Oregon 9 Aero-Graphics, Inc.: Geospatial Services
3. LiDAR Processing Workflow and Software
a. Absolute Sensor Calibration. The absolute sensor calibration is defined as the
difference in roll, pitch, heading, and scale between the raw laser point cloud from the
sensor and surveyed control points on the ground over two separate sites. Software:
Dashmap 4.1801; ACalib 1.3.5.7.
b. Kinematic Air Point Processing. Differentially corrected the 1-second airborne GPS
positions with ground base stations; combined and refined the GPS positions with
1/200-second IMU (roll-pitch-yaw) data through development of a smoothed best
estimate of trajectory (SBET). Software: Applanix POSPac 5.3.3664.28463.
c. Raw LiDAR Point Processing. Combined SBET with raw LiDAR range data; solved real-
world position for each laser point; produced point cloud data by flight strip in ASPRS
v1.1 .LAS format; output in WGS84 UTM Ellipsoid Heights. Software: LiDAR Mapping
Suite 1.0.
d. Relative Calibration. Tested relative accuracy; performed relative calibration by
correcting for roll, pitch, heading, and scale discrepancies between adjacent flightlines.
Results presented in Section 4.1. Software: LiDAR Mapping Suite 1.0.
e. Tiling & Long/Short Filtering. Cut data into project-specified tiles and filtered out
grossly long and short returns. Software: TerraScan 10.011.
f. Classification. Ran classification algorithms on points in each tile; separated into
ground, unclassified, high outliers and low outliers; revisited areas not completely
classified automatically and manually corrected them. Software: TerraScan 10.011.
g. Absolute Accuracy Assessment. Performed comparative tests that showed Z-differences between each static survey point and the laser point surface. Results presented in Section 4.2. Software: TerraScan 10.001.
h. Datum Transformation. Transformed all .LAS tiles from WGS84 UTM 11N Ellipsoid
Heights into NAD83 UTM 11N, adjusted for orthometric heights on NAVD88 (Geoid03).
Integrity of the .LAS file format was maintained throughout the process. Software:
Blue Marble Desktop 2.1.
i. DEM Creation. Generated 2-meter first-return DEMs and 1-meter ground surface DEMs in ESRI Raster Grid format, tiled according to project specifications. Software: TerraScan 10.011.
j. Intensity Image Creation. Generated 1-meter pixel intensity images in GeoTIFF format,
tiled according to project specifications. Software: TerraScan 10.011.
LiDAR Post-Deliverable Report – LC West, Mahleur National Forest, Oregon 10 Aero-Graphics, Inc.: Geospatial Services
4. Results
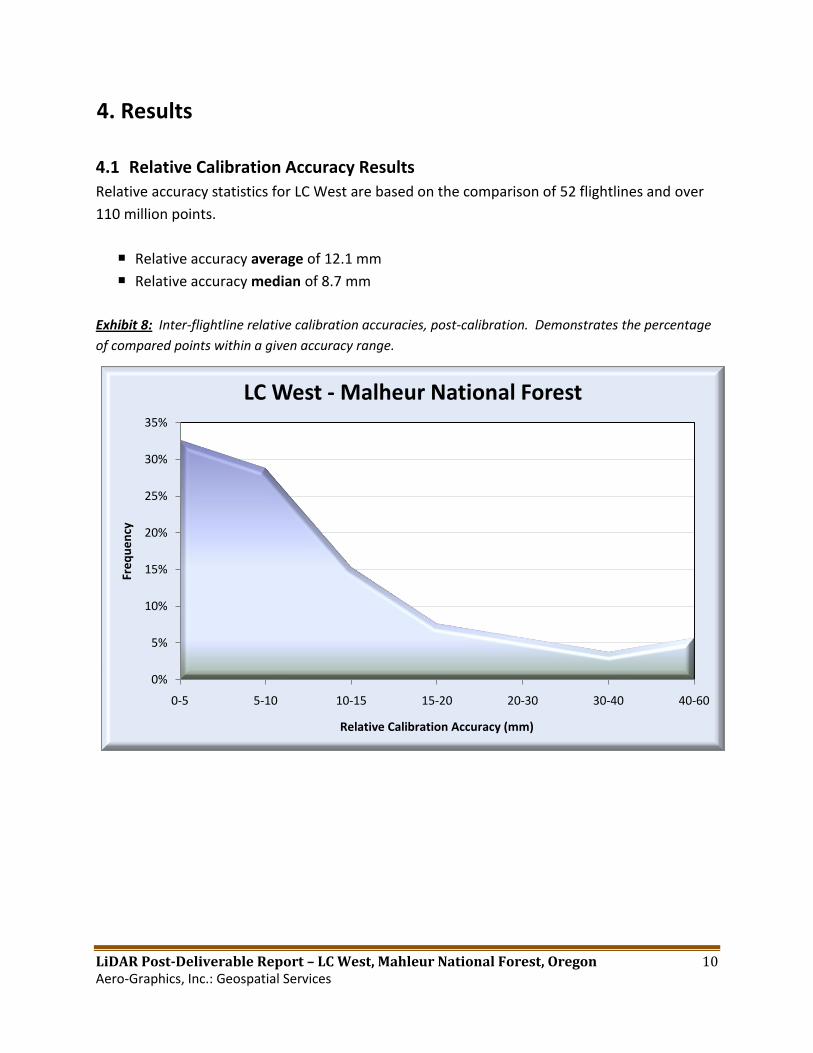
4.1 Relative Calibration Accuracy Results
Relative accuracy statistics for LC West are based on the comparison of 52 flightlines and over
110 million points.
Relative accuracy average of 12.1 mm
Relative accuracy median of 8.7 mm
Exhibit 8: Inter-flightline relative calibration accuracies, post-calibration. Demonstrates the percentage
of compared points within a given accuracy range.
0%
5%
10%
15%
20%
25%
30%
35%
0-5 5-10 10-15 15-20 20-30 30-40 40-60
Fre
qu
en
cy
Relative Calibration Accuracy (mm)
LC West - Malheur National Forest

LiDAR Post-Deliverable Report – LC West, Mahleur National Forest, Oregon 11 Aero-Graphics, Inc.: Geospatial Services
4.2 Absolute Accuracy Absolute accuracy is defined as the elevation difference between ground surveyed static points
and the elevation of the LiDAR surface at that same horizontal location. The statistics of the
results are presented here.
Exhibit 9: Absolute accuracy of the LC West project
Average Error = 0.017 m RMSE = 0.054 m
Minimum Error = -0.118 m σ = 0.052 m
Maximum Error = 0.110 m 2 σ = 0.104 m
Survey Sample Size: n = 20
Exhibit 10: Distribution of the errors between LiDAR surface and Ground Surveyed points. Demonstrates
the percentage of compared points within a given accuracy range.
0%
5%
10%
15%
20%
25%
30%
35%
40%
-0.015 -0.1 -0.05 0 0.05 0.1 0.015
Fre
qu
en
cy
Difference between LiDAR surface and Ground Surveyed Point (m)
LC West - Malheur National Forest
LiDAR Post-Deliverable Report – LC West, Mahleur National Forest, Oregon 12 Aero-Graphics, Inc.: Geospatial Services
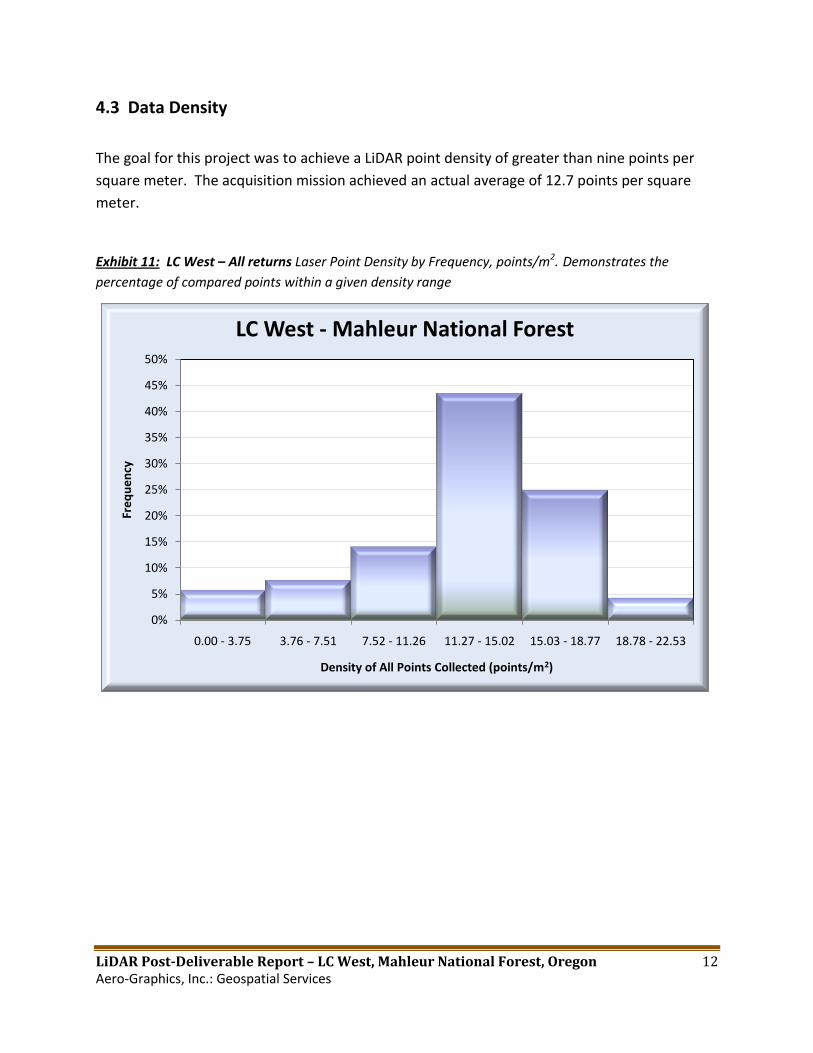
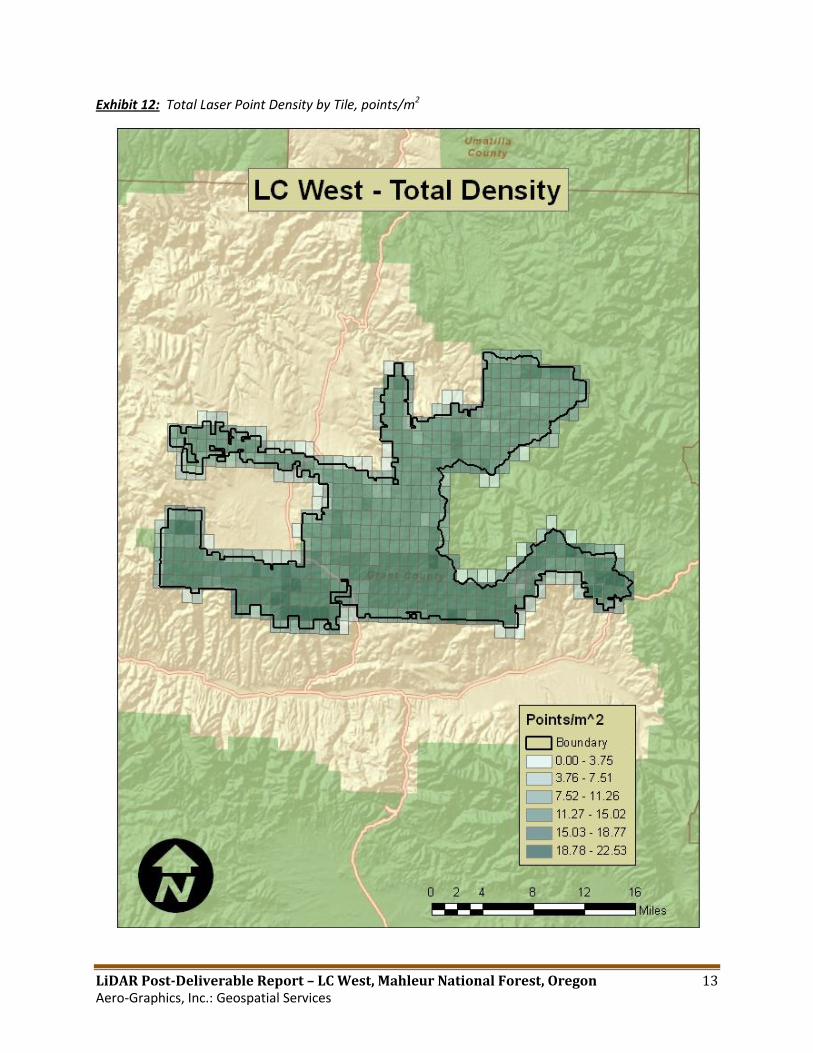
4.3 Data Density
The goal for this project was to achieve a LiDAR point density of greater than nine points per
square meter. The acquisition mission achieved an actual average of 12.7 points per square
meter.
Exhibit 11: LC West – All returns Laser Point Density by Frequency, points/m2. Demonstrates the
percentage of compared points within a given density range
0%
5%
10%
15%
20%
25%
30%
35%
40%
45%
50%
0.00 - 3.75 3.76 - 7.51 7.52 - 11.26 11.27 - 15.02 15.03 - 18.77 18.78 - 22.53
Fre
qu
en
cy
Density of All Points Collected (points/m2)
LC West - Mahleur National Forest
LiDAR Post-Deliverable Report – LC West, Mahleur National Forest, Oregon 13 Aero-Graphics, Inc.: Geospatial Services
Exhibit 12: Total Laser Point Density by Tile, points/m2

LiDAR Post-Deliverable Report – LC West, Mahleur National Forest, Oregon 14 Aero-Graphics, Inc.: Geospatial Services
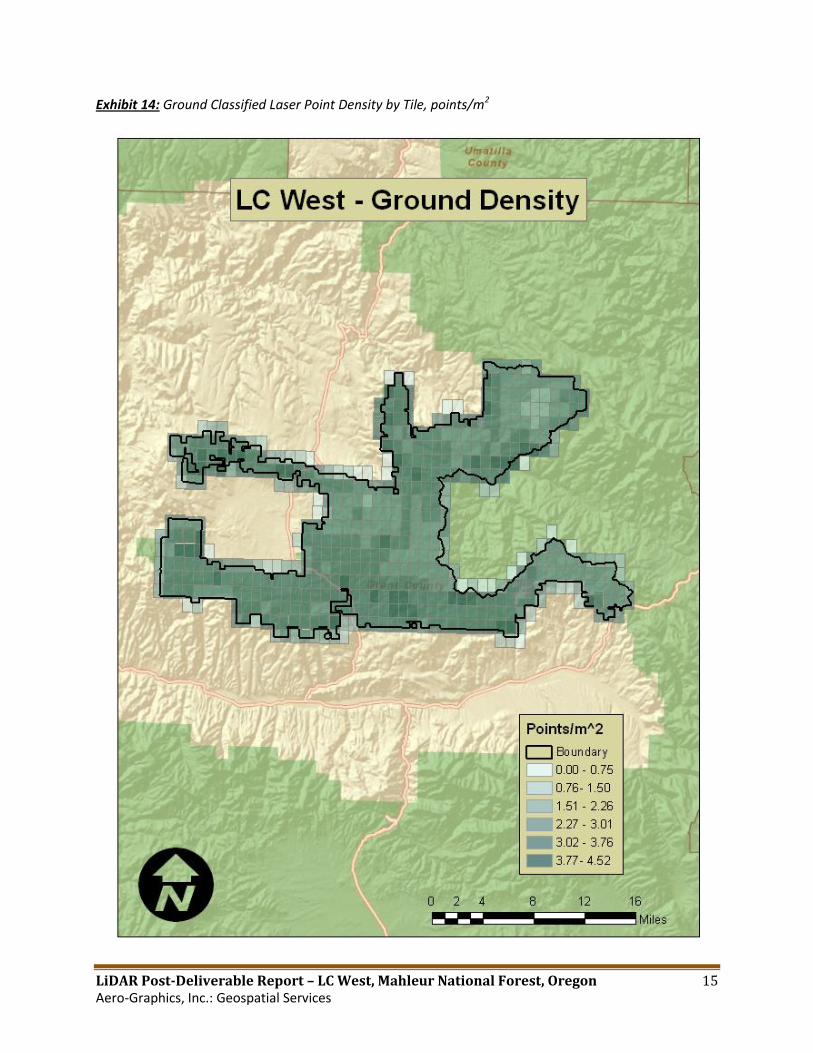
The following two exhibits show the density of ground classified points. Factors such as
vegetation, water, and buildings will affect how points are classified. For the LC West project
area, an average of 2.8 ground classified points per square meter was achieved.
Exhibit 13: LC West - Ground Classified Laser Point Density by Frequency, points/m2. Demonstrates the
percentage of compared points within a given density range
0%
5%
10%
15%
20%
25%
30%
35%
40%
45%
50%
0.00 - 0.75 0.76 - 1.50 1.51 - 2.26 2.27 - 3.01 3.02 - 3.76 3.77 - 4.52
Fre
qu
en
cy
Density of Ground Points Collected (points/m2)
LC West - Malheur National Forest
LiDAR Post-Deliverable Report – LC West, Mahleur National Forest, Oregon 15 Aero-Graphics, Inc.: Geospatial Services
Exhibit 14: Ground Classified Laser Point Density by Tile, points/m2

LiDAR Post-Deliverable Report – LC West, Mahleur National Forest, Oregon 16 Aero-Graphics, Inc.: Geospatial Services
4.4 Data Density Summary
LC West Project Area Goal Actual (mean)
Total Point Density: >9 points/m2 12.7 points/m2
Ground Classified Point Density: ------- 2.8 points/m2
4.5 Projection, Datum, and Units
Projection: UTM Zone 11N
Ellipsoid: WGS84
Datum Vertical: NAVD88 Geoid 03
Horizontal: NAD83
Units: Meters

LiDAR Post-Deliverable Report – LC West, Mahleur National Forest, Oregon 17 Aero-Graphics, Inc.: Geospatial Services
5. Deliverables
Point Data:
All laser returns (classified into
ground and non-ground features) in
LAS 1.1 format
Ground laser returns in LAS 1.1
format
Vector Data: Aircraft trajectories in ASCII format
Raster Data:
Ground surface DEMs in ESRI Raster
Grid format at a 1m cell size
First-return surface DEMs in ESRI
Raster Grid format at a 2m cell size
Intensity Imagery in GeoTIFF format
at a 1m pixel size
Report of Survey: Post-Deliverable Report including
methodology, accuracy, and results
LiDAR Post-Deliverable Report – LC West, Mahleur National Forest, Oregon 18 Aero-Graphics, Inc.: Geospatial Services
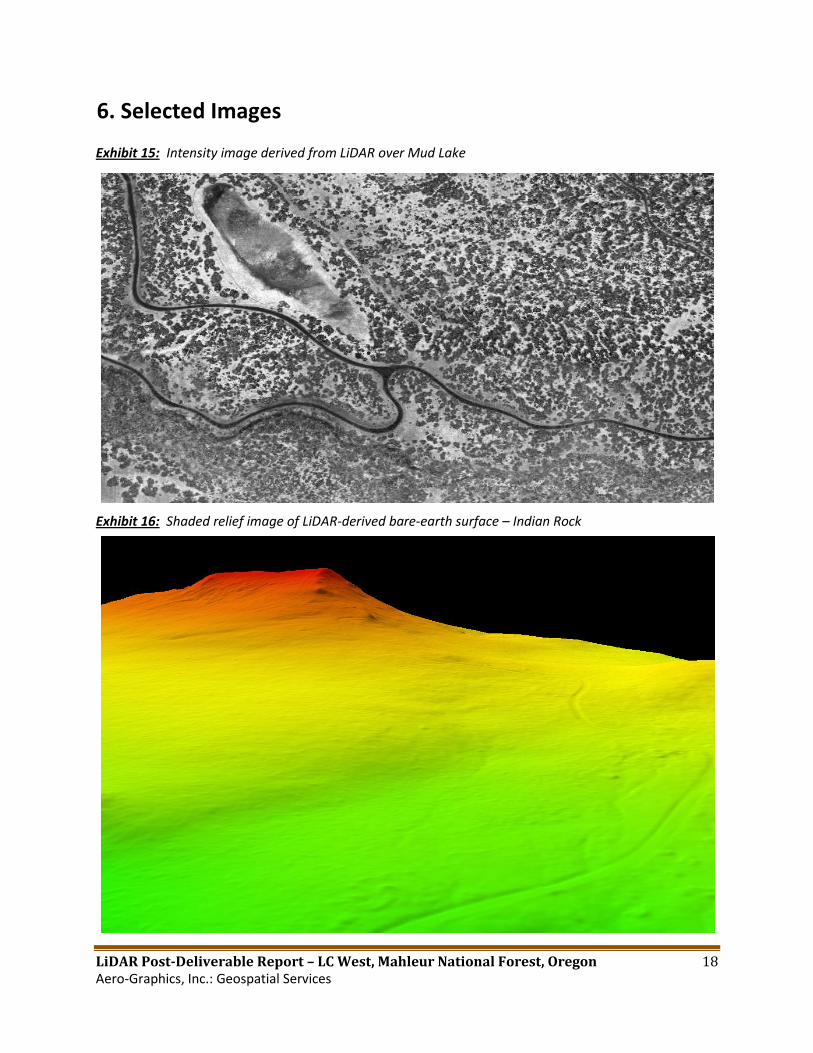
6. Selected Images Exhibit 15: Intensity image derived from LiDAR over Mud Lake
Exhibit 16: Shaded relief image of LiDAR-derived bare-earth surface – Indian Rock


