31
Life by Newell 2017 Annual Report
Life by Newell2017 Annual Report

Buckling a little one into his stroller for a Saturday morning coffee run. Adding decorative flair for a dinner party with friends. Gearing up for adventure in the great outdoors. Launching a creative project. In the experiences that give life meaning, Newell Brands is there, with products that help consumers live to the fullest, elicit their passions and inspire the moments that matter most. That’s Life by Newell.

Newell Brands 2017 Annual Report 3
Newell Brands’ Internship Program Wins Big
Newell Brands was recognized in the 2017 Internship Awards conducted by careers site WayUp as a top-ranked program in America. Additionally, campus recruiting manager, Christine Terminello, was recognized as the #1 ranked Internship Program Manager.
“ Ranking among the top internship programs absolutely validates the incredible program we have in place, but we have big plans for even more creative ways to attract talented college students in 2018 and beyond,” Christine said.
Oster Thrives in LATAM
In 2017, consumers in Latin America embraced Oster’s key promises of power and performance. Driven by high demand for products such as the Xpert Series™ blender and the Prima Latte™ Espresso, Cappuccino & Latte Machine, sales in our Appliance and Cookware Division grew at a double-digit rate in the region.
Admiring the Sights of London with Parker
For the first time in 10 years, Parker was back on the air with an advertising campaign in the United Kingdom promoting the iconic Jotter pen, featured in a range of colors inspired by famous London landmarks.
The Jotter campaign included TV spots, a social media and influencer campaign, in-store displays, promo packs and an experiential Jotter London activation on university campuses. During the campaign, Jotter sell-out almost doubled versus the same period in 2016 and continued to drive accelerated growth after the campaign ended.
Brilliant Design with Rubbermaid Brilliance®
Guaranteed not to leak, Rubbermaid Brilliance® food storage containers are intelligently crafted and beautifully designed. Paired with a splatter-resistant lid design, these BPA-free food storage containers are built with an airtight leak-proof seal, secure latches and built-in vents.
Rubbermaid Brilliance food storage containers also save space, with a modular design that perfectly stacks in consumers’ pantries, refrigerators or lunch bags.
Marmot Develops the Fabric of the Future
After two years of research, design and development, the next generation of synthetic insulation for outdoor apparel has arrived: Marmot® Featherless.
Featherless is the latest example of Marmot’s adventure-minded philosophy, inspiring athletes to get out and explore no matter the conditions. With warmth equal to 700 fill power down, Featherless is ultralight, packable and stays warm when wet.
Life by Newell

Newell Brands 2017 Annual Report 4
Keeping Children Safe & Snug with Graco
One of the most impactful innovations in the infant car seat industry in years, Graco SnugRide® SnugLock® Infant Car Seats were designed with a hassle-free installation process using either a vehicle seat belt or Graco’s LATCH technology. After three simple steps, parents hear that “click” and feel confident that their car seat has been securely installed.
“ The SnugRide SnugLock Infant Car Seat eliminates the guesswork often associated with car seat installation and provides parents peace of mind that their baby is secure when they take to the road,” said Erin Varano, Brand Marketing Director at Graco.
The SnugRide SnugLock platform will expand the SnugLock installation technology to a broad set of Graco offerings in 2018.
Jostens Continues Tradition of Commemorating Champions
To celebrate their first MLB World Series™ championship in 108 years, Jostens partnered with the Chicago Cubs™ on a new retail store concept for sports collectibles and memorabilia, giving consumers the opportunity to interact with the Jostens® brand in a differentiated channel. The Jostens Store at The Park at Wrigley Field is a first-of-its-kind, exclusive partnership between a professional sports team and a jewelry manufacturer.
Additionally, Jostens continues to be the trusted partner to capture the championship stories of more major sports league champions than any other company.
First Alert Sparks Innovation with Onelink®
The innovative, easy-to-install Onelink® Safe & Sound is the first alarm system that combines intelligent protection from smoke, fire and carbon monoxide with superior two-way audio capabilities and compatibility with connected home platforms, including Amazon Alexa, Apple HomeKit and Google Assistant.
Onelink was unveiled at the Consumer Electronics Show (CES), the world’s largest tradeshow for innovators and breakthrough technologies, in Las Vegas, Nevada, and showcased at the International Builders Show (IBS), which attracts 60,000 construction professionals each year, in Orlando, Florida.
Pure Fishing Catches Praise at ICAST
Newell Brands’ Fishing Division appeared at the International Convention of Allied Sportfishing Trades (ICAST), the world’s largest sport fishing trade show, showcasing the latest innovations in tackle, gear, accessories and apparel.
While at the show, our brands were recognized in the following categories:
Best of Category — Fishing LineBerkley Fireline Ultra 8
Best of Category — Fly ReelPflueger Supreme QRS Fly Reel
First Runner-Up — Saltwater ReelPENN International VI — 50VISW
Chesapeake Bay Candle Joins the Home Fragrance Division
Newell Brands proudly welcomed Chesapeake Bay Candle to our dynamic Home Fragrance portfolio of brands in September 2017, following the addition of WoodWick in January 2017.
“ We are excited to join the family of Newell Brands and the Home Fragrance division. Together with Yankee Candle and WoodWick, we intend to inspire consumers worldwide to celebrate life’s every occasion,” said Mei Xu, Co-Founder and CEO of Chesapeake Bay Candle.
Life by Newell
Newell Brands 2017 Annual Report 5
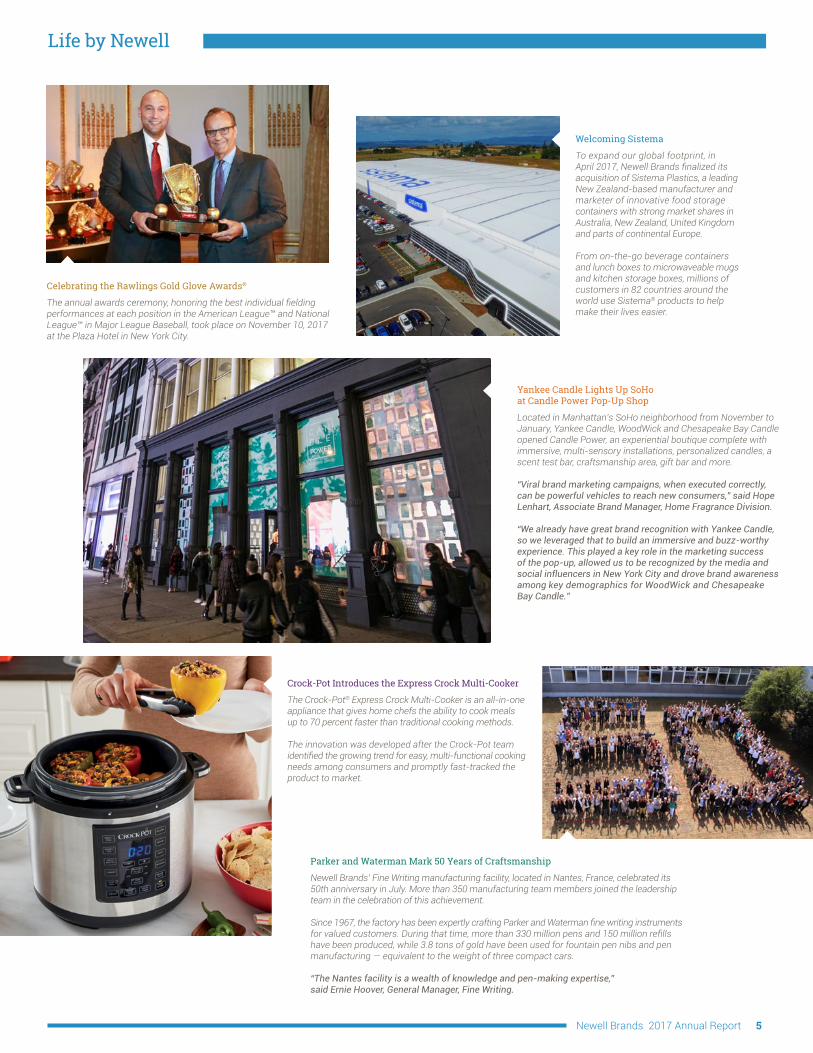
Yankee Candle Lights Up SoHo at Candle Power Pop-Up Shop
Located in Manhattan’s SoHo neighborhood from November to January, Yankee Candle, WoodWick and Chesapeake Bay Candle opened Candle Power, an experiential boutique complete with immersive, multi-sensory installations, personalized candles, a scent test bar, craftsmanship area, gift bar and more.
“Viral brand marketing campaigns, when executed correctly, can be powerful vehicles to reach new consumers,” said Hope Lenhart, Associate Brand Manager, Home Fragrance Division.
“We already have great brand recognition with Yankee Candle, so we leveraged that to build an immersive and buzz-worthy experience. This played a key role in the marketing success of the pop-up, allowed us to be recognized by the media and social influencers in New York City and drove brand awareness among key demographics for WoodWick and Chesapeake Bay Candle.”
Parker and Waterman Mark 50 Years of Craftsmanship
Newell Brands’ Fine Writing manufacturing facility, located in Nantes, France, celebrated its 50th anniversary in July. More than 350 manufacturing team members joined the leadership team in the celebration of this achievement.
Since 1967, the factory has been expertly crafting Parker and Waterman fine writing instruments for valued customers. During that time, more than 330 million pens and 150 million refills have been produced, while 3.8 tons of gold have been used for fountain pen nibs and pen manufacturing — equivalent to the weight of three compact cars.
“The Nantes facility is a wealth of knowledge and pen-making expertise,” said Ernie Hoover, General Manager, Fine Writing.
Crock-Pot Introduces the Express Crock Multi-Cooker
The Crock-Pot® Express Crock Multi-Cooker is an all-in-one appliance that gives home chefs the ability to cook meals up to 70 percent faster than traditional cooking methods.
The innovation was developed after the Crock-Pot team identified the growing trend for easy, multi-functional cooking needs among consumers and promptly fast-tracked the product to market.
Welcoming Sistema
To expand our global footprint, in April 2017, Newell Brands finalized its acquisition of Sistema Plastics, a leading New Zealand-based manufacturer and marketer of innovative food storage containers with strong market shares in Australia, New Zealand, United Kingdom and parts of continental Europe.
From on-the-go beverage containers and lunch boxes to microwaveable mugs and kitchen storage boxes, millions of customers in 82 countries around the world use Sistema® products to help make their lives easier.
Life by Newell
Celebrating the Rawlings Gold Glove Awards®
The annual awards ceremony, honoring the best individual fielding performances at each position in the American League™ and National League™ in Major League Baseball, took place on November 10, 2017 at the Plaza Hotel in New York City.

Newell Brands 2017 Annual Report 6
Going Green with Eco-Products
Eco-Products is one of the Waddington Group’s most dynamic brands.
Increasing interest in sustainability has fueled the brand’s growth and further cemented its position as the leading provider of environmentally friendly foodservice packaging.
Rubbermaid Commercial Products Awarded Grant from State of Virginia
In recognition of its contributions to the community and local economy, Rubbermaid Commercial Products received a $500,000 grant from the Virginia Port Authority to enhance its local operations and investment in the Winchester-based facility’s infrastructure.
Designing for the Future in Kalamazoo
Our design team, located at the Newell Brands Design Center in Kalamazoo, Michigan, has grown to more than 150 industrial and graphic designers. At the state-of-the-art facility, these experts collectively integrate design-oriented and innovative thinking to our portfolio of brands and fuel the growth of product innovation.
Life by Newell
Newell Brands Launches Go Teach!
Last spring, Newell Brands introduced Go Teach!, a powerful initiative designed to inspire, empower and motivate teachers to keep doing what they love — teaching. The program, in tandem with our Sharpie, Paper Mate and Expo brands, embraces teachers of all grades, subjects and experience levels.
Currently, more than 127,000 teachers are part of the Go Teach! community and Newell Brands donated 100,000 product samples during 2017.
“ We love America’s teachers and are inspired by their dedication and the efforts they put forth for their students every single day,” said Victor Misawa, Senior Vice President of Marketing, Writing & Creative Expression. “We want to do our part to help them and America’s youth continue to thrive. We are cheering for them, Go Teach!”
Contigo Features Spill-Proof AUTOSEAL® Technology in TV Campaign
Contigo’s first television commercial was broadcast in April 2017, and based on its success, Contigo was back on the air during the holiday season, featuring the West Loop travel mug with AUTOSEAL® technology.

Newell Brands 2017 Annual Report 7
We have taken decisive action to simplify business systems, take out costs and invest in new e-commerce capabilities, product design and talent across the broader portfolio. Thus far, we’ve realized a significant number of achievements:
• Restructuring the company from 32 discrete business units to 15 operating divisions;
• Scaling a new enterprise-wide E-commerce Division that grew at a strong double-digit rate;
• Sharpening the focus of the portfolio by completing three bolt-on acquisitions and eight divestitures;
• Generating over $350 million in annual savings and synergies;• Building the size of our future innovation funnel,
particularly on our recently acquired brands• Delivering competitive levels of core sales growth and
increasing U.S. market share by more than 70 basis points;• Combining the net proceeds of divestitures with over
$930 million in operating cash flow to repay $1.4 billion in debt in 2017, cumulatively paying down debt by $3.4 billion since the completion of the Jarden acquisition in 2016; and
• Returning over $580 million to shareholders in the form of dividends and share repurchases.
This progress was significant and accomplished in the context of a difficult U.S. retail landscape and an increasingly inflationary environment which created headwinds for the company and in some ways masked the progress we have made.
Letter to ShareholdersA Letter To Our Shareholders
Accelerating the Transformation2017 was a transformational year for our Company as two legacy businesses came together as Newell Brands, operating as one organization, under one corporate strategy.
In the context of these challenging retailer realities, we have launched an Accelerated Transformation Plan. This plan will create a company that is simpler, faster and stronger. We are focused on becoming a leading branded consumer goods company, with an emphasis on strengthening margins and cash generation while positioning Newell Brands for future growth.
We’ve identified a path to simplify the company by focusing on a core group of consumer facing brands and categories that will be most responsive to our competitively-advantaged capabilities in product design, innovation and e-commerce, and therefore have the greatest potential to win in our global categories and generate value for shareholders. We will capture that potential by capitalizing on Newell Brands’ scale and differentiated capabilities to drive market share gains through innovation, e-commerce and international deployment. We will create this scaled consumer goods portfolio through a set of accretive divestiture opportunities to be executed at competitive market multiples. At the same time, we’ll continue our uncompromising drive to reduce costs, simplify operations and improve operating efficiencies — all with a goal of increasing operating income, improving financial flexibility, and increasing free cash flow and the return of capital to shareholders.
This work will be guided by a Board of Directors that recently welcomed six new independent directors. Your refreshed Board consists of seasoned leaders who bring significant experience, collective expertise, and a shared understanding of the complexities of our business and our strategy to win in a rapidly changing retail landscape. Together, we’re excited about transforming the power and potential of Newell Brands to create value for our shareholders.
A sincere thanks to all my Newell Brands colleagues who continue to work exceptionally hard to make this a reality, and to you for your continued support.
Michael B. PolkChief Executive Officer

Newell Brands 2017 Annual Report 8
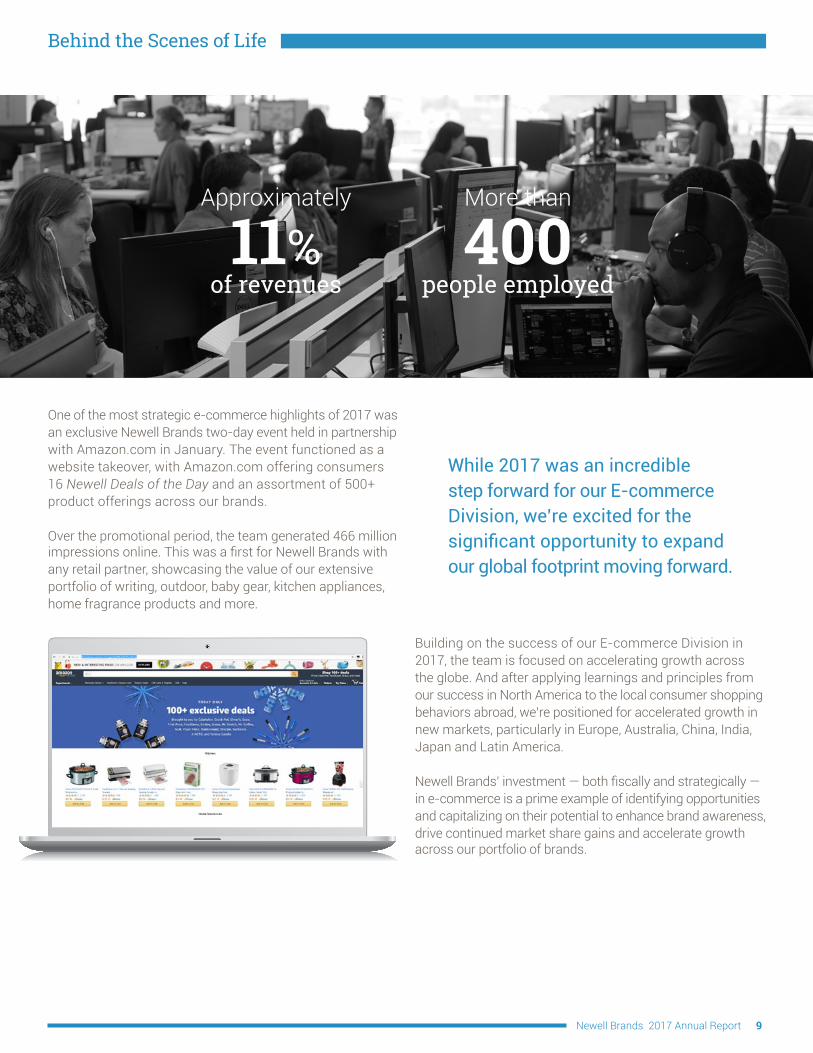
Behind the Scenes of Life: E-commerce
2017 was a transformative year for our E-commerce Division, which now employs more than 400 people. These e-commerce experts helped generate strong double-digit growth in 2017 across our E-commerce business. In fact, e-commerce now represents approximately 11 percent of Newell Brands’ revenues.
The E-commerce team developed a competitive advantage by leveraging talented people and world-class technology, focusing intensely on driving results and activating nimbly across our portfolio of brands. As a result, this advantaged capability generated strong double-digit sales growth across three e-commerce channels: pure-play partners, retailer.com sites and our own brands’ individual direct-to-consumer sites.
E-commerce Division Wired for Success
Newell Brands 2017 Annual Report 9
While 2017 was an incredible step forward for our E-commerce Division, we’re excited for the significant opportunity to expand our global footprint moving forward.
One of the most strategic e-commerce highlights of 2017 was an exclusive Newell Brands two-day event held in partnership with Amazon.com in January. The event functioned as a website takeover, with Amazon.com offering consumers 16 Newell Deals of the Day and an assortment of 500+ product offerings across our brands. Over the promotional period, the team generated 466 million impressions online. This was a first for Newell Brands with any retail partner, showcasing the value of our extensive portfolio of writing, outdoor, baby gear, kitchen appliances, home fragrance products and more.
Behind the Scenes of Life
More than
400 people employed
Approximately
11% of revenues
Building on the success of our E-commerce Division in 2017, the team is focused on accelerating growth across the globe. And after applying learnings and principles from our success in North America to the local consumer shopping behaviors abroad, we’re positioned for accelerated growth in new markets, particularly in Europe, Australia, China, India, Japan and Latin America.
Newell Brands’ investment — both fiscally and strategically — in e-commerce is a prime example of identifying opportunities and capitalizing on their potential to enhance brand awareness, drive continued market share gains and accelerate growth across our portfolio of brands.
Newell Brands 2017 Annual Report 10
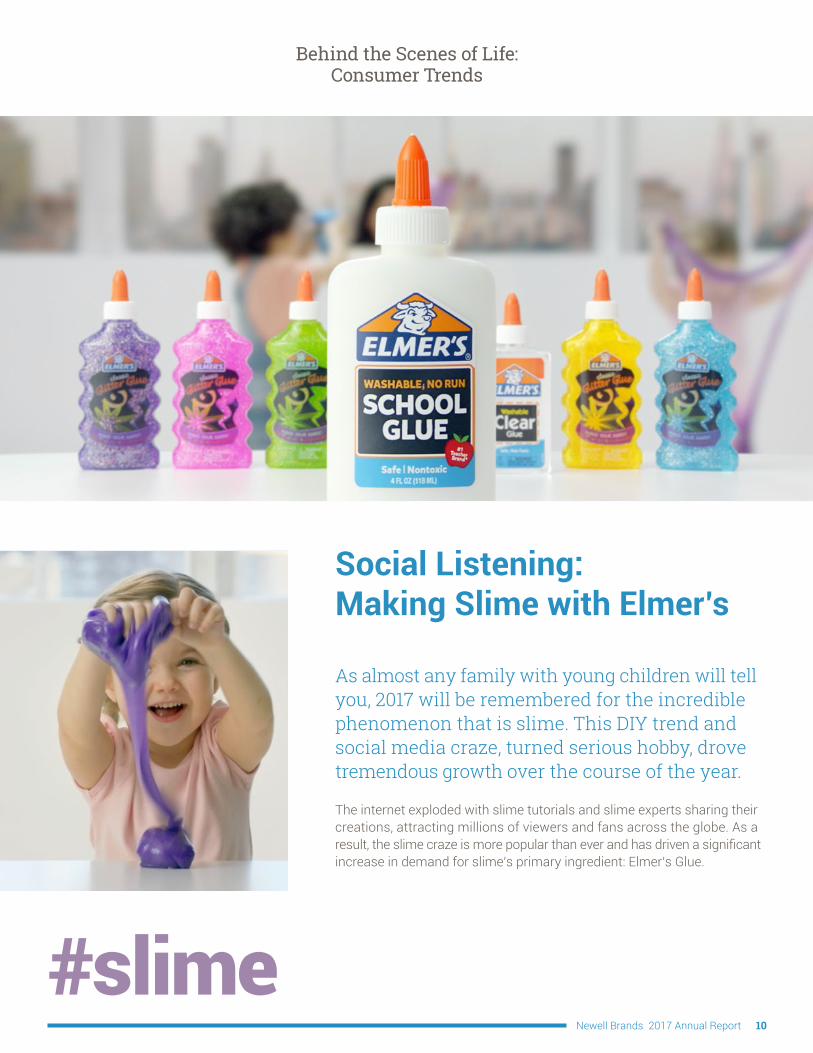
Behind the Scenes of Life: Consumer Trends
Social Listening: Making Slime with Elmer’s
As almost any family with young children will tell you, 2017 will be remembered for the incredible phenomenon that is slime. This DIY trend and social media craze, turned serious hobby, drove tremendous growth over the course of the year.
The internet exploded with slime tutorials and slime experts sharing their creations, attracting millions of viewers and fans across the globe. As a result, the slime craze is more popular than ever and has driven a significant increase in demand for slime’s primary ingredient: Elmer’s Glue.
#slime

Newell Brands 2017 Annual Report 11
Behind the Scenes of Life
Slime has not only become popular among children and teens, but even adults! It’s an easy craft product to create at home or school, simply requiring Elmer’s Glue, baking soda and contact lens solution. The possibilities are endless for crafters to personalize slime, adding anything from food coloring and glitter, to sparkles and more. Before the slime phenomenon began, the number one selling item for Elmer’s was the 4 oz. White School Glue. Today, the best-selling Elmer’s item is the gallon-size White School Glue, thanks to consumers’ creating multiple “extra-large” batches of slime to share with family and friends.
The Elmer’s marketing team leapt into action to fuel the demand even further, creatively developing new product lines and gift packs, including Elmer’s Magical Liquid, Elmer’s Slime Starter Kits, Elmer’s Slime Packs and, most recently, Glow in the Dark Glue. As one of Newell’s biggest marketing successes of 2017, Elmer’s bottled almost 200 million bottles of glue throughout the year.

Newell Brands 2017 Annual Report 12
Behind the Scenes of Life: Buying Experiences
Personalizing America’s Favorite Candle
Already known for its expressive fragrances, Yankee Candle doubled down on the power of scented candles to create intimate connections with consumers by introducing Personalized Photo Candles that commemorate fun occasions and capture a moment in time.
The concept was sparked after the Yankee Candle team identified a growing consumer trend: a desire for tailored purchasing experiences and custom products with a personal connection.

Newell Brands 2017 Annual Report 13
Yankee Candle’s Personalized Photo Candles allow consumers to select their preferred candle style, their favorite fragrance and a personal photo of their choosing to create their own personalized candle label. The program represents the brand’s commitment to connecting people to special moments in their lives and bringing those moments to life every time they light their Personalized Photo Candle, providing a keepsake to be enjoyed far longer than the candle burns.
An employee idea that was first brought to life on Yankee Candle’s direct to consumer website in 2015, Personalized Photo Candles were featured in a Q4 2016 holiday television advertisement that touted the capability online and generated an enthusiastic response from Yankee Candle fans. Following its success, in the first quarter of 2017, the decision was made to roll out the capability to Yankee Candle’s 500+ retail stores.
In the span of only a few months, a cross-functional team was assembled to deploy the technology to Yankee Candle’s retail stores in time for Mother’s Day 2017. Beginning approximately four weeks prior to the holiday, the team began airing television advertising spots, promoting the roll-out of the Personalized Photo Candle capability at Yankee Candle retail locations.
Behind the Scenes of Life
As a result, in-store revenue for the pre-Mother’s Day Saturday was the strongest in company history, with nearly 23,000 Personalized Photo Candles sold that day and more than 50,000 over the course of the weekend. Importantly, online sales of Personalized Photo Candles also benefited from the advertising, growing nearly 300 percent throughout the campaign. The combination of the television campaign and in-store marketing programs promoting Personalized Photo Candles drew in new customers at nearly double the typical rate. An ideal way to celebrate and capture an array of special moments in addition to holidays like Mother’s Day, Yankee’s Personalized Photo Candles exemplify Newell Brands’ commitment to offering consumers innovative, design-focused products.

Newell Brands 2017 Annual Report 14
Behind the Scenes of Life: Product Innovation
Winning with Parents
With mid- to high-single-digit sales growth over the past three years, Newell Brands’ Baby business has been one of our best performers — a dramatic proof point that our strategy of investing in consumer insights, design and brand development can generate extraordinary results.
In 2017, the Baby team continued its track record of success, focusing on delivering compelling offerings to parents, driving both market share gains and category growth.
One of our most exciting innovations this year was the SnugRide® SnugLock® Car Seat, a powerhouse product designed with a hassle-free installation process and a definitive “click” that reassures parents that the car seat has been securely and safely installed. This Snug-Lock technology will be leveraged across a broad set of Graco offerings in 2018 that offer similar safety and reassurance benefits.
Generated
49% U.S. revenue
via online sales

Newell Brands 2017 Annual Report 15
Behind the Scenes of Life
Baby Jogger® also introduced compelling innovation this year with the introduction of the City Select® LUX and City Tour® strollers. City Select LUX offers parents more than 20 riding options for their children, more than any other single-to-double stroller, while City Tour® features a patented quick-fold technology that gives parents the ability to fold the stroller with just one hand, providing the ease and flexibility they need. From a Baby Care perspective, NUK released a new NUK® Bottle platform: the Simply Natural® collection, designed to imitate the bond between a mother and child during breastfeeding. Following intensive product research with experts, including pediatricians, midwives and moms, the product gives baby a close-to-mom feel never before found from a bottle.
In Asia, Aprica intoduced its Fladea Grow ISOFIX product, a car seat that supports children from the time a child is born to five years. The Baby Division’s online penetration has grown considerably, with 49 percent of its revenue in the U.S. now generated via online sales, offering parents the convenience and researchability that they desire when purchasing baby products and providing a more seamless buying experience. Graco’s leadership position in the industry and increased investment in product innovation were essential to driving our success in 2017. But the real success was and will continue to be keeping more parents and their children safe, the truest and most important trademark of Newell Brands’ best-in-class Baby Division brands.

Newell Brands 2017 Annual Report 16
Behind the Scenes of Life: Execution
Last October, Calphalon cemented its leadership in the cookware industry by solving an everyday kitchen dilemma — space.
The Calphalon Premier™ Space Saving Cookware — a first-of-its-kind innovation — securely stacks to save 30 percent more space*. The unique design allows for the cookware to stack and nest in any order**, making it easy for home chefs to stack and store the product any way they want.
Ever wonder how such a revolutionary idea comes to fruition? We asked Caleb Gossens, an Industrial Designer at our Design Center in Kalamazoo, Michigan, just that. The concept for space saving cookware came about when Caleb was considering and reviewing previously developed ideas to solve the cookware clutter issue that many consumers face. “Accessibility and organization are the biggest pain points everyone with cookware deals with,” said Caleb. “So how can we make storing and using cookware easier?”
From Concept to Execution: Calphalon Premier™
Space Saving Cookware
**Average space saved vs. like non-stacking Calphalon cookware items when stacked with like-diameter Premier Space Saving items**Cookware must have same diameter

Newell Brands 2017 Annual Report 17
He began brainstorming the parameters that would successfully accomplish the following goal: being able to nest a full line of cookware — not just a couple of pieces — in any order without compromising on the size of the cookware. This would maximize space and help organize the cupboard, improving convenience and consumer experience with cookware storage.
From there, Caleb began designing. After positive feedback from his Design Center teammates, he prepared his prototype and pitched his design to the leadership team in Kalamazoo — and it was well received.
Behind the Scenes of Life
Calphalon’s brand leaders then fast-tracked the concept immediately into product testing where it was met with extremely high testing scores. Working closely with the engineering, manufacturing, design and brand teams, Caleb led the industrial design of the product and developed an aesthetic that incorporated the premium durable and functional qualities of the Calphalon brand. Fast forward to October, the Calphalon Premier™ Space Saving Cookware hit the shelves to great success in the consumer market. During the fourth quarter, the line accounted for approximately 15 percent of Calphalon’s Cookware sales, and the 10-piece set, which includes every individual Space Saving piece, was one of the brand’s best-selling offerings. The overall success of the launch proves one of Newell Brands’ driving precepts — that an innovative concept paired with smart execution results in remarkable returns.
Accessibility and organization are the biggest pain points everyone with cookware deals with. So how can we make storing and using cookware easier?
Caleb Gossens, an Industrial Designer at our Design Center in Kalamazoo, Michigan

Newell Brands 2017 Annual Report 18
OperationsGOALS & PROGRESSNewell Brands practices good corporate citizenship by working to decrease our operational footprint. Since our April 2016 acquisition of Jarden Corporation, Newell Brands has developed new goals for reducing our impact relative to our 2016 baseline:
• Reduce overall energy use by 25 percent by 2025; and • Reduce waste to landfill at top manufacturing sites by
90 percent by 2025.
As of the end of 2017, we have reduced energy use by 4 percent and waste to landfill by 20 percent versus 2016. Newell Brands has created discipline in our progress toward these goals through science-based targets, which we initially established in 2015 and are updating to reflect our broader portfolio. We also use a real-time analytics platform for our major facilities that utilizes smart meters and a cloud computing application. With this platform, our manufacturing facilities can visualize energy usage with pinpoint accuracy and receive information critical to improving the efficiency of their equipment.
Our customers are also inspiring us to do more. Building upon Walmart’s Project Gigaton, Newell Brands is partnering with Walmart to reduce CO2 emissions by 150,000 metric tons by 2025 across our supply chain. We will accomplish this through changes in transportation, logistics, manufacturing and packaging.
SUSTAINABILITY GOVERNANCEOversight for sustainability at Newell Brands rests with our Sustainability Council, which is comprised of a cross-functional mix of senior-level employees that help to shape the strategic direction for our sustainability program. This council continues to evolve and expand to reflect our new organization.
The council is supported by Sustainability Champions, employees across Newell who lead the charge to improve environmental performance, operational efficiencies and cost savings at their respective locations. These Champions participate in quarterly calls with our Sustainability Council to share initiatives and successes. In 2017, we introduced a new web-based portal for easy access and collaboration. Champions use this platform to share their local success stories, but also to share ideas and engage across the Champions network. In 2017, we had nearly 70 Sustainability Champions and 150 initiatives posted on the web portal. The Deployment Committee continues to onboard new Champions with the goal of having representatives from each of our locations to further drive performance.
Environmental, Social and Governance Review

Newell Brands 2017 Annual Report 19
ESG
SUCCESS STORIES
A Cutting-Edge Solution for Producing Blades Our manufacturing facility in McMinnville, Tennessee produces professional beauty, barber and animal grooming tools under the Oster Professional Products brand. At the heart of the business are the blades that are produced for the finished clippers. A byproduct of blade production is a coolant and water mixture that cannot be ultra-filtered and must be disposed offsite. Five years ago, the facility was generating about 5,000 gallons of this waste coolant water at a disposal cost of roughly $1,750 per week. Since then, the site has invested in a gas-powered evaporation system that boils the water off of waste liquids, leaving only the sludgy solids for disposal. The installation has prevented 750,000 gallons of wastewater from being shipped to the landfill, reducing disposal costs by more than $237,000 over that period.
-750,000 gallons of wastewater
Shining Light on Energy Savings When a local utility company near Sedalia, Missouri offered a rebate for LED lighting upgrades, our Jostens facility decided to take the plunge. We replaced 72 high bay lights with 31,000-lumen, 225-watt LEDs. The rebates covered the cost of the lights, so all the facility had to pay for were taxes. The facility will also save over the long run: the new lights draw 37 percent less energy than their predecessors, leading to annual savings of $10,000.
37%energy savings
Making Corrections for EfficiencyOur Liquid Paper facility in Thailand is implementing improvements and boosting employee knowledge in all areas of environmental management. The facility has a goal of reducing electricity consumption by 15 percent and annual water use by 3 percent. Energy reduction projects include updating large equipment, such as chillers, that significantly affect the facility’s energy usage, saving approximately 1 million watts of energy for certain processes. The facility is also currently evaluating the installation of solar panels. In addition, the facility sells all solvents and waste to recyclers and waste management companies.
Target of
-15%electricity consumption

Newell Brands 2017 Annual Report 20
ESG
SOCIAL COMPLIANCE PROGRAMS Newell Brands considers our suppliers to be extensions of our business and, accordingly, expects them to conduct their businesses ethically and in a socially and environmentally responsible manner. In 2017, we updated our social compliance program and harmonized it across all Newell Brands. This included updates to key program materials such as our Vendor Code of Conduct and Responsible Sourcing Manual to outline compliance standards and expectations for suppliers. The program has been recognized as a leader by customers such as Walmart, Costco and CVS.
Social compliance audits are one way we learn of supplier risks. We use audits as a starting point to drive long-term sustainable improvements with our suppliers. Audits are conducted against our Vendor Code of Conduct and assess suppliers on laws and regulations, wages and benefits, working hours, labor practices, environmental health and safety and subcontracting. Based upon findings from audits, we develop comprehensive corrective action plans with suppliers that apply root cause analysis with a focus on full issue resolution and continuous improvement.
CONTINUOUS IMPROVEMENT We help our suppliers improve through both in-person and online training. In late 2017, we brought together 400 representatives from strategic suppliers across divisions for training events in Shenzhen and Shanghai, China. At these events, we invited suppliers to share how they have been able to drive performance within their own factories and turn challenges into successes. The events culminated with an award ceremony recognizing outstanding suppliers. Training topics included:
• Social compliance program and overview• Audit trends, top findings and remediation strategies • Compliance software overview• Establishing effective management systems and
best practices • Supplier presentations: examples of factory
continuous improvement • Walmart responsible sourcing presentation and
program updates• Working hours and continuous improvement• The importance of transparency • Building a proactive culture of fire safety • Environmental protection campaign • Subcontractor management and requirements • Supply chain security
Newell also conducts quarterly webinars on topics including corrective action plans, environmental management systems, engagement of factory supervisors and recognizing and preventing forced labor. Divisional trainings with internal teams continue with the goal of driving program awareness and engagement from internal stakeholders.
Supply Chain
600 social compliance audits conducted
2017
We use audits as a starting point to drive long-term sustainable improvements with our suppliers.
Newell Brands 2017 Annual Report 21
ESG
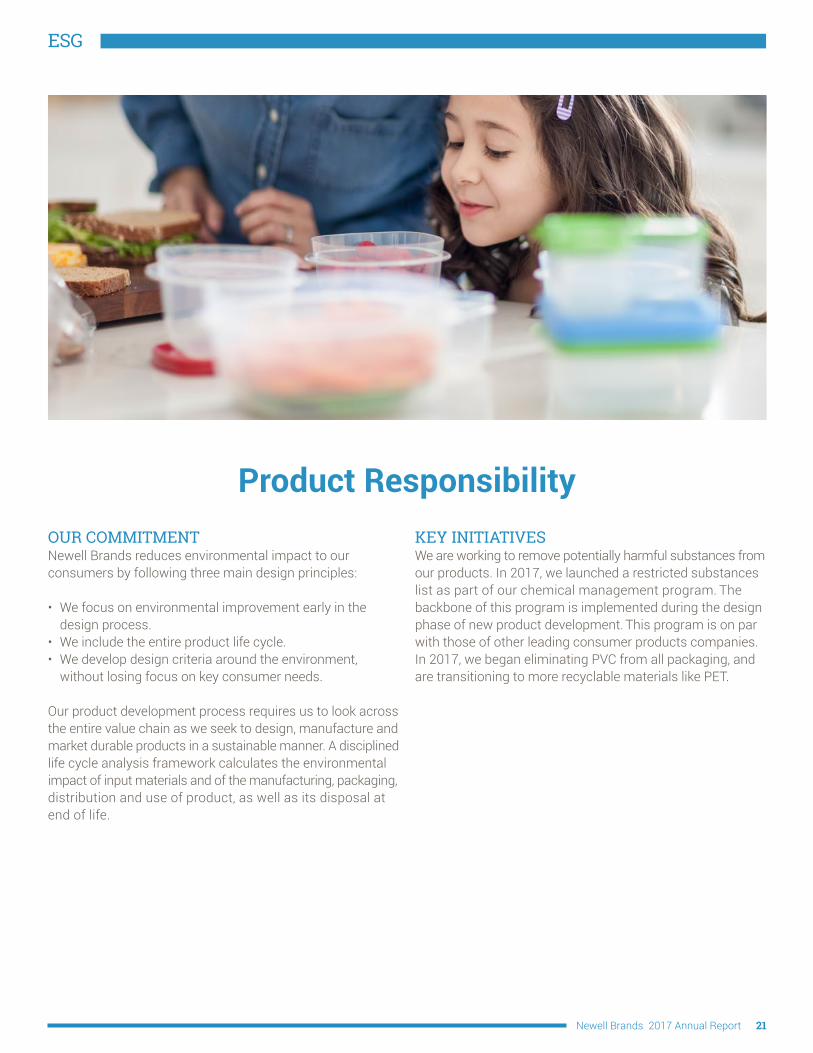
OUR COMMITMENT Newell Brands reduces environmental impact to our consumers by following three main design principles:
• We focus on environmental improvement early in the design process.
• We include the entire product life cycle.• We develop design criteria around the environment,
without losing focus on key consumer needs.
Our product development process requires us to look across the entire value chain as we seek to design, manufacture and market durable products in a sustainable manner. A disciplined life cycle analysis framework calculates the environmental impact of input materials and of the manufacturing, packaging, distribution and use of product, as well as its disposal at end of life.
KEY INITIATIVES We are working to remove potentially harmful substances from our products. In 2017, we launched a restricted substances list as part of our chemical management program. The backbone of this program is implemented during the design phase of new product development. This program is on par with those of other leading consumer products companies. In 2017, we began eliminating PVC from all packaging, and are transitioning to more recyclable materials like PET.
Product Responsibility

Newell Brands 2017 Annual Report 22
ESG
Rubbermaid and Sistema food storage containers, such as the FreshWorks Produce Saver, replace disposable plastic bags and keep food fresher longer, helping address the global issue of food waste.
Contigo water bottles reduce the need for single-use plastic bottles.
Rubbermaid Commercial Products’ Microburst 3000® aerosol system is powered by the LumeCel™ rechargeable energy system, eliminating the need for alkaline batteries. The unit is also 100 percent recyclable.
Through its EnviroFree initiative, Marmot seeks to reduce chemical applications in the manufacturing process, such as durable water repellent finishes in sportswear products and PVC and phthalate inks in printing.
Environmentally ResponsibleAt Newell Brands, we work hard to create products with sustainable attributes:
Nearly all of Eco-Products’ containers, cups and utensils are made from environmentally friendly materials and are recyclable or compostable after use.
Rubbermaid Commercial Products offers recycling bins of all types for consumer and commercial use that make recycling easy, and many are made from recycled or renewable materials that allow building owners to earn LEED credits.

Newell Brands 2017 Annual Report 23
$591
$1,224$1,341
Normalized Net Income
in m
illio
ns
2016 20172015
Financial Performance
$5.9
$13.3$14.7
Net Sales
in b
illio
ns
2016 20172015
$0.76 $0.76$0.88
Dividends Per Share
2016 20172015
$5.6 Live $2.8 Learn $2.8 Work $2.6 Play $1.0 Other
2017 Net Sales by Segment (in billions)
$14.7
$11.3 North America $ 1.8 Europe, Middle East, Africa $ 0.8 Latin America $ 0.8 Asia Pacific
2017 Net Sales by Geography (in billions)
$14.7
OUR PERFORMANCE
Newell Brands
Newell Brands 2017 Annual Report 24
Corporate Information
Newell Brands
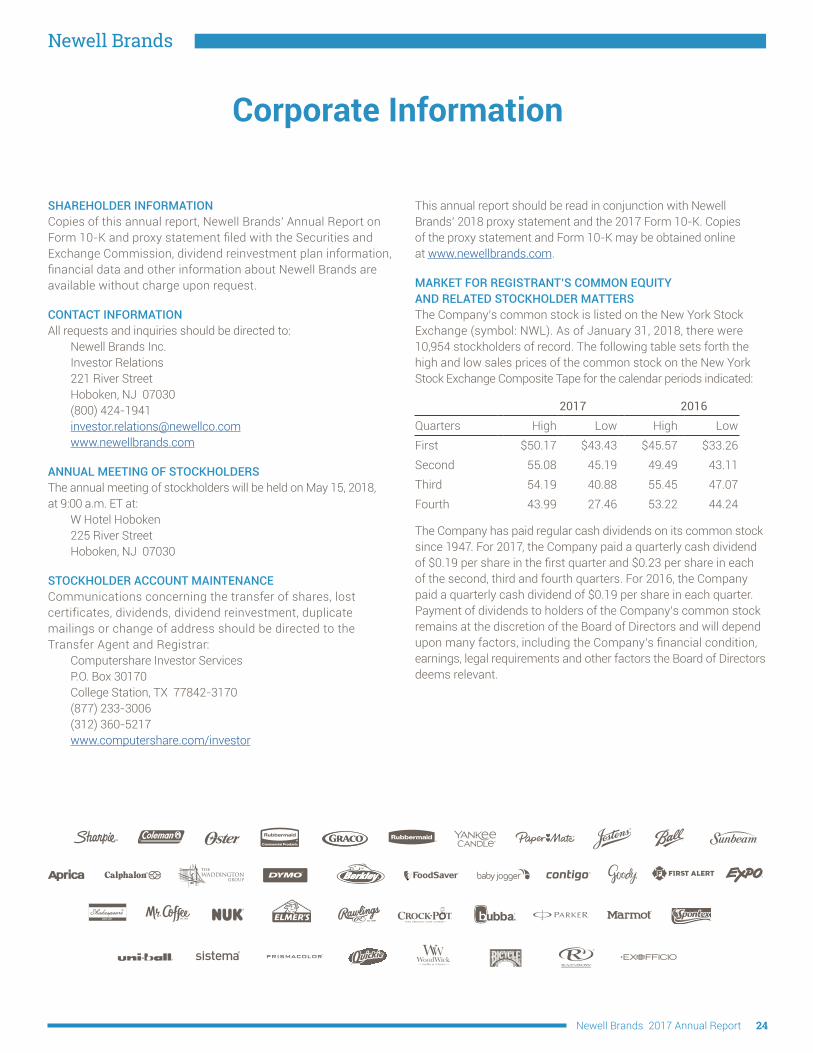
SHAREHOLDER INFORMATIONCopies of this annual report, Newell Brands’ Annual Report on Form 10-K and proxy statement filed with the Securities and Exchange Commission, dividend reinvestment plan information, financial data and other information about Newell Brands are available without charge upon request.
CONTACT INFORMATIONAll requests and inquiries should be directed to: Newell Brands Inc. Investor Relations 221 River Street Hoboken, NJ 07030 (800) 424-1941 [email protected] www.newellbrands.com
ANNUAL MEETING OF STOCKHOLDERSThe annual meeting of stockholders will be held on May 15, 2018, at 9:00 a.m. ET at: W Hotel Hoboken 225 River Street Hoboken, NJ 07030
STOCKHOLDER ACCOUNT MAINTENANCECommunications concerning the transfer of shares, lost certificates, dividends, dividend reinvestment, duplicate mailings or change of address should be directed to the Transfer Agent and Registrar: Computershare Investor Services P.O. Box 30170 College Station, TX 77842-3170 (877) 233-3006 (312) 360-5217 www.computershare.com/investor
This annual report should be read in conjunction with Newell Brands’ 2018 proxy statement and the 2017 Form 10-K. Copies of the proxy statement and Form 10-K may be obtained online at www.newellbrands.com.
MARKET FOR REGISTRANT’S COMMON EQUITY AND RELATED STOCKHOLDER MATTERSThe Company’s common stock is listed on the New York Stock Exchange (symbol: NWL). As of January 31, 2018, there were 10,954 stockholders of record. The following table sets forth the high and low sales prices of the common stock on the New York Stock Exchange Composite Tape for the calendar periods indicated:
2017 2016Quarters High Low High LowFirst $50.17 $43.43 $45.57 $33.26Second 55.08 45.19 49.49 43.11Third 54.19 40.88 55.45 47.07Fourth 43.99 27.46 53.22 44.24
The Company has paid regular cash dividends on its common stock since 1947. For 2017, the Company paid a quarterly cash dividend of $0.19 per share in the first quarter and $0.23 per share in each of the second, third and fourth quarters. For 2016, the Company paid a quarterly cash dividend of $0.19 per share in each quarter. Payment of dividends to holders of the Company’s common stock remains at the discretion of the Board of Directors and will depend upon many factors, including the Company’s financial condition, earnings, legal requirements and other factors the Board of Directors deems relevant.
®
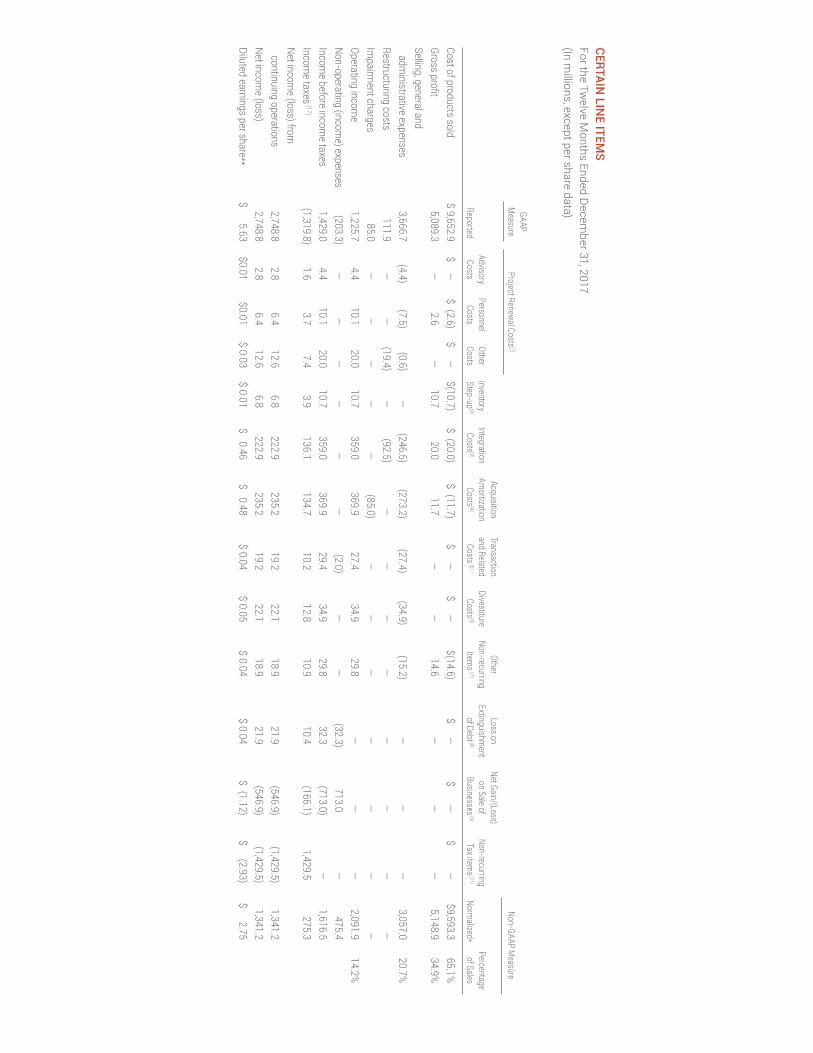
CERTAIN LIN
E ITEMS
For the Twelve M
onths Ended Decem
ber 31, 2017(In m
illions, except per share data)
GAAP
M
easure Project Renewal Costs
(1) Non-GAAP M
easure
Acquisition Transaction
Other
Loss on Net Gain/(Loss)
Advisory
Personnel Other
Inventory Integration
Amortization
and Related Divestiture
Non-recurring Extinguishm
ent on Sale of
Non-recurring
Percentage
Reported
Costs Costs
Costs Step-up
(2) Costs
(3) Costs
(4) Costs
(5) Costs
(6) Item
s (7) of Debt (8)
Businesses (9)
Tax items
(11) Norm
alized* of Sales
Cost of products sold $ 9,652.9
$ —
$ (2.6) $ —
$(10.7)
$ (20.0) $ (11.7)
$ —
$ —
$(14.6) $ —
$ —
$ —
$9,593.3
65.1%Gross profit
5,089.3 —
2.6
—
10.7 20.0
11.7 —
—
14.6
—
—
—
5,148.9 34.9%
Selling, general and
administrative expenses
3,666.7 (4.4)
(7.5) (0.6)
—
(246.5) (273.2)
(27.4) (34.9)
(15.2) —
—
—
3,057.0
20.7%Restructuring costs
111.9 —
—
(19.4)
—
(92.5) —
—
—
—
—
—
—
—
Impairm
ent charges 85.0
—
—
—
—
—
(85.0) —
—
—
—
—
—
—
Operating income
1,225.7 4.4
10.1 20.0
10.7 359.0
369.9 27.4
34.9 29.8
—
—
—
2,091.9 14.2%
Non-operating (income) expenses
(203.3) —
—
—
—
—
—
(2.0)
—
—
(32.3) 713.0
—
475.4Incom
e before income taxes
1,429.0 4.4
10.1 20.0
10.7 359.0
369.9 29.4
34.9 29.8
32.3 (713.0)
—
1,616.5Incom
e taxes (17)
(1,319.8) 1.6
3.7 7.4
3.9 136.1
134.7 10.2
12.8 10.9
10.4 (166.1)
1,429.5 275.3
Net income (loss) from
continuing operations 2,748.8
2.8 6.4
12.6 6.8
222.9 235.2
19.2 22.1
18.9 21.9
(546.9) (1,429.5)
1,341.2Net incom
e (loss) 2,748.8
2.8 6.4
12.6 6.8
222.9 235.2
19.2 22.1
18.9 21.9
(546.9) (1,429.5)
1,341.2Diluted earnings per share**
$ 5.63 $0.01
$0.01 $ 0.03
$ 0.01 $ 0.46
$ 0.48 $ 0.04
$ 0.05 $ 0.04
$ 0.04 $ (1.12)
$ (2.93) $ 2.75

CERTAIN LIN
E ITEMS
For the Twelve M
onths Ended Decem
ber 31, 2016(In m
illions, except per share data)
GAAP
M
easure Project Renewal Costs
(1) Non-GAAP M
easure
Acquisition Transaction
Net Gain/(Loss)
Advisory Personnel
Other Inventory
Integration Am
ortization and Related
Divestiture Product
on Sale of Discontinued
Non-recurring
Percentage
Reported
Costs Costs
Costs Step-up
(2) Costs
(3) Costs
(4) Costs
(5) Costs
(6) Recall Costs
(7) Business
(9) Operations
(10) Tax item
s (11)
Normalized*
of Sales
Cost of products sold $8,865.2
$ (0.2) $ (6.3)
$ (7.1) $(479.5)
$ (5.1) $ (8.9)
$ —
$ —
$ —
$ —
$ —
$ —
$8,358.1 63.0%
Gross profit 4,398.8
0.2 6.3
7.1 479.5
5.1 8.9
—
—
—
—
—
—
4,905.9 37.0%
Selling, general &
administrative expenses
3,223.8 (9.3)
(20.0) (7.2)
—
(129.5) (145.8)
(61.7) (8.4)
(0.7) —
—
—
2,841.2
21.4%Restructuring costs
74.9 —
—
(9.9)
—
(65.0) —
—
—
—
—
—
—
—
Operating income
1,100.1 9.5
26.3 24.2
479.5 199.6
154.7 61.7
8.4 0.7
—
—
—
2,064.7 15.6%
Non-operating (income) expenses
285.6 —
—
—
—
(64.4)
—
—
—
—
160.2 —
—
381.4
Income (loss) before incom
e taxes 814.5
9.5 26.3
24.2 479.5
264.0 154.7
61.7 8.4
0.7 (160.2)
—
—
1,683.3Incom
e taxes (17)
286.0 3.6
10.0 9.2
168.1 96.2
52.6 32.9
3.2 0.3
(59.3) —
(143.2)
459.6Net incom
e (loss) from
continuing operations
528.5 5.9
16.3 15.0
311.4 167.8
102.1 28.8
5.2 0.4
(100.9) —
143.2
1,223.7Net incom
e (loss) 527.8
5.9 16.3
15.0 311.4
167.8 102.1
28.8 5.2
0.4 (100.9)
0.7 143.2
1,223.7 Diluted earnings per share**
$ 1.25 $0.01
$ 0.04 $ 0.04 $ 0.74
$ 0.39 $ 0.24
$ 0.07 $0.01
$ —
$ (0.24) $ —
$ 0.34
$ 2.89
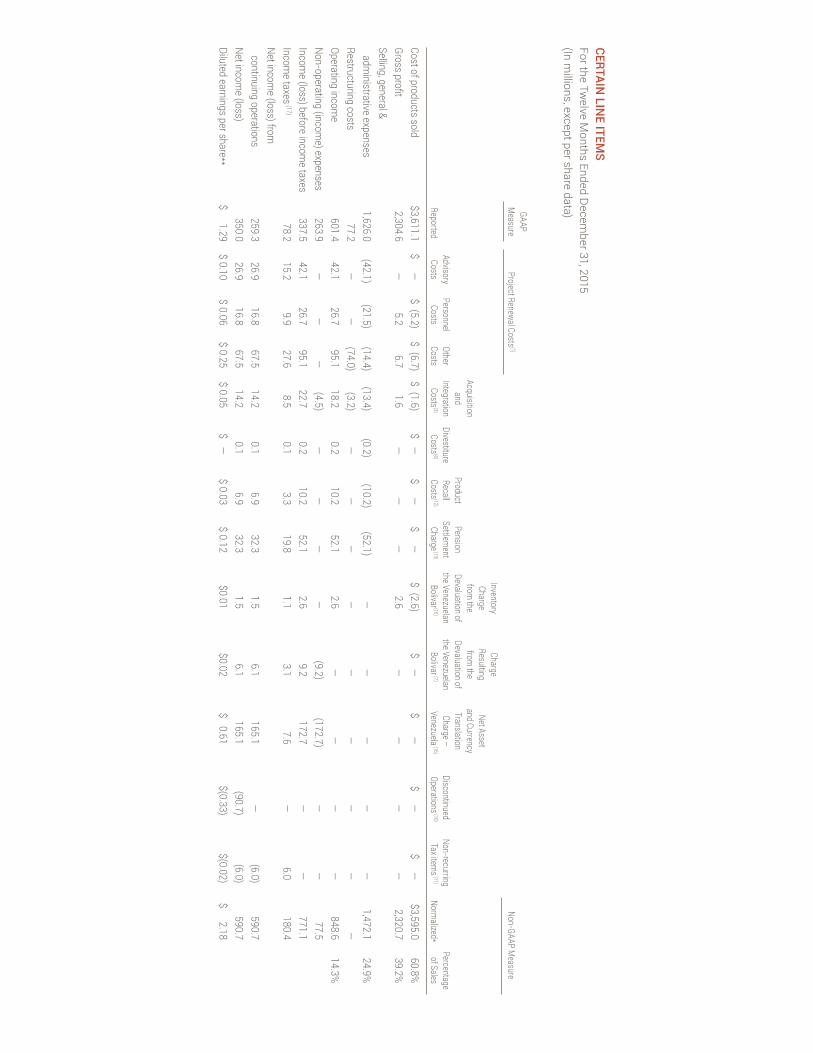
CERTAIN LIN
E ITEMS
For the Twelve M
onths Ended Decem
ber 31, 2015(In m
illions, except per share data)
GAAP
M
easure Project Renewal Costs
(1) Non-GAAP M
easure
Inventory Charge
Charge
Resulting Net Asset
Acquisition
from the
from the
and Currency
and
Product
Pension Devaluation of
Devaluation of Translation
Advisory
Personnel Other
Integration Divestiture
Recall Settlem
ent the Venezuelan
the Venezuelan Charge –
Discontinued Non-recurring
Percentage
Reported Costs
Costs Costs
Costs(3)
Costs(6)
Costs(12)
Charge (13)
Bolivar (15) Bolivar (7)
Venezuela (16)
Operations (10)
Tax items
(11) Norm
alized* of Sales
Cost of products sold $3,611.1
$ —
$ (5.2) $ (6.7)
$ (1.6) $ —
$ —
$ —
$ (2.6)
$ —
$ —
$ —
$ —
$3,595.0 60.8%
Gross profit 2,304.6
—
5.2 6.7
1.6 —
—
—
2.6
—
—
—
—
2,320.7 39.2%
Selling, general &
administrative expenses
1,626.0 (42.1)
(21.5) (14.4)
(13.4) (0.2)
(10.2) (52.1)
—
—
—
—
—
1,472.1 24.9%
Restructuring costs 77.2
—
—
(74.0) (3.2)
—
—
—
—
—
—
—
—
—Operating incom
e 601.4
42.1 26.7
95.1 18.2
0.2 10.2
52.1 2.6
—
—
—
—
848.6 14.3%
Non-operating (income) expenses
263.9 —
—
—
(4.5)
—
—
—
—
(9.2) (172.7)
—
—
77.5 Incom
e (loss) before income taxes
337.5 42.1
26.7 95.1
22.7 0.2
10.2 52.1
2.6 9.2
172.7 —
—
771.1
Income taxes
(17) 78.2
15.2 9.9
27.6 8.5
0.1 3.3
19.8 1.1
3.1 7.6
—
6.0 180.4
Net income (loss) from
continuing operations 259.3
26.9 16.8
67.5 14.2
0.1 6.9
32.3 1.5
6.1 165.1
—
(6.0) 590.7
Net income (loss)
350.0 26.9
16.8 67.5
14.2 0.1
6.9 32.3
1.5 6.1
165.1 (90.7)
(6.0) 590.7
Diluted earnings per share** $ 1.29
$ 0.10 $ 0.06
$ 0.25 $ 0.05
$ —
$ 0.03 $ 0.12
$0.01 $0.02
$ 0.61 $(0.33)
$(0.02) $ 2.18

** Normalized results are financial m
easures that are not in accordance with GAAP and exclude the above norm
alized adjustments. See below
for a discussion of each of these adjustments.
**Totals may not add due to rounding
(1) Costs associated with Project Renew
al include $15.1 million of project-related costs and $19.4 m
illion of restructuring costs during the twelve m
onths ended December 31, 2017; $50.1 m
illion of project-related costs and $9.9 million of restructuring costs during the tw
elve months ended Decem
ber 31, 2016, and $89.9 m
illion of project-related costs and $74.0 million of restructuring costs during the year ended Decem
ber 31, 2015. Project-related costs include advisory and consultancy costs, compensation and related costs of personnel dedicated to transform
ation projects, and other project-related costs. (2) During the tw
elve months ended Decem
ber 31, 2017, the Company recognized $10.7 m
illion of non-cash charges related to the fair value step up of inventory related to the Chesapeake®, Sistem
a® and W
oodWick
® (Smith M
ountain Industries) acquisitions. During the twelve m
onths ended December 31,
2016, the Company recognized $479.5 m
illion of non-cash charges related to the fair value step up of inventory related to the Jarden acquisition. (3) During the tw
elve months ended Decem
ber 31, 2017, the Company incurred $359.0 m
illion of costs (including $92.5 million of restructuring costs) prim
arily associated with the Jarden integration. During the year ended Decem
ber 31, 2016, the Company incurred $199.6 m
illion of costs (including $65.0 million
of restructuring costs) associated with the integration of Jarden, Elm
er’s, Ignite Holdings, LLC, which prim
arily represent personnel and advisory costs associated with the integration of Jarden. In addition, the Com
pany recognized a $47.6 million loss associated w
ith the termination of the Jarden Bridge
Facility and $16.8 million of interest costs associated w
ith borrowing arrangem
ents for the Jarden transaction. During the year ended December 31, 2015, the Com
pany recognized $18.2 million of costs (including $3.2 m
illion of restructuring costs) associated with the acquisition and integration of Ignite
Holdings, LLC, bubba brands, Baby Jogger, Elmer’s and the pending Jarden transaction. During the year ended Decem
ber 31, 2015, the Company recognized $4.5 m
illion of interest expense in connection with bridge loans related to the acquisition of Elm
er’s and the pending Jarden transaction. (4) During the tw
elve months ended Decem
ber 31, 2017 and 2016, the Company incurred acquisition am
ortization costs of $284.9 million and $154.7 m
illion, respectively. During the twelve m
onths ended December 31, 2017, the Com
pany recognized $85.0 million of im
pairment charges, prim
arily associated w
ith assets of the Winter Sports and Fire building businesses held for sale.
(5) During the twelve m
onths ended December 31, 2017, the Com
pany recognized $29.4 million of transaction and related costs, w
hich includes $2.0 million of hedge loss associated w
ith the Sistema
® acquisition. During the twelve m
onths ended December 31, 2016, the Com
pany recognized $61.7 million
of transaction and related costs associated with the Jarden transaction.
(6) During the twelve m
onths ended December 31, 2017, the Com
pany recognized $34.9 million of transaction and related costs prim
arily associated with the divestiture of the Tools business (excluding Dym
o® industrial labeling), and the W
inter Sports businesses. During the twelve m
onths ended Decem
ber 31, 2016, the Company recognized $8.4 m
illion of costs associated with the divestiture of Décor and planned divestiture of Tools (excluding Dym
o® industrial labeling). During the year ended Decem
ber 31, 2015, the Company recognized $0.2 m
illion of costs associated with the planned
divestiture of Décor. (7) During the tw
elve months ended Decem
ber 31, 2017, the Company incurred $14.6 m
illion of fire-related losses and costs, net of recoveries, in the Writing business; $13.0 m
illion of bad debt related to a customer in the Baby business; and $2.2 m
illion of consulting expenses for new accounting standards
adoption. During the twelve m
onths ended December 31, 2016, the Com
pany recorded $0.7 million of charges associated w
ith the Graco® recall.
(8) During the twelve m
onths ended December 31, 2017, the Com
pany incurred a $32.3 million loss related to the extinguishm
ent of debt, consisting of a make-w
hole payment of $34.2 m
illion and fees, partially offset by $1.9 million of non-cash w
rite-offs. (9) During the tw
elve months ended Decem
ber 31, 2017 and 2016, the Company recognized $713.0 m
illion of net gains related to the sale of businesses, primarily Tools and W
inter Sports businesses, and $160.2 million related to the divestiture of Décor, respectively. During the tw
elve months ended
December 31, 2017, the Com
pany recognized $166.1 million of net tax expense attributed to the gain on sale, w
ithholding taxes, and outside basis differences primarily related to the dispositions of the Tools and W
inter Sports businesses.(10) During the tw
elve months ended Decem
ber 31, 2016, the Company recognized net loss of $0.7 m
illion in discontinued operations. During the year ended December 31, 2015, the Com
pany recognized a net loss of $4.9 million in discontinued operations prim
arily associated with Endicia and certain
Culinary businesses and a $95.6 million net gain from
the sale of Endicia.(11) During the tw
elve months ended Decem
ber 31, 2017, the Company recognized a benefit of $1.5 billion related to tax reform
due to the revaluation of its deferred tax liabilities for the change in the U.S. tax rate from 35%
to 21%; $195.0 m
illion of tax expense related to the mandatory repatriation tax; and
$87.2 million of tax benefit to reverse the Com
pany’s APB 23 liability on historical Jarden earnings. During the twelve m
onths ended December 31, 2016, the Com
pany recognized $164.2 million of deferred tax expense related to the difference betw
een the book and tax basis in the Tools business and ($21.0) m
illion of deferred tax benefit related to statutory tax rate changes in France affecting Jarden acquired intangibles. During the year ended December 31, 2015, the Com
pany recognized $6.0 million of non-recurring incom
e tax benefits resulting from the resolution of incom
e tax contingencies.(12) During the year ended Decem
ber 31, 2015, the Company recognized $10.2 m
illion of charges associated with the Graco product recall.
(13) During the year ended December 31, 2015, the Com
pany settled U.S. pension liabilities for certain participants with plan assets w
hich resulted in $52.1 million of non-cash settlem
ent charges.(14) During the year ended Decem
ber 31, 2015, the Company recognized an increase of $2.6 m
illion in cost of products sold resulting from increased costs of inventory due to changes in the exchange rate for the Venezuelan Bolivar.
(15) During the year ended December 31, 2015, the Com
pany recognized foreign exchange losses of $9.2 million resulting from
the devaluation of and subsequent changes in the exchange rate for the Venezuelan Bolivar, which under hyperinflationary accounting is recorded in the Statem
ent of Operations.(16) During the year ended Decem
ber 31, 2015, the Company recognized charges resulting from
the deconsolidation of its Venezuela operations, including $133.0 million of charges associated w
ith the write-off of Venezuela net assets and $39.7 m
illion of charges associated with the w
rite-off of currency translation adjustm
ents included in equity that arose before the application of hyperinflationary accounting for Venezuela in 2010.(17) The Com
pany determined the tax effect of the item
s excluded from norm
alized results by applying the estimated effective rate for the applicable jurisdiction in w
hich the pre-tax items w
ere incurred, and for which realization of the resulting tax benefit, if any, is expected. In certain situations in w
hich an item
excluded from norm
alized results impacts incom
e tax expense, the Company uses a “”w
ith”” and “”without”” approach to determ
ine normalized incom
e tax expense.
New
ell Brands 2017 Annual Report 28
New
ell Brands
Reconciliation of GAAP and Non-GAAP Inform
ation

Newell Brands 2017 Annual Report 29
Newell Brands
ADDITIONAL INFORMATIONIn connection with Newell Brands’ 2018 Annual Meeting of Shareholders, Newell Brands will file with the U.S. Securities and Exchange Commission (the “SEC”) and mail to the shareholders of record entitled to vote at the 2018 Annual Meeting a definitive proxy statement and other documents, including a WHITE proxy card. SHAREHOLDERS ARE ENCOURAGED TO READ THE PROXY STATEMENT AND ALL OTHER RELEVANT DOCUMENTS WHEN FILED WITH THE SEC AND WHEN THEY BECOME AVAILABLE BECAUSE THOSE DOCUMENTS WILL CONTAIN IMPORTANT INFORMATION. When filed with the SEC, the definitive proxy statement and WHITE proxy card will also be mailed to shareholders of record. Investors and other interested parties will be able to obtain the documents free of charge at the SEC’s website, www.sec.gov, or from Newell Brands at its website, www.newellbrands.com, or through a request in writing sent to Newell Brands at 221 River Street, Hoboken, New Jersey, 07030, Attention: General Counsel.
PARTICIPANTS IN SOLICITATIONThe Company and its directors and executive officers may be deemed to be participants in the solicitation of proxies in connection with the 2018 Annual Meeting. The participants in the solicitation of proxies in connection with the 2018 Annual Meeting are currently anticipated to be the Company, David L. Atchison, Patrick D. Campbell, James R. Craigie, Debra A. Crew, Brett Icahn, Andrew Langham, Courtney R. Mather, Michael B. Polk, Judith A. Sprieser, Steven J. Strobel, Michael A. Todman, Ralph Nicoletti, Mark S. Tarchetti, William A. Burke, Bradford Turner, Nancy O’Donnell, Sofya Tsinis, High River Limited Partnership, Hopper Investments LLC, Barberry Corp., Icahn Partners Master Fund LP, Icahn Offshore LP, Icahn Partners LP, Icahn Onshore LP, Icahn Capital LP, IPH GP LLC, Icahn Enterprises Holdings L.P., Icahn Enterprises G.P. Inc., Beckton Corp. and Carl C. Icahn.
As of the date hereof, Ms. Crew beneficially owns 30 shares of common stock of the Company, par value $1.00 (the “Common Stock”). Mr. Craigie beneficially owns 3,175 shares of Common Stock, which includes 1,594 shares held in trusts, 797 shares each, for the benefit of Mr. Craigie’s children. Mr. Polk beneficially owns 1,353,392 shares of Common Stock, which includes 225,872 shares of Common Stock issuable pursuant to stock options and RSUs currently exercisable or exercisable or vesting within 60 days and includes 332,925 shares held in grantor retained annuity trusts for the benefit of Mr. Polk’s children and 47,303 shares held in trust by Mr. Polk’s wife. Mr. Strobel beneficially owns 50,707 shares of Common Stock. Mr. Todman beneficially owns 54,949 shares
of Common Stock. Mr. Nicoletti beneficially owns 14,788 shares of Common Stock, which includes 25 shares held in a revocable trust by Mr. Nicoletti’s wife, 193 shares in an IRA and 14,570 held in a revocable trust. Mr. Tarchetti beneficially owns 260,949 shares of Common Stock. Mr. Burke beneficially owns 175,046 shares of Common Stock. Mr. Turner beneficially owns 14,134 shares of Common Stock. Ms. O’Donnell beneficially owns 6,855 shares of Common Stock. As of the date hereof, Ms. Sprieser and Ms. Tsinis do not beneficially own any shares of Common Stock.
As of the date hereof, High River Limited Partnership has sole voting power and sole dispositive power with regard to 6,658,602 shares of Common Stock (including shares of Common Stock underlying forward contracts). Each of Hopper Investments LLC, Barberry Corp. and Mr. Carl C. Icahn has shared voting power and shared dispositive power with regard to such shares of Common Stock. Icahn Partners Master Fund LP has sole voting power and sole dispositive power with regard to 10,836,710 shares of Common Stock (including shares of Common Stock underlying forward contracts). Each of Icahn Offshore LP, Icahn Capital LP, IPH GP LLC, Icahn Enterprises Holdings L.P., Icahn Enterprises G.P. Inc., Beckton Corp. and Mr. Carl C. Icahn has shared voting power and shared dispositive power with regard to such shares of Common Stock. Icahn Partners LP has sole voting power and sole dispositive power with regard to 15,797,701 shares of Common Stock (including shares of Common Stock underlying forward contracts). Each of Icahn Onshore LP, Icahn Capital LP, IPH GP LLC, Icahn Enterprises Holdings L.P., Icahn Enterprises GP, Beckton Corp. and Mr. Carl C. Icahn has shared voting power and shared dispositive power with regard to such shares of Common Stock. Mr. Brett Icahn has sole voting power and sole dispositive power with regard to 500,000 shares of Common Stock, including 250,000 shares of Common Stock beneficially owned by a charitable foundation controlled by Mr. Brett Icahn. As of the date hereof, Messrs. Atchison, Campbell, Langham and Mather do not beneficially own any shares of Common Stock.
Certain information concerning these participants is also set forth in the Company’s definitive proxy statement, dated March 30, 2017, for its 2017 annual meeting of shareholders as filed with the SEC on Schedule 14A and the Company’s Current Reports, dated August 24, 2017, January 21, 2018, February 16, 2018, February 22, 2018 and March 19, 2018, as filed with the SEC on Form 8-K. Additional information regarding the interests of these participants in the solicitation of proxies in respect of the 2018 Annual Meeting and other relevant materials will be filed with the SEC when they become available.

Newell Brands 2017 Annual Report 30
Newell Brands
CAUTION CONCERNING FORWARD-LOOKING STATEMENTS
Statements in these materials, other than those of historical fact, particularly those anticipating future financial performance, business prospects, growth, operating strategies and similar matters, are forward-looking statements within the meaning of the U.S. Private Securities Litigation Reform Act of 1995 and other federal securities laws. These statements generally can be identified by the use of words such as “intend,” “anticipate,” “believe,” “estimate,” “project,” “target,” “plan,” “expect,” “will,” “should,” “would” or similar statements. The Company cautions that forward-looking statements are not guarantees because there are inherent difficulties in predicting future results. In addition, there are no assurances that the Company will complete any or all of the potential transactions, and other initiatives referenced in this release. Actual results may differ materially from those expressed or implied in the forward-looking statements. Important factors that could cause actual results to differ materially from those suggested by the forward-looking statements include, but are not limited to: • uncertainties regarding future actions that may be taken
by Starboard Value LP (together with its affiliates, “Starboard”) in furtherance of its stated intention to nominate director candidates for election at Newell Brands’ 2018 Annual Meeting;
• potential operational disruption caused by Starboard’s actions that may make it more difficult to maintain relationships with customers, employees or suppliers;
• the Company’s dependence on the strength of retail, commercial and industrial sectors of the economy in various parts of the world;
• competition with other manufacturers and distributors of consumer products;
• major retailers’ strong bargaining power and consolidation of the Company’s customers;
• the Company’s ability to improve productivity, reduce complexity and streamline operations;
• the Company’s ability to develop innovative new products, to develop, maintain and strengthen end-user brands and to realize the benefits of increased advertising and promotion spend;
• risks related to the Company’s substantial indebtedness, potential increases in interest rates or changes in the Company’s credit ratings;
• the Company’s ability to effectively accelerate its transformation plan and explore and execute its strategic options;
• the Company’s ability to complete planned acquisitions and divestitures, to integrate Jarden and other acquisitions and unexpected costs or expenses associated with acquisitions or dispositions;
• changes in the prices of raw materials and sourced products and the Company’s ability to obtain raw materials and sourced products in a timely manner;
• the risks inherent to the Company’s foreign operations, including currency fluctuations, exchange controls and pricing restrictions;
• a failure of one of the Company’s key information technology systems or related controls;
• future events that could adversely affect the value of the Company’s assets and require impairment charges;
• the impact of United States or foreign regulations on the Company’s operations, including environmental remediation costs;
• the potential inability to attract, retain and motivate key employees;
• the resolution of tax contingencies resulting in additional tax liabilities;
• product liability, product recalls or related regulatory actions; • the Company’s ability to protect its intellectual property rights; • significant increases in the funding obligations related to
the Company’s pension plans; and • other factors listed from time to time in the Company’s
filings with the SEC including, but not limited to, the Company’s most recent Annual Report on Form 10-K.
The information contained in these materials is as of the date indicated. The Company assumes no obligation to update any forward-looking statements as a result of new information, future events or developments.


