Life Cycle Assessment, LCA, of PVC Blood Bag Raul Carlson, eco2win AB 2012‐ 03 Commissioned by Jegrelius Institute for Applied Green Chemistry, Regional Council of Jämtland Within the of EU Life+ project PVCfreeBloodBag
Practitioner: Raul Carlson, eco2win AB, Jönköping, Sweden with CORALIA environmental, Argentina
Commissioner: Jegrelius Institute for Applied Green Chemistry, Regional Council of Jämtland,
Sweden, Within the of EU Life+ project PVCfreeBloodBag
Dr Raul Carlson owner and consultant at eco2win. Dr Carlson is author of
the Swedish handbook of LCA according to the international standards of
LCA ISO 1404ff, Livscykelanalys – Ringar på vattnet, co‐convenor of the
Swedish standardization of LCA, and is also senior researcher at the Swedish transport and vehicle
research institute Viktoria in Göteborg.
eco2win is a consultant agency with the mission to guide businesses and organizations towards social
responsibility and sustainable development. eco2win applies quantifiable principles and tools such as
LCA to establish improvement processes in the clients’ businesses. eco2win translates to ‘win‐win
when economic prosperity is guided by the laws and limitations of ecology’.
More information available at http://www.eco2win.com
For this commission eco2win has worked together with the Argentinian consultant agency CORALIA environmental with especially the life cycle inventory and related expertise:
Ignacio Barutta is based in Buenos Aires, Argentina and leads implementation of multinational projects operations at CORALIA. Mr Barutta’s professional background and experience includes GHG emission reduction and inventory projects (CDM and voluntary), Life Cycle Assessment
and Carbon footprint, SH&E permitting, compliance, site investigation and remediation, as well as environmental due diligence, risk assessment, waste management. Florencia Catalá is Project Manager at CORALIA Environmental. Her competence and experience
includes industrial projects related to greenhouse gas (GHG) management such as GHG Inventories,
Carbon Footprint studies and GHG emission reduction projects; activities related to environmental
management such as Life Cycle Assessment (LCA) studies, environmental performance evaluation,
environmental labeling and communication and development of sustainability strategies.
CORALIA environmental consists of a team of professionals with multidisciplinary background from different environmental management projects, with aim to contribute to sustainable development with both social and environmental orientation. CORALIA performs implementation and improvement projects based on eco‐efficiency and sustainable development principles. CORALIA strives to excel in leadership of multicultural and multidisciplinary worldwide teams of high‐quality. More information available at http://www.coraliae.com
Life Cycle Assessment, LCA, of PVC Blood Bag
2
ExecutivesummaryA Life Cycle Assessment (LCA) of a PVC/DEHP1 blood bag was performed to provide a quantitative
overview of the environmental impact of the PVC blood bag over its life cycle. As quantitative
reference to the PVC/DEHP blood bag, a fictional blood bag made from the material High Density
Polyethylene (HDPE) is used. Since the phthalate DEHP and the plastic HDPE have very similar names
the full name High Density Polyethylene will be interchangeably with HDPE throughout the text. The
two flow charts in figure E1 represents the studied life cycles.
Figure E1 The left flow chart represents the life cycle of the PVC/DEHP blood bag, and the right flow chart represents the
life cycle of the HDPE blood bag.
The three main environmental impact categories of a PVC/DEHP blood bag are climate change,
impact on human health and resource use. Therefore the environmental impact assessment was
focusing on these three impact categories.
The result of the LCA is that the PVC/DEHP blood bag has a substantially higher potential to harm
human health, both when analyzing the total life cycle of the blood bags and with regards to the
DEHP contamination of transfused blood. This is due to the chlorinated substances occurring in
production emissions, in phthalates being transferred to the patient during blood transfusion and
due to dioxin emissions in the waste incineration emissions. The HDPE blood bag show a potentially
higher impact on resource depletion and climate change. This is due to the higher content of
hydrocarbons in the HDPE blood bag. Comparison of the two different ways to incinerate PVC/DEHP
blood bags by allowing a higher emission of dioxins or by controlling the dioxin emissions by ensuring
a more effective combustion, reveals a trade‐off issue, where cleaning of smoke gases increases both
the resource use and the contribution to climate change. Figure E2 summarizes the environmental
impact on the three impact categories using the 3‐axis model.
Table of contents ..................................................................................................................................... 5
List of figures ........................................................................................................................................... 7
List of tables ............................................................................................................................................ 8
General .............................................................................................................................................. 37
Figure 18 Potential human health impact evaluated by the USEtox method, number of cases, divided
per type of analysed emission. .............................................................................................................. 29
Figure 19 Potential human health impact evaluated by the USEtox method, number of cases, divided
per emitting life cycle stage. ................................................................................................................. 29
Figure 20 Comparing the potential impact on human health from the total life cycle of a PVC/DEHP
blood bag to the potential impact from the transfusion. ..................................................................... 30
Figure 21 Resource depletion over the life cycle of the three scenarios evaluated using the EPS, the
eco‐indicator and the EDIP methods. It should be noted that comparisons between the methods
makes no sense. The three different methods express resource depletion in different units. The
diagram is normalized to make it easy to see how the different methods evaluate the alternatives. 32
Life Cycle Assessment, LCA, of PVC Blood Bag
8
Figure 22 The different impact from the three different alternatives onto the three different impact
categories presented as different dimensions in a co‐ordination system, the 3‐axis approach. A
conceptual summary of the graphs for each alternative is indicated onto each axis. .......................... 34
ListoftablesTable 1 Human health cases (cancer + non‐cancer) per PVC/DEHP blood bag, evaluated by USEtox. 30
Life Cycle Assessment, LCA, of PVC Blood Bag
9
NomenclatureAbbreviation Explanation CO2 Carbon dioxide DALY Disability Adjusted Life Years DEHP Di‐2‐Ethylhexyl Phthalate or Bis(2‐ethylhexyl)phthalate EDIP Environmental Development of Industrial Products EOL End of life (waste management) EPS Environmental Priority Strategy HCFC Hydrochlorofluorocarbons HDPE High density polyethylene ISO International Organization for Standardization LCA Life cycle assessment N2O Nitrous oxide PVC Polyvinyl chloride VCM Vinyl chloride monomer
Life Cycle Assessment, LCA, of PVC Blood Bag
10
1. Introductionandapplication
1.1. PurposeofthisstudyThe purpose of this life cycle assessment is to serve as information for the development and
establishment of demand and production of PVC free blood bags. It is intended to serve both as
information about the actual environmental impact from PVC based blood bags, as well as a
reference point for the environmental performance of an alternative blood bag.
To make full use of the purpose of this study it is strongly suggested that similar full comparative life
cycle assessments are performed on the real candidates to the PVC free blood bag. This will give the
necessary understanding of the environmental hot spots of the alternatives, and it may be used to
ensure that the alternative is indeed better from the perspective of the environmental life cycle.
1.2. IntroductiontoLifecycleassessment–LCALife cycle assessment (LCA) is a method to acquire an overview of the environmental impact of a
product, function or service. According to the international standard ISO 14040:2006 [ISO 2006] of
LCA, LCA is established on seven principles:
Life cycle perspective
Environmental focus
Relative approach and functional unit
Iterative approach
Transparency
Comprehensiveness
Priority of scientific approach
Figure 1 Life cycle assessment (LCA) is a method to acquire an overview of the environmental impact of a product, function or service. [Carlson, Pålsson, 2011]
The scope of the Process/product system in Figure 1 exemplifies the meaning of the first principle,
the Life cycle perspective. It means that when performing an LCA to assess the environmental impact
of the life cycle of a Function of product one shall follow the flow of production processes backwards
Life Cycle Assessment, LCA, of PVC Blood Bag
11
to the extraction of natural resources, and one shall follow the product all the way to the final
disposal, such as the waste management or recycling. Figure 1 also exemplifies the second principle,
the principle of Environmental focus. This principle states that when performing an LCA one shall
primarily consider what is important from the environmental point of view, and put the efforts of the
study of the life cycle product system based on the environmental relevance. In practice this is done
by selecting Impact categories, which are representations of the Environmental impact (such as
global warming potential (GWP), human health and Natural resource depletion) that are considered
relevant over the life cycle of the studied product, function or service.
The third principle, the principle of Relative approach and functional unit, means that the result of
the study should always be related to a numerical entity of relevance to why the study is performed.
In this case we are relating the entire study to one blood bag which is stored for thirty days before
being used. The principle of Iterative approach means that during the study one may find new
information which means that one will need to take new decisions about how to work. The principle
of Transparency means that all choices made and all data used shall be made transparent to a
reviewer of the study, hence the many annexes with data in this report. The principle of
Comprehensiveness means that the study should encompass all environmentally relevant aspects of
the object of study. Hence, it would not be sufficient to only study the toxicity aspects of the blood
bag, but since the blood bags are made of plastics they also contribute to resource depletion (oil),
and since medical waste is incinerated for safety reasons, the plastics contribute to global warming.
The principle of Priority of the scientific approach means that the LCA study shall be performed in
accordance with scientific principles, such as objectivity, neutrality, verifiability and transparency.
In the ISO standard ISO 14040, the framework of LCA is strongly related to its specific application (see
Figure 2). This means that an LCA will be different depending on for which purpose the study is
made. But the LCA standard also states that there are four consecutive and interdependent phases in
each LCA‐study. The first phase is the Interpretation. In the beginning of the study the phase of
interpretation means to understand the application and how it has implications on how the study
should be performed. This is to a large extent what this chapter Introduction and application
describes in this report. During the study the interpretation means to make different choices that
leads to a good LCA result that is relevant for the application. At the end of the study the
interpretation means to extract the key meaningful results to the application.
Life Cycle Assessment, LCA, of PVC Blood Bag
12
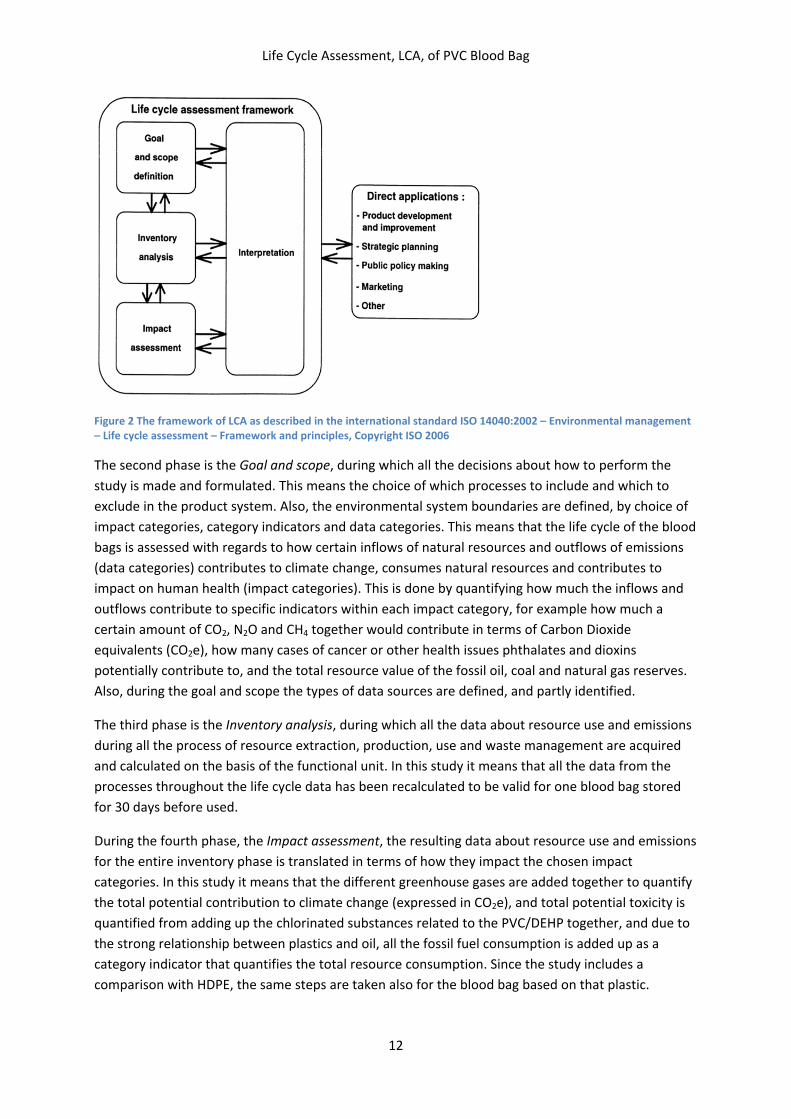
Figure 2 The framework of LCA as described in the international standard ISO 14040:2002 – Environmental management – Life cycle assessment – Framework and principles, Copyright ISO 2006
The second phase is the Goal and scope, during which all the decisions about how to perform the
study is made and formulated. This means the choice of which processes to include and which to
exclude in the product system. Also, the environmental system boundaries are defined, by choice of
impact categories, category indicators and data categories. This means that the life cycle of the blood
bags is assessed with regards to how certain inflows of natural resources and outflows of emissions
(data categories) contributes to climate change, consumes natural resources and contributes to
impact on human health (impact categories). This is done by quantifying how much the inflows and
outflows contribute to specific indicators within each impact category, for example how much a
certain amount of CO2, N2O and CH4 together would contribute in terms of Carbon Dioxide
equivalents (CO2e), how many cases of cancer or other health issues phthalates and dioxins
potentially contribute to, and the total resource value of the fossil oil, coal and natural gas reserves.
Also, during the goal and scope the types of data sources are defined, and partly identified.
The third phase is the Inventory analysis, during which all the data about resource use and emissions
during all the process of resource extraction, production, use and waste management are acquired
and calculated on the basis of the functional unit. In this study it means that all the data from the
processes throughout the life cycle data has been recalculated to be valid for one blood bag stored
for 30 days before used.
During the fourth phase, the Impact assessment, the resulting data about resource use and emissions
for the entire inventory phase is translated in terms of how they impact the chosen impact
categories. In this study it means that the different greenhouse gases are added together to quantify
the total potential contribution to climate change (expressed in CO2e), and total potential toxicity is
quantified from adding up the chlorinated substances related to the PVC/DEHP together, and due to
the strong relationship between plastics and oil, all the fossil fuel consumption is added up as a
category indicator that quantifies the total resource consumption. Since the study includes a
comparison with HDPE, the same steps are taken also for the blood bag based on that plastic.
Life Cycle Assessment, LCA, of PVC Blood Bag
13
As stated earlier, after the impact assessment, the result of the study is interpreted and the result is
reported in a form that follows the principles of LCA and is fit to the application. The report you are
now reading is such an LCA study report.
1.3. ApproachtothisstudyThe initial literature study of this LCA showed that much has been written about the environmental
impact of plastics, PVC [Vinylsum, 2012] and of DEHP [DEHP facts, 2012]. Much has also been written
about the toxicity aspects of the phthalate DEHP [JRC, 2008] [US food and drug administration, 2002]
as well as of the different chlorinated substances throughout the life cycle of both PVC and DEHP
[SCENHIR, 2007]. In specific, several papers discussed dioxin emissions from PVC waste incineration
and described different options about how to treat PVC [Rijpkema, 1999] and PVC/DEHP waste
incineration. Only a few of the references are mentioned here.
It was concluded that to add to this substantial amount of already available knowledge and these
many viewpoints in the field, it would be most relevant to perform an LCA that compiles simple
quantitative and transparent overview of the environmental hot spots of the life cycle of a PVC/DEHP
blood bag. To make the quantitative result meaningful and easy to understand, two reference points
are established: One is the relationship between the potential human health impact caused by the
transfusion of DEHP‐contaminated blood and the human health impact caused by chlorinated
substances throughout the life cycle. The other point of reference is an imaginary blood bag based on
a simple hydrocarbon plastic. Because High Density Polyethylene (HDPE) is also to a small share part
of the PVC/DEHP blood bag, HDPE was chosen as material for the imaginary reference blood bag.
2. Goalandscope
2.1. SystemboundariesThe system boundary dimensions considered specifically are the
technical system boundary, which is defined by the included and excluded processes which
are described in section 2.1.1
the environmental system boundary, which is defined by choice of environmental impact
categories, described in detail in section 2.1.2.
2.1.1. TechnicalsystemboundariesThe flow chart for the PVC/DEHP blood bag is represented in the flow chart in Figure 1. The flow
chart is drawn on the basis of the unit processes acquired for the study, which means the lowest
level of detail for which the data is acquired. This for example means that the production of PVC is
just one single data set, which includes data about oil extraction, electricity production, cracking,
transports etc., all the way up to PVC resin. The same is true for DEHP, HDPE and Calendering and
Electricity production. The other processes are modeled as gate to gate data, i.e. on basis of similar
data. This is described in detail in section 2.3.
Life Cycle Assessment, LCA, of PVC Blood Bag
14
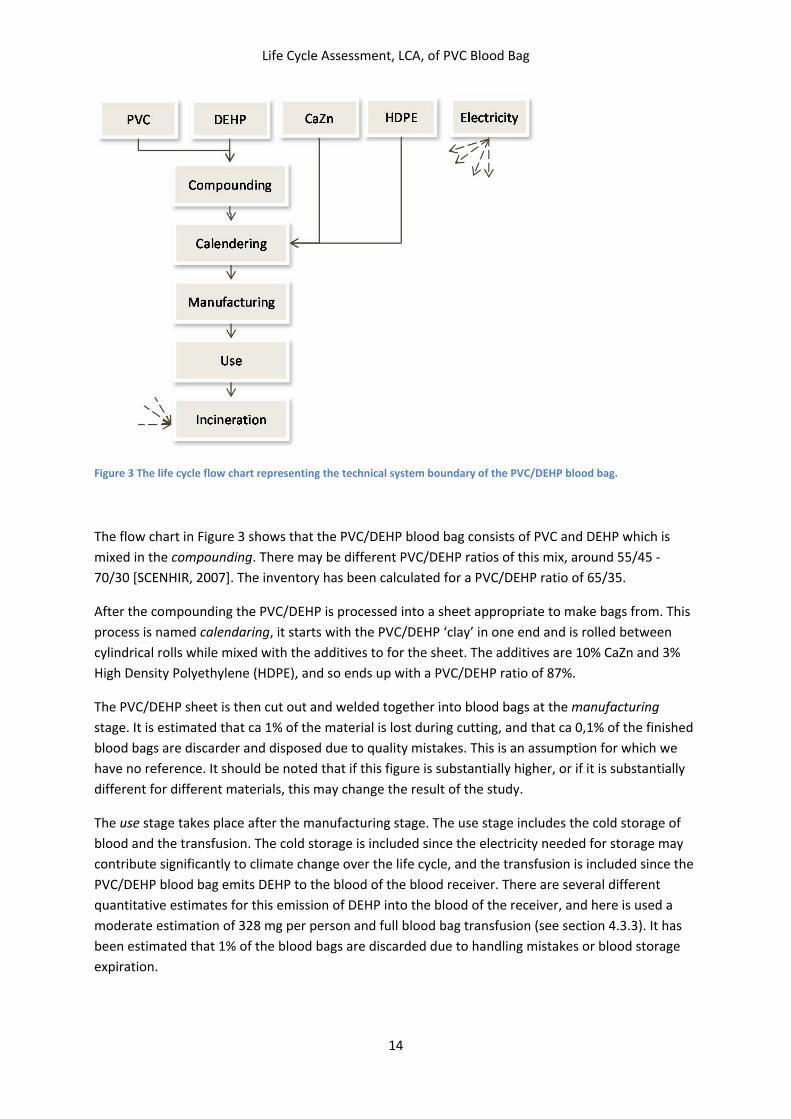
Figure 3 The life cycle flow chart representing the technical system boundary of the PVC/DEHP blood bag.
The flow chart in Figure 3 shows that the PVC/DEHP blood bag consists of PVC and DEHP which is
mixed in the compounding. There may be different PVC/DEHP ratios of this mix, around 55/45 ‐
70/30 [SCENHIR, 2007]. The inventory has been calculated for a PVC/DEHP ratio of 65/35.
After the compounding the PVC/DEHP is processed into a sheet appropriate to make bags from. This
process is named calendaring, it starts with the PVC/DEHP ‘clay’ in one end and is rolled between
cylindrical rolls while mixed with the additives to for the sheet. The additives are 10% CaZn and 3%
High Density Polyethylene (HDPE), and so ends up with a PVC/DEHP ratio of 87%.
The PVC/DEHP sheet is then cut out and welded together into blood bags at the manufacturing
stage. It is estimated that ca 1% of the material is lost during cutting, and that ca 0,1% of the finished
blood bags are discarder and disposed due to quality mistakes. This is an assumption for which we
have no reference. It should be noted that if this figure is substantially higher, or if it is substantially
different for different materials, this may change the result of the study.
The use stage takes place after the manufacturing stage. The use stage includes the cold storage of
blood and the transfusion. The cold storage is included since the electricity needed for storage may
contribute significantly to climate change over the life cycle, and the transfusion is included since the
PVC/DEHP blood bag emits DEHP to the blood of the blood receiver. There are several different
quantitative estimates for this emission of DEHP into the blood of the receiver, and here is used a
moderate estimation of 328 mg per person and full blood bag transfusion (see section 4.3.3). It has
been estimated that 1% of the blood bags are discarded due to handling mistakes or blood storage
expiration.
Life Cycle Assessment, LCA, of PVC Blood Bag
15
After the use, the blood bag goes to incineration together with other medical waste. For simplicity
and overview it has been considered that the waste during manufacturing and the discarded blood
bag due to expiration also goes to the same waste incineration. The incineration of any material with
chloride content potentially leads to dioxin emissions. It has been noted that it is today common that
the heat generated during the incineration is used to replace an alternative heating system. This is
not included here, since it would not add to the clarity of the study. It should be stressed, however,
that if it had been accounted for, both the total resource use and the total contribution to climate
change are likely to have been lower. It is also well understood that the ashes from the incineration
of PVC/DEHP may contain toxic substances that will cause dioxins to leak during the final waste
storage at a landfill site potentially affecting soil and groundwater resources (due to vertical and
horizontal migration) and maybe surface water in case of a considerable horizontal migration. The
latter would also be influenced by the specific landfill site context characteristics (soil type and
composition, type of groundwater aquifers, etc.). This again has not been included here. Such data
would show to increase the environmental impact of the life cycle of the PVC/DEHP blood bag, but
since the uncertainty of the data about the actual amount leaked out would be combined with the
uncertainties of the incineration process, it was decided to leave the landfill leakage out.
The compounding, the manufacturing and the use stage are modeled to utilize the same electricity
production data.
Since the impact from transportation is assumed nearly independent on type of material of the blood
bag, explicit transports from the calendaring process and to incineration have not been in included
with the study. It should be noted, however, that when striving to minimize the environmental
impact of a specific choice of blood bag material, transports are likely to be important.
2.1.2. EnvironmentalsystemboundariesSection 1.2 introduces the methodology of LCA and also describes in detail how to set the
environmental system boundaries of a study.
The literature study shows that the most significant aspects for the PVC/DEHP blood bag are:
Impact on human health:
– The phthalate DEHP: During blood transfusion the DEHP is leaked into the blood, and
exposes the blood receiver to risks for cancer and disturbances in the reproductive
systems [SCENHIR, 2007].
– Dioxin: The chlorine content of PVC and DEHP contributes to the potential generation of
dioxin during waste generation [Rijpkema, 1999].
Consumption of natural resources
– Fossil oil: Both PVC and DEHP are based on fossil oil, and since the used blood bag is
considered as medical waste (biohazard potential) it is incinerated for safety reasons
rather than recycled.
Contribution to climate change
– Carbon dioxide: As with natural resources, since PVC and DEHP are produced from fossil
hydrocarbons, the incineration of the blood bags contributes to with CO2 emissions to
the atmosphere [Vadas, Nguyen‐Ngoc, 2009].
Life Cycle Assessment, LCA, of PVC Blood Bag
16
This list of significant aspects is used to define the impact categories and the data categories for the
study. It means that the emissions of the phthalate and other chlorinated substances related to the
PVC and the DEHP production, and the emissions of dioxin are included in the analysis of potential
impact on human health. And it also means that the fossil fuel consumption are included for analysis
of potential impact on resource depletion, and the emission of greenhouse gases are included for the
analysis of potential impact on climate change.
It is of course understood that there are other impact categories and other data categories that could
also have been included to get an even more comprehensive picture, but it was considered that such
comprehensiveness would have contributed to neither the clarity nor the result of the study.
It was decided that different impact assessment methods would be used to assess the result of the
study, including the EPS method [Steen, 1999], the Eco‐indicator method [Goedkoop, Spriensma,
1999], the EDIP method [Wenzel, Hauschild, Alting, 1997] and the USEtox method [USEtox, 2012], as
well as the IPCC documents [IPCC, 2012, Revised 2006 IPCC Guidelines for National Greenhouse Gas
Inventories as well as other IPCC references] for assessing the potential climate impact from different
gases.
2.2. Referencebloodbag,HighDensityPolyethyleneTo facilitate the quantitative interpretation of the result of the life cycle assessment of the PVC/DEHP
blood bag, it was decided to perform a comparative and very similar study on an imaginary PVC‐free
blood bag, made from only High Density Polyethylene (HDPE). With lack of further knowledge about
this blood bag, it was considered likely that this alternative blood bag would have the same weight
and in all other aspects have the same life cycle. The difference is based on that it would lack the PVC
and DEHP production steps, as well as the CaZn additive, and of course also be without the exposure
of DEHP to humans during blood transfusion, and not contributing to dioxin during medical waste
incineration.
Figure 4 The life cycle flow chart representing the technical system boundary of the High Density Polyethylene (HDPE) blood bag.
Life Cycle Assessment, LCA, of PVC Blood Bag
17
To make the studies comparable, as much as possible of the same data is used for the PVC/DEHP
studies and for the HDPE, except for the differences associated with the PVC and DEHP.
2.3. Choiceofdatasourcesanddatacategories
2.3.1. LCIdataFrom having assessed several potential data sources, the choices of LCI data were made as follows:
Best available and transparent data sources for the key materials PVC, DEHP and HDPE. This
means that the data available from the plastics industry, the Plastics Europe database
[Ostermayer, Giegrich, 2006] [Ecobilan, 2001]. The data sources were compared with other
available data from for example the European ELCD database for the production of these
materials, and Plastics Europe data was selected due to transparency and relevance for the
study.
For manufacturing and use of blood bag, several different data sources were combined to
estimate key functions, such as welding the PVC/DEHP and holding the blood bags cold. The
result is hence a theoretical model value, based on technical data [See Manufacturing
section under References for LCI database].
Several different sources were assessed to acquire data for the incineration of the blood
bags. Since the dioxin emissions are the result of a non‐efficient and non‐effective
incineration process, it is difficult to find data about the actual emission levels. Data for
general waste management facilities and technologies was not considered relevant for this
specific study, since the connection between the blood bags and the actual dioxin emission
levels is very hard to identify or describe. Therefore it was decided to make incineration
emission models based on assessment of several different data sources [See EOL PVC
Uncontrolled / EOL PVC Controlled/ EOL HDPE section under References for LCI database].
Transport of blood bags has been omitted, since impact from transportation is assumed
independent on choice of material for the blood bag. It should be stressed, however, that the
transportation does have an environmental impact and is relevant when optimizing the
environmental performance of the life cycle of a specific blood bag, or when transportation
for some reason may be expected to be very different for different material choices.
The data categories to consider are those that relate directly to the three impact categories
described in sections 2.1.2 and 2.3.2.
2.3.2. Impactassessmentdata
2.3.2.1. ImpactonhumanhealthThe impact assessment of this LCA study focuses especially on the health aspects of the phthalates
and chlorinated substances, such as the dioxins. Impact assessment methods with emphasis on
human health is applied: the Eco‐indicator method [Goedkoop, Spriensma, 1999], the EDIP method
[Wenzel, Hauschild, Alting, 1997] and the new USEtox method [USEtox, 2012]. The best documented
and most accurately updated database and method is the latter of these three. But this database
focuses on chemicals with a CAS number, i.e. chemicals that are produced to be sold. This means that
characterization factors, for example for dioxins, cannot be found in the database of this method.
Another way to put it is that the USEtox method is blind to dioxins.
Life Cycle Assessment, LCA, of PVC Blood Bag
18
To support the interpretation of the result, the impact assessment includes a comparison between
health impacts over the life cycle of the blood bag and health impacts from the exposure of the
phthalate DEHP during blood transfusion. There are some complications with such a comparison,
described in chapter 4.
There are many emissions associated with the chlorinated substances for which there are no
characterization data, such as chloride, HCl and many other substances.
It should also be stressed that none of the methods have characterization factors for CaZn, Austinite,
which is a lubricant for PVC. It includes a small amount of arsenic, chemical formula CaZn(AsO4)OH.
Its toxicity aspects are not known
2.3.2.2. DepletionofnaturalresourcesFor plastics products consumption of the natural resources oil and natural gas are most significant.
To evaluate not only the consumption, but also the environmental significance of this consumption
of fossil fuels, three different impact assessment methods has been used, the EPS method [Steen,
1999], the Eco‐indicator method [Goedkoop, Spriensma, 1999] and the EDIP method [Wenzel,
Hauschild, Alting, 1997]. The three methods employ somewhat different valuation of the different
resources.
2.3.2.3. ContributiontoclimatechangeContribution to climate change is considered with regards to how much the different greenhouse
gases carbon dioxide (CO2), nitrous oxide (N2O), methane (CH4) and freons (HCFC) contribute to
climate change, using data published by the IPCC, the Intergovernmental Panel on Climate Change
[IPCC, 2012].
3. Inventory
3.1. DatacollectionThe actual inventory data is presented in a separate library of Excel files, but the LCI‐profiles are
presented in Annex B.
3.2. Calculations
3.2.1. AssumptionsandsimplificationsTo maintain full transparency throughout the life cycle inventory, all calculations are performed in
Microsoft Excel. The calculations are based on the following assumptions and simplifications:
The PVC/DEHP mix in one blood bag is 65%/35%
One blood bag weighs 87,5 grams2
A blood bag is stored for 30 days
The production waste PVC/DEHP and HDPE are incinerated in the same way as the medical
PVC/DEHP. A sensitivity analysis has been performed to verify that any realistic waste
management profile does not change the result of this study.
2 This weight was estimated from data about the mass of a full blood bag, with reference to a blood bag handling routine, stating that the mass of a full 400 ml blood bag is between 509 g and 620 g (Mazin, 2012)
Life Cycle Assessment, LCA, of PVC Blood Bag
19
The electricity production not included in the Plastics Europe data, i.e. the electricity used for
manufacturing and use, has been chosen as a generic background electricity production as an
average from the OECD countries. A sensitivity analysis has been performed to verify that
any other electricity production mixture does not significantly change the comparative result
of this study, though it of course may impact the absolute levels of in specific resource
consumption and climate change.
3.2.2. DifferentcalculationsperformedTo produce the relevant information that could be withdrawn from the LCI, according the goal and
scope and the data collection, three different life cycle calculations were performed:
A. Life cycle of PVC/DEHP blood bag with a controlled waste PVC incineration. The controlled
waste incineration means both the existence of emission cleaning technologies as well as
that the incineration temperature is higher. Both these circumstances lead to less dioxin
emissions, but they instead also consume more other fuel. In a normal waste incineration it
is likely that the higher temperature would be maintained with an optimal mixture of other
combustible medical waste. To estimate the energy consumption for the higher oxidation
temperature and the emission cleaning it is assumed that the energy level is reached by an
addition of oil. It is not an entirely realistic assumption, but makes it easy to understand that
the oxidation of PVC and the emission cleaning is made on the expense of such an amount of
energy resources.
B. Life cycle of PVC/DEHP blood bag with an Uncontrolled waste PVC incineration. The
uncontrolled waste incineration burns without the additional amount of extra oil, which
leads to a lower degree of oxidation, hence much higher dioxin emissions. It also leads to
lower emissions of carbon dioxide and lower energy resource consumption.
C. Life cycle of High Density Polyethylene (HDPE) blood bag with a controlled waste
incineration. The controlled waste incineration of HDPE means that it burns with the same
additional energy as the controlled waste, leading to perfect oxidation and only carbon
dioxide emissions.
It should be noted that it is difficult to give a perfect estimation of the emissions and waste
incineration energy needed. The data used here are backed up by references about energy and
temperature levels for medical waste incineration [See section EOL3 PVC Uncontrolled / EOL PVC
Controlled/ EOL HDPE under References for LCI database] in combination with estimates of emissions
from medical waste incineration plants.
The three different life cycle calculations have been combined to provide the following two
comparisons:
A‐C: Difference in the LCI profile between the PVC/DEHP and the HDPE blood bag
A‐B: Difference in the LCI profile between the PVC/DEHP‐blood bags depending on the different
waste incineration types
3 EOL – End of life ‐ Refers here to the waste incineration technology
Life Cycle Assessment, LCA, of PVC Blood Bag
20
Calculations had also been performed to identify the share of contribution of climate change gases
and fossil fuel resource consumption from the processes throughout the life cycle vs. the feedstock
and the waste incineration from the different alternatives.
3.3. LCIprofilesandLCIcalculationresultsIn this chapter some diagrams of the LCI profile calculations are presented. The LCI profile data tables
are presented in Annex B.
3.3.1. Climatechangegases
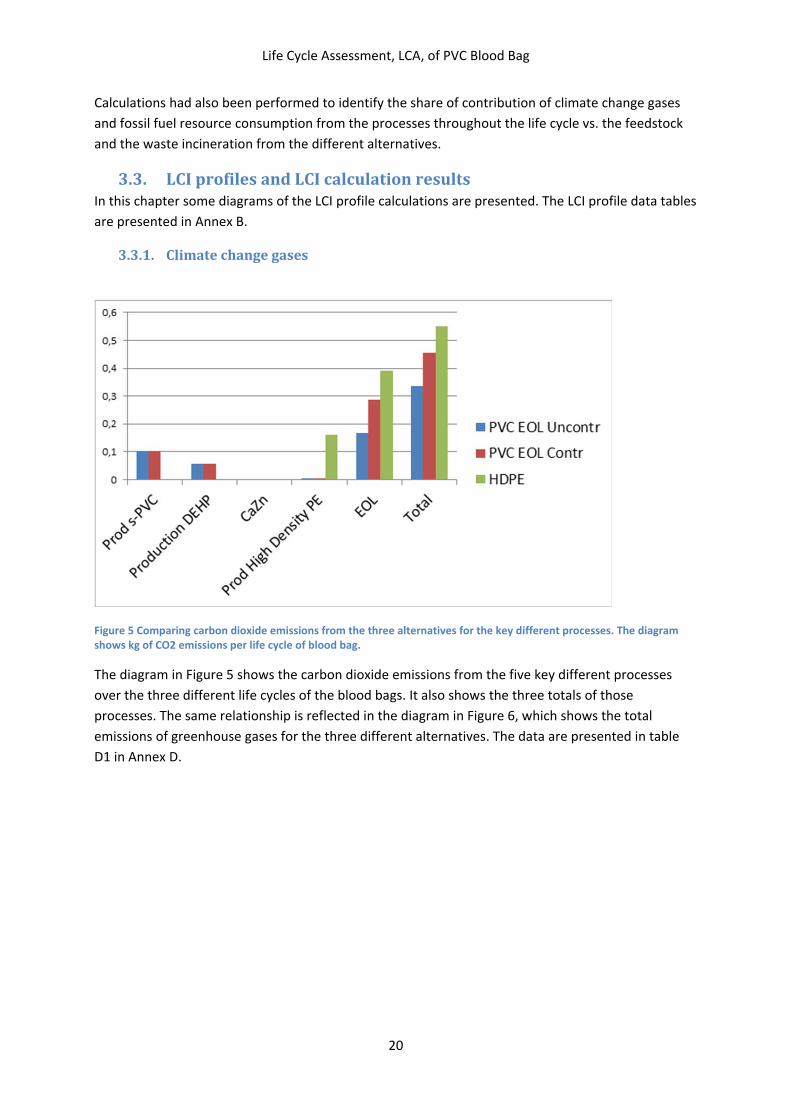
Figure 5 Comparing carbon dioxide emissions from the three alternatives for the key different processes. The diagram shows kg of CO2 emissions per life cycle of blood bag.
The diagram in Figure 5 shows the carbon dioxide emissions from the five key different processes
over the three different life cycles of the blood bags. It also shows the three totals of those
processes. The same relationship is reflected in the diagram in Figure 6, which shows the total
emissions of greenhouse gases for the three different alternatives. The data are presented in table
D1 in Annex D.
Life Cycle Assessment, LCA, of PVC Blood Bag
21
Figure 6 The greenhouse gases emitted from the life cycles of the different alternatives. The diagram shows kg of greenhouse gas emissions per life cycle of blood bag.
The diagrams in Figure 5 and Figure 6 show that the HDPE emits the higher amount of greenhouse
gases, and it shows that the reason for this is that it emits its larger carbon content during waste
incineration, and because it uses more energy during production than the PVC/DEHP alternative. The
diagrams also show that the scenario with a controlled incineration of the PVC blood bag contributes
more to climate change than the uncontrolled incineration. This is because of the need for extra
energy to acquire a better oxidation. The data are presented in table D2 in Annex D.
Figure 7 The carbon dioxide emissions from the three alternatives, divided onto incineration vs. the other processes. (compare with Figure 13 ). The diagram shows kg of CO2 emissions per life cycle of blood bag.
The diagram in Figure 7 shows the contribution for carbon dioxide emission divided between the
incineration and the rest of the life cycle of the blood bag. It shows that the High Density
0
0,5
1
1,5
2
2,5
Carbondioxide
Methane NitrousOxide
HCFCs andHFC
PVC EOL Uncontr
PVC EOL Contr
HDPE
0
0,5
1
1,5
2
2,5
PVC EOLUncontrolled
PVC EOLControlled
HDPE
CO2 emissions fromother processes
CO2 emissions fromincineration of waste
Life Cycle Assessment, LCA, of PVC Blood Bag
22
Polyethylene, HDPE blood bag contributes with most carbon dioxide over its life cycle, and that this is
mainly due to the final incineration stage.
It should be stressed that the total contribution to climate change would have increased equally for
the three alternatives if the transports would have been added to the study. The absolute value for
the climate change figures also depend strongly on the choice of data for the electricity production.
However, the relative values do not depend on this choice of electricity production.
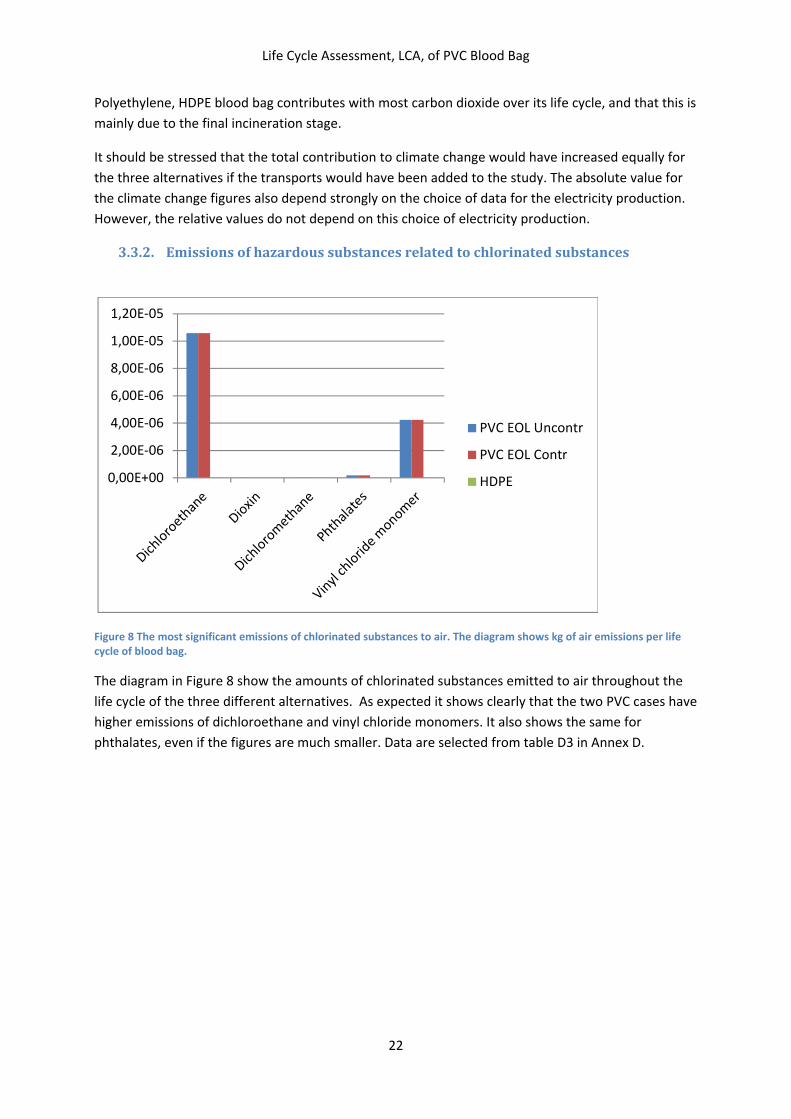
Figure 8 The most significant emissions of chlorinated substances to air. The diagram shows kg of air emissions per life cycle of blood bag.
The diagram in Figure 8 show the amounts of chlorinated substances emitted to air throughout the
life cycle of the three different alternatives. As expected it shows clearly that the two PVC cases have
higher emissions of dichloroethane and vinyl chloride monomers. It also shows the same for
phthalates, even if the figures are much smaller. Data are selected from table D3 in Annex D.
0,00E+00
2,00E‐06
4,00E‐06
6,00E‐06
8,00E‐06
1,00E‐05
1,20E‐05
PVC EOL Uncontr
PVC EOL Contr
HDPE
Life Cycle Assessment, LCA, of PVC Blood Bag
23
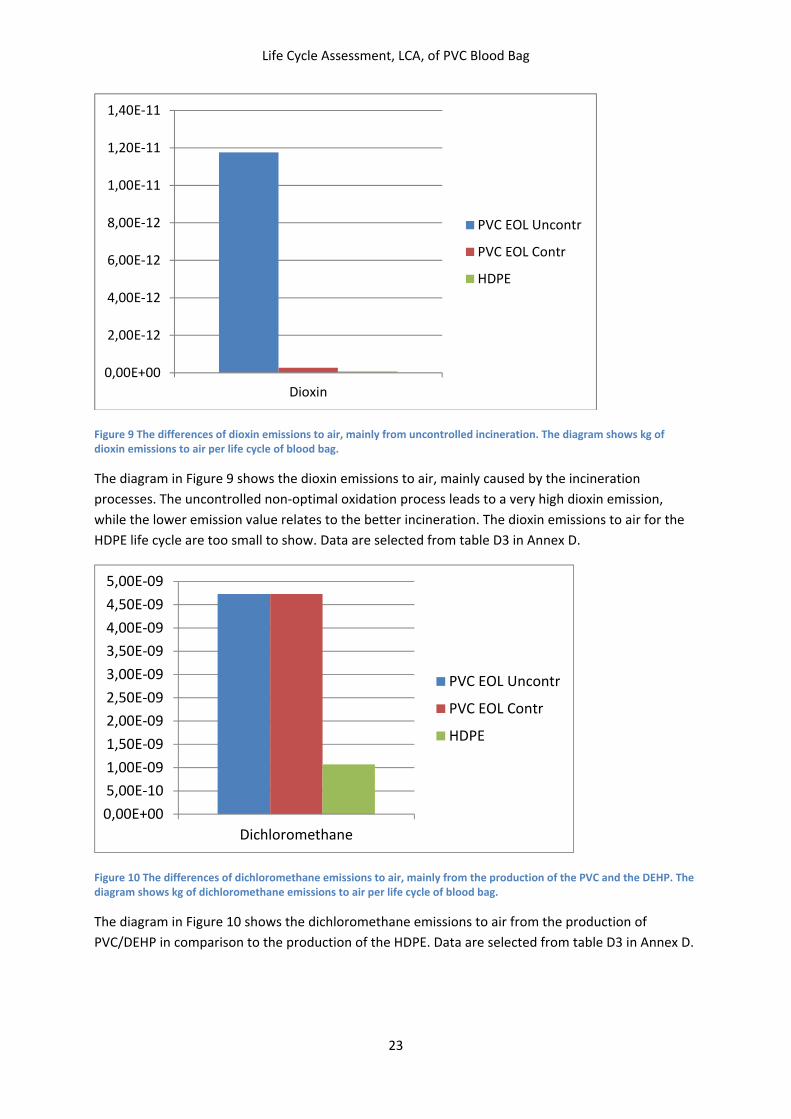
Figure 9 The differences of dioxin emissions to air, mainly from uncontrolled incineration. The diagram shows kg of dioxin emissions to air per life cycle of blood bag.
The diagram in Figure 9 shows the dioxin emissions to air, mainly caused by the incineration
processes. The uncontrolled non‐optimal oxidation process leads to a very high dioxin emission,
while the lower emission value relates to the better incineration. The dioxin emissions to air for the
HDPE life cycle are too small to show. Data are selected from table D3 in Annex D.
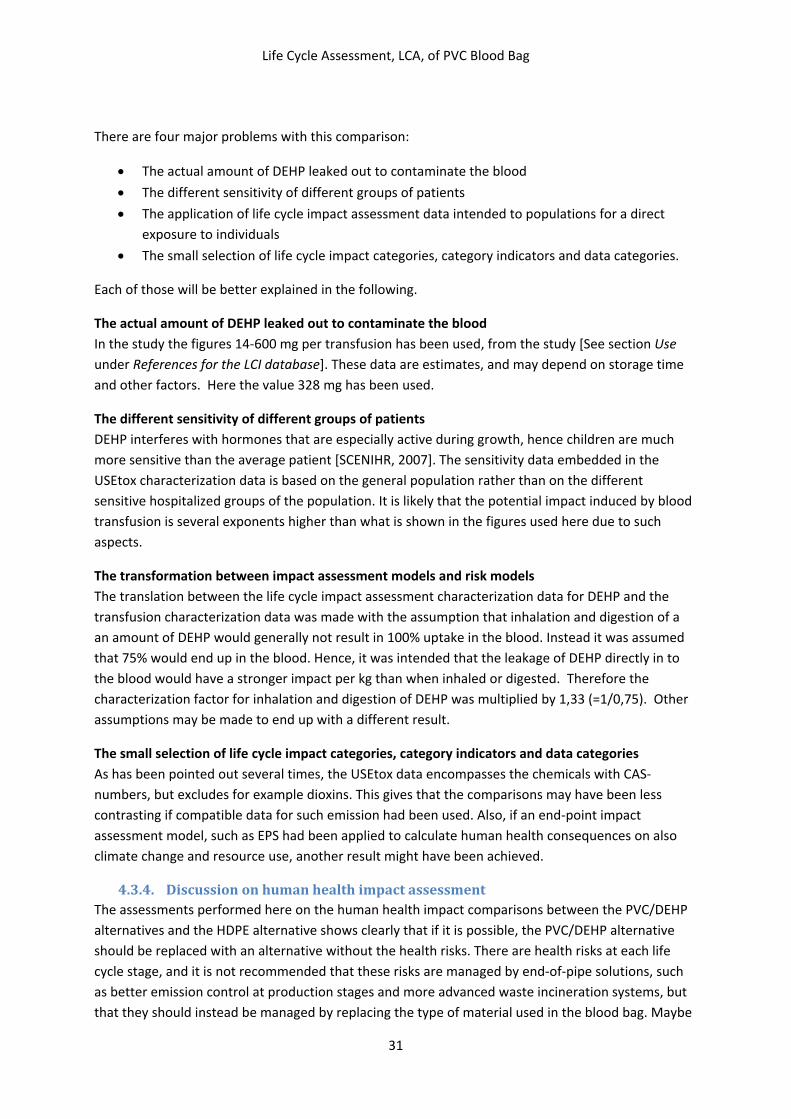
Figure 10 The differences of dichloromethane emissions to air, mainly from the production of the PVC and the DEHP. The diagram shows kg of dichloromethane emissions to air per life cycle of blood bag.
The diagram in Figure 10 shows the dichloromethane emissions to air from the production of
PVC/DEHP in comparison to the production of the HDPE. Data are selected from table D3 in Annex D.
0,00E+00
2,00E‐12
4,00E‐12
6,00E‐12
8,00E‐12
1,00E‐11
1,20E‐11
1,40E‐11
Dioxin
PVC EOL Uncontr
PVC EOL Contr
HDPE
0,00E+00
5,00E‐10
1,00E‐09
1,50E‐09
2,00E‐09
2,50E‐09
3,00E‐09
3,50E‐09
4,00E‐09
4,50E‐09
5,00E‐09
Dichloromethane
PVC EOL Uncontr
PVC EOL Contr
HDPE
Life Cycle Assessment, LCA, of PVC Blood Bag
24
Figure 11 The most significant emissions of chlorinated substances to water. The diagram shows kg of water emissions per life cycle of blood bag.
The diagram in Figure 11 shows the emissions of dioxin to water for the different alternatives.4
It was expected that the emissions of chlorinated substances are higher for PVC/DEHP, and the
presented tables show this clearly. Data are selected from table D3 in Annex D.
3.3.3. DepletionofnaturalresourcesThis section presents diagrams that show the depletion of natural resources by using the fossil fuel
consumption for the three different cases.
Figure 12 Comparing fossil fuel use from the three alternatives. The diagram shows kg of energyware per life cycle of blood bag.
4 It should be noted here that the Plastics Europe data for production HDPE revealed to have an erroneous data for a water emission of dioxins. This water emission could be identified as belonging to a production process with no incineration. It was concluded to be wrong and was therefore nullified.
0,00E+00
1,00E‐08
2,00E‐08
3,00E‐08
4,00E‐08
5,00E‐08
6,00E‐08
7,00E‐08
PVC EOL Uncontr
PVC EOL Contr
HDPE
0
0,1
0,2
0,3
0,4
0,5
0,6
0,7
0,8
0,9
1
Oil fuels Coal Natural gas
PVC EOL Uncontr
PVC EOL Contr
HDPE
Life Cycle Assessment, LCA, of PVC Blood Bag
25
The diagram in Figure 12 shows that HDPE uses more oil fuel, which is because of its higher content
of hydrocarbons. PVC and DEHP are also based on hydrocarbons from oil, but also from natural gas.
And they also contain a high amount of chloride, which originates from sea water or rock salt. The
relatively high amount of coal is due to the electricity production system. This may vary depending
on how the electricity is produced. Data are presented in table D4 in Annex D.
Figure 13 Comparing feedstock and energy use from the three different alternatives (compare with Figure 7). The diagram shows inflow of the natural resource oil in kg per of blood bag.
The diagram in Figure 13 shows that the natural resource oil is distributed between product content
(feedstock) and as fuel for energy production in other processes throughout the three different life
cycles. It is clear that the oil is used to a higher degree as feedback to the plastics in the HDPE and
that it uses less oil than the PVC alternatives as fuel for energy. The figure also shows the differences
in fuel use to acquire the better controlled incineration which leads to lower dioxin emissions. The
data are presented in table D5 in Annex D.
4. Impactassessment
4.1. ThreeimpactcategoriesThe impact assessment presented here is divided into the three impact categories climate change,
human health and natural resource depletion, since these were identified as the significant issues for
PVC/DEHP blood bags, and is also suitable for the reference high density Polyethylene blood bag. By
maintaining the three impact categories rather than weighting them together, the differences
between the alternatives are more transparent. The drawback is that in this case there is a trade‐off
between the impacts on the different impact categories of the different blood bag alternatives, and
the actual choice between which is the better alternative is left to the decision maker.
0
0,02
0,04
0,06
0,08
0,1
0,12
0,14
0,16
PVC EOLUncontrolled
PVC EOLControlled
HDPE
Natural resource oil forother processes
Natural resource oil ontofeedstock energy
Life Cycle Assessment, LCA, of PVC Blood Bag
26
4.2. Climatechange
4.2.1. TheimpactonclimatechangeThe diagram in Figure 14 shows how different the climate change contribution from the alternative
life cycle scenarios of the PVC/DEHP blood bag is in comparison to the High Density Polyethylene,
HDPE blood bag.
Figure 14 Comparing contributions to climate change between the three alternatives.
The diagram should be compared with Figure 7, which shows almost the same relationship, but only
based on carbon dioxide emissions. Data are selected from table D6 in Annex D.
The diagram is presented in the unit of carbon dioxide equivalents (CO2e), which means that
emissions of N2O, CH4 and CFCs are recalculated into how much each one contributes in relation to
the normalization of CO2e by applying the corresponding global warming potentials.
4.2.2. DiscussionaboutclimatechangeThere may be different ways to reduce the contribution to climate change from the different
alternative life cycles of the blood bags. For example, the energy may be produced using bio fuels or
may be more efficiently produced. Much of the virgin fossil oil content in the plastics may be
replaced with recycled or bio‐plastics, and during incineration it may considered that the heat
produced during the incineration replaces a less sustainable solution to heat generation, etc.
This has not been considered here, but it is expected from the reader of this report to identify these
potentials themselves. It is of course not acceptable to introduce any new sources for carbon dioxide
emissions for any reason, even if it is to substantially reduce severe human health risks as in this
case. The potential additional carbon dioxide emissions will most probably in the first place be
reduced by the fact that a simpler plastic can be burnt as better fuel in the incineration plants and
that the cleaner some gas emissions needs lesser treatment. In the next phase the plastics shall of
course be replaced by bio‐plastics or recycled material, if possible.
1,9
1,95
2
2,05
2,1
2,15
2,2
PVC EOL Uncontr. PVC Contr. HDPE
Life Cycle Assessment, LCA, of PVC Blood Bag
27
4.3. HumanhealthPotential human health impact is assessed using different impact assessment methods, and the
assessments are performed both over the full life cycle of the different alternatives and by
comparing the potential health impact over the life cycle with the health impact from the blood
transfusion. The methods used to assess the health impact over the life cycle are the Eco‐indicator,
the EDIP, and the USEtox method. The USEtox method is also used to compare the potential human
health impacts from emissions during the life cycle of the blood bag with the potential human health
impacts induced by DEHP contaminated transfused blood (section 4.3.3).
4.3.1.1. GeneralabouthumanhealthimpactassessmentAll the impact assessment methods that are used here have an, in general, similar approach
regarding how to quantify the impact on human health. The basis for the quantification is empirical
toxicity studies performed in laboratories and which results in quantifications of concentration or
amount of a specific substance that causes cancer, impacts reproduction, is lethal, gives skin
irritation or is otherwise indicated to disturb the health of the test specimens. On these well‐
structured laboratory results, the impact assessment methods are formed by a systematic estimation
about how an emission eventually causes a concentration in soil or air or water, and how this impacts
the health of the general population.
The USEtox characterization data are developed for traded chemicals, which means chemicals that
are sold and can be bought and that therefore have a CAS number, such as phthalates. Dioxins,
however, are unintended products of inefficient combustion of chlorinated substances, such as PVC
and DEHP. They are not available on the market and do not have a CAS number and are therefore
not included in the USEtox method. This is the major reason why older data from the two different
methods Eco‐indicator and EDIP with less degree of scientific consensus are also used to assess the
environmental impact of the life cycle. They both have a combined set of characterization data for
both the dioxins and for other chemical substances.
4.3.1.2. Eco‐indicatorThe impact assessment method Eco‐indicator uses the term DALY (Disability Adjust Life Years) as
category indicator to describe human health impacts. The quantification of DALY is calculated and
modeled on the same basis as described in section 4.3.1.1, but is the sum modeled as a sum of years
of potential life lost due to premature mortality and the years of productive life lost due to disability.
[Goedkoop, Spriensma, 1999]
4.3.1.3. EDIPThe EDIP method follows nearly exactly the general description of human health impact assessment
method described in section 4.3.1.1., and results in several contributions to human health toxicity
impacts resulting from the media air, water and soil. The actual human health impact summarizes
those human health impacts coming from the different media. [Wenzel, Hauschild, Alting, 1997]
4.3.1.4. USEtoxThe USEtox method also follows the general description of human health impact assessment method
described in section 1.2. In addition, the USEtox method is developed by a group of world leading
human toxicology experts and LCA experts in a network [USEtox, 2012] established jointly by UNEP
Life Cycle Assessment, LCA, of PVC Blood Bag
28
(United Nations Environmental Programme) and SETAC (Society for Environmental Toxicology and
Chemistry).
4.3.2. ComparingthethreelifecyclealternativesThe diagram in Figure 15 shows the human health impact using the concept of DALY by the impact
assessment method Eco‐indicator. The diagram in Figure 16 shows the same thing using the the
human toxicity concept of the EDIP method. Both these diagrams show the same result, that the
dioxin emission from the uncontrolled incineration of PVC has a large impact on the human health
over the life cycle of the blood bag. Even when using the controlled incineration with substantially
much lower dioxin emissions, these are still very high in comparison to the overall potential life cycle
impact on human health compared with the HDPE alternative. Data are selected from table D7 in
Annex D.
Figure 15 Human health impact in DALY (Disability adjust life years) using the Eco‐indicator impact assessment method.
Figure 16 Human health impact in DALY (Disability adjusted life years) using the EDIP impact assessment method.
It should be stressed that the high impacts are directly related to the data and modeling used for
waste incineration. Any cleaning of dioxin emissions will be directly reflected in these impact
assessment evaluations. A comparison with the diagram in Figure 7 should be regarded however,
0,00E+00
2,00E‐08
4,00E‐08
6,00E‐08
8,00E‐08
1,00E‐07
1,20E‐07
1,40E‐07
1,60E‐07
PVC EOL Uncontr. PVC Contr. HDPE
Human health DALY Eco‐indicator
0,00E+00
1,00E+00
2,00E+00
3,00E+00
4,00E+00
5,00E+00
6,00E+00
7,00E+00
8,00E+00
PVC EOL Uncontr. PVC Contr. HDPE
Human health Toxicity EDIP
Life Cycle Assessment, LCA, of PVC Blood Bag
29
because a cleaning of dioxin may be expensive with regards to resource consumption and may
produce more carbon dioxide that contributes to climate change.
Figure 17 Potential human health impact evaluated by the USEtox method, number of cases, divided per type of analysed emission.
Figure 18 Potential human health impact evaluated by the USEtox method, number of cases, divided per emitting life cycle stage.
By combining the information given in the diagrams of Figure 17 and Figure 18 it is clear that the
major potential human health impact from the PVC/DEHP blood bag when using the USEtox method
comes from the production of the PVC resin (s‐PVC), and that this is mainly caused by the emission of
vinyl chloride monomers (VCM). It needs to be stressed that the diagrams also includes the full life
cycle process steps of the HDPE blood bag, and that the potential human health impact from this is
negligible. Data are selected from table D6 in Annex D.
0
2E‐12
4E‐12
6E‐12
8E‐12
1E‐11
1,2E‐11
1,4E‐11
Dichloroethane(air)
Phthalates (air) Vinyl chloridemonomer (air)
Dichloroethane(water)
Vinyl chloridemonomer(water)
Human health by USEtox, divided per type of analysed emission
PVC/DEHP
HDPE
0
2E‐12
4E‐12
6E‐12
8E‐12
1E‐11
1,2E‐11
1,4E‐11
1,6E‐11
1,8E‐11
Prod. of s‐PVC Prod. of DEHP Prod. of HDPE Prod. of Electr.
Human health by USEtox, divided per emitting life cycle stage
PVC/DEHP
HDPE
Life Cycle Assessment, LCA, of PVC Blood Bag
30
The reader is reminded about that the USEtox database does not contain data for the dioxin
emissions, which is the reason why there is no difference between the two PVC/DEHP cases, where
the major human health impact comes from the dioxin emissions presented in the diagrams of Figure
15 and Figure 16.
4.3.3. Comparingimpactfromlifecyclevs.transfusionAs described in section 4.3.1.1, the basic data for the characterization data for life cycle human
health impact is the laboratory data about how concentration of substances impacts health on test
specimens. This same data is used to assess the exposure risk for these substances during handling,
inhalation etc. that is the basis for example for risk classification. Therefore it is at least in theory
possible to compare the potential human health impact induced by the total life cycle of a blood bag
to the potential human health impact induced by to one patient that receives blood via transfusion
of this same blood bag.
Figure 19 Comparing the potential impact on human health from the total life cycle of a PVC/DEHP blood bag to the potential impact from the transfusion.
The diagram in Figure 19 shows a large difference in the potential impact on human health from
blood transfusion. It should be stressed that the bar Total life cycle, which is too small to be visible
next to the bar showing Exposure during transfusion is in fact the sum of the bars in either Figure 17
or Figure 18. Data are selected from table D6 in Annex D. An excerpt of that data is presented in
Table 1 below.
Table 1 Human health cases (cancer + non‐cancer) per PVC/DEHP blood bag, evaluated by USEtox.
Human health cases per blood bag
Total life cycle 1,6E‐11
Exposure during transfusion 1,3E‐06
0,0E+00
2,0E‐07
4,0E‐07
6,0E‐07
8,0E‐07
1,0E‐06
1,2E‐06
1,4E‐06
Total life cycle Exposure during transfusion
Human health by USEtox, comparing total life cycle emissions to exposure during tranfusion
Life Cycle Assessment, LCA, of PVC Blood Bag
31
There are four major problems with this comparison:
The actual amount of DEHP leaked out to contaminate the blood
The different sensitivity of different groups of patients
The application of life cycle impact assessment data intended to populations for a direct
exposure to individuals
The small selection of life cycle impact categories, category indicators and data categories.
Each of those will be better explained in the following.
The actual amount of DEHP leaked out to contaminate the blood
In the study the figures 14‐600 mg per transfusion has been used, from the study [See section Use
under References for the LCI database]. These data are estimates, and may depend on storage time
and other factors. Here the value 328 mg has been used.
The different sensitivity of different groups of patients
DEHP interferes with hormones that are especially active during growth, hence children are much
more sensitive than the average patient [SCENIHR, 2007]. The sensitivity data embedded in the
USEtox characterization data is based on the general population rather than on the different
sensitive hospitalized groups of the population. It is likely that the potential impact induced by blood
transfusion is several exponents higher than what is shown in the figures used here due to such
aspects.
The transformation between impact assessment models and risk models
The translation between the life cycle impact assessment characterization data for DEHP and the
transfusion characterization data was made with the assumption that inhalation and digestion of a
an amount of DEHP would generally not result in 100% uptake in the blood. Instead it was assumed
that 75% would end up in the blood. Hence, it was intended that the leakage of DEHP directly in to
the blood would have a stronger impact per kg than when inhaled or digested. Therefore the
characterization factor for inhalation and digestion of DEHP was multiplied by 1,33 (=1/0,75). Other
assumptions may be made to end up with a different result.
The small selection of life cycle impact categories, category indicators and data categories
As has been pointed out several times, the USEtox data encompasses the chemicals with CAS‐
numbers, but excludes for example dioxins. This gives that the comparisons may have been less
contrasting if compatible data for such emission had been used. Also, if an end‐point impact
assessment model, such as EPS had been applied to calculate human health consequences on also
climate change and resource use, another result might have been achieved.
4.3.4. DiscussiononhumanhealthimpactassessmentThe assessments performed here on the human health impact comparisons between the PVC/DEHP
alternatives and the HDPE alternative shows clearly that if it is possible, the PVC/DEHP alternative
should be replaced with an alternative without the health risks. There are health risks at each life
cycle stage, and it is not recommended that these risks are managed by end‐of‐pipe solutions, such
as better emission control at production stages and more advanced waste incineration systems, but
that they should instead be managed by replacing the type of material used in the blood bag. Maybe
Life Cycle Assessment, LCA, of PVC Blood Bag
32
is not HDPE a functional material option, but there are many plastics that should be tested. There are
very good reasons to try to replace the PVC/DEHP with something less hazardous to human health,
and that also meet the same technical quality criteria.
4.4. Naturalresources
4.4.1. EvaluatingfossilresourceconsumptionThis study is based on the simple assumption made by Plastics Europe that PVC and High Density
Polyethylene are based on virgin fossil resources. There are alternatives to virgin fossil resources. The
two major categories of alternatives are to use recycled raw material or to use bio‐plastics as input.
Either alternative in separate or in combination will reduce the need for fossil resources. However,
this study is not aiming to assess different options to produce PVC and HDPE. Instead it is considered
more useful to identify the fossil resource consumption by the different alternative blood bags, and
to propose that any actual choice of blood bag should be produced by the most sustainable option,
that is non‐fossil raw material.
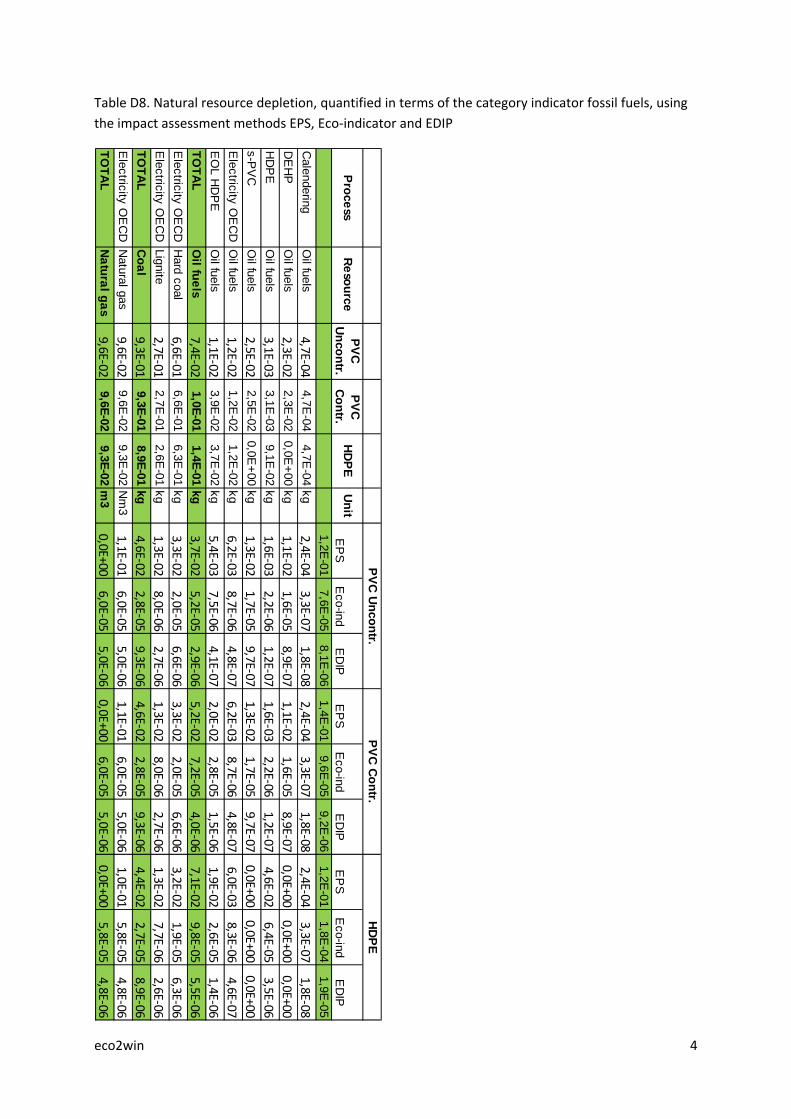
Figure 20 Resource depletion over the life cycle of the three scenarios evaluated using the EPS, the eco‐indicator and the EDIP methods. It should be noted that comparisons between the methods makes no sense. The three different methods express resource depletion in different units. The diagram is normalized to make it easy to see how the different methods evaluate the alternatives.
The diagram in Figure 20 shows how the different impact assessment methods give different
emphasis to different resources. The data are selected from Table D8 in Annex D. The major
difference between the evaluation by the EPS method and the other two methods depends on that
the EPS method assigns a lower value to the oil resource, based on a faith in the adaptability of the
market to utilize other energy and coal resources when the price of oil increases. The Eco‐indicator
and the EDIP methods assign a relatively high value to fossil oil since oil is considered to be more
scarce as an individual resource than both coal and natural gas. Since the PVC/DEHP alternative
consumes more electric energy during production and much of the electricity production is based on
coal, and since the HDPE alternative contains more oil in the product the actual difference is
expected:
EPS Eco‐indicator EDIP
PVC EOL Uncontr.
PVC Contr.
HDPE
Life Cycle Assessment, LCA, of PVC Blood Bag
33
The EPS method gives a relatively low value to fossil oil consumption and a relatively high
value to the consumption of any fossil fuel, and since the electricity for the production of the
PVC/DEHP alternatives are much based on oil and gas, these alternatives gives the worse
result.
The Eco‐indicator and the EDIP methods give a relatively high value to the fossil oil
consumption that occurs when utilizing virgin oil as 100% raw material for the HDPE blood
bag, and incinerating it in the end.
4.4.2. AlternativestoresourceconsumptionIn the beginning of section 4.4.1 it was mentioned that the assumption to use virgin fossil oil for the
different plastics alternatives could be exchanged with for example recycled material and bio‐
plastics. Such solutions are necessary for any alternative blood bag, since depletion of resources is
not sustainable.
There are other options towards reaching a more sustainable level of resource consumption. Some of
them will be mentioned here, together with arguments why they were not considered in this study.
Replacing another energy source during incineration
When incinerating the blood bags, the additional generated heat replaces the use of an alternative
source of energy to generate this heat, such as oil, coal, wind power or any other source. This
alternative was considered but not included, for two reasons. The first reason is that it is likely that
such systems are installed already in many places where medical waste is incinerated. And where
they are installed, the system depends on the medical waste as fuel. Hence, there is no fuel that is
replaced any longer. It is just PVC or HDPE based on virgin fossil fuel being incinerated.
Using more efficient production data for PVC, DEHP, HDPE and electricity
The result from the study would most likely have shown lower consumption of resources if best
available, or even best current practice data would have been used all over. However, it was
considered more relevant to establish an understanding of the key impact areas of consideration for
the blood bags, and to quantify the different impacts and present them, than to have the latest data
for all technologies.
To summarize, the goal must be to stop spending fossil resources, to seek to close the recycling loops
and use less material all over.
4.5. DiscussionaboutweightingandprioritizationsAs has been presented in this chapter, the environmental impact from the different blood bags are
assessed using characterization and weighting by the use of different impact assessment methods
that helps highlight different aspects of the environmental impact.
In section 4.2 only carbon dioxide equivalents were to quantify the total life cycle contribution to
climate change for the different alternatives. In section 4.3 three different methods were used to
characterize the potential impact on human health. And in section 4.4 another three different
weighting methods were used to summarize different fossil resources into one total figure for each
alternative.
Since the quantification of the three impact categories necessarily are made using different category
indicators, hence are quantified in different units, they are not directly comparable with each other.
Life Cycle Assessment, LCA, of PVC Blood Bag
34
Instead one needs to decide which way to summarize the result. This LCA project does not have the
resources to develop and apply a systematic weighting between the different results in order to
compare the environmental impacts from resource depletion, human health and climate change.
Such systematic default weighting methods are included in the EPS, the Eco‐indicator and the EDIP
impact assessment methods. But since no single method has been applied or favored in this study,
those default methods could not be applied. In fact, since the blood bags show strong differences in
the three different impact categories, and since the alternatives are rather contrasting than a matter
of degree or nuances, it is suggested than instead of attempting to summarize the different impact
categories they should rather be held separate, as separate dimensions. The three dimensional
diagram in Figure 21 represents this line of thought, a 3‐axis approach.
Figure 21 The different impact from the three different alternatives onto the three different impact categories presented as different dimensions in a co‐ordination system, the 3‐axis approach. A conceptual summary of the graphs for each alternative is indicated onto each axis.
It should be stressed that this 3‐axis approach is not intended as a weighting method, but is a
graphical and mental support when presenting the quantitative impact assessment onto three
separate impact categories to a decision maker, such as a product developer. With the support from
Figure 21 the following reasoning about prioritizations follows.
For the PVC/DEHP blood bag there are major environmental issues to consider for all three impact
categories. There are practical ways to move ahead concerning depletion of natural resources and
impact on climate change, i.e. by introducing more efficient recycling, bio‐plastics and co‐processing
waste incineration and energy generation. But with regards to the many different potential impacts
on human health related to the choice of chlorinated material for a blood bag, doubts should be
raised as to whether it is either ethical or economical to sustain this choice of material. Questions
should be asked if it PVC and DEHP are really necessary, or whether a blood bag with life cycle
properties more similar to the HDPE alternative shown in this LCA study could be used instead.
BIS (2‐ETHYLHEXYL) PHTHALATE (DEHP), CAS No: 117‐81‐7, EINECS No: 204‐211‐0, Summary Risk
Assessment Report, EUR 23384 EN/2, European Commission, Joint Research Centre, Institute of
Health and Consumer Protection (IHCP), Toxicology and Chemical Substances (TCS), European
Chemicals Bureau (ECB), 2008
L.P.M. Rijpkema, PVC and municipal solid waste combustion: Burden or benefit?, TNO‐report TNO‐
MEP ‐ R 99/462, TNO Institute of Environmental Sciences, Energy Research and Process Innovation,
1999
U.S. Food and Drug Administration, Safety Assessment of Di(2‐ethylhexyl)phthalate (DEHP) Released from PVC Medical Devices, Center for Devices and Radiological Health, U.S. Food and Drug Administration, 2002 SCENIHR, Preliminary report on the safety of medical devices containing DEHP plasticized PVC or other plasticizers on neonates and other groups possibly at risk, Scientific Committee on Emerging and Newly‐Identified Health Risks, 2007 Vadas, Flora, Nguyen‐Ngoc, Diep, Mechanical recycling versus incineration of PVC waste Greenhouse gas emissions, European Council of Vinyl Manufacturers (ECVM), Toxicology and Chemical Substances (TCS), European Chemicals Bureau (ECB), Joint Research Centre, 2009 Steen, Bengt, A systematic approach to environmental priority strategies in product development (EPS). Version 2000 – Models and data of the default method CPM report Chalmers University of Technology Sweden, 1999 Goedkoop, Mark, Spriensma, Reinilde, The Eco‐indicator 99 ‐ A damage oriented method for Life Cycle Impact Assessment Methodology Report, Second edition, 1999 Wenzel, Henrik, Hauschild, Michael, Alting, Leo, Environmental assessment of products Vol. 1 Methodology, tools and case studies in product development London Chapman & Hall, 1997 USEtox, http://www.usetox.org, 2012‐02‐23 IPCC, 2006 IPCC revised guidelines for National Greenhouse Gas Inventories, http://www.ipcc‐nggip.iges.or.jp/public/2006gl/index.html, 2012‐02‐23
Life Cycle Assessment, LCA, of PVC Blood Bag
38
LCIdatabasereferences
S‐PVC:
Ostermayer, Axel, Giegrich, Jürgen, Eco‐profiles of the European Plastics Industry ‐ POLYVINYLCHLORIDE (PVC) (SUSPENSION POLYMERISATION), The European Council of Vinyl Manufacturers (ECVM) & PlasticsEurope. Data last calculated July 2006. Available at Plastics Europe web site: http://www.plasticseurope.org/plastics‐sustainability/eco‐profiles.aspx, 2012‐02‐28
DEHP:
Eco‐Profiles of High Volume Commodity Phthalate Esters (DEHP/DINP/DIDP). January 2001. Prepared for The European Council for Plasticisers and Intermediates (ECPI) a sector Group of CEFIC. Prepared by Ecoliban. Member company of PricewaterhouseCoopers. (ECPI, 2001)
CaZn Internal modeling, based on similarities with other mineral extraction.
HDPE
Eco‐profiles of the European Plastics Industry ‐ HIGH DENSITY POLYETHYLENE (HDPE). A report by I Boustead for PlasticsEurope. Data last calculated March 2005. Available at Plastics Europe web site: http://www.plasticseurope.org/plastics‐sustainability/eco‐profiles.aspx, 2012‐02‐28
Compounding
European Union Risk Assessment Report on Bis(2‐ethylhexyl) phthalate (DEHP). Final Report, 2008. European Commission, Joint Research Centre: Institute of Health and Consumer Protection (IHCP), Toxicology and Chemical Substances (TCS), European Chemicals Bureau (ECB). Page 25.
The safety of medical devices containing DEHP‐plasticized PVC or other plasticizers on neonates and other groups possibly at risk. European Commission 2008. Scientific Committees: SCCP, SCHER and SCENIHR.
Calendering
Eco‐profiles of the European Plastics Industry. PVC FILM CALENDERING. A report by TNO for PlasticsEurope. Data last calculated February 2010. Boustead, I. (2005). PVC Sheet Calendering. Plastics Europe.
Manufacturing
Changzhou Jiarui Precision Machinery Co., Ltd. Description/ Specification of Medical Blood Bag Making Machine. Available at: http://www.tradeindia.com/fp843432/Medical‐Blood‐Bag‐Making‐Machine.html, 2012‐02‐28 Project Abstract for production of Blood Bags as a Trunkey Plant. Ensymm. Page 6: Schematic diagram of the sequence used to produce a blood bag.
Mazin, Tamer Shawky, Blood bag separation, http://dc407.4shared.com/doc/‐2dwiVlP/preview.html, 2012‐02‐04
Use
The Blood Cold Chain. Guide to the selection and procurement of equipment and accessories. November 2002. Department of Blood Safety and Clinical Technology. World Health Organization. Geneva, http://www.who.int/medical_devices/publications/en/Blood_Cold_Chain.pdf, 2012‐02‐28 Powering Health. Options for improving energy services at health facilities in Haiti. January, 2008.
Jeffrey Haeni, Office of Infrastructure and Engineering – Energy Team, USAID. Walt Ratterman, Institute of International Education (IIE) Consultant. Table 2: Power requirements of common blood bank refrigerators (page 22)
Estimation of DEHP human exposure: http://www.chemicalspolicy.org/downloads/DEHP.pdf/ttp://sustainableproduction.org, 2012‐02‐28
EOL PVC Uncontrolled / EOL PVC Controlled/ EOL HDPE: Emission factor documentation for AP‐42 section 2.6 Medical Waste Incineration. Office of Air Quality Planning and Standards. Office of Air and Radiation. U.S. Environmental Protection Agency. Research Triangle Park, North Carolina 27711. July 1993, http://www.epa.gov/ttn/chief/ap42/ch02/bgdocs/b02s03.pdf, 2012‐02‐28
An evaluation of the cost of incinerating wastes containing PVC. Table 1: Typical PVC and Chlorine content of MSW and MW. http://files.asme.org/Committees/K&C/TCOB/BRTD/EEW/24116.pdf, 2012‐02‐28
ELCD core database version II. http://lca.jrc.ec.europa.eu/lcainfohub/datasetCategories.vm, 2012‐02‐28
USA EPA, waste data on plastics: http://epa.gov/climatechange/wycd/waste/downloads/plastics‐chapter10‐28‐10.pdf, 2012‐02‐28
DEFRA Life‐Cycle Conversion Factors for Waste Disposal http://archive.defra.gov.uk/environment/business/reporting/pdf/110819‐guidelines‐ghg‐conversion‐factors.pdf, 2012‐02‐28
2006 IPCC Guidelines for National Greenhouse Gas Inventories. Chapter 2. Table 2.2: DEFAULT EMISSION FACTORS FOR STATIONARY COMBUSTION IN THE ENERGY INDUSTRIES
Incer8 web page: http://www.inciner8.com, 2012‐02‐28
Life Cycle Assessment, LCA, of PVC Blood Bag
40
Electricity OECD IEA Statistics, Energy statistics of OECD countries 1997-1998, 2000 Edition, ISBN 92-64-05914-8, page II.300. http://www.cpmdatabase.chalmers.se, 2012‐02‐28
Raul Carlson, eco2win 1
AnnexA,ThelifecycleinventorydatabaseThe life cycle inventory database is presented separately in a separate library of MS Excel files made
available by the publisher of this report.
The list of references used to establish this life cycle inventory database is shown under the separate
section LCI database references in the References section of this report.
Raul Carlson, eco2win 2
AnnexB,theLCIprofiles
PVC/DEHPbloodbagwith controlledincineration
Table A1 LCI profile of the PVC/DEHP blood bag with controlled incineration
Table A2 Division of natural resource oil into feedstock and as fuel energy to processes and transports
TableA3 Division of CO2‐emissions from incineration of waste PVC/DEHP waste and from combustion of fuels from processes and transports
CLIMATE CHANGEOutput Emission Carbon dioxide 2,02E+00 kg AirOutput Emission Methane 4,51E-03 kg AirOutput Emission Nitrous Oxide 1,51E-05 kg AirOutput Emission HCFCs and HFC 1,09E-08 kg AirTOXICITYOutput Emission Dichloroethane 1,06E-05 kg AirOutput Emission Dioxin 2,65E-13 kg AirOutput Emission Dichloromethane 4,73E-09 kg AirOutput Emission Phthalates 1,87E-07 kg AirOutput Emission Vinyl chloride monomer 4,23E-06 kg AirOutput Emission Adult transfusion exposure 3,28E-04 kg HumanOutput Emission Dichloroethane 2,31E-08 kg WaterOutput Emission Dioxin 1,39E-14 kg WaterOutput Emission Vinyl chloride monomer 6,33E-08 kg WaterRESOURCE USEInput Natural resource Oil fuels 1,03E-01 kg GroundInput Natural resource Coal 9,25E-01 kg GroundInput Natural resource Natural gas 9,63E-02 m3 Ground
4,30E-02 kg5,98E-02 kg
Natural resource oil onto feedstock energyNatural resource oil for other processes
2,86E-01 kgCO2e1,84E+00 kgCO2eCO2 emissions from other processes
CO2 emissions from incineration of waste
Raul Carlson, eco2win 3
PVC/DEHPbloodbagwith Uncontrolledincineration
Table A4 LCI profile of the PVC/DEHP blood bag with Uncontrolled incineration
Table A5 Division of natural resource oil into feedstock and as fuel energy to processes and transports
Table A6 Division of CO2‐emissions from incineration of waste PVC/DEHP waste and from combustion of fuels from processes and transports
CLIMATE CHANGEOutput Emission Carbon dioxide 1,91E+00 kg AirOutput Emission Methane 4,51E-03 kg AirOutput Emission Nitrous Oxide 1,51E-05 kg AirOutput Emission HCFCs and HFC 1,09E-08 kg AirTOXICITYOutput Emission Dichloroethane 1,06E-05 kg AirOutput Emission Dioxin 1,18E-11 kg AirOutput Emission Dichloromethane 4,73E-09 kg AirOutput Emission Phthalates 1,87E-07 kg AirOutput Emission Vinyl chloride monomer 4,23E-06 kg AirOutput Emission Adult transfusion exposure 3,28E-04 kg HumanOutput Emission Dichloroethane 2,31E-08 kg WaterOutput Emission Dioxin 1,39E-14 kg WaterOutput Emission Vinyl chloride monomer 6,33E-08 kg WaterRESOURCE USEInput Natural resource Oil fuels 7,41E-02 kg GroundInput Natural resource Coal 9,25E-01 kg GroundInput Natural resource Natural gas 9,63E-02 m3 Ground
4,30E-02 kg3,10E-02 kg
Natural resource oil onto feedstock energyNatural resource oil for other processes
1,68E-01 kgCO2e1,84E+00 kgCO2e
CO2 emissions from incineration of wasteCO2 emissions from other processes
Raul Carlson, eco2win 4
HighDensityPolyethylenebloodbag
Table A7 LCI profile of the High Density Polyethylene blood bag
Table A8 Division of natural resource oil into feedstock and as fuel energy to processes and transports
Table A9 Division of CO2‐emissions from incineration of waste PVC/DEHP waste and from combustion of fuels from processes and transports
CLIMATE CHANGEOutput Emission Carbon dioxide 2,06E+00 kg AirOutput Emission Methane 5,39E-03 kg AirOutput Emission Nitrous Oxide 1,17E-05 kg AirOutput Emission HCFCs and HFC 1,05E-08 kg AirTOXICITYOutput Emission Dichloroethane 9,90E-10 kg AirOutput Emission Dioxin 7,17E-14 kg AirOutput Emission Dichloromethane 1,07E-09 kg AirOutput Emission Phthalates 0,00E+00 kg AirOutput Emission Vinyl chloride monomer 2,12E-10 kg AirOutput Emission Adult transfusion exposure 0,00E+00 kg HumanOutput Emission Dichloroethane 5,18E-14 kg WaterOutput Emission Dioxin 0,00E+00 kg WaterOutput Emission Vinyl chloride monomer 9,46E-13 kg WaterRESOURCE USEInput Natural resource Oil fuels 1,40E-01 kg GroundInput Natural resource Coal 8,91E-01 kg GroundInput Natural resource Natural gas 9,28E-02 m3 Ground
1,00E-01 kg4,00E-02 kg
Natural resource oil onto feedstock enerNatural resource oil for other processes
3,90E-01 kgCO2e1,79E+00 kgCO2eCO2 emissions from other processes
Tabell A11 Comparing LCI profiles of PVC/DEHP Controlled vs Uncontrolled waste incineration
CLIMATE CHANGEOutput Emission Carbon dioxide -2,13E-01 kg AirOutput Emission Methane -8,83E-04 kg AirOutput Emission Nitrous Oxide 3,40E-06 kg AirOutput Emission HCFCs and HFC 4,01E-10 kg AirTOXICITYOutput Emission Cl2 1,16E-07 kg AirOutput Emission Dichloroethane 1,06E-05 kg AirOutput Emission Dioxin 1,93E-13 kg AirOutput Emission HCl 9,69E-06 kg AirOutput Emission Dichloromethane 3,66E-09 kg AirOutput Emission Phthalates 1,87E-07 kg AirOutput Emission Polyvinyl chloride 7,38E-09 kg AirOutput Emission Vinyl chloride mon 4,23E-06 kg AirOutput Emission Other organo chlor 1,55E-10 kg AirOutput Emission Adult transfusion e 3,28E-04 kg HumanOutput Emission Chlorine 3,90E-03 kg WaterOutput Emission Dichloroethane 2,31E-08 kg WaterOutput Emission Dioxin -9,69E-11 kg WaterOutput Emission Vinyl chloride mon 6,33E-08 kg WaterOutput Emission Other organo chlor 2,49E-07 kg WaterRESOURCE USEInput Natural resource Bio fuels -1,53E-03 kg GroundInput Natural resource Oil fuels -3,94E-02 kg GroundInput Natural resource Coal 3,40E-02 kg GroundInput Natural resource Natural gas 3,54E-03 m3 Ground
CLIMATE CHANGEOutput Emission Carbon dioxide 6,52E-07 kg AirOutput Emission Methane 0,00E+00 kg AirOutput Emission Nitrous Oxide 0,00E+00 kg AirOutput Emission HCFCs and HFC 0,00E+00 kg AirTOXICITY 0,00E+00Output Emission Cl2 0,00E+00 kg AirOutput Emission Dichloroethane 0,00E+00 kg AirOutput Emission Dioxin 1,15E-11 kg AirOutput Emission HCl 8,61E-05 kg AirOutput Emission Dichloromethane 0,00E+00 kg AirOutput Emission Phthalates 0,00E+00 kg AirOutput Emission Polyvinyl chloride 0,00E+00 kg AirOutput Emission Vinyl chloride mon 0,00E+00 kg AirOutput Emission Other organo chlor 0,00E+00 kg AirOutput Emission Adult transfusion e 0,00E+00 kg HumanOutput Emission Chlorine 0,00E+00 kg WaterOutput Emission Dichloroethane 0,00E+00 kg WaterOutput Emission Dioxin 0,00E+00 kg WaterOutput Emission Vinyl chloride mon 0,00E+00 kg WaterOutput Emission Other organo chlor 0,00E+00 kg WaterRESOURCE USE 0,00E+00Input Natural resource Bio fuels 0,00E+00 kg GroundInput Natural resource Oil fuels 0,00E+00 kg GroundInput Natural resource Coal 0,00E+00 kg GroundInput Natural resource Natural gas 0,00E+00 m3 Ground
eco2win 1
AnnexCImpactassessmentdataTable C1 Carbon dioxide equivalents, based on 100 years from IPCC publication.
Other characterization factors used is presented in the Excel files database library published together
with this report.
IPCC
CO2 1 kgCO2eq/kg
CH4 21 kgCO2eq/kg
N2O 310 kgCO2eq/kg
HCFC 1500 kgCO2eq/kg
eco2win 1
AnnexDCalculatedtables
Tablesrepresentingdiagramsshownforclimatechangegasesinsection3.3.1Table D1 Comparing carbon dioxide emissions from the three alternatives for the key different
processes.
Table D2. The greenhouse gases emitted from the life cycles of the different alternatives.
Table D3. The most significant emissions of chlorinated substances to air.
Table D4. The consumption of fossil fuel for the three alternatives.
Table D5. Division of fossil oil as fuel and as feedstock.
Table D6. Climate change contribution, emission data calculated into CO2‐equivalents in the
rightmost column with IPCC data from table C1.
PVC EOL Uncontrolled PVC EOL Controlled HDPENatural resource oil onto feedstock energy 0,04 0,04 0,10 kg
Natural resource oil for other processes 0,03 0,06 0,04 kg
PVC EOL Uncontr
PVC EOL Contr.
HDPE2,179245
Calendering Output Emission Carbon dioxide 2,2E-06 2,2E-06 2,2E-06 kg Air 2,21E‐06EOL Other waste Output Emission CO2 0,0E+00 0,0E+00 0,0E+00 kg Air 0,00E+00EOL HDPE Output Emission CO2 0,0E+00 2,9E-01 3,9E-01 kg Air 3,90E‐01EOL PVC Uncontrolled Output Emission CO2 1,7E-01 0,0E+00 0,0E+00 kg Air 0,00E+00HDPE Output Emission CO2 5,6E-03 5,6E-03 1,6E-01 kg Air 1,60E‐01s-PVC Output Emission CO2 1,0E-01 1,0E-01 0,0E+00 kg Air 0,00E+00CaZn Output Emission CO2 3,0E-03 3,0E-03 0,0E+00 kg Air 0,00E+00Electricity OECD Output Emission CO2 1,6E+00 1,6E+00 1,5E+00 kg Air 1,51E+00DEHP Output Emission CO2 5,7E-02 5,7E-02 0,0E+00 kg Air 0,00E+00
TOTAL Output Emission Carbon dioxide 1,9E+00 2,0E+00 2,1E+00 kg Air 2,06E+00HDPE Output Emission CH4 5,0E-05 5,0E-05 1,5E-03 kg Air 3,05E‐02s-PVC Output Emission CH4 2,3E-04 2,3E-04 0,0E+00 kg Air 0,00E+00DEHP Output Emission Methane 1,4E-04 1,4E-04 0,0E+00 kg Air 0,00E+00EOL Other waste Output Emission Methane 0,0E+00 0,0E+00 0,0E+00 kg Air 0,00E+00Electricity OECD Output Emission Methane 4,1E-03 4,1E-03 3,9E-03 kg Air 8,28E‐02
TOTAL Output Emission Methane 4,5E-03 4,5E-03 5,4E-03 kg Air 1,13E‐01DEHP Output Emission N20 6,2E-08 6,2E-08 0,0E+00 kg Air 0,00E+00HDPE Output Emission N2O 2,8E-15 2,8E-15 8,1E-14 kg Air 2,51E‐11s-PVC Output Emission N2O 2,9E-06 2,9E-06 0,0E+00 kg Air 0,00E+00Electricity OECD Output Emission N2O 1,2E-05 1,2E-05 1,2E-05 kg Air 3,61E‐03
TOTAL Output Emission Nitrous Oxide 1,5E-05 1,5E-05 1,2E-05 kg Air 3,61E‐03Electricity OECD Output Emission HCFC-21 9,4E-09 9,4E-09 9,1E-09 kg Air 1,36E‐05Electricity OECD Output Emission HCFC-22 1,5E-09 1,5E-09 1,4E-09 kg Air 2,17E‐06Electricity OECD Output Emission HFC-134a -3,6E-21 -3,6E-21 -3,5E-21 kg Air ‐5,25E‐18
TOTAL Output Emission HCFCs and HFC 1,1E-08 1,1E-08 1,1E-08 kg Air 1,58E‐05
eco2win 3
Table D7. Human health impact assessment calculations, based on impact assessment data
presented in Annex C.P
roce
ssE
missio
nP
VC
Un
con
tr.P
VC
Co
ntr.
HD
PE
Un
itM
ed
ia
Eco
-ind
.E
DIP
US
Eto
xE
co-in
d.
ED
IPU
SE
tox
Eco
-ind
.E
DIP
US
Eto
x1,39E
-077,05E
+00
1,57E-11
HD
PE
dichloroethane (DC
E) C
2H4C
l29,0E
-149,0E
-142,6E
-12kg
Air
9,0E‐112,9E‐20
9,0E-11
2,9E-20
3E-09
8,5E-19
s-PV
Cdichloroethane (D
CE
) C2H
4Cl2
1,1E-05
1,1E-05
0,0E+
00kg
Air
1,1E‐023,4E‐12
1,1E-02
3,4E-12
00
Electricity O
EC
D1,2-D
ichloroethane 1,0E
-091,0E
-099,9E
-10kg
Air
1,0E‐063,3E‐16
1,0E-06
3,3E-16
1E-06
3,2E-16
TO
TA
LD
ichlo
roe
tha
ne
1,1E-05
1,1E-05
9,9E-10
kgA
ir1,1E‐02
3,4E‐121,1E
-023,4E
-121E
-063,2E
-16
EO
L Other w
asteD
ioxin0,0E
+00
0,0E+
000,0E
+00
kgA
ir0,0E+00
0,0E+000,0E
+00
0,0E+
000
0
HD
PE
dioxin/furan as Teq1,1E
-341,1E
-343,2E
-33kg
Air
1,3E‐306,7E‐23
1,3E-30
6,7E-23
3,76E-29
2E-21
s-PV
Cdioxin/furan as Teq
2,5E-15
2,5E-15
0,0E+
00kg
Air
2,9E‐111,5E‐03
2,9E-11
1,5E-03
00
Electricity O
EC
DD
ioxin (TCD
D)
7,4E-14
7,4E-14
7,2E-14
kg A
ir 8,6E‐10
4,4E‐028,6E
-104,4E
-028,32E
-100,043
EO
L PV
C U
ncontrolledTotal C
DD
1,5E-12
4,0E-14
0,0E+
00kg
Air
1,7E‐088,7E‐01
4,6E-10
2,4E-02
00
EO
L PV
C U
ncontrolledTotal C
DF
1,0E-11
1,5E-13
0,0E+
00kg
Air
1,2E‐076,1E+00
1,7E-09
8,8E-02
00
TO
TA
LD
iox
in1,2E
-112,7E
-137,2E
-14kg
Air
1,4E‐077,0E+00
3,1E-09
1,6E-01
8,32E-10
0,043
HD
PE
methylene chloride C
H2C
l21,0E
-161,0E
-163,0E
-15kg
Air
4,0E‐214,0E
-211,14E
-19
s-PV
Cm
ethylene chloride CH
2Cl2
3,6E-09
3,6E-09
0,0E+
00kg
Air
1,4E‐131,4E
-130
Electricity O
EC
DD
ichloromethane
1,1E-09
1,1E-09
1,1E-09
kg A
ir 4,2E‐14
4,2E-14
4,03E-14
TO
TA
LD
ichlo
rom
eth
an
e4,7E
-094,7E
-091,1E
-09kg
Air
1,8E‐131,8E
-134,03E
-14
DE
HP
Phthalate esters (unspecified)
2,2E-10
2,2E-10
0,0E+
00kg
Air
4,8E‐139,8E‐17
4,8E-13
9,8E-17
00
DE
HP
Phthalic anhydride
1,9E-07
1,9E-07
0,0E+
00kg
Air
4,1E‐108,3E‐14
4,1E-10
8,3E-14
00
TO
TA
LP
hth
ala
tes
1,9E-07
1,9E-07
0,0E+
00kg
Air
4,1E‐108,3E‐14
4,1E-10
8,3E-14
00
Calendering
Polyvinyl chloride
7,4E-09
7,4E-09
0,0E+
00kg
Air
TO
TA
LP
olyvin
yl chlo
ride
7,4E-09
7,4E-09
0,0E+
00kg
Air
DE
HP
VC
M5,9E
-165,9E
-160,0E
+00
kgA
ir8,0E‐21
1,7E‐218,0E
-211,7E
-210
0
HD
PE
vinyl chloride monom
er (VC
M)
1,8E-12
1,8E-12
5,1E-11
kgA
ir2,4E‐17
5,1E‐182,4E
-175,1E
-186,98E
-161,5E
-16
s-PV
Cvinyl chloride m
onomer (V
CM
)4,2E
-064,2E
-060,0E
+00
kgA
ir5,8E‐11
1,2E‐115,8E
-111,2E
-110
0
Electricity O
EC
DV
inyl chloride 1,7E
-101,7E
-101,6E
-10kg
Air
2,3E‐154,8E‐16
2,3E-15
4,8E-16
2,19E-15
4,6E-16
TO
TA
LV
inyl ch
lorid
e m
on
om
er
4,2E-06
4,2E-06
2,1E-10
kgA
ir5,8E‐11
1,2E‐115,8E
-111,2E
-112,89E
-156E
-16
Use
Adult transfusion exposure
3,3E-04
3,3E-04
0,0E+
00kg
Hum
an1,3E‐06
1,3E-06
0
TO
TA
LA
du
lt tran
sfusio
n e
xp
osu
re3,3E
-043,3E
-040,0E
+00
kgH
um
an
1,3E‐061,3E
-060
HD
PE
dichloroethane (DC
E)
1,8E-15
1,8E-15
5,2E-14
kgW
ater9,7E‐14
1,1E‐219,7E
-141,1E
-213E
-123E
-20
s-PV
Cdichloroethane (D
CE
)2,3E
-082,3E
-080,0E
+00
kgW
ater1,2E‐06
1,4E‐141,2E
-061,4E
-140
0
TO
TA
LD
ichlo
roe
tha
ne
2,3E-08
2,3E-08
5,2E-14
kgW
ate
r1,2E‐06
1,4E‐141,2E
-061,4E
-143E
-123E
-20
HD
PE
dioxin/furan as Teq0,0E
+00
0,0E+
000,0E
+00
kgW
ater0,0E+00
0,0E+000,0E
+00
0,0E+
000
0
s-PV
Cdioxin/furan as Teq
1,4E-14
1,4E-14
0,0E+
00kg
Water
1,8E‐095,0E‐02
1,8E-09
5,0E-02
00
TO
TA
LD
iox
in1,4E
-141,4E
-140,0E
+00
kgW
ate
r1,8E‐09
5,0E‐021,8E
-095,0E
-020
0
DE
HP
VC
M1,9E
-321,9E
-320,0E
+00
kgW
ater3,4E‐37
4,8E‐383,4E
-374,8E
-380
0
HD
PE
vinyl chloride monom
er (VC
M)
3,3E-14
3,3E-14
9,5E-13
kgW
ater6,0E‐19
8,4E‐206,0E
-198,4E
-201,74E
-172,4E
-18
s-PV
Cvinyl chloride m
onomer (V
CM
)6,3E
-086,3E
-080,0E
+00
kgW
ater1,2E‐12
1,6E‐131,2E
-121,6E
-130
0
TO
TA
LV
inyl ch
lorid
e m
on
om
er
6,3E-08
6,3E-08
9,5E-13
kgW
ate
r1,2E‐12
1,6E‐131,2E
-121,6E
-131,74E
-172,4E
-18
PV
C U
nco
ntr.
PV
C C
on
tr.H
DP
E
eco2win 4
Table D8. Natural resource depletion, quantified in terms of the category indicator fossil fuels, using
the impact assessment methods EPS, Eco‐indicator and EDIP