Page 1
Life cycle assessment of constructed wetland systems for wastewater 1
treatment coupled with microbial fuel cells 2
3
Clara Corbella1, Jaume Puigagut1, Marianna Garfí1* 4
5
6
1GEMMA - Group of Environmental Engineering and Microbiology, Department of 7
Civil and Environmental Engineering, Universitat Politècnica de Catalunya-8
BarcelonaTech, c/ Jordi Girona, 1-3, Building D1, E-08034, Barcelona, Spain 9
10
11
* Corresponding author: Marianna Garfí 12
Tel: +34 93 4016412 13
Fax: +34 93 4017357 14
Email: [email protected] 15
16
Corbella, C., Puigagut, J., Garfí M. (2017) Life cycle assessment of constructed 17
wetland systems for wastewater treatment coupled with microbial fuel cells. Science 18
of the Total Environment. In press. Doi: 10.1016/j.scitotenv.2016.12.186 19
20
21
22
Page 2
Abstract 23
The aim of this study was to assess the environmental impact of Microbial fuel cells 24
(MFCs) implemented in constructed wetlands (CWs). To this aim a Life Cycle 25
Assessment (LCA) was carried out comparing three scenarios: 1) a conventional CW 26
system (without MFC implementation); 2) a CW system coupled with a gravel-based 27
anode MFC, and 3) a CW system coupled with a graphite-based anode MFC. All 28
systems served a population equivalent of 1,500 p.e. They were designed to meet the 29
same effluent quality. Since MFCs implemented in CWs improve treatment efficiency, 30
the CWs coupled with MFCs had lower specific area requirement compared to the 31
conventional CW system. The functional unit was 1 m3 of wastewater. The LCA was 32
performed with the software SimaPro® 8, using the CML-IA baseline method. The three 33
scenarios considered showed similar environmental performance in all the categories 34
considered, with the exception of Abiotic Depletion Potential. In this impact category, 35
the potential environmental impact of the CW system coupled with a gravel-based 36
anode MFC was around 2 times higher than that generated by the conventional CW 37
system and the CW system coupled with a graphite-based anode MFC. It was attributed 38
to the large amount of less environmentally friendly materials (e.g. metals, graphite) for 39
MFCs implementation, especially in the case of gravel-based anode MFCs. Therefore, 40
the CW system coupled with graphite-based anode MFC appeared as the most 41
environmentally friendly solution which can replace conventional CWs reducing system 42
footprint by up to 20%. An economic assessment showed that this system was around 43
1.5 times more expensive than the conventional CW system. 44
45
Page 3
Keywords: Constructed wetland; Environmental impact assessment; Decentralised 46
wastewater treatment system; Life Cycle Assessment; Microbial fuel cells; Wastewater 47
treatment 48
49
50
51
Page 4
1. Introduction 52
Horizontal subsurface constructed wetlands (HSSF CWs) are natural wastewater 53
treatment systems in which pollutants are removed by means of physical, chemical and 54
biological processes (García et al., 2010). They constitute an alternative to conventional 55
systems for wastewater treatment (e.g. activated sludge systems) in small communities 56
due to their low energy requirement and easy operation and maintenance (Puigagut et 57
al., 2007). Nevertheless, HSSF CWs are characterized by higher specific area 58
requirement when compared to conventional technologies (2-5 vs. <1 m2 p.e.-1, 59
respectively). In order to overcome this drawback, several intensifying strategies (e.g. 60
forced aeration) has been lately investigated (Austin and Nivala, 2009; Wu et al., 2014). 61
However, these strategies often result in a significant increase in energy consumption 62
when compared to conventional HSSF CW designs. 63
Microbial Fuel Cells (MFCs) are bioelectrochemical devices that generate 64
electricity from organic matter by means of exoelectrogenic bacteria (Logan, 2008). 65
These bacteria oxidize organic compounds and transfer the resulting electrons to an 66
electrode (anode). From the anode, electrons flow through an external circuit 67
(containing a resistor) to the cathode, where they are used to reduce an electron acceptor 68
(e.g. oxygen) (Rabaey and Verstraete 2005). Therefore, MFCs performance depends on 69
the redox gradient between electrodes (anode and cathode). 70
The presence of organic matter in wastewater and the naturally generated redox 71
gradient between the upper layer (in aerobic conditions) and the deeper layers (in 72
anaerobic conditions) of HSSF CW treatment bed, are favourable conditions for the 73
implementation of MFCs in CW systems (Corbella et al., 2014; García et al., 2003). 74
During the last decade, several studies have demonstrated the synergy between MFCs 75
and HSSF CWs (Corbella et al., 2015; Corbella et al., 2016). Indeed, the 76
Page 5
implementation of MFCs in HSSF CWs may lead to important benefits. First of all, it 77
provides an energy surplus that can partially cover the energy input necessary for 78
wastewater treatment (Corbella et al., 2015). Moreover, MFCs can stimulate the 79
degradation of organic matter present in wastewater by fostering more efficient 80
degradation pathways carried out by exoelectrogenic bacteria (Katuri, et al., 2011; 81
Srivastava et al., 2015). As a consequence, the implementation of MFCs in HSSF CWs 82
can improve CWs treatment efficiency and reduce their surface requirement. However, 83
materials used for conventional MFCs electrodes (e.g. carbon fiber, stainless steel) are 84
expensive materials with poor environmental performance (Foley, et al., 2010; Gude, 85
2016; Liu and Cheng, 2014; Zhou et al., 2011). Therefore, although energy inputs and 86
surface area requirement could be reduced, both costs and environmental impacts could 87
significantly increase when implementing MFCs in CW treatment systems. 88
Even if several studies which analyse the environmental impacts of CW systems 89
have been carried out (Dixon et al., 2003; Fuchs, et al., 2011; Machado et al., 2007; 90
Yildirim et al., 2012), there is still no study assessing environmental impacts of CW 91
systems coupled with MFCs. 92
The objective of this study was to evaluate the environmental impacts caused by 93
HSSF CWs coupled with MFCs made of different materials. To this aim a Life Cycle 94
Assessment (LCA) was performed comparing three alternatives: i) a conventional CW 95
system (without MFCs implementation); ii) an HSSF CW system coupled with a gravel-96
based anode MFC; iii) an HSSF CW system coupled with a graphite-based anode MFC. 97
An economic evaluation of the considered scenarios was also conducted. 98
99
2. Materials and methods 100
2.1 Constructed wetland systems design 101
Page 6
The conventional CW system was a hypothetical wastewater treatment plant designed to 102
serve a population equivalent of 1,500 p.e. and treat 292.5 m3 of wastewater per day. It 103
comprised a primary treatment (i.e. septic tank) followed by HSSF CWs. The CW unit 104
consisted of 3 basins filled up with granitic gravel (D60=7.3; Cu=0.8; porosity=40%) 105
and planted with Phragmites australis (Pedescoll et al., 2013). 106
The CW unit was designed according to García and Corzo (2008). First of all, 107
the total surface area was determined using the following expression: 108
(Eq. 1) 109
Where 110
S= total CW surface, m2 111
Q= inlet flow rate, m3 d-1 112
kA= first order rate constant for BOD removal, m d-1 113
C0= BOD inlet concentration, mg L-1 114
C1= BOD outlet concentration, mg L-1 115
In this case, the first order rate constant for BOD removal (kA) was considered to be 116
0.08 m d-1 (García and Corzo, 2008). Then, the hydraulic sizing was conducted by 117
applying the Darcy’s law and considering a porosity of 35%, a hydraulic conductivity of 118
5,000 m3 m-2 d-1, a safety factor of 7, a slope of 0.01 m m-1, a wetland depth of 0.35 m 119
and a water depth of 0.3 m (García et al., 2005; García and Corzo, 2008). 120
The design of the CW systems coupled with gravel and graphite-based anode 121
MFCs was carried out taking into account that the implementation of MFCs in CWs 122
stimulates degradation processes leading to higher kA values compared to conventional 123
CWs (without MFCs) (Srivastava et al., 2015). In these cases, the kA was estimated 124
considering the results obtained in previous experiments conducted at the Universitat 125
Page 7
Politècnica de Catalunya-BarcelonaTech (UPC) (Barcelona, Spain). These experiments 126
showed a decrease in outlet BOD concentrations as a consequence of the 127
implementation of MFCs in lab-scale HSSF CWs, which indicates an increase of the 128
BOD removal rate constant in CW systems coupled with MFCs (Corbella and Puigagut, 129
submitted, Corbella and Puigagut, 2016). In accordance with the results of this study, 130
the kA was increased to 0.092 m d-1 and 0.098 m d-1 for the CW system coupled with 131
gravel-based anode MFC and the CW system coupled with graphite-based anode MFC, 132
respectively. It is important to note that since all CW systems here considered were 133
designed to provide the same effluent quality (25 mgBOD L-1), higher kA values resulted 134
in lower specific area requirements (Eq. 1). 135
MFCs cathode was designed to be a 12 cm depth layer of crushed graphite 136
placed at the upper part of the CW (in contact with the atmosphere) covering most of 137
the surface of the gravel bed. This design was taken from the recommendations given 138
elsewhere (Corbella et al., 2016) as to make sure that the cathode remains always in 139
contact with the water table and the atmosphere (Figure 1). Furthermore, the anodic 140
volume was determined according to the optimal cathode to anode ratio (4:1) as 141
recommended by Corbella et al. (2015). MFCs anode was placed at a distance of 2 m 142
from the inlet distribution zone (after the initial coarse gravel zone). The anode was 143
considered to be made of gravel or crushed graphite (Figure 1). Even though gravel is 144
not a conductive material, it has been reported that it provides a suitable surface for the 145
establishment of exoelectrogenic communities if an electron collector (e.g. stainless 146
steel mesh) is provided (Corbella et al., 2015). Therefore, in gravel-based anode a 147
stainless steel mesh (0.5 cm-mesh) was placed at every 5 cm depth along the whole 148
anode surface. CW systems characteristics and design parameters are summarised in 149
Table 1. 150
Page 8
151
Please Insert Table 1 152
Please Insert Figure 1 153
154
2.2 Life Cycle Assessment 155
LCA is a standardized methodology for the evaluation of the potential environmental 156
impacts generated by a product, process or service using a cradle to grave approach 157
(ISO, 2000; ISO, 2006). It identifies and quantifies the environmental burdens 158
associated with energy and materials used (inputs) and waste released into the 159
environment (outputs) during the whole life cycle. LCA is mainly used to compare 160
different competing products or technologies, as well as to identify improvement 161
alternatives for a single product or technology. The methodological framework for LCA 162
consists of the following phases: goal and scope definition; inventory analysis; impacts 163
assessment and interpretation of the results (ISO, 2006). The following sections 164
describe the specific contents of each phase. 165
166
2.2.1 Goal and scope definition 167
The goal of this study was to assess and compare the potential environmental impacts 168
generated by HSSF CWs for wastewater treatment coupled with MFCs made of 169
different materials. To this aim, the following scenarios were considered: 170
1) Conventional CW system (without MFC) (S1); 171
2) CW system coupled with a gravel-based anode MFC (S2); 172
3) CW system coupled with a graphite-based anode MFC (S3). 173
The functional unit was 1 m3 of treated water. 174
Page 9
The system boundaries included unit processes related to systems construction 175
and operation over a period of 20 years. Input flows associated with construction 176
materials and energy resources (electricity) were comprehensively studied for all 177
alternatives. Outputs consisted of direct greenhouse gas (GHG) emissions. The end-of-178
life of infrastructures and equipment were excluded from the scope of LCA, since it was 179
considered to not significantly influence the overall impact (Lopsik, 2013; Machado et 180
al., 2007). Sludge disposal was not accounted for, since its contribution only represents 181
a minor fraction of the overall impact (Garfí et al., submitted). Transportation of 182
construction materials was not considered. Their contribution to the overall impact can 183
be neglected, since locally produced materials are supposed to be used (Fuchs et al., 184
2011). The effluent discharge was not included within the system boundaries, since the 185
CW systems were designed in order to produce a same quality final effluent. 186
The system expansion method has been used to quantify the impacts generated 187
by by-products, as suggested by ISO standard (ISO, 2006). It consists of considering the 188
environmental benefits of recovered resources (by-products) by expanding the system 189
boundaries to include the avoided impacts of conventional production. In this study, the 190
avoided burdens of using electricity produced by MFCs instead of electricity supplied 191
through the grid were considered. 192
193
2.2.2 Inventory analysis 194
The results of the inventory analysis for the three investigated CW systems are 195
summarized in Table 2. Inventory data regarding construction processes, construction 196
materials and electricity consumption were gathered from the construction projects 197
performed in the frame of this study. CH4 emissions from the conventional CW system 198
were estimated considering the emissions rate found in previous studies carried out in a 199
Page 10
pilot plant of HSSF CWs implemented at the Universitat Politècnica de Catalunya-200
BarcelonaTech (UPC) (Barcelona, Spain) (Corbella and Puigagut, 2015a). In order to 201
estimate CH4 emissions from the CW systems coupled with MFCs, the MFC efficiency 202
in reducing CH4 fluxes found by Rizzo et al. (2013) was considered. Regarding the N2O 203
emissions, the emission rate proposed by Mander et al. (2008) was taken into account 204
for all scenarios. CO2 emissions were not included in the inventory, since CO2 from 205
biogenic sources does not contribute to global warming potential (Doorn et al., 2006). 206
Electricity produced by MFCs were determined considering the results obtained from 207
lab-scale experiments carried out at the Universitat Politècnica de Catalunya-208
BarcelonaTech (UPC) (Barcelona, Spain) (Corbella and Puigagut, submitted, Corbella 209
and Puigagut, 2016). All materials and energy inputs, as well as direct GHG emissions, 210
were determined based on the functional unit. Background data were obtained from the 211
Ecoinvent 3.1 database (Moreno-Ruiz et al., 2014; Weidema et al., 2013). The Spanish 212
electricity mix (i.e: natural gas 39%; nuclear 19%; coal 15.50%; wind 10.90%; hydro 213
8.80%; liquid fuels 5.80% and solid biomass 1%) was used for the electricity 214
requirement. 215
216
Please Insert Table 2 217
218
2.2.3 Impact assessment 219
The LCA was performed using the software SimaPro® 8 (Pre-sustainability, 2014). 220
Potential environmental impacts were assessed by the CML-IA baseline method 221
following the ISO standard procedure (ISO, 2000). The analysis focused on the 222
following impact categories: Abiotic Depletion, Abiotic Depletion (fossil fuels), Global 223
Warming Potential, Ozone Layer Depletion, Acidification, Eutrophication and 224
Page 11
Photochemical Oxidation. In this study only classification and characterisation phases 225
were performed. 226
227
2.2.4 Sensitivity Analysis 228
A sensitivity analysis evaluates the influence of the most important assumptions have 229
on the results. It consists of defining some scenarios, alternative to that assumed as a 230
base case, and comparing the potential environmental impacts with those of the base 231
case scenarios. To this end, selected parameters are changed into reasonable ranges of 232
variation to check if the outcomes of the LCA can be heavily dependent on some of the 233
assumptions. In this study, two parameters were evaluated (Table 3): i) the kA in 234
scenarios S2 and S3 (CW systems with gravel and graphite-based anode MFCs, 235
respectively); and, ii) the electricity produced by MFCs in scenarios S2 and S3 (CW 236
systems with gravel and graphite-based anode MFCs, respectively). 237
Regarding the kA, two alternatives were considered: 0.138 and 0.162 m d-1, 238
which correspond to an increase of 50 and 75% with respect to the kA taken into account 239
in scenario 2 (0.092 m d-1). These values have been chosen considering that MFCs in 240
CWs can produce an improvement in treatment efficiencies higher than those used in 241
the base case scenarios (Aguirre-Sierra et al., 2016). In order to carry out the sensitivity 242
analysis, the CW systems in scenarios S2 and S3 were redesigned taking into account 243
the above-mentioned kA values. Since these kA values were higher than those of the base 244
case scenarios, the CW systems considered for the sensitivity analysis had higher 245
treatment efficiency and lower specific area requirement compared to that of the base 246
case scenarios (Table 3). 247
Concerning the electricity produced by MFCs, two alternatives were analysed: 248
40 Wh m-3 and 70 Wh m-3. These values were chosen as they represent a middle and 249
Page 12
high energy production scenario for conventional MFC systems treating wastewater, 250
respectively (Ge, et al., 2014; Logan and Rabaey, 2013). 251
252
Please Insert Table 3 253
254
2.3 Economic assessment 255
The economic analysis was conducted comparing the capital cost of the three CW 256
systems (scenarios S1, S2 and S3). In addition, the scenarios with lower specific area 257
requirement (scenarios S2A, S2B, S3A and S3B, Table 3) considered in the sensitivity 258
analysis were also taken into account. In all scenarios, prices were provided by local 259
companies. The capital cost included the cost for earthmoving, construction materials 260
purchase and electrical works. For all scenarios, a lifespan of 20 years was considered. 261
CWs implemented with MFCs would probably require more material replacement than 262
conventional CWs configurations. However, MFC implemented in CWs would reduce 263
biomass growth within the filter media (Park and Zeikus, 200), reducing clogging and 264
its derived operation and maintenance costs. Overall, operation and maintenance costs 265
were assumed to be the same in all scenarios and, thus, they were not included in the 266
analysis. 267
268
3. Results and discussion 269
3.1 Life Cycle Assessment 270
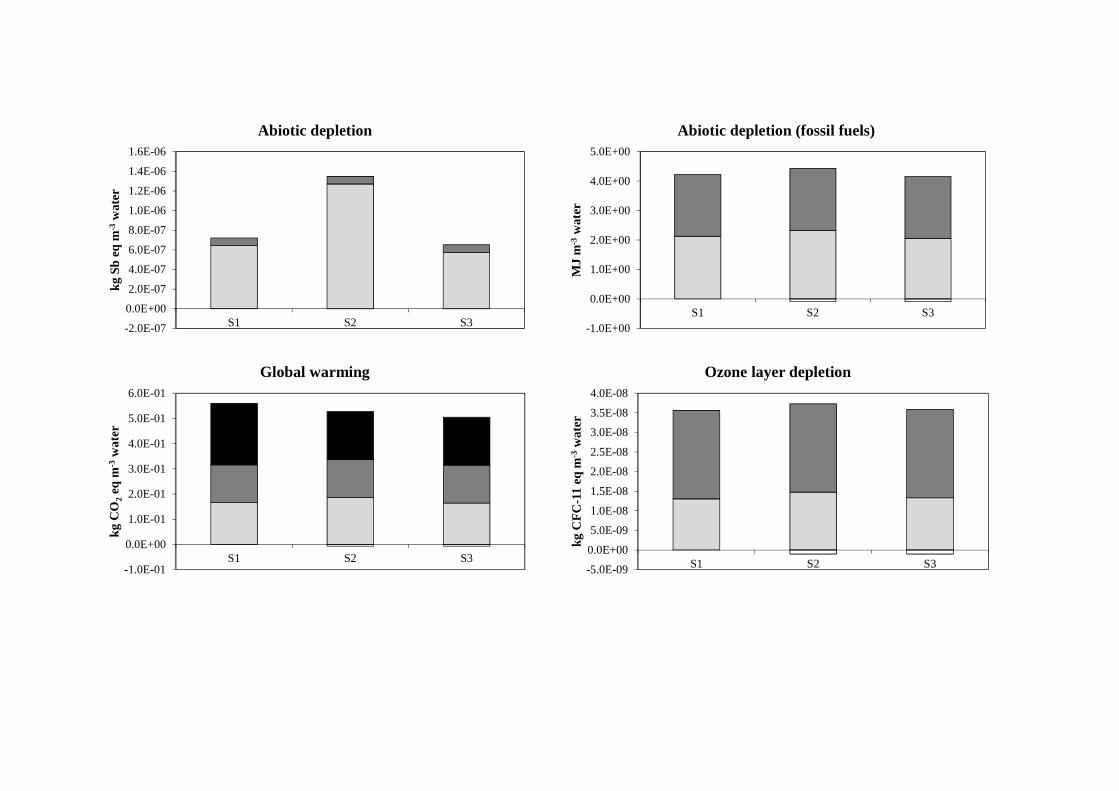
The potential environmental impacts associated with each scenario are shown in Figure 271
2. 272
All the alternatives showed a similar environmental performance in all the 273
categories analysed, with the exception of Abiotic Depletion Potential. In this impact 274
Page 13
category, the potential environmental impact of scenario S2 (CW system coupled with a 275
gravel-based anode MFC) was around 2 times higher than that generated by scenarios 276
S1 and S3 (conventional CW system and CW system coupled with a graphite-based 277
anode MFC, respectively) (Figure 2). It was due to the fact that, despite the CW systems 278
coupled with MFCs showed lower specific area requirement compared to the 279
conventional CW system, they require a large amount of less environmentally friendly 280
materials (i.e. metals and graphite) for MFCs implementation (Table 2). In particular, 281
the high impact caused by the CW system coupled with a gravel-based anode MFC 282
(scenario S2) in the Abiotic Depletion category was mainly attributed to the large 283
amount of stainless steel required for the electron collector at the anode (stainless steel 284
mesh) (Table 2). It was in accordance with previous studies which observed that the 285
potential environmental impact of a CW system would increase by around 30% of the 286
overall impact if gravel and sand were replaced with less environmentally friendly 287
materials (i.e. lightweight expanded clay aggregate) (Lopsik, 2013). 288
Since CW systems are extensive, low-tech and low energy technologies, their 289
life cycle is mainly influenced by construction. For all scenarios, the contribution of the 290
construction and operation stages in Abiotic Depletion impact category accounted for 291
88-95% and 5-12% of the total impact, respectively. It was in accordance with previous 292
studies which assessed the environmental impacts of conventional CW systems (Dixon 293
et al., 2003; Fuchs et al., 2011; Machado et al., 2007). With regards to Abiotic 294
Depletion (fossil fuels), Acidification and Eutrophication Potentials, construction and 295
operation accounted for around 50% of the overall impact in all scenarios. In these 296
categories, the appreciable contribution of operation to the overall impact was mainly 297
due to the use of fossil fuels for electricity production and to gases emissions (i.e. NOx 298
and SO2) generated by power plants (Turconi et al., 2013). As far as Global Warming 299
Page 14
and Photochemical Oxidation Potentials are concerned, direct GHG emissions, 300
construction and operation phases contributed equally to the overall impact in scenarios 301
S2 and S3 (CW system coupled with gravel and graphite-based anode MFCs, 302
respectively). On the contrary, in scenario 1 (conventional CW system) the contribution 303
of direct GHG emissions was around 45% of the total environmental impact for the 304
above-mentioned impact categories. It was attributed to MFCs capability of reducing 305
methane released to the atmosphere during wastewater treatment under anaerobic 306
conditions. In fact, in these systems bacteria involved in bioelectrochemical processes 307
use organic matter (e.g. acetate) as a substrate, reducing the availability of the carbon 308
source for methanogenic bacteria (Rizzo, et al., 2013). For all scenarios, the 309
contribution of operation phase to the overall impact only predominated in Ozone Layer 310
Depletion impact category (around 60% of the total impact). Moreover, electricity 311
produced by MFCs had a negligible impact in all considered impact categories. In all 312
scenarios, using electricity produced by MFCs instead of electricity supplied by the grid 313
would reduce potential environmental impact by around 3% in all impact categories. 314
Finally, CW system coupled with graphite-based anode MFC appeared as the 315
best alternative to reduce CW surface requirements (by around 20%, Table 3) from an 316
environmental perspective. 317
318
Please insert Figure 2 319
320
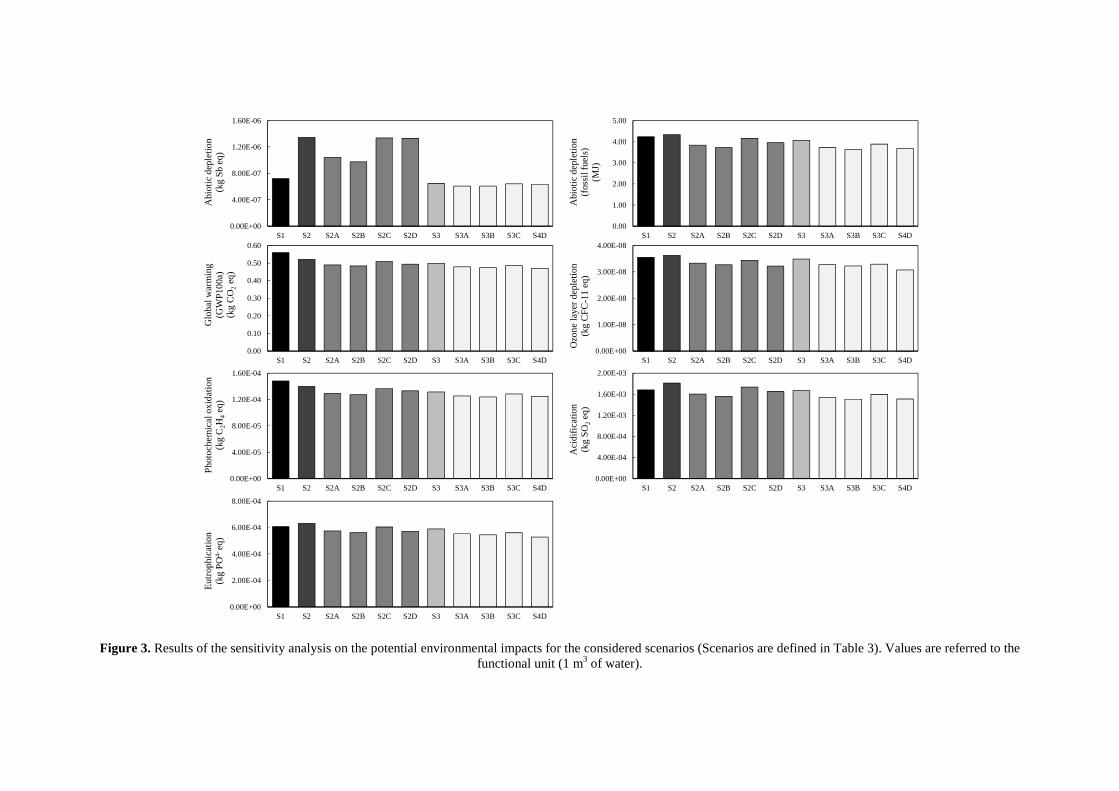
3.2 Sensitivity analysis 321
The results of the sensitivity analysis are shown in Figure 3. As mentioned above, it 322
took into account two parameters: i) the kA in scenarios S2 and S3 (CW systems with 323
gravel and graphite-based anode MFCs, respectively); and ii) the electricity produced by 324
Page 15
the MFCs in scenarios S2 and S3 (CW systems with gravel and graphite-based anode 325
MFCs, respectively). 326
Regarding the kA, the results showed how increasing this parameter (to 0.138 327
and 0.162 m d-1) would slightly reduce the environmental impact (by up to 10%, as 328
compared to the base cases – 0.092 and 0.098 m d-1) in all impact categories with the 329
exception of Abiotic Depletion Potential. For this impact category, the reduction in 330
scenario S2 accounted for around 25% as compared to the base cases (0.092 m d-1). 331
Nevertheless, scenario S2 remained the most abiotic depleting alternative. 332
Concerning the electricity produced by MFCs, the sensitivity analysis showed 333
that increasing the electricity produced (to 40 Wh m-3 and 70 Wh m-3) would reduce all 334
environmental indicators by 1-10% as compared to the base cases (14.4 Wh m-3). 335
Consequently, it can be concluded that the results of the LCA are robust and not 336
strongly dependent on the assumptions considered in this study. 337
338
Please insert Figure 3 339
340
3.3 Economic assessment 341
The results of the economic assessment are summarised in Table 4. The capital cost of 342
conventional CW system (scenario S1) was around 430 € p.e.-1, which is in agreement 343
with previous studies (Masi and Bresciani, 2013; Puigagut et al., 2007). The CW system 344
coupled with a gravel-based anode MFC (scenario S2) appeared as the most expensive 345
alternative, followed by the CW system coupled with a graphite-based anode MFC 346
(scenario S3). In particular, CW systems coupled with MFCs (scenario S2 and S3) 347
showed to be from 1.4 to 1.6 times more expensive than the conventional CW system. It 348
was mainly due to the high cost of materials (i.e. graphite and steel) used for microbial 349
Page 16
fuel cells implementation. In the case of scenarios with lower specific area requirement 350
considered in the sensitivity analysis (scenarios S2A, S2B, S3A and S3B, Table 3), the 351
capital costs were similar to that of the conventional CW system (scenario S1). Thus, 352
CW systems coupled with high performance MFCs would be competitive with 353
conventional CWs in terms of costs. 354
355
Please insert Table 4 356
357
4. Conclusions 358
• The CW systems coupled with MFCs are an appropriate solution for wastewater 359
treatment in small communities which may help to reduce surface requirements, 360
while keeping the environmental impacts low. 361
• The CW system coupled with a graphite-based anode MFC appeared as the most 362
environmentally friendly solution which could replace conventional CWs 363
reducing system footprint by up to 20%. 364
• The CW system coupled with a graphite-based anode MFC showed to be around 365
1.5 times more expensive than the conventional CW system. The cost of MFC-366
based CW would be competitive with conventional CW only under higher 367
treatment performances of MFC than those currently attained. 368
• For the purpose of reducing costs, cheaper materials should be investigated for 369
MFCs implementation in CW systems. 370
• Regarding the future research needs, an environmental and economic analysis of 371
a full-scale CWs system coupled with MFCs should be carried out using data 372
obtained during a long-term monitoring (e.g. MFCs lifespan, electricity 373
generated by MFCs, wastewater treatment efficiency, GHG emissions, costs). 374
Page 17
Moreover, a comparison with other intensified CW systems (e.g. aerated CWs 375
and MFCs implemented in saturated vertical flow CWs) should be also 376
addressed. 377
378
Acknowledgements 379
Clara Corbella kindly acknowledges her PhD scholarship (2014 FI_AGAUR, 380
Generalitat de Catalunya). Marianna Garfí is grateful to Ministry of Economy and 381
Competitiveness (Spain) (Plan Nacional de I+D+i 2008-2011, Subprograma Juan de la 382
Cierva (JDC) 2012). Authors are also grateful to Neus Montero for her contribution to 383
this study. 384
385
Page 18
References 386
Aguirre-Sierra, A., Bacchetti-De Gregoris, T., Berná, A., Salas, J.J., Aragón, C., Esteve-387
Núñez, A. 2016. Microbial electrochemical systems outperform fixed-bed 388
biofilters in cleaning up urban wastewater. Environ. Sci.: Water Res. Technol. 2, 389
984–993 390
Austin D., Nivala J. 2009. Energy requirements for nitrification and biological nitrogen 391
removal in engineered wetlands. Ecol. Eng. 35, 184-192 392
Corbella, C., Garfí, M., Puigagut, J. 2014. Vertical redox profiles in treatment wetlands 393
as function of hydraulic regime and macrophytes presence: Surveying the optimal 394
scenario for microbial fuel cell implementation. Sci. Total Environ. 470–471, 754–395
8. 396
Corbella, C., Guivernau, M., Viñas, M., Puigagut, J. 2015. Operational, design and 397
microbial aspects related to power production with microbial fuel cells 398
implemented in constructed wetlands. Water Res. 84, 232–242. 399
Corbella, C., Puigagut, J. 2015a. Effect of primary treatment and organic loading on 400
methane emissions from horizontal subsurface flow constructed wetlands treating 401
urban wastewater. Ecol. Eng. 80, 79–84 402
Corbella, C., Puigagut, J. 2015b. Microbial fuel cells implemented in constructed 403
wetlands: Fundamentals, current research and future perspectives. Contrib. Sci. 404
11, 127–134. 405
Corbella, C., Garfí, M., Puigagut, J. 2016. Long-term assessment of best cathode 406
position to maximise microbial fuel cell performance in horizontal subsurface 407
flow constructed wetlands. Sci. Total Environ. 563–564, 448–455. 408
Corbella, C. and Puigagut, J. 2016. Constructed Wetland-Microbial Fuel Cell enhances 409
domestic wastewater treatment efficiency. The 3rd European Meeting of the 410
Page 19
International Society for Microbial Electrochemistry and Technology (EU-ISMET 411
2016), Rome (Italy), 10. 412
Corbella, C., Puigagut, J. Improving domestic wastewater treatment efficiency with 413
membrane-less microbial fuel cells: influence of anode material, external 414
resistance and contact time. Water Res. Submitted. 415
Dixon, A., Simon, M., Burkitt, T. 2003. Assessing the environmental impact of two 416
options for small-scale wastewater treatment: comparing a reedbed and an aerated 417
biological filter using a life cycle approach. Ecol. Eng. 20 (4), 297–308. 418
Doorn, M.R.J., Towprayoon, S., Manso-Vieira, S.M., Irving, W., Palmer, C., Pipatti, R., 419
Wang, C. 2006. IPCC Guidelines for National Greenhouse Gas Inventories 420
Volume 5: Waste. 421
Foley, J. M., Rozendal, R., Hertle, C. K., Lant, P., Rabaey, K. 2010. Life cycle 422
assessment of high-rate anaerobic treatment, microbial fuel cells, and microbial 423
electrolysis cells. Environ. Sci. Technol. 44(9), 3629–3637. 424
Fuchs, V.J., Mihelcic, J.R., Gierke, J.S. 2011. Life cycle assessment of vertical and 425
horizontal flow constructed wetlands for wastewater treatment considering 426
nitrogen and carbon greenhouse gas emissions. Water Res. 45, 2073–2081 427
García, J., Aguirre, P., Barragán, J., Mujeriego, R., Matamoros, V., Bayona, J.M. 2005. 428
Effect of key design parameters on the efficiency of horizontal subsurface flow 429
constructed wetlands. Ecol. Eng. 25 (4), 405–418 430
García, J., Corzo, A. 2008. Depuración con Humedales Construidos. Universidad 431
Politecnica de Cataluña, 1–96. Available from 432
http://upcommons.upc.edu/bitstream/handle/2117/2474/JGarcia_and_ACorzo.pdf?433
sequence=1&isAllowed=y 434
García, J., Ojeda, E., Sales, E., Chico, F., Pı́riz, T., Aguirre, P., Mujeriego, R. 2003. 435
Page 20
Spatial variations of temperature, redox potential, and contaminants in horizontal 436
flow reed beds. Ecol. Eng. 21(2–3), 129–142. 437
García, J., Rousseau, D. P. L., Morató, J., Lesage, E., Matamoros, V., Bayona, J. M. 438
2010. Contaminant Removal Processes in Subsurface-Flow Constructed Wetlands: 439
A Review. Critical Reviews Environ. Sci.Technol. 40(7), 561–661. 440
Garfí, M., Ferrer, I., Life cycle assessment of wastewater treatment systems for small 441
communities: activated sludge, constructed wetlands and high rate algal ponds. 442
Water Res. Submitted 443
Ge, Z., Li, J., Xiao, L., Tong, Y., He, Z. 2014. Recovery of Electrical Energy in 444
Microbial Fuel Cells. Environ. Sci. Technol. Letters, 1(2), 137–141. 445
Gude, V. G. 2016. Wastewater Treatment in Microbial Fuel Cells – An Overview. J. 446
Clean. Prod. 122, 287–307. 447
ISO (International Organization for Standardization). 2000. Environmental management 448
– life cycle assessment – life cycle impact assessment, International Standard ISO 449
14042, Geneva, Switzerland. 450
ISO (International Organization for Standardization). 2006. Environmental 451
management - life cycle assessment - principles and framework, International 452
Standard ISO 14040, Geneva, Switzerland. 453
Katuri, K. P., Scott, K., Head, I. M., Picioreanu, C., Curtis, T. P. 2011. Microbial fuel 454
cells meet with external resistance. Bioresour. Technol. 102(3), 2758–66. 455
Liu, W.F., Cheng, S.A. 2014. Microbial fuel cells for energy production from 456
wastewaters: the way toward practical application. J Zhejiang Univ-Sci A. 15(11), 457
841–861. 458
Logan, B. E. 2008. Microbial Fuel Cells. The effects of brief mindfulness intervention 459
on acute pain experience: An examination of individual difference (John Wiley, 460
Page 21
Vol. 1). Hoboken, New Jersey. 461
Logan, B. E., Rabaey, K. 2013. Conversion of wastes into bioelectricity and chemicals 462
by using microbial electrochemical technologies (vol 337, pg 686, 2012). Science, 463
339(6122), 906. 464
Lopsik, K. 2013. Life cycle assessment of small-scale constructed wetland and 465
extended aeration activated sludge wastewater treatment system. Int. J. Environ. 466
Sci. Technol. 10; 1295–1308 467
Machado, A.P., Urbano, L., Brito, A.G., Janknecht, P., Salas, J.J., Nogueira, R. 2007. 468
Life cycle assessment of wastewater treatment options for small and 469
decentralized communities. Water Sci. Technol. 56(3), 15–22 470
Mander, Ü,Lõhmus, K., Teiter, S., Mauring, T., Nurk, K., Augustin, J. 2008. Gaseous 471
fluxes in the nitrogen and carbon budgets of subsurface flow constructed 472
wetlands. Sci. Total Environ. 404(2–3), 343–353 473
Masi, F., Bresciani, R. 2013. Horizontal Flow (HF) Constructed Wetland (CWs). In: 474
Barreto Dillon, L., Doyle, L. and Langergraber, G. (Editors). 2013. 475
Compendium of Natural Water Systems and Treatment Technologies to cope 476
with Water Shortages in Urbanised Areas in India. Berlin: epubli GmbH. 477
Ministerio de Agricultura, Alimentación y Medio Ambiente (MAGRAMA). 2007. 478
Manual para la gestión de vertidos. Available at: 479
http://www.magrama.gob.es/es/agua/publicaciones/# 480
Moreno -Ruiz E., Lévová T., Bourgault G., Wernet G. 2014. Documentation of 481
changes implemented in ecoinvent Data 3.1. Zurich: ecoinvent 482
Park, D.H., and Zeikus, G. 2000. Electricity generation in microbial fuel cells using 483
neutral red as an electronophore. App. Environm. Microbiol., 66(4), 1292–1297 484
Page 22
Pedescoll, A., Sidrach-Cardona, R., Sánchez, J.C., Carretero, J., Garfí, M., Bécares, E. 485
2013. Design configurations affecting flow pattern and solids accumulation in 486
horizontal free water and subsurface flow constructed wetlands. Water Res. 47, 487
(3), 1448-1458 488
Pre-sustainability (2014). https://www.pre-sustainability.com/simapro 489
Puigagut J., Villaseñor J., Salas J.J., Bécares E., García J. 2007. Subsurface-flow 490
constructed wetlands in Spain for the sanitation of small communities: a 491
comparative study. Ecol. Eng. 30,312–9 492
Rabaey, K., Verstraete, W. 2005. Microbial fuel cells: novel biotechnology for energy 493
generation. Trends in Biotechnol. 23(6), 291–8. 494
Rizzo, A., Boano, F., Revelli, R., Ridolfi, L. 2013. Can microbial fuel cells be an 495
effective mitigation strategy for methane emissions from paddy fields? Ecol. 496
Eng. 60, 167– 171 497
Srivastava, P., Yadav, A.K., Mishra, B.K. 2015. The effects of microbial fuel cell 498
integration into constructed wetland on the performance of constructed wetland. 499
Bioresour. Technol. 195, 223–230. 500
Turconi, R., Boldrin, A., Astrup, T. 2013. Life cycle assessment (LCA) of electricity 501
generation technologies: Overview, comparability and limitations. Renew. Sust. 502
En. Rev. 28 555–565 503
Weidema B.P., Bauer C., Hischier R., Mutel C., Nemecek T., Reinhard J., Vadenbo C. 504
O., Wernet G. 2013. Overview and methodology. Data quality guideline for the 505
ecoinvent database version 3. Ecoinvent Report 1 (v3). St. Gallen: The 506
ecoinvent Centre 507
Page 23
Wu S., Kuschk P., Brix H., Vymazal J., Dong R. 2014. Development of constructed 508
wetlands in performance intensifications for wastewater treatment: a nitrogen 509
and organic matter targeted review. Water Res. 57,40-55 510
Yildirim, M., Topkaya, B. 2012. Assessing Environmental Impacts of Wastewater 511
Treatment Alternatives for Small-Scale Communities. Clean – Soil, Air, Water, 512
40 (2), 171–178 513
Zhou, M., Chi, M., Luo, J., He, H., Jin, T. 2011. An overview of electrode materials in 514
microbial fuel cells. J. Power Sources, 196(10), 4427–4435. 515
516
517
518
519
Page 24
Table 1. CW systems characteristics and design parameters 520 521 Scenarios (a)
Unit S1 S2 S3
System characteristics
Inlet BOD concentration (b) mgBOD L-1 168 168 168
Outlet BOD concentration (c) mgBOD L-1 25 25 25
Flow rate m3 d-1 292.5 292.5 292.5
Population equivalent p.e. 1,500 1,500 1,500
BOD removal efficiency % 85 85 85
Design parameters
Hydraulic conductivity m3 m-2 d-1 5,000 5,000 5,000
First order rate constant for BOD removal (kA) m d-1 0.08 0.092 0.098
Organic Loading Rate (OLR) gBOD m-2 d-1 6.00 6.90 7.40
Hydraulic Loading Rate (HLR) m d-1 0.036 0.041 0.044
Constructed wetlands
Number of constructed wetland cells - 3 3 3
Constructed wetland cell dimensions m (D×L×W) 0.3 × 60 ×
45.5 0.3 × 52.5
× 45.5 0.3 × 49 ×
45.5 Total surface area m2 8,190 7,166 6,688.5
Specific area requirement m2 p.e.-1 5.46 4.78 4.46
Microbial Fuel Cells
Anode Material - - gravel graphite
Volume m3 - 64.23 59.59
Cathode Material - - graphite graphite
Volume m3 - 264.81 245.7 (a) S1: conventional CW system (without MFC); S2: CW system coupled with a gravel-based anode MFC; S3: CW system coupled with a graphite-based anode MFC
(b) Influent concentration at the treatment plant was 240 mg BOD L-1. Primary treatment was supposed to remove 30% of the BOD concentration. (c) Discharge legislation limit (MAGRAMA, 2007). 522
523
Page 25
Table 2. Wastewater treatment inventory for scenarios S1, S2 and S3. Values are referred to the 524 functional unit (1 m3 of water). 525
Scenarios (a)
Units S1 S2 S3
Inputs
Construction materials
Inlet pumping station
Concrete m3 m-3 5.77E-06 5.77E-06 5.77E-06
Metals kg m-3 8.51E-04 8.51E-04 8.51E-04
Coating kg m-3 1.19E-04 1.19E-04 1.19E-04
Plastics kg m-3 4.41E-06 4.41E-06 4.41E-06
Septic tank
Concrete m3m-3 3.37E-05 3.37E-05 3.37E-05
Metals kg m-3 3.32E-03 3.32E-03 3.32E-03
Coating kg m-3 6.23E-04 6.23E-04 6.23E-04
Plastics kg m-3 2.02E-05 2.02E-05 2.02E-05
Pumping stations
Concrete m3m-3 6.47E-06 6.47E-06 6.47E-06
Metals kg m-3 9.70E-04 9.70E-04 9.70E-04
Coating kg m-3 1.21E-04 1.21E-04 1.21E-04
Plastics kg m-3 1.32E-05 1.32E-05 1.32E-05
Constructed wetlands and Microbial fuel cells
Concrete m3m-3 1.75E-05 1.63E-05 1.57E-05
Metals kg m-3 8.42E-04 5.32E-03 7.71E-04
Coating kg m-3 1.19E-05 1.19E-05 1.19E-05
Plastics kg m-3 7.92E-03 7.01E-03 6.58E-03
Gravel and sand kg m-3 2.76E+00 1.83E+00 1.59E+00
Bricks kg m-3 3.86E-02 3.59E-02 3.46E-02
Graphite kg m-3 - 2.99E-01 3.44E-01
Storage tank
Concrete m3m-3 5.69E-05 5.69E-05 5.69E-05
Metals kg m-3 5.31E-03 5.31E-03 5.31E-03
Coating kg m-3 5.82E-04 5.82E-04 5.82E-04
Plastics kg m-3 2.39E-06 2.39E-06 2.39E-06
Pipelines
Plastics kg m-3 1.29E-04 1.29E-04 1.29E-04
Operation
Electricity kWh m-3 3.10E-01 3.10E-01 3.10E-01
Outputs
Emissions to air (direct GHG emissions)
CH4 g m-3 10.89 8.49 8.49
N2O g m-3 0.01 0.01 0.01
Avoided products
Electricity produced by MFCs kWh m-3 1.44E-02 1.44E-02 (a) S1: conventional CW system (without MFC); S2: CW system coupled with a gravel-based anode MFC; S3: CW system coupled with a graphite-based anode MFC
526
Page 26
Table 3. Scenarios and parameters considered in the sensitivity analysis. 527 528
Scenarios (a) Microbial fuel cells kA Electricity
produced by MFCs
Specific area requirement
Anode Cathode m d-1 Wh m-3 m2 p.e.-1
S1 - - 0.080 - 5.42
S2 (base case) Gravel Graphite 0.092 14.4 4.74
S2A Gravel Graphite 0.138 14.4 3.14
S2B Gravel Graphite 0.162 14.4 2.68
S2C Gravel Graphite 0.092 40 4.74
S2D Gravel Graphite 0.092 70 4.74
S3 (base case) Graphite Graphite 0.098 14.4 4.42
S3A Graphite Graphite 0.138 14.4 3.14
S3B Graphite Graphite 0.162 14.4 2.68
S3C Graphite Graphite 0.098 40 4.42
S3D Graphite Graphite 0.098 70 4.42 (a) S1: conventional CW system (without MFC); S2: CW system coupled with a gravel-based anode MFC; 529 S3: CW system coupled with a graphite-based anode MFC 530
Page 27
531 Table 4. Capital costs of the considered scenarios expressed in terms of euros per population 532
equivalent. 533 534
Scenarios (a) Microbial fuel cells Capital cost
Anode Cathode € p.e.-1
S1 - - 432
S2 (base case) Gravel Graphite 726
S2A Gravel Graphite 518
S2B Gravel Graphite 488
S3 (base case) Graphite Graphite 639
S3A Graphite Graphite 470
S3B Graphite Graphite 445 (a) Scenarios are defined in Table 3 535
536
Page 28
537
Coarse gravel Gravel Sand
Graphite cathode Graphite anode
Sand layer 0.05m
Cathode layer 0.12m
0.5 m
INLE
T
OU
TLE
T
INLE
T
OU
TLE
T
INLE
T
OU
TLE
T
2.00m 0.05m 2.00m
0.5m
0.12m
0.35m
2.00m 0.05m 2.00m
0.5m
0.35m
S1
S2
S3
Water levelGravel anode
Coarse gravel
2.00m
Coarse gravel
2.00m
0.35 m
538 539
Figure 1. Schematic cross section of CWs for the considered scenarios. S1: conventional CW 540 system (without MFC); S2: CW system coupled with a gravel-based anode MFC; S3: CW 541
system coupled with a graphite-based anode MFC 542 543
544
Page 29
-2.0E-07
0.0E+00
2.0E-07
4.0E-07
6.0E-07
8.0E-07
1.0E-06
1.2E-06
1.4E-06
1.6E-06
S1 S2 S3
kg S
b eq
m-3
wat
erAbiotic depletion
-1.0E+00
0.0E+00
1.0E+00
2.0E+00
3.0E+00
4.0E+00
5.0E+00
S1 S2 S3
MJ
m-3
wat
er
Abiotic depletion (fossil fuels)
-1.0E-01
0.0E+00
1.0E-01
2.0E-01
3.0E-01
4.0E-01
5.0E-01
6.0E-01
S1 S2 S3
kg C
O2
eq m
-3w
ater
Global warming
-5.0E-09
0.0E+00
5.0E-09
1.0E-08
1.5E-08
2.0E-08
2.5E-08
3.0E-08
3.5E-08
4.0E-08
S1 S2 S3kg
CF
C-1
1 eq
m-3
wat
er
Ozone layer depletion
Page 30
1.60E-06
Construction and materialsOperation Direct GHG emissions Avoided electricity
Figure 2. Potential environmental impacts for the three scenarios. Values are referred to the functional unit (1 m3 of water). S1: conventional CW system 545 (without MFC); S2: CW system coupled with a gravel-based anode MFC; S3: CW system coupled with a graphite-based anode MFC 546
-2.0E-05
0.0E+00
2.0E-05
4.0E-05
6.0E-05
8.0E-05
1.0E-04
1.2E-04
1.4E-04
1.6E-04
S1 S2 S3
kg C
2H4
eq m
-3w
ater
Photochemical oxidation
-4.0E-04
1.0E-04
6.0E-04
1.1E-03
1.6E-03
2.1E-03
S1 S2 S3
kg S
O2
eq m
-3w
ater
Acidification
-1.0E-04
0.0E+00
1.0E-04
2.0E-04
3.0E-04
4.0E-04
5.0E-04
6.0E-04
7.0E-04
S1 S2 S3
kg P
O43-
eq m
-3w
ater
Eutrophication
Page 31
0.00E+00
4.00E-07
8.00E-07
1.20E-06
1.60E-06
S1 S2 S2A S2B S2C S2D S3 S3A S3B S3C S4D
Abi
otic
dep
letio
n (k
g S
b eq
)0.00
1.00
2.00
3.00
4.00
5.00
S1 S2 S2A S2B S2C S2D S3 S3A S3B S3C S4D
Abi
otic
dep
letio
n (f
ossi
l fue
ls)
(MJ)
0.00
0.10
0.20
0.30
0.40
0.50
0.60
S1 S2 S2A S2B S2C S2D S3 S3A S3B S3C S4D
Glo
bal w
arm
ing
(GW
P10
0a)
(kg
CO
2eq
)
0.00E+00
1.00E-08
2.00E-08
3.00E-08
4.00E-08
S1 S2 S2A S2B S2C S2D S3 S3A S3B S3C S4D
Ozo
ne
laye
r de
plet
ion
(kg
CF
C-1
1 eq
)
0.00E+00
4.00E-05
8.00E-05
1.20E-04
1.60E-04
S1 S2 S2A S2B S2C S2D S3 S3A S3B S3C S4D
Pho
toch
emic
al o
xida
tion
(kg
C2H
4eq
)
0.00E+00
4.00E-04
8.00E-04
1.20E-03
1.60E-03
2.00E-03
S1 S2 S2A S2B S2C S2D S3 S3A S3B S3C S4D
Aci
dific
atio
n (k
g S
O 2eq
)
0.00E+00
2.00E-04
4.00E-04
6.00E-04
8.00E-04
S1 S2 S2A S2B S2C S2D S3 S3A S3B S3C S4D
Eut
roph
icat
ion
(kg
PO4
- eq
)
Figure 3. Results of the sensitivity analysis on the potential environmental impacts for the considered scenarios (Scenarios are defined in Table 3). Values are referred to the
functional unit (1 m3 of water).