59
ANL/ESD/07-10 Life-Cycle Assessment of Corn-Based Butanol as a Potential Transportation Fuel Energy Systems Division
ANLESD07-10
Life-Cycle Assessment of Corn-Based Butanol as a Potential Transportation Fuel
Energy Systems Division
About Argonne National Laboratory Argonne is a US Department of Energy laboratory managed by UChicago Argonne LLC under contract DE-AC02-06CH11357 The Laboratoryrsquos main facility is outside Chicago at 9700 South Cass Avenue Argonne Illinois 60439 For information about Argonne see wwwanlgov
Availability of This Report This report is available at no cost at httpwwwostigovbridge It is also available on paper to the US Department of Energy and its contractors for a processing fee from
US Department of Energy
OfficeofScientificandTechnicalInformation
PO Box 62
Oak Ridge TN 37831-0062
phone (865) 576-8401
fax (865) 576-5728
reportsadonisostigov
Disclaimer
This report was prepared as an account of work sponsored by an agency of the United States Government Neither the United States
GovernmentnoranyagencythereofnorUChicagoArgonneLLCnoranyoftheiremployeesorofficersmakesanywarrantyexpress
or implied or assumes any legal liability or responsibility for the accuracy completeness or usefulness of any information apparatus
productorprocessdisclosedorrepresentsthatitsusewouldnotinfringeprivatelyownedrightsReferencehereintoanyspecific
commercial product process or service by trade name trademark manufacturer or otherwise does not necessarily constitute or imply
its endorsement recommendation or favoring by the United States Government or any agency thereof The views and opinions of
documentauthorsexpressedhereindonotnecessarilystateorreflectthoseoftheUnitedStatesGovernmentoranyagencythereof
Argonne National Laboratory or UChicago Argonne LLC
ANLESD07-10
Life-Cycle Assessment of Corn-Based Butanol as a Potential Transportation Fuel
by M Wu M Wang J Liu and H Huo Center for Transportation Research Energy Systems Division Argonne National Laboratory
Work supported by the US Department of Energyrsquos FreedomCAR and Vehicle Technologies Program (Office of Energy Efficiency and Renewable Energy)
November 2007
CONTENTS
ACKNOWLEDGMENTS vi
NOTATION vii
ABSTRACT 1
1 INTRODUCTION 1
2 LCA SYSTEM BOUNDARY AND ANALYSIS SCENARIOS 5
21 System Boundary 5 22 Analysis Cases 6
3 ASPEN PLUSreg SIMULATION OF THE ABE PROCESS 9
31 Scope and Method 9 32 Overview of ABE Process 9
321 Grain Receiving Liquefaction and Saccharification 10 322 Fermentation and In-Situ Gas Stripping 11 323 Downstream Processing 12
33 Process Flowsheet Simulated by Aspen Plusreg 13 331 ABE Process Flowsheet 13 332 Estimate of Energy Use for Adsorbent Regeneration 17
4 BIO-BUTANOL LIFE-CYCLE ASSESSMENT 19
41 Bio-Butanol Plant Energy Requirements 19 42 Butanol Life-Cycle Parameters 21 43 Co-Product Credit 22 44 Cradle-to-User Assessment of Petroleum Acetone and Displacement 24
441 Petroleum Acetone and Feedstocks Production 24 442 Assumptions and Data Sources 24 443 Petroleum Acetone Displacement 26
5 RESULTS AND DISCUSSION 29
51 Energy Consumption and GHG Emissions 29 52 Effect of Acetone Co-Product Credit 30 53 Comparison of Bio-Butanol with Corn Ethanol 32 54 Cradle-to-User Comparison of Bio-Acetone with Petroleum Acetone
Issues and Concerns 34
6 CONCLUSIONS 39
iii
CONTENTS (CONT)
7 REFERENCES 41
APPENDIX 45 A1 Parameters for Corn Butanol Life-Cycle Analysis 47 A2 Parameters for Petroleum-Based Acetone Analysis 48 A3 Transportation for Corn-Acetone 48 A4 Fuel Specifications 48
FIGURES
1 Schematic Representation of WTW Analysis System Boundaries for Butanol Ethanol and Gasoline 5
2 Schematic for Grain Receiving Liquefaction and Saccharification 10
3 Schematic Representation of Adsorption and Adsorbent Regeneration 14
4 Aspen Plusreg Output of the Process Flowsheet from Fermentation to Downstream Processing 15
5 System Boundaries for Cradle-to-User Pathway of Fossil-Based Acetone and Corn-Based Acetone 27
6 Well-to-Pump Fossil Energy Breakdown for Bio-Butanol and Corn Ethanol Compared with Gasoline Using Different Co-Product Allocation Methods 30
7 Breakdown of Fossil Energy Use in Various Stages of Fuel Life Cycle for Corn-Based Butanol 31
8 Life-Cycle GHG Emissions of Bio-Butanol and Ethanol Compared with Gasoline Using Different Co-Product Allocation Methods 31
9 Life-Cycle GHG Emission Breakdown for Bio-Butanol and Ethanol 32
10 Fossil Energy Use Based on the Production of Bio-Acetone Compared with Fossil Energy Use Based on the Production of Petroleum 36
11 Fossil Energy Consumption Breakdown for (a) Bio-Acetone and (b) Petroleum Acetone 37
iv
FIGURES (CONT)
12 GHG Emissions Generated or Avoided by Bio-Acetone Production Compared with Petroleum Acetone Production 38
TABLES
1 Properties of ABE Products 6
2 Main Input Parameters for Fermentation and Gas Stripping for Aspen Plusreg Simulations 16
3 Material Balance of Bio-Butanol Plant 16
4 Yields of Acetone Butanol and Ethanol from Bio-Butanol Plant 17
5 Process Fuel Use for ABE Fermentation and Downstream Processing 17
6 Parameters for Calculating Energy Use for Adsorbent Regeneration 18
7 Thermal Energy Requirements in Bio-Butanol Plant 20
8 Electricity Consumption in Bio-Butanol Plants 20
9 GREET Input Parameters for Corn Butanol WTW Analysis Corn Farming Transportation of Corn and Butanol and Vehicle Operation 21
10 US Average Electricity Generation Mix Used in this Study 22
11 Co-Product Energy Partitioning by Energy Allocation 23
12 Assumptions and Data Sources of Cradle-to-User Petroleum Acetone 25
13 Low-Heating-Value Comparison for this Study 26
14 Acetone Butanol and Ethanol Outputs from Corn Compared with Ethanol fromConventional Corn Mills 33
15 Co-Product Yields 33
16 Process Fuel Use in Bio-Butanol and Ethanol Production Plant 34
v
ACKNOWLEDGMENTS
This work was sponsored by the US Department of Energyrsquos Office of FreedomCAR and Vehicle Technologies which is part of the Office of Energy Efficiency and Renewable Energy We would like to thank Professor Hans Blaschek of the University of Illinois at Urbana-Champaign and Dr Nasib Quresh of the US Department of Agriculture (USDA) Agricultural Research Service (ARS) National Center for Agricultural Utilization Research (NCAUR) for providing process data and insights on the ABE process We also thank Andrew McAloon of USDA Economic Research Service (ERS) Eastern Regional Research Center (ERRC) for providing the corn-to-ethanol dry mill ASPEN+ model Several experts reviewed this report Dr Vernel Stanciulescu of Natural Resources Canada Dr Robin Jenkins of DuPont and Professor Han Blaschek of the University of Illinois at Urbana-Champaign We deeply appreciate their input Argonne National Laboratory is a US Department of Energy laboratory managed by UChicago Argonne LLC under Contract No DE-AC02-06CH11357
vi
NOTATION
ABE acetone butanol and ethanol
BC biochemical BTX benzene toluene xylene
CEH Chemical Economics Handbook CH4 methane CO carbon monoxide CO2 carbon dioxide
DDGS distillerrsquos dried grain with solubles DOE Department of Energy
EIA Energy Information Administration EtOH ethanol
GHG greenhouse gas GREET Greenhouse Gases Regulated Emissions and Energy Use in Transportation GV gasoline vehicles
IPCC Intergovernmental Panel on Climate Change
K2O potash fertilizer
LCA life-cycle analysis LCI life-cycle inventory LDV light-duty vehicle LHV low heating value
MMGY million gallons per year
N nitrogen N2O nitrous oxide NG natural gas NOx nitrogen oxide
P2O5 phosphorus fertilizer PM10 particulate matter with diameters smaller than 10 micrometers PM25 particulate matter with diameters smaller than 10 micrometers
RampD research and development RTO regenerative thermal oxidizer
vii
SOx sulfur oxide
USDA US Department of Agriculture
VOC volatile organic compound
WTW well-to-wheels
UNITS OF MEASURE
Btu British thermal unit bu bushel g gram(s) gal gallon(s) kg kilogram(s) kW kilowatt(s) kWh kilowatt hour(s) L liter lb pound(s) MJ mega Joule psi pounds per square inch scf standard cubic feet wt weight percent yr year
viii
1
LIFE-CYCLE ASSESSMENT OF CORN-BASED BUTANOL AS A POTENTIAL TRANSPORTATION FUEL
by
May Wu Michael Wang Jiahong Liu and Hong Huo
ABSTRACT
Butanol produced from bio-sources (such as corn) could have attractive properties as a transportation fuel Production of butanol through a fermentation process called acetone-butanolshyethanol (ABE) has been the focus of increasing research and development efforts Advances in ABE process development in recent years have led to drastic increases in ABE productivity and yields making butanol production worthy of evaluation for use in motor vehicles Consequently chemicalfuel industries have announced their intention to produce butanol from bio-based materials The purpose of this study is to estimate the potential life-cycle energy and emission effects associated with using bio-butanol as a transportation fuel The study employs a well-toshywheels analysis tool mdash the Greenhouse Gases Regulated Emissions and Energy Use in Transportation (GREET) model developed at Argonne National Laboratory mdash and the Aspen Plusreg model developed by AspenTech The study describes the butanol production from corn including grain processing fermentation gas stripping distillation and adsorption for products separation The Aspenreg results that we obtained for the corn-to-butanol production process provide the basis for GREET modeling to estimate life-cycle energy use and greenhouse gas emissions The GREET model was expanded to simulate the bio-butanol life cycle from agricultural chemical production to butanol use in motor vehicles We then compared the results for bio-butanol with those of conventional gasoline We also analyzed the bio-acetone that is coshyproduced with bio-butanol as an alternative to petroleum-based acetone Our study shows that while the use of corn-based butanol achieves energy benefits and reduces greenhouse gas emissions the results are affected by the methods used to treat the acetone that is co-produced in butanol plants
1 INTRODUCTION
Liquid fuel use accounts for the single largest share of petroleum oil consumption in the United States In 2006 the United States consumed more than 20 million barrels of crude oil per day 66 of this total was used in the transportation sector Motor vehicles alone consumed 140 billion gallons of gasoline and 50 billion gallons of diesel in 2006 Gasoline use has increased as a result of the growth in light-duty vehicle (LDV) travel in the past 20 years The Energy Information Administration projected that transportation fuel use will continue to grow up to 30 by 2030 (Conti 2007)
2
On the petroleum supply side the United States relies heavily on foreign oil (137 million barrels per day EIA 2007) The worldrsquos most oil-rich region has become extremely unstable which heightens energy security concerns Furthermore competition for petroleum oil has increased dramatically as a result of rapid economic growth in developing countries Finally exploration production and use of petroleum-based fuels generate greenhouse gas (GHG) emissions which are the primary cause of global warming as confirmed in a recent report prepared by the Intergovernmental Panel on Climate Change (IPCC 2007)
Considering the challenges facing the United States in its continued reliance on fossil-based fuels in the transportation sector many researchers are exploring other alternatives Finding a liquid transportation fuel that (1) can be produced from domestic resources (2) is carbon neutral and (3) has minimal GHG impacts would allow the United States to reduce our dependence on foreign oil and decrease environmental burdens In a recent State of Union address the President stated his goal of displacing 20 of gasoline demand by renewable fuels and vehicle efficiency improvement mdash that translates to 35 billion gallons of biofuels and alternative fuels in 10 years
Following dramatic growth in the ethanol industry corn ethanol (EtOH) production reached a record 49 billion gallons in 2006 Yet this total accounts for only 23 of the total US gasoline supply (in gallons of gasoline equivalent) Even considering a US Department of Agriculture (USDA) projection that corn ethanol production could reach 12 billion gallons by 2017 (Collins 2007) a large gap remains to be filled by biofuels Therefore developments in feedstocks processing technologies and new biofuels are urgently needed if the United States is to meet the Presidentrsquos target of 35 billion gallons per year by 2017
Among potential biofuels butanol (BuOH) produced from starch has gained visibility in recent years as a replacement for gasoline Butanol has unique properties as a fuel The energy content of butanol mdash 99840 Btu per gallon (low heating value [LHV]) mdash is 86 of the energy content of gasoline (on a volumetric basis) and 30 higher than the energy content of ethanol The low water solubility of butanol could minimize the co-solvency concern associated with ethanol consequently decreasing the tendency of microbial-induced corrosion in fuel tanks and pipelines during transportation and storage Butanol is much less evaporative than gasoline or ethanol making it safer to use and generating fewer volatile organic compound (VOC) emissions The majority of butanol used as a chemical is produced from petroleum propylene through the Oxo process (in which synthetic gas [syngas] is reacted with propylene) and its ultimate end use is for surface coatings
The most dominant bio-butanol production process has been acetone-butanol-ethanol (ABE) fermentation ABE fermentation by Clostridium acetobutylicum was the route used to produce butanol during World War II It was phased out when more economical petrochemical routes emerged Now almost all butanol in the world is produced from petrochemical feedstocks Research interest in developing viable ABE fermentation processes has been rekindled recently as a result of the pursuit of non-fossil-based feedstocks
In the past 20 years research and development (RampD) efforts have focused on various aspects of the ABE process Molecular biology research has achieved major breakthroughs in
3
strainmutant development that dramatically improved microbial tolerance to butanol toxicity which resulted in a significant increase in ABE solvent production yield Experimental and computational engineering efforts have included designing new schemes to minimize butanol inhibition by using new fermentor configurations improved downstream processing and process integration Huang et al (2004) reported an experimental process that uses continuous immobilized cultures of Clostridium tyrobutyricum and Clostridium acetobutylicum to maximize the production of hydrogen and butyric acid and convert butyric acid to butanol separately in two steps This process reportedly produced butanol at a rate of 464 grams per liter of fermentation medium per hour (gLh) and used 42 glucose compared with the up-to-25 glucose use rate in traditional ABE fermentation by Clostridium acetobutylicum alone
In the early 1990s Clostridium beijerinckii BA101 was developed by using chemical mutagenesis together with selective enrichment which is able to produce twice as much butanol as its parent strain (US Patent 6358717) Extensive studies have been performed to characterize this strain and develop an ABE process with various feedstocks and evaluate technologies for downstream product separation (Qureshi and Blaschek 1999 Parek et al 1999 Qureshi and Blaschek 2001a and 2001b) Experimental and pilot-scale ABE fermentation processes by this organism resulted in up to 951 glucose utilization in fermentation Using in-situ gas stripping for solvent removal from fermentor minimizes product inhibition and enables higher feed concentration mdash up to 500gL of glucose (Ezeji et al 2004) Solvent production in this process in a fed-batch mode reached 65351 of butanolacetoneethanol by weight which is a significant increase in butanol production from 631 in conventional ABE process
Liu (2003) presents an exhaustive survey of major research findings on ABE downstream processing Recent studies have focused on integration of fermentation and product removal through in-situ gas stripping and fermentation gas recirculation (Qureshi and Blaschek 2000 Qureshi and Blaschek 2001a Qureshi and Blaschek 2001b Ezeji et al 2004 and Ezeji et al 2005) The latest development includes a DuPont patent (2007) describing a strain that produces butanol from biological feedstocks while minimizing acetone production Cellulosic feedstock for butanol production has also been reported (Qureshi et al 2007)
Researchers have employed computer simulations in developing butanol production processes including ABE fermentation The earliest efforts in downstream processing simulation of ABE fermentation were reported in Marlatt and Datta (1986) and Dadgar and Foutch (1988) In these studies simulations were used to evaluate the economics of their processes More recent studies were published in Liu (2003) and Liu et al (2004 and 2006) In these studies downstream processing systems were synthesized simulated and optimized in terms of cost There are comparatively few publications on ABE fermentation process simulation A corn-toshybutanol pathway has been modeled by NRC (Natural Resources Canada Feb 2007) recently on the basis of earlier work of conventional ABE fermentation The study examined corn-based butanol used as 10 butanol in a gasoline blend to fuel light-duty vehicles Simulation results for fuel ethanol produced from corn via dry milling such as those obtained by using USDArsquos dry mill model (Kwiatkowski et al 2006 McAloon 2006) are readily available
Since 1995 with support primarily from DOErsquos Office of Energy Efficiency and Renewable Energy Argonne has been developing the Greenhouse Gases Regulated Emissions
4
and Energy Use in Transportation (GREET) model Argonne released the first version of the model mdash GREET 10 mdash in June 1996 GREET is a Microsoftreg Exceltrade-based multidimensional spreadsheet model that addresses the well-to-wheels (WTW) analytical challenges associated with transportation fuels (including ethanol) and vehicle technologies The latest version mdash GREET 17 mdash is capable of analyzing more than 100 transportation fuel pathways and 75 vehiclefuel systems (Brinkman et al 2005) The GREET model has been updated frequently to reflect new feedstocks processing technologies fuels and vehicle systems For a given vehicle and fuel system GREET separately calculates
bull Consumption of total energy (energy in non-renewable and renewable sources) fossil fuels (petroleum natural gas and coal combined) petroleum natural gas and coal
bull Emissions of carbon-dioxide (CO2) -equivalent GHGs mdash primarily CO2 methane (CH4) and nitrous oxide (N2O) and
bull Emissions of six criteria pollutants VOCs carbon monoxide (CO) nitrogen oxides (NOX) particulate matter measuring 10 micrometers or less (PM10) particulate matter measuring 25 micrometers or less (PM25) and sulfur oxides (SOX)
These criteria pollutant emissions are further separated into total and urban emissions
This study was an attempt to evaluate the potential of the recent ABE process from a life-cycle perspective This estimate provides a life-cycle analysis (LCA) of the production and use of corn-derived bio-butanol as transportation fuel to displace petroleum gasoline First we developed an ABE process simulation model by using Aspen Plusreg We used the energy and mass balance resulting from the Aspen Plusreg simulation as a basis for a life-cycle analysis of corn-based butanol production and use We estimated the life-cycle energy and GHG emissions impacts of corn-based butanol (produced via the ABE process) when used to displace gasoline as a transportation fuel in LDVs We also performed a ldquocradle-to-userrdquo analysis for bio-acetone (which is co-produced with bio-butanol) to address the impacts of displacing petroleum-based acetone with the bio-acetone co-product Merits and shortfalls of such process are discussed in this report
5
2 LCA SYSTEM BOUNDARY AND ANALYSIS SCENARIOS
21 SYSTEM BOUNDARY
Figure 1 depicts the GREET modeling boundary for this study The life cycle of bioshybutanol is divided into five stages
1 Corn farming 2 Corn transportation 3 Bio-butanol production 4 Bio-butanol transportation and distribution and 5 Bio-butanol use in gasoline vehicles (GVs)
FIGURE 1 Schematic Representation of WTW Analysis System Boundaries for Butanol Ethanol and Gasoline
6
The bio-butanol life cycle begins with the manufacture of fertilizer and farming machinery Corn farming operations include irrigation tillage application of fertilizer lime herbicides and pesticides and corn harvest Harvested corn grain is transported via barge rail and truck to fuel production facilities where it undergoes biochemical (BC) processing for fuel production The demand for heat and power (steam and electricity) from the BC processing is met by grid electricity and natural gas (NG) Liquid fuel is then transported to refueling stations via rail barge and truck We assumed that bio-butanol would be used in unblended form in GVs The gasoline life cycle on the other hand begins with crude oil recovery in oil fields and ends in gasoline combustion in GVs The timeframe for the analysis is 2010
22 ANALYSIS CASES
This study analyzes a facility that TABLE 1 Properties of ABE Productsa
produces 150000 metric tons of bio-butanol per year requiring 33 million bushels of corn mdash equivalent to an 89-million-gallon-per-year LHV Density
Product (Btugal) (ggal)(MMGY) corn ethanol dry mill Corn-derived butanol (bio-butanol) is produced from Acetone 83127 2964 fermentation that co-produces acetone butanol Butanol 99837 3065 and ethanol (ABE) plus a small amount of fatty Ethanol 76330 2988 acids The corn-derived butanol is assumed to Gasoline 116090 2819 displace gasoline in GVs on the basis of the DDGS 8703 (Btulb) similarities in the properties of the two fuels (Table 1)
a Sources Acetone and butanol J-C Guibet 1997 ethanol and gasoline GREET DDGS (distillerrsquos dried grains with solubles)
Because current bio-butanol production Morey et al 2006 technology is still in the early stages of research and development we assumed a 2010 timeframe for a large-scale demonstration plant During bio-butanol production a large amount of acetone is generated as a co-product Corn-based acetone could displace petroleum-based acetone We established cases to compare biofuel butanol and biochemical acetone with their petroleum counterparts For bio-butanol we conducted a full life cycle (or WTW) analysis for bio-acetone we elected a ldquocradle-to-userrdquo approach because of limited use data available in the open literature The cradle-to-user analysis includes feedstock farming and transportation bio-acetone production via ABE process and acetone transport to user gate Thus we established a total of seven cases
bull Case 1 Conventional gasoline (baseline fuel)
bull Case 2 Bio-butanol with natural gas as the process fuel where bio-acetone is regarded as a chemical to displace petroleum-based acetone and is therefore credited by product displacement Distillerrsquos dried grains with solubles (DDGS) and ethanol displace animal feed and gasoline respectively
7
bull Case 3 Bio-butanol with natural gas as the process fuel where acetone and DDGS are regarded as energy products and are thus credited on the basis of the energy allocation method among butanol acetone ethanol and DDGS
bull Case 4 Bio-butanol with natural gas as the process fuel where acetone is regarded as waste and therefore no acetone credit is assigned DDGS and ethanol displace animal feed and gasoline respectively
bull Case 5 Corn ethanol from dry milling with natural gas as the process fuel where DDGS is credited by product displacement to displace animal feed (GREET default)
bull Case 6 Corn ethanol from dry milling with natural gas as the process fuel where DDGS is regarded as an energy product and is credited on the basis of the energy allocation method between ethanol and DDGS
bull Case 7 Cradle-to-user petroleum-acetone (baseline chemical) analysis for examining displacement of petroleum acetone by bio-acetone Butanol DDGS and ethanol are credited by product displacement
We established a bio-butanol life-cycle framework on the basis of Aspen Plusreg process simulation and existing GREET as shown in Figure 1 We adopted feedstock corn farming and transportation values from GREETrsquos corn ethanol pathway Bio-butanol is produced together with acetone and ethanol from a corn dry mill by retrofitting the mill to accommodate the ABE fermentation and separation process The bio-butanol production process is simulated by using the Aspen Plusreg model We approximated the other process steps (grain feed handling cooking and DDGS drying) on the basis of a corn dry mill cost model from USDA (Kwiatkowski et al 2006 McAloon 2006) and results from a recent study (Mueller and Cuttia 2006) Data from these sources and Aspen Plusreg simulations were then integrated and scaled to obtain the entire bio-butanol plant mass and energy flow Data from the mass and energy balance of the bioshybutanol plant serve as input parameters to the GREET model for the WTW analysis
We estimated the energy consumption (of both petroleum oil and fossil energy) and the emissions of GHGs (CO2 N2O and CH4) that occurred over the entire fuel cycle Energy and emissions were partitioned to all products resulting from the process according to either the displacement or the energy allocation method (see Section 43) Finally we determined fuel transportation and vehicle operation parameters to complete the bio-butanol fuel life cycle We then compared scenarios for bio-butanol and ethanol produced from conventional corn dry mills to gasoline Section 44 addresses the cradle-to-user analysis of bio-acetone
8
9
3 ASPEN PLUSreg SIMULATION OF THE ABE PROCESS
The simulation of ABE fermentation and downstream processing was completed by using Aspen Plusreg and Microsoft Excelreg Section 31 presents the basis of this simulation including scope plant capacity and product specifications Section 32 presents an overview of the simulated process upstream raw material processing is also included to provide the context for the simulated process Mass and energy balances derived from the ABE fermentation and downstream processing simulation are presented at the end of Section 33 The results are further integrated into the whole plant to include corn grain pretreatment saccharification and DDGS drying Section 41 presents the energy balance of the bio-butanol plant
31 SCOPE AND METHOD
The bio-butanol plant produces butanol from corn via ABE fermentation Our Aspen Plusreg simulation is based on two data sources For the portion of the process upstream from ABE fermentation (ie grain pre-treatment liquefaction and saccharification) we adopt the results from a USDA Aspen Plusreg simulation model for a corn dry mill (Kwiatkowski et al 2006 McAloon 2006) because the upstream results of fermentation would be similar to those of a corn dry mill and can therefore be modeled the same way For a similar reason co-product DDGS drying is simulated after the USDA model
For the second half of the process including ABE fermentation and downstream processing the ASPEN simulation was completed on the basis of the research results from a pilot-scale ABE fermentation plant (Ezeji et al 2003 and 2004) and from literature (Liu 2003 Liu et al 2004 2006 Heckl et al 2006) The production capacity of this plant was set at 150000 metric tons per year of butanol The operation runs 315 days per year Product and by-product specifications were as follows butanol purity 995 by weight (wt) acetone purity 995 wt and ethanol purity 995 wt
32 OVERVIEW OF ABE PROCESS
The ABE fermentation simulation describes a process developed by Qureshi and Blaschek (1999 2001a b) Acetone butanol and ethanol (ABE) are produced by a hyper-butanol-producing strain (C beijerinckii BA101) Corn is fed into a conventional corn dry mill for conversion to glucose through liquefaction and saccharification The glucose is fermented to ABE through a fed-batch system After fermentation the ABE compounds are removed by means of in-situ gas stripping ABE products are recovered through molecular sieve adsorption and a three-stage distillation that separates the acetone butanol and ethanol Solids and biomass that are removed from grain processing and fermentation undergo centrifugation and proceed to drying along with syrup from distillation DDGS generated from drying is used as animal feed The following subsections provide brief descriptions of the process for producing butanol from corn The process consists of three main parts grain pre-treatment (receiving liquefaction and saccharification) fermentation and gas stripping and downstream processing
10
321 Grain Receiving Liquefaction and Saccharification
This section describes of the portion of the conventional dry grind ethanol process that begins with receipt of grain and ends with saccharification as modeled in the USDA Aspen Plusreg simulation of the corn ethanol process (Figure 2) We use the data derived from this part of the corn ethanol process in the USDArsquos 40-mmgy dry mill model to simulate the ABE fermentation process except we scaled the capacity from 40 MMGY of ethanol to 150000 metric tons of butanol per year
Corn brought into the plant site is first separated from finer particles and foreign objects by using a blower and screens The cleaned dry corn is ground in a hammer-mill and weighed to control the feed rate to the process In the liquefaction step the ground corn is then mixed with water thermo-stable alpha-amylase ammonia and lime in a slurry tank
A steam injection heater is used to gelatinize the starch which is then hydrolyzed by the alpha-amylase into oligosaccharides The stream is then ldquocookedrdquo and transferred to the saccharification tank where the oligosaccharides are converted by glucoamylase to glucose at a temperature of 61degC The slurry is then transferred to an evaporator to concentrate the feed to the desired level for ABE fermentation
Corn Grind
Cook
Liquefy
Saccharify
Alpha-amylase
Glucoamylase
Sulfuric Acid
To Evaporation andFermentation
FIGURE 2 Schematic for Grain Receiving Liquefaction and Saccharification
11
322 Fermentation and In-Situ Gas Stripping
The information in this section is based on the research results from Qureshi and Blaschek (2000 2001a b) Ezeji et al (2004) and Ezeji et al (2005)
The literature reported that the strain C beijerinckii BA101 can produce butanol in a range of sugar concentrations from 454 to 500 gL Because typical sugar concentration in fermentation feed is 3ndash7 (White and Johnson 2003) in a corn ethanol plant it is desirable to concentrate this stream which provides a means to integrate the grain processing in corn dry milling with the ABE process we modeled Further it could potentially reduce energy demand associated with removing water from ABE products in downstream processing (Operational issues with respect to the concentrated feed will be discussed later in this section) The stream that departs from saccharification goes to an evaporator to concentrate the sugar to 430 gL before entering ABE fermentation Alternative technologies to provide concentrated feed are available and could be used Nevertheless this step represents a large amount of heat demand and a capital cost Our Aspen Plusreg simulation begins at this step The slurry feed generated from evaporation is then cooled to 35degC and introduced to the oxygen-free fermentation vessel which has been inoculated with C beijerinckii BA101 The temperature is controlled at 35degC and no pH adjustment is applied during the process
ABE fermentation is operated in a fed-batch mode ABE production typically starts with a lag phase and gradually increases its rate until the ABE concentration reaches a plateau before it finally decreases (Ezeji et al 2004) A gas mixture of carbon dioxide (CO2) and hydrogen (H2) is also generated from the fermentation This gaseous mixture is recirculated via a gas pump to maintain a head pressure that ensures the anaerobic environment necessary for the microorganism ABE products are removed by in-situ stripping from the fermentor by using the gaseous mixture from fermentation At start-up the fermentation proceeds for 22 h until ABE reaches about 5 gL and then gas stripping is applied The ABE vapors that are stripped from the fermentor enter a condenser above the fermentor and the ABE vapors are cooled to 10degC and condensed to liquids leaving uncondensed CO2 and H2 in the vapor phase to be recirculated Excessive CO2 and H2 are vented to the atmosphere after passing through a CO2 scrubber The gas stripping captures most of the butanol acetone and ethanol produced during fermentation The selectivity of the stripping for butanol defined as
[y(1ndashy)][x(1ndashx)]
where x = wt of butanol in fermentation broth and y = wt of butanol in condensate
is set at 20 (Qureshi and Blaschek 2001b) Accordingly about 25 wt water is present in the condensate the water will be removed from the product and by-products in the downstream processing stage
Microbial reaction mechanisms for the conversion of glucose to ABE have not been fully understood and characterized In principle the following biochemical reactions could describe the ABE fermentation
12
C6H12O6 rarr C4H10O (butanol) + CO2 + H2O C6H12O6 + H2O rarr C3H6O (acetone) + CO2 + H2 C6H12O6 rarr C2H5O (ethanol) + CO2 + H2 C6H12O6 rarr C4H8O2 (butyric acid) + CO2 + 2H2 C6H12O6 rarr C2H4O2 (acetic acid)
The reactions represent a qualitative measure rather than stoichiometric quantitative relationships for the ABE conversion process The microbial cell growth was not included in any of the reactions above In our simulation the extent of ABE conversion is set according to literature value reported from experimental tests Glucose utilization is 951 (ie 49 glucose is converted into biomass solids as a result of microbial growth) Butanol acetone ethanol acetic acid and butyric acid yields are 0303 0155 00068 00086 00084 gg glucose respectively (Table 2)
As we noted earlier in this section integrating the conventional corn ethanol dry mill process with the new ABE process requires closing a gap in the concentration of the sugar feed to the fermentor between the two processes Feed for the ABE fermentation process contains a sugar concentration of up to eight-fold as high as that of conventional corn ethanol process which suggests a small footprint for a fermentation and downstream processing unit and therefore lower capital expenditure and lower energy demand for downstream separation However at such a concentration the solids could build up to 55 (wtwt) or higher in the fermentor In comparison the level of solids in corn ethanol fermentation is roughly 20 (wtwt) The level of solids in ABE fermentation broth means increased viscosity which could result in inhibitory stress on microorganisms and operational difficulties In addition feed to a fermentor in a corn dry mill usually contains corn fiber which could exhibit mass-transfer limitation during gas stripping The net result could be increased energy consumption for gas stripping or reduced product removal efficiency by stripping Data in the literature are mostly based upon relatively pure glucosenutrient feed in which mass transfer may not be limiting The operability and mass-transfer issues in fermentation for the corn-to-butanol process should therefore be examined carefully For comparison we estimated a case with diluted feed to the fermentor (no evaporation) which is similar to the fermentation feed in an existing corn ethanol plant
Another uncertainty is that ABE fermentation requires a pure form of starch that is similar to starches produced from a wet milling process Additional steps to purify dry milling starch will be necessary to integrate the dry mill with the ABE fermentation Unfortunately at the time of this study available data were limited to pilot-scale testing and the corn-to-butanol ABE process is not well established We did not including starch purification step Our analysis will be updated once these issues have been addressed and data become publicly available
323 Downstream Processing
The liquid fermentation broth from the condenser is subject to a series of distillation operations in which the stream is separated into product based on their volatilities 995 wt pure butanol 995 wt pure acetone and 995 wt pure ethanol In a mixture containing
13
butanol ethanol and water homogeneous ethanol-water azeotrope and heterogeneous water-butanol azeotrope are formed In descending order of their volatilities the components in the stream (including the two azeotropes) to be separated by the downstream processing are acetone azeotrope of ethanol and water ethanol azeotrope of water and butanol water and butanol The components in this sequence could plausibly be separated simply by fractional distillation achieved by various simple andor complex column configurations into any two or more subsequences of components at the adjacent components that have sufficiently different volatilities
The fermentation broth is first fed to the first distillation tower where a composition cut is made to separate acetone ethanol and water from the broth These components are sent to the top stream and the butanol (together with a trace amount of water) goes to the bottom stream The product butanol is 995 wt pure and suitable for transportation fuel use The top stream is sent to a second distillation tower where acetone is concentrated purified and then sent out from the top The bottom stream containing mainly ethanol and water is subject to further separation in a third distillation tower where the azeotropic vapor of 944 wt ethanol and 53 wt water (and 2 wt acetone) is withdrawn from the top and sent to an adsorption unit The water stream from the bottom is sent back to the fermentor Water in the top stream is adsorbed in this unit and ethanol purity in the product stream reaches 995 (the minimum purity required for ethanol to be blended with gasoline and used in vehicles)
The adsorption unit consists of two adsorption columns that run cyclically between the adsorption and desorption phases Molecular sieves are packed in the column as the adsorbents The sieves consist of a microporous substance designed to separate small polar molecules from larger nonpolar ones via a sieving action Water molecules are trapped and adsorbed inside the microporous beads while the ethanol molecules flow around them Molecular sieves are then regenerated by heat and carrier air Figure 3 presents the schematic of the adsorption and adsorbent regeneration process
33 PROCESS FLOWSHEET SIMULATED BY ASPEN PLUSreg
331 ABE Process Flowsheet
This simulation attempts to address the potential of the new ABE fermentation with an in-situ stripping process by using the best of the process value reported The ABE fermentation and downstream processing (separation) model from this study was integrated with the upstream grain processing component of the USDArsquos corn dry mill model and scaled to the 150000-metric-ton-per-year bio-butanol production level Figure 4 shows the Aspen Plusreg
output of the process flowsheet from fermentation to downstream processing Data for the simulation of fermentation and gas-stripping unit operations are based on the research results from Qureshi and Blaschek (2000 2001ab) Ezeji et al (2004) and Ezeji et al (2005) Table 2 summarizes the main parameters for fermentation and gas stripping input to the Aspen Plusreg
simulation
14
995 Ethanol
Atmospheric air Hot Regen
air
Regeneration
Azeotrope stream of ethanol and water
Blower
FIGURE 3 Schematic Representation of Adsorption and Adsorbent Regeneration
The downstream processing flowsheet in the simulation is based on the most cost-effective flowsheet rigorously generated from an exhaustive list of plausible processing equipment and unit operations as described in Liu (2003) Liu et al (2004 2006) and Heckl et al (2006) According to their studies this optimal flowsheet consists of a gas stripper that isolates a liquid product stream from the fermentation broth an adsorption unit that removes the majority of water and a set of distillation columns that purifies the butanol ethanol and acetone products The studies show that the cost of this flowsheet is at least 125 lower than that of any other alternative flowsheet Energy use for the regeneration of the molecular sieve adsorbents is calculated off-line The calculation presented in Section 332 is then incorporated into the simulation by using a Fortran subroutine
Shortcut methods that highlight the mass and energy balances are chosen for simulating most of the unit operations in the process Heat integration between the three distillation columns is taken into consideration Our simulation did not include stream recycling and simple unit operations (such as valves) we also did not examine different distillation column configurations
The combined Aspen Plusreg model provides the material balance for the bio-butanol plant as shown in Table 3 Table 4 lists the yields of acetone butanol and ethanol from the bioshybutanol plant (in gallon per bushel [galbu] of corn) Steam and electricity use for the ABE process (Table 5) indicates that using concentrated feed for ABE fermentation could save 14 of steam needs in comparison with using existing feed in a dry mill Among the reductions in steam needs 75 of those reductions come from distillation Section 41 presents the energy balance for the bio-butanol plant from gate to gate
15
GASPUMP
DISCHARG
ETOH
ADSBWST1
BTOH
ACETONE
WATER
215WATER GASPROD
GASSTRPR
CONDNSR PHSSEPR
ADSORBR1 DIST1
DIST2 FERMENTR
DIST3
EV01
FIGURE 4 Aspen Plusreg Output of the Process Flowsheet from Fermentation to Downstream Processing
16
TABLE 2 Main Input Parameters for Fermentation and Gas Stripping for Aspen Plusreg Simulations
Value Used in Input Parameter the Simulationa
Fermentor operating temperature (degC) 35
Fermentor operating pressure (atm) 1
Acetone 0155 Butanol 0303 Ethanol 00068
Yield (gram ABE (total) 0465 gram glucose) Acetic acid 00086
Butyric acid 00084 Hydrogen 0021 Carbon dioxide 06954
Gas stripping carrier gas Fermentation gas Gas stripping selectivity for butanol 200 Condensation temperature (degC) 2
a Sources Ezeji et al (2004) Qureshi et al (2001b)
TABLE 3 Material Balance of Bio-Butanol Plant
Parameter Value Source
Feed grain moisture content () 15 USDA dry mill model (Kwiatkowski et al 2006
Corn grain feed rate (lb cornh) 237338 McAloon 2006) Aspen Plusreg results scaled up from USDA dry mill model (Kwiatkowski et al 2006 McAloon
Glucose feed rate to fermentor 154871 2006) Aspen Plusreg simulation (this study)
(lbh) Production (lbh) Aspen Plusreg simulation (this study)
Acetone 23997 Butanol 42728 Ethanol 1032 DDGS 73816
DDGS moisture content () 11
17
TABLE 4 Yields of Acetone Butanol and Ethanol from Bio-Butanol Plant
Product Yield
(galbu corn) Energy
(Btubu corn) Energy Output Share
()
Acetone Butanol Ethanol Total
0868 1495 0037 24
69525 149267
2828 221621
314 674
12 100
TABLE 5 Process Fuel Use for ABE Fermentation and Downstream Processing
Diluted Sugar Feed to Fermentora
Process Step Steam (Btuh) Electricity (kW) Steam (Btuh) Evaporator 278653091 0 Fermentor agitator 19273 Condenser 310540 Gas pump 6104 Gas stripper 1307400 1412700 Adsorption feed pump 024 Distillation Column 1 43220100 68173300 Distillation Column 2 62665700 374388000 Distillation Column 3 5730860 10891300 Distillation 2 feed pump 040 Distillation 3 feed pump 003 Adsorbent regeneration -729205 23733 -729205
a Existing fermentation feed such as those from corn dry mill used for ABE fermentation
332 Estimate of Energy Use for Adsorbent Regeneration
The heat use for the regeneration of adsorbents is calculated as the total amount required to bring the system mdash which includes the adsorption column the molecular sieves adsorbed water and the carrier gas mdash to a temperature of 500degF An electric heater provides the energy requirement for absorbent regeneration The system is cooled by exchanging the heat with the process streams fed to the distillation towers (assuming a loss factor of 10) Therefore the energy used to cool the system is not taken into account The weight of water that the molecular sieves adsorb is set at 22 of the weight of the molecular sieve The peak concentration of water in the carrier air is set at 17 wt The adsorption and regeneration cycle time is set at 8 h The amount of heat required to bring the column to the specified temperature is calculated by using a method based on logarithmic mean temperature difference (LMTD) and the scaling of experimental data The radiation loss factor for heater is set at 5 Other major parameters for the calculation are listed in Table 6
18
TABLE 6 Parameters for Calculating Energy Use for Adsorbent Regeneration
Water Adsorbed Inside Molecular Adsorption Carrier Gas mdash
Parameter Sieves Molecular Sieves Column Air
Amount (lbh) 556 20200 na 33330 Cp (btulbdegF) 10 02 na 02 T1 (degF) 1750 1750 1750 1750 T2 (degF) 5000 5000 5000 5000 ΔT (degF) 3250 3250 3250 3250 Q (Btuh) 180538 1509950 3437061 2588908 Total (Btuh) 8102279
19
4 BIO-BUTANOL LIFE-CYCLE ASSESSMENT
41 BIO-BUTANOL PLANT ENERGY REQUIREMENTS
We assume that the bio-butanol plant uses natural gas as process fuel to generate steam and purchases electricity from the grid Our process fuel estimate for the butanol plant is based on three sources (1) the Aspen Plusreg simulation of ABE fermentation and downstream processing from this study (2) a recent study by Mueller and Cuttica (2006) of process fuel use in corn ethanol dry mills and (3) the USDA corn dry mill model (Kwiatkowski et al 2006 McAloon 2006) Aspen Plusreg results from this simulation generate process fuel use values for ABE fermentation and downstream processing (Table 5) Considering the similarity in upstream grain processing between corn ethanol and corn butanol process in this study we adopted the grain processing and DDGS drying steps from USDA dry mill model scaling-up the corn feed for the bio-butanol plant Thus the heat and power needs in the rest of the plant (for cooking the regenerative thermal oxidizer [RTO] and DDGS drying) are based on sources (2) and (3)
An estimate of process fuel (natural gas) use for cooking DDGS drying and RTO in the corn butanol plant was based on the amount of corn feed processed in the following steps We first converted the energy input per gallon of ethanol to energy input per bushel of corn feed at a yield of 272 gallons of denatured ethanol per bushel of corn We then converted this value to energy use per gallon of bio-butanol with a bio-butanol yield of 150 gallons per bushel of corn (Table 4) for each process step above In a conventional corn ethanol dry mill water is removed from WDG (solids from grain processing) and syrup (solids from distillation) at the drying step and from ethanol via distillation The ABE fermentation process described in this study partially removes water before fermentation to concentrate feed sugar content Therefore it is likely that less water will be removed at downstream processing and DDGS drying which means lower energy demand Another parameter that has not been fully evaluated and reported is DDGS yield from the corn-to-butanol ABE process and its quality We assume equivalent heating demands for DDGS drying in the ethanol plant and in the butanol plant Table 7 details the calculations of natural gas use in the bio-butanol plant This steam demand is met by using a natural-gas-fired steam boiler with 80 efficiency to produce 150-psi medium-pressure steam
Electricity demand for the bio-butanol plant was estimated in a similar way According to the ethanol plant study by Mueller and Cuttica (2006) the average electricity use in corn ethanol plants is 075 kWh per gallon of ethanol which agrees with the value estimated by an ethanol plant designer (Roddy 2006) while it is slightly higher than the 073 kWh per gallon of ethanol suggested by the USDA model We used the former estimate in this analysis to reflect the current industry average Electricity used for fermentation and distillation in the corn ethanol plant was displaced by that for ABE fermentation and downstream processing The power consumption value was converted from per gallon of ethanol to per gallon of butanol via per bushel of corn on the basis of 272 gallons of EtOHbushel and 150 gallons of bio-butanolbushel Table 8 summarizes the major assumptions and data sources for power use in the bio-butanol plant
c
20
TABLE 7 Thermal Energy Requirements in Bio-Butanol Plant
Process Steps
EtOH Plant NG Required (Btugal denatured EtOH)
BtOH Plant NG Required Based on
Feed Corn (Btubu corn)c
BtOH Plant NG Required Based on
BtOH (Btugal BtOH)d
Cooking 10013ab 27236 18216 Dryer and RTOe
ABE fermentationf
and processing
10830 29458 19703 77195
BtOH plant total 115114
a Source Mueller (2006) 231 total process fuel for cooking 265 for EtOH processing Therefore cooking fuel use is 231(231 + 265) = 4657 of total fuel used in ethanol processing (excluding DDGS drying)
b The total thermal fuel requirement for cooking fermentation and distillation is 21500 Btugal denatured EtOH in a 100-MMGY ethanol dry mill Source Mueller and Cuttica (2006) NG needed for cooking is 4657 times 21500 Btugal = 10013 Btugal EtOH Assumed corn ethanol yield 272 galbu (denatured)
d Corn butanol yield 150 galbu of corn e Source Mueller and Cuttica (2006) f Aspen Plusreg results from this study includes heat for evaporation fermentation distillation and gas
stripping
TABLE 8 Electricity Consumption in Bio-Butanol Plants
BtOH Plant BtOH Plant EtOH Plant Electricity Required Electricity Required
Electricity Required Based on Feed Corn Based on BtOH Item (kWhgal EtOH) (kWhbu) (kWhgal BtOHa)
EtOH plantb 075 204 EtOH plant excluding 068c 184 123 fermentation and distillation ABE fermentation and 053d
separation BtOH plant total 176
a Converted from kWhbu to kWhgal BtOH with a corn butanol yield of 150 galbu b Source Mueller and Cuttica (2006) Converted to per bushel with an assumed corn ethanol yield of 272
gal denatured ethanolbu Calculated on the basis of USDA dry mill model fermentation requirement 006 kWhgal EtOH and 001 kWhgal for distillation are subtracted from 075 kWhgal EtOH
d Electricity needs from ABE fermentation and separation Aspen Plusreg results from this study
c
21
Scale-up from pilot test to full-scale commercial production could change the yield and energy consumption These factors affect the overall bio-butanol production and energy use estimates
42 BUTANOL LIFE-CYCLE PARAMETERS
Bio-butanol in this study is produced from corn It would be economical for the bioshybutanol plant to be built near corn farms to reduce transportation costs Operations associated with corn farming and feedstock transportation would be similar to those for corn Bio-butanol produced from corn will displace gasoline therefore transportation storage and distribution of bio-butanol would be similar to those of ethanol Table 9 presents key assumptions and GREET inputs for the bio-butanol life-cycle analysis Electricity for the bio-butanol plant is supplied from the US electric generation mix (Table 10)
TABLE 9 GREET Input Parameters for Corn Butanol WTW Analysis Corn Farming Transportation of Corn and Butanol and Vehicle Operation
Parameters Assumptions
Corn yield (buharvested acre) 158 Ratio of harvested acreage to planted 09 acreage Fertilizer use (gbu) N = 420 P2O5 = 149
K2O = 174a
CO2 emissions from potential land use 195 changes of farming (gbu) Lime use (gbu) 1202 Corn transportation mode and distance (mi) Truck (100) 50 Butanol transport and distance (mi) Barge (40) 520 Rail (40) 800 Truck (20) 110 On-road fuel economy of LDVs fueled with 248 bio-butanol (migal gasoline equivalent)
a N = nitrogen P2O5 = phosphorus fertilizer and K2O = potash fertilizer
22
To clearly show the energy and emission TABLE 10 US Average Electricity effects of bio-butanol vs gasoline we assumed in this Generation Mix Used in this Studya
study that bio-butanol is used in pure form in GVs and that butanol could achieve the same fuel economy per gallon gasoline equivalent as gasoline-powered Source Percent of Total
GVs (Table 9) WTW results are expressed in a per-million-Btu fuel matrix for comparison In reality Residual oil 27
bio-butanol may be used in various gasoline blends Natural gas 189
The per-million-Btu base system is more appropriate Coal 507
from a fuel supply perspective Because energy and Nuclear power 187
emission results are presented in Btu or grams per Biomass 13
million Btu of fuel produced and used the effects of Others 77
differences in fuel economy are removed a Source GREET year 2010
43 CO-PRODUCT CREDIT
During bio-butanol production several co-products are generated along with butanol mdash these include acetone DDGS a small amount of ethanol fatty acids (butyric acid and acetic acid) and H2 gas On the scale that we analyzed acetone is the major co-product of the bioshybutanol plant with 82000 metric tons produced per year Acetone contributes to more than one-half (by weight) of the butanol production The bio-butanol plant also generates 253600 metric tons of DDGS (11 moisture) per year mdash the second large co-product The yield of ethanol is relatively small (Tables 3 and 4) (similar to the level of fatty acid mixtures) Ethanol yield from ABE fermentation accounts for 15 of total ABE (acetone butanol and ethanol) by weight and only 12 by energy content (Btubu of corn) (Table 4) Although the fatty acids could be separated further purified from the liquid discharge stream and sold for use in the chemical market the separation step has not yet been tested with ABE fermentation In this Aspen Plusreg
simulation the fatty acids were not separated and purified and so they were not treated as coshyproducts
Significant amounts of H2 and CO2 gas were produced from fermentation these gases were used internally for gas stripping and then for maintaining anaerobic conditions for ABE fermentation The H2 could be separated as a fuel product if high-purity nitrogen gas is used in place of fermentation gas However using such nitrogen gas to maintain anaerobic conditions and for stripping in large-scale operation could be cost prohibitive Further studies to evaluate the engineering economics of alternative approaches for process operation while economically producing bio-butanol and hydrogen would be beneficial In this initial attempt to address the life cycle of bio-butanol H2 was not considered as a co-product
We partitioned total energy and emissions into bio-butanol and the co-products by using two methods product displacement and energy allocation Co-product displacement (Case 2) is based on the concept of displacing the current product with the new product In this case bioshyacetone is regarded as a renewable chemical The energy consumed and the emissions that occur during bio-acetone production displace the energy and emissions associated with petroleum-based acetone production Energy and emission accredits from the acetone displacement are
23
assigned to bio-acetone Similarly DDGS generated from corn butanol production contains 267 protein by weight which is close to the amount of protein contained in the DDGS from the corn ethanol process With the assumptions that the nutritional values of DDGS from the two processes are similar the DDGS from the bio-butanol plant displaces traditional animal feed (soy protein and corn) the production pathway of which is already in place in GREET
The limitation of using the displacement method for the bio-butanol life-cycle analysis is the large amount of acetone that is co-produced with butanol While the main product mdash butanol mdash accounts for 63 (wtwt) of the total product yield (acetone butanol and ethanol) acetone accounts for 35 (wtwt) (Table 3) Our previous study (Wu et al 2005) suggested that when the share of energy co-products increases the co-product displacement method could yield misleading results Therefore other partitioning methods such as energy allocation should be examined
For Case 3 we applied the product energy allocation method to co-products in which emission and energy burdens are allocated among products according to their energy output shares from the bio-butanol plant In the energy allocation method shares of output product energy for each product are determined according to the heating value Energy use and associated emissions from bio-butanol production and from upstream feedstock production and transportation activities are partitioned among acetone butanol ethanol and DDGS on the basis of their corresponding energy shares This approach treats all energy products from the production process as equal regardless of the form and quality differences among them It also implies that all four products are energy products The energy allocation method is applicable to this case because of the ABE products both butanol and ethanol are liquid fuels Although TABLE 11 Co-Product Energy Partitioningacetone is normally regarded as a chemical by Energy Allocationa
solvent and feedstock its energy content (in LHV) is in fact in between that of butanol and ethanol (Table 1) Furthermore DDGS has a Bio- Bio- Bio-
Butanol Acetone DDGS EthanolLHV of 8703 Btulb and can be used as a solid fuel for ethanol plant operations Several 40 19 40 001 ethanol plants are currently exploring DDGS
acombustion or gasification such as Corn Plus Based on energy contentto provide heat and power Although the fuel quality of DDGS is lower than that of the liquid fuels considering its large quantity (Table 3) use of DDGS for process heat brings energy savings and yet relaxes pressure on the already stagnant DDGS market Table 11 presents energy shares based on product energy (in Btu)content
We also established a case to consider the impact of overproduction of acetone (Case 4) In this case an overabundance of acetone produced by a large-scale butanol industry would flood the acetone market consequently losing its commercial value Case 4 is the same as Case 2 except that it treats acetone as a waste stream (ie corn-acetone is not credited) This case provides an extreme scenario for bio-butanol
24
44 CRADLE-TO-USER ASSESSMENT OF PETROLEUM ACETONE AND DISPLACEMENT
441 Petroleum Acetone and Feedstocks Production
To evaluate the energy and emissions benefits of producing bio-acetone in a corn butanol plant we performed a cradle-to-user analysis of petroleum-based acetone mdash from feedstock extraction to acetone delivery to the user site Acetone is almost exclusively produced via cumene peroxidation as a co-product with phenol Its main use is as a chemical intermediate in the manufacture of acetone cyanohydrin for methyl mechacrylate biphenol A and adol chemicals Direct solvent use accounts for about 30 of world demand for acetone
A synthetic process based on hydrocarbons or derivatives is now accounted for all acetone production in the United States and nearly all production in other countries In this process acetone is co-produced with phenol from cumene The yield of acetone from this process averages 221 units of cumene per unit of acetone by weight (Camara-Greiner 2005) Cumene is produced via alkylation of benzene with propylene under elevated temperatures and pressures in the presence of a catalyst Upstream from cumene production benzene is produced principally through a catalytic reforming from naphtha in a BTX (benzene toluene and xylene) process The other feedstock for cumene propylene is one of a half dozen products from crackers receiving raw hydrocarbon (naphtha) from oil refineries as well as natural gas Figure 5 presents a schematic of cradle-to-user petroleum acetone production
442 Assumptions and Data Sources
The cradle-to-user analysis system boundary for petroleum acetone includes resource extraction feedstock production acetone production process fuel production and associated transportation Our petroleum acetone production data are based on the life-cycle inventory (LCI) of Eco-Profile (Boustead 2005)
Eco-Profile Reports compiled average industry data and assembled detailed environmental data for various petrochemical processes We noted system boundary differences in the transportation and upstream fuel production stages between the Eco-Profile and the GREET database To ensure a consistent system boundary for all seven cases with current GREET biofuel pathways we selected feedstock production (under category ldquofeedstock energyrdquo in Eco-Profile) and the amount of process fuel used in production of acetone feedstocks and acetone (under category ldquoenergy content of delivered fuelrdquo in Eco-Profile) to arrive at our energy estimate for petroleum acetone The GREET default energy values were used for upstream fuel production (oil extraction refining and transportation) transport of feedstocks and transport of acetone to users Direct emissions from production processes (under category ldquoprocessrdquo in Eco-Profile) from Eco-profile were used for our petroleum acetone cradle-to-user estimate Emissions associated with upstream fuel production and all transportation activities were based on GREET values Table 12 presents data sources for each life-cycle step in petroleum acetone production
25
TABLE 12 Assumptions and Data Sources of Cradle-to-User Petroleum Acetone
Cradle-to-User Stage Data Sources
Crude extraction for process fuel Crude transport for process fuel GREET 17 Oil refining and transport for process fuel
Cumene transporta GREET 17
Acetone production (life-cycle value)b Eco-Profile
a Benzene and propylene were assumed to be captive Acetone is for captive use in the acetone production facility to produce acetone cyanohydrin biphenol A and adol chemicals Cumene is transported to acetone production facility
b Cumene production value is not available
The hypothetical corn butanol plant is located in the US Corn Belt to reduce corn transportation costs We assumed that acetone produced from the corn butanol plant would displace petroleum acetone produced in the region of Petroleum Administration for Defense Districts (PADD) II (EIA 2004) PADDs were delineated during World War II to facilitate oil allocation PADD II includes 14 Midwest states and overlaps with the Corn Belt where most corn-based plants would operate We identified the mass flow for cumene and acetone production and transportation in PADD II on the basis of a Chemical Economics Handbook (CEH) Marketing Research Report (Camara-Greiner 2005) In this region 85 of total cumene is produced from captive benzene and propylene (that is benzene and propylene are produced and consumed on-site) The cumene is purchased by and subsequently transported to the acetone producer
Major assumptions for cradle-to-user analysis of petroleum acetone are listed below
bull Process fuels used in the acetone pathway are electricity oil and natural gas
bull Electricity is purchased from the grid with the US average generation mix (Table 10)
bull Cumene production feedstocks (benzene and propylene) are captive in the refinery so no transportation is associated with these feedstocks
bull The acetone production facility purchases 100 of feedstock cumene
bull Cumene needs for the acetone producer is estimated on the basis of the mass unit ratio of 221 units of cumene per unit of acetone (Camara-Greiner 2005)
26
bull Cumene is transported to the acetone production facility an average distance of 323 miles in a 1028-Btuton-mi Class 8 diesel truck
Table 13 presents the heating values used in Eco-Profile and GREET In this assessment energy data are expressed in LHV of Btu or kWhkg acetone produced When there was a discrepancy in LHV between Eco-Profile and GREET for same fuel or chemical the GREET value was selected to ensure consistency with the baseline fuel pathways of petroleum gasoline and corn ethanol The energy data from Eco-Profile are converted according to the ratio of LHV Eco-ProfileLHV GREET (Table 13)
TABLE 13 Low-Heating-Value Comparison for this Studya
Fuel
GREET (Btugal Btuscf)
Eco-Profile (MJkg)
Eco-Profile (Btugal Btuscf)
Ratio LHV EcoGREET
Fuel oil NG
140353 983
405 4816
144176 1005
103 102
a Unit for fuel oil is Btugal unit for natural gas is Btuscf
443 Petroleum Acetone Displacement
We assumed that the corn-based butanol plant would be built near a corn farm in the Midwest PADD II region and operated at a production scale of 150000 metric tons of bioshybutanol per year With a mass production ratio of 056 lb of bio-acetone per pound of bioshybutanol this facility could yield 82461 metric tons of bio-acetone annually mdash 16 of the total acetone production in PADD II and 4 nationwide We assumed that bio-acetone would be transported to acetone consumers via train (500 miles) and truck (100 miles) within PADD II
In the co-product displacement approach (Case 2) petroleum acetone is displaced by corn-based acetone from cradle to user The displacement is carried out in the following sequence the cradle-to-gate results of petroleum acetone (as illustrated in Figure 5) were first subtracted from the WTW results of bio-butanol and then the energy or emissions values associated with bio-acetone transportation from the bio-butanol plant to the acetone user were added
27
FIGURE 5 System Boundaries for Cradle-to-User Pathway of Fossil-Based Acetone and Corn-Based Acetone
28
29
5 RESULTS AND DISCUSSION
51 ENERGY CONSUMPTION AND GHG EMISSIONS
Corn-derived butanol achieves substantial fossil energy savings (39ndash56) compared with gasoline ([Cases 3 and 2] Figure 6) on a life-cycle basis In Cases 2 and 3 bio-butanol production contributes to a positive energy balance (defined as fossil energy used in gasoline production minus fossil energy used in bio-butanol production) Without acetone credit as in Case 4 in which acetone is regarded as a waste bio-butanol production is not an option for fossil energy savings
The primary fuel consumed in the bio-butanol life cycle is natural gas followed by petroleum oil and coal (Figure 6) Although electricity generation uses 50 of coal (Table 10) the amount of electricity required is relatively small (Table 8) and so only 9ndash17 of total fossil energy use is from coal (Cases 3 and 2) A life-cycle fossil energy breakdown (Figure 7) indicates that about three-fourths of the fossil fuel is spent in the butanol production plant (73) Corn cultivation accounts for a total of 23 of WTW fossil energy (12 for agricultural chemical and fertilizer manufacturing and 11 for farming operations) In the butanol plant the majority of natural gas demand comes from the process steam requirement (Table 5) which leads to 115000 Btu per gallon of butanol produced mdash approximately three times that of corn ethanol production before co-products are allocated As we pointed out earlier this estimate tends to be conservative because it did not reflect the lower heating requirement for DDGS drying in the bio-butanol plant The water requirement in biological fuel production drives the energy balance in the plant A higher concentration of product in fermentation reduces energy needs for product concentrating in subsequent process steps Historically improvement of ethanol concentration in a fermentor from ~8 in 1980s to 20 at present demonstrates in part the lower energy cost in ethanol plant operation The ABE fermentation process evaluated in this study achieved a concentration of 19 (wtwt) of total solvents (ethanol butanol and acetone) in a fermentor With rapid in-situ removal of solvent by gas stripping the process is able to increase feed concentration to improve production rate while minimizing butanol inhibition Although using concentrated feed in fermentation effectively reduces about 14 of the steam requirement (Table 5) solids concentration in the fermentor mdash an important issue in process development and operation mdash remains a constraint
Vehicles fueled by bio-butanol achieve small to moderate reductions in GHG emissions relative to gasoline vehicle on a WTW basis in Cases 2 (8 displacement ) and 3 (32 energy allocation) (Figure 8) For every million Btu of bio-butanol used in place of one million Btu of gasoline 8ndash32 kg of GHG emissions could be avoided (Cases 2 and 3) The GHG emissions profile for the bio-butanol production option in this study is similar to that of corn ethanol Of total GHG emissions in the bio-butanol WTW cycle over 70 by weight of the GHGs are from CO2 less than 5 is from methane and the remaining 18ndash21 is from N2O (Figure 9) Natural gas consumption in butanol plant is the major cause of GHG emission
We assumed that vehicles fueled by bio-butanol would offer performance similar to that of vehicles fueled by gasoline We have not found any vehicle testing data to confirm this
-
30
assumption Vehicle testing with butanol should be conducted to evaluate butanolrsquos performance in vehicles under realistic driving conditions
52 EFFECT OF ACETONE CO-PRODUCT CREDIT
Energy partitioning for co-products has a significant effect on overall energy use and associated GHG emissions The three cases that we examined (2 3 and 4) presented different options for acetone When acetone is regarded as a fuel and credit is allocated on the basis of product energy content (Case 3) the WTW analysis yields moderate fossil energy and GHG emissions benefits for bio-butanol When acetone is used as a renewable chemical to displace petroleum acetone via the displacement method (Case 2) the results of analysis show 17 savings in fossil fuel (Figure 6) and small reductions in GHG emissions (Figure 8) However treating acetone as a waste stream (Case 4) resulted in an increase of almost one million Btu in fossil energy and 40000 g of GHG emissions (compared with gasoline) for each million Btu of bio-butanol produced The difference is largely attributable to the acetone credit Feedstocks for petroleum-based acetone production (propylene and benzene [Figure 5]) are produced from naphtha and natural gas mdash 100 fossil feedstock (Lacson et al 2005) Another factor is the high yield of acetone from the ABE process 056 lb acetone per pound of butanol These two factors suggest that a significant portion of fossil energy use in petroleum acetone production will be regarded as a credit when bio-acetone displaces fossil acetone which eventually leads to a small fossil energy value (Figure 6)
-500000
0
500000
1000000
1500000
2000000
WTW
Fos
sil E
nerg
y U
se (B
tum
mB
tu) Petroleum
NG
Coal
Co product allocation based on displacement
Co-product allocation based on product energy value
Butanol Ethanol Butanol Butanol Ethanol Gasoline (Case 3) Dry mill (Case 2) (Case 4) Dry mill (Case 1)
(Case 6) (Case 5)
FIGURE 6 Well-to-Pump Fossil Energy Breakdown for Bio-Butanol and Corn Ethanol Compared with Gasoline Using Different Co-Product Allocation Methods (negative value indicates fossil energy avoided)
31
Vehicle Fuel Transport Bio-butanol
Net Consumption in Production
Plant 73
Corn Transport
2
Corn Farming 11
Fertilizer Manufacture
12
Operation 02
FIGURE 7 Breakdown of Fossil Energy Use in Various Stages of Fuel Life Cycle for Corn-Based Butanol (Case 3)
Butanol Ethanol Butanol Butanol Ethanol Gasoline (Case 3) Dry mill (Case 2) (Case 4) Dry mill (Case 1)
(Case 6) (Case 5)
FIGURE 8 Life-Cycle GHG Emissions of Bio-Butanol and Ethanol Compared with Gasoline Using Different Co-Product Allocation Methods
0
20000
40000
60000
80000
100000
120000
140000
WTW
GH
G E
mis
sion
s (g
CO
2 eq
uiva
lent
GH
Gm
mB
tu)
32
80000
60000
40000
20000
0 Butanol (Case 3) Ethanol Dry mill (Case 6)
FIGURE 9 Life-Cycle GHG Emission Breakdown for Bio-Butanol and Ethanol (Energy Allocation)
The displacement method provides significant benefits in terms of reductions in the use of fossil energy (Figure 6) but relatively small reductions in GHG emissions (Figure 8) The main reason for this phenomenon is that petroleum acetone production extracts carbon from a fossil resource and transforms the carbon to another bounded form (chemical) with net GHG emissions generated from consumption of the process fuel In its life cycle petroleum acetone is primarily used as a chemicalfeedstock with a fraction as solvent Although a small amount of carbon embedded in petroleum acetone may escape to the atmosphere through volatilization during product application (ie use as solvent) the majority ultimately ends up as a solidliquid chemical in a bound form rather than being emitted to the air as CO2 By displacing petroleum acetone with bio-acetone in this case the life-cycle reductions in fossil energy use do not translate to benefits in terms of GHG emissions
53 COMPARISON OF BIO-BUTANOL WITH CORN ETHANOL
The ABE process simulated in this study appears to be as efficient in producing acetone butanol and ethanol on a weight basis as current corn dry mills (Table 14) Measured by gallon or gram of ABE the yields from the ABE process are similar to ethanol yields from a conventional dry mill As a rule of thumb in ethanol produced from corn dry milling one-third of the feed mass goes to ethanol one-third is left in DDGS and one-third is emitted as CO2 The
WTW
GH
G E
mis
sion
s B
reak
dow
n(g
ram
CO
2 eq
uiv
per
milli
on B
tu)
N2O
CH4
CO2
33
TABLE 14 Acetone Butanol and Ethanol Outputs from Corn Compared with Ethanol from Conventional Corn Mills
Corn Butanol Plant Ethanol from Corn
Acetone Butanol Ethanol Total Dry Mills
Btubu corn 69525 149267 2828 221620 (with 198458 acetone) 152095 (without acetone)
Galbu corna
gCg cornb 087
0074 150 0137
004 0003
240 0214
260 0172
a Un-denatured b Based on dry corn feed
ABE process examined in this study follows TABLE 15 Co-Product Yields (gg corn)almost the same rule one-third of the feed mass ends up in the products (acetone butanol and
Acetone Butanolethanol) one-third remains in DDGS and about Ethanol DDGS CO2one-third (30) is emitted as CO2 (Table 15) (the remaining ~3 ends up in fatty acids [butyric and 034 033 030 acetic acids] and losses) Acetone 0119
Butanol 0212 Because acetone is not used as a fuel at Ethanol 0005
present net fuel production (butanol and ethanol) is small A typical dry mill can deliver 272 galbu of fuel ethanol or 26 galbu of undenatured ethanol which is ~11 gal more than the butanol and ethanol yield together from the ABE process (154 galbu) (Table 14) On the other hand butanol contains 30 more energy (LHV) than ethanol (Table 1) by volume When we take fuel energy yield into consideration each bushel of corn could generate nearly 152000 Btu of liquid fuels from the ABE process (butanol and ethanol together) while the same bushel delivers 198000 Btu of liquid fuels (undenatured ethanol) from the conventional ethanol dry mill (46000 Btu more than the bio-butanol option) Hence from a liquid fuel production perspective the ABE process option does not offer an increase in renewable fuel production in comparison with conventional corn ethanol production
Process fuel use for ABE production could be a major hurdle as indicated in Table 16 A bushel of corn requires 82 more steam and 34 more electricity to produce ABE from a bioshybutanol plant than to produce ethanol from a corn dry mill If the first corn butanol plant is built from an existing corn dry mill that has been retrofitted the implication is that operation cost will be high To build a new corn butanol plant capital cost may be lower because of the reduced footprint in fermentation and downstream processing relative to the existing dry mill but the plant would have increased process fuel cost mdash especially given the current price for natural gas
34
TABLE 16 Process Fuel Use in Bio-Butanol and Ethanol Production Plant
Fuel Bio-butanol Plant Ethanol Dry Mill Ratio of Butanol
to Ethanol
Natural gas (Btubushel of corn) Electricity (kWbushel of corn)
172108
263
94320
197
182
134
Another concern is the feedstock supply for bio-butanol The current ABE process shares the same starch-based feedstocks with conventional corn ethanol Development of bio-butanol through the ABE process could take limited feedstocks away from conventional corn ethanol production RampD efforts in bio-butanol may need to be directed toward identifying new feedstocks and process technologies In fact Qureshi (2007) recently reported on a study using cellulosic biomass as feedstock for bio-butanol production via the ABE process Because ABE fermentation is from glucose the results of ongoing RampD on cellulosic pretreatment for cellulosic ethanol could be applied to the ABE process
54 CRADLE-TO-USER COMPARISON OF BIO-ACETONE WITH PETROLEUM ACETONE ISSUES AND CONCERNS
Use of bio-acetone to displace petroleum acetone shows promising energy and environmental benefits (Figure 10) from a life-cycle perspective Conventional acetone production is a fossil-energy-intensive process By producing acetone from corn manufacturers could save a significant amount of total fossil energy mdash up to 71 relative to petroleum-based acetone The renewable acetone achieves energy savings of 91 for petroleum and 58 for natural gas Figure 11 further shows the life-cycle fossil energy distribution between the two The majority of fossil energy use shifts from feedstocks (57) in the petroleum acetone production process to acetone production (70) in the corn acetone production process
Bio-acetone in this study is produced from corn mdash a renewable agricultural resource that absorbs atmospheric CO2 during its growth The carbon in CO2 is converted to organic carbon in the corn and is further transformed and embedded in acetone through the ABE process Therefore we allocated a renewable carbon credit to bio-acetone for the carbon embedded in corn As illustrated in Figure 12 a net carbon sequestration would occur from cradle to user GHG emissions would be much higher mdash about 500 glb acetone produced if the carbon in acetone is from non-renewable sources
Although bio-acetone production results in positive WTW energy benefits and decreased GHG burdens several issues and concerns need to be addressed In 2005 a total of 19 million metric tons of acetone was produced in the United States (Camara-Greiner 2005) PADD II which overlaps with the US corn belt would most likely to be the location for corn-based
35
butanol plants Production of petroleum acetone in this region in 2005 was 505000 metric tons representing 26 of total US production If bio-acetone were produced from a single simulated bio-butanol plant located in this region the volume of bio-acetone would be about 16 of the total petroleum acetone production in the region and 4 nationwide Furthermore assuming that total bio-butanol production levels could reach a quarter of the production level of corn ethanol of 49 billion gallons (2006) the amount of corn feed used for bio-butanol production could generate 676 million gallons of bio-butanol and 391 million gallons (12 million metric tons) of bio-acetone At this production scale the acetone market would be flooded with both bio- and petroleum acetones dramatically decreasing the market value of acetone Thus one may argue that acetone should be treated as a waste stream (as we did in Case 4) Aside from the fossil energy and GHG benefits (within WTW analysis boundaries) that may result from the production of bio-butanol we should consider the emission of liquid acetone into the environment if acetone is treated as a waste stream On the basis of a value of 0074 g of carbon generated in acetone from each gram of corn if all of the carbons contained in acetone were converted to gaseous CO2 approximately 6900 g of CO2 could be emitted to the atmosphere per bushel of processed corn Acetone-containing water in such high volumes could become a major source of atmospheric VOC and CO2 emissions
Unfortunately the outlook for replacement of petro-chemicals with bio-chemicals is far from clear Petroleum acetone is currently generated as a by-product during phenol production from cumene On average 061 lb of acetone is obtained per pound of phenol produced (SRI Consulting 2005) The United States consumed $21 million metric tons of phenol in 2004 (SRI Consulting 2007) Worldwide the consumption of phenol grows at a rate of 41 per year As demand for phenol continues to rise petroleum acetone will be produced with or without the presence of bio-acetone In the ABE process studied the bio-acetone is also a co-product New technologiesprocesses that significantly reduce the acetone that results from phenol and ABE production are therefore needed In fact at the time of this study DuPont was making considerable progress in molecular biology which led to a patent award for a recombinant bacterium that produces butanol exclusively from biological feedstocks (DuPont 2007) Other potential research directions include exploring the use of acetone as a fuel blend and as a feedstock for new chemicals
36
0
5000
10000
15000
20000
25000
30000
Cra
dle-
to-U
ser F
ossi
l Ene
rgy
Use
(Btu
lb A
ceto
ne)
Petroleum Natural Gas Coal
Corn-Acetone Petroleum-Acetone
FIGURE 10 Fossil Energy Use Based on the Production of Bio-Acetone Compared with Fossil Energy Use Based on the Production of Petroleum Acetone
37
8127 Btu of fossil per lb of corn acetone a) bio-Acetone
Fuel Transport
3 Corn Farming 12
Fertilizer Manufacture
13
Corn Net Transport
Consumption 2 in Production
Plant70
27818 btu of fossil per lb of acetone Feedstock and
acetone
b) Petroleum-Acetone
Acetoneproduction -Co-product
Credit40 Feedstock
production 57
transportation 3
FIGURE 11 Fossil Energy Consumption Breakdown for (a) Bio-Acetone and (b) Petroleum Acetone
38
Cra
dle-
to-U
ser G
HG
Em
issi
ons
(g C
O2-
equi
vlb
ace
tone
)
1500
1000
500
0
-500
-1000 Corn-Acetone Petroleum-Acetone
CO2 CH4 N2O
Net CO2 emission - 304gCO2 equivlb
Net CO2 emission 738gCO2 equivlb if carbon is not sequested
FIGURE 12 GHG Emissions Generated or Avoided by Bio-Acetone Production Compared with Petroleum Acetone Production
39
6 CONCLUSIONS
Our conclusions based on the results of our study include the following
bull Corn-based butanol produced by means of the current ABE process could offer substantial fossil energy savings and moderate reductions in GHG emissions relative to petroleum gasoline on a WTW basis when co-products are credited by energy allocation
bull The energy benefits associated with bio-butanol are significant when coshyproduct corn-acetone is credited with displacement method
bull When acetone is credited by energy allocation life-cycle energy benefits for corn butanol are less promising than those of corn ethanol generated from conventional dry milling processes GHG emissions generated from bioshybutanol life cycle are higher than those generated from corn ethanol
bull From a liquid fuel production standpoint the ABE process examined may not be as effective as conventional corn ethanol production in that it produces less liquid fuel (on an energy basis) per bushel of corn than the corn ethanol process in addition to increased process fuel use in the production plant
bull The impacts of corn-acetone (produced via the ABE process) on the acetone market need to be carefully examined and new uses for bio-acetone need to be explored
40
41
7 REFERENCES
Boustead I 2005 ldquoEco-Profiles of the European Plastic Industry Acetonerdquo Plastics Europe March available at httpwwwplasticseuropeorgContentDefaultaspPageID=392 accessed Dec 2006
Brinkman N M Wang T Weber and T Darlington 2005 GM Study Well-to-Wheels Analysis of Advanced FuelVehicle Systems ndash A North American Study of Energy Use Greenhouse Gas Emissions and Criteria Pollutant Emissions May httpwwwtransportationanlgovpdfsTA339pdf
Collins K 2007 The New World of Biofuels Implications for Agriculture and Energy Presented at EIA Energy Outlook Modeling and Data Conference March Washington DC
Conti J 2007 Annual Energy Outlook 2007 presentation at EIA Energy Outlook Modeling and Data Conference March Washington DC
Dadgar AM and GL Foutch 1988 ldquoImproving the Acetone-Butanol Fermentation Process with Liquid-Liquid Extractionrdquo Biotechnology Progress 4 36ndash39
DuPont 2007 Fermentive Production of Four Carbon Alcohols World Patent Application WO2007041269 USPTO PCTUS2006038007
EIA see Energy Information Administration
Energy Information Administration 2004 httpwwweiadoegovpuboil_gaspetroleum analysis_publicationsoil_market_basicspaddmaphtm accessed May 15 2007
Energy Information Administration 2007 Annual Energy Outlook 2007 DOEEIA-0383(2007) available at httpwwweiadoegovoiafaeopdf0383(2007)pdf accessed May 23 2007
Ezeji TC N Qureshi and HP Blaschek 2004 ldquoAcetone Butanol Ethanol (ABE) Production from Concentrated Substrate Reduction in Substrate Inhibition by Fed-Batch Technique and Product Inhibition by Gas Strippingrdquo Appl Microbiol Biotechnol 63 653ndash658
Ezeji TC PM Karcher N Qureshi and HP Blaschek 2005 ldquoImproving Performance of a Gas-Stripping-Based Recovery System to Remove Butanol from Clostridium Beijerinckii Fermentation Bioprocess Biosyst Eng 27 207ndash214
Guibet J-C 1997 Carburants et Moteurs Technologies Energie Environnement Publication de lrsquoInstitut Franccedilais du Peacutetrole ISBN 2-7108-0704-1
Heckl I Z Kovacs F Friedler LT Fan and J Liu 2006 ldquoAlgorithmic Synthesis of an Optimal Separation Network Comprising Separators of Different Classesrdquo Chemical Engineering and Processing doi101016jcep200606013
42
Huang WC DE Ramey and ST Yang 2004 ldquoContinuous Production of Butanol by Clostridium Acetobutylicum Immobilized in a Fibrous Bed Bioreactorrdquo in Applied Biochemistry and Biotechnology mdash Part A Enzyme Engineering and Biotechnology 113ndash116 887ndash898
Intergovernmental Panel on Climate Change (IPCC) 2001 Climate Change 2001 the Scientific Basis Technical Summary of the Group I Report
Intergovernmental Panel on Climate Change (IPCC) 2007 Working Group I The Physical Basis of Climate Change IPCC WG1 AR4 report available at httpipcc-wg1ucareduwg1 wg1-reporthtml accessed May 23 2007
IPCC see Intergovernmental Panel on Climate Change
Kwiatkowski JR McAloon AJ Taylor F Johnston D 2006 Modeling the process and costs of the production of fuel ethanol by the corn dry-grind process Industrial Crops and Products V23 Issue 3 p288-296
Lacson JG 2004 ldquoPropylenerdquo in Chemical Economics Handbook (CEH) Marketing Research Report SRI Consulting Menlo Park Calif
Liu J 2003 Downstream Process Synthesis for Biochemical Production of Butanol Ethanol and Acetone from Grains PhD Dissertation Kansas State University Manhattan KS
Liu J LT Fan P Seib F Friedler and B Bertok 2004 ldquoDownstream Process Synthesis for Biochemical Production of Butanol Ethanol and Acetone from Grains Generation of Optimal and Near Optimal Flowsheets with Conventional Operating Unitsrdquo Biotechnol Prog 20 1518ndash1527
Liu J LT Fan P Seib F Friedler and B Bertok 2006 ldquoHolistic Approach to Process Retrofitting Illustration with Downstream Process for Biochemical Production of Organicsrdquo Ind Eng Chem Res 45 4200ndash4207
Marlatt JA and R Datta 1986 ldquoAcetone-Butanol Fermentation Process Development and Economic Evaluationrdquo Biotechnology Progress 2 23ndash28
McAloon A 2006 Shelled Corn to Ethanol Process Energy Analysis Aspen + reg MGY Dry Grind Ethanol Process Model ERRCARSUSDA
Morey V et al 2006 Characterization of Feed Streams and Emissions from Biomass GasificationCombustion at Fuel Ethanol Plants American Society of Agricultural and Biological Engineers (ASABE) Presentation Paper Number 064180 July Portland Ore
Mueller S and J Cuttia 2006 Research Investigation for the Potential Use of Illinois Coal in Dry Mill Ethanol Plants prepared by the Energy Resources Center at University of Illinois at Chicago for the Illinois Clean Coal Institute and the Illinois Department of Commerce and Economic Opportunity Oct
43
Mueller S 2006 Energy Resources Center University of Illinois at Chicago Chicago Ill personal communication to May Wu of Argonne National Laboratory Argonne Ill
Natural Resources Canada 2007 ldquoThe Addition of Bio-Butanol to GHGenius and a Review of the GHG Emissions from Diesel Engines With Urea SCRrdquo NRC Report prepared by (SampT)2
Consultants BC Canada
Parekh M J Formanek and HP Blaschek 1999 ldquoPilot-Scale Production of Butanol by Clostridium Beijerinckii BA 101 Using a Low-Cost Fermentation Medium Based on Corn Steep Waterrdquo App Microbiol Biotechnol 51 152ndash157
Qureshi N and HP Blaschek 1999 Economics of Butanol Fermentation Using Hyper-Butanol Producing Clostridium Beijerinckii BA 101rdquo Trans Institution of Chemical Engineers 78 (Part C) 139ndash144
Qureshi N and HP Blaschek 2001a ldquoABE Production from Corn A Recent Economic Evaluationrdquo Journal of Industrial Microbiology amp Biotechnology 27 292ndash297
Qureshi N and HP Blaschek 2001b ldquoRecovery of Butanol from Fermentation Broth by Gas Strippingrdquo Renewable Energy 22 557ndash564
Qureshi N 2007 Bioconversion of Agricultural Residues to Butanol Simultaneous Saccharification Fermentation and Product Recovery Presentation at the 29th Symposium on Biotechnology for Fuels and Chemicals Denver CO
Roddy W 2006 Dry Mill Ethanol Plants Environmental Impacts and Future Growth ICM Presented at Governorsrsquo Ethanol Coalition Feb
SRI Consulting 2005 Chemical Economics Handbook (CEH) Marketing Research Report Menlo Park Calif
SRI Consulting 2007 Chemical Economics Handbook (CEH) Marketing Research Report Menlo Park Calif
White and Johnson 2003 Corn Chemistry and Technology 2nd edition
Wu M Y Wu M Wang 2005 Mobility Chains Analysis of Technologies for Passenger Cars and Light-Duty Vehicles Fueled with Biofuels Application of the GREET Model to the Role of Biomass in Americarsquos Energy Future (RBAEF) Project Argonne National Laboratory Report May available at httpwwwtransportationanlgovpdfsTA344pdf
44
45
APPENDIX
46
47
APPENDIX
A1 PARAMETERS FOR CORN BUTANOL LIFE-CYCLE ANALYSIS
Corn Farming Energy UseFertilizer Use
Nitrogen P2O5 K2O CaCO3
Pesticide Use Herbicide Insecticide
Corn Transportation From Field to Stacks
Truck Share Distance
From Stacks to Plants Truck
Share Distance
Butanol Production Energy Use
Thermal Energy Electricity
Yield Butanol Acetone DDGS
22500 Btubu
420 gbu 149 gbu 174 gbu
1202 gbu
810 gbu 068 gbu
100 10 mi
100 40 mi
115114 Btugal BuOH 176 kWhgal BuOH
150 galbushel 380 lbgal BuOH 1166 lbgal BuOH
Butanol Transportation and Distribution Transportation
Barge Share Distance
Rail Share Distance
Truck Share Distance
40 520 mi
40 800 mi
20 110 mi
GREET corn-EtOH pathway
GREET corn-EtOH pathway GREET corn-EtOH pathway GREET corn-EtOH pathway
GREET corn-EtOH pathway
GREET corn-EtOH pathway GREET corn-EtOH pathway
GREET corn-EtOH pathway GREET corn-EtOH pathway
GREET corn-EtOH pathway GREET corn-EtOH pathway
see report see report
see report see report
see report
see report see report
see report see report
see report see report
48
Distribution Truck
Share 100 see report Distance 30 mi see report
Butanol Combustion in Vehicles On-Road Fuel Economy
245 migal see report
A2 PARAMETERS FOR PETROLEUM-BASED ACETONE ANALYSIS
Energy Use Energy Used as Process Fuel Electricity 031 kWhkg acetone see report
Oil 9337 Btukg acetone see report NG 10678 Btukg acetone see report
Energy Used as Feedstock Oil 12961 kWhkg acetone see report NG 18908 kWhkg acetone see report
Cumene Transportation Truck
Share 100 Distance 323 mi see report Fuel economy 50 migal see report
A3 TRANSPORTATION FOR CORN-ACETONE
Rail Share 100 see report Distance 500 mi see report
Truck Share 100 see report Distance 100 mi see report
A4 FUEL SPECIFICATIONS
Butanol Low heating value 99837 Btugal Density 3065 ggal
Carbon content 65 Acetone
Low heating value 83127 Btugal Density 2964 ggal
Carbon content 62
Energy Systems Division Argonne National Laboratory9700 South Cass Avenue Bldg 362Argonne IL 60439-4815
wwwanlgov
A US Department of Energy laboratory managed by UChicago Argonne LLC
2
On the petroleum supply side the United States relies heavily on foreign oil (137 million barrels per day EIA 2007) The worldrsquos most oil-rich region has become extremely unstable which heightens energy security concerns Furthermore competition for petroleum oil has increased dramatically as a result of rapid economic growth in developing countries Finally exploration production and use of petroleum-based fuels generate greenhouse gas (GHG) emissions which are the primary cause of global warming as confirmed in a recent report prepared by the Intergovernmental Panel on Climate Change (IPCC 2007)
Considering the challenges facing the United States in its continued reliance on fossil-based fuels in the transportation sector many researchers are exploring other alternatives Finding a liquid transportation fuel that (1) can be produced from domestic resources (2) is carbon neutral and (3) has minimal GHG impacts would allow the United States to reduce our dependence on foreign oil and decrease environmental burdens In a recent State of Union address the President stated his goal of displacing 20 of gasoline demand by renewable fuels and vehicle efficiency improvement mdash that translates to 35 billion gallons of biofuels and alternative fuels in 10 years
Following dramatic growth in the ethanol industry corn ethanol (EtOH) production reached a record 49 billion gallons in 2006 Yet this total accounts for only 23 of the total US gasoline supply (in gallons of gasoline equivalent) Even considering a US Department of Agriculture (USDA) projection that corn ethanol production could reach 12 billion gallons by 2017 (Collins 2007) a large gap remains to be filled by biofuels Therefore developments in feedstocks processing technologies and new biofuels are urgently needed if the United States is to meet the Presidentrsquos target of 35 billion gallons per year by 2017
Among potential biofuels butanol (BuOH) produced from starch has gained visibility in recent years as a replacement for gasoline Butanol has unique properties as a fuel The energy content of butanol mdash 99840 Btu per gallon (low heating value [LHV]) mdash is 86 of the energy content of gasoline (on a volumetric basis) and 30 higher than the energy content of ethanol The low water solubility of butanol could minimize the co-solvency concern associated with ethanol consequently decreasing the tendency of microbial-induced corrosion in fuel tanks and pipelines during transportation and storage Butanol is much less evaporative than gasoline or ethanol making it safer to use and generating fewer volatile organic compound (VOC) emissions The majority of butanol used as a chemical is produced from petroleum propylene through the Oxo process (in which synthetic gas [syngas] is reacted with propylene) and its ultimate end use is for surface coatings
The most dominant bio-butanol production process has been acetone-butanol-ethanol (ABE) fermentation ABE fermentation by Clostridium acetobutylicum was the route used to produce butanol during World War II It was phased out when more economical petrochemical routes emerged Now almost all butanol in the world is produced from petrochemical feedstocks Research interest in developing viable ABE fermentation processes has been rekindled recently as a result of the pursuit of non-fossil-based feedstocks
In the past 20 years research and development (RampD) efforts have focused on various aspects of the ABE process Molecular biology research has achieved major breakthroughs in
3
strainmutant development that dramatically improved microbial tolerance to butanol toxicity which resulted in a significant increase in ABE solvent production yield Experimental and computational engineering efforts have included designing new schemes to minimize butanol inhibition by using new fermentor configurations improved downstream processing and process integration Huang et al (2004) reported an experimental process that uses continuous immobilized cultures of Clostridium tyrobutyricum and Clostridium acetobutylicum to maximize the production of hydrogen and butyric acid and convert butyric acid to butanol separately in two steps This process reportedly produced butanol at a rate of 464 grams per liter of fermentation medium per hour (gLh) and used 42 glucose compared with the up-to-25 glucose use rate in traditional ABE fermentation by Clostridium acetobutylicum alone
In the early 1990s Clostridium beijerinckii BA101 was developed by using chemical mutagenesis together with selective enrichment which is able to produce twice as much butanol as its parent strain (US Patent 6358717) Extensive studies have been performed to characterize this strain and develop an ABE process with various feedstocks and evaluate technologies for downstream product separation (Qureshi and Blaschek 1999 Parek et al 1999 Qureshi and Blaschek 2001a and 2001b) Experimental and pilot-scale ABE fermentation processes by this organism resulted in up to 951 glucose utilization in fermentation Using in-situ gas stripping for solvent removal from fermentor minimizes product inhibition and enables higher feed concentration mdash up to 500gL of glucose (Ezeji et al 2004) Solvent production in this process in a fed-batch mode reached 65351 of butanolacetoneethanol by weight which is a significant increase in butanol production from 631 in conventional ABE process
Liu (2003) presents an exhaustive survey of major research findings on ABE downstream processing Recent studies have focused on integration of fermentation and product removal through in-situ gas stripping and fermentation gas recirculation (Qureshi and Blaschek 2000 Qureshi and Blaschek 2001a Qureshi and Blaschek 2001b Ezeji et al 2004 and Ezeji et al 2005) The latest development includes a DuPont patent (2007) describing a strain that produces butanol from biological feedstocks while minimizing acetone production Cellulosic feedstock for butanol production has also been reported (Qureshi et al 2007)
Researchers have employed computer simulations in developing butanol production processes including ABE fermentation The earliest efforts in downstream processing simulation of ABE fermentation were reported in Marlatt and Datta (1986) and Dadgar and Foutch (1988) In these studies simulations were used to evaluate the economics of their processes More recent studies were published in Liu (2003) and Liu et al (2004 and 2006) In these studies downstream processing systems were synthesized simulated and optimized in terms of cost There are comparatively few publications on ABE fermentation process simulation A corn-toshybutanol pathway has been modeled by NRC (Natural Resources Canada Feb 2007) recently on the basis of earlier work of conventional ABE fermentation The study examined corn-based butanol used as 10 butanol in a gasoline blend to fuel light-duty vehicles Simulation results for fuel ethanol produced from corn via dry milling such as those obtained by using USDArsquos dry mill model (Kwiatkowski et al 2006 McAloon 2006) are readily available
Since 1995 with support primarily from DOErsquos Office of Energy Efficiency and Renewable Energy Argonne has been developing the Greenhouse Gases Regulated Emissions
4
and Energy Use in Transportation (GREET) model Argonne released the first version of the model mdash GREET 10 mdash in June 1996 GREET is a Microsoftreg Exceltrade-based multidimensional spreadsheet model that addresses the well-to-wheels (WTW) analytical challenges associated with transportation fuels (including ethanol) and vehicle technologies The latest version mdash GREET 17 mdash is capable of analyzing more than 100 transportation fuel pathways and 75 vehiclefuel systems (Brinkman et al 2005) The GREET model has been updated frequently to reflect new feedstocks processing technologies fuels and vehicle systems For a given vehicle and fuel system GREET separately calculates
bull Consumption of total energy (energy in non-renewable and renewable sources) fossil fuels (petroleum natural gas and coal combined) petroleum natural gas and coal
bull Emissions of carbon-dioxide (CO2) -equivalent GHGs mdash primarily CO2 methane (CH4) and nitrous oxide (N2O) and
bull Emissions of six criteria pollutants VOCs carbon monoxide (CO) nitrogen oxides (NOX) particulate matter measuring 10 micrometers or less (PM10) particulate matter measuring 25 micrometers or less (PM25) and sulfur oxides (SOX)
These criteria pollutant emissions are further separated into total and urban emissions
This study was an attempt to evaluate the potential of the recent ABE process from a life-cycle perspective This estimate provides a life-cycle analysis (LCA) of the production and use of corn-derived bio-butanol as transportation fuel to displace petroleum gasoline First we developed an ABE process simulation model by using Aspen Plusreg We used the energy and mass balance resulting from the Aspen Plusreg simulation as a basis for a life-cycle analysis of corn-based butanol production and use We estimated the life-cycle energy and GHG emissions impacts of corn-based butanol (produced via the ABE process) when used to displace gasoline as a transportation fuel in LDVs We also performed a ldquocradle-to-userrdquo analysis for bio-acetone (which is co-produced with bio-butanol) to address the impacts of displacing petroleum-based acetone with the bio-acetone co-product Merits and shortfalls of such process are discussed in this report
5
2 LCA SYSTEM BOUNDARY AND ANALYSIS SCENARIOS
21 SYSTEM BOUNDARY
Figure 1 depicts the GREET modeling boundary for this study The life cycle of bioshybutanol is divided into five stages
1 Corn farming 2 Corn transportation 3 Bio-butanol production 4 Bio-butanol transportation and distribution and 5 Bio-butanol use in gasoline vehicles (GVs)
FIGURE 1 Schematic Representation of WTW Analysis System Boundaries for Butanol Ethanol and Gasoline
6
The bio-butanol life cycle begins with the manufacture of fertilizer and farming machinery Corn farming operations include irrigation tillage application of fertilizer lime herbicides and pesticides and corn harvest Harvested corn grain is transported via barge rail and truck to fuel production facilities where it undergoes biochemical (BC) processing for fuel production The demand for heat and power (steam and electricity) from the BC processing is met by grid electricity and natural gas (NG) Liquid fuel is then transported to refueling stations via rail barge and truck We assumed that bio-butanol would be used in unblended form in GVs The gasoline life cycle on the other hand begins with crude oil recovery in oil fields and ends in gasoline combustion in GVs The timeframe for the analysis is 2010
22 ANALYSIS CASES
This study analyzes a facility that TABLE 1 Properties of ABE Productsa
produces 150000 metric tons of bio-butanol per year requiring 33 million bushels of corn mdash equivalent to an 89-million-gallon-per-year LHV Density
Product (Btugal) (ggal)(MMGY) corn ethanol dry mill Corn-derived butanol (bio-butanol) is produced from Acetone 83127 2964 fermentation that co-produces acetone butanol Butanol 99837 3065 and ethanol (ABE) plus a small amount of fatty Ethanol 76330 2988 acids The corn-derived butanol is assumed to Gasoline 116090 2819 displace gasoline in GVs on the basis of the DDGS 8703 (Btulb) similarities in the properties of the two fuels (Table 1)
a Sources Acetone and butanol J-C Guibet 1997 ethanol and gasoline GREET DDGS (distillerrsquos dried grains with solubles)
Because current bio-butanol production Morey et al 2006 technology is still in the early stages of research and development we assumed a 2010 timeframe for a large-scale demonstration plant During bio-butanol production a large amount of acetone is generated as a co-product Corn-based acetone could displace petroleum-based acetone We established cases to compare biofuel butanol and biochemical acetone with their petroleum counterparts For bio-butanol we conducted a full life cycle (or WTW) analysis for bio-acetone we elected a ldquocradle-to-userrdquo approach because of limited use data available in the open literature The cradle-to-user analysis includes feedstock farming and transportation bio-acetone production via ABE process and acetone transport to user gate Thus we established a total of seven cases
bull Case 1 Conventional gasoline (baseline fuel)
bull Case 2 Bio-butanol with natural gas as the process fuel where bio-acetone is regarded as a chemical to displace petroleum-based acetone and is therefore credited by product displacement Distillerrsquos dried grains with solubles (DDGS) and ethanol displace animal feed and gasoline respectively
7
bull Case 3 Bio-butanol with natural gas as the process fuel where acetone and DDGS are regarded as energy products and are thus credited on the basis of the energy allocation method among butanol acetone ethanol and DDGS
bull Case 4 Bio-butanol with natural gas as the process fuel where acetone is regarded as waste and therefore no acetone credit is assigned DDGS and ethanol displace animal feed and gasoline respectively
bull Case 5 Corn ethanol from dry milling with natural gas as the process fuel where DDGS is credited by product displacement to displace animal feed (GREET default)
bull Case 6 Corn ethanol from dry milling with natural gas as the process fuel where DDGS is regarded as an energy product and is credited on the basis of the energy allocation method between ethanol and DDGS
bull Case 7 Cradle-to-user petroleum-acetone (baseline chemical) analysis for examining displacement of petroleum acetone by bio-acetone Butanol DDGS and ethanol are credited by product displacement
We established a bio-butanol life-cycle framework on the basis of Aspen Plusreg process simulation and existing GREET as shown in Figure 1 We adopted feedstock corn farming and transportation values from GREETrsquos corn ethanol pathway Bio-butanol is produced together with acetone and ethanol from a corn dry mill by retrofitting the mill to accommodate the ABE fermentation and separation process The bio-butanol production process is simulated by using the Aspen Plusreg model We approximated the other process steps (grain feed handling cooking and DDGS drying) on the basis of a corn dry mill cost model from USDA (Kwiatkowski et al 2006 McAloon 2006) and results from a recent study (Mueller and Cuttia 2006) Data from these sources and Aspen Plusreg simulations were then integrated and scaled to obtain the entire bio-butanol plant mass and energy flow Data from the mass and energy balance of the bioshybutanol plant serve as input parameters to the GREET model for the WTW analysis
We estimated the energy consumption (of both petroleum oil and fossil energy) and the emissions of GHGs (CO2 N2O and CH4) that occurred over the entire fuel cycle Energy and emissions were partitioned to all products resulting from the process according to either the displacement or the energy allocation method (see Section 43) Finally we determined fuel transportation and vehicle operation parameters to complete the bio-butanol fuel life cycle We then compared scenarios for bio-butanol and ethanol produced from conventional corn dry mills to gasoline Section 44 addresses the cradle-to-user analysis of bio-acetone
8
9
3 ASPEN PLUSreg SIMULATION OF THE ABE PROCESS
The simulation of ABE fermentation and downstream processing was completed by using Aspen Plusreg and Microsoft Excelreg Section 31 presents the basis of this simulation including scope plant capacity and product specifications Section 32 presents an overview of the simulated process upstream raw material processing is also included to provide the context for the simulated process Mass and energy balances derived from the ABE fermentation and downstream processing simulation are presented at the end of Section 33 The results are further integrated into the whole plant to include corn grain pretreatment saccharification and DDGS drying Section 41 presents the energy balance of the bio-butanol plant
31 SCOPE AND METHOD
The bio-butanol plant produces butanol from corn via ABE fermentation Our Aspen Plusreg simulation is based on two data sources For the portion of the process upstream from ABE fermentation (ie grain pre-treatment liquefaction and saccharification) we adopt the results from a USDA Aspen Plusreg simulation model for a corn dry mill (Kwiatkowski et al 2006 McAloon 2006) because the upstream results of fermentation would be similar to those of a corn dry mill and can therefore be modeled the same way For a similar reason co-product DDGS drying is simulated after the USDA model
For the second half of the process including ABE fermentation and downstream processing the ASPEN simulation was completed on the basis of the research results from a pilot-scale ABE fermentation plant (Ezeji et al 2003 and 2004) and from literature (Liu 2003 Liu et al 2004 2006 Heckl et al 2006) The production capacity of this plant was set at 150000 metric tons per year of butanol The operation runs 315 days per year Product and by-product specifications were as follows butanol purity 995 by weight (wt) acetone purity 995 wt and ethanol purity 995 wt
32 OVERVIEW OF ABE PROCESS
The ABE fermentation simulation describes a process developed by Qureshi and Blaschek (1999 2001a b) Acetone butanol and ethanol (ABE) are produced by a hyper-butanol-producing strain (C beijerinckii BA101) Corn is fed into a conventional corn dry mill for conversion to glucose through liquefaction and saccharification The glucose is fermented to ABE through a fed-batch system After fermentation the ABE compounds are removed by means of in-situ gas stripping ABE products are recovered through molecular sieve adsorption and a three-stage distillation that separates the acetone butanol and ethanol Solids and biomass that are removed from grain processing and fermentation undergo centrifugation and proceed to drying along with syrup from distillation DDGS generated from drying is used as animal feed The following subsections provide brief descriptions of the process for producing butanol from corn The process consists of three main parts grain pre-treatment (receiving liquefaction and saccharification) fermentation and gas stripping and downstream processing
10
321 Grain Receiving Liquefaction and Saccharification
This section describes of the portion of the conventional dry grind ethanol process that begins with receipt of grain and ends with saccharification as modeled in the USDA Aspen Plusreg simulation of the corn ethanol process (Figure 2) We use the data derived from this part of the corn ethanol process in the USDArsquos 40-mmgy dry mill model to simulate the ABE fermentation process except we scaled the capacity from 40 MMGY of ethanol to 150000 metric tons of butanol per year
Corn brought into the plant site is first separated from finer particles and foreign objects by using a blower and screens The cleaned dry corn is ground in a hammer-mill and weighed to control the feed rate to the process In the liquefaction step the ground corn is then mixed with water thermo-stable alpha-amylase ammonia and lime in a slurry tank
A steam injection heater is used to gelatinize the starch which is then hydrolyzed by the alpha-amylase into oligosaccharides The stream is then ldquocookedrdquo and transferred to the saccharification tank where the oligosaccharides are converted by glucoamylase to glucose at a temperature of 61degC The slurry is then transferred to an evaporator to concentrate the feed to the desired level for ABE fermentation
Corn Grind
Cook
Liquefy
Saccharify
Alpha-amylase
Glucoamylase
Sulfuric Acid
To Evaporation andFermentation
FIGURE 2 Schematic for Grain Receiving Liquefaction and Saccharification
11
322 Fermentation and In-Situ Gas Stripping
The information in this section is based on the research results from Qureshi and Blaschek (2000 2001a b) Ezeji et al (2004) and Ezeji et al (2005)
The literature reported that the strain C beijerinckii BA101 can produce butanol in a range of sugar concentrations from 454 to 500 gL Because typical sugar concentration in fermentation feed is 3ndash7 (White and Johnson 2003) in a corn ethanol plant it is desirable to concentrate this stream which provides a means to integrate the grain processing in corn dry milling with the ABE process we modeled Further it could potentially reduce energy demand associated with removing water from ABE products in downstream processing (Operational issues with respect to the concentrated feed will be discussed later in this section) The stream that departs from saccharification goes to an evaporator to concentrate the sugar to 430 gL before entering ABE fermentation Alternative technologies to provide concentrated feed are available and could be used Nevertheless this step represents a large amount of heat demand and a capital cost Our Aspen Plusreg simulation begins at this step The slurry feed generated from evaporation is then cooled to 35degC and introduced to the oxygen-free fermentation vessel which has been inoculated with C beijerinckii BA101 The temperature is controlled at 35degC and no pH adjustment is applied during the process
ABE fermentation is operated in a fed-batch mode ABE production typically starts with a lag phase and gradually increases its rate until the ABE concentration reaches a plateau before it finally decreases (Ezeji et al 2004) A gas mixture of carbon dioxide (CO2) and hydrogen (H2) is also generated from the fermentation This gaseous mixture is recirculated via a gas pump to maintain a head pressure that ensures the anaerobic environment necessary for the microorganism ABE products are removed by in-situ stripping from the fermentor by using the gaseous mixture from fermentation At start-up the fermentation proceeds for 22 h until ABE reaches about 5 gL and then gas stripping is applied The ABE vapors that are stripped from the fermentor enter a condenser above the fermentor and the ABE vapors are cooled to 10degC and condensed to liquids leaving uncondensed CO2 and H2 in the vapor phase to be recirculated Excessive CO2 and H2 are vented to the atmosphere after passing through a CO2 scrubber The gas stripping captures most of the butanol acetone and ethanol produced during fermentation The selectivity of the stripping for butanol defined as
[y(1ndashy)][x(1ndashx)]
where x = wt of butanol in fermentation broth and y = wt of butanol in condensate
is set at 20 (Qureshi and Blaschek 2001b) Accordingly about 25 wt water is present in the condensate the water will be removed from the product and by-products in the downstream processing stage
Microbial reaction mechanisms for the conversion of glucose to ABE have not been fully understood and characterized In principle the following biochemical reactions could describe the ABE fermentation
12
C6H12O6 rarr C4H10O (butanol) + CO2 + H2O C6H12O6 + H2O rarr C3H6O (acetone) + CO2 + H2 C6H12O6 rarr C2H5O (ethanol) + CO2 + H2 C6H12O6 rarr C4H8O2 (butyric acid) + CO2 + 2H2 C6H12O6 rarr C2H4O2 (acetic acid)
The reactions represent a qualitative measure rather than stoichiometric quantitative relationships for the ABE conversion process The microbial cell growth was not included in any of the reactions above In our simulation the extent of ABE conversion is set according to literature value reported from experimental tests Glucose utilization is 951 (ie 49 glucose is converted into biomass solids as a result of microbial growth) Butanol acetone ethanol acetic acid and butyric acid yields are 0303 0155 00068 00086 00084 gg glucose respectively (Table 2)
As we noted earlier in this section integrating the conventional corn ethanol dry mill process with the new ABE process requires closing a gap in the concentration of the sugar feed to the fermentor between the two processes Feed for the ABE fermentation process contains a sugar concentration of up to eight-fold as high as that of conventional corn ethanol process which suggests a small footprint for a fermentation and downstream processing unit and therefore lower capital expenditure and lower energy demand for downstream separation However at such a concentration the solids could build up to 55 (wtwt) or higher in the fermentor In comparison the level of solids in corn ethanol fermentation is roughly 20 (wtwt) The level of solids in ABE fermentation broth means increased viscosity which could result in inhibitory stress on microorganisms and operational difficulties In addition feed to a fermentor in a corn dry mill usually contains corn fiber which could exhibit mass-transfer limitation during gas stripping The net result could be increased energy consumption for gas stripping or reduced product removal efficiency by stripping Data in the literature are mostly based upon relatively pure glucosenutrient feed in which mass transfer may not be limiting The operability and mass-transfer issues in fermentation for the corn-to-butanol process should therefore be examined carefully For comparison we estimated a case with diluted feed to the fermentor (no evaporation) which is similar to the fermentation feed in an existing corn ethanol plant
Another uncertainty is that ABE fermentation requires a pure form of starch that is similar to starches produced from a wet milling process Additional steps to purify dry milling starch will be necessary to integrate the dry mill with the ABE fermentation Unfortunately at the time of this study available data were limited to pilot-scale testing and the corn-to-butanol ABE process is not well established We did not including starch purification step Our analysis will be updated once these issues have been addressed and data become publicly available
323 Downstream Processing
The liquid fermentation broth from the condenser is subject to a series of distillation operations in which the stream is separated into product based on their volatilities 995 wt pure butanol 995 wt pure acetone and 995 wt pure ethanol In a mixture containing
13
butanol ethanol and water homogeneous ethanol-water azeotrope and heterogeneous water-butanol azeotrope are formed In descending order of their volatilities the components in the stream (including the two azeotropes) to be separated by the downstream processing are acetone azeotrope of ethanol and water ethanol azeotrope of water and butanol water and butanol The components in this sequence could plausibly be separated simply by fractional distillation achieved by various simple andor complex column configurations into any two or more subsequences of components at the adjacent components that have sufficiently different volatilities
The fermentation broth is first fed to the first distillation tower where a composition cut is made to separate acetone ethanol and water from the broth These components are sent to the top stream and the butanol (together with a trace amount of water) goes to the bottom stream The product butanol is 995 wt pure and suitable for transportation fuel use The top stream is sent to a second distillation tower where acetone is concentrated purified and then sent out from the top The bottom stream containing mainly ethanol and water is subject to further separation in a third distillation tower where the azeotropic vapor of 944 wt ethanol and 53 wt water (and 2 wt acetone) is withdrawn from the top and sent to an adsorption unit The water stream from the bottom is sent back to the fermentor Water in the top stream is adsorbed in this unit and ethanol purity in the product stream reaches 995 (the minimum purity required for ethanol to be blended with gasoline and used in vehicles)
The adsorption unit consists of two adsorption columns that run cyclically between the adsorption and desorption phases Molecular sieves are packed in the column as the adsorbents The sieves consist of a microporous substance designed to separate small polar molecules from larger nonpolar ones via a sieving action Water molecules are trapped and adsorbed inside the microporous beads while the ethanol molecules flow around them Molecular sieves are then regenerated by heat and carrier air Figure 3 presents the schematic of the adsorption and adsorbent regeneration process
33 PROCESS FLOWSHEET SIMULATED BY ASPEN PLUSreg
331 ABE Process Flowsheet
This simulation attempts to address the potential of the new ABE fermentation with an in-situ stripping process by using the best of the process value reported The ABE fermentation and downstream processing (separation) model from this study was integrated with the upstream grain processing component of the USDArsquos corn dry mill model and scaled to the 150000-metric-ton-per-year bio-butanol production level Figure 4 shows the Aspen Plusreg
output of the process flowsheet from fermentation to downstream processing Data for the simulation of fermentation and gas-stripping unit operations are based on the research results from Qureshi and Blaschek (2000 2001ab) Ezeji et al (2004) and Ezeji et al (2005) Table 2 summarizes the main parameters for fermentation and gas stripping input to the Aspen Plusreg
simulation
14
995 Ethanol
Atmospheric air Hot Regen
air
Regeneration
Azeotrope stream of ethanol and water
Blower
FIGURE 3 Schematic Representation of Adsorption and Adsorbent Regeneration
The downstream processing flowsheet in the simulation is based on the most cost-effective flowsheet rigorously generated from an exhaustive list of plausible processing equipment and unit operations as described in Liu (2003) Liu et al (2004 2006) and Heckl et al (2006) According to their studies this optimal flowsheet consists of a gas stripper that isolates a liquid product stream from the fermentation broth an adsorption unit that removes the majority of water and a set of distillation columns that purifies the butanol ethanol and acetone products The studies show that the cost of this flowsheet is at least 125 lower than that of any other alternative flowsheet Energy use for the regeneration of the molecular sieve adsorbents is calculated off-line The calculation presented in Section 332 is then incorporated into the simulation by using a Fortran subroutine
Shortcut methods that highlight the mass and energy balances are chosen for simulating most of the unit operations in the process Heat integration between the three distillation columns is taken into consideration Our simulation did not include stream recycling and simple unit operations (such as valves) we also did not examine different distillation column configurations
The combined Aspen Plusreg model provides the material balance for the bio-butanol plant as shown in Table 3 Table 4 lists the yields of acetone butanol and ethanol from the bioshybutanol plant (in gallon per bushel [galbu] of corn) Steam and electricity use for the ABE process (Table 5) indicates that using concentrated feed for ABE fermentation could save 14 of steam needs in comparison with using existing feed in a dry mill Among the reductions in steam needs 75 of those reductions come from distillation Section 41 presents the energy balance for the bio-butanol plant from gate to gate
15
GASPUMP
DISCHARG
ETOH
ADSBWST1
BTOH
ACETONE
WATER
215WATER GASPROD
GASSTRPR
CONDNSR PHSSEPR
ADSORBR1 DIST1
DIST2 FERMENTR
DIST3
EV01
FIGURE 4 Aspen Plusreg Output of the Process Flowsheet from Fermentation to Downstream Processing
16
TABLE 2 Main Input Parameters for Fermentation and Gas Stripping for Aspen Plusreg Simulations
Value Used in Input Parameter the Simulationa
Fermentor operating temperature (degC) 35
Fermentor operating pressure (atm) 1
Acetone 0155 Butanol 0303 Ethanol 00068
Yield (gram ABE (total) 0465 gram glucose) Acetic acid 00086
Butyric acid 00084 Hydrogen 0021 Carbon dioxide 06954
Gas stripping carrier gas Fermentation gas Gas stripping selectivity for butanol 200 Condensation temperature (degC) 2
a Sources Ezeji et al (2004) Qureshi et al (2001b)
TABLE 3 Material Balance of Bio-Butanol Plant
Parameter Value Source
Feed grain moisture content () 15 USDA dry mill model (Kwiatkowski et al 2006
Corn grain feed rate (lb cornh) 237338 McAloon 2006) Aspen Plusreg results scaled up from USDA dry mill model (Kwiatkowski et al 2006 McAloon
Glucose feed rate to fermentor 154871 2006) Aspen Plusreg simulation (this study)
(lbh) Production (lbh) Aspen Plusreg simulation (this study)
Acetone 23997 Butanol 42728 Ethanol 1032 DDGS 73816
DDGS moisture content () 11
17
TABLE 4 Yields of Acetone Butanol and Ethanol from Bio-Butanol Plant
Product Yield
(galbu corn) Energy
(Btubu corn) Energy Output Share
()
Acetone Butanol Ethanol Total
0868 1495 0037 24
69525 149267
2828 221621
314 674
12 100
TABLE 5 Process Fuel Use for ABE Fermentation and Downstream Processing
Diluted Sugar Feed to Fermentora
Process Step Steam (Btuh) Electricity (kW) Steam (Btuh) Evaporator 278653091 0 Fermentor agitator 19273 Condenser 310540 Gas pump 6104 Gas stripper 1307400 1412700 Adsorption feed pump 024 Distillation Column 1 43220100 68173300 Distillation Column 2 62665700 374388000 Distillation Column 3 5730860 10891300 Distillation 2 feed pump 040 Distillation 3 feed pump 003 Adsorbent regeneration -729205 23733 -729205
a Existing fermentation feed such as those from corn dry mill used for ABE fermentation
332 Estimate of Energy Use for Adsorbent Regeneration
The heat use for the regeneration of adsorbents is calculated as the total amount required to bring the system mdash which includes the adsorption column the molecular sieves adsorbed water and the carrier gas mdash to a temperature of 500degF An electric heater provides the energy requirement for absorbent regeneration The system is cooled by exchanging the heat with the process streams fed to the distillation towers (assuming a loss factor of 10) Therefore the energy used to cool the system is not taken into account The weight of water that the molecular sieves adsorb is set at 22 of the weight of the molecular sieve The peak concentration of water in the carrier air is set at 17 wt The adsorption and regeneration cycle time is set at 8 h The amount of heat required to bring the column to the specified temperature is calculated by using a method based on logarithmic mean temperature difference (LMTD) and the scaling of experimental data The radiation loss factor for heater is set at 5 Other major parameters for the calculation are listed in Table 6
18
TABLE 6 Parameters for Calculating Energy Use for Adsorbent Regeneration
Water Adsorbed Inside Molecular Adsorption Carrier Gas mdash
Parameter Sieves Molecular Sieves Column Air
Amount (lbh) 556 20200 na 33330 Cp (btulbdegF) 10 02 na 02 T1 (degF) 1750 1750 1750 1750 T2 (degF) 5000 5000 5000 5000 ΔT (degF) 3250 3250 3250 3250 Q (Btuh) 180538 1509950 3437061 2588908 Total (Btuh) 8102279
19
4 BIO-BUTANOL LIFE-CYCLE ASSESSMENT
41 BIO-BUTANOL PLANT ENERGY REQUIREMENTS
We assume that the bio-butanol plant uses natural gas as process fuel to generate steam and purchases electricity from the grid Our process fuel estimate for the butanol plant is based on three sources (1) the Aspen Plusreg simulation of ABE fermentation and downstream processing from this study (2) a recent study by Mueller and Cuttica (2006) of process fuel use in corn ethanol dry mills and (3) the USDA corn dry mill model (Kwiatkowski et al 2006 McAloon 2006) Aspen Plusreg results from this simulation generate process fuel use values for ABE fermentation and downstream processing (Table 5) Considering the similarity in upstream grain processing between corn ethanol and corn butanol process in this study we adopted the grain processing and DDGS drying steps from USDA dry mill model scaling-up the corn feed for the bio-butanol plant Thus the heat and power needs in the rest of the plant (for cooking the regenerative thermal oxidizer [RTO] and DDGS drying) are based on sources (2) and (3)
An estimate of process fuel (natural gas) use for cooking DDGS drying and RTO in the corn butanol plant was based on the amount of corn feed processed in the following steps We first converted the energy input per gallon of ethanol to energy input per bushel of corn feed at a yield of 272 gallons of denatured ethanol per bushel of corn We then converted this value to energy use per gallon of bio-butanol with a bio-butanol yield of 150 gallons per bushel of corn (Table 4) for each process step above In a conventional corn ethanol dry mill water is removed from WDG (solids from grain processing) and syrup (solids from distillation) at the drying step and from ethanol via distillation The ABE fermentation process described in this study partially removes water before fermentation to concentrate feed sugar content Therefore it is likely that less water will be removed at downstream processing and DDGS drying which means lower energy demand Another parameter that has not been fully evaluated and reported is DDGS yield from the corn-to-butanol ABE process and its quality We assume equivalent heating demands for DDGS drying in the ethanol plant and in the butanol plant Table 7 details the calculations of natural gas use in the bio-butanol plant This steam demand is met by using a natural-gas-fired steam boiler with 80 efficiency to produce 150-psi medium-pressure steam
Electricity demand for the bio-butanol plant was estimated in a similar way According to the ethanol plant study by Mueller and Cuttica (2006) the average electricity use in corn ethanol plants is 075 kWh per gallon of ethanol which agrees with the value estimated by an ethanol plant designer (Roddy 2006) while it is slightly higher than the 073 kWh per gallon of ethanol suggested by the USDA model We used the former estimate in this analysis to reflect the current industry average Electricity used for fermentation and distillation in the corn ethanol plant was displaced by that for ABE fermentation and downstream processing The power consumption value was converted from per gallon of ethanol to per gallon of butanol via per bushel of corn on the basis of 272 gallons of EtOHbushel and 150 gallons of bio-butanolbushel Table 8 summarizes the major assumptions and data sources for power use in the bio-butanol plant
c
20
TABLE 7 Thermal Energy Requirements in Bio-Butanol Plant
Process Steps
EtOH Plant NG Required (Btugal denatured EtOH)
BtOH Plant NG Required Based on
Feed Corn (Btubu corn)c
BtOH Plant NG Required Based on
BtOH (Btugal BtOH)d
Cooking 10013ab 27236 18216 Dryer and RTOe
ABE fermentationf
and processing
10830 29458 19703 77195
BtOH plant total 115114
a Source Mueller (2006) 231 total process fuel for cooking 265 for EtOH processing Therefore cooking fuel use is 231(231 + 265) = 4657 of total fuel used in ethanol processing (excluding DDGS drying)
b The total thermal fuel requirement for cooking fermentation and distillation is 21500 Btugal denatured EtOH in a 100-MMGY ethanol dry mill Source Mueller and Cuttica (2006) NG needed for cooking is 4657 times 21500 Btugal = 10013 Btugal EtOH Assumed corn ethanol yield 272 galbu (denatured)
d Corn butanol yield 150 galbu of corn e Source Mueller and Cuttica (2006) f Aspen Plusreg results from this study includes heat for evaporation fermentation distillation and gas
stripping
TABLE 8 Electricity Consumption in Bio-Butanol Plants
BtOH Plant BtOH Plant EtOH Plant Electricity Required Electricity Required
Electricity Required Based on Feed Corn Based on BtOH Item (kWhgal EtOH) (kWhbu) (kWhgal BtOHa)
EtOH plantb 075 204 EtOH plant excluding 068c 184 123 fermentation and distillation ABE fermentation and 053d
separation BtOH plant total 176
a Converted from kWhbu to kWhgal BtOH with a corn butanol yield of 150 galbu b Source Mueller and Cuttica (2006) Converted to per bushel with an assumed corn ethanol yield of 272
gal denatured ethanolbu Calculated on the basis of USDA dry mill model fermentation requirement 006 kWhgal EtOH and 001 kWhgal for distillation are subtracted from 075 kWhgal EtOH
d Electricity needs from ABE fermentation and separation Aspen Plusreg results from this study
c
21
Scale-up from pilot test to full-scale commercial production could change the yield and energy consumption These factors affect the overall bio-butanol production and energy use estimates
42 BUTANOL LIFE-CYCLE PARAMETERS
Bio-butanol in this study is produced from corn It would be economical for the bioshybutanol plant to be built near corn farms to reduce transportation costs Operations associated with corn farming and feedstock transportation would be similar to those for corn Bio-butanol produced from corn will displace gasoline therefore transportation storage and distribution of bio-butanol would be similar to those of ethanol Table 9 presents key assumptions and GREET inputs for the bio-butanol life-cycle analysis Electricity for the bio-butanol plant is supplied from the US electric generation mix (Table 10)
TABLE 9 GREET Input Parameters for Corn Butanol WTW Analysis Corn Farming Transportation of Corn and Butanol and Vehicle Operation
Parameters Assumptions
Corn yield (buharvested acre) 158 Ratio of harvested acreage to planted 09 acreage Fertilizer use (gbu) N = 420 P2O5 = 149
K2O = 174a
CO2 emissions from potential land use 195 changes of farming (gbu) Lime use (gbu) 1202 Corn transportation mode and distance (mi) Truck (100) 50 Butanol transport and distance (mi) Barge (40) 520 Rail (40) 800 Truck (20) 110 On-road fuel economy of LDVs fueled with 248 bio-butanol (migal gasoline equivalent)
a N = nitrogen P2O5 = phosphorus fertilizer and K2O = potash fertilizer
22
To clearly show the energy and emission TABLE 10 US Average Electricity effects of bio-butanol vs gasoline we assumed in this Generation Mix Used in this Studya
study that bio-butanol is used in pure form in GVs and that butanol could achieve the same fuel economy per gallon gasoline equivalent as gasoline-powered Source Percent of Total
GVs (Table 9) WTW results are expressed in a per-million-Btu fuel matrix for comparison In reality Residual oil 27
bio-butanol may be used in various gasoline blends Natural gas 189
The per-million-Btu base system is more appropriate Coal 507
from a fuel supply perspective Because energy and Nuclear power 187
emission results are presented in Btu or grams per Biomass 13
million Btu of fuel produced and used the effects of Others 77
differences in fuel economy are removed a Source GREET year 2010
43 CO-PRODUCT CREDIT
During bio-butanol production several co-products are generated along with butanol mdash these include acetone DDGS a small amount of ethanol fatty acids (butyric acid and acetic acid) and H2 gas On the scale that we analyzed acetone is the major co-product of the bioshybutanol plant with 82000 metric tons produced per year Acetone contributes to more than one-half (by weight) of the butanol production The bio-butanol plant also generates 253600 metric tons of DDGS (11 moisture) per year mdash the second large co-product The yield of ethanol is relatively small (Tables 3 and 4) (similar to the level of fatty acid mixtures) Ethanol yield from ABE fermentation accounts for 15 of total ABE (acetone butanol and ethanol) by weight and only 12 by energy content (Btubu of corn) (Table 4) Although the fatty acids could be separated further purified from the liquid discharge stream and sold for use in the chemical market the separation step has not yet been tested with ABE fermentation In this Aspen Plusreg
simulation the fatty acids were not separated and purified and so they were not treated as coshyproducts
Significant amounts of H2 and CO2 gas were produced from fermentation these gases were used internally for gas stripping and then for maintaining anaerobic conditions for ABE fermentation The H2 could be separated as a fuel product if high-purity nitrogen gas is used in place of fermentation gas However using such nitrogen gas to maintain anaerobic conditions and for stripping in large-scale operation could be cost prohibitive Further studies to evaluate the engineering economics of alternative approaches for process operation while economically producing bio-butanol and hydrogen would be beneficial In this initial attempt to address the life cycle of bio-butanol H2 was not considered as a co-product
We partitioned total energy and emissions into bio-butanol and the co-products by using two methods product displacement and energy allocation Co-product displacement (Case 2) is based on the concept of displacing the current product with the new product In this case bioshyacetone is regarded as a renewable chemical The energy consumed and the emissions that occur during bio-acetone production displace the energy and emissions associated with petroleum-based acetone production Energy and emission accredits from the acetone displacement are
23
assigned to bio-acetone Similarly DDGS generated from corn butanol production contains 267 protein by weight which is close to the amount of protein contained in the DDGS from the corn ethanol process With the assumptions that the nutritional values of DDGS from the two processes are similar the DDGS from the bio-butanol plant displaces traditional animal feed (soy protein and corn) the production pathway of which is already in place in GREET
The limitation of using the displacement method for the bio-butanol life-cycle analysis is the large amount of acetone that is co-produced with butanol While the main product mdash butanol mdash accounts for 63 (wtwt) of the total product yield (acetone butanol and ethanol) acetone accounts for 35 (wtwt) (Table 3) Our previous study (Wu et al 2005) suggested that when the share of energy co-products increases the co-product displacement method could yield misleading results Therefore other partitioning methods such as energy allocation should be examined
For Case 3 we applied the product energy allocation method to co-products in which emission and energy burdens are allocated among products according to their energy output shares from the bio-butanol plant In the energy allocation method shares of output product energy for each product are determined according to the heating value Energy use and associated emissions from bio-butanol production and from upstream feedstock production and transportation activities are partitioned among acetone butanol ethanol and DDGS on the basis of their corresponding energy shares This approach treats all energy products from the production process as equal regardless of the form and quality differences among them It also implies that all four products are energy products The energy allocation method is applicable to this case because of the ABE products both butanol and ethanol are liquid fuels Although TABLE 11 Co-Product Energy Partitioningacetone is normally regarded as a chemical by Energy Allocationa
solvent and feedstock its energy content (in LHV) is in fact in between that of butanol and ethanol (Table 1) Furthermore DDGS has a Bio- Bio- Bio-
Butanol Acetone DDGS EthanolLHV of 8703 Btulb and can be used as a solid fuel for ethanol plant operations Several 40 19 40 001 ethanol plants are currently exploring DDGS
acombustion or gasification such as Corn Plus Based on energy contentto provide heat and power Although the fuel quality of DDGS is lower than that of the liquid fuels considering its large quantity (Table 3) use of DDGS for process heat brings energy savings and yet relaxes pressure on the already stagnant DDGS market Table 11 presents energy shares based on product energy (in Btu)content
We also established a case to consider the impact of overproduction of acetone (Case 4) In this case an overabundance of acetone produced by a large-scale butanol industry would flood the acetone market consequently losing its commercial value Case 4 is the same as Case 2 except that it treats acetone as a waste stream (ie corn-acetone is not credited) This case provides an extreme scenario for bio-butanol
24
44 CRADLE-TO-USER ASSESSMENT OF PETROLEUM ACETONE AND DISPLACEMENT
441 Petroleum Acetone and Feedstocks Production
To evaluate the energy and emissions benefits of producing bio-acetone in a corn butanol plant we performed a cradle-to-user analysis of petroleum-based acetone mdash from feedstock extraction to acetone delivery to the user site Acetone is almost exclusively produced via cumene peroxidation as a co-product with phenol Its main use is as a chemical intermediate in the manufacture of acetone cyanohydrin for methyl mechacrylate biphenol A and adol chemicals Direct solvent use accounts for about 30 of world demand for acetone
A synthetic process based on hydrocarbons or derivatives is now accounted for all acetone production in the United States and nearly all production in other countries In this process acetone is co-produced with phenol from cumene The yield of acetone from this process averages 221 units of cumene per unit of acetone by weight (Camara-Greiner 2005) Cumene is produced via alkylation of benzene with propylene under elevated temperatures and pressures in the presence of a catalyst Upstream from cumene production benzene is produced principally through a catalytic reforming from naphtha in a BTX (benzene toluene and xylene) process The other feedstock for cumene propylene is one of a half dozen products from crackers receiving raw hydrocarbon (naphtha) from oil refineries as well as natural gas Figure 5 presents a schematic of cradle-to-user petroleum acetone production
442 Assumptions and Data Sources
The cradle-to-user analysis system boundary for petroleum acetone includes resource extraction feedstock production acetone production process fuel production and associated transportation Our petroleum acetone production data are based on the life-cycle inventory (LCI) of Eco-Profile (Boustead 2005)
Eco-Profile Reports compiled average industry data and assembled detailed environmental data for various petrochemical processes We noted system boundary differences in the transportation and upstream fuel production stages between the Eco-Profile and the GREET database To ensure a consistent system boundary for all seven cases with current GREET biofuel pathways we selected feedstock production (under category ldquofeedstock energyrdquo in Eco-Profile) and the amount of process fuel used in production of acetone feedstocks and acetone (under category ldquoenergy content of delivered fuelrdquo in Eco-Profile) to arrive at our energy estimate for petroleum acetone The GREET default energy values were used for upstream fuel production (oil extraction refining and transportation) transport of feedstocks and transport of acetone to users Direct emissions from production processes (under category ldquoprocessrdquo in Eco-Profile) from Eco-profile were used for our petroleum acetone cradle-to-user estimate Emissions associated with upstream fuel production and all transportation activities were based on GREET values Table 12 presents data sources for each life-cycle step in petroleum acetone production
25
TABLE 12 Assumptions and Data Sources of Cradle-to-User Petroleum Acetone
Cradle-to-User Stage Data Sources
Crude extraction for process fuel Crude transport for process fuel GREET 17 Oil refining and transport for process fuel
Cumene transporta GREET 17
Acetone production (life-cycle value)b Eco-Profile
a Benzene and propylene were assumed to be captive Acetone is for captive use in the acetone production facility to produce acetone cyanohydrin biphenol A and adol chemicals Cumene is transported to acetone production facility
b Cumene production value is not available
The hypothetical corn butanol plant is located in the US Corn Belt to reduce corn transportation costs We assumed that acetone produced from the corn butanol plant would displace petroleum acetone produced in the region of Petroleum Administration for Defense Districts (PADD) II (EIA 2004) PADDs were delineated during World War II to facilitate oil allocation PADD II includes 14 Midwest states and overlaps with the Corn Belt where most corn-based plants would operate We identified the mass flow for cumene and acetone production and transportation in PADD II on the basis of a Chemical Economics Handbook (CEH) Marketing Research Report (Camara-Greiner 2005) In this region 85 of total cumene is produced from captive benzene and propylene (that is benzene and propylene are produced and consumed on-site) The cumene is purchased by and subsequently transported to the acetone producer
Major assumptions for cradle-to-user analysis of petroleum acetone are listed below
bull Process fuels used in the acetone pathway are electricity oil and natural gas
bull Electricity is purchased from the grid with the US average generation mix (Table 10)
bull Cumene production feedstocks (benzene and propylene) are captive in the refinery so no transportation is associated with these feedstocks
bull The acetone production facility purchases 100 of feedstock cumene
bull Cumene needs for the acetone producer is estimated on the basis of the mass unit ratio of 221 units of cumene per unit of acetone (Camara-Greiner 2005)
26
bull Cumene is transported to the acetone production facility an average distance of 323 miles in a 1028-Btuton-mi Class 8 diesel truck
Table 13 presents the heating values used in Eco-Profile and GREET In this assessment energy data are expressed in LHV of Btu or kWhkg acetone produced When there was a discrepancy in LHV between Eco-Profile and GREET for same fuel or chemical the GREET value was selected to ensure consistency with the baseline fuel pathways of petroleum gasoline and corn ethanol The energy data from Eco-Profile are converted according to the ratio of LHV Eco-ProfileLHV GREET (Table 13)
TABLE 13 Low-Heating-Value Comparison for this Studya
Fuel
GREET (Btugal Btuscf)
Eco-Profile (MJkg)
Eco-Profile (Btugal Btuscf)
Ratio LHV EcoGREET
Fuel oil NG
140353 983
405 4816
144176 1005
103 102
a Unit for fuel oil is Btugal unit for natural gas is Btuscf
443 Petroleum Acetone Displacement
We assumed that the corn-based butanol plant would be built near a corn farm in the Midwest PADD II region and operated at a production scale of 150000 metric tons of bioshybutanol per year With a mass production ratio of 056 lb of bio-acetone per pound of bioshybutanol this facility could yield 82461 metric tons of bio-acetone annually mdash 16 of the total acetone production in PADD II and 4 nationwide We assumed that bio-acetone would be transported to acetone consumers via train (500 miles) and truck (100 miles) within PADD II
In the co-product displacement approach (Case 2) petroleum acetone is displaced by corn-based acetone from cradle to user The displacement is carried out in the following sequence the cradle-to-gate results of petroleum acetone (as illustrated in Figure 5) were first subtracted from the WTW results of bio-butanol and then the energy or emissions values associated with bio-acetone transportation from the bio-butanol plant to the acetone user were added
27
FIGURE 5 System Boundaries for Cradle-to-User Pathway of Fossil-Based Acetone and Corn-Based Acetone
28
29
5 RESULTS AND DISCUSSION
51 ENERGY CONSUMPTION AND GHG EMISSIONS
Corn-derived butanol achieves substantial fossil energy savings (39ndash56) compared with gasoline ([Cases 3 and 2] Figure 6) on a life-cycle basis In Cases 2 and 3 bio-butanol production contributes to a positive energy balance (defined as fossil energy used in gasoline production minus fossil energy used in bio-butanol production) Without acetone credit as in Case 4 in which acetone is regarded as a waste bio-butanol production is not an option for fossil energy savings
The primary fuel consumed in the bio-butanol life cycle is natural gas followed by petroleum oil and coal (Figure 6) Although electricity generation uses 50 of coal (Table 10) the amount of electricity required is relatively small (Table 8) and so only 9ndash17 of total fossil energy use is from coal (Cases 3 and 2) A life-cycle fossil energy breakdown (Figure 7) indicates that about three-fourths of the fossil fuel is spent in the butanol production plant (73) Corn cultivation accounts for a total of 23 of WTW fossil energy (12 for agricultural chemical and fertilizer manufacturing and 11 for farming operations) In the butanol plant the majority of natural gas demand comes from the process steam requirement (Table 5) which leads to 115000 Btu per gallon of butanol produced mdash approximately three times that of corn ethanol production before co-products are allocated As we pointed out earlier this estimate tends to be conservative because it did not reflect the lower heating requirement for DDGS drying in the bio-butanol plant The water requirement in biological fuel production drives the energy balance in the plant A higher concentration of product in fermentation reduces energy needs for product concentrating in subsequent process steps Historically improvement of ethanol concentration in a fermentor from ~8 in 1980s to 20 at present demonstrates in part the lower energy cost in ethanol plant operation The ABE fermentation process evaluated in this study achieved a concentration of 19 (wtwt) of total solvents (ethanol butanol and acetone) in a fermentor With rapid in-situ removal of solvent by gas stripping the process is able to increase feed concentration to improve production rate while minimizing butanol inhibition Although using concentrated feed in fermentation effectively reduces about 14 of the steam requirement (Table 5) solids concentration in the fermentor mdash an important issue in process development and operation mdash remains a constraint
Vehicles fueled by bio-butanol achieve small to moderate reductions in GHG emissions relative to gasoline vehicle on a WTW basis in Cases 2 (8 displacement ) and 3 (32 energy allocation) (Figure 8) For every million Btu of bio-butanol used in place of one million Btu of gasoline 8ndash32 kg of GHG emissions could be avoided (Cases 2 and 3) The GHG emissions profile for the bio-butanol production option in this study is similar to that of corn ethanol Of total GHG emissions in the bio-butanol WTW cycle over 70 by weight of the GHGs are from CO2 less than 5 is from methane and the remaining 18ndash21 is from N2O (Figure 9) Natural gas consumption in butanol plant is the major cause of GHG emission
We assumed that vehicles fueled by bio-butanol would offer performance similar to that of vehicles fueled by gasoline We have not found any vehicle testing data to confirm this
-
30
assumption Vehicle testing with butanol should be conducted to evaluate butanolrsquos performance in vehicles under realistic driving conditions
52 EFFECT OF ACETONE CO-PRODUCT CREDIT
Energy partitioning for co-products has a significant effect on overall energy use and associated GHG emissions The three cases that we examined (2 3 and 4) presented different options for acetone When acetone is regarded as a fuel and credit is allocated on the basis of product energy content (Case 3) the WTW analysis yields moderate fossil energy and GHG emissions benefits for bio-butanol When acetone is used as a renewable chemical to displace petroleum acetone via the displacement method (Case 2) the results of analysis show 17 savings in fossil fuel (Figure 6) and small reductions in GHG emissions (Figure 8) However treating acetone as a waste stream (Case 4) resulted in an increase of almost one million Btu in fossil energy and 40000 g of GHG emissions (compared with gasoline) for each million Btu of bio-butanol produced The difference is largely attributable to the acetone credit Feedstocks for petroleum-based acetone production (propylene and benzene [Figure 5]) are produced from naphtha and natural gas mdash 100 fossil feedstock (Lacson et al 2005) Another factor is the high yield of acetone from the ABE process 056 lb acetone per pound of butanol These two factors suggest that a significant portion of fossil energy use in petroleum acetone production will be regarded as a credit when bio-acetone displaces fossil acetone which eventually leads to a small fossil energy value (Figure 6)
-500000
0
500000
1000000
1500000
2000000
WTW
Fos
sil E
nerg
y U
se (B
tum
mB
tu) Petroleum
NG
Coal
Co product allocation based on displacement
Co-product allocation based on product energy value
Butanol Ethanol Butanol Butanol Ethanol Gasoline (Case 3) Dry mill (Case 2) (Case 4) Dry mill (Case 1)
(Case 6) (Case 5)
FIGURE 6 Well-to-Pump Fossil Energy Breakdown for Bio-Butanol and Corn Ethanol Compared with Gasoline Using Different Co-Product Allocation Methods (negative value indicates fossil energy avoided)
31
Vehicle Fuel Transport Bio-butanol
Net Consumption in Production
Plant 73
Corn Transport
2
Corn Farming 11
Fertilizer Manufacture
12
Operation 02
FIGURE 7 Breakdown of Fossil Energy Use in Various Stages of Fuel Life Cycle for Corn-Based Butanol (Case 3)
Butanol Ethanol Butanol Butanol Ethanol Gasoline (Case 3) Dry mill (Case 2) (Case 4) Dry mill (Case 1)
(Case 6) (Case 5)
FIGURE 8 Life-Cycle GHG Emissions of Bio-Butanol and Ethanol Compared with Gasoline Using Different Co-Product Allocation Methods
0
20000
40000
60000
80000
100000
120000
140000
WTW
GH
G E
mis
sion
s (g
CO
2 eq
uiva
lent
GH
Gm
mB
tu)
32
80000
60000
40000
20000
0 Butanol (Case 3) Ethanol Dry mill (Case 6)
FIGURE 9 Life-Cycle GHG Emission Breakdown for Bio-Butanol and Ethanol (Energy Allocation)
The displacement method provides significant benefits in terms of reductions in the use of fossil energy (Figure 6) but relatively small reductions in GHG emissions (Figure 8) The main reason for this phenomenon is that petroleum acetone production extracts carbon from a fossil resource and transforms the carbon to another bounded form (chemical) with net GHG emissions generated from consumption of the process fuel In its life cycle petroleum acetone is primarily used as a chemicalfeedstock with a fraction as solvent Although a small amount of carbon embedded in petroleum acetone may escape to the atmosphere through volatilization during product application (ie use as solvent) the majority ultimately ends up as a solidliquid chemical in a bound form rather than being emitted to the air as CO2 By displacing petroleum acetone with bio-acetone in this case the life-cycle reductions in fossil energy use do not translate to benefits in terms of GHG emissions
53 COMPARISON OF BIO-BUTANOL WITH CORN ETHANOL
The ABE process simulated in this study appears to be as efficient in producing acetone butanol and ethanol on a weight basis as current corn dry mills (Table 14) Measured by gallon or gram of ABE the yields from the ABE process are similar to ethanol yields from a conventional dry mill As a rule of thumb in ethanol produced from corn dry milling one-third of the feed mass goes to ethanol one-third is left in DDGS and one-third is emitted as CO2 The
WTW
GH
G E
mis
sion
s B
reak
dow
n(g
ram
CO
2 eq
uiv
per
milli
on B
tu)
N2O
CH4
CO2
33
TABLE 14 Acetone Butanol and Ethanol Outputs from Corn Compared with Ethanol from Conventional Corn Mills
Corn Butanol Plant Ethanol from Corn
Acetone Butanol Ethanol Total Dry Mills
Btubu corn 69525 149267 2828 221620 (with 198458 acetone) 152095 (without acetone)
Galbu corna
gCg cornb 087
0074 150 0137
004 0003
240 0214
260 0172
a Un-denatured b Based on dry corn feed
ABE process examined in this study follows TABLE 15 Co-Product Yields (gg corn)almost the same rule one-third of the feed mass ends up in the products (acetone butanol and
Acetone Butanolethanol) one-third remains in DDGS and about Ethanol DDGS CO2one-third (30) is emitted as CO2 (Table 15) (the remaining ~3 ends up in fatty acids [butyric and 034 033 030 acetic acids] and losses) Acetone 0119
Butanol 0212 Because acetone is not used as a fuel at Ethanol 0005
present net fuel production (butanol and ethanol) is small A typical dry mill can deliver 272 galbu of fuel ethanol or 26 galbu of undenatured ethanol which is ~11 gal more than the butanol and ethanol yield together from the ABE process (154 galbu) (Table 14) On the other hand butanol contains 30 more energy (LHV) than ethanol (Table 1) by volume When we take fuel energy yield into consideration each bushel of corn could generate nearly 152000 Btu of liquid fuels from the ABE process (butanol and ethanol together) while the same bushel delivers 198000 Btu of liquid fuels (undenatured ethanol) from the conventional ethanol dry mill (46000 Btu more than the bio-butanol option) Hence from a liquid fuel production perspective the ABE process option does not offer an increase in renewable fuel production in comparison with conventional corn ethanol production
Process fuel use for ABE production could be a major hurdle as indicated in Table 16 A bushel of corn requires 82 more steam and 34 more electricity to produce ABE from a bioshybutanol plant than to produce ethanol from a corn dry mill If the first corn butanol plant is built from an existing corn dry mill that has been retrofitted the implication is that operation cost will be high To build a new corn butanol plant capital cost may be lower because of the reduced footprint in fermentation and downstream processing relative to the existing dry mill but the plant would have increased process fuel cost mdash especially given the current price for natural gas
34
TABLE 16 Process Fuel Use in Bio-Butanol and Ethanol Production Plant
Fuel Bio-butanol Plant Ethanol Dry Mill Ratio of Butanol
to Ethanol
Natural gas (Btubushel of corn) Electricity (kWbushel of corn)
172108
263
94320
197
182
134
Another concern is the feedstock supply for bio-butanol The current ABE process shares the same starch-based feedstocks with conventional corn ethanol Development of bio-butanol through the ABE process could take limited feedstocks away from conventional corn ethanol production RampD efforts in bio-butanol may need to be directed toward identifying new feedstocks and process technologies In fact Qureshi (2007) recently reported on a study using cellulosic biomass as feedstock for bio-butanol production via the ABE process Because ABE fermentation is from glucose the results of ongoing RampD on cellulosic pretreatment for cellulosic ethanol could be applied to the ABE process
54 CRADLE-TO-USER COMPARISON OF BIO-ACETONE WITH PETROLEUM ACETONE ISSUES AND CONCERNS
Use of bio-acetone to displace petroleum acetone shows promising energy and environmental benefits (Figure 10) from a life-cycle perspective Conventional acetone production is a fossil-energy-intensive process By producing acetone from corn manufacturers could save a significant amount of total fossil energy mdash up to 71 relative to petroleum-based acetone The renewable acetone achieves energy savings of 91 for petroleum and 58 for natural gas Figure 11 further shows the life-cycle fossil energy distribution between the two The majority of fossil energy use shifts from feedstocks (57) in the petroleum acetone production process to acetone production (70) in the corn acetone production process
Bio-acetone in this study is produced from corn mdash a renewable agricultural resource that absorbs atmospheric CO2 during its growth The carbon in CO2 is converted to organic carbon in the corn and is further transformed and embedded in acetone through the ABE process Therefore we allocated a renewable carbon credit to bio-acetone for the carbon embedded in corn As illustrated in Figure 12 a net carbon sequestration would occur from cradle to user GHG emissions would be much higher mdash about 500 glb acetone produced if the carbon in acetone is from non-renewable sources
Although bio-acetone production results in positive WTW energy benefits and decreased GHG burdens several issues and concerns need to be addressed In 2005 a total of 19 million metric tons of acetone was produced in the United States (Camara-Greiner 2005) PADD II which overlaps with the US corn belt would most likely to be the location for corn-based
35
butanol plants Production of petroleum acetone in this region in 2005 was 505000 metric tons representing 26 of total US production If bio-acetone were produced from a single simulated bio-butanol plant located in this region the volume of bio-acetone would be about 16 of the total petroleum acetone production in the region and 4 nationwide Furthermore assuming that total bio-butanol production levels could reach a quarter of the production level of corn ethanol of 49 billion gallons (2006) the amount of corn feed used for bio-butanol production could generate 676 million gallons of bio-butanol and 391 million gallons (12 million metric tons) of bio-acetone At this production scale the acetone market would be flooded with both bio- and petroleum acetones dramatically decreasing the market value of acetone Thus one may argue that acetone should be treated as a waste stream (as we did in Case 4) Aside from the fossil energy and GHG benefits (within WTW analysis boundaries) that may result from the production of bio-butanol we should consider the emission of liquid acetone into the environment if acetone is treated as a waste stream On the basis of a value of 0074 g of carbon generated in acetone from each gram of corn if all of the carbons contained in acetone were converted to gaseous CO2 approximately 6900 g of CO2 could be emitted to the atmosphere per bushel of processed corn Acetone-containing water in such high volumes could become a major source of atmospheric VOC and CO2 emissions
Unfortunately the outlook for replacement of petro-chemicals with bio-chemicals is far from clear Petroleum acetone is currently generated as a by-product during phenol production from cumene On average 061 lb of acetone is obtained per pound of phenol produced (SRI Consulting 2005) The United States consumed $21 million metric tons of phenol in 2004 (SRI Consulting 2007) Worldwide the consumption of phenol grows at a rate of 41 per year As demand for phenol continues to rise petroleum acetone will be produced with or without the presence of bio-acetone In the ABE process studied the bio-acetone is also a co-product New technologiesprocesses that significantly reduce the acetone that results from phenol and ABE production are therefore needed In fact at the time of this study DuPont was making considerable progress in molecular biology which led to a patent award for a recombinant bacterium that produces butanol exclusively from biological feedstocks (DuPont 2007) Other potential research directions include exploring the use of acetone as a fuel blend and as a feedstock for new chemicals
36
0
5000
10000
15000
20000
25000
30000
Cra
dle-
to-U
ser F
ossi
l Ene
rgy
Use
(Btu
lb A
ceto
ne)
Petroleum Natural Gas Coal
Corn-Acetone Petroleum-Acetone
FIGURE 10 Fossil Energy Use Based on the Production of Bio-Acetone Compared with Fossil Energy Use Based on the Production of Petroleum Acetone
37
8127 Btu of fossil per lb of corn acetone a) bio-Acetone
Fuel Transport
3 Corn Farming 12
Fertilizer Manufacture
13
Corn Net Transport
Consumption 2 in Production
Plant70
27818 btu of fossil per lb of acetone Feedstock and
acetone
b) Petroleum-Acetone
Acetoneproduction -Co-product
Credit40 Feedstock
production 57
transportation 3
FIGURE 11 Fossil Energy Consumption Breakdown for (a) Bio-Acetone and (b) Petroleum Acetone
38
Cra
dle-
to-U
ser G
HG
Em
issi
ons
(g C
O2-
equi
vlb
ace
tone
)
1500
1000
500
0
-500
-1000 Corn-Acetone Petroleum-Acetone
CO2 CH4 N2O
Net CO2 emission - 304gCO2 equivlb
Net CO2 emission 738gCO2 equivlb if carbon is not sequested
FIGURE 12 GHG Emissions Generated or Avoided by Bio-Acetone Production Compared with Petroleum Acetone Production
39
6 CONCLUSIONS
Our conclusions based on the results of our study include the following
bull Corn-based butanol produced by means of the current ABE process could offer substantial fossil energy savings and moderate reductions in GHG emissions relative to petroleum gasoline on a WTW basis when co-products are credited by energy allocation
bull The energy benefits associated with bio-butanol are significant when coshyproduct corn-acetone is credited with displacement method
bull When acetone is credited by energy allocation life-cycle energy benefits for corn butanol are less promising than those of corn ethanol generated from conventional dry milling processes GHG emissions generated from bioshybutanol life cycle are higher than those generated from corn ethanol
bull From a liquid fuel production standpoint the ABE process examined may not be as effective as conventional corn ethanol production in that it produces less liquid fuel (on an energy basis) per bushel of corn than the corn ethanol process in addition to increased process fuel use in the production plant
bull The impacts of corn-acetone (produced via the ABE process) on the acetone market need to be carefully examined and new uses for bio-acetone need to be explored
40
41
7 REFERENCES
Boustead I 2005 ldquoEco-Profiles of the European Plastic Industry Acetonerdquo Plastics Europe March available at httpwwwplasticseuropeorgContentDefaultaspPageID=392 accessed Dec 2006
Brinkman N M Wang T Weber and T Darlington 2005 GM Study Well-to-Wheels Analysis of Advanced FuelVehicle Systems ndash A North American Study of Energy Use Greenhouse Gas Emissions and Criteria Pollutant Emissions May httpwwwtransportationanlgovpdfsTA339pdf
Collins K 2007 The New World of Biofuels Implications for Agriculture and Energy Presented at EIA Energy Outlook Modeling and Data Conference March Washington DC
Conti J 2007 Annual Energy Outlook 2007 presentation at EIA Energy Outlook Modeling and Data Conference March Washington DC
Dadgar AM and GL Foutch 1988 ldquoImproving the Acetone-Butanol Fermentation Process with Liquid-Liquid Extractionrdquo Biotechnology Progress 4 36ndash39
DuPont 2007 Fermentive Production of Four Carbon Alcohols World Patent Application WO2007041269 USPTO PCTUS2006038007
EIA see Energy Information Administration
Energy Information Administration 2004 httpwwweiadoegovpuboil_gaspetroleum analysis_publicationsoil_market_basicspaddmaphtm accessed May 15 2007
Energy Information Administration 2007 Annual Energy Outlook 2007 DOEEIA-0383(2007) available at httpwwweiadoegovoiafaeopdf0383(2007)pdf accessed May 23 2007
Ezeji TC N Qureshi and HP Blaschek 2004 ldquoAcetone Butanol Ethanol (ABE) Production from Concentrated Substrate Reduction in Substrate Inhibition by Fed-Batch Technique and Product Inhibition by Gas Strippingrdquo Appl Microbiol Biotechnol 63 653ndash658
Ezeji TC PM Karcher N Qureshi and HP Blaschek 2005 ldquoImproving Performance of a Gas-Stripping-Based Recovery System to Remove Butanol from Clostridium Beijerinckii Fermentation Bioprocess Biosyst Eng 27 207ndash214
Guibet J-C 1997 Carburants et Moteurs Technologies Energie Environnement Publication de lrsquoInstitut Franccedilais du Peacutetrole ISBN 2-7108-0704-1
Heckl I Z Kovacs F Friedler LT Fan and J Liu 2006 ldquoAlgorithmic Synthesis of an Optimal Separation Network Comprising Separators of Different Classesrdquo Chemical Engineering and Processing doi101016jcep200606013
42
Huang WC DE Ramey and ST Yang 2004 ldquoContinuous Production of Butanol by Clostridium Acetobutylicum Immobilized in a Fibrous Bed Bioreactorrdquo in Applied Biochemistry and Biotechnology mdash Part A Enzyme Engineering and Biotechnology 113ndash116 887ndash898
Intergovernmental Panel on Climate Change (IPCC) 2001 Climate Change 2001 the Scientific Basis Technical Summary of the Group I Report
Intergovernmental Panel on Climate Change (IPCC) 2007 Working Group I The Physical Basis of Climate Change IPCC WG1 AR4 report available at httpipcc-wg1ucareduwg1 wg1-reporthtml accessed May 23 2007
IPCC see Intergovernmental Panel on Climate Change
Kwiatkowski JR McAloon AJ Taylor F Johnston D 2006 Modeling the process and costs of the production of fuel ethanol by the corn dry-grind process Industrial Crops and Products V23 Issue 3 p288-296
Lacson JG 2004 ldquoPropylenerdquo in Chemical Economics Handbook (CEH) Marketing Research Report SRI Consulting Menlo Park Calif
Liu J 2003 Downstream Process Synthesis for Biochemical Production of Butanol Ethanol and Acetone from Grains PhD Dissertation Kansas State University Manhattan KS
Liu J LT Fan P Seib F Friedler and B Bertok 2004 ldquoDownstream Process Synthesis for Biochemical Production of Butanol Ethanol and Acetone from Grains Generation of Optimal and Near Optimal Flowsheets with Conventional Operating Unitsrdquo Biotechnol Prog 20 1518ndash1527
Liu J LT Fan P Seib F Friedler and B Bertok 2006 ldquoHolistic Approach to Process Retrofitting Illustration with Downstream Process for Biochemical Production of Organicsrdquo Ind Eng Chem Res 45 4200ndash4207
Marlatt JA and R Datta 1986 ldquoAcetone-Butanol Fermentation Process Development and Economic Evaluationrdquo Biotechnology Progress 2 23ndash28
McAloon A 2006 Shelled Corn to Ethanol Process Energy Analysis Aspen + reg MGY Dry Grind Ethanol Process Model ERRCARSUSDA
Morey V et al 2006 Characterization of Feed Streams and Emissions from Biomass GasificationCombustion at Fuel Ethanol Plants American Society of Agricultural and Biological Engineers (ASABE) Presentation Paper Number 064180 July Portland Ore
Mueller S and J Cuttia 2006 Research Investigation for the Potential Use of Illinois Coal in Dry Mill Ethanol Plants prepared by the Energy Resources Center at University of Illinois at Chicago for the Illinois Clean Coal Institute and the Illinois Department of Commerce and Economic Opportunity Oct
43
Mueller S 2006 Energy Resources Center University of Illinois at Chicago Chicago Ill personal communication to May Wu of Argonne National Laboratory Argonne Ill
Natural Resources Canada 2007 ldquoThe Addition of Bio-Butanol to GHGenius and a Review of the GHG Emissions from Diesel Engines With Urea SCRrdquo NRC Report prepared by (SampT)2
Consultants BC Canada
Parekh M J Formanek and HP Blaschek 1999 ldquoPilot-Scale Production of Butanol by Clostridium Beijerinckii BA 101 Using a Low-Cost Fermentation Medium Based on Corn Steep Waterrdquo App Microbiol Biotechnol 51 152ndash157
Qureshi N and HP Blaschek 1999 Economics of Butanol Fermentation Using Hyper-Butanol Producing Clostridium Beijerinckii BA 101rdquo Trans Institution of Chemical Engineers 78 (Part C) 139ndash144
Qureshi N and HP Blaschek 2001a ldquoABE Production from Corn A Recent Economic Evaluationrdquo Journal of Industrial Microbiology amp Biotechnology 27 292ndash297
Qureshi N and HP Blaschek 2001b ldquoRecovery of Butanol from Fermentation Broth by Gas Strippingrdquo Renewable Energy 22 557ndash564
Qureshi N 2007 Bioconversion of Agricultural Residues to Butanol Simultaneous Saccharification Fermentation and Product Recovery Presentation at the 29th Symposium on Biotechnology for Fuels and Chemicals Denver CO
Roddy W 2006 Dry Mill Ethanol Plants Environmental Impacts and Future Growth ICM Presented at Governorsrsquo Ethanol Coalition Feb
SRI Consulting 2005 Chemical Economics Handbook (CEH) Marketing Research Report Menlo Park Calif
SRI Consulting 2007 Chemical Economics Handbook (CEH) Marketing Research Report Menlo Park Calif
White and Johnson 2003 Corn Chemistry and Technology 2nd edition
Wu M Y Wu M Wang 2005 Mobility Chains Analysis of Technologies for Passenger Cars and Light-Duty Vehicles Fueled with Biofuels Application of the GREET Model to the Role of Biomass in Americarsquos Energy Future (RBAEF) Project Argonne National Laboratory Report May available at httpwwwtransportationanlgovpdfsTA344pdf
44
45
APPENDIX
46
47
APPENDIX
A1 PARAMETERS FOR CORN BUTANOL LIFE-CYCLE ANALYSIS
Corn Farming Energy UseFertilizer Use
Nitrogen P2O5 K2O CaCO3
Pesticide Use Herbicide Insecticide
Corn Transportation From Field to Stacks
Truck Share Distance
From Stacks to Plants Truck
Share Distance
Butanol Production Energy Use
Thermal Energy Electricity
Yield Butanol Acetone DDGS
22500 Btubu
420 gbu 149 gbu 174 gbu
1202 gbu
810 gbu 068 gbu
100 10 mi
100 40 mi
115114 Btugal BuOH 176 kWhgal BuOH
150 galbushel 380 lbgal BuOH 1166 lbgal BuOH
Butanol Transportation and Distribution Transportation
Barge Share Distance
Rail Share Distance
Truck Share Distance
40 520 mi
40 800 mi
20 110 mi
GREET corn-EtOH pathway
GREET corn-EtOH pathway GREET corn-EtOH pathway GREET corn-EtOH pathway
GREET corn-EtOH pathway
GREET corn-EtOH pathway GREET corn-EtOH pathway
GREET corn-EtOH pathway GREET corn-EtOH pathway
GREET corn-EtOH pathway GREET corn-EtOH pathway
see report see report
see report see report
see report
see report see report
see report see report
see report see report
48
Distribution Truck
Share 100 see report Distance 30 mi see report
Butanol Combustion in Vehicles On-Road Fuel Economy
245 migal see report
A2 PARAMETERS FOR PETROLEUM-BASED ACETONE ANALYSIS
Energy Use Energy Used as Process Fuel Electricity 031 kWhkg acetone see report
Oil 9337 Btukg acetone see report NG 10678 Btukg acetone see report
Energy Used as Feedstock Oil 12961 kWhkg acetone see report NG 18908 kWhkg acetone see report
Cumene Transportation Truck
Share 100 Distance 323 mi see report Fuel economy 50 migal see report
A3 TRANSPORTATION FOR CORN-ACETONE
Rail Share 100 see report Distance 500 mi see report
Truck Share 100 see report Distance 100 mi see report
A4 FUEL SPECIFICATIONS
Butanol Low heating value 99837 Btugal Density 3065 ggal
Carbon content 65 Acetone
Low heating value 83127 Btugal Density 2964 ggal
Carbon content 62
Energy Systems Division Argonne National Laboratory9700 South Cass Avenue Bldg 362Argonne IL 60439-4815
wwwanlgov
A US Department of Energy laboratory managed by UChicago Argonne LLC
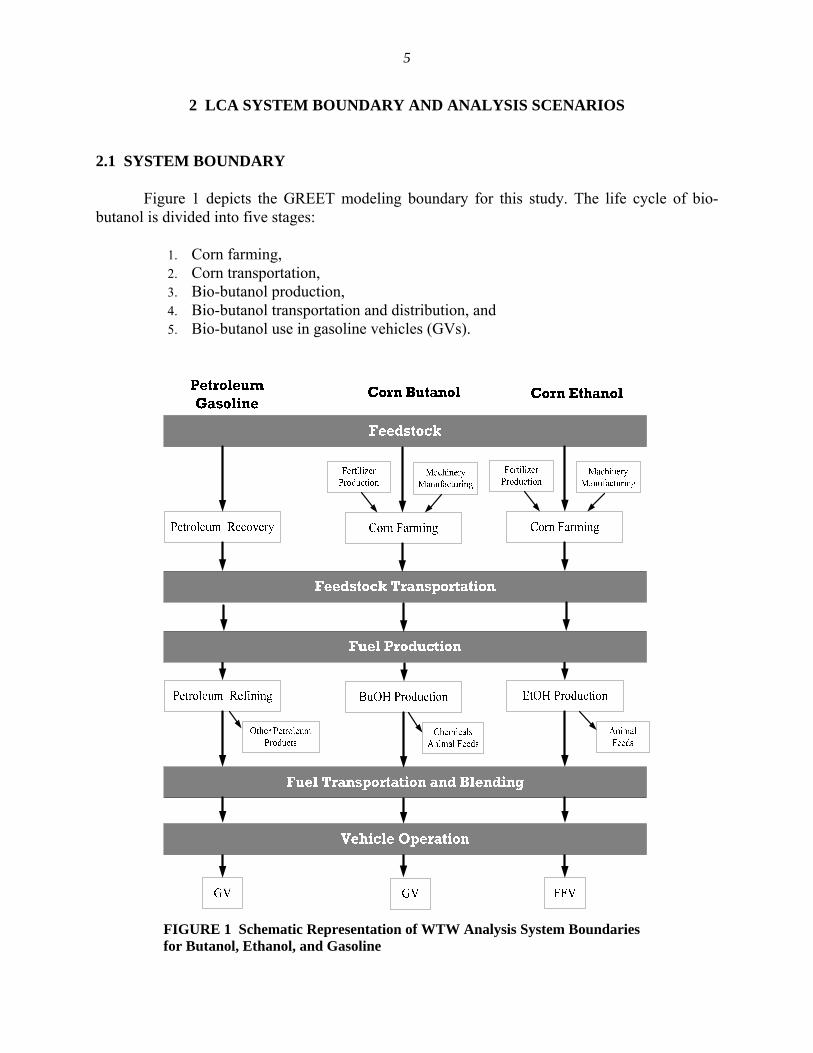
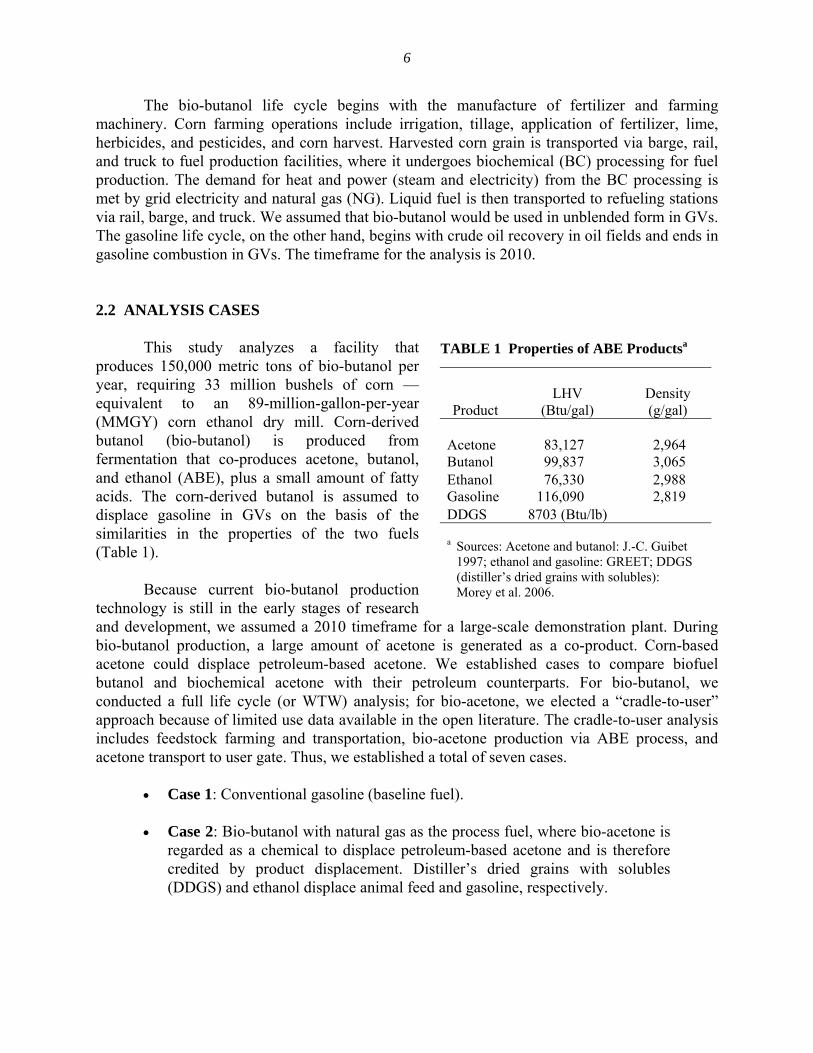
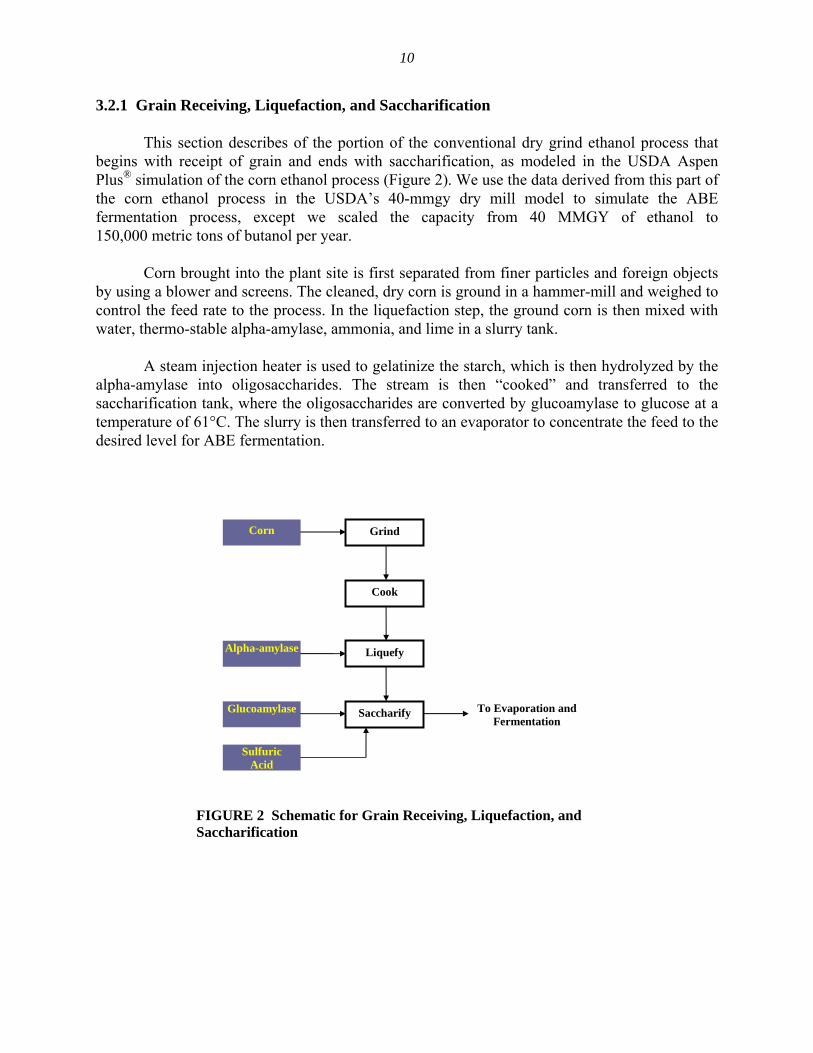
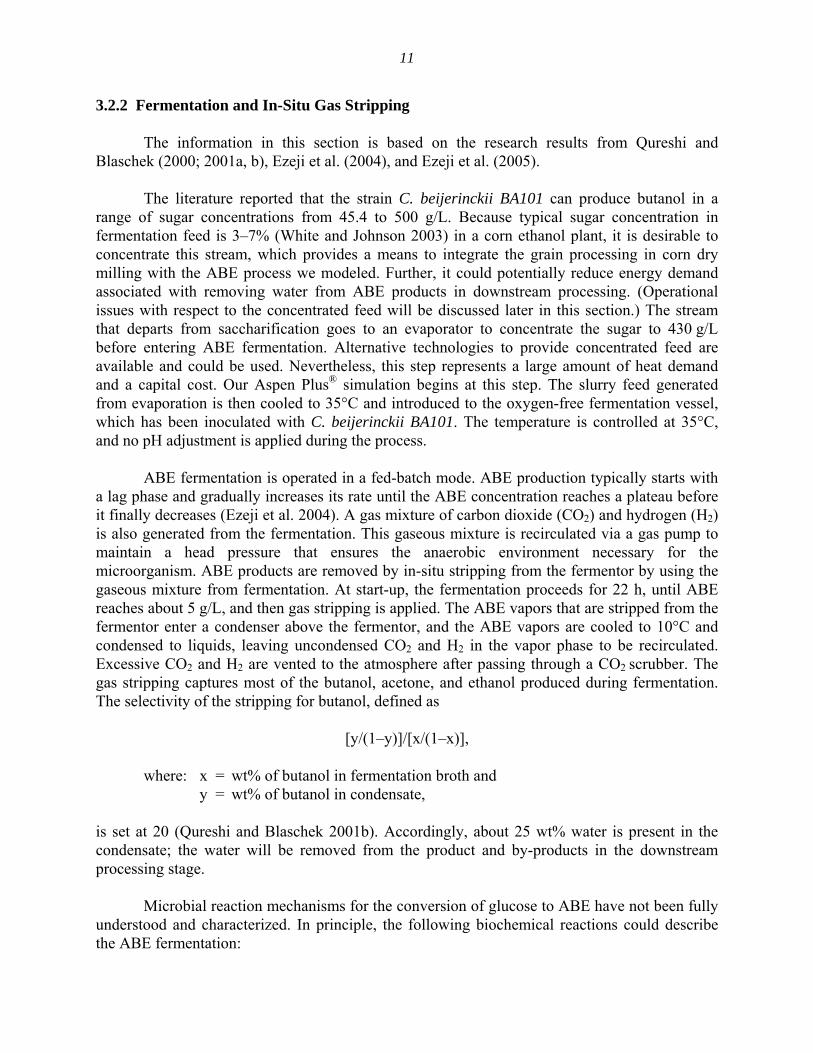
12
C6H12O6 rarr C4H10O (butanol) + CO2 + H2O C6H12O6 + H2O rarr C3H6O (acetone) + CO2 + H2 C6H12O6 rarr C2H5O (ethanol) + CO2 + H2 C6H12O6 rarr C4H8O2 (butyric acid) + CO2 + 2H2 C6H12O6 rarr C2H4O2 (acetic acid)
The reactions represent a qualitative measure rather than stoichiometric quantitative relationships for the ABE conversion process The microbial cell growth was not included in any of the reactions above In our simulation the extent of ABE conversion is set according to literature value reported from experimental tests Glucose utilization is 951 (ie 49 glucose is converted into biomass solids as a result of microbial growth) Butanol acetone ethanol acetic acid and butyric acid yields are 0303 0155 00068 00086 00084 gg glucose respectively (Table 2)
As we noted earlier in this section integrating the conventional corn ethanol dry mill process with the new ABE process requires closing a gap in the concentration of the sugar feed to the fermentor between the two processes Feed for the ABE fermentation process contains a sugar concentration of up to eight-fold as high as that of conventional corn ethanol process which suggests a small footprint for a fermentation and downstream processing unit and therefore lower capital expenditure and lower energy demand for downstream separation However at such a concentration the solids could build up to 55 (wtwt) or higher in the fermentor In comparison the level of solids in corn ethanol fermentation is roughly 20 (wtwt) The level of solids in ABE fermentation broth means increased viscosity which could result in inhibitory stress on microorganisms and operational difficulties In addition feed to a fermentor in a corn dry mill usually contains corn fiber which could exhibit mass-transfer limitation during gas stripping The net result could be increased energy consumption for gas stripping or reduced product removal efficiency by stripping Data in the literature are mostly based upon relatively pure glucosenutrient feed in which mass transfer may not be limiting The operability and mass-transfer issues in fermentation for the corn-to-butanol process should therefore be examined carefully For comparison we estimated a case with diluted feed to the fermentor (no evaporation) which is similar to the fermentation feed in an existing corn ethanol plant
Another uncertainty is that ABE fermentation requires a pure form of starch that is similar to starches produced from a wet milling process Additional steps to purify dry milling starch will be necessary to integrate the dry mill with the ABE fermentation Unfortunately at the time of this study available data were limited to pilot-scale testing and the corn-to-butanol ABE process is not well established We did not including starch purification step Our analysis will be updated once these issues have been addressed and data become publicly available
323 Downstream Processing
The liquid fermentation broth from the condenser is subject to a series of distillation operations in which the stream is separated into product based on their volatilities 995 wt pure butanol 995 wt pure acetone and 995 wt pure ethanol In a mixture containing
13
butanol ethanol and water homogeneous ethanol-water azeotrope and heterogeneous water-butanol azeotrope are formed In descending order of their volatilities the components in the stream (including the two azeotropes) to be separated by the downstream processing are acetone azeotrope of ethanol and water ethanol azeotrope of water and butanol water and butanol The components in this sequence could plausibly be separated simply by fractional distillation achieved by various simple andor complex column configurations into any two or more subsequences of components at the adjacent components that have sufficiently different volatilities
The fermentation broth is first fed to the first distillation tower where a composition cut is made to separate acetone ethanol and water from the broth These components are sent to the top stream and the butanol (together with a trace amount of water) goes to the bottom stream The product butanol is 995 wt pure and suitable for transportation fuel use The top stream is sent to a second distillation tower where acetone is concentrated purified and then sent out from the top The bottom stream containing mainly ethanol and water is subject to further separation in a third distillation tower where the azeotropic vapor of 944 wt ethanol and 53 wt water (and 2 wt acetone) is withdrawn from the top and sent to an adsorption unit The water stream from the bottom is sent back to the fermentor Water in the top stream is adsorbed in this unit and ethanol purity in the product stream reaches 995 (the minimum purity required for ethanol to be blended with gasoline and used in vehicles)
The adsorption unit consists of two adsorption columns that run cyclically between the adsorption and desorption phases Molecular sieves are packed in the column as the adsorbents The sieves consist of a microporous substance designed to separate small polar molecules from larger nonpolar ones via a sieving action Water molecules are trapped and adsorbed inside the microporous beads while the ethanol molecules flow around them Molecular sieves are then regenerated by heat and carrier air Figure 3 presents the schematic of the adsorption and adsorbent regeneration process
33 PROCESS FLOWSHEET SIMULATED BY ASPEN PLUSreg
331 ABE Process Flowsheet
This simulation attempts to address the potential of the new ABE fermentation with an in-situ stripping process by using the best of the process value reported The ABE fermentation and downstream processing (separation) model from this study was integrated with the upstream grain processing component of the USDArsquos corn dry mill model and scaled to the 150000-metric-ton-per-year bio-butanol production level Figure 4 shows the Aspen Plusreg
output of the process flowsheet from fermentation to downstream processing Data for the simulation of fermentation and gas-stripping unit operations are based on the research results from Qureshi and Blaschek (2000 2001ab) Ezeji et al (2004) and Ezeji et al (2005) Table 2 summarizes the main parameters for fermentation and gas stripping input to the Aspen Plusreg
simulation
14
995 Ethanol
Atmospheric air Hot Regen
air
Regeneration
Azeotrope stream of ethanol and water
Blower
FIGURE 3 Schematic Representation of Adsorption and Adsorbent Regeneration
The downstream processing flowsheet in the simulation is based on the most cost-effective flowsheet rigorously generated from an exhaustive list of plausible processing equipment and unit operations as described in Liu (2003) Liu et al (2004 2006) and Heckl et al (2006) According to their studies this optimal flowsheet consists of a gas stripper that isolates a liquid product stream from the fermentation broth an adsorption unit that removes the majority of water and a set of distillation columns that purifies the butanol ethanol and acetone products The studies show that the cost of this flowsheet is at least 125 lower than that of any other alternative flowsheet Energy use for the regeneration of the molecular sieve adsorbents is calculated off-line The calculation presented in Section 332 is then incorporated into the simulation by using a Fortran subroutine
Shortcut methods that highlight the mass and energy balances are chosen for simulating most of the unit operations in the process Heat integration between the three distillation columns is taken into consideration Our simulation did not include stream recycling and simple unit operations (such as valves) we also did not examine different distillation column configurations
The combined Aspen Plusreg model provides the material balance for the bio-butanol plant as shown in Table 3 Table 4 lists the yields of acetone butanol and ethanol from the bioshybutanol plant (in gallon per bushel [galbu] of corn) Steam and electricity use for the ABE process (Table 5) indicates that using concentrated feed for ABE fermentation could save 14 of steam needs in comparison with using existing feed in a dry mill Among the reductions in steam needs 75 of those reductions come from distillation Section 41 presents the energy balance for the bio-butanol plant from gate to gate
15
GASPUMP
DISCHARG
ETOH
ADSBWST1
BTOH
ACETONE
WATER
215WATER GASPROD
GASSTRPR
CONDNSR PHSSEPR
ADSORBR1 DIST1
DIST2 FERMENTR
DIST3
EV01
FIGURE 4 Aspen Plusreg Output of the Process Flowsheet from Fermentation to Downstream Processing
16
TABLE 2 Main Input Parameters for Fermentation and Gas Stripping for Aspen Plusreg Simulations
Value Used in Input Parameter the Simulationa
Fermentor operating temperature (degC) 35
Fermentor operating pressure (atm) 1
Acetone 0155 Butanol 0303 Ethanol 00068
Yield (gram ABE (total) 0465 gram glucose) Acetic acid 00086
Butyric acid 00084 Hydrogen 0021 Carbon dioxide 06954
Gas stripping carrier gas Fermentation gas Gas stripping selectivity for butanol 200 Condensation temperature (degC) 2
a Sources Ezeji et al (2004) Qureshi et al (2001b)
TABLE 3 Material Balance of Bio-Butanol Plant
Parameter Value Source
Feed grain moisture content () 15 USDA dry mill model (Kwiatkowski et al 2006
Corn grain feed rate (lb cornh) 237338 McAloon 2006) Aspen Plusreg results scaled up from USDA dry mill model (Kwiatkowski et al 2006 McAloon
Glucose feed rate to fermentor 154871 2006) Aspen Plusreg simulation (this study)
(lbh) Production (lbh) Aspen Plusreg simulation (this study)
Acetone 23997 Butanol 42728 Ethanol 1032 DDGS 73816
DDGS moisture content () 11
17
TABLE 4 Yields of Acetone Butanol and Ethanol from Bio-Butanol Plant
Product Yield
(galbu corn) Energy
(Btubu corn) Energy Output Share
()
Acetone Butanol Ethanol Total
0868 1495 0037 24
69525 149267
2828 221621
314 674
12 100
TABLE 5 Process Fuel Use for ABE Fermentation and Downstream Processing
Diluted Sugar Feed to Fermentora
Process Step Steam (Btuh) Electricity (kW) Steam (Btuh) Evaporator 278653091 0 Fermentor agitator 19273 Condenser 310540 Gas pump 6104 Gas stripper 1307400 1412700 Adsorption feed pump 024 Distillation Column 1 43220100 68173300 Distillation Column 2 62665700 374388000 Distillation Column 3 5730860 10891300 Distillation 2 feed pump 040 Distillation 3 feed pump 003 Adsorbent regeneration -729205 23733 -729205
a Existing fermentation feed such as those from corn dry mill used for ABE fermentation
332 Estimate of Energy Use for Adsorbent Regeneration
The heat use for the regeneration of adsorbents is calculated as the total amount required to bring the system mdash which includes the adsorption column the molecular sieves adsorbed water and the carrier gas mdash to a temperature of 500degF An electric heater provides the energy requirement for absorbent regeneration The system is cooled by exchanging the heat with the process streams fed to the distillation towers (assuming a loss factor of 10) Therefore the energy used to cool the system is not taken into account The weight of water that the molecular sieves adsorb is set at 22 of the weight of the molecular sieve The peak concentration of water in the carrier air is set at 17 wt The adsorption and regeneration cycle time is set at 8 h The amount of heat required to bring the column to the specified temperature is calculated by using a method based on logarithmic mean temperature difference (LMTD) and the scaling of experimental data The radiation loss factor for heater is set at 5 Other major parameters for the calculation are listed in Table 6
18
TABLE 6 Parameters for Calculating Energy Use for Adsorbent Regeneration
Water Adsorbed Inside Molecular Adsorption Carrier Gas mdash
Parameter Sieves Molecular Sieves Column Air
Amount (lbh) 556 20200 na 33330 Cp (btulbdegF) 10 02 na 02 T1 (degF) 1750 1750 1750 1750 T2 (degF) 5000 5000 5000 5000 ΔT (degF) 3250 3250 3250 3250 Q (Btuh) 180538 1509950 3437061 2588908 Total (Btuh) 8102279
19
4 BIO-BUTANOL LIFE-CYCLE ASSESSMENT
41 BIO-BUTANOL PLANT ENERGY REQUIREMENTS
We assume that the bio-butanol plant uses natural gas as process fuel to generate steam and purchases electricity from the grid Our process fuel estimate for the butanol plant is based on three sources (1) the Aspen Plusreg simulation of ABE fermentation and downstream processing from this study (2) a recent study by Mueller and Cuttica (2006) of process fuel use in corn ethanol dry mills and (3) the USDA corn dry mill model (Kwiatkowski et al 2006 McAloon 2006) Aspen Plusreg results from this simulation generate process fuel use values for ABE fermentation and downstream processing (Table 5) Considering the similarity in upstream grain processing between corn ethanol and corn butanol process in this study we adopted the grain processing and DDGS drying steps from USDA dry mill model scaling-up the corn feed for the bio-butanol plant Thus the heat and power needs in the rest of the plant (for cooking the regenerative thermal oxidizer [RTO] and DDGS drying) are based on sources (2) and (3)
An estimate of process fuel (natural gas) use for cooking DDGS drying and RTO in the corn butanol plant was based on the amount of corn feed processed in the following steps We first converted the energy input per gallon of ethanol to energy input per bushel of corn feed at a yield of 272 gallons of denatured ethanol per bushel of corn We then converted this value to energy use per gallon of bio-butanol with a bio-butanol yield of 150 gallons per bushel of corn (Table 4) for each process step above In a conventional corn ethanol dry mill water is removed from WDG (solids from grain processing) and syrup (solids from distillation) at the drying step and from ethanol via distillation The ABE fermentation process described in this study partially removes water before fermentation to concentrate feed sugar content Therefore it is likely that less water will be removed at downstream processing and DDGS drying which means lower energy demand Another parameter that has not been fully evaluated and reported is DDGS yield from the corn-to-butanol ABE process and its quality We assume equivalent heating demands for DDGS drying in the ethanol plant and in the butanol plant Table 7 details the calculations of natural gas use in the bio-butanol plant This steam demand is met by using a natural-gas-fired steam boiler with 80 efficiency to produce 150-psi medium-pressure steam
Electricity demand for the bio-butanol plant was estimated in a similar way According to the ethanol plant study by Mueller and Cuttica (2006) the average electricity use in corn ethanol plants is 075 kWh per gallon of ethanol which agrees with the value estimated by an ethanol plant designer (Roddy 2006) while it is slightly higher than the 073 kWh per gallon of ethanol suggested by the USDA model We used the former estimate in this analysis to reflect the current industry average Electricity used for fermentation and distillation in the corn ethanol plant was displaced by that for ABE fermentation and downstream processing The power consumption value was converted from per gallon of ethanol to per gallon of butanol via per bushel of corn on the basis of 272 gallons of EtOHbushel and 150 gallons of bio-butanolbushel Table 8 summarizes the major assumptions and data sources for power use in the bio-butanol plant
c
20
TABLE 7 Thermal Energy Requirements in Bio-Butanol Plant
Process Steps
EtOH Plant NG Required (Btugal denatured EtOH)
BtOH Plant NG Required Based on
Feed Corn (Btubu corn)c
BtOH Plant NG Required Based on
BtOH (Btugal BtOH)d
Cooking 10013ab 27236 18216 Dryer and RTOe
ABE fermentationf
and processing
10830 29458 19703 77195
BtOH plant total 115114
a Source Mueller (2006) 231 total process fuel for cooking 265 for EtOH processing Therefore cooking fuel use is 231(231 + 265) = 4657 of total fuel used in ethanol processing (excluding DDGS drying)
b The total thermal fuel requirement for cooking fermentation and distillation is 21500 Btugal denatured EtOH in a 100-MMGY ethanol dry mill Source Mueller and Cuttica (2006) NG needed for cooking is 4657 times 21500 Btugal = 10013 Btugal EtOH Assumed corn ethanol yield 272 galbu (denatured)
d Corn butanol yield 150 galbu of corn e Source Mueller and Cuttica (2006) f Aspen Plusreg results from this study includes heat for evaporation fermentation distillation and gas
stripping
TABLE 8 Electricity Consumption in Bio-Butanol Plants
BtOH Plant BtOH Plant EtOH Plant Electricity Required Electricity Required
Electricity Required Based on Feed Corn Based on BtOH Item (kWhgal EtOH) (kWhbu) (kWhgal BtOHa)
EtOH plantb 075 204 EtOH plant excluding 068c 184 123 fermentation and distillation ABE fermentation and 053d
separation BtOH plant total 176
a Converted from kWhbu to kWhgal BtOH with a corn butanol yield of 150 galbu b Source Mueller and Cuttica (2006) Converted to per bushel with an assumed corn ethanol yield of 272
gal denatured ethanolbu Calculated on the basis of USDA dry mill model fermentation requirement 006 kWhgal EtOH and 001 kWhgal for distillation are subtracted from 075 kWhgal EtOH
d Electricity needs from ABE fermentation and separation Aspen Plusreg results from this study
c
21
Scale-up from pilot test to full-scale commercial production could change the yield and energy consumption These factors affect the overall bio-butanol production and energy use estimates
42 BUTANOL LIFE-CYCLE PARAMETERS
Bio-butanol in this study is produced from corn It would be economical for the bioshybutanol plant to be built near corn farms to reduce transportation costs Operations associated with corn farming and feedstock transportation would be similar to those for corn Bio-butanol produced from corn will displace gasoline therefore transportation storage and distribution of bio-butanol would be similar to those of ethanol Table 9 presents key assumptions and GREET inputs for the bio-butanol life-cycle analysis Electricity for the bio-butanol plant is supplied from the US electric generation mix (Table 10)
TABLE 9 GREET Input Parameters for Corn Butanol WTW Analysis Corn Farming Transportation of Corn and Butanol and Vehicle Operation
Parameters Assumptions
Corn yield (buharvested acre) 158 Ratio of harvested acreage to planted 09 acreage Fertilizer use (gbu) N = 420 P2O5 = 149
K2O = 174a
CO2 emissions from potential land use 195 changes of farming (gbu) Lime use (gbu) 1202 Corn transportation mode and distance (mi) Truck (100) 50 Butanol transport and distance (mi) Barge (40) 520 Rail (40) 800 Truck (20) 110 On-road fuel economy of LDVs fueled with 248 bio-butanol (migal gasoline equivalent)
a N = nitrogen P2O5 = phosphorus fertilizer and K2O = potash fertilizer
22
To clearly show the energy and emission TABLE 10 US Average Electricity effects of bio-butanol vs gasoline we assumed in this Generation Mix Used in this Studya
study that bio-butanol is used in pure form in GVs and that butanol could achieve the same fuel economy per gallon gasoline equivalent as gasoline-powered Source Percent of Total
GVs (Table 9) WTW results are expressed in a per-million-Btu fuel matrix for comparison In reality Residual oil 27
bio-butanol may be used in various gasoline blends Natural gas 189
The per-million-Btu base system is more appropriate Coal 507
from a fuel supply perspective Because energy and Nuclear power 187
emission results are presented in Btu or grams per Biomass 13
million Btu of fuel produced and used the effects of Others 77
differences in fuel economy are removed a Source GREET year 2010
43 CO-PRODUCT CREDIT
During bio-butanol production several co-products are generated along with butanol mdash these include acetone DDGS a small amount of ethanol fatty acids (butyric acid and acetic acid) and H2 gas On the scale that we analyzed acetone is the major co-product of the bioshybutanol plant with 82000 metric tons produced per year Acetone contributes to more than one-half (by weight) of the butanol production The bio-butanol plant also generates 253600 metric tons of DDGS (11 moisture) per year mdash the second large co-product The yield of ethanol is relatively small (Tables 3 and 4) (similar to the level of fatty acid mixtures) Ethanol yield from ABE fermentation accounts for 15 of total ABE (acetone butanol and ethanol) by weight and only 12 by energy content (Btubu of corn) (Table 4) Although the fatty acids could be separated further purified from the liquid discharge stream and sold for use in the chemical market the separation step has not yet been tested with ABE fermentation In this Aspen Plusreg
simulation the fatty acids were not separated and purified and so they were not treated as coshyproducts
Significant amounts of H2 and CO2 gas were produced from fermentation these gases were used internally for gas stripping and then for maintaining anaerobic conditions for ABE fermentation The H2 could be separated as a fuel product if high-purity nitrogen gas is used in place of fermentation gas However using such nitrogen gas to maintain anaerobic conditions and for stripping in large-scale operation could be cost prohibitive Further studies to evaluate the engineering economics of alternative approaches for process operation while economically producing bio-butanol and hydrogen would be beneficial In this initial attempt to address the life cycle of bio-butanol H2 was not considered as a co-product
We partitioned total energy and emissions into bio-butanol and the co-products by using two methods product displacement and energy allocation Co-product displacement (Case 2) is based on the concept of displacing the current product with the new product In this case bioshyacetone is regarded as a renewable chemical The energy consumed and the emissions that occur during bio-acetone production displace the energy and emissions associated with petroleum-based acetone production Energy and emission accredits from the acetone displacement are
23
assigned to bio-acetone Similarly DDGS generated from corn butanol production contains 267 protein by weight which is close to the amount of protein contained in the DDGS from the corn ethanol process With the assumptions that the nutritional values of DDGS from the two processes are similar the DDGS from the bio-butanol plant displaces traditional animal feed (soy protein and corn) the production pathway of which is already in place in GREET
The limitation of using the displacement method for the bio-butanol life-cycle analysis is the large amount of acetone that is co-produced with butanol While the main product mdash butanol mdash accounts for 63 (wtwt) of the total product yield (acetone butanol and ethanol) acetone accounts for 35 (wtwt) (Table 3) Our previous study (Wu et al 2005) suggested that when the share of energy co-products increases the co-product displacement method could yield misleading results Therefore other partitioning methods such as energy allocation should be examined
For Case 3 we applied the product energy allocation method to co-products in which emission and energy burdens are allocated among products according to their energy output shares from the bio-butanol plant In the energy allocation method shares of output product energy for each product are determined according to the heating value Energy use and associated emissions from bio-butanol production and from upstream feedstock production and transportation activities are partitioned among acetone butanol ethanol and DDGS on the basis of their corresponding energy shares This approach treats all energy products from the production process as equal regardless of the form and quality differences among them It also implies that all four products are energy products The energy allocation method is applicable to this case because of the ABE products both butanol and ethanol are liquid fuels Although TABLE 11 Co-Product Energy Partitioningacetone is normally regarded as a chemical by Energy Allocationa
solvent and feedstock its energy content (in LHV) is in fact in between that of butanol and ethanol (Table 1) Furthermore DDGS has a Bio- Bio- Bio-
Butanol Acetone DDGS EthanolLHV of 8703 Btulb and can be used as a solid fuel for ethanol plant operations Several 40 19 40 001 ethanol plants are currently exploring DDGS
acombustion or gasification such as Corn Plus Based on energy contentto provide heat and power Although the fuel quality of DDGS is lower than that of the liquid fuels considering its large quantity (Table 3) use of DDGS for process heat brings energy savings and yet relaxes pressure on the already stagnant DDGS market Table 11 presents energy shares based on product energy (in Btu)content
We also established a case to consider the impact of overproduction of acetone (Case 4) In this case an overabundance of acetone produced by a large-scale butanol industry would flood the acetone market consequently losing its commercial value Case 4 is the same as Case 2 except that it treats acetone as a waste stream (ie corn-acetone is not credited) This case provides an extreme scenario for bio-butanol
24
44 CRADLE-TO-USER ASSESSMENT OF PETROLEUM ACETONE AND DISPLACEMENT
441 Petroleum Acetone and Feedstocks Production
To evaluate the energy and emissions benefits of producing bio-acetone in a corn butanol plant we performed a cradle-to-user analysis of petroleum-based acetone mdash from feedstock extraction to acetone delivery to the user site Acetone is almost exclusively produced via cumene peroxidation as a co-product with phenol Its main use is as a chemical intermediate in the manufacture of acetone cyanohydrin for methyl mechacrylate biphenol A and adol chemicals Direct solvent use accounts for about 30 of world demand for acetone
A synthetic process based on hydrocarbons or derivatives is now accounted for all acetone production in the United States and nearly all production in other countries In this process acetone is co-produced with phenol from cumene The yield of acetone from this process averages 221 units of cumene per unit of acetone by weight (Camara-Greiner 2005) Cumene is produced via alkylation of benzene with propylene under elevated temperatures and pressures in the presence of a catalyst Upstream from cumene production benzene is produced principally through a catalytic reforming from naphtha in a BTX (benzene toluene and xylene) process The other feedstock for cumene propylene is one of a half dozen products from crackers receiving raw hydrocarbon (naphtha) from oil refineries as well as natural gas Figure 5 presents a schematic of cradle-to-user petroleum acetone production
442 Assumptions and Data Sources
The cradle-to-user analysis system boundary for petroleum acetone includes resource extraction feedstock production acetone production process fuel production and associated transportation Our petroleum acetone production data are based on the life-cycle inventory (LCI) of Eco-Profile (Boustead 2005)
Eco-Profile Reports compiled average industry data and assembled detailed environmental data for various petrochemical processes We noted system boundary differences in the transportation and upstream fuel production stages between the Eco-Profile and the GREET database To ensure a consistent system boundary for all seven cases with current GREET biofuel pathways we selected feedstock production (under category ldquofeedstock energyrdquo in Eco-Profile) and the amount of process fuel used in production of acetone feedstocks and acetone (under category ldquoenergy content of delivered fuelrdquo in Eco-Profile) to arrive at our energy estimate for petroleum acetone The GREET default energy values were used for upstream fuel production (oil extraction refining and transportation) transport of feedstocks and transport of acetone to users Direct emissions from production processes (under category ldquoprocessrdquo in Eco-Profile) from Eco-profile were used for our petroleum acetone cradle-to-user estimate Emissions associated with upstream fuel production and all transportation activities were based on GREET values Table 12 presents data sources for each life-cycle step in petroleum acetone production
25
TABLE 12 Assumptions and Data Sources of Cradle-to-User Petroleum Acetone
Cradle-to-User Stage Data Sources
Crude extraction for process fuel Crude transport for process fuel GREET 17 Oil refining and transport for process fuel
Cumene transporta GREET 17
Acetone production (life-cycle value)b Eco-Profile
a Benzene and propylene were assumed to be captive Acetone is for captive use in the acetone production facility to produce acetone cyanohydrin biphenol A and adol chemicals Cumene is transported to acetone production facility
b Cumene production value is not available
The hypothetical corn butanol plant is located in the US Corn Belt to reduce corn transportation costs We assumed that acetone produced from the corn butanol plant would displace petroleum acetone produced in the region of Petroleum Administration for Defense Districts (PADD) II (EIA 2004) PADDs were delineated during World War II to facilitate oil allocation PADD II includes 14 Midwest states and overlaps with the Corn Belt where most corn-based plants would operate We identified the mass flow for cumene and acetone production and transportation in PADD II on the basis of a Chemical Economics Handbook (CEH) Marketing Research Report (Camara-Greiner 2005) In this region 85 of total cumene is produced from captive benzene and propylene (that is benzene and propylene are produced and consumed on-site) The cumene is purchased by and subsequently transported to the acetone producer
Major assumptions for cradle-to-user analysis of petroleum acetone are listed below
bull Process fuels used in the acetone pathway are electricity oil and natural gas
bull Electricity is purchased from the grid with the US average generation mix (Table 10)
bull Cumene production feedstocks (benzene and propylene) are captive in the refinery so no transportation is associated with these feedstocks
bull The acetone production facility purchases 100 of feedstock cumene
bull Cumene needs for the acetone producer is estimated on the basis of the mass unit ratio of 221 units of cumene per unit of acetone (Camara-Greiner 2005)
26
bull Cumene is transported to the acetone production facility an average distance of 323 miles in a 1028-Btuton-mi Class 8 diesel truck
Table 13 presents the heating values used in Eco-Profile and GREET In this assessment energy data are expressed in LHV of Btu or kWhkg acetone produced When there was a discrepancy in LHV between Eco-Profile and GREET for same fuel or chemical the GREET value was selected to ensure consistency with the baseline fuel pathways of petroleum gasoline and corn ethanol The energy data from Eco-Profile are converted according to the ratio of LHV Eco-ProfileLHV GREET (Table 13)
TABLE 13 Low-Heating-Value Comparison for this Studya
Fuel
GREET (Btugal Btuscf)
Eco-Profile (MJkg)
Eco-Profile (Btugal Btuscf)
Ratio LHV EcoGREET
Fuel oil NG
140353 983
405 4816
144176 1005
103 102
a Unit for fuel oil is Btugal unit for natural gas is Btuscf
443 Petroleum Acetone Displacement
We assumed that the corn-based butanol plant would be built near a corn farm in the Midwest PADD II region and operated at a production scale of 150000 metric tons of bioshybutanol per year With a mass production ratio of 056 lb of bio-acetone per pound of bioshybutanol this facility could yield 82461 metric tons of bio-acetone annually mdash 16 of the total acetone production in PADD II and 4 nationwide We assumed that bio-acetone would be transported to acetone consumers via train (500 miles) and truck (100 miles) within PADD II
In the co-product displacement approach (Case 2) petroleum acetone is displaced by corn-based acetone from cradle to user The displacement is carried out in the following sequence the cradle-to-gate results of petroleum acetone (as illustrated in Figure 5) were first subtracted from the WTW results of bio-butanol and then the energy or emissions values associated with bio-acetone transportation from the bio-butanol plant to the acetone user were added
27
FIGURE 5 System Boundaries for Cradle-to-User Pathway of Fossil-Based Acetone and Corn-Based Acetone
28
29
5 RESULTS AND DISCUSSION
51 ENERGY CONSUMPTION AND GHG EMISSIONS
Corn-derived butanol achieves substantial fossil energy savings (39ndash56) compared with gasoline ([Cases 3 and 2] Figure 6) on a life-cycle basis In Cases 2 and 3 bio-butanol production contributes to a positive energy balance (defined as fossil energy used in gasoline production minus fossil energy used in bio-butanol production) Without acetone credit as in Case 4 in which acetone is regarded as a waste bio-butanol production is not an option for fossil energy savings
The primary fuel consumed in the bio-butanol life cycle is natural gas followed by petroleum oil and coal (Figure 6) Although electricity generation uses 50 of coal (Table 10) the amount of electricity required is relatively small (Table 8) and so only 9ndash17 of total fossil energy use is from coal (Cases 3 and 2) A life-cycle fossil energy breakdown (Figure 7) indicates that about three-fourths of the fossil fuel is spent in the butanol production plant (73) Corn cultivation accounts for a total of 23 of WTW fossil energy (12 for agricultural chemical and fertilizer manufacturing and 11 for farming operations) In the butanol plant the majority of natural gas demand comes from the process steam requirement (Table 5) which leads to 115000 Btu per gallon of butanol produced mdash approximately three times that of corn ethanol production before co-products are allocated As we pointed out earlier this estimate tends to be conservative because it did not reflect the lower heating requirement for DDGS drying in the bio-butanol plant The water requirement in biological fuel production drives the energy balance in the plant A higher concentration of product in fermentation reduces energy needs for product concentrating in subsequent process steps Historically improvement of ethanol concentration in a fermentor from ~8 in 1980s to 20 at present demonstrates in part the lower energy cost in ethanol plant operation The ABE fermentation process evaluated in this study achieved a concentration of 19 (wtwt) of total solvents (ethanol butanol and acetone) in a fermentor With rapid in-situ removal of solvent by gas stripping the process is able to increase feed concentration to improve production rate while minimizing butanol inhibition Although using concentrated feed in fermentation effectively reduces about 14 of the steam requirement (Table 5) solids concentration in the fermentor mdash an important issue in process development and operation mdash remains a constraint
Vehicles fueled by bio-butanol achieve small to moderate reductions in GHG emissions relative to gasoline vehicle on a WTW basis in Cases 2 (8 displacement ) and 3 (32 energy allocation) (Figure 8) For every million Btu of bio-butanol used in place of one million Btu of gasoline 8ndash32 kg of GHG emissions could be avoided (Cases 2 and 3) The GHG emissions profile for the bio-butanol production option in this study is similar to that of corn ethanol Of total GHG emissions in the bio-butanol WTW cycle over 70 by weight of the GHGs are from CO2 less than 5 is from methane and the remaining 18ndash21 is from N2O (Figure 9) Natural gas consumption in butanol plant is the major cause of GHG emission
We assumed that vehicles fueled by bio-butanol would offer performance similar to that of vehicles fueled by gasoline We have not found any vehicle testing data to confirm this
-
30
assumption Vehicle testing with butanol should be conducted to evaluate butanolrsquos performance in vehicles under realistic driving conditions
52 EFFECT OF ACETONE CO-PRODUCT CREDIT
Energy partitioning for co-products has a significant effect on overall energy use and associated GHG emissions The three cases that we examined (2 3 and 4) presented different options for acetone When acetone is regarded as a fuel and credit is allocated on the basis of product energy content (Case 3) the WTW analysis yields moderate fossil energy and GHG emissions benefits for bio-butanol When acetone is used as a renewable chemical to displace petroleum acetone via the displacement method (Case 2) the results of analysis show 17 savings in fossil fuel (Figure 6) and small reductions in GHG emissions (Figure 8) However treating acetone as a waste stream (Case 4) resulted in an increase of almost one million Btu in fossil energy and 40000 g of GHG emissions (compared with gasoline) for each million Btu of bio-butanol produced The difference is largely attributable to the acetone credit Feedstocks for petroleum-based acetone production (propylene and benzene [Figure 5]) are produced from naphtha and natural gas mdash 100 fossil feedstock (Lacson et al 2005) Another factor is the high yield of acetone from the ABE process 056 lb acetone per pound of butanol These two factors suggest that a significant portion of fossil energy use in petroleum acetone production will be regarded as a credit when bio-acetone displaces fossil acetone which eventually leads to a small fossil energy value (Figure 6)
-500000
0
500000
1000000
1500000
2000000
WTW
Fos
sil E
nerg
y U
se (B
tum
mB
tu) Petroleum
NG
Coal
Co product allocation based on displacement
Co-product allocation based on product energy value
Butanol Ethanol Butanol Butanol Ethanol Gasoline (Case 3) Dry mill (Case 2) (Case 4) Dry mill (Case 1)
(Case 6) (Case 5)
FIGURE 6 Well-to-Pump Fossil Energy Breakdown for Bio-Butanol and Corn Ethanol Compared with Gasoline Using Different Co-Product Allocation Methods (negative value indicates fossil energy avoided)
31
Vehicle Fuel Transport Bio-butanol
Net Consumption in Production
Plant 73
Corn Transport
2
Corn Farming 11
Fertilizer Manufacture
12
Operation 02
FIGURE 7 Breakdown of Fossil Energy Use in Various Stages of Fuel Life Cycle for Corn-Based Butanol (Case 3)
Butanol Ethanol Butanol Butanol Ethanol Gasoline (Case 3) Dry mill (Case 2) (Case 4) Dry mill (Case 1)
(Case 6) (Case 5)
FIGURE 8 Life-Cycle GHG Emissions of Bio-Butanol and Ethanol Compared with Gasoline Using Different Co-Product Allocation Methods
0
20000
40000
60000
80000
100000
120000
140000
WTW
GH
G E
mis
sion
s (g
CO
2 eq
uiva
lent
GH
Gm
mB
tu)
32
80000
60000
40000
20000
0 Butanol (Case 3) Ethanol Dry mill (Case 6)
FIGURE 9 Life-Cycle GHG Emission Breakdown for Bio-Butanol and Ethanol (Energy Allocation)
The displacement method provides significant benefits in terms of reductions in the use of fossil energy (Figure 6) but relatively small reductions in GHG emissions (Figure 8) The main reason for this phenomenon is that petroleum acetone production extracts carbon from a fossil resource and transforms the carbon to another bounded form (chemical) with net GHG emissions generated from consumption of the process fuel In its life cycle petroleum acetone is primarily used as a chemicalfeedstock with a fraction as solvent Although a small amount of carbon embedded in petroleum acetone may escape to the atmosphere through volatilization during product application (ie use as solvent) the majority ultimately ends up as a solidliquid chemical in a bound form rather than being emitted to the air as CO2 By displacing petroleum acetone with bio-acetone in this case the life-cycle reductions in fossil energy use do not translate to benefits in terms of GHG emissions
53 COMPARISON OF BIO-BUTANOL WITH CORN ETHANOL
The ABE process simulated in this study appears to be as efficient in producing acetone butanol and ethanol on a weight basis as current corn dry mills (Table 14) Measured by gallon or gram of ABE the yields from the ABE process are similar to ethanol yields from a conventional dry mill As a rule of thumb in ethanol produced from corn dry milling one-third of the feed mass goes to ethanol one-third is left in DDGS and one-third is emitted as CO2 The
WTW
GH
G E
mis
sion
s B
reak
dow
n(g
ram
CO
2 eq
uiv
per
milli
on B
tu)
N2O
CH4
CO2
33
TABLE 14 Acetone Butanol and Ethanol Outputs from Corn Compared with Ethanol from Conventional Corn Mills
Corn Butanol Plant Ethanol from Corn
Acetone Butanol Ethanol Total Dry Mills
Btubu corn 69525 149267 2828 221620 (with 198458 acetone) 152095 (without acetone)
Galbu corna
gCg cornb 087
0074 150 0137
004 0003
240 0214
260 0172
a Un-denatured b Based on dry corn feed
ABE process examined in this study follows TABLE 15 Co-Product Yields (gg corn)almost the same rule one-third of the feed mass ends up in the products (acetone butanol and
Acetone Butanolethanol) one-third remains in DDGS and about Ethanol DDGS CO2one-third (30) is emitted as CO2 (Table 15) (the remaining ~3 ends up in fatty acids [butyric and 034 033 030 acetic acids] and losses) Acetone 0119
Butanol 0212 Because acetone is not used as a fuel at Ethanol 0005
present net fuel production (butanol and ethanol) is small A typical dry mill can deliver 272 galbu of fuel ethanol or 26 galbu of undenatured ethanol which is ~11 gal more than the butanol and ethanol yield together from the ABE process (154 galbu) (Table 14) On the other hand butanol contains 30 more energy (LHV) than ethanol (Table 1) by volume When we take fuel energy yield into consideration each bushel of corn could generate nearly 152000 Btu of liquid fuels from the ABE process (butanol and ethanol together) while the same bushel delivers 198000 Btu of liquid fuels (undenatured ethanol) from the conventional ethanol dry mill (46000 Btu more than the bio-butanol option) Hence from a liquid fuel production perspective the ABE process option does not offer an increase in renewable fuel production in comparison with conventional corn ethanol production
Process fuel use for ABE production could be a major hurdle as indicated in Table 16 A bushel of corn requires 82 more steam and 34 more electricity to produce ABE from a bioshybutanol plant than to produce ethanol from a corn dry mill If the first corn butanol plant is built from an existing corn dry mill that has been retrofitted the implication is that operation cost will be high To build a new corn butanol plant capital cost may be lower because of the reduced footprint in fermentation and downstream processing relative to the existing dry mill but the plant would have increased process fuel cost mdash especially given the current price for natural gas
34
TABLE 16 Process Fuel Use in Bio-Butanol and Ethanol Production Plant
Fuel Bio-butanol Plant Ethanol Dry Mill Ratio of Butanol
to Ethanol
Natural gas (Btubushel of corn) Electricity (kWbushel of corn)
172108
263
94320
197
182
134
Another concern is the feedstock supply for bio-butanol The current ABE process shares the same starch-based feedstocks with conventional corn ethanol Development of bio-butanol through the ABE process could take limited feedstocks away from conventional corn ethanol production RampD efforts in bio-butanol may need to be directed toward identifying new feedstocks and process technologies In fact Qureshi (2007) recently reported on a study using cellulosic biomass as feedstock for bio-butanol production via the ABE process Because ABE fermentation is from glucose the results of ongoing RampD on cellulosic pretreatment for cellulosic ethanol could be applied to the ABE process
54 CRADLE-TO-USER COMPARISON OF BIO-ACETONE WITH PETROLEUM ACETONE ISSUES AND CONCERNS
Use of bio-acetone to displace petroleum acetone shows promising energy and environmental benefits (Figure 10) from a life-cycle perspective Conventional acetone production is a fossil-energy-intensive process By producing acetone from corn manufacturers could save a significant amount of total fossil energy mdash up to 71 relative to petroleum-based acetone The renewable acetone achieves energy savings of 91 for petroleum and 58 for natural gas Figure 11 further shows the life-cycle fossil energy distribution between the two The majority of fossil energy use shifts from feedstocks (57) in the petroleum acetone production process to acetone production (70) in the corn acetone production process
Bio-acetone in this study is produced from corn mdash a renewable agricultural resource that absorbs atmospheric CO2 during its growth The carbon in CO2 is converted to organic carbon in the corn and is further transformed and embedded in acetone through the ABE process Therefore we allocated a renewable carbon credit to bio-acetone for the carbon embedded in corn As illustrated in Figure 12 a net carbon sequestration would occur from cradle to user GHG emissions would be much higher mdash about 500 glb acetone produced if the carbon in acetone is from non-renewable sources
Although bio-acetone production results in positive WTW energy benefits and decreased GHG burdens several issues and concerns need to be addressed In 2005 a total of 19 million metric tons of acetone was produced in the United States (Camara-Greiner 2005) PADD II which overlaps with the US corn belt would most likely to be the location for corn-based
35
butanol plants Production of petroleum acetone in this region in 2005 was 505000 metric tons representing 26 of total US production If bio-acetone were produced from a single simulated bio-butanol plant located in this region the volume of bio-acetone would be about 16 of the total petroleum acetone production in the region and 4 nationwide Furthermore assuming that total bio-butanol production levels could reach a quarter of the production level of corn ethanol of 49 billion gallons (2006) the amount of corn feed used for bio-butanol production could generate 676 million gallons of bio-butanol and 391 million gallons (12 million metric tons) of bio-acetone At this production scale the acetone market would be flooded with both bio- and petroleum acetones dramatically decreasing the market value of acetone Thus one may argue that acetone should be treated as a waste stream (as we did in Case 4) Aside from the fossil energy and GHG benefits (within WTW analysis boundaries) that may result from the production of bio-butanol we should consider the emission of liquid acetone into the environment if acetone is treated as a waste stream On the basis of a value of 0074 g of carbon generated in acetone from each gram of corn if all of the carbons contained in acetone were converted to gaseous CO2 approximately 6900 g of CO2 could be emitted to the atmosphere per bushel of processed corn Acetone-containing water in such high volumes could become a major source of atmospheric VOC and CO2 emissions
Unfortunately the outlook for replacement of petro-chemicals with bio-chemicals is far from clear Petroleum acetone is currently generated as a by-product during phenol production from cumene On average 061 lb of acetone is obtained per pound of phenol produced (SRI Consulting 2005) The United States consumed $21 million metric tons of phenol in 2004 (SRI Consulting 2007) Worldwide the consumption of phenol grows at a rate of 41 per year As demand for phenol continues to rise petroleum acetone will be produced with or without the presence of bio-acetone In the ABE process studied the bio-acetone is also a co-product New technologiesprocesses that significantly reduce the acetone that results from phenol and ABE production are therefore needed In fact at the time of this study DuPont was making considerable progress in molecular biology which led to a patent award for a recombinant bacterium that produces butanol exclusively from biological feedstocks (DuPont 2007) Other potential research directions include exploring the use of acetone as a fuel blend and as a feedstock for new chemicals
36
0
5000
10000
15000
20000
25000
30000
Cra
dle-
to-U
ser F
ossi
l Ene
rgy
Use
(Btu
lb A
ceto
ne)
Petroleum Natural Gas Coal
Corn-Acetone Petroleum-Acetone
FIGURE 10 Fossil Energy Use Based on the Production of Bio-Acetone Compared with Fossil Energy Use Based on the Production of Petroleum Acetone
37
8127 Btu of fossil per lb of corn acetone a) bio-Acetone
Fuel Transport
3 Corn Farming 12
Fertilizer Manufacture
13
Corn Net Transport
Consumption 2 in Production
Plant70
27818 btu of fossil per lb of acetone Feedstock and
acetone
b) Petroleum-Acetone
Acetoneproduction -Co-product
Credit40 Feedstock
production 57
transportation 3
FIGURE 11 Fossil Energy Consumption Breakdown for (a) Bio-Acetone and (b) Petroleum Acetone
38
Cra
dle-
to-U
ser G
HG
Em
issi
ons
(g C
O2-
equi
vlb
ace
tone
)
1500
1000
500
0
-500
-1000 Corn-Acetone Petroleum-Acetone
CO2 CH4 N2O
Net CO2 emission - 304gCO2 equivlb
Net CO2 emission 738gCO2 equivlb if carbon is not sequested
FIGURE 12 GHG Emissions Generated or Avoided by Bio-Acetone Production Compared with Petroleum Acetone Production
39
6 CONCLUSIONS
Our conclusions based on the results of our study include the following
bull Corn-based butanol produced by means of the current ABE process could offer substantial fossil energy savings and moderate reductions in GHG emissions relative to petroleum gasoline on a WTW basis when co-products are credited by energy allocation
bull The energy benefits associated with bio-butanol are significant when coshyproduct corn-acetone is credited with displacement method
bull When acetone is credited by energy allocation life-cycle energy benefits for corn butanol are less promising than those of corn ethanol generated from conventional dry milling processes GHG emissions generated from bioshybutanol life cycle are higher than those generated from corn ethanol
bull From a liquid fuel production standpoint the ABE process examined may not be as effective as conventional corn ethanol production in that it produces less liquid fuel (on an energy basis) per bushel of corn than the corn ethanol process in addition to increased process fuel use in the production plant
bull The impacts of corn-acetone (produced via the ABE process) on the acetone market need to be carefully examined and new uses for bio-acetone need to be explored
40
41
7 REFERENCES
Boustead I 2005 ldquoEco-Profiles of the European Plastic Industry Acetonerdquo Plastics Europe March available at httpwwwplasticseuropeorgContentDefaultaspPageID=392 accessed Dec 2006
Brinkman N M Wang T Weber and T Darlington 2005 GM Study Well-to-Wheels Analysis of Advanced FuelVehicle Systems ndash A North American Study of Energy Use Greenhouse Gas Emissions and Criteria Pollutant Emissions May httpwwwtransportationanlgovpdfsTA339pdf
Collins K 2007 The New World of Biofuels Implications for Agriculture and Energy Presented at EIA Energy Outlook Modeling and Data Conference March Washington DC
Conti J 2007 Annual Energy Outlook 2007 presentation at EIA Energy Outlook Modeling and Data Conference March Washington DC
Dadgar AM and GL Foutch 1988 ldquoImproving the Acetone-Butanol Fermentation Process with Liquid-Liquid Extractionrdquo Biotechnology Progress 4 36ndash39
DuPont 2007 Fermentive Production of Four Carbon Alcohols World Patent Application WO2007041269 USPTO PCTUS2006038007
EIA see Energy Information Administration
Energy Information Administration 2004 httpwwweiadoegovpuboil_gaspetroleum analysis_publicationsoil_market_basicspaddmaphtm accessed May 15 2007
Energy Information Administration 2007 Annual Energy Outlook 2007 DOEEIA-0383(2007) available at httpwwweiadoegovoiafaeopdf0383(2007)pdf accessed May 23 2007
Ezeji TC N Qureshi and HP Blaschek 2004 ldquoAcetone Butanol Ethanol (ABE) Production from Concentrated Substrate Reduction in Substrate Inhibition by Fed-Batch Technique and Product Inhibition by Gas Strippingrdquo Appl Microbiol Biotechnol 63 653ndash658
Ezeji TC PM Karcher N Qureshi and HP Blaschek 2005 ldquoImproving Performance of a Gas-Stripping-Based Recovery System to Remove Butanol from Clostridium Beijerinckii Fermentation Bioprocess Biosyst Eng 27 207ndash214
Guibet J-C 1997 Carburants et Moteurs Technologies Energie Environnement Publication de lrsquoInstitut Franccedilais du Peacutetrole ISBN 2-7108-0704-1
Heckl I Z Kovacs F Friedler LT Fan and J Liu 2006 ldquoAlgorithmic Synthesis of an Optimal Separation Network Comprising Separators of Different Classesrdquo Chemical Engineering and Processing doi101016jcep200606013
42
Huang WC DE Ramey and ST Yang 2004 ldquoContinuous Production of Butanol by Clostridium Acetobutylicum Immobilized in a Fibrous Bed Bioreactorrdquo in Applied Biochemistry and Biotechnology mdash Part A Enzyme Engineering and Biotechnology 113ndash116 887ndash898
Intergovernmental Panel on Climate Change (IPCC) 2001 Climate Change 2001 the Scientific Basis Technical Summary of the Group I Report
Intergovernmental Panel on Climate Change (IPCC) 2007 Working Group I The Physical Basis of Climate Change IPCC WG1 AR4 report available at httpipcc-wg1ucareduwg1 wg1-reporthtml accessed May 23 2007
IPCC see Intergovernmental Panel on Climate Change
Kwiatkowski JR McAloon AJ Taylor F Johnston D 2006 Modeling the process and costs of the production of fuel ethanol by the corn dry-grind process Industrial Crops and Products V23 Issue 3 p288-296
Lacson JG 2004 ldquoPropylenerdquo in Chemical Economics Handbook (CEH) Marketing Research Report SRI Consulting Menlo Park Calif
Liu J 2003 Downstream Process Synthesis for Biochemical Production of Butanol Ethanol and Acetone from Grains PhD Dissertation Kansas State University Manhattan KS
Liu J LT Fan P Seib F Friedler and B Bertok 2004 ldquoDownstream Process Synthesis for Biochemical Production of Butanol Ethanol and Acetone from Grains Generation of Optimal and Near Optimal Flowsheets with Conventional Operating Unitsrdquo Biotechnol Prog 20 1518ndash1527
Liu J LT Fan P Seib F Friedler and B Bertok 2006 ldquoHolistic Approach to Process Retrofitting Illustration with Downstream Process for Biochemical Production of Organicsrdquo Ind Eng Chem Res 45 4200ndash4207
Marlatt JA and R Datta 1986 ldquoAcetone-Butanol Fermentation Process Development and Economic Evaluationrdquo Biotechnology Progress 2 23ndash28
McAloon A 2006 Shelled Corn to Ethanol Process Energy Analysis Aspen + reg MGY Dry Grind Ethanol Process Model ERRCARSUSDA
Morey V et al 2006 Characterization of Feed Streams and Emissions from Biomass GasificationCombustion at Fuel Ethanol Plants American Society of Agricultural and Biological Engineers (ASABE) Presentation Paper Number 064180 July Portland Ore
Mueller S and J Cuttia 2006 Research Investigation for the Potential Use of Illinois Coal in Dry Mill Ethanol Plants prepared by the Energy Resources Center at University of Illinois at Chicago for the Illinois Clean Coal Institute and the Illinois Department of Commerce and Economic Opportunity Oct
43
Mueller S 2006 Energy Resources Center University of Illinois at Chicago Chicago Ill personal communication to May Wu of Argonne National Laboratory Argonne Ill
Natural Resources Canada 2007 ldquoThe Addition of Bio-Butanol to GHGenius and a Review of the GHG Emissions from Diesel Engines With Urea SCRrdquo NRC Report prepared by (SampT)2
Consultants BC Canada
Parekh M J Formanek and HP Blaschek 1999 ldquoPilot-Scale Production of Butanol by Clostridium Beijerinckii BA 101 Using a Low-Cost Fermentation Medium Based on Corn Steep Waterrdquo App Microbiol Biotechnol 51 152ndash157
Qureshi N and HP Blaschek 1999 Economics of Butanol Fermentation Using Hyper-Butanol Producing Clostridium Beijerinckii BA 101rdquo Trans Institution of Chemical Engineers 78 (Part C) 139ndash144
Qureshi N and HP Blaschek 2001a ldquoABE Production from Corn A Recent Economic Evaluationrdquo Journal of Industrial Microbiology amp Biotechnology 27 292ndash297
Qureshi N and HP Blaschek 2001b ldquoRecovery of Butanol from Fermentation Broth by Gas Strippingrdquo Renewable Energy 22 557ndash564
Qureshi N 2007 Bioconversion of Agricultural Residues to Butanol Simultaneous Saccharification Fermentation and Product Recovery Presentation at the 29th Symposium on Biotechnology for Fuels and Chemicals Denver CO
Roddy W 2006 Dry Mill Ethanol Plants Environmental Impacts and Future Growth ICM Presented at Governorsrsquo Ethanol Coalition Feb
SRI Consulting 2005 Chemical Economics Handbook (CEH) Marketing Research Report Menlo Park Calif
SRI Consulting 2007 Chemical Economics Handbook (CEH) Marketing Research Report Menlo Park Calif
White and Johnson 2003 Corn Chemistry and Technology 2nd edition
Wu M Y Wu M Wang 2005 Mobility Chains Analysis of Technologies for Passenger Cars and Light-Duty Vehicles Fueled with Biofuels Application of the GREET Model to the Role of Biomass in Americarsquos Energy Future (RBAEF) Project Argonne National Laboratory Report May available at httpwwwtransportationanlgovpdfsTA344pdf
44
45
APPENDIX
46
47
APPENDIX
A1 PARAMETERS FOR CORN BUTANOL LIFE-CYCLE ANALYSIS
Corn Farming Energy UseFertilizer Use
Nitrogen P2O5 K2O CaCO3
Pesticide Use Herbicide Insecticide
Corn Transportation From Field to Stacks
Truck Share Distance
From Stacks to Plants Truck
Share Distance
Butanol Production Energy Use
Thermal Energy Electricity
Yield Butanol Acetone DDGS
22500 Btubu
420 gbu 149 gbu 174 gbu
1202 gbu
810 gbu 068 gbu
100 10 mi
100 40 mi
115114 Btugal BuOH 176 kWhgal BuOH
150 galbushel 380 lbgal BuOH 1166 lbgal BuOH
Butanol Transportation and Distribution Transportation
Barge Share Distance
Rail Share Distance
Truck Share Distance
40 520 mi
40 800 mi
20 110 mi
GREET corn-EtOH pathway
GREET corn-EtOH pathway GREET corn-EtOH pathway GREET corn-EtOH pathway
GREET corn-EtOH pathway
GREET corn-EtOH pathway GREET corn-EtOH pathway
GREET corn-EtOH pathway GREET corn-EtOH pathway
GREET corn-EtOH pathway GREET corn-EtOH pathway
see report see report
see report see report
see report
see report see report
see report see report
see report see report
48
Distribution Truck
Share 100 see report Distance 30 mi see report
Butanol Combustion in Vehicles On-Road Fuel Economy
245 migal see report
A2 PARAMETERS FOR PETROLEUM-BASED ACETONE ANALYSIS
Energy Use Energy Used as Process Fuel Electricity 031 kWhkg acetone see report
Oil 9337 Btukg acetone see report NG 10678 Btukg acetone see report
Energy Used as Feedstock Oil 12961 kWhkg acetone see report NG 18908 kWhkg acetone see report
Cumene Transportation Truck
Share 100 Distance 323 mi see report Fuel economy 50 migal see report
A3 TRANSPORTATION FOR CORN-ACETONE
Rail Share 100 see report Distance 500 mi see report
Truck Share 100 see report Distance 100 mi see report
A4 FUEL SPECIFICATIONS
Butanol Low heating value 99837 Btugal Density 3065 ggal
Carbon content 65 Acetone
Low heating value 83127 Btugal Density 2964 ggal
Carbon content 62
Energy Systems Division Argonne National Laboratory9700 South Cass Avenue Bldg 362Argonne IL 60439-4815
wwwanlgov
A US Department of Energy laboratory managed by UChicago Argonne LLC
13
butanol ethanol and water homogeneous ethanol-water azeotrope and heterogeneous water-butanol azeotrope are formed In descending order of their volatilities the components in the stream (including the two azeotropes) to be separated by the downstream processing are acetone azeotrope of ethanol and water ethanol azeotrope of water and butanol water and butanol The components in this sequence could plausibly be separated simply by fractional distillation achieved by various simple andor complex column configurations into any two or more subsequences of components at the adjacent components that have sufficiently different volatilities
The fermentation broth is first fed to the first distillation tower where a composition cut is made to separate acetone ethanol and water from the broth These components are sent to the top stream and the butanol (together with a trace amount of water) goes to the bottom stream The product butanol is 995 wt pure and suitable for transportation fuel use The top stream is sent to a second distillation tower where acetone is concentrated purified and then sent out from the top The bottom stream containing mainly ethanol and water is subject to further separation in a third distillation tower where the azeotropic vapor of 944 wt ethanol and 53 wt water (and 2 wt acetone) is withdrawn from the top and sent to an adsorption unit The water stream from the bottom is sent back to the fermentor Water in the top stream is adsorbed in this unit and ethanol purity in the product stream reaches 995 (the minimum purity required for ethanol to be blended with gasoline and used in vehicles)
The adsorption unit consists of two adsorption columns that run cyclically between the adsorption and desorption phases Molecular sieves are packed in the column as the adsorbents The sieves consist of a microporous substance designed to separate small polar molecules from larger nonpolar ones via a sieving action Water molecules are trapped and adsorbed inside the microporous beads while the ethanol molecules flow around them Molecular sieves are then regenerated by heat and carrier air Figure 3 presents the schematic of the adsorption and adsorbent regeneration process
33 PROCESS FLOWSHEET SIMULATED BY ASPEN PLUSreg
331 ABE Process Flowsheet
This simulation attempts to address the potential of the new ABE fermentation with an in-situ stripping process by using the best of the process value reported The ABE fermentation and downstream processing (separation) model from this study was integrated with the upstream grain processing component of the USDArsquos corn dry mill model and scaled to the 150000-metric-ton-per-year bio-butanol production level Figure 4 shows the Aspen Plusreg
output of the process flowsheet from fermentation to downstream processing Data for the simulation of fermentation and gas-stripping unit operations are based on the research results from Qureshi and Blaschek (2000 2001ab) Ezeji et al (2004) and Ezeji et al (2005) Table 2 summarizes the main parameters for fermentation and gas stripping input to the Aspen Plusreg
simulation
14
995 Ethanol
Atmospheric air Hot Regen
air
Regeneration
Azeotrope stream of ethanol and water
Blower
FIGURE 3 Schematic Representation of Adsorption and Adsorbent Regeneration
The downstream processing flowsheet in the simulation is based on the most cost-effective flowsheet rigorously generated from an exhaustive list of plausible processing equipment and unit operations as described in Liu (2003) Liu et al (2004 2006) and Heckl et al (2006) According to their studies this optimal flowsheet consists of a gas stripper that isolates a liquid product stream from the fermentation broth an adsorption unit that removes the majority of water and a set of distillation columns that purifies the butanol ethanol and acetone products The studies show that the cost of this flowsheet is at least 125 lower than that of any other alternative flowsheet Energy use for the regeneration of the molecular sieve adsorbents is calculated off-line The calculation presented in Section 332 is then incorporated into the simulation by using a Fortran subroutine
Shortcut methods that highlight the mass and energy balances are chosen for simulating most of the unit operations in the process Heat integration between the three distillation columns is taken into consideration Our simulation did not include stream recycling and simple unit operations (such as valves) we also did not examine different distillation column configurations
The combined Aspen Plusreg model provides the material balance for the bio-butanol plant as shown in Table 3 Table 4 lists the yields of acetone butanol and ethanol from the bioshybutanol plant (in gallon per bushel [galbu] of corn) Steam and electricity use for the ABE process (Table 5) indicates that using concentrated feed for ABE fermentation could save 14 of steam needs in comparison with using existing feed in a dry mill Among the reductions in steam needs 75 of those reductions come from distillation Section 41 presents the energy balance for the bio-butanol plant from gate to gate
15
GASPUMP
DISCHARG
ETOH
ADSBWST1
BTOH
ACETONE
WATER
215WATER GASPROD
GASSTRPR
CONDNSR PHSSEPR
ADSORBR1 DIST1
DIST2 FERMENTR
DIST3
EV01
FIGURE 4 Aspen Plusreg Output of the Process Flowsheet from Fermentation to Downstream Processing
16
TABLE 2 Main Input Parameters for Fermentation and Gas Stripping for Aspen Plusreg Simulations
Value Used in Input Parameter the Simulationa
Fermentor operating temperature (degC) 35
Fermentor operating pressure (atm) 1
Acetone 0155 Butanol 0303 Ethanol 00068
Yield (gram ABE (total) 0465 gram glucose) Acetic acid 00086
Butyric acid 00084 Hydrogen 0021 Carbon dioxide 06954
Gas stripping carrier gas Fermentation gas Gas stripping selectivity for butanol 200 Condensation temperature (degC) 2
a Sources Ezeji et al (2004) Qureshi et al (2001b)
TABLE 3 Material Balance of Bio-Butanol Plant
Parameter Value Source
Feed grain moisture content () 15 USDA dry mill model (Kwiatkowski et al 2006
Corn grain feed rate (lb cornh) 237338 McAloon 2006) Aspen Plusreg results scaled up from USDA dry mill model (Kwiatkowski et al 2006 McAloon
Glucose feed rate to fermentor 154871 2006) Aspen Plusreg simulation (this study)
(lbh) Production (lbh) Aspen Plusreg simulation (this study)
Acetone 23997 Butanol 42728 Ethanol 1032 DDGS 73816
DDGS moisture content () 11
17
TABLE 4 Yields of Acetone Butanol and Ethanol from Bio-Butanol Plant
Product Yield
(galbu corn) Energy
(Btubu corn) Energy Output Share
()
Acetone Butanol Ethanol Total
0868 1495 0037 24
69525 149267
2828 221621
314 674
12 100
TABLE 5 Process Fuel Use for ABE Fermentation and Downstream Processing
Diluted Sugar Feed to Fermentora
Process Step Steam (Btuh) Electricity (kW) Steam (Btuh) Evaporator 278653091 0 Fermentor agitator 19273 Condenser 310540 Gas pump 6104 Gas stripper 1307400 1412700 Adsorption feed pump 024 Distillation Column 1 43220100 68173300 Distillation Column 2 62665700 374388000 Distillation Column 3 5730860 10891300 Distillation 2 feed pump 040 Distillation 3 feed pump 003 Adsorbent regeneration -729205 23733 -729205
a Existing fermentation feed such as those from corn dry mill used for ABE fermentation
332 Estimate of Energy Use for Adsorbent Regeneration
The heat use for the regeneration of adsorbents is calculated as the total amount required to bring the system mdash which includes the adsorption column the molecular sieves adsorbed water and the carrier gas mdash to a temperature of 500degF An electric heater provides the energy requirement for absorbent regeneration The system is cooled by exchanging the heat with the process streams fed to the distillation towers (assuming a loss factor of 10) Therefore the energy used to cool the system is not taken into account The weight of water that the molecular sieves adsorb is set at 22 of the weight of the molecular sieve The peak concentration of water in the carrier air is set at 17 wt The adsorption and regeneration cycle time is set at 8 h The amount of heat required to bring the column to the specified temperature is calculated by using a method based on logarithmic mean temperature difference (LMTD) and the scaling of experimental data The radiation loss factor for heater is set at 5 Other major parameters for the calculation are listed in Table 6
18
TABLE 6 Parameters for Calculating Energy Use for Adsorbent Regeneration
Water Adsorbed Inside Molecular Adsorption Carrier Gas mdash
Parameter Sieves Molecular Sieves Column Air
Amount (lbh) 556 20200 na 33330 Cp (btulbdegF) 10 02 na 02 T1 (degF) 1750 1750 1750 1750 T2 (degF) 5000 5000 5000 5000 ΔT (degF) 3250 3250 3250 3250 Q (Btuh) 180538 1509950 3437061 2588908 Total (Btuh) 8102279
19
4 BIO-BUTANOL LIFE-CYCLE ASSESSMENT
41 BIO-BUTANOL PLANT ENERGY REQUIREMENTS
We assume that the bio-butanol plant uses natural gas as process fuel to generate steam and purchases electricity from the grid Our process fuel estimate for the butanol plant is based on three sources (1) the Aspen Plusreg simulation of ABE fermentation and downstream processing from this study (2) a recent study by Mueller and Cuttica (2006) of process fuel use in corn ethanol dry mills and (3) the USDA corn dry mill model (Kwiatkowski et al 2006 McAloon 2006) Aspen Plusreg results from this simulation generate process fuel use values for ABE fermentation and downstream processing (Table 5) Considering the similarity in upstream grain processing between corn ethanol and corn butanol process in this study we adopted the grain processing and DDGS drying steps from USDA dry mill model scaling-up the corn feed for the bio-butanol plant Thus the heat and power needs in the rest of the plant (for cooking the regenerative thermal oxidizer [RTO] and DDGS drying) are based on sources (2) and (3)
An estimate of process fuel (natural gas) use for cooking DDGS drying and RTO in the corn butanol plant was based on the amount of corn feed processed in the following steps We first converted the energy input per gallon of ethanol to energy input per bushel of corn feed at a yield of 272 gallons of denatured ethanol per bushel of corn We then converted this value to energy use per gallon of bio-butanol with a bio-butanol yield of 150 gallons per bushel of corn (Table 4) for each process step above In a conventional corn ethanol dry mill water is removed from WDG (solids from grain processing) and syrup (solids from distillation) at the drying step and from ethanol via distillation The ABE fermentation process described in this study partially removes water before fermentation to concentrate feed sugar content Therefore it is likely that less water will be removed at downstream processing and DDGS drying which means lower energy demand Another parameter that has not been fully evaluated and reported is DDGS yield from the corn-to-butanol ABE process and its quality We assume equivalent heating demands for DDGS drying in the ethanol plant and in the butanol plant Table 7 details the calculations of natural gas use in the bio-butanol plant This steam demand is met by using a natural-gas-fired steam boiler with 80 efficiency to produce 150-psi medium-pressure steam
Electricity demand for the bio-butanol plant was estimated in a similar way According to the ethanol plant study by Mueller and Cuttica (2006) the average electricity use in corn ethanol plants is 075 kWh per gallon of ethanol which agrees with the value estimated by an ethanol plant designer (Roddy 2006) while it is slightly higher than the 073 kWh per gallon of ethanol suggested by the USDA model We used the former estimate in this analysis to reflect the current industry average Electricity used for fermentation and distillation in the corn ethanol plant was displaced by that for ABE fermentation and downstream processing The power consumption value was converted from per gallon of ethanol to per gallon of butanol via per bushel of corn on the basis of 272 gallons of EtOHbushel and 150 gallons of bio-butanolbushel Table 8 summarizes the major assumptions and data sources for power use in the bio-butanol plant
c
20
TABLE 7 Thermal Energy Requirements in Bio-Butanol Plant
Process Steps
EtOH Plant NG Required (Btugal denatured EtOH)
BtOH Plant NG Required Based on
Feed Corn (Btubu corn)c
BtOH Plant NG Required Based on
BtOH (Btugal BtOH)d
Cooking 10013ab 27236 18216 Dryer and RTOe
ABE fermentationf
and processing
10830 29458 19703 77195
BtOH plant total 115114
a Source Mueller (2006) 231 total process fuel for cooking 265 for EtOH processing Therefore cooking fuel use is 231(231 + 265) = 4657 of total fuel used in ethanol processing (excluding DDGS drying)
b The total thermal fuel requirement for cooking fermentation and distillation is 21500 Btugal denatured EtOH in a 100-MMGY ethanol dry mill Source Mueller and Cuttica (2006) NG needed for cooking is 4657 times 21500 Btugal = 10013 Btugal EtOH Assumed corn ethanol yield 272 galbu (denatured)
d Corn butanol yield 150 galbu of corn e Source Mueller and Cuttica (2006) f Aspen Plusreg results from this study includes heat for evaporation fermentation distillation and gas
stripping
TABLE 8 Electricity Consumption in Bio-Butanol Plants
BtOH Plant BtOH Plant EtOH Plant Electricity Required Electricity Required
Electricity Required Based on Feed Corn Based on BtOH Item (kWhgal EtOH) (kWhbu) (kWhgal BtOHa)
EtOH plantb 075 204 EtOH plant excluding 068c 184 123 fermentation and distillation ABE fermentation and 053d
separation BtOH plant total 176
a Converted from kWhbu to kWhgal BtOH with a corn butanol yield of 150 galbu b Source Mueller and Cuttica (2006) Converted to per bushel with an assumed corn ethanol yield of 272
gal denatured ethanolbu Calculated on the basis of USDA dry mill model fermentation requirement 006 kWhgal EtOH and 001 kWhgal for distillation are subtracted from 075 kWhgal EtOH
d Electricity needs from ABE fermentation and separation Aspen Plusreg results from this study
c
21
Scale-up from pilot test to full-scale commercial production could change the yield and energy consumption These factors affect the overall bio-butanol production and energy use estimates
42 BUTANOL LIFE-CYCLE PARAMETERS
Bio-butanol in this study is produced from corn It would be economical for the bioshybutanol plant to be built near corn farms to reduce transportation costs Operations associated with corn farming and feedstock transportation would be similar to those for corn Bio-butanol produced from corn will displace gasoline therefore transportation storage and distribution of bio-butanol would be similar to those of ethanol Table 9 presents key assumptions and GREET inputs for the bio-butanol life-cycle analysis Electricity for the bio-butanol plant is supplied from the US electric generation mix (Table 10)
TABLE 9 GREET Input Parameters for Corn Butanol WTW Analysis Corn Farming Transportation of Corn and Butanol and Vehicle Operation
Parameters Assumptions
Corn yield (buharvested acre) 158 Ratio of harvested acreage to planted 09 acreage Fertilizer use (gbu) N = 420 P2O5 = 149
K2O = 174a
CO2 emissions from potential land use 195 changes of farming (gbu) Lime use (gbu) 1202 Corn transportation mode and distance (mi) Truck (100) 50 Butanol transport and distance (mi) Barge (40) 520 Rail (40) 800 Truck (20) 110 On-road fuel economy of LDVs fueled with 248 bio-butanol (migal gasoline equivalent)
a N = nitrogen P2O5 = phosphorus fertilizer and K2O = potash fertilizer
22
To clearly show the energy and emission TABLE 10 US Average Electricity effects of bio-butanol vs gasoline we assumed in this Generation Mix Used in this Studya
study that bio-butanol is used in pure form in GVs and that butanol could achieve the same fuel economy per gallon gasoline equivalent as gasoline-powered Source Percent of Total
GVs (Table 9) WTW results are expressed in a per-million-Btu fuel matrix for comparison In reality Residual oil 27
bio-butanol may be used in various gasoline blends Natural gas 189
The per-million-Btu base system is more appropriate Coal 507
from a fuel supply perspective Because energy and Nuclear power 187
emission results are presented in Btu or grams per Biomass 13
million Btu of fuel produced and used the effects of Others 77
differences in fuel economy are removed a Source GREET year 2010
43 CO-PRODUCT CREDIT
During bio-butanol production several co-products are generated along with butanol mdash these include acetone DDGS a small amount of ethanol fatty acids (butyric acid and acetic acid) and H2 gas On the scale that we analyzed acetone is the major co-product of the bioshybutanol plant with 82000 metric tons produced per year Acetone contributes to more than one-half (by weight) of the butanol production The bio-butanol plant also generates 253600 metric tons of DDGS (11 moisture) per year mdash the second large co-product The yield of ethanol is relatively small (Tables 3 and 4) (similar to the level of fatty acid mixtures) Ethanol yield from ABE fermentation accounts for 15 of total ABE (acetone butanol and ethanol) by weight and only 12 by energy content (Btubu of corn) (Table 4) Although the fatty acids could be separated further purified from the liquid discharge stream and sold for use in the chemical market the separation step has not yet been tested with ABE fermentation In this Aspen Plusreg
simulation the fatty acids were not separated and purified and so they were not treated as coshyproducts
Significant amounts of H2 and CO2 gas were produced from fermentation these gases were used internally for gas stripping and then for maintaining anaerobic conditions for ABE fermentation The H2 could be separated as a fuel product if high-purity nitrogen gas is used in place of fermentation gas However using such nitrogen gas to maintain anaerobic conditions and for stripping in large-scale operation could be cost prohibitive Further studies to evaluate the engineering economics of alternative approaches for process operation while economically producing bio-butanol and hydrogen would be beneficial In this initial attempt to address the life cycle of bio-butanol H2 was not considered as a co-product
We partitioned total energy and emissions into bio-butanol and the co-products by using two methods product displacement and energy allocation Co-product displacement (Case 2) is based on the concept of displacing the current product with the new product In this case bioshyacetone is regarded as a renewable chemical The energy consumed and the emissions that occur during bio-acetone production displace the energy and emissions associated with petroleum-based acetone production Energy and emission accredits from the acetone displacement are
23
assigned to bio-acetone Similarly DDGS generated from corn butanol production contains 267 protein by weight which is close to the amount of protein contained in the DDGS from the corn ethanol process With the assumptions that the nutritional values of DDGS from the two processes are similar the DDGS from the bio-butanol plant displaces traditional animal feed (soy protein and corn) the production pathway of which is already in place in GREET
The limitation of using the displacement method for the bio-butanol life-cycle analysis is the large amount of acetone that is co-produced with butanol While the main product mdash butanol mdash accounts for 63 (wtwt) of the total product yield (acetone butanol and ethanol) acetone accounts for 35 (wtwt) (Table 3) Our previous study (Wu et al 2005) suggested that when the share of energy co-products increases the co-product displacement method could yield misleading results Therefore other partitioning methods such as energy allocation should be examined
For Case 3 we applied the product energy allocation method to co-products in which emission and energy burdens are allocated among products according to their energy output shares from the bio-butanol plant In the energy allocation method shares of output product energy for each product are determined according to the heating value Energy use and associated emissions from bio-butanol production and from upstream feedstock production and transportation activities are partitioned among acetone butanol ethanol and DDGS on the basis of their corresponding energy shares This approach treats all energy products from the production process as equal regardless of the form and quality differences among them It also implies that all four products are energy products The energy allocation method is applicable to this case because of the ABE products both butanol and ethanol are liquid fuels Although TABLE 11 Co-Product Energy Partitioningacetone is normally regarded as a chemical by Energy Allocationa
solvent and feedstock its energy content (in LHV) is in fact in between that of butanol and ethanol (Table 1) Furthermore DDGS has a Bio- Bio- Bio-
Butanol Acetone DDGS EthanolLHV of 8703 Btulb and can be used as a solid fuel for ethanol plant operations Several 40 19 40 001 ethanol plants are currently exploring DDGS
acombustion or gasification such as Corn Plus Based on energy contentto provide heat and power Although the fuel quality of DDGS is lower than that of the liquid fuels considering its large quantity (Table 3) use of DDGS for process heat brings energy savings and yet relaxes pressure on the already stagnant DDGS market Table 11 presents energy shares based on product energy (in Btu)content
We also established a case to consider the impact of overproduction of acetone (Case 4) In this case an overabundance of acetone produced by a large-scale butanol industry would flood the acetone market consequently losing its commercial value Case 4 is the same as Case 2 except that it treats acetone as a waste stream (ie corn-acetone is not credited) This case provides an extreme scenario for bio-butanol
24
44 CRADLE-TO-USER ASSESSMENT OF PETROLEUM ACETONE AND DISPLACEMENT
441 Petroleum Acetone and Feedstocks Production
To evaluate the energy and emissions benefits of producing bio-acetone in a corn butanol plant we performed a cradle-to-user analysis of petroleum-based acetone mdash from feedstock extraction to acetone delivery to the user site Acetone is almost exclusively produced via cumene peroxidation as a co-product with phenol Its main use is as a chemical intermediate in the manufacture of acetone cyanohydrin for methyl mechacrylate biphenol A and adol chemicals Direct solvent use accounts for about 30 of world demand for acetone
A synthetic process based on hydrocarbons or derivatives is now accounted for all acetone production in the United States and nearly all production in other countries In this process acetone is co-produced with phenol from cumene The yield of acetone from this process averages 221 units of cumene per unit of acetone by weight (Camara-Greiner 2005) Cumene is produced via alkylation of benzene with propylene under elevated temperatures and pressures in the presence of a catalyst Upstream from cumene production benzene is produced principally through a catalytic reforming from naphtha in a BTX (benzene toluene and xylene) process The other feedstock for cumene propylene is one of a half dozen products from crackers receiving raw hydrocarbon (naphtha) from oil refineries as well as natural gas Figure 5 presents a schematic of cradle-to-user petroleum acetone production
442 Assumptions and Data Sources
The cradle-to-user analysis system boundary for petroleum acetone includes resource extraction feedstock production acetone production process fuel production and associated transportation Our petroleum acetone production data are based on the life-cycle inventory (LCI) of Eco-Profile (Boustead 2005)
Eco-Profile Reports compiled average industry data and assembled detailed environmental data for various petrochemical processes We noted system boundary differences in the transportation and upstream fuel production stages between the Eco-Profile and the GREET database To ensure a consistent system boundary for all seven cases with current GREET biofuel pathways we selected feedstock production (under category ldquofeedstock energyrdquo in Eco-Profile) and the amount of process fuel used in production of acetone feedstocks and acetone (under category ldquoenergy content of delivered fuelrdquo in Eco-Profile) to arrive at our energy estimate for petroleum acetone The GREET default energy values were used for upstream fuel production (oil extraction refining and transportation) transport of feedstocks and transport of acetone to users Direct emissions from production processes (under category ldquoprocessrdquo in Eco-Profile) from Eco-profile were used for our petroleum acetone cradle-to-user estimate Emissions associated with upstream fuel production and all transportation activities were based on GREET values Table 12 presents data sources for each life-cycle step in petroleum acetone production
25
TABLE 12 Assumptions and Data Sources of Cradle-to-User Petroleum Acetone
Cradle-to-User Stage Data Sources
Crude extraction for process fuel Crude transport for process fuel GREET 17 Oil refining and transport for process fuel
Cumene transporta GREET 17
Acetone production (life-cycle value)b Eco-Profile
a Benzene and propylene were assumed to be captive Acetone is for captive use in the acetone production facility to produce acetone cyanohydrin biphenol A and adol chemicals Cumene is transported to acetone production facility
b Cumene production value is not available
The hypothetical corn butanol plant is located in the US Corn Belt to reduce corn transportation costs We assumed that acetone produced from the corn butanol plant would displace petroleum acetone produced in the region of Petroleum Administration for Defense Districts (PADD) II (EIA 2004) PADDs were delineated during World War II to facilitate oil allocation PADD II includes 14 Midwest states and overlaps with the Corn Belt where most corn-based plants would operate We identified the mass flow for cumene and acetone production and transportation in PADD II on the basis of a Chemical Economics Handbook (CEH) Marketing Research Report (Camara-Greiner 2005) In this region 85 of total cumene is produced from captive benzene and propylene (that is benzene and propylene are produced and consumed on-site) The cumene is purchased by and subsequently transported to the acetone producer
Major assumptions for cradle-to-user analysis of petroleum acetone are listed below
bull Process fuels used in the acetone pathway are electricity oil and natural gas
bull Electricity is purchased from the grid with the US average generation mix (Table 10)
bull Cumene production feedstocks (benzene and propylene) are captive in the refinery so no transportation is associated with these feedstocks
bull The acetone production facility purchases 100 of feedstock cumene
bull Cumene needs for the acetone producer is estimated on the basis of the mass unit ratio of 221 units of cumene per unit of acetone (Camara-Greiner 2005)
26
bull Cumene is transported to the acetone production facility an average distance of 323 miles in a 1028-Btuton-mi Class 8 diesel truck
Table 13 presents the heating values used in Eco-Profile and GREET In this assessment energy data are expressed in LHV of Btu or kWhkg acetone produced When there was a discrepancy in LHV between Eco-Profile and GREET for same fuel or chemical the GREET value was selected to ensure consistency with the baseline fuel pathways of petroleum gasoline and corn ethanol The energy data from Eco-Profile are converted according to the ratio of LHV Eco-ProfileLHV GREET (Table 13)
TABLE 13 Low-Heating-Value Comparison for this Studya
Fuel
GREET (Btugal Btuscf)
Eco-Profile (MJkg)
Eco-Profile (Btugal Btuscf)
Ratio LHV EcoGREET
Fuel oil NG
140353 983
405 4816
144176 1005
103 102
a Unit for fuel oil is Btugal unit for natural gas is Btuscf
443 Petroleum Acetone Displacement
We assumed that the corn-based butanol plant would be built near a corn farm in the Midwest PADD II region and operated at a production scale of 150000 metric tons of bioshybutanol per year With a mass production ratio of 056 lb of bio-acetone per pound of bioshybutanol this facility could yield 82461 metric tons of bio-acetone annually mdash 16 of the total acetone production in PADD II and 4 nationwide We assumed that bio-acetone would be transported to acetone consumers via train (500 miles) and truck (100 miles) within PADD II
In the co-product displacement approach (Case 2) petroleum acetone is displaced by corn-based acetone from cradle to user The displacement is carried out in the following sequence the cradle-to-gate results of petroleum acetone (as illustrated in Figure 5) were first subtracted from the WTW results of bio-butanol and then the energy or emissions values associated with bio-acetone transportation from the bio-butanol plant to the acetone user were added
27
FIGURE 5 System Boundaries for Cradle-to-User Pathway of Fossil-Based Acetone and Corn-Based Acetone
28
29
5 RESULTS AND DISCUSSION
51 ENERGY CONSUMPTION AND GHG EMISSIONS
Corn-derived butanol achieves substantial fossil energy savings (39ndash56) compared with gasoline ([Cases 3 and 2] Figure 6) on a life-cycle basis In Cases 2 and 3 bio-butanol production contributes to a positive energy balance (defined as fossil energy used in gasoline production minus fossil energy used in bio-butanol production) Without acetone credit as in Case 4 in which acetone is regarded as a waste bio-butanol production is not an option for fossil energy savings
The primary fuel consumed in the bio-butanol life cycle is natural gas followed by petroleum oil and coal (Figure 6) Although electricity generation uses 50 of coal (Table 10) the amount of electricity required is relatively small (Table 8) and so only 9ndash17 of total fossil energy use is from coal (Cases 3 and 2) A life-cycle fossil energy breakdown (Figure 7) indicates that about three-fourths of the fossil fuel is spent in the butanol production plant (73) Corn cultivation accounts for a total of 23 of WTW fossil energy (12 for agricultural chemical and fertilizer manufacturing and 11 for farming operations) In the butanol plant the majority of natural gas demand comes from the process steam requirement (Table 5) which leads to 115000 Btu per gallon of butanol produced mdash approximately three times that of corn ethanol production before co-products are allocated As we pointed out earlier this estimate tends to be conservative because it did not reflect the lower heating requirement for DDGS drying in the bio-butanol plant The water requirement in biological fuel production drives the energy balance in the plant A higher concentration of product in fermentation reduces energy needs for product concentrating in subsequent process steps Historically improvement of ethanol concentration in a fermentor from ~8 in 1980s to 20 at present demonstrates in part the lower energy cost in ethanol plant operation The ABE fermentation process evaluated in this study achieved a concentration of 19 (wtwt) of total solvents (ethanol butanol and acetone) in a fermentor With rapid in-situ removal of solvent by gas stripping the process is able to increase feed concentration to improve production rate while minimizing butanol inhibition Although using concentrated feed in fermentation effectively reduces about 14 of the steam requirement (Table 5) solids concentration in the fermentor mdash an important issue in process development and operation mdash remains a constraint
Vehicles fueled by bio-butanol achieve small to moderate reductions in GHG emissions relative to gasoline vehicle on a WTW basis in Cases 2 (8 displacement ) and 3 (32 energy allocation) (Figure 8) For every million Btu of bio-butanol used in place of one million Btu of gasoline 8ndash32 kg of GHG emissions could be avoided (Cases 2 and 3) The GHG emissions profile for the bio-butanol production option in this study is similar to that of corn ethanol Of total GHG emissions in the bio-butanol WTW cycle over 70 by weight of the GHGs are from CO2 less than 5 is from methane and the remaining 18ndash21 is from N2O (Figure 9) Natural gas consumption in butanol plant is the major cause of GHG emission
We assumed that vehicles fueled by bio-butanol would offer performance similar to that of vehicles fueled by gasoline We have not found any vehicle testing data to confirm this
-
30
assumption Vehicle testing with butanol should be conducted to evaluate butanolrsquos performance in vehicles under realistic driving conditions
52 EFFECT OF ACETONE CO-PRODUCT CREDIT
Energy partitioning for co-products has a significant effect on overall energy use and associated GHG emissions The three cases that we examined (2 3 and 4) presented different options for acetone When acetone is regarded as a fuel and credit is allocated on the basis of product energy content (Case 3) the WTW analysis yields moderate fossil energy and GHG emissions benefits for bio-butanol When acetone is used as a renewable chemical to displace petroleum acetone via the displacement method (Case 2) the results of analysis show 17 savings in fossil fuel (Figure 6) and small reductions in GHG emissions (Figure 8) However treating acetone as a waste stream (Case 4) resulted in an increase of almost one million Btu in fossil energy and 40000 g of GHG emissions (compared with gasoline) for each million Btu of bio-butanol produced The difference is largely attributable to the acetone credit Feedstocks for petroleum-based acetone production (propylene and benzene [Figure 5]) are produced from naphtha and natural gas mdash 100 fossil feedstock (Lacson et al 2005) Another factor is the high yield of acetone from the ABE process 056 lb acetone per pound of butanol These two factors suggest that a significant portion of fossil energy use in petroleum acetone production will be regarded as a credit when bio-acetone displaces fossil acetone which eventually leads to a small fossil energy value (Figure 6)
-500000
0
500000
1000000
1500000
2000000
WTW
Fos
sil E
nerg
y U
se (B
tum
mB
tu) Petroleum
NG
Coal
Co product allocation based on displacement
Co-product allocation based on product energy value
Butanol Ethanol Butanol Butanol Ethanol Gasoline (Case 3) Dry mill (Case 2) (Case 4) Dry mill (Case 1)
(Case 6) (Case 5)
FIGURE 6 Well-to-Pump Fossil Energy Breakdown for Bio-Butanol and Corn Ethanol Compared with Gasoline Using Different Co-Product Allocation Methods (negative value indicates fossil energy avoided)
31
Vehicle Fuel Transport Bio-butanol
Net Consumption in Production
Plant 73
Corn Transport
2
Corn Farming 11
Fertilizer Manufacture
12
Operation 02
FIGURE 7 Breakdown of Fossil Energy Use in Various Stages of Fuel Life Cycle for Corn-Based Butanol (Case 3)
Butanol Ethanol Butanol Butanol Ethanol Gasoline (Case 3) Dry mill (Case 2) (Case 4) Dry mill (Case 1)
(Case 6) (Case 5)
FIGURE 8 Life-Cycle GHG Emissions of Bio-Butanol and Ethanol Compared with Gasoline Using Different Co-Product Allocation Methods
0
20000
40000
60000
80000
100000
120000
140000
WTW
GH
G E
mis
sion
s (g
CO
2 eq
uiva
lent
GH
Gm
mB
tu)
32
80000
60000
40000
20000
0 Butanol (Case 3) Ethanol Dry mill (Case 6)
FIGURE 9 Life-Cycle GHG Emission Breakdown for Bio-Butanol and Ethanol (Energy Allocation)
The displacement method provides significant benefits in terms of reductions in the use of fossil energy (Figure 6) but relatively small reductions in GHG emissions (Figure 8) The main reason for this phenomenon is that petroleum acetone production extracts carbon from a fossil resource and transforms the carbon to another bounded form (chemical) with net GHG emissions generated from consumption of the process fuel In its life cycle petroleum acetone is primarily used as a chemicalfeedstock with a fraction as solvent Although a small amount of carbon embedded in petroleum acetone may escape to the atmosphere through volatilization during product application (ie use as solvent) the majority ultimately ends up as a solidliquid chemical in a bound form rather than being emitted to the air as CO2 By displacing petroleum acetone with bio-acetone in this case the life-cycle reductions in fossil energy use do not translate to benefits in terms of GHG emissions
53 COMPARISON OF BIO-BUTANOL WITH CORN ETHANOL
The ABE process simulated in this study appears to be as efficient in producing acetone butanol and ethanol on a weight basis as current corn dry mills (Table 14) Measured by gallon or gram of ABE the yields from the ABE process are similar to ethanol yields from a conventional dry mill As a rule of thumb in ethanol produced from corn dry milling one-third of the feed mass goes to ethanol one-third is left in DDGS and one-third is emitted as CO2 The
WTW
GH
G E
mis
sion
s B
reak
dow
n(g
ram
CO
2 eq
uiv
per
milli
on B
tu)
N2O
CH4
CO2
33
TABLE 14 Acetone Butanol and Ethanol Outputs from Corn Compared with Ethanol from Conventional Corn Mills
Corn Butanol Plant Ethanol from Corn
Acetone Butanol Ethanol Total Dry Mills
Btubu corn 69525 149267 2828 221620 (with 198458 acetone) 152095 (without acetone)
Galbu corna
gCg cornb 087
0074 150 0137
004 0003
240 0214
260 0172
a Un-denatured b Based on dry corn feed
ABE process examined in this study follows TABLE 15 Co-Product Yields (gg corn)almost the same rule one-third of the feed mass ends up in the products (acetone butanol and
Acetone Butanolethanol) one-third remains in DDGS and about Ethanol DDGS CO2one-third (30) is emitted as CO2 (Table 15) (the remaining ~3 ends up in fatty acids [butyric and 034 033 030 acetic acids] and losses) Acetone 0119
Butanol 0212 Because acetone is not used as a fuel at Ethanol 0005
present net fuel production (butanol and ethanol) is small A typical dry mill can deliver 272 galbu of fuel ethanol or 26 galbu of undenatured ethanol which is ~11 gal more than the butanol and ethanol yield together from the ABE process (154 galbu) (Table 14) On the other hand butanol contains 30 more energy (LHV) than ethanol (Table 1) by volume When we take fuel energy yield into consideration each bushel of corn could generate nearly 152000 Btu of liquid fuels from the ABE process (butanol and ethanol together) while the same bushel delivers 198000 Btu of liquid fuels (undenatured ethanol) from the conventional ethanol dry mill (46000 Btu more than the bio-butanol option) Hence from a liquid fuel production perspective the ABE process option does not offer an increase in renewable fuel production in comparison with conventional corn ethanol production
Process fuel use for ABE production could be a major hurdle as indicated in Table 16 A bushel of corn requires 82 more steam and 34 more electricity to produce ABE from a bioshybutanol plant than to produce ethanol from a corn dry mill If the first corn butanol plant is built from an existing corn dry mill that has been retrofitted the implication is that operation cost will be high To build a new corn butanol plant capital cost may be lower because of the reduced footprint in fermentation and downstream processing relative to the existing dry mill but the plant would have increased process fuel cost mdash especially given the current price for natural gas
34
TABLE 16 Process Fuel Use in Bio-Butanol and Ethanol Production Plant
Fuel Bio-butanol Plant Ethanol Dry Mill Ratio of Butanol
to Ethanol
Natural gas (Btubushel of corn) Electricity (kWbushel of corn)
172108
263
94320
197
182
134
Another concern is the feedstock supply for bio-butanol The current ABE process shares the same starch-based feedstocks with conventional corn ethanol Development of bio-butanol through the ABE process could take limited feedstocks away from conventional corn ethanol production RampD efforts in bio-butanol may need to be directed toward identifying new feedstocks and process technologies In fact Qureshi (2007) recently reported on a study using cellulosic biomass as feedstock for bio-butanol production via the ABE process Because ABE fermentation is from glucose the results of ongoing RampD on cellulosic pretreatment for cellulosic ethanol could be applied to the ABE process
54 CRADLE-TO-USER COMPARISON OF BIO-ACETONE WITH PETROLEUM ACETONE ISSUES AND CONCERNS
Use of bio-acetone to displace petroleum acetone shows promising energy and environmental benefits (Figure 10) from a life-cycle perspective Conventional acetone production is a fossil-energy-intensive process By producing acetone from corn manufacturers could save a significant amount of total fossil energy mdash up to 71 relative to petroleum-based acetone The renewable acetone achieves energy savings of 91 for petroleum and 58 for natural gas Figure 11 further shows the life-cycle fossil energy distribution between the two The majority of fossil energy use shifts from feedstocks (57) in the petroleum acetone production process to acetone production (70) in the corn acetone production process
Bio-acetone in this study is produced from corn mdash a renewable agricultural resource that absorbs atmospheric CO2 during its growth The carbon in CO2 is converted to organic carbon in the corn and is further transformed and embedded in acetone through the ABE process Therefore we allocated a renewable carbon credit to bio-acetone for the carbon embedded in corn As illustrated in Figure 12 a net carbon sequestration would occur from cradle to user GHG emissions would be much higher mdash about 500 glb acetone produced if the carbon in acetone is from non-renewable sources
Although bio-acetone production results in positive WTW energy benefits and decreased GHG burdens several issues and concerns need to be addressed In 2005 a total of 19 million metric tons of acetone was produced in the United States (Camara-Greiner 2005) PADD II which overlaps with the US corn belt would most likely to be the location for corn-based
35
butanol plants Production of petroleum acetone in this region in 2005 was 505000 metric tons representing 26 of total US production If bio-acetone were produced from a single simulated bio-butanol plant located in this region the volume of bio-acetone would be about 16 of the total petroleum acetone production in the region and 4 nationwide Furthermore assuming that total bio-butanol production levels could reach a quarter of the production level of corn ethanol of 49 billion gallons (2006) the amount of corn feed used for bio-butanol production could generate 676 million gallons of bio-butanol and 391 million gallons (12 million metric tons) of bio-acetone At this production scale the acetone market would be flooded with both bio- and petroleum acetones dramatically decreasing the market value of acetone Thus one may argue that acetone should be treated as a waste stream (as we did in Case 4) Aside from the fossil energy and GHG benefits (within WTW analysis boundaries) that may result from the production of bio-butanol we should consider the emission of liquid acetone into the environment if acetone is treated as a waste stream On the basis of a value of 0074 g of carbon generated in acetone from each gram of corn if all of the carbons contained in acetone were converted to gaseous CO2 approximately 6900 g of CO2 could be emitted to the atmosphere per bushel of processed corn Acetone-containing water in such high volumes could become a major source of atmospheric VOC and CO2 emissions
Unfortunately the outlook for replacement of petro-chemicals with bio-chemicals is far from clear Petroleum acetone is currently generated as a by-product during phenol production from cumene On average 061 lb of acetone is obtained per pound of phenol produced (SRI Consulting 2005) The United States consumed $21 million metric tons of phenol in 2004 (SRI Consulting 2007) Worldwide the consumption of phenol grows at a rate of 41 per year As demand for phenol continues to rise petroleum acetone will be produced with or without the presence of bio-acetone In the ABE process studied the bio-acetone is also a co-product New technologiesprocesses that significantly reduce the acetone that results from phenol and ABE production are therefore needed In fact at the time of this study DuPont was making considerable progress in molecular biology which led to a patent award for a recombinant bacterium that produces butanol exclusively from biological feedstocks (DuPont 2007) Other potential research directions include exploring the use of acetone as a fuel blend and as a feedstock for new chemicals
36
0
5000
10000
15000
20000
25000
30000
Cra
dle-
to-U
ser F
ossi
l Ene
rgy
Use
(Btu
lb A
ceto
ne)
Petroleum Natural Gas Coal
Corn-Acetone Petroleum-Acetone
FIGURE 10 Fossil Energy Use Based on the Production of Bio-Acetone Compared with Fossil Energy Use Based on the Production of Petroleum Acetone
37
8127 Btu of fossil per lb of corn acetone a) bio-Acetone
Fuel Transport
3 Corn Farming 12
Fertilizer Manufacture
13
Corn Net Transport
Consumption 2 in Production
Plant70
27818 btu of fossil per lb of acetone Feedstock and
acetone
b) Petroleum-Acetone
Acetoneproduction -Co-product
Credit40 Feedstock
production 57
transportation 3
FIGURE 11 Fossil Energy Consumption Breakdown for (a) Bio-Acetone and (b) Petroleum Acetone
38
Cra
dle-
to-U
ser G
HG
Em
issi
ons
(g C
O2-
equi
vlb
ace
tone
)
1500
1000
500
0
-500
-1000 Corn-Acetone Petroleum-Acetone
CO2 CH4 N2O
Net CO2 emission - 304gCO2 equivlb
Net CO2 emission 738gCO2 equivlb if carbon is not sequested
FIGURE 12 GHG Emissions Generated or Avoided by Bio-Acetone Production Compared with Petroleum Acetone Production
39
6 CONCLUSIONS
Our conclusions based on the results of our study include the following
bull Corn-based butanol produced by means of the current ABE process could offer substantial fossil energy savings and moderate reductions in GHG emissions relative to petroleum gasoline on a WTW basis when co-products are credited by energy allocation
bull The energy benefits associated with bio-butanol are significant when coshyproduct corn-acetone is credited with displacement method
bull When acetone is credited by energy allocation life-cycle energy benefits for corn butanol are less promising than those of corn ethanol generated from conventional dry milling processes GHG emissions generated from bioshybutanol life cycle are higher than those generated from corn ethanol
bull From a liquid fuel production standpoint the ABE process examined may not be as effective as conventional corn ethanol production in that it produces less liquid fuel (on an energy basis) per bushel of corn than the corn ethanol process in addition to increased process fuel use in the production plant
bull The impacts of corn-acetone (produced via the ABE process) on the acetone market need to be carefully examined and new uses for bio-acetone need to be explored
40
41
7 REFERENCES
Boustead I 2005 ldquoEco-Profiles of the European Plastic Industry Acetonerdquo Plastics Europe March available at httpwwwplasticseuropeorgContentDefaultaspPageID=392 accessed Dec 2006
Brinkman N M Wang T Weber and T Darlington 2005 GM Study Well-to-Wheels Analysis of Advanced FuelVehicle Systems ndash A North American Study of Energy Use Greenhouse Gas Emissions and Criteria Pollutant Emissions May httpwwwtransportationanlgovpdfsTA339pdf
Collins K 2007 The New World of Biofuels Implications for Agriculture and Energy Presented at EIA Energy Outlook Modeling and Data Conference March Washington DC
Conti J 2007 Annual Energy Outlook 2007 presentation at EIA Energy Outlook Modeling and Data Conference March Washington DC
Dadgar AM and GL Foutch 1988 ldquoImproving the Acetone-Butanol Fermentation Process with Liquid-Liquid Extractionrdquo Biotechnology Progress 4 36ndash39
DuPont 2007 Fermentive Production of Four Carbon Alcohols World Patent Application WO2007041269 USPTO PCTUS2006038007
EIA see Energy Information Administration
Energy Information Administration 2004 httpwwweiadoegovpuboil_gaspetroleum analysis_publicationsoil_market_basicspaddmaphtm accessed May 15 2007
Energy Information Administration 2007 Annual Energy Outlook 2007 DOEEIA-0383(2007) available at httpwwweiadoegovoiafaeopdf0383(2007)pdf accessed May 23 2007
Ezeji TC N Qureshi and HP Blaschek 2004 ldquoAcetone Butanol Ethanol (ABE) Production from Concentrated Substrate Reduction in Substrate Inhibition by Fed-Batch Technique and Product Inhibition by Gas Strippingrdquo Appl Microbiol Biotechnol 63 653ndash658
Ezeji TC PM Karcher N Qureshi and HP Blaschek 2005 ldquoImproving Performance of a Gas-Stripping-Based Recovery System to Remove Butanol from Clostridium Beijerinckii Fermentation Bioprocess Biosyst Eng 27 207ndash214
Guibet J-C 1997 Carburants et Moteurs Technologies Energie Environnement Publication de lrsquoInstitut Franccedilais du Peacutetrole ISBN 2-7108-0704-1
Heckl I Z Kovacs F Friedler LT Fan and J Liu 2006 ldquoAlgorithmic Synthesis of an Optimal Separation Network Comprising Separators of Different Classesrdquo Chemical Engineering and Processing doi101016jcep200606013
42
Huang WC DE Ramey and ST Yang 2004 ldquoContinuous Production of Butanol by Clostridium Acetobutylicum Immobilized in a Fibrous Bed Bioreactorrdquo in Applied Biochemistry and Biotechnology mdash Part A Enzyme Engineering and Biotechnology 113ndash116 887ndash898
Intergovernmental Panel on Climate Change (IPCC) 2001 Climate Change 2001 the Scientific Basis Technical Summary of the Group I Report
Intergovernmental Panel on Climate Change (IPCC) 2007 Working Group I The Physical Basis of Climate Change IPCC WG1 AR4 report available at httpipcc-wg1ucareduwg1 wg1-reporthtml accessed May 23 2007
IPCC see Intergovernmental Panel on Climate Change
Kwiatkowski JR McAloon AJ Taylor F Johnston D 2006 Modeling the process and costs of the production of fuel ethanol by the corn dry-grind process Industrial Crops and Products V23 Issue 3 p288-296
Lacson JG 2004 ldquoPropylenerdquo in Chemical Economics Handbook (CEH) Marketing Research Report SRI Consulting Menlo Park Calif
Liu J 2003 Downstream Process Synthesis for Biochemical Production of Butanol Ethanol and Acetone from Grains PhD Dissertation Kansas State University Manhattan KS
Liu J LT Fan P Seib F Friedler and B Bertok 2004 ldquoDownstream Process Synthesis for Biochemical Production of Butanol Ethanol and Acetone from Grains Generation of Optimal and Near Optimal Flowsheets with Conventional Operating Unitsrdquo Biotechnol Prog 20 1518ndash1527
Liu J LT Fan P Seib F Friedler and B Bertok 2006 ldquoHolistic Approach to Process Retrofitting Illustration with Downstream Process for Biochemical Production of Organicsrdquo Ind Eng Chem Res 45 4200ndash4207
Marlatt JA and R Datta 1986 ldquoAcetone-Butanol Fermentation Process Development and Economic Evaluationrdquo Biotechnology Progress 2 23ndash28
McAloon A 2006 Shelled Corn to Ethanol Process Energy Analysis Aspen + reg MGY Dry Grind Ethanol Process Model ERRCARSUSDA
Morey V et al 2006 Characterization of Feed Streams and Emissions from Biomass GasificationCombustion at Fuel Ethanol Plants American Society of Agricultural and Biological Engineers (ASABE) Presentation Paper Number 064180 July Portland Ore
Mueller S and J Cuttia 2006 Research Investigation for the Potential Use of Illinois Coal in Dry Mill Ethanol Plants prepared by the Energy Resources Center at University of Illinois at Chicago for the Illinois Clean Coal Institute and the Illinois Department of Commerce and Economic Opportunity Oct
43
Mueller S 2006 Energy Resources Center University of Illinois at Chicago Chicago Ill personal communication to May Wu of Argonne National Laboratory Argonne Ill
Natural Resources Canada 2007 ldquoThe Addition of Bio-Butanol to GHGenius and a Review of the GHG Emissions from Diesel Engines With Urea SCRrdquo NRC Report prepared by (SampT)2
Consultants BC Canada
Parekh M J Formanek and HP Blaschek 1999 ldquoPilot-Scale Production of Butanol by Clostridium Beijerinckii BA 101 Using a Low-Cost Fermentation Medium Based on Corn Steep Waterrdquo App Microbiol Biotechnol 51 152ndash157
Qureshi N and HP Blaschek 1999 Economics of Butanol Fermentation Using Hyper-Butanol Producing Clostridium Beijerinckii BA 101rdquo Trans Institution of Chemical Engineers 78 (Part C) 139ndash144
Qureshi N and HP Blaschek 2001a ldquoABE Production from Corn A Recent Economic Evaluationrdquo Journal of Industrial Microbiology amp Biotechnology 27 292ndash297
Qureshi N and HP Blaschek 2001b ldquoRecovery of Butanol from Fermentation Broth by Gas Strippingrdquo Renewable Energy 22 557ndash564
Qureshi N 2007 Bioconversion of Agricultural Residues to Butanol Simultaneous Saccharification Fermentation and Product Recovery Presentation at the 29th Symposium on Biotechnology for Fuels and Chemicals Denver CO
Roddy W 2006 Dry Mill Ethanol Plants Environmental Impacts and Future Growth ICM Presented at Governorsrsquo Ethanol Coalition Feb
SRI Consulting 2005 Chemical Economics Handbook (CEH) Marketing Research Report Menlo Park Calif
SRI Consulting 2007 Chemical Economics Handbook (CEH) Marketing Research Report Menlo Park Calif
White and Johnson 2003 Corn Chemistry and Technology 2nd edition
Wu M Y Wu M Wang 2005 Mobility Chains Analysis of Technologies for Passenger Cars and Light-Duty Vehicles Fueled with Biofuels Application of the GREET Model to the Role of Biomass in Americarsquos Energy Future (RBAEF) Project Argonne National Laboratory Report May available at httpwwwtransportationanlgovpdfsTA344pdf
44
45
APPENDIX
46
47
APPENDIX
A1 PARAMETERS FOR CORN BUTANOL LIFE-CYCLE ANALYSIS
Corn Farming Energy UseFertilizer Use
Nitrogen P2O5 K2O CaCO3
Pesticide Use Herbicide Insecticide
Corn Transportation From Field to Stacks
Truck Share Distance
From Stacks to Plants Truck
Share Distance
Butanol Production Energy Use
Thermal Energy Electricity
Yield Butanol Acetone DDGS
22500 Btubu
420 gbu 149 gbu 174 gbu
1202 gbu
810 gbu 068 gbu
100 10 mi
100 40 mi
115114 Btugal BuOH 176 kWhgal BuOH
150 galbushel 380 lbgal BuOH 1166 lbgal BuOH
Butanol Transportation and Distribution Transportation
Barge Share Distance
Rail Share Distance
Truck Share Distance
40 520 mi
40 800 mi
20 110 mi
GREET corn-EtOH pathway
GREET corn-EtOH pathway GREET corn-EtOH pathway GREET corn-EtOH pathway
GREET corn-EtOH pathway
GREET corn-EtOH pathway GREET corn-EtOH pathway
GREET corn-EtOH pathway GREET corn-EtOH pathway
GREET corn-EtOH pathway GREET corn-EtOH pathway
see report see report
see report see report
see report
see report see report
see report see report
see report see report
48
Distribution Truck
Share 100 see report Distance 30 mi see report
Butanol Combustion in Vehicles On-Road Fuel Economy
245 migal see report
A2 PARAMETERS FOR PETROLEUM-BASED ACETONE ANALYSIS
Energy Use Energy Used as Process Fuel Electricity 031 kWhkg acetone see report
Oil 9337 Btukg acetone see report NG 10678 Btukg acetone see report
Energy Used as Feedstock Oil 12961 kWhkg acetone see report NG 18908 kWhkg acetone see report
Cumene Transportation Truck
Share 100 Distance 323 mi see report Fuel economy 50 migal see report
A3 TRANSPORTATION FOR CORN-ACETONE
Rail Share 100 see report Distance 500 mi see report
Truck Share 100 see report Distance 100 mi see report
A4 FUEL SPECIFICATIONS
Butanol Low heating value 99837 Btugal Density 3065 ggal
Carbon content 65 Acetone
Low heating value 83127 Btugal Density 2964 ggal
Carbon content 62
Energy Systems Division Argonne National Laboratory9700 South Cass Avenue Bldg 362Argonne IL 60439-4815
wwwanlgov
A US Department of Energy laboratory managed by UChicago Argonne LLC
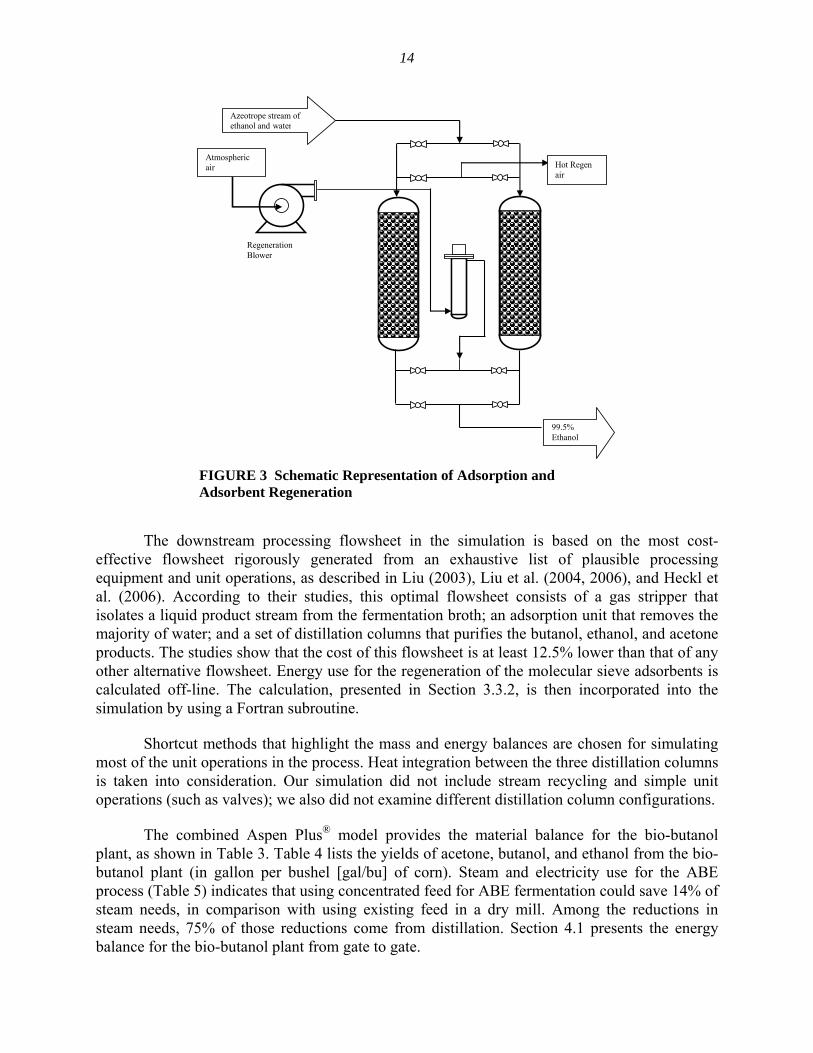
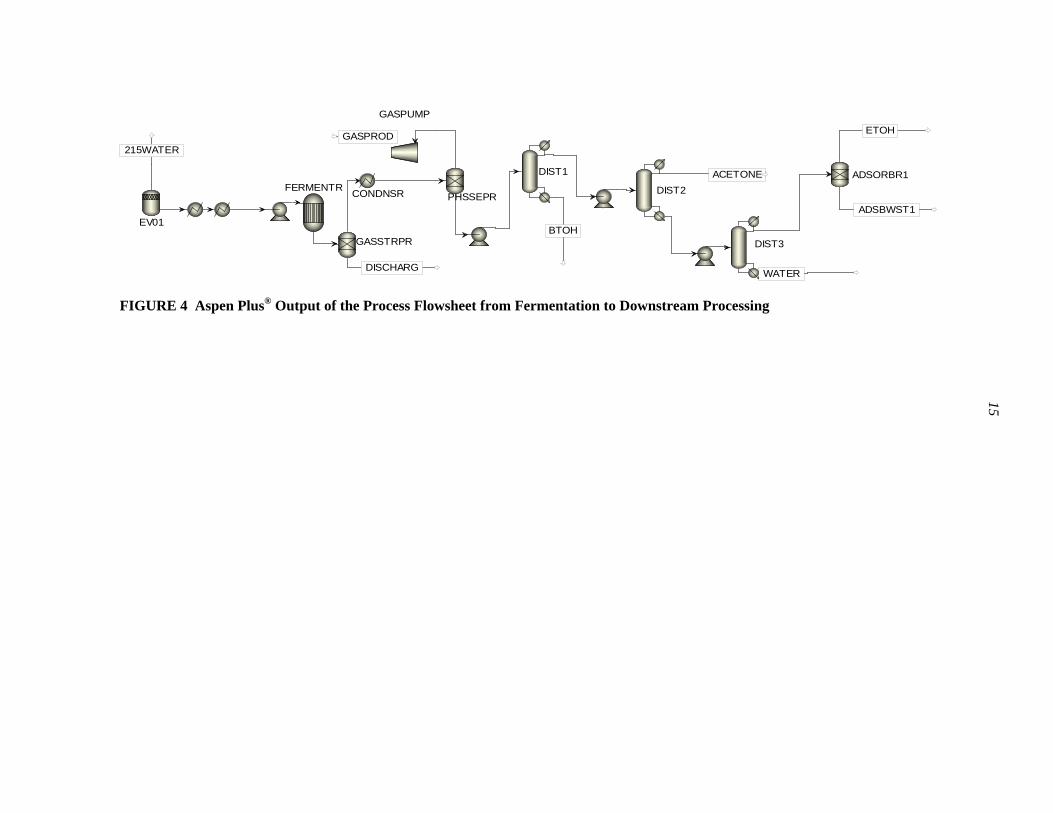
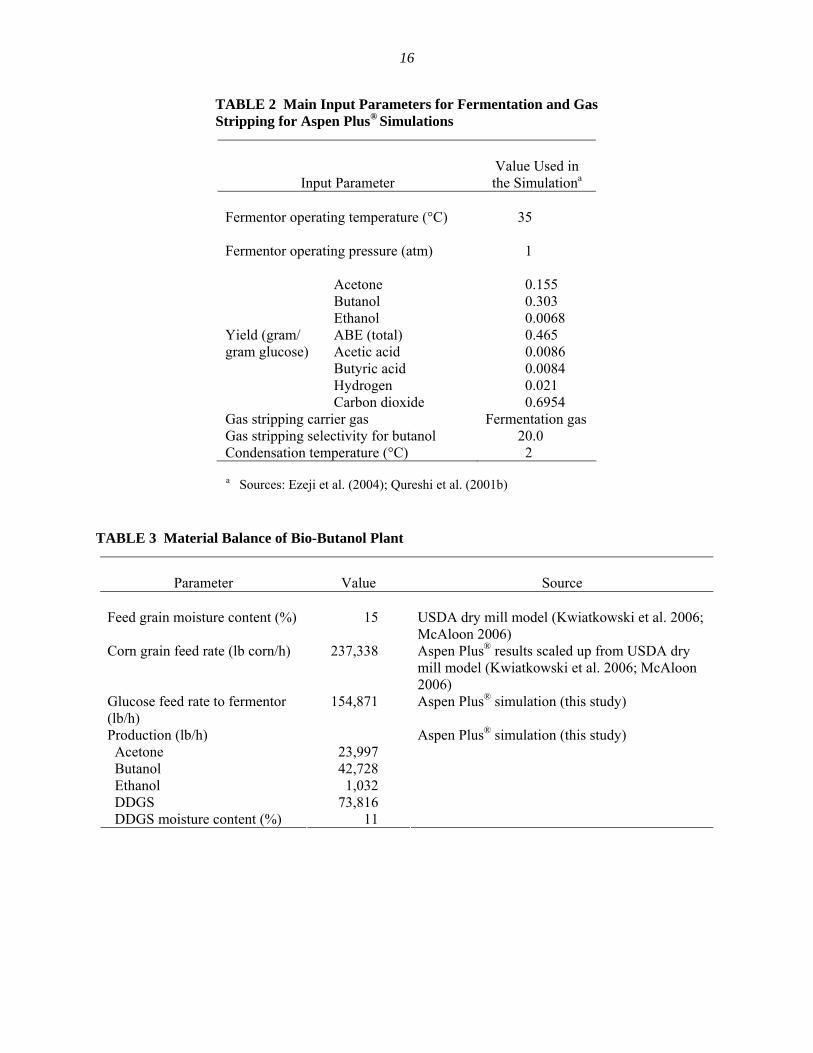
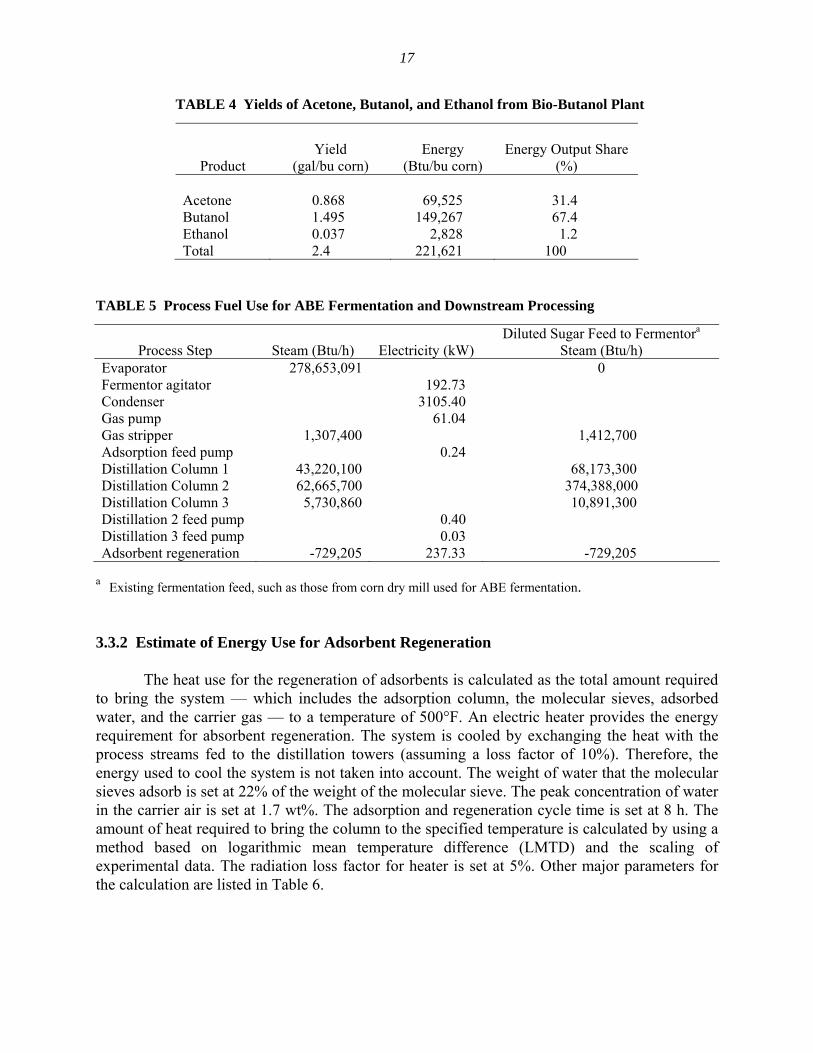
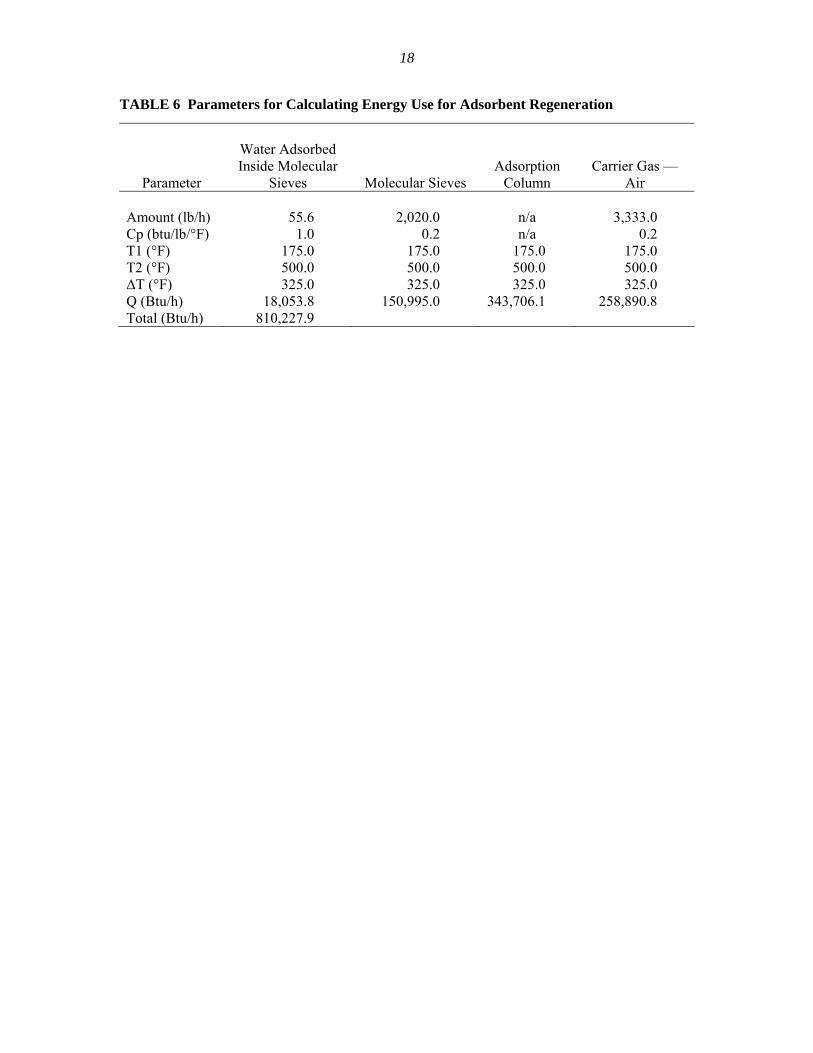
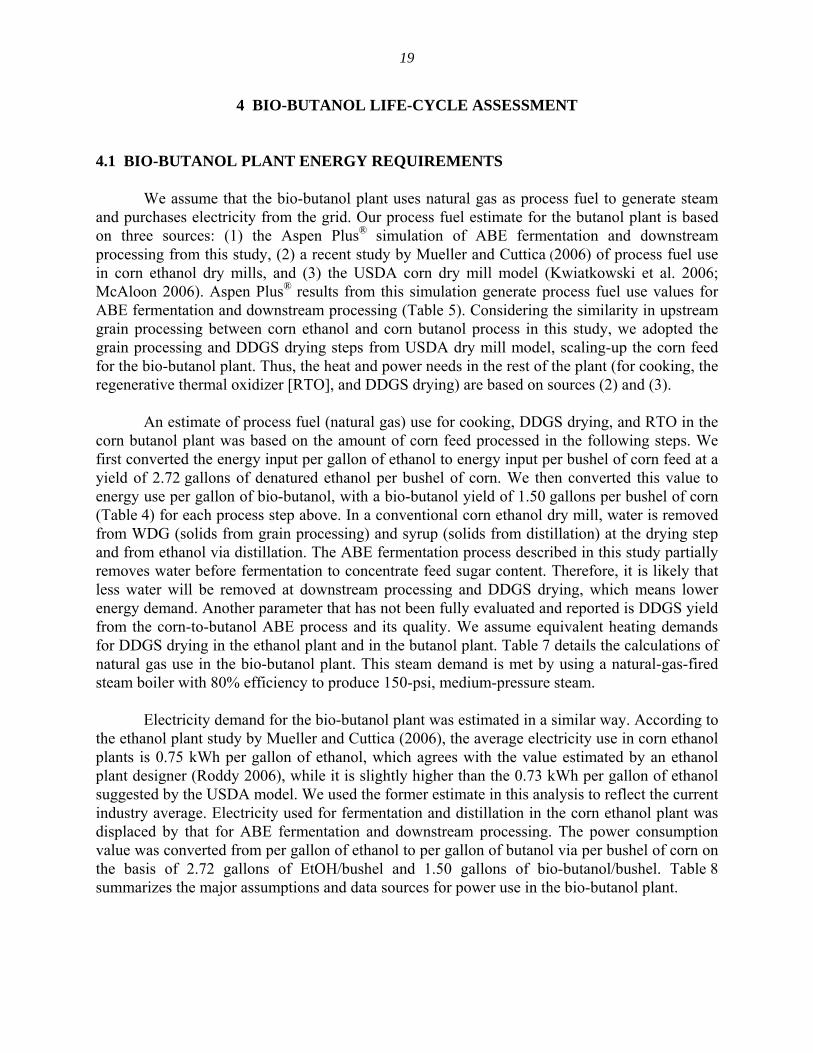
c
20
TABLE 7 Thermal Energy Requirements in Bio-Butanol Plant
Process Steps
EtOH Plant NG Required (Btugal denatured EtOH)
BtOH Plant NG Required Based on
Feed Corn (Btubu corn)c
BtOH Plant NG Required Based on
BtOH (Btugal BtOH)d
Cooking 10013ab 27236 18216 Dryer and RTOe
ABE fermentationf
and processing
10830 29458 19703 77195
BtOH plant total 115114
a Source Mueller (2006) 231 total process fuel for cooking 265 for EtOH processing Therefore cooking fuel use is 231(231 + 265) = 4657 of total fuel used in ethanol processing (excluding DDGS drying)
b The total thermal fuel requirement for cooking fermentation and distillation is 21500 Btugal denatured EtOH in a 100-MMGY ethanol dry mill Source Mueller and Cuttica (2006) NG needed for cooking is 4657 times 21500 Btugal = 10013 Btugal EtOH Assumed corn ethanol yield 272 galbu (denatured)
d Corn butanol yield 150 galbu of corn e Source Mueller and Cuttica (2006) f Aspen Plusreg results from this study includes heat for evaporation fermentation distillation and gas
stripping
TABLE 8 Electricity Consumption in Bio-Butanol Plants
BtOH Plant BtOH Plant EtOH Plant Electricity Required Electricity Required
Electricity Required Based on Feed Corn Based on BtOH Item (kWhgal EtOH) (kWhbu) (kWhgal BtOHa)
EtOH plantb 075 204 EtOH plant excluding 068c 184 123 fermentation and distillation ABE fermentation and 053d
separation BtOH plant total 176
a Converted from kWhbu to kWhgal BtOH with a corn butanol yield of 150 galbu b Source Mueller and Cuttica (2006) Converted to per bushel with an assumed corn ethanol yield of 272
gal denatured ethanolbu Calculated on the basis of USDA dry mill model fermentation requirement 006 kWhgal EtOH and 001 kWhgal for distillation are subtracted from 075 kWhgal EtOH
d Electricity needs from ABE fermentation and separation Aspen Plusreg results from this study
c
21
Scale-up from pilot test to full-scale commercial production could change the yield and energy consumption These factors affect the overall bio-butanol production and energy use estimates
42 BUTANOL LIFE-CYCLE PARAMETERS
Bio-butanol in this study is produced from corn It would be economical for the bioshybutanol plant to be built near corn farms to reduce transportation costs Operations associated with corn farming and feedstock transportation would be similar to those for corn Bio-butanol produced from corn will displace gasoline therefore transportation storage and distribution of bio-butanol would be similar to those of ethanol Table 9 presents key assumptions and GREET inputs for the bio-butanol life-cycle analysis Electricity for the bio-butanol plant is supplied from the US electric generation mix (Table 10)
TABLE 9 GREET Input Parameters for Corn Butanol WTW Analysis Corn Farming Transportation of Corn and Butanol and Vehicle Operation
Parameters Assumptions
Corn yield (buharvested acre) 158 Ratio of harvested acreage to planted 09 acreage Fertilizer use (gbu) N = 420 P2O5 = 149
K2O = 174a
CO2 emissions from potential land use 195 changes of farming (gbu) Lime use (gbu) 1202 Corn transportation mode and distance (mi) Truck (100) 50 Butanol transport and distance (mi) Barge (40) 520 Rail (40) 800 Truck (20) 110 On-road fuel economy of LDVs fueled with 248 bio-butanol (migal gasoline equivalent)
a N = nitrogen P2O5 = phosphorus fertilizer and K2O = potash fertilizer
22
To clearly show the energy and emission TABLE 10 US Average Electricity effects of bio-butanol vs gasoline we assumed in this Generation Mix Used in this Studya
study that bio-butanol is used in pure form in GVs and that butanol could achieve the same fuel economy per gallon gasoline equivalent as gasoline-powered Source Percent of Total
GVs (Table 9) WTW results are expressed in a per-million-Btu fuel matrix for comparison In reality Residual oil 27
bio-butanol may be used in various gasoline blends Natural gas 189
The per-million-Btu base system is more appropriate Coal 507
from a fuel supply perspective Because energy and Nuclear power 187
emission results are presented in Btu or grams per Biomass 13
million Btu of fuel produced and used the effects of Others 77
differences in fuel economy are removed a Source GREET year 2010
43 CO-PRODUCT CREDIT
During bio-butanol production several co-products are generated along with butanol mdash these include acetone DDGS a small amount of ethanol fatty acids (butyric acid and acetic acid) and H2 gas On the scale that we analyzed acetone is the major co-product of the bioshybutanol plant with 82000 metric tons produced per year Acetone contributes to more than one-half (by weight) of the butanol production The bio-butanol plant also generates 253600 metric tons of DDGS (11 moisture) per year mdash the second large co-product The yield of ethanol is relatively small (Tables 3 and 4) (similar to the level of fatty acid mixtures) Ethanol yield from ABE fermentation accounts for 15 of total ABE (acetone butanol and ethanol) by weight and only 12 by energy content (Btubu of corn) (Table 4) Although the fatty acids could be separated further purified from the liquid discharge stream and sold for use in the chemical market the separation step has not yet been tested with ABE fermentation In this Aspen Plusreg
simulation the fatty acids were not separated and purified and so they were not treated as coshyproducts
Significant amounts of H2 and CO2 gas were produced from fermentation these gases were used internally for gas stripping and then for maintaining anaerobic conditions for ABE fermentation The H2 could be separated as a fuel product if high-purity nitrogen gas is used in place of fermentation gas However using such nitrogen gas to maintain anaerobic conditions and for stripping in large-scale operation could be cost prohibitive Further studies to evaluate the engineering economics of alternative approaches for process operation while economically producing bio-butanol and hydrogen would be beneficial In this initial attempt to address the life cycle of bio-butanol H2 was not considered as a co-product
We partitioned total energy and emissions into bio-butanol and the co-products by using two methods product displacement and energy allocation Co-product displacement (Case 2) is based on the concept of displacing the current product with the new product In this case bioshyacetone is regarded as a renewable chemical The energy consumed and the emissions that occur during bio-acetone production displace the energy and emissions associated with petroleum-based acetone production Energy and emission accredits from the acetone displacement are
23
assigned to bio-acetone Similarly DDGS generated from corn butanol production contains 267 protein by weight which is close to the amount of protein contained in the DDGS from the corn ethanol process With the assumptions that the nutritional values of DDGS from the two processes are similar the DDGS from the bio-butanol plant displaces traditional animal feed (soy protein and corn) the production pathway of which is already in place in GREET
The limitation of using the displacement method for the bio-butanol life-cycle analysis is the large amount of acetone that is co-produced with butanol While the main product mdash butanol mdash accounts for 63 (wtwt) of the total product yield (acetone butanol and ethanol) acetone accounts for 35 (wtwt) (Table 3) Our previous study (Wu et al 2005) suggested that when the share of energy co-products increases the co-product displacement method could yield misleading results Therefore other partitioning methods such as energy allocation should be examined
For Case 3 we applied the product energy allocation method to co-products in which emission and energy burdens are allocated among products according to their energy output shares from the bio-butanol plant In the energy allocation method shares of output product energy for each product are determined according to the heating value Energy use and associated emissions from bio-butanol production and from upstream feedstock production and transportation activities are partitioned among acetone butanol ethanol and DDGS on the basis of their corresponding energy shares This approach treats all energy products from the production process as equal regardless of the form and quality differences among them It also implies that all four products are energy products The energy allocation method is applicable to this case because of the ABE products both butanol and ethanol are liquid fuels Although TABLE 11 Co-Product Energy Partitioningacetone is normally regarded as a chemical by Energy Allocationa
solvent and feedstock its energy content (in LHV) is in fact in between that of butanol and ethanol (Table 1) Furthermore DDGS has a Bio- Bio- Bio-
Butanol Acetone DDGS EthanolLHV of 8703 Btulb and can be used as a solid fuel for ethanol plant operations Several 40 19 40 001 ethanol plants are currently exploring DDGS
acombustion or gasification such as Corn Plus Based on energy contentto provide heat and power Although the fuel quality of DDGS is lower than that of the liquid fuels considering its large quantity (Table 3) use of DDGS for process heat brings energy savings and yet relaxes pressure on the already stagnant DDGS market Table 11 presents energy shares based on product energy (in Btu)content
We also established a case to consider the impact of overproduction of acetone (Case 4) In this case an overabundance of acetone produced by a large-scale butanol industry would flood the acetone market consequently losing its commercial value Case 4 is the same as Case 2 except that it treats acetone as a waste stream (ie corn-acetone is not credited) This case provides an extreme scenario for bio-butanol
24
44 CRADLE-TO-USER ASSESSMENT OF PETROLEUM ACETONE AND DISPLACEMENT
441 Petroleum Acetone and Feedstocks Production
To evaluate the energy and emissions benefits of producing bio-acetone in a corn butanol plant we performed a cradle-to-user analysis of petroleum-based acetone mdash from feedstock extraction to acetone delivery to the user site Acetone is almost exclusively produced via cumene peroxidation as a co-product with phenol Its main use is as a chemical intermediate in the manufacture of acetone cyanohydrin for methyl mechacrylate biphenol A and adol chemicals Direct solvent use accounts for about 30 of world demand for acetone
A synthetic process based on hydrocarbons or derivatives is now accounted for all acetone production in the United States and nearly all production in other countries In this process acetone is co-produced with phenol from cumene The yield of acetone from this process averages 221 units of cumene per unit of acetone by weight (Camara-Greiner 2005) Cumene is produced via alkylation of benzene with propylene under elevated temperatures and pressures in the presence of a catalyst Upstream from cumene production benzene is produced principally through a catalytic reforming from naphtha in a BTX (benzene toluene and xylene) process The other feedstock for cumene propylene is one of a half dozen products from crackers receiving raw hydrocarbon (naphtha) from oil refineries as well as natural gas Figure 5 presents a schematic of cradle-to-user petroleum acetone production
442 Assumptions and Data Sources
The cradle-to-user analysis system boundary for petroleum acetone includes resource extraction feedstock production acetone production process fuel production and associated transportation Our petroleum acetone production data are based on the life-cycle inventory (LCI) of Eco-Profile (Boustead 2005)
Eco-Profile Reports compiled average industry data and assembled detailed environmental data for various petrochemical processes We noted system boundary differences in the transportation and upstream fuel production stages between the Eco-Profile and the GREET database To ensure a consistent system boundary for all seven cases with current GREET biofuel pathways we selected feedstock production (under category ldquofeedstock energyrdquo in Eco-Profile) and the amount of process fuel used in production of acetone feedstocks and acetone (under category ldquoenergy content of delivered fuelrdquo in Eco-Profile) to arrive at our energy estimate for petroleum acetone The GREET default energy values were used for upstream fuel production (oil extraction refining and transportation) transport of feedstocks and transport of acetone to users Direct emissions from production processes (under category ldquoprocessrdquo in Eco-Profile) from Eco-profile were used for our petroleum acetone cradle-to-user estimate Emissions associated with upstream fuel production and all transportation activities were based on GREET values Table 12 presents data sources for each life-cycle step in petroleum acetone production
25
TABLE 12 Assumptions and Data Sources of Cradle-to-User Petroleum Acetone
Cradle-to-User Stage Data Sources
Crude extraction for process fuel Crude transport for process fuel GREET 17 Oil refining and transport for process fuel
Cumene transporta GREET 17
Acetone production (life-cycle value)b Eco-Profile
a Benzene and propylene were assumed to be captive Acetone is for captive use in the acetone production facility to produce acetone cyanohydrin biphenol A and adol chemicals Cumene is transported to acetone production facility
b Cumene production value is not available
The hypothetical corn butanol plant is located in the US Corn Belt to reduce corn transportation costs We assumed that acetone produced from the corn butanol plant would displace petroleum acetone produced in the region of Petroleum Administration for Defense Districts (PADD) II (EIA 2004) PADDs were delineated during World War II to facilitate oil allocation PADD II includes 14 Midwest states and overlaps with the Corn Belt where most corn-based plants would operate We identified the mass flow for cumene and acetone production and transportation in PADD II on the basis of a Chemical Economics Handbook (CEH) Marketing Research Report (Camara-Greiner 2005) In this region 85 of total cumene is produced from captive benzene and propylene (that is benzene and propylene are produced and consumed on-site) The cumene is purchased by and subsequently transported to the acetone producer
Major assumptions for cradle-to-user analysis of petroleum acetone are listed below
bull Process fuels used in the acetone pathway are electricity oil and natural gas
bull Electricity is purchased from the grid with the US average generation mix (Table 10)
bull Cumene production feedstocks (benzene and propylene) are captive in the refinery so no transportation is associated with these feedstocks
bull The acetone production facility purchases 100 of feedstock cumene
bull Cumene needs for the acetone producer is estimated on the basis of the mass unit ratio of 221 units of cumene per unit of acetone (Camara-Greiner 2005)
26
bull Cumene is transported to the acetone production facility an average distance of 323 miles in a 1028-Btuton-mi Class 8 diesel truck
Table 13 presents the heating values used in Eco-Profile and GREET In this assessment energy data are expressed in LHV of Btu or kWhkg acetone produced When there was a discrepancy in LHV between Eco-Profile and GREET for same fuel or chemical the GREET value was selected to ensure consistency with the baseline fuel pathways of petroleum gasoline and corn ethanol The energy data from Eco-Profile are converted according to the ratio of LHV Eco-ProfileLHV GREET (Table 13)
TABLE 13 Low-Heating-Value Comparison for this Studya
Fuel
GREET (Btugal Btuscf)
Eco-Profile (MJkg)
Eco-Profile (Btugal Btuscf)
Ratio LHV EcoGREET
Fuel oil NG
140353 983
405 4816
144176 1005
103 102
a Unit for fuel oil is Btugal unit for natural gas is Btuscf
443 Petroleum Acetone Displacement
We assumed that the corn-based butanol plant would be built near a corn farm in the Midwest PADD II region and operated at a production scale of 150000 metric tons of bioshybutanol per year With a mass production ratio of 056 lb of bio-acetone per pound of bioshybutanol this facility could yield 82461 metric tons of bio-acetone annually mdash 16 of the total acetone production in PADD II and 4 nationwide We assumed that bio-acetone would be transported to acetone consumers via train (500 miles) and truck (100 miles) within PADD II
In the co-product displacement approach (Case 2) petroleum acetone is displaced by corn-based acetone from cradle to user The displacement is carried out in the following sequence the cradle-to-gate results of petroleum acetone (as illustrated in Figure 5) were first subtracted from the WTW results of bio-butanol and then the energy or emissions values associated with bio-acetone transportation from the bio-butanol plant to the acetone user were added
27
FIGURE 5 System Boundaries for Cradle-to-User Pathway of Fossil-Based Acetone and Corn-Based Acetone
28
29
5 RESULTS AND DISCUSSION
51 ENERGY CONSUMPTION AND GHG EMISSIONS
Corn-derived butanol achieves substantial fossil energy savings (39ndash56) compared with gasoline ([Cases 3 and 2] Figure 6) on a life-cycle basis In Cases 2 and 3 bio-butanol production contributes to a positive energy balance (defined as fossil energy used in gasoline production minus fossil energy used in bio-butanol production) Without acetone credit as in Case 4 in which acetone is regarded as a waste bio-butanol production is not an option for fossil energy savings
The primary fuel consumed in the bio-butanol life cycle is natural gas followed by petroleum oil and coal (Figure 6) Although electricity generation uses 50 of coal (Table 10) the amount of electricity required is relatively small (Table 8) and so only 9ndash17 of total fossil energy use is from coal (Cases 3 and 2) A life-cycle fossil energy breakdown (Figure 7) indicates that about three-fourths of the fossil fuel is spent in the butanol production plant (73) Corn cultivation accounts for a total of 23 of WTW fossil energy (12 for agricultural chemical and fertilizer manufacturing and 11 for farming operations) In the butanol plant the majority of natural gas demand comes from the process steam requirement (Table 5) which leads to 115000 Btu per gallon of butanol produced mdash approximately three times that of corn ethanol production before co-products are allocated As we pointed out earlier this estimate tends to be conservative because it did not reflect the lower heating requirement for DDGS drying in the bio-butanol plant The water requirement in biological fuel production drives the energy balance in the plant A higher concentration of product in fermentation reduces energy needs for product concentrating in subsequent process steps Historically improvement of ethanol concentration in a fermentor from ~8 in 1980s to 20 at present demonstrates in part the lower energy cost in ethanol plant operation The ABE fermentation process evaluated in this study achieved a concentration of 19 (wtwt) of total solvents (ethanol butanol and acetone) in a fermentor With rapid in-situ removal of solvent by gas stripping the process is able to increase feed concentration to improve production rate while minimizing butanol inhibition Although using concentrated feed in fermentation effectively reduces about 14 of the steam requirement (Table 5) solids concentration in the fermentor mdash an important issue in process development and operation mdash remains a constraint
Vehicles fueled by bio-butanol achieve small to moderate reductions in GHG emissions relative to gasoline vehicle on a WTW basis in Cases 2 (8 displacement ) and 3 (32 energy allocation) (Figure 8) For every million Btu of bio-butanol used in place of one million Btu of gasoline 8ndash32 kg of GHG emissions could be avoided (Cases 2 and 3) The GHG emissions profile for the bio-butanol production option in this study is similar to that of corn ethanol Of total GHG emissions in the bio-butanol WTW cycle over 70 by weight of the GHGs are from CO2 less than 5 is from methane and the remaining 18ndash21 is from N2O (Figure 9) Natural gas consumption in butanol plant is the major cause of GHG emission
We assumed that vehicles fueled by bio-butanol would offer performance similar to that of vehicles fueled by gasoline We have not found any vehicle testing data to confirm this
-
30
assumption Vehicle testing with butanol should be conducted to evaluate butanolrsquos performance in vehicles under realistic driving conditions
52 EFFECT OF ACETONE CO-PRODUCT CREDIT
Energy partitioning for co-products has a significant effect on overall energy use and associated GHG emissions The three cases that we examined (2 3 and 4) presented different options for acetone When acetone is regarded as a fuel and credit is allocated on the basis of product energy content (Case 3) the WTW analysis yields moderate fossil energy and GHG emissions benefits for bio-butanol When acetone is used as a renewable chemical to displace petroleum acetone via the displacement method (Case 2) the results of analysis show 17 savings in fossil fuel (Figure 6) and small reductions in GHG emissions (Figure 8) However treating acetone as a waste stream (Case 4) resulted in an increase of almost one million Btu in fossil energy and 40000 g of GHG emissions (compared with gasoline) for each million Btu of bio-butanol produced The difference is largely attributable to the acetone credit Feedstocks for petroleum-based acetone production (propylene and benzene [Figure 5]) are produced from naphtha and natural gas mdash 100 fossil feedstock (Lacson et al 2005) Another factor is the high yield of acetone from the ABE process 056 lb acetone per pound of butanol These two factors suggest that a significant portion of fossil energy use in petroleum acetone production will be regarded as a credit when bio-acetone displaces fossil acetone which eventually leads to a small fossil energy value (Figure 6)
-500000
0
500000
1000000
1500000
2000000
WTW
Fos
sil E
nerg
y U
se (B
tum
mB
tu) Petroleum
NG
Coal
Co product allocation based on displacement
Co-product allocation based on product energy value
Butanol Ethanol Butanol Butanol Ethanol Gasoline (Case 3) Dry mill (Case 2) (Case 4) Dry mill (Case 1)
(Case 6) (Case 5)
FIGURE 6 Well-to-Pump Fossil Energy Breakdown for Bio-Butanol and Corn Ethanol Compared with Gasoline Using Different Co-Product Allocation Methods (negative value indicates fossil energy avoided)
31
Vehicle Fuel Transport Bio-butanol
Net Consumption in Production
Plant 73
Corn Transport
2
Corn Farming 11
Fertilizer Manufacture
12
Operation 02
FIGURE 7 Breakdown of Fossil Energy Use in Various Stages of Fuel Life Cycle for Corn-Based Butanol (Case 3)
Butanol Ethanol Butanol Butanol Ethanol Gasoline (Case 3) Dry mill (Case 2) (Case 4) Dry mill (Case 1)
(Case 6) (Case 5)
FIGURE 8 Life-Cycle GHG Emissions of Bio-Butanol and Ethanol Compared with Gasoline Using Different Co-Product Allocation Methods
0
20000
40000
60000
80000
100000
120000
140000
WTW
GH
G E
mis
sion
s (g
CO
2 eq
uiva
lent
GH
Gm
mB
tu)
32
80000
60000
40000
20000
0 Butanol (Case 3) Ethanol Dry mill (Case 6)
FIGURE 9 Life-Cycle GHG Emission Breakdown for Bio-Butanol and Ethanol (Energy Allocation)
The displacement method provides significant benefits in terms of reductions in the use of fossil energy (Figure 6) but relatively small reductions in GHG emissions (Figure 8) The main reason for this phenomenon is that petroleum acetone production extracts carbon from a fossil resource and transforms the carbon to another bounded form (chemical) with net GHG emissions generated from consumption of the process fuel In its life cycle petroleum acetone is primarily used as a chemicalfeedstock with a fraction as solvent Although a small amount of carbon embedded in petroleum acetone may escape to the atmosphere through volatilization during product application (ie use as solvent) the majority ultimately ends up as a solidliquid chemical in a bound form rather than being emitted to the air as CO2 By displacing petroleum acetone with bio-acetone in this case the life-cycle reductions in fossil energy use do not translate to benefits in terms of GHG emissions
53 COMPARISON OF BIO-BUTANOL WITH CORN ETHANOL
The ABE process simulated in this study appears to be as efficient in producing acetone butanol and ethanol on a weight basis as current corn dry mills (Table 14) Measured by gallon or gram of ABE the yields from the ABE process are similar to ethanol yields from a conventional dry mill As a rule of thumb in ethanol produced from corn dry milling one-third of the feed mass goes to ethanol one-third is left in DDGS and one-third is emitted as CO2 The
WTW
GH
G E
mis
sion
s B
reak
dow
n(g
ram
CO
2 eq
uiv
per
milli
on B
tu)
N2O
CH4
CO2
33
TABLE 14 Acetone Butanol and Ethanol Outputs from Corn Compared with Ethanol from Conventional Corn Mills
Corn Butanol Plant Ethanol from Corn
Acetone Butanol Ethanol Total Dry Mills
Btubu corn 69525 149267 2828 221620 (with 198458 acetone) 152095 (without acetone)
Galbu corna
gCg cornb 087
0074 150 0137
004 0003
240 0214
260 0172
a Un-denatured b Based on dry corn feed
ABE process examined in this study follows TABLE 15 Co-Product Yields (gg corn)almost the same rule one-third of the feed mass ends up in the products (acetone butanol and
Acetone Butanolethanol) one-third remains in DDGS and about Ethanol DDGS CO2one-third (30) is emitted as CO2 (Table 15) (the remaining ~3 ends up in fatty acids [butyric and 034 033 030 acetic acids] and losses) Acetone 0119
Butanol 0212 Because acetone is not used as a fuel at Ethanol 0005
present net fuel production (butanol and ethanol) is small A typical dry mill can deliver 272 galbu of fuel ethanol or 26 galbu of undenatured ethanol which is ~11 gal more than the butanol and ethanol yield together from the ABE process (154 galbu) (Table 14) On the other hand butanol contains 30 more energy (LHV) than ethanol (Table 1) by volume When we take fuel energy yield into consideration each bushel of corn could generate nearly 152000 Btu of liquid fuels from the ABE process (butanol and ethanol together) while the same bushel delivers 198000 Btu of liquid fuels (undenatured ethanol) from the conventional ethanol dry mill (46000 Btu more than the bio-butanol option) Hence from a liquid fuel production perspective the ABE process option does not offer an increase in renewable fuel production in comparison with conventional corn ethanol production
Process fuel use for ABE production could be a major hurdle as indicated in Table 16 A bushel of corn requires 82 more steam and 34 more electricity to produce ABE from a bioshybutanol plant than to produce ethanol from a corn dry mill If the first corn butanol plant is built from an existing corn dry mill that has been retrofitted the implication is that operation cost will be high To build a new corn butanol plant capital cost may be lower because of the reduced footprint in fermentation and downstream processing relative to the existing dry mill but the plant would have increased process fuel cost mdash especially given the current price for natural gas
34
TABLE 16 Process Fuel Use in Bio-Butanol and Ethanol Production Plant
Fuel Bio-butanol Plant Ethanol Dry Mill Ratio of Butanol
to Ethanol
Natural gas (Btubushel of corn) Electricity (kWbushel of corn)
172108
263
94320
197
182
134
Another concern is the feedstock supply for bio-butanol The current ABE process shares the same starch-based feedstocks with conventional corn ethanol Development of bio-butanol through the ABE process could take limited feedstocks away from conventional corn ethanol production RampD efforts in bio-butanol may need to be directed toward identifying new feedstocks and process technologies In fact Qureshi (2007) recently reported on a study using cellulosic biomass as feedstock for bio-butanol production via the ABE process Because ABE fermentation is from glucose the results of ongoing RampD on cellulosic pretreatment for cellulosic ethanol could be applied to the ABE process
54 CRADLE-TO-USER COMPARISON OF BIO-ACETONE WITH PETROLEUM ACETONE ISSUES AND CONCERNS
Use of bio-acetone to displace petroleum acetone shows promising energy and environmental benefits (Figure 10) from a life-cycle perspective Conventional acetone production is a fossil-energy-intensive process By producing acetone from corn manufacturers could save a significant amount of total fossil energy mdash up to 71 relative to petroleum-based acetone The renewable acetone achieves energy savings of 91 for petroleum and 58 for natural gas Figure 11 further shows the life-cycle fossil energy distribution between the two The majority of fossil energy use shifts from feedstocks (57) in the petroleum acetone production process to acetone production (70) in the corn acetone production process
Bio-acetone in this study is produced from corn mdash a renewable agricultural resource that absorbs atmospheric CO2 during its growth The carbon in CO2 is converted to organic carbon in the corn and is further transformed and embedded in acetone through the ABE process Therefore we allocated a renewable carbon credit to bio-acetone for the carbon embedded in corn As illustrated in Figure 12 a net carbon sequestration would occur from cradle to user GHG emissions would be much higher mdash about 500 glb acetone produced if the carbon in acetone is from non-renewable sources
Although bio-acetone production results in positive WTW energy benefits and decreased GHG burdens several issues and concerns need to be addressed In 2005 a total of 19 million metric tons of acetone was produced in the United States (Camara-Greiner 2005) PADD II which overlaps with the US corn belt would most likely to be the location for corn-based
35
butanol plants Production of petroleum acetone in this region in 2005 was 505000 metric tons representing 26 of total US production If bio-acetone were produced from a single simulated bio-butanol plant located in this region the volume of bio-acetone would be about 16 of the total petroleum acetone production in the region and 4 nationwide Furthermore assuming that total bio-butanol production levels could reach a quarter of the production level of corn ethanol of 49 billion gallons (2006) the amount of corn feed used for bio-butanol production could generate 676 million gallons of bio-butanol and 391 million gallons (12 million metric tons) of bio-acetone At this production scale the acetone market would be flooded with both bio- and petroleum acetones dramatically decreasing the market value of acetone Thus one may argue that acetone should be treated as a waste stream (as we did in Case 4) Aside from the fossil energy and GHG benefits (within WTW analysis boundaries) that may result from the production of bio-butanol we should consider the emission of liquid acetone into the environment if acetone is treated as a waste stream On the basis of a value of 0074 g of carbon generated in acetone from each gram of corn if all of the carbons contained in acetone were converted to gaseous CO2 approximately 6900 g of CO2 could be emitted to the atmosphere per bushel of processed corn Acetone-containing water in such high volumes could become a major source of atmospheric VOC and CO2 emissions
Unfortunately the outlook for replacement of petro-chemicals with bio-chemicals is far from clear Petroleum acetone is currently generated as a by-product during phenol production from cumene On average 061 lb of acetone is obtained per pound of phenol produced (SRI Consulting 2005) The United States consumed $21 million metric tons of phenol in 2004 (SRI Consulting 2007) Worldwide the consumption of phenol grows at a rate of 41 per year As demand for phenol continues to rise petroleum acetone will be produced with or without the presence of bio-acetone In the ABE process studied the bio-acetone is also a co-product New technologiesprocesses that significantly reduce the acetone that results from phenol and ABE production are therefore needed In fact at the time of this study DuPont was making considerable progress in molecular biology which led to a patent award for a recombinant bacterium that produces butanol exclusively from biological feedstocks (DuPont 2007) Other potential research directions include exploring the use of acetone as a fuel blend and as a feedstock for new chemicals
36
0
5000
10000
15000
20000
25000
30000
Cra
dle-
to-U
ser F
ossi
l Ene
rgy
Use
(Btu
lb A
ceto
ne)
Petroleum Natural Gas Coal
Corn-Acetone Petroleum-Acetone
FIGURE 10 Fossil Energy Use Based on the Production of Bio-Acetone Compared with Fossil Energy Use Based on the Production of Petroleum Acetone
37
8127 Btu of fossil per lb of corn acetone a) bio-Acetone
Fuel Transport
3 Corn Farming 12
Fertilizer Manufacture
13
Corn Net Transport
Consumption 2 in Production
Plant70
27818 btu of fossil per lb of acetone Feedstock and
acetone
b) Petroleum-Acetone
Acetoneproduction -Co-product
Credit40 Feedstock
production 57
transportation 3
FIGURE 11 Fossil Energy Consumption Breakdown for (a) Bio-Acetone and (b) Petroleum Acetone
38
Cra
dle-
to-U
ser G
HG
Em
issi
ons
(g C
O2-
equi
vlb
ace
tone
)
1500
1000
500
0
-500
-1000 Corn-Acetone Petroleum-Acetone
CO2 CH4 N2O
Net CO2 emission - 304gCO2 equivlb
Net CO2 emission 738gCO2 equivlb if carbon is not sequested
FIGURE 12 GHG Emissions Generated or Avoided by Bio-Acetone Production Compared with Petroleum Acetone Production
39
6 CONCLUSIONS
Our conclusions based on the results of our study include the following
bull Corn-based butanol produced by means of the current ABE process could offer substantial fossil energy savings and moderate reductions in GHG emissions relative to petroleum gasoline on a WTW basis when co-products are credited by energy allocation
bull The energy benefits associated with bio-butanol are significant when coshyproduct corn-acetone is credited with displacement method
bull When acetone is credited by energy allocation life-cycle energy benefits for corn butanol are less promising than those of corn ethanol generated from conventional dry milling processes GHG emissions generated from bioshybutanol life cycle are higher than those generated from corn ethanol
bull From a liquid fuel production standpoint the ABE process examined may not be as effective as conventional corn ethanol production in that it produces less liquid fuel (on an energy basis) per bushel of corn than the corn ethanol process in addition to increased process fuel use in the production plant
bull The impacts of corn-acetone (produced via the ABE process) on the acetone market need to be carefully examined and new uses for bio-acetone need to be explored
40
41
7 REFERENCES
Boustead I 2005 ldquoEco-Profiles of the European Plastic Industry Acetonerdquo Plastics Europe March available at httpwwwplasticseuropeorgContentDefaultaspPageID=392 accessed Dec 2006
Brinkman N M Wang T Weber and T Darlington 2005 GM Study Well-to-Wheels Analysis of Advanced FuelVehicle Systems ndash A North American Study of Energy Use Greenhouse Gas Emissions and Criteria Pollutant Emissions May httpwwwtransportationanlgovpdfsTA339pdf
Collins K 2007 The New World of Biofuels Implications for Agriculture and Energy Presented at EIA Energy Outlook Modeling and Data Conference March Washington DC
Conti J 2007 Annual Energy Outlook 2007 presentation at EIA Energy Outlook Modeling and Data Conference March Washington DC
Dadgar AM and GL Foutch 1988 ldquoImproving the Acetone-Butanol Fermentation Process with Liquid-Liquid Extractionrdquo Biotechnology Progress 4 36ndash39
DuPont 2007 Fermentive Production of Four Carbon Alcohols World Patent Application WO2007041269 USPTO PCTUS2006038007
EIA see Energy Information Administration
Energy Information Administration 2004 httpwwweiadoegovpuboil_gaspetroleum analysis_publicationsoil_market_basicspaddmaphtm accessed May 15 2007
Energy Information Administration 2007 Annual Energy Outlook 2007 DOEEIA-0383(2007) available at httpwwweiadoegovoiafaeopdf0383(2007)pdf accessed May 23 2007
Ezeji TC N Qureshi and HP Blaschek 2004 ldquoAcetone Butanol Ethanol (ABE) Production from Concentrated Substrate Reduction in Substrate Inhibition by Fed-Batch Technique and Product Inhibition by Gas Strippingrdquo Appl Microbiol Biotechnol 63 653ndash658
Ezeji TC PM Karcher N Qureshi and HP Blaschek 2005 ldquoImproving Performance of a Gas-Stripping-Based Recovery System to Remove Butanol from Clostridium Beijerinckii Fermentation Bioprocess Biosyst Eng 27 207ndash214
Guibet J-C 1997 Carburants et Moteurs Technologies Energie Environnement Publication de lrsquoInstitut Franccedilais du Peacutetrole ISBN 2-7108-0704-1
Heckl I Z Kovacs F Friedler LT Fan and J Liu 2006 ldquoAlgorithmic Synthesis of an Optimal Separation Network Comprising Separators of Different Classesrdquo Chemical Engineering and Processing doi101016jcep200606013
42
Huang WC DE Ramey and ST Yang 2004 ldquoContinuous Production of Butanol by Clostridium Acetobutylicum Immobilized in a Fibrous Bed Bioreactorrdquo in Applied Biochemistry and Biotechnology mdash Part A Enzyme Engineering and Biotechnology 113ndash116 887ndash898
Intergovernmental Panel on Climate Change (IPCC) 2001 Climate Change 2001 the Scientific Basis Technical Summary of the Group I Report
Intergovernmental Panel on Climate Change (IPCC) 2007 Working Group I The Physical Basis of Climate Change IPCC WG1 AR4 report available at httpipcc-wg1ucareduwg1 wg1-reporthtml accessed May 23 2007
IPCC see Intergovernmental Panel on Climate Change
Kwiatkowski JR McAloon AJ Taylor F Johnston D 2006 Modeling the process and costs of the production of fuel ethanol by the corn dry-grind process Industrial Crops and Products V23 Issue 3 p288-296
Lacson JG 2004 ldquoPropylenerdquo in Chemical Economics Handbook (CEH) Marketing Research Report SRI Consulting Menlo Park Calif
Liu J 2003 Downstream Process Synthesis for Biochemical Production of Butanol Ethanol and Acetone from Grains PhD Dissertation Kansas State University Manhattan KS
Liu J LT Fan P Seib F Friedler and B Bertok 2004 ldquoDownstream Process Synthesis for Biochemical Production of Butanol Ethanol and Acetone from Grains Generation of Optimal and Near Optimal Flowsheets with Conventional Operating Unitsrdquo Biotechnol Prog 20 1518ndash1527
Liu J LT Fan P Seib F Friedler and B Bertok 2006 ldquoHolistic Approach to Process Retrofitting Illustration with Downstream Process for Biochemical Production of Organicsrdquo Ind Eng Chem Res 45 4200ndash4207
Marlatt JA and R Datta 1986 ldquoAcetone-Butanol Fermentation Process Development and Economic Evaluationrdquo Biotechnology Progress 2 23ndash28
McAloon A 2006 Shelled Corn to Ethanol Process Energy Analysis Aspen + reg MGY Dry Grind Ethanol Process Model ERRCARSUSDA
Morey V et al 2006 Characterization of Feed Streams and Emissions from Biomass GasificationCombustion at Fuel Ethanol Plants American Society of Agricultural and Biological Engineers (ASABE) Presentation Paper Number 064180 July Portland Ore
Mueller S and J Cuttia 2006 Research Investigation for the Potential Use of Illinois Coal in Dry Mill Ethanol Plants prepared by the Energy Resources Center at University of Illinois at Chicago for the Illinois Clean Coal Institute and the Illinois Department of Commerce and Economic Opportunity Oct
43
Mueller S 2006 Energy Resources Center University of Illinois at Chicago Chicago Ill personal communication to May Wu of Argonne National Laboratory Argonne Ill
Natural Resources Canada 2007 ldquoThe Addition of Bio-Butanol to GHGenius and a Review of the GHG Emissions from Diesel Engines With Urea SCRrdquo NRC Report prepared by (SampT)2
Consultants BC Canada
Parekh M J Formanek and HP Blaschek 1999 ldquoPilot-Scale Production of Butanol by Clostridium Beijerinckii BA 101 Using a Low-Cost Fermentation Medium Based on Corn Steep Waterrdquo App Microbiol Biotechnol 51 152ndash157
Qureshi N and HP Blaschek 1999 Economics of Butanol Fermentation Using Hyper-Butanol Producing Clostridium Beijerinckii BA 101rdquo Trans Institution of Chemical Engineers 78 (Part C) 139ndash144
Qureshi N and HP Blaschek 2001a ldquoABE Production from Corn A Recent Economic Evaluationrdquo Journal of Industrial Microbiology amp Biotechnology 27 292ndash297
Qureshi N and HP Blaschek 2001b ldquoRecovery of Butanol from Fermentation Broth by Gas Strippingrdquo Renewable Energy 22 557ndash564
Qureshi N 2007 Bioconversion of Agricultural Residues to Butanol Simultaneous Saccharification Fermentation and Product Recovery Presentation at the 29th Symposium on Biotechnology for Fuels and Chemicals Denver CO
Roddy W 2006 Dry Mill Ethanol Plants Environmental Impacts and Future Growth ICM Presented at Governorsrsquo Ethanol Coalition Feb
SRI Consulting 2005 Chemical Economics Handbook (CEH) Marketing Research Report Menlo Park Calif
SRI Consulting 2007 Chemical Economics Handbook (CEH) Marketing Research Report Menlo Park Calif
White and Johnson 2003 Corn Chemistry and Technology 2nd edition
Wu M Y Wu M Wang 2005 Mobility Chains Analysis of Technologies for Passenger Cars and Light-Duty Vehicles Fueled with Biofuels Application of the GREET Model to the Role of Biomass in Americarsquos Energy Future (RBAEF) Project Argonne National Laboratory Report May available at httpwwwtransportationanlgovpdfsTA344pdf
44
45
APPENDIX
46
47
APPENDIX
A1 PARAMETERS FOR CORN BUTANOL LIFE-CYCLE ANALYSIS
Corn Farming Energy UseFertilizer Use
Nitrogen P2O5 K2O CaCO3
Pesticide Use Herbicide Insecticide
Corn Transportation From Field to Stacks
Truck Share Distance
From Stacks to Plants Truck
Share Distance
Butanol Production Energy Use
Thermal Energy Electricity
Yield Butanol Acetone DDGS
22500 Btubu
420 gbu 149 gbu 174 gbu
1202 gbu
810 gbu 068 gbu
100 10 mi
100 40 mi
115114 Btugal BuOH 176 kWhgal BuOH
150 galbushel 380 lbgal BuOH 1166 lbgal BuOH
Butanol Transportation and Distribution Transportation
Barge Share Distance
Rail Share Distance
Truck Share Distance
40 520 mi
40 800 mi
20 110 mi
GREET corn-EtOH pathway
GREET corn-EtOH pathway GREET corn-EtOH pathway GREET corn-EtOH pathway
GREET corn-EtOH pathway
GREET corn-EtOH pathway GREET corn-EtOH pathway
GREET corn-EtOH pathway GREET corn-EtOH pathway
GREET corn-EtOH pathway GREET corn-EtOH pathway
see report see report
see report see report
see report
see report see report
see report see report
see report see report
48
Distribution Truck
Share 100 see report Distance 30 mi see report
Butanol Combustion in Vehicles On-Road Fuel Economy
245 migal see report
A2 PARAMETERS FOR PETROLEUM-BASED ACETONE ANALYSIS
Energy Use Energy Used as Process Fuel Electricity 031 kWhkg acetone see report
Oil 9337 Btukg acetone see report NG 10678 Btukg acetone see report
Energy Used as Feedstock Oil 12961 kWhkg acetone see report NG 18908 kWhkg acetone see report
Cumene Transportation Truck
Share 100 Distance 323 mi see report Fuel economy 50 migal see report
A3 TRANSPORTATION FOR CORN-ACETONE
Rail Share 100 see report Distance 500 mi see report
Truck Share 100 see report Distance 100 mi see report
A4 FUEL SPECIFICATIONS
Butanol Low heating value 99837 Btugal Density 3065 ggal
Carbon content 65 Acetone
Low heating value 83127 Btugal Density 2964 ggal
Carbon content 62
Energy Systems Division Argonne National Laboratory9700 South Cass Avenue Bldg 362Argonne IL 60439-4815
wwwanlgov
A US Department of Energy laboratory managed by UChicago Argonne LLC
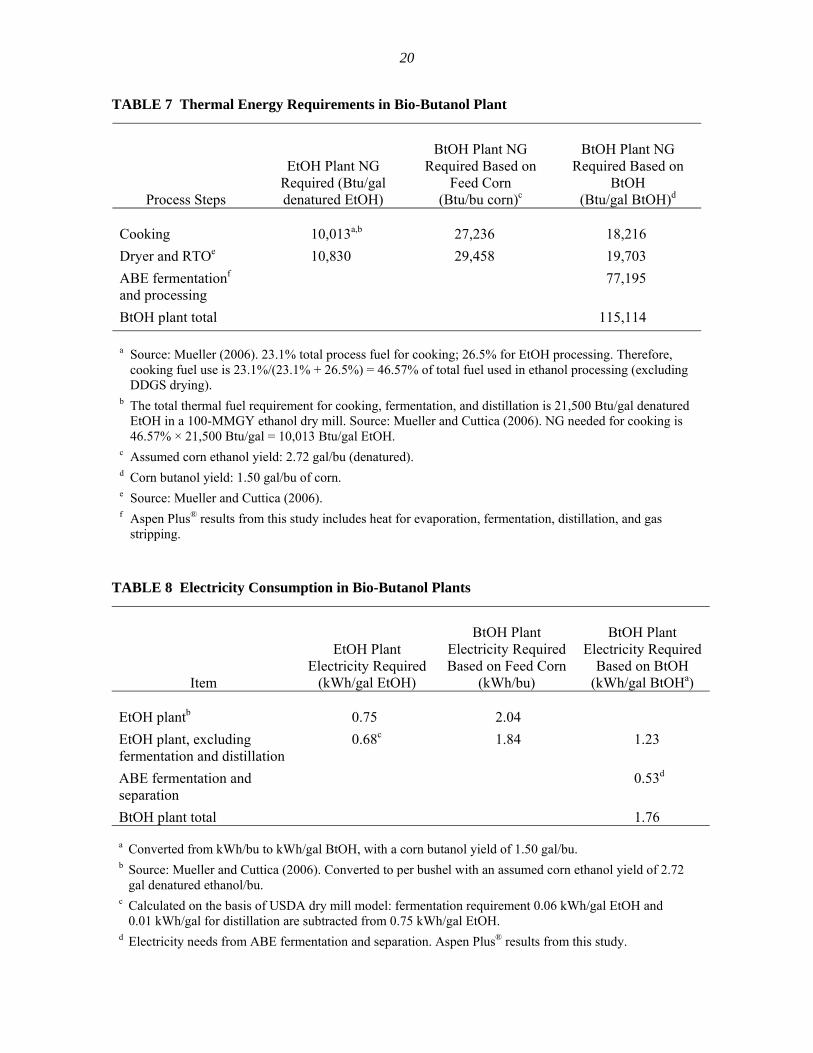
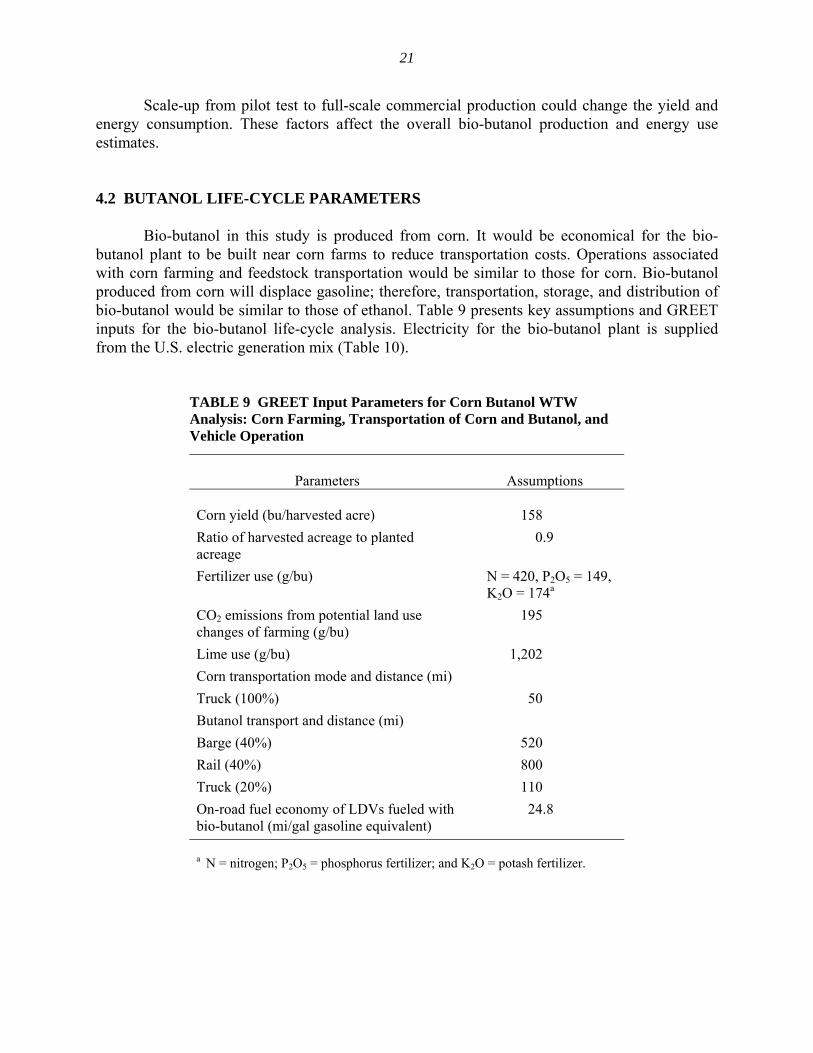
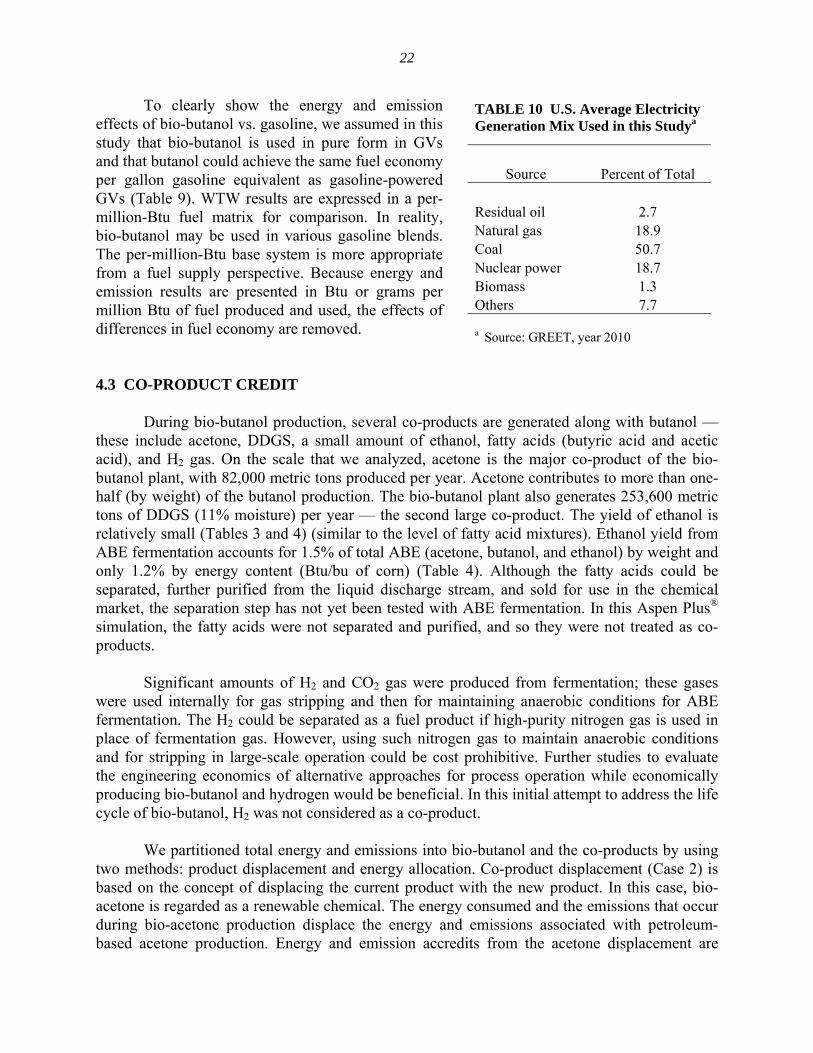
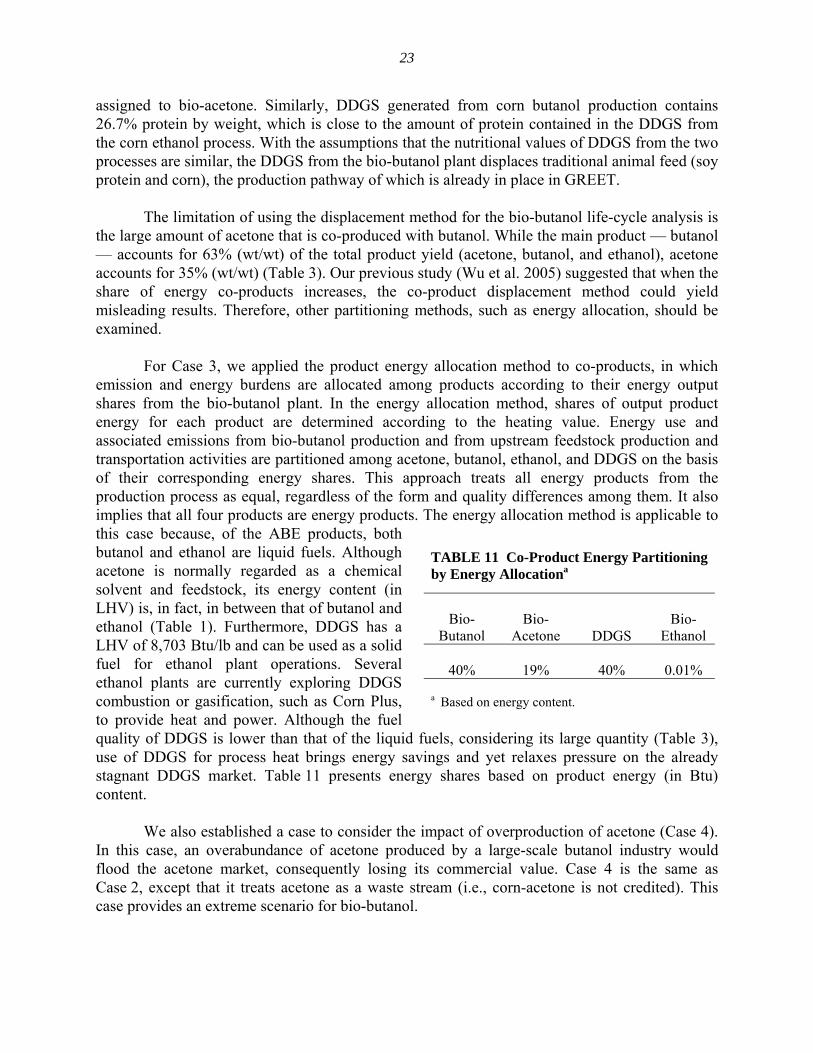
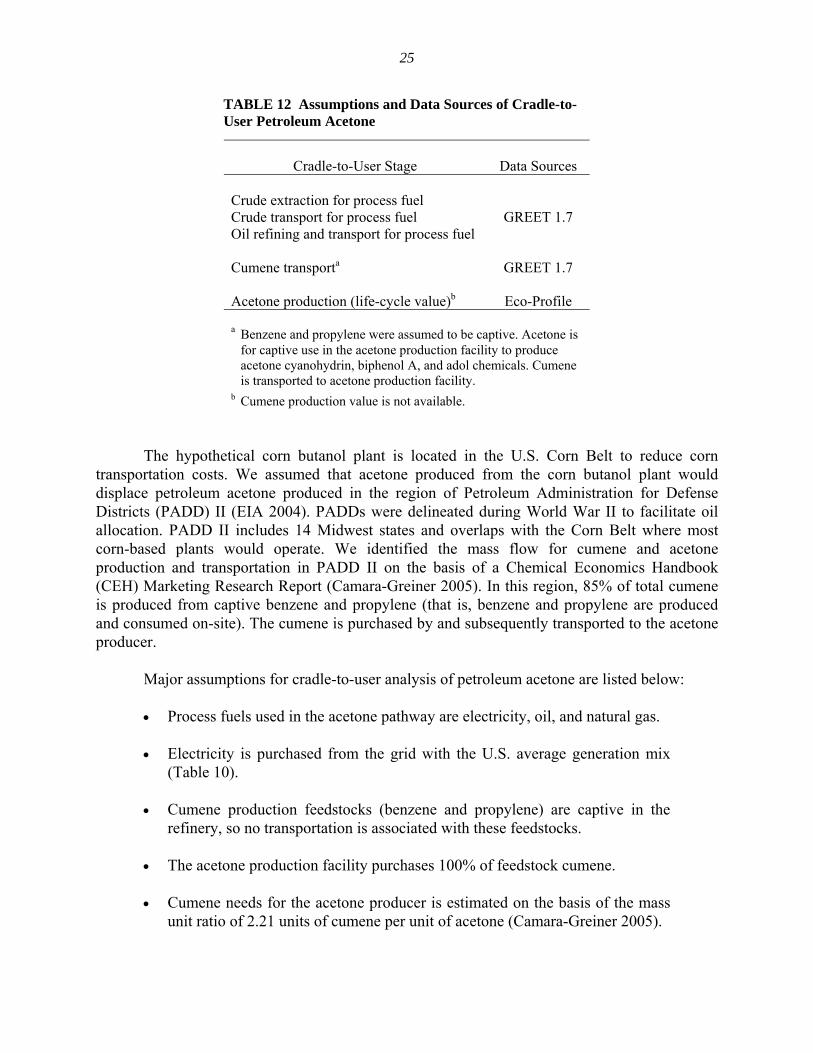
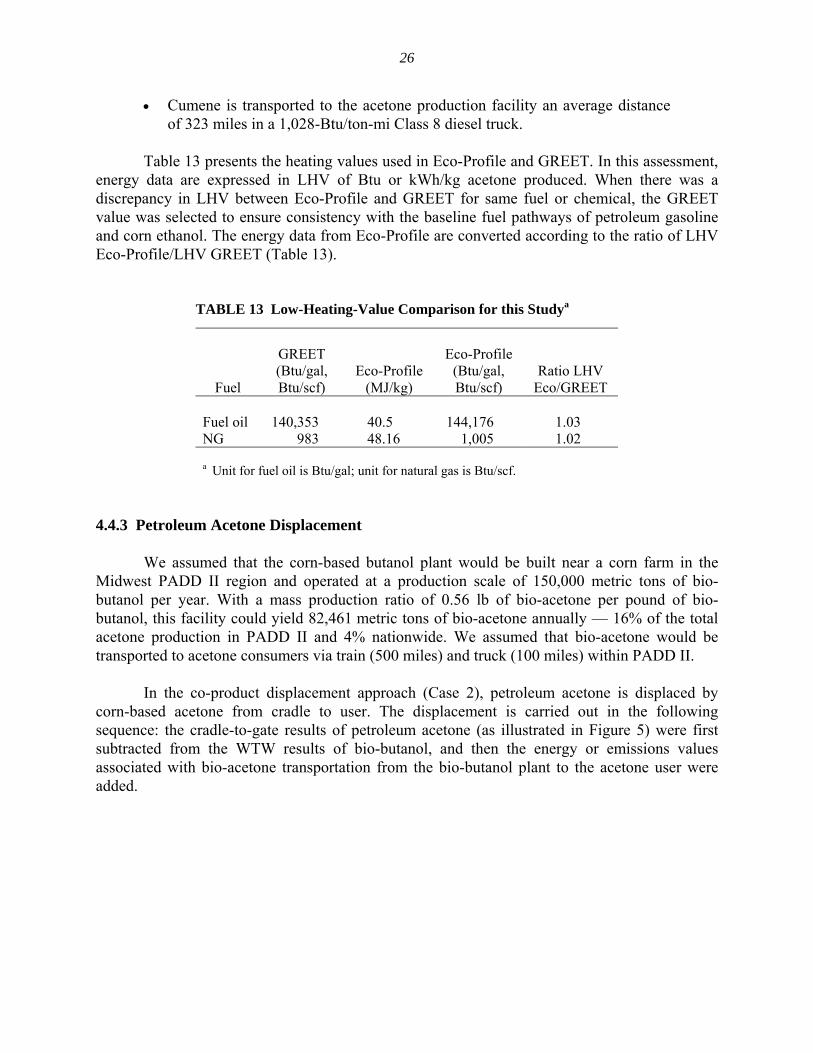
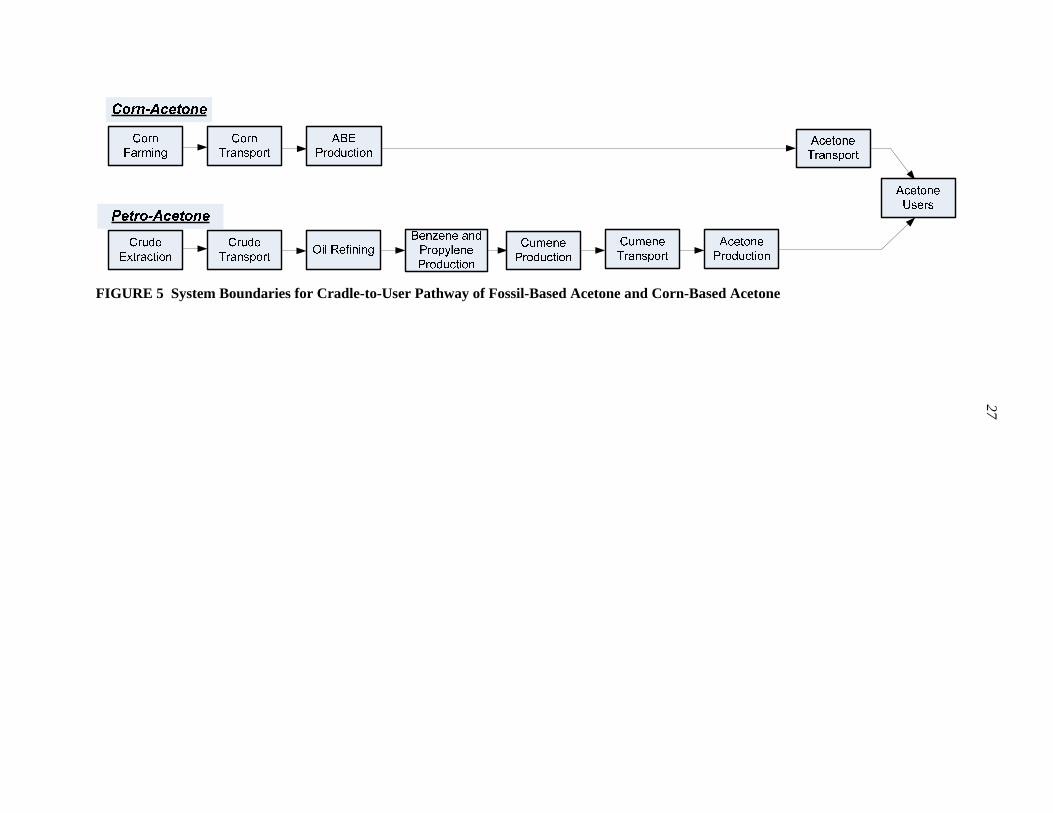
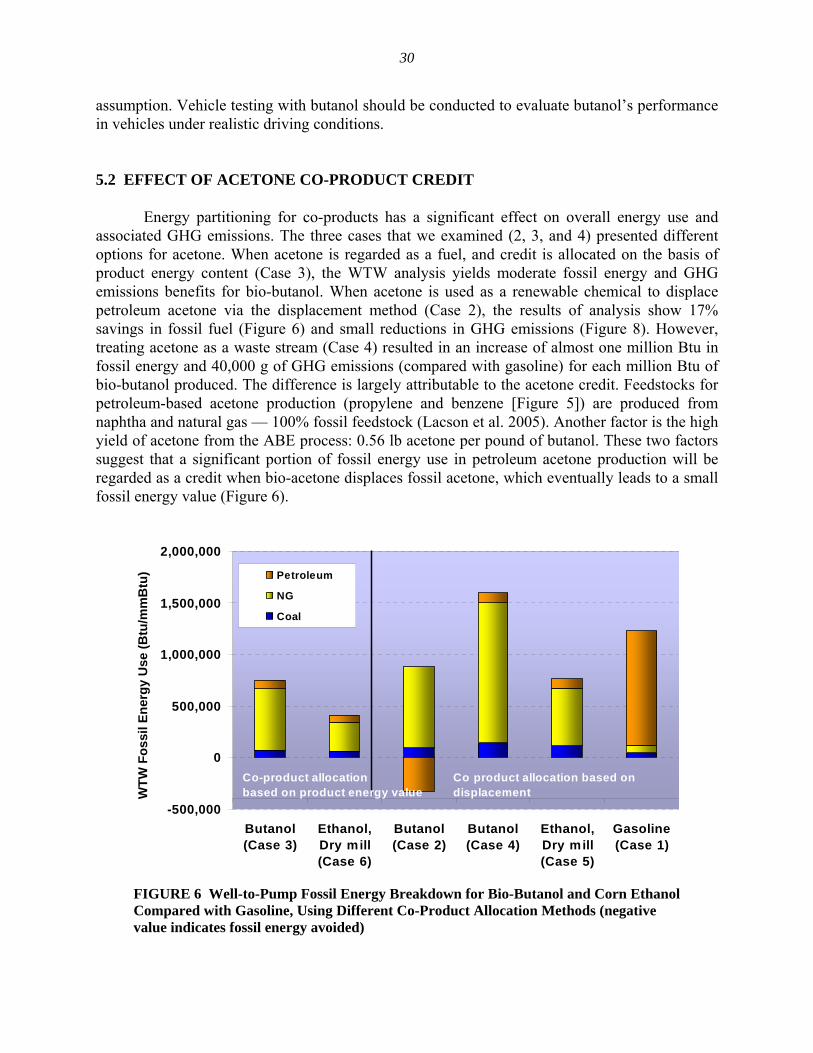
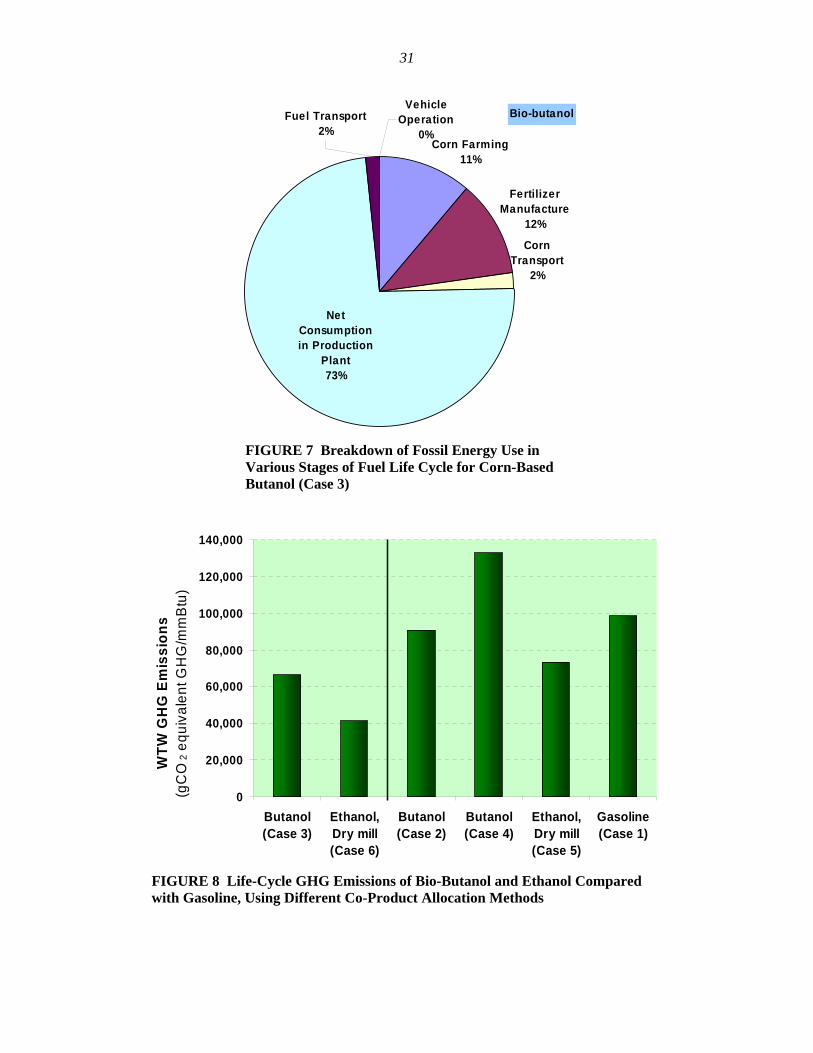
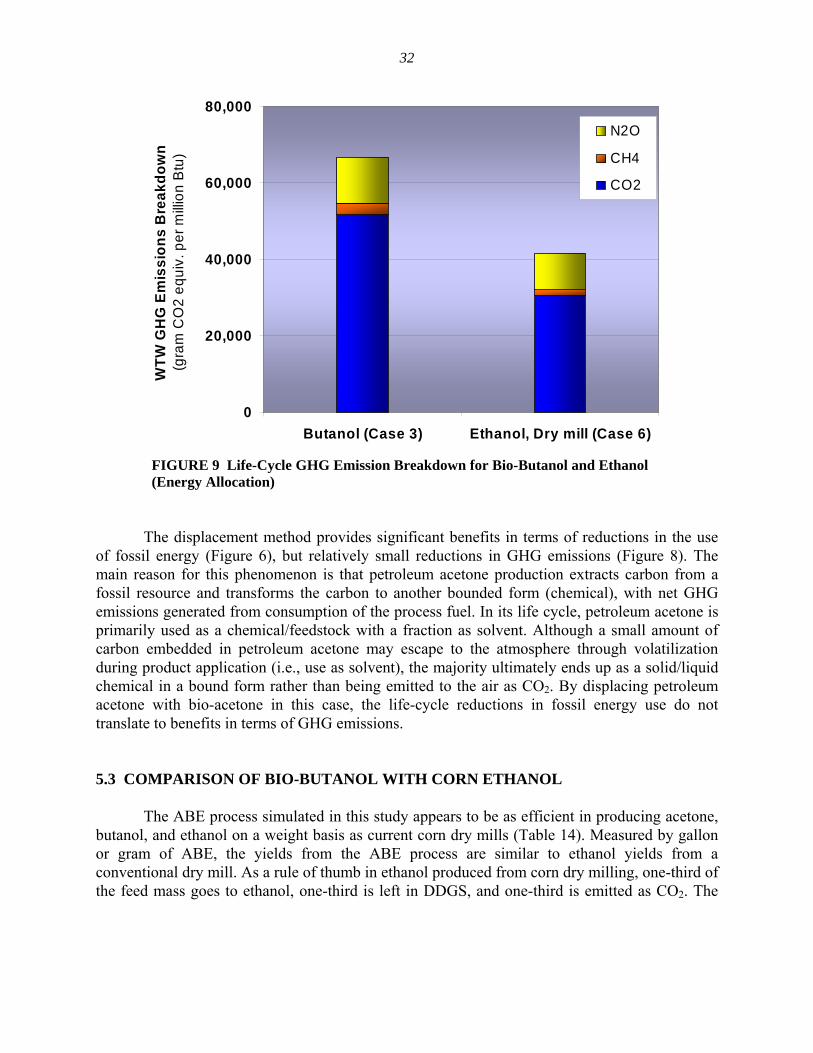
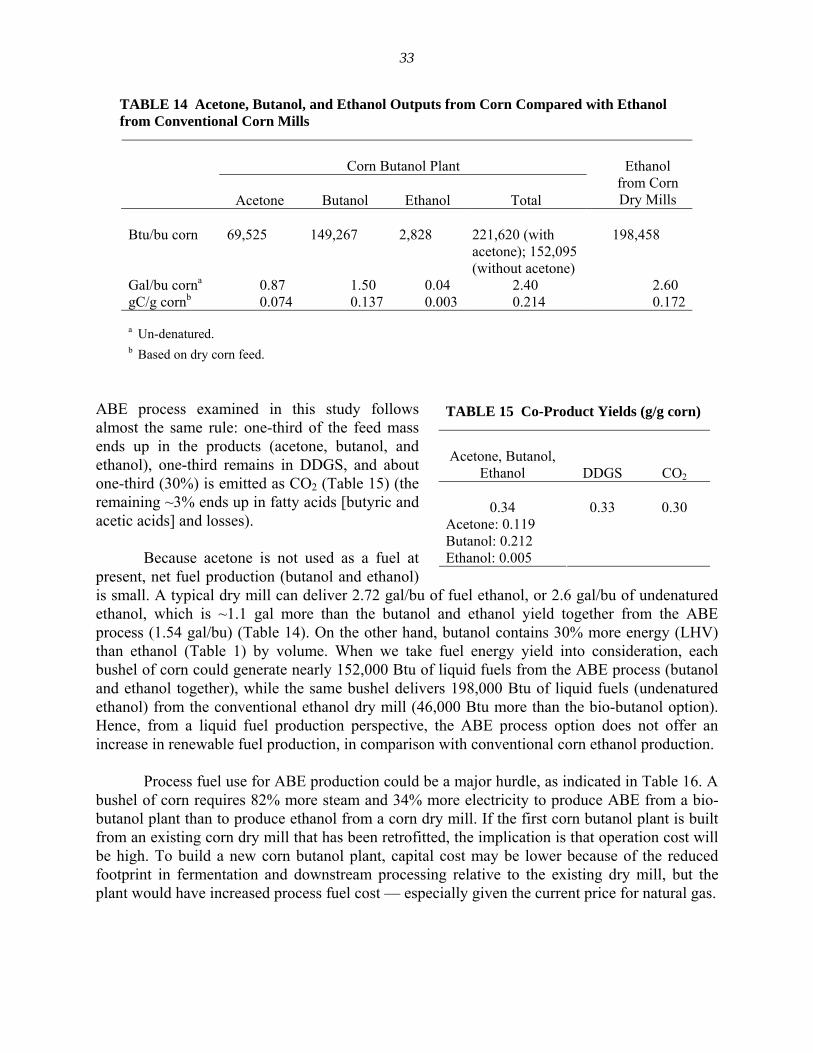
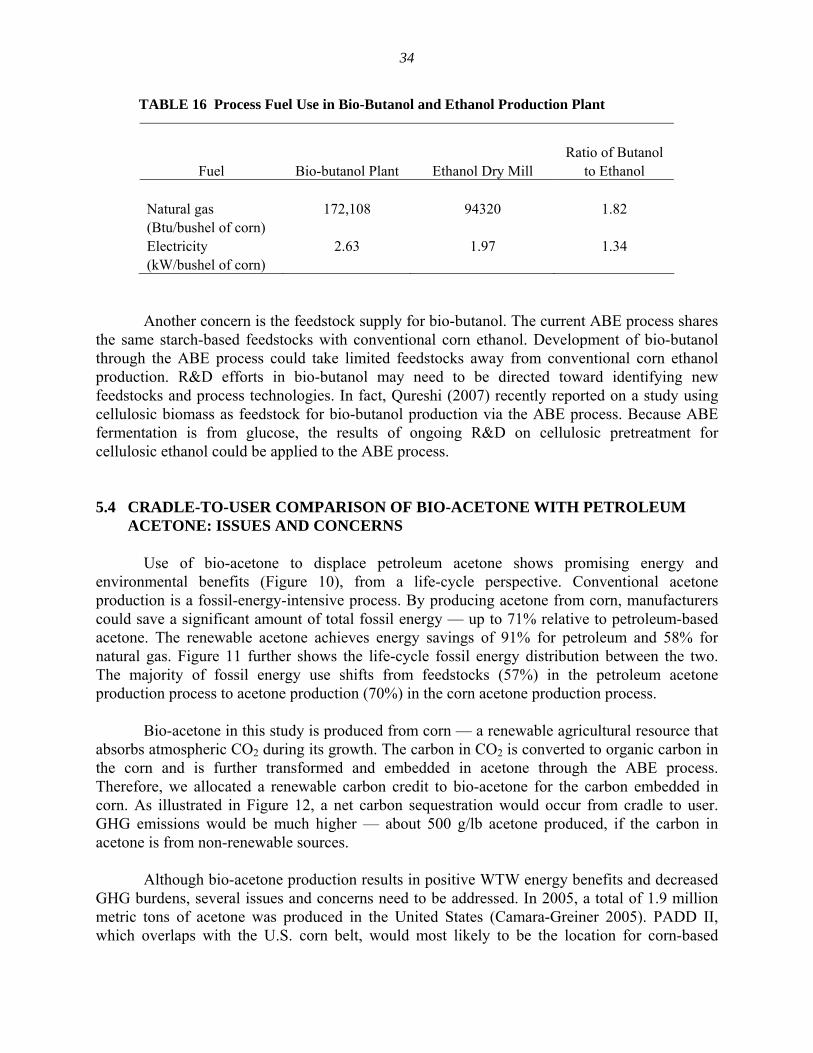
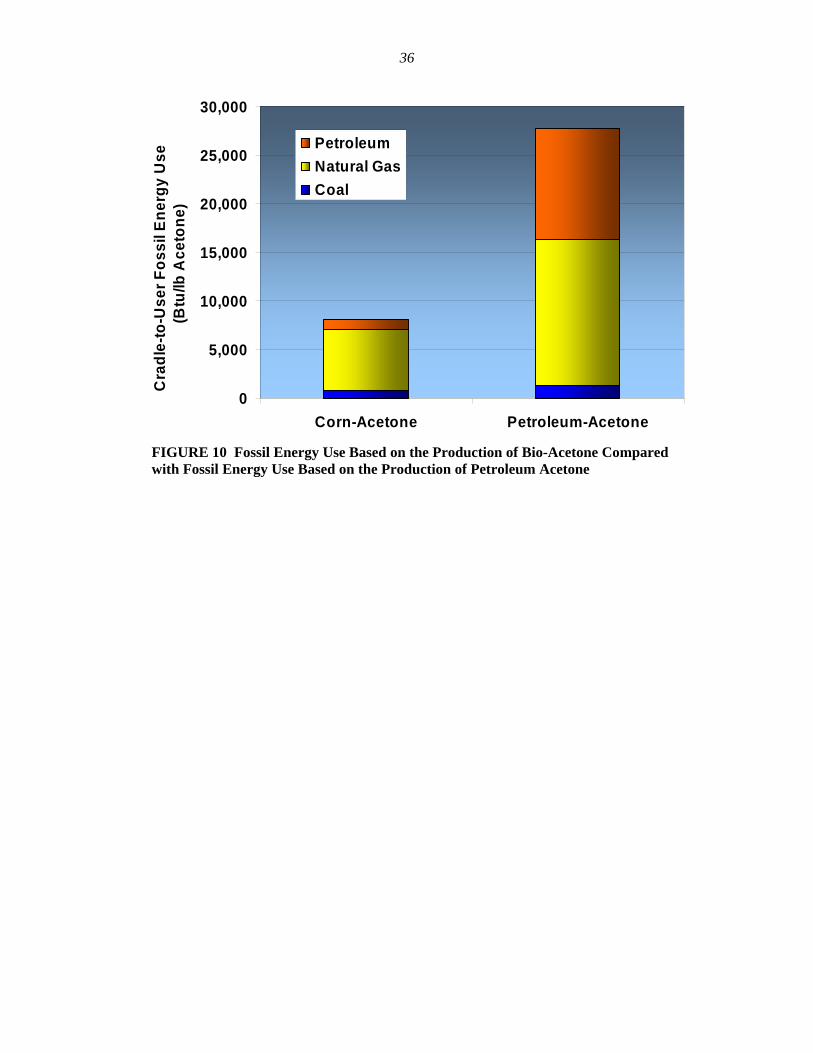
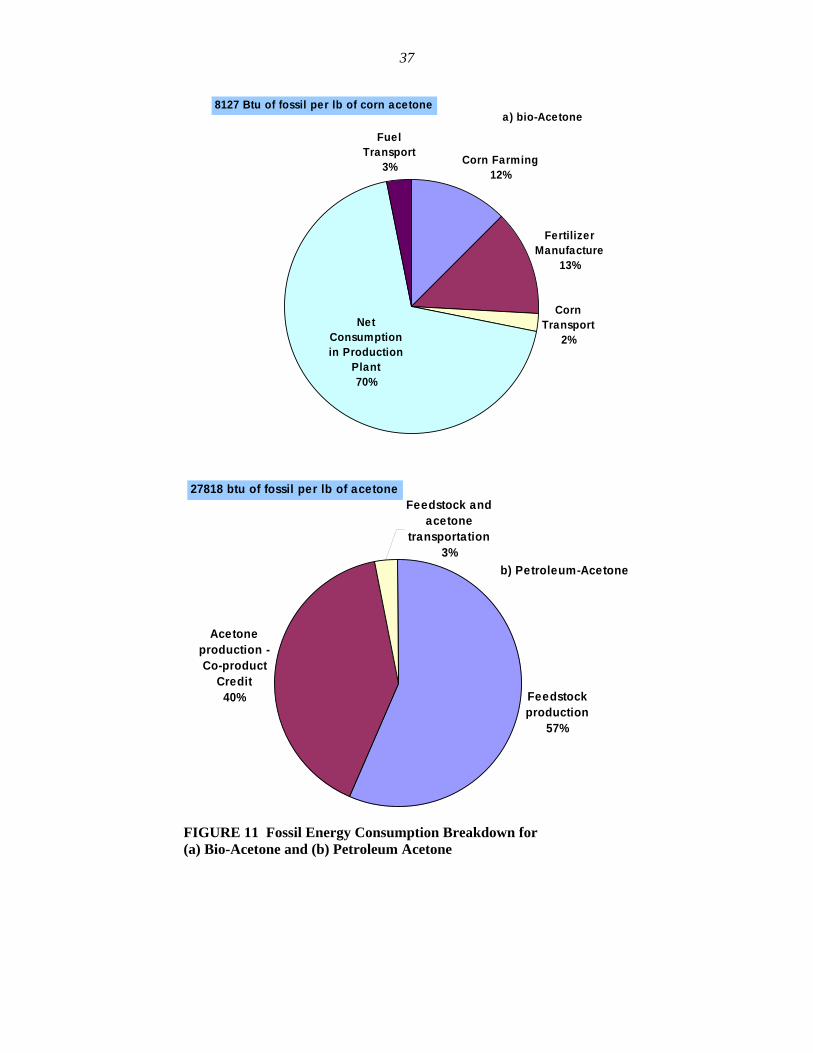
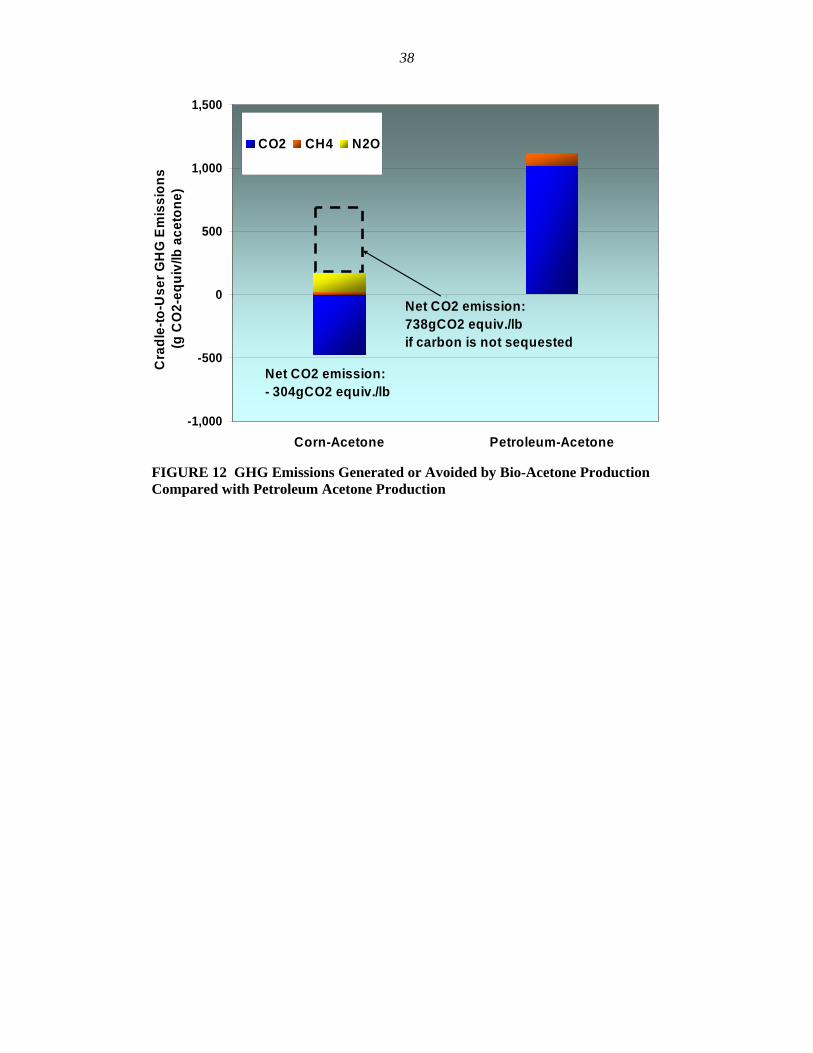
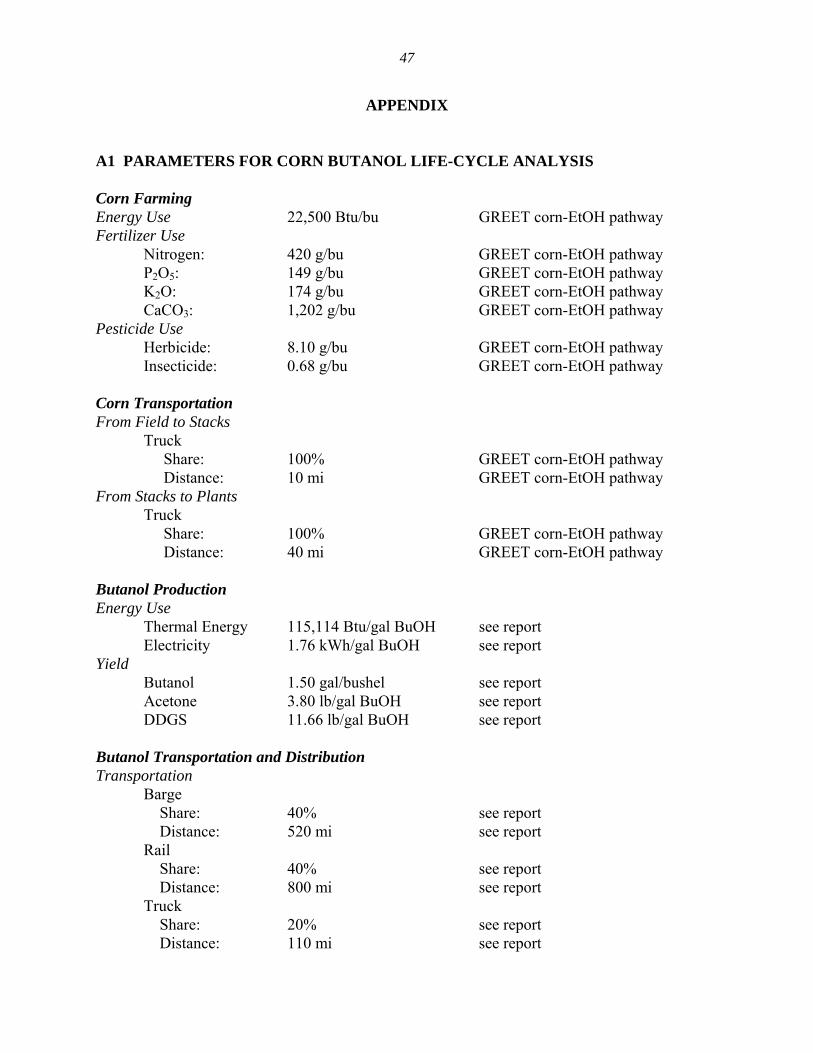
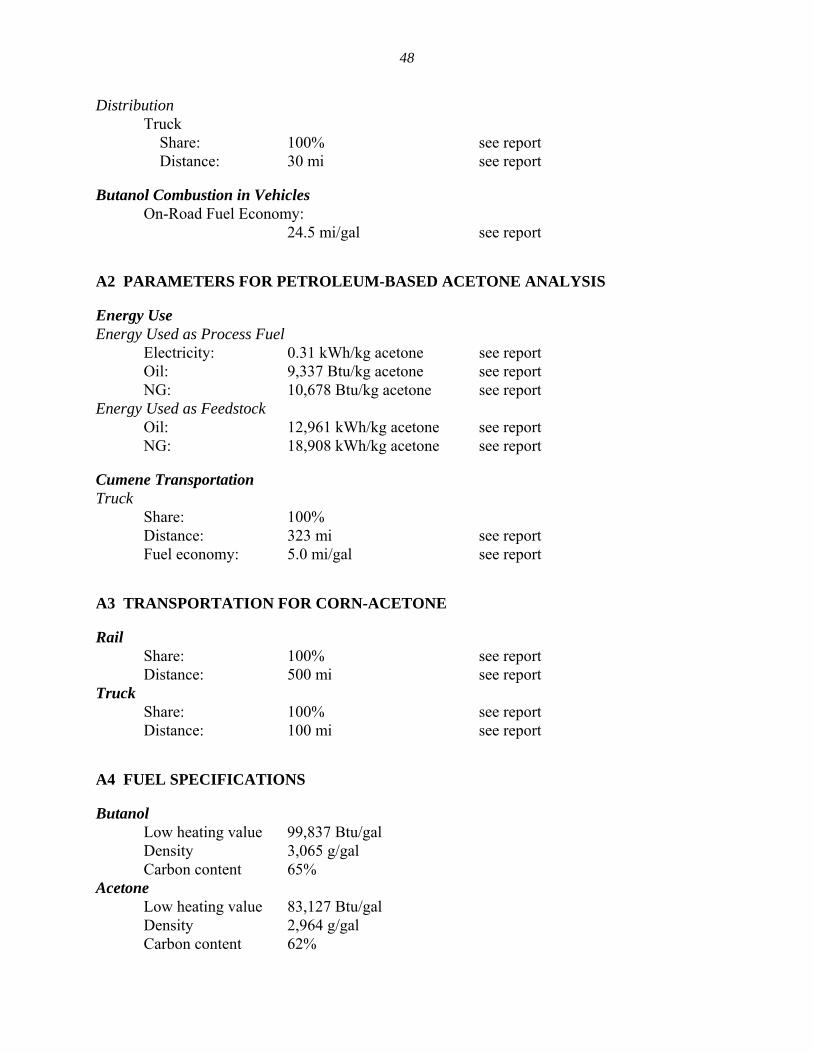
Energy Systems Division Argonne National Laboratory9700 South Cass Avenue Bldg 362Argonne IL 60439-4815
wwwanlgov
A US Department of Energy laboratory managed by UChicago Argonne LLC


