Life Cycle Assessment of Creosote- Treated Wooden Railroad Crossties in the U.S. with Comparisons to Concrete and Plastic-Composite Ties Written by Chris Bolin and Stephen Smith for TWC, Published in Journal of Transportation Technologies, 2013.
Transcript
Life Cycle Assessment of Creosote-Treated Wooden Railroad Crossties
in the U.S. with Comparisons to Concrete and Plastic-Composite
Ties Written by Chris Bolin and Stephen
Smith for TWC, Published in Journal of Transportation Technologies, 2013.
6 LCAs Completed • ACQ-Treated Lumber Decking
– Journal of Cleaner Production (Volume 19, Issue 6-7, April/May 2011) at http://www.sciencedirect.com/science/journal/09596526
• Borate-Treated Framing Lumber – Journal of Cleaner Production (as above)
• Pentachlorophenol-Treated Utility Poles – Renewable and Sustainable Energy Review at
http://dx.doi.org/10.1016/j.rser.2011.01.019 • Creosote-Treated Railroad Ties (open access)
– Journal of Transportation Technologies at http://scirp.org/journal/jtts • CCA-Treated Guard Rail Systems (open access)
– Journal of Transportation Technologies at http://scirp.org/journal/jtts • CCA-Treated Marine Pilings
– Journal of Marine Environmental Engineering – http://www.oldcitypublishing.com/JMEE/JMEEcontents/JMEEv9n3issueconten
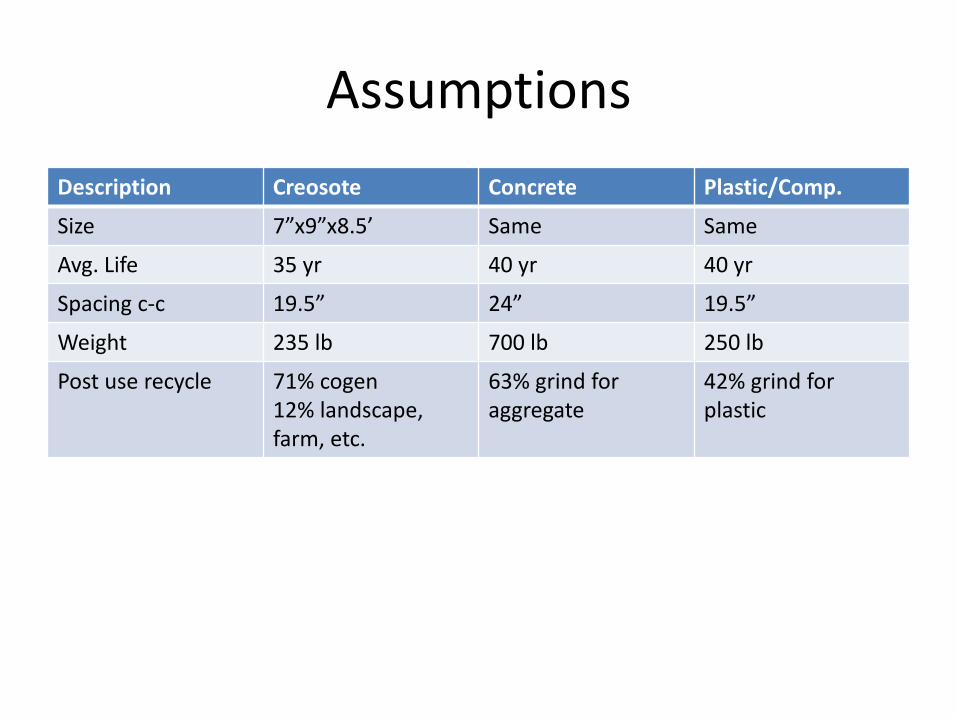
Post use recycle 71% cogen 12% landscape, farm, etc.
63% grind for aggregate
42% grind for plastic
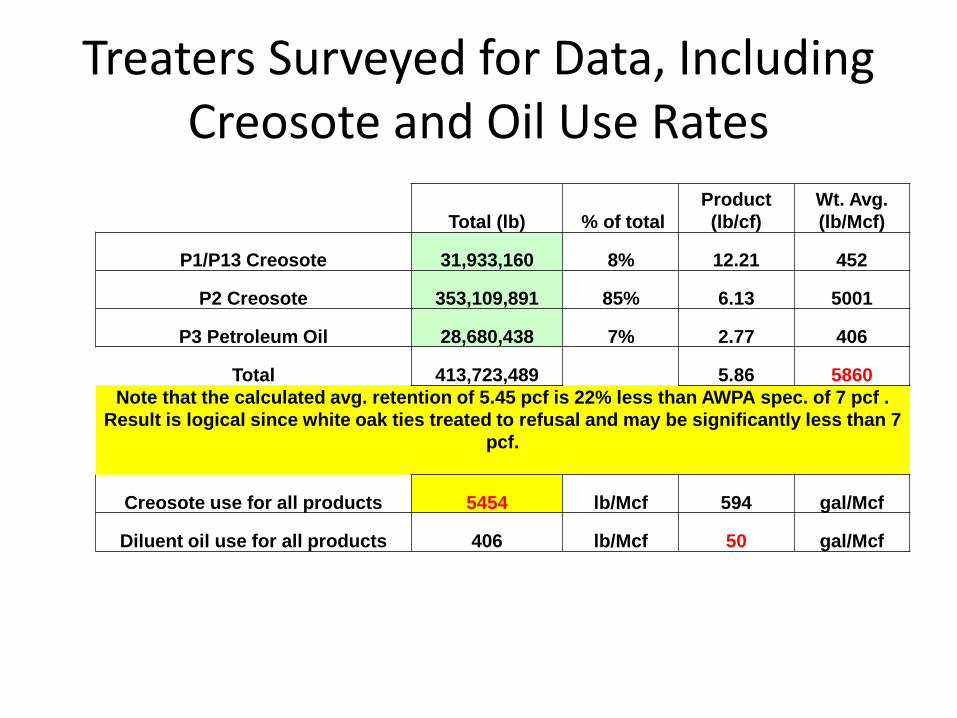
Treaters Surveyed for Data, Including Creosote and Oil Use Rates
Total (lb) % of total Product (lb/cf)
Wt. Avg. (lb/Mcf)
P1/P13 Creosote 31,933,160 8% 12.21 452
P2 Creosote 353,109,891 85% 6.13 5001
P3 Petroleum Oil 28,680,438 7% 2.77 406
Total 413,723,489 5.86 5860 Note that the calculated avg. retention of 5.45 pcf is 22% less than AWPA spec. of 7 pcf .
Result is logical since white oak ties treated to refusal and may be significantly less than 7 pcf.
Creosote use for all products 5454 lb/Mcf 594 gal/Mcf
Diluent oil use for all products 406 lb/Mcf 50 gal/Mcf
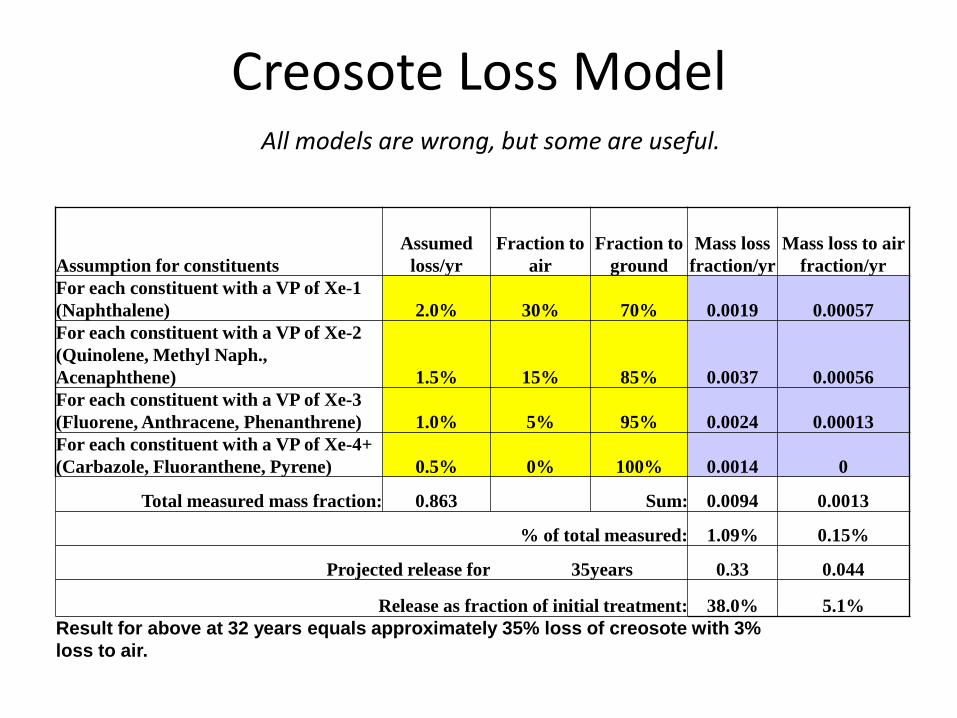
Creosote Loss Model
Assumption for constituents Assumed
loss/yr Fraction to
air Fraction to
ground Mass loss
fraction/yr Mass loss to air
fraction/yr For each constituent with a VP of Xe-1 (Naphthalene) 2.0% 30% 70% 0.0019 0.00057 For each constituent with a VP of Xe-2 (Quinolene, Methyl Naph., Acenaphthene) 1.5% 15% 85% 0.0037 0.00056 For each constituent with a VP of Xe-3 (Fluorene, Anthracene, Phenanthrene) 1.0% 5% 95% 0.0024 0.00013 For each constituent with a VP of Xe-4+ (Carbazole, Fluoranthene, Pyrene) 0.5% 0% 100% 0.0014 0
Total measured mass fraction: 0.863 Sum: 0.0094 0.0013
% of total measured: 1.09% 0.15%
Projected release for 35 years 0.33 0.044
Release as fraction of initial treatment: 38.0% 5.1% Result for above at 32 years equals approximately 35% loss of creosote with 3% loss to air.
All models are wrong, but some are useful.
Inventory Summary Infrastructure Process Units
Creosote-Treated RR Tie Cradle-to-Grave
(/tie) Concrete RR Tie
Cradle-to-Grave (/tie)
Plastic/Composite RR Tie Cradle-to-Grave
(/tie) Service life = 35 yrs Service life = 40 yrs Service life = 40 yrs Spacing = 19.5 in Spacing = 24 in Spacing = 19.5 in
Inputs from technosphere Electricity, at grid, US kWh -54 128 123 Natural gas, processed, at plant (feedstock) ft3 -99 260 635 Natural gas, combusted in industrial boiler ft3 101 23 269
Diesel fuel,combusted in industrial equipment gal 0.81 0.23 0.050 Gasoline, combusted in industrial equipment gal 0.028 0.023 0.011 Hogfuel/biomass (50%MC) lb 7.0 3.5 3.3 Coal-bituminous & sub. combusted in boiler lb 26 0.12 0.034 Coal (feedstock) lb 0 17 0 Truck transport, diesel powered ton-miles 45 75 69 Rail transport, diesel powered ton-miles 84 390 90 Harvested hardwood ft3 3.7 0 0 Creosote lb 20 0 0 Landfill capacity ton 0.012 0.26 0.10 Inputs from nature Water gal 6.9 84 83 Unprocessed coal lb 10 98 81 Unprocessed U3O8 lb -0.000074 0.00020 0.00018 Unprocessed crude oil gal 2.0 2.9 1.4 Unprocessed natural gas ft3 107 71 674 Hydropower Btu -13,665 36,287 33,468 Other renewable energy Btu -1,078 2,507 2,399 Biogenic carbon (from air) lb 11 0 -2.8 Other mined mineral resources lb 16 1,580 24
So, what do all these numbers mean? Assessment
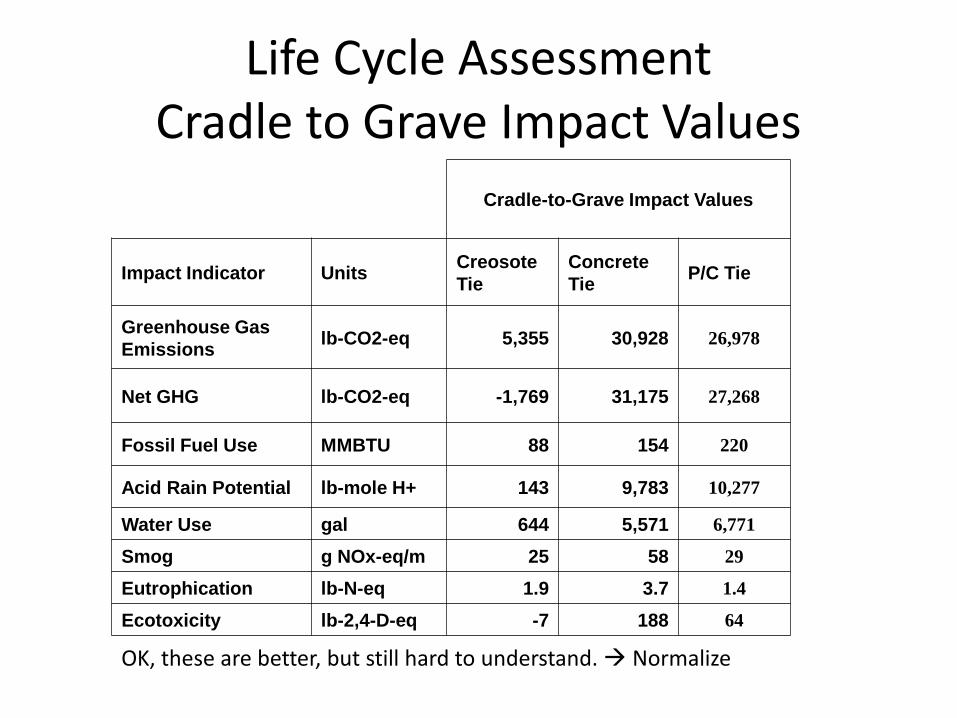
Life Cycle Assessment Cradle to Grave Impact Values
Cradle-to-Grave Impact Values
Impact Indicator Units Creosote Tie
Concrete Tie P/C Tie
Greenhouse Gas Emissions lb-CO2-eq 5,355 30,928 26,978
Net GHG lb-CO2-eq -1,769 31,175 27,268
Fossil Fuel Use MMBTU 88 154 220
Acid Rain Potential lb-mole H+ 143 9,783 10,277
Water Use gal 644 5,571 6,771
Smog g NOx-eq/m 25 58 29
Eutrophication lb-N-eq 1.9 3.7 1.4
Ecotoxicity lb-2,4-D-eq -7 188 64
OK, these are better, but still hard to understand. Normalize
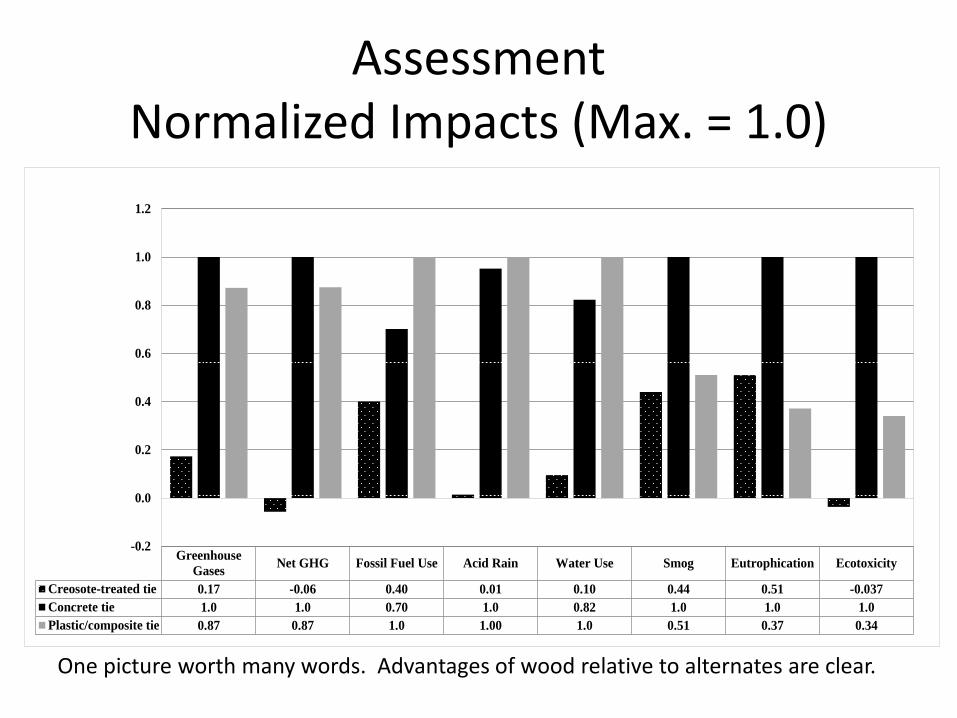
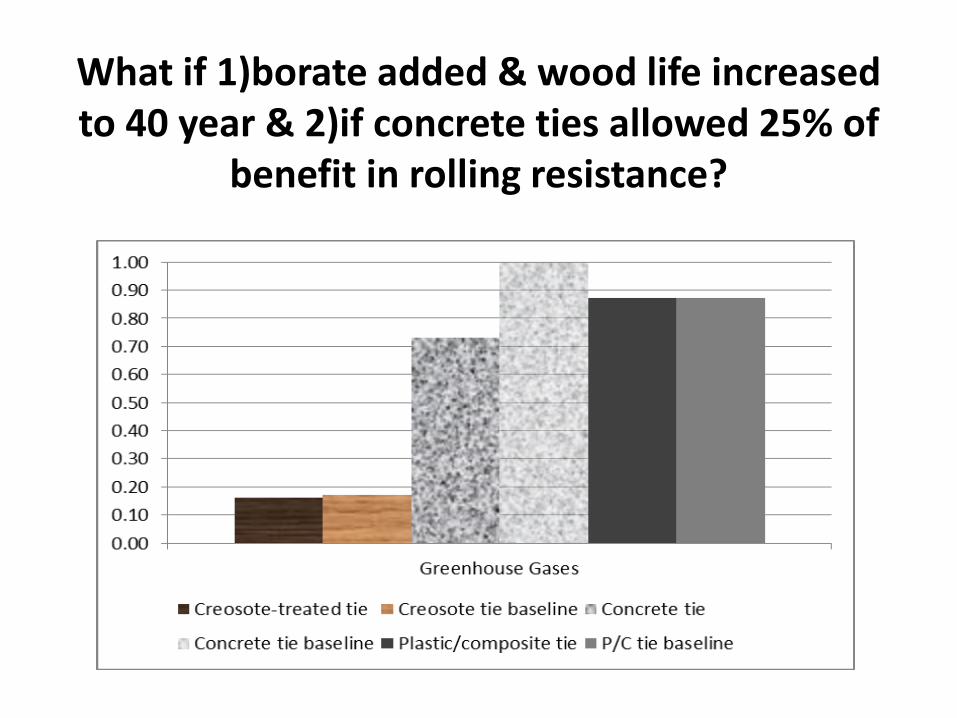
Assessment Normalized Impacts (Max. = 1.0)
GreenhouseGases Net GHG Fossil Fuel Use Acid Rain Water Use Smog Eutrophication Ecotoxicity
Creosote-treated tie 0.17 -0.06 0.40 0.01 0.10 0.44 0.51 -0.037Concrete tie 1.0 1.0 0.70 1.0 0.82 1.0 1.0 1.0Plastic/composite tie 0.87 0.87 1.0 1.00 1.0 0.51 0.37 0.34
-0.2
0.0
0.2
0.4
0.6
0.8
1.0
1.2
One picture worth many words. Advantages of wood relative to alternates are clear.
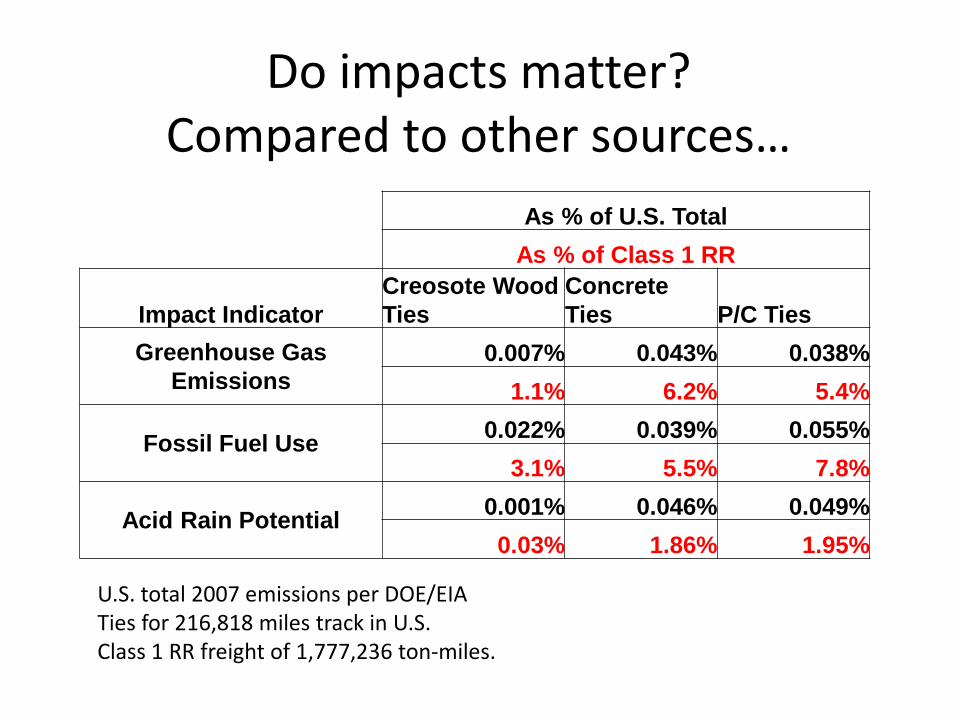
Do impacts matter? Compared to other sources…
As % of U.S. Total As % of Class 1 RR
Impact Indicator Creosote Wood Ties
Concrete Ties P/C Ties
Greenhouse Gas Emissions
0.007% 0.043% 0.038% 1.1% 6.2% 5.4%
Fossil Fuel Use 0.022% 0.039% 0.055% 3.1% 5.5% 7.8%
U.S. total 2007 emissions per DOE/EIA Ties for 216,818 miles track in U.S. Class 1 RR freight of 1,777,236 ton-miles.
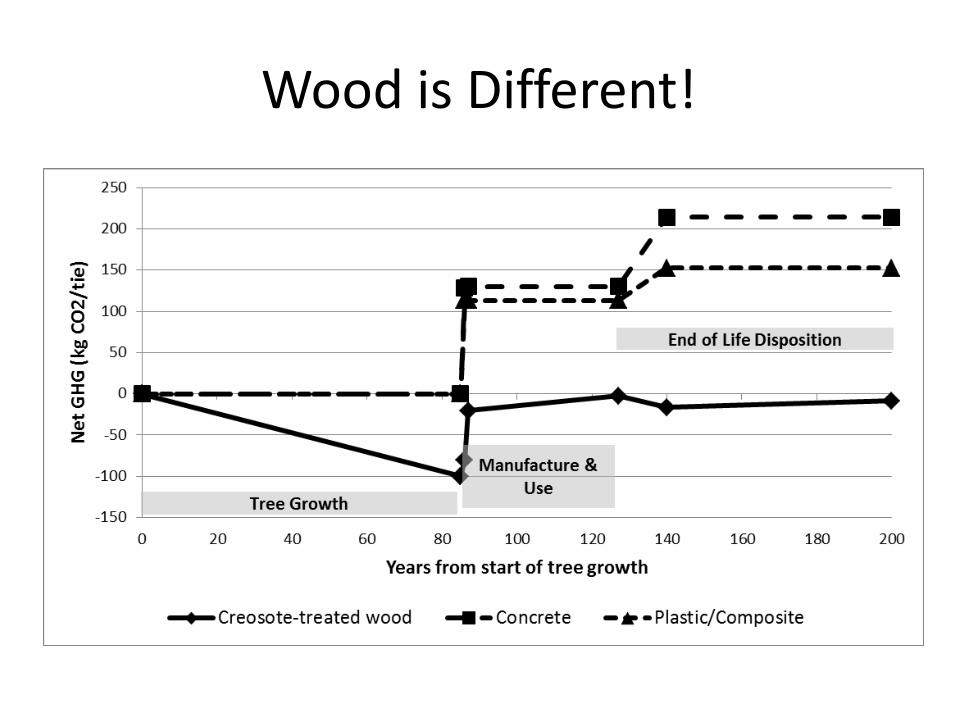
Wood is Different!
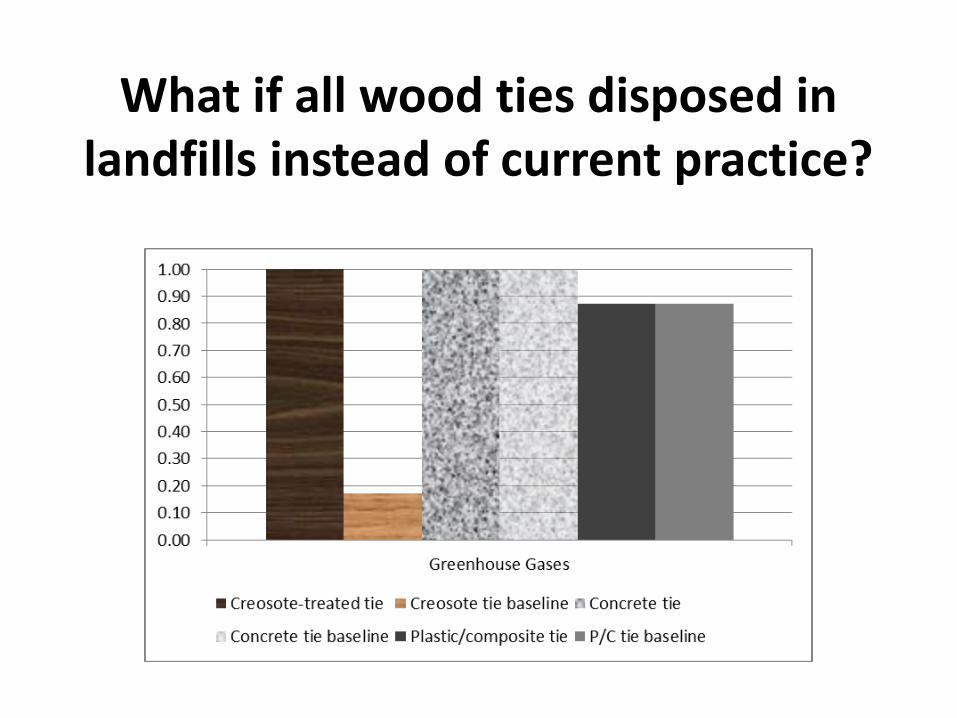
Sensitivity Analysis
What if all wood ties disposed in landfills instead of current practice?
What if 1)borate added & wood life increased to 40 year & 2)if concrete ties allowed 25% of
benefit in rolling resistance?
Not all LCAs are the same
Steel Market Development Institute (SMDI) news release
• PR Newswire - August 7, 2013 • “New Life Cycle Assessment Study Shows
Replacing Wood Utility Poles With Steel Significantly Lowers Key Environmental Impacts”
• Written by SCS Global Services (SCS) • Referred to as “SCS LCA”
SCS LCA Scenarios
• 1) Business as Usual (BAU) – Wood poles replaced as needed with wood poles.
• 2) Steel Pole Replacement (SPR) – Wood poles replaced as needed with steel poles.
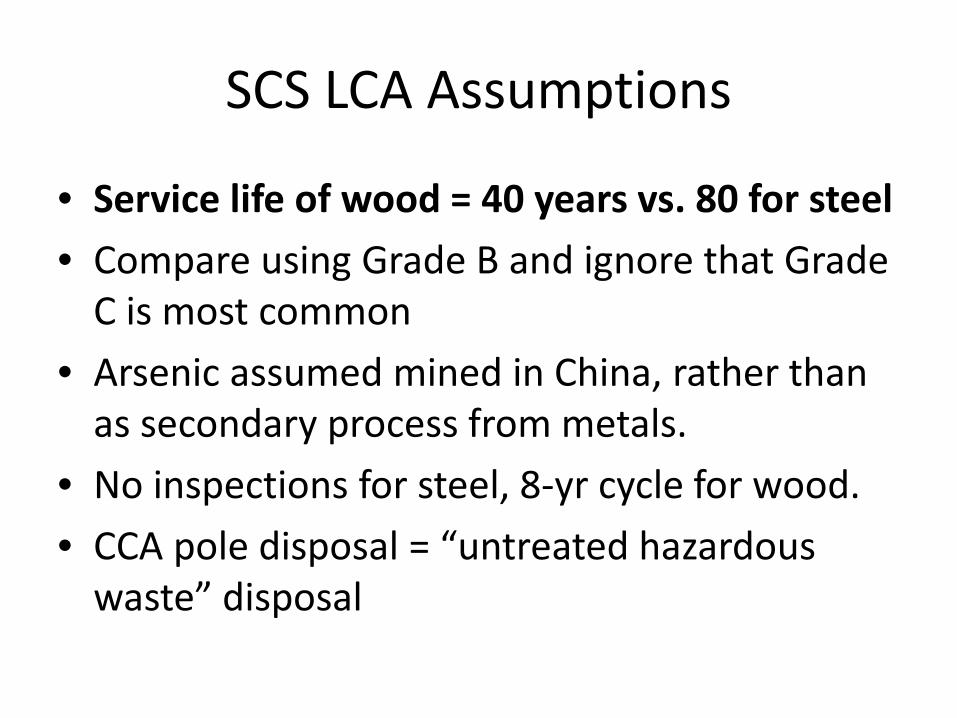
SCS LCA Assumptions
• Service life of wood = 40 years vs. 80 for steel • Compare using Grade B and ignore that Grade
C is most common • Arsenic assumed mined in China, rather than
as secondary process from metals. • No inspections for steel, 8-yr cycle for wood. • CCA pole disposal = “untreated hazardous
waste” disposal
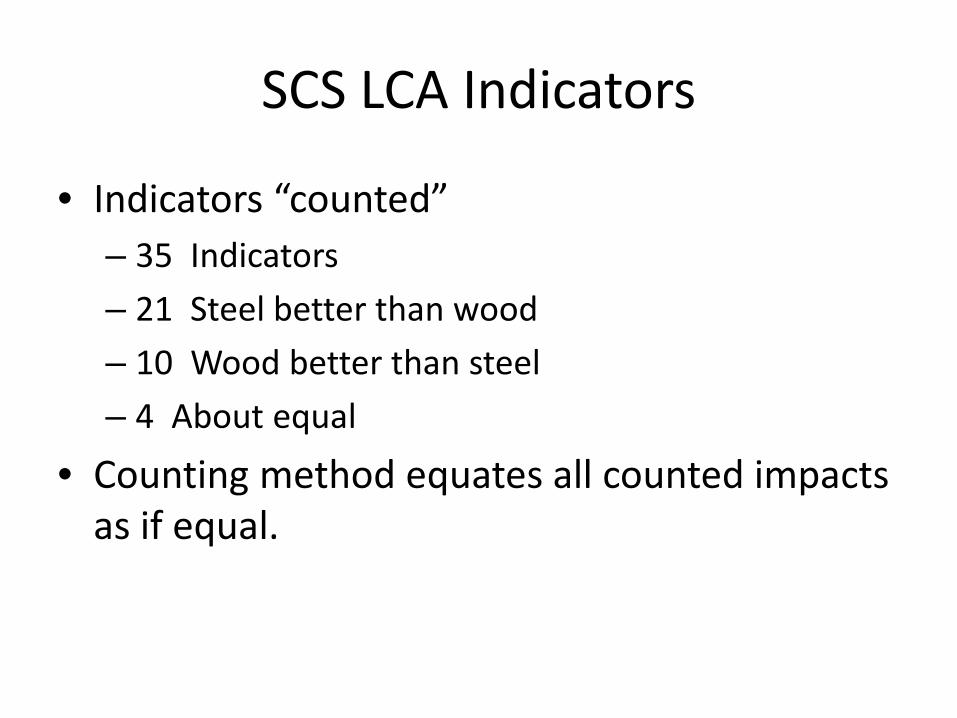
SCS LCA Indicators
• Indicators “counted” – 35 Indicators – 21 Steel better than wood – 10 Wood better than steel – 4 About equal
• Counting method equates all counted impacts as if equal.
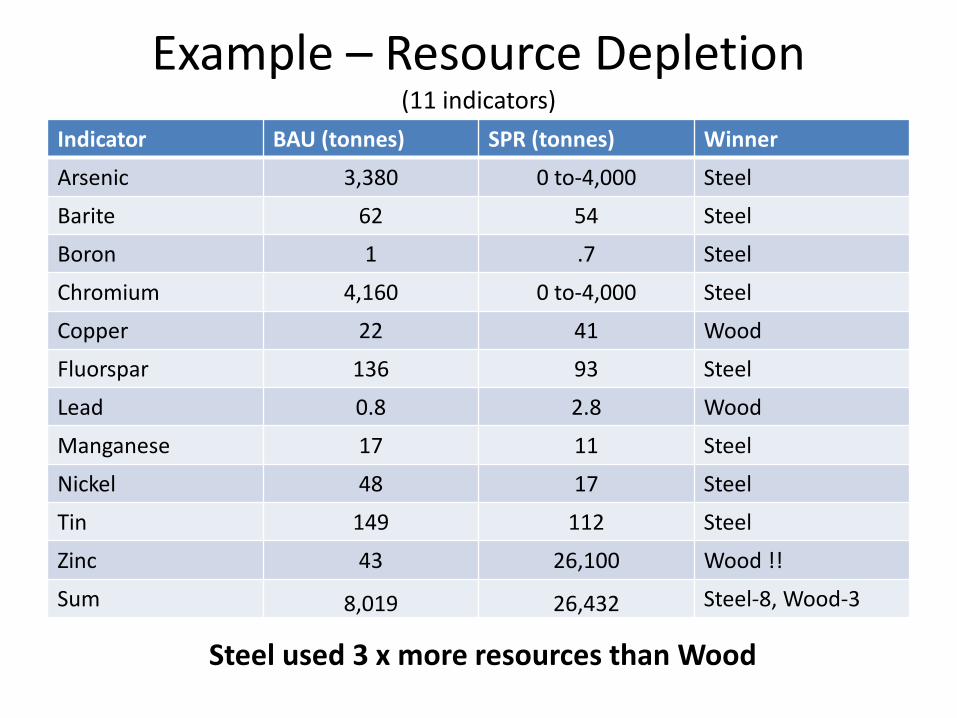
Example – Resource Depletion (11 indicators)
Indicator BAU (tonnes) SPR (tonnes) Winner
Arsenic 3,380 0 to-4,000 Steel
Barite 62 54 Steel
Boron 1 .7 Steel
Chromium 4,160 0 to-4,000 Steel
Copper 22 41 Wood
Fluorspar 136 93 Steel
Lead 0.8 2.8 Wood
Manganese 17 11 Steel
Nickel 48 17 Steel
Tin 149 112 Steel
Zinc 43 26,100 Wood !!
Sum 8,019 26,432 Steel-8, Wood-3
Steel used 3 x more resources than Wood
SCS LCA Seems Biased
• Over emphasis on Chinese arsenic but ignore Chinese steel.
• Emphasis on forestry impacts – Comparison to “pre-industrial” conditions – Active forestry = “impact” – No benefits
• Continued forest land use vs. alternatives • Carbon sequestered in product and forest • Sustainable
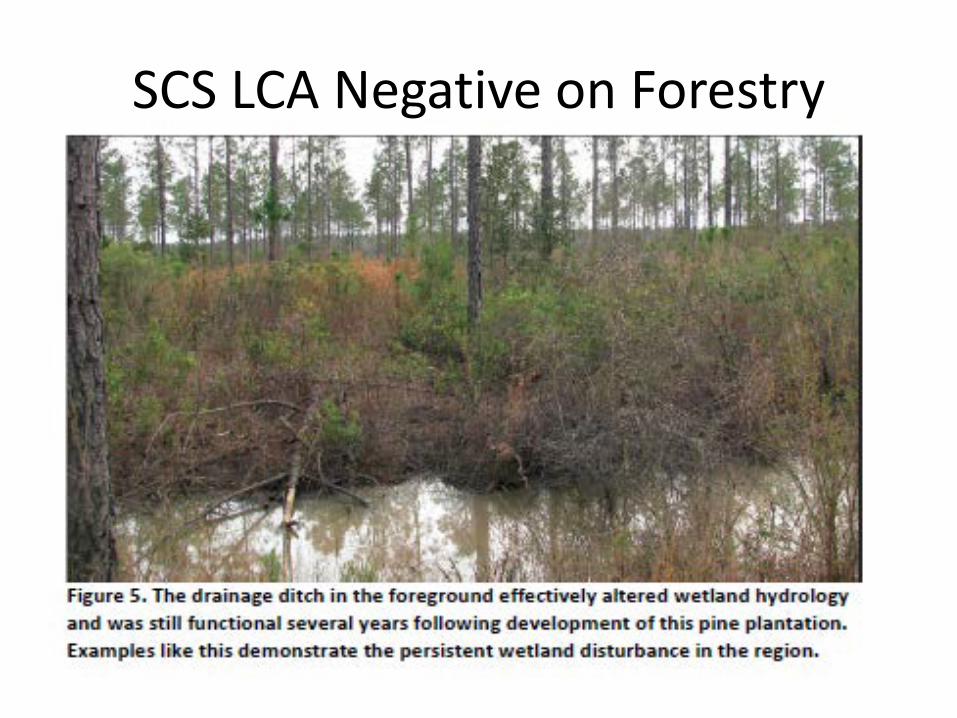
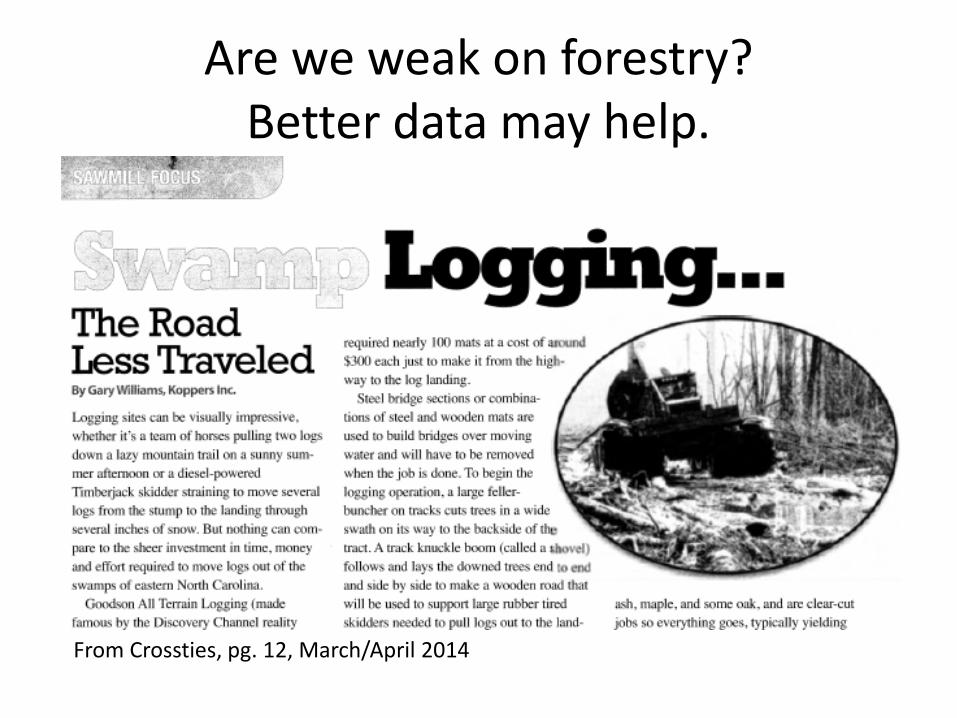
SCS LCA Negative on Forestry
Met with SCS Global • Meeting on February 19 at SCS office • Offered comments of TWC, NAWPC, WWPI
perspective – Scott Conklin, Kevin Ragon, John Horton, Jeff Miller,
Stephen Smith attended • Understand SCS Global perspective • Goal was discussion and understanding • Written comments provided • SCS Global to provide response, possible