Life-cycle Assessment of Full-scale Membrane Bioreactor and Tertiary
Treatment Technologies in Fruit Processing Industry
by
Tong Chu
A Thesis
presented to
The University of Guelph
In partial fulfilment of requirements
for the degree of
Master of Applied Science
in
Engineering
Guelph, Ontario, Canada
© Tong Chu, July, 2019
ABSTRACT
LIFE-CYCLE ASSESSMENT OF FULL-SCALE MEMBRANE BIOREACTOR AND
TERTIARY TREATMENT TECHNOLOGIES IN FRUIT PROCESSING INDUSTRY
Tong Chu
University of Guelph, 2019
Advisor(s):
Dr. Richard G. Zytner
Dr. Bassim E. Abbassi
Life-cycle assessment (LCA) was conducted to quantitatively assess the total
environmental impacts of membrane bioreactor (MBR) and tertiary technologies treating
wastewater in the fruit processing sector, allowing comparisons on the impacts of different
treatment options, including impacts without on-site treatment. The system boundaries for all
scenarios comprise raw materials extraction and processing, transportation, construction, operation
and waste disposal. SimaPro 8.0.4.26 was used as the software tool, and two impact assessment
methods (ReCiPe v1.11 and TRACI v2.1) were applied. Results showed that MBR combined with
RO and UV contributed the least damage to the ecosystem, and minimized eutrophication impacts
from the sewage when compared to the non-treatment scenario. Treating wastewater in municipal
wastewater treatment plants (WWTP) would mitigate eutrophication effects, but it resulted in more
environmental impacts from categories such as climate change and human health compared with
implementing on-site treatment systems.
iii
ACKNOWLEDGEMENTS
I would first like to express my deep gratitude to Dr. Zytner and Dr. Abbassi for offering
me the opportunity of being part of this project, and all other opportunities that will benefit my
whole life. It is a fortune for me to meet such great advisors in my school life. I am thankful for
the insightful knowledge and advice they gave me with great patience, which made this journey
very instructive and enjoyable.
Secondly, I would like to thank the Algoma Orchards and all the friends who offered me
help during the project. This project requires extensive data, which cannot be accomplished
without their support.
Lastly to my mom and dad, thank you for being accompanied with me emotionally all the
time. Although we did not have much time to stay together, it is your endless love and
encouragement that supported me during these years. Many thanks to my girlfriend Ziqi, with your
love and company, the hard times became joyful, and also thanks to your patience and
encouragement, I can be confident and fearless to go ahead. A special thank you to our cat Meeko.
It was his loveliness and cuddle that made our life much brightened.
iv
TABLE OF CONTENTS
Abstract .............................................................................................................................ii
Acknowledgements ............................................................................................................ iii
Table of Contents ..............................................................................................................iv
List of Tables ................................................................................................................... vii
List of Figures ................................................................................................................. viii
List of Abbreviations .......................................................................................................... x
1 Introduction ............................................................................................................... 1
1.1 Research Gap ....................................................................................................... 3
1.2 Objectives and Thesis Layout ................................................................................ 4
2 Literature Review ....................................................................................................... 6
2.1 The History and Standardization of Life-cycle Assessment ....................................... 6
2.2 Life-cycle Assessment Tools................................................................................ 12
2.3 Development of LCA in Conventional Wastewater Treatment ................................. 15
2.4 LCA of Membrane Bioreactor Technology ............................................................ 20
2.5 Summary of Literature Review ............................................................................ 23
3 Methodology ............................................................................................................ 26
3.1 Goal and Scope .................................................................................................. 26
3.1.1 Goal Definition ............................................................................................ 26
3.1.2 Functional Unit ............................................................................................ 27
3.1.3 System Descriptions ..................................................................................... 28
3.1.4 System Boundaries ....................................................................................... 30
3.1.5 Major Assumptions and Limitations ............................................................... 34
v
3.2 Life-cycle Inventory (LCI) .................................................................................. 35
3.2.1 Direct Discharge .......................................................................................... 35
3.2.2 Treatment in Local WWTP ........................................................................... 37
3.2.3 MBR and Tertiary Treatment Technologies .................................................... 38
3.3 Life-cycle Impact Assessment (LCIA) Methods ..................................................... 41
3.3.1 ReCiPe........................................................................................................ 41
3.3.2 TRACI ........................................................................................................ 43
3.3.3 Impact Categories ........................................................................................ 43
3.3.4 Normalization .............................................................................................. 50
3.4 Sensitivity Analysis ............................................................................................ 51
4 Results and Discussion .............................................................................................. 54
4.1 ReCiPe .............................................................................................................. 54
4.2 TRACI .............................................................................................................. 62
4.3 Life Cycle Impact Assessment Comparisons ......................................................... 70
4.3.1 Climate Change/ Global Warming ................................................................. 72
4.3.2 Ozone Depletion .......................................................................................... 72
4.3.3 Eutrophication ............................................................................................. 73
4.3.4 Acidification ................................................................................................ 74
4.3.5 Human Toxicity ........................................................................................... 74
4.3.6 Ecotoxicity .................................................................................................. 76
4.3.7 Photochemical Oxidant Formation/ Smog ....................................................... 77
4.3.8 Particulate Matter Formation/ Respiratory Effects ........................................... 78
4.3.9 Other Effects ............................................................................................... 80
4.3.10 Summary of the LCIA Comparisons .............................................................. 80
vi
4.4 Sensitivity Analysis ............................................................................................ 81
4.4.1 Direct Discharge .......................................................................................... 81
4.4.2 Treatment in Local WWTP ........................................................................... 84
4.4.3 Membrane and Tertiary Treatment Technologies ............................................. 86
4.5 Research Application .......................................................................................... 91
5 Conclusions and Recommendations ............................................................................ 92
5.1 Conclusions ....................................................................................................... 92
5.2 Recommendations .............................................................................................. 95
References ...................................................................................................................... 96
vii
LIST OF TABLES
Table 3.1: Wastewater data of MBR (ALS, 2011) ....................................................................... 40
Table 3.2: Airborne emissions data for MBR operation treating municipal wastewater (Ortiz et
al., 2007; Foley et al., 2010) ......................................................................................................... 40
Table 3.3 Classification of the impact categories in ReCiPe and TRACI .................................... 44
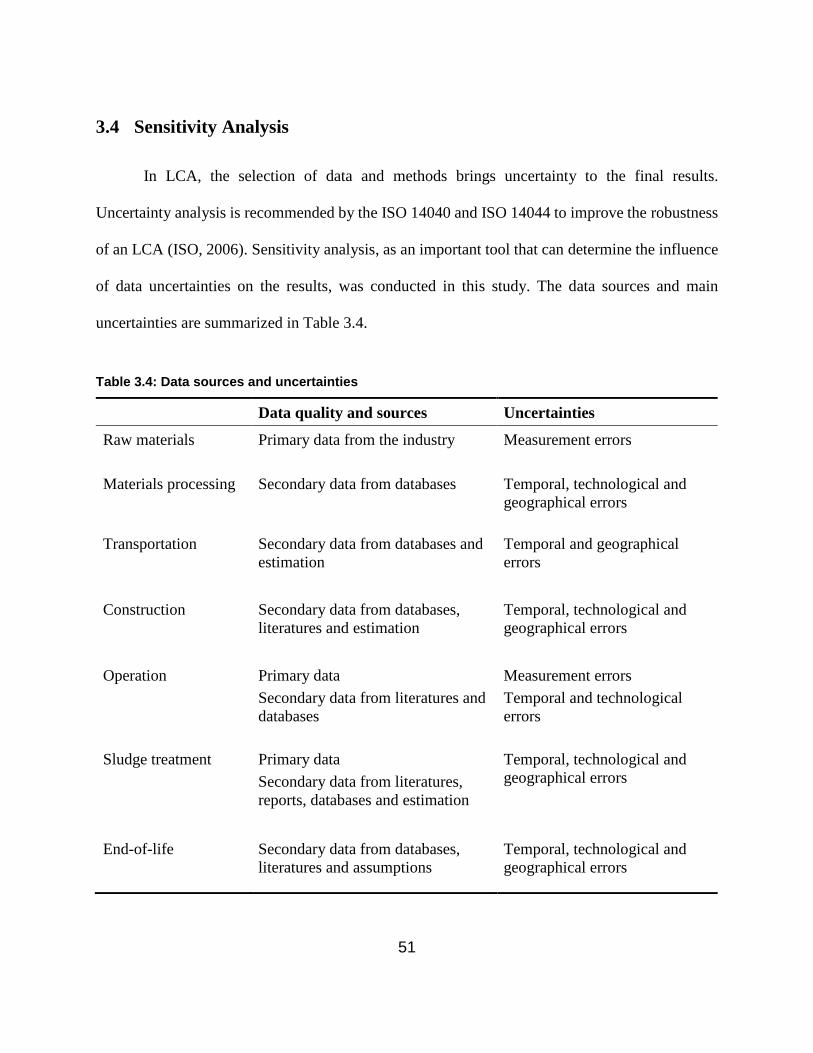
Table 3.4: Data sources and uncertainties..................................................................................... 51
Table 3.5 Sensitivity analysis for specific assumptions................................................................ 53
Table 4.1: Comparison of the characterization results from ReCiPe and TRACI ........................ 71
Table 4.2: Life-cycle phases of the direct discharge scenario ...................................................... 82
Table 4.3: Life-cycle phases of the treatment in local WWTP scenario ...................................... 84
Table 4.4: Life-cycle phases of the MBR and MBR+RO+UV scenarios ..................................... 86
viii
LIST OF FIGURES
Figure 2.1: Stages of an LCA (ISO, 2006) ..................................................................................... 8
Figure 2.2 Elements of the LCIA phase (ISO, 2006) ................................................................... 10
Figure 2.3 Summary of impact categories (characterization models) available in popular LCIA
models (Matthews et al., 2015) ..................................................................................................... 14
Figure 3.1: Schematic diagram of wastewater treatment plant at Algoma ................................... 29
Figure 3.2: System boundary of direct wastewater discharge ...................................................... 31
Figure 3.3: System boundary of treating wastewater in WWTP .................................................. 32
Figure 3.4: System boundary of the on-site wastewater treatment plant construction phase ....... 33
Figure 3.5: System boundary of the on-site wastewater treatment plant operation phase ............ 33
Figure 3.6 System boundary of the on-site wastewater treatment plant end-of-life phase ........... 34
Figure 4.1: Comparison of characterization results of the four scenarios using ReCiPe ............. 55
Figure 4.2: Comparison of normalization results of the four scenarios using ReCiPe ................. 56
Figure 4.3: Process contribution to impact categories for direct discharge scenario using ReCiPe
....................................................................................................................................................... 58
Figure 4.4: Process contribution to impact categories for treating wastewater in municipal
WWTP scenario using ReCiPe ..................................................................................................... 59
Figure 4.5: Process contribution to impact categories for MBR scenario using ReCiPe ............. 61
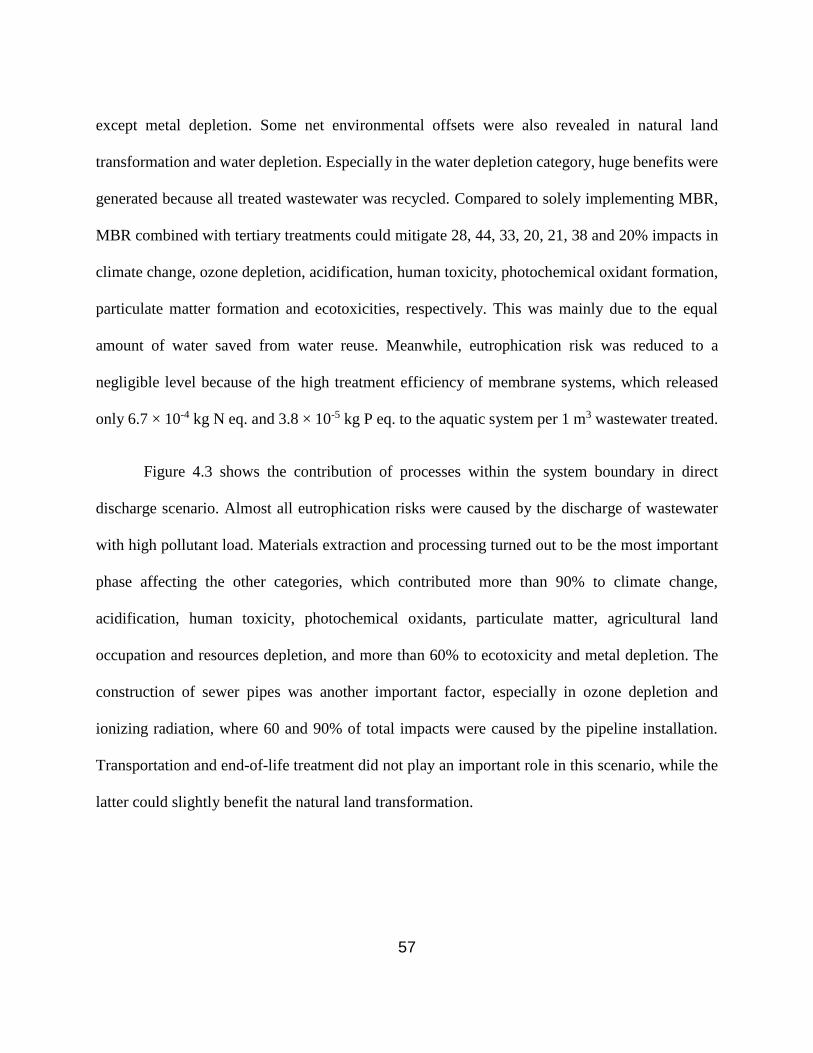
Figure 4.6: Process contribution to impact categories for MBR+RO+UV scenario using ReCiPe
....................................................................................................................................................... 62
Figure 4.7: Comparison of characterization results of the four scenarios using TRACI .............. 63
Figure 4.8: Comparison of normalization results of the four scenarios using TRACI ................. 64
Figure 4.9: Process contribution to impact categories for direct discharge scenario using TRACI
....................................................................................................................................................... 65
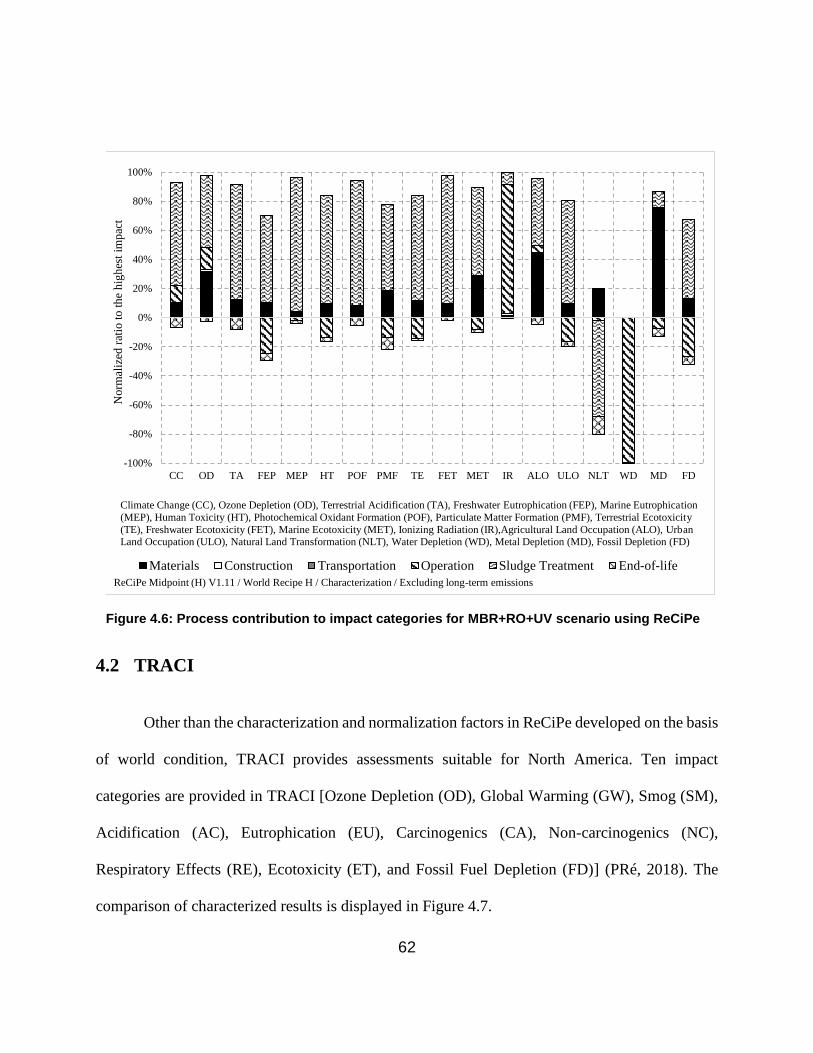
Figure 4.10 Process contribution to impact categories for treating wastewater in municipal
WWTP scenario using TRACI ..................................................................................................... 67
Figure 4.11 Process contribution to impact categories for MBR scenario using TRACI............. 68
ix
Figure 4.12 Process contribution to impact categories for MBR+RO+UV scenario using TRACI
....................................................................................................................................................... 69
Figure 4.13: Sensitivity analysis for direct discharge impacts using ReCiPe method.................. 83
Figure 4.14: Sensitivity analysis for treatment in local WWTP impacts using ReCiPe method .. 85
Figure 4.15: Sensitivity analysis for MBR and MBR+RO+UV impacts using ReCiPe method.. 88
Figure 4.16 Sensitivity analysis for major assumptions within the MBR system using ReCiPe
method........................................................................................................................................... 90
x
LIST OF ABBREVIATIONS
AC Acidification
ALO Agricultural Land Occupation
BOD Biological Oxygen Demand
CA Carcinogenics
CC Climate Change
CML Center of Environmental Science of Leiden University
COD Chemical Oxygen Demand
ET Ecotoxicity
EU Eutrophication
FD Fossil Depletion
FEP Freshwater Eutrophication
FET Freshwater Ecotoxicity
GW Global Warming
HT Human Toxicity
IESO Independent Electricity System Operator
IPCC Intergovernmental Panel on Climate Change
IR Ionizing Radiation
ISO International Organization for Standardization
LCA Life-cycle Assessment
LCI Life-cycle Inventory
LCIA Life-cycle Impact Assessment
MBR Membrane Bioreactor
MD Metal Depletion
MEP Marine Eutrophication
MET Marine Ecotoxicity
NC Non-carcinogenics
NLT Natural Land Transformation
OD Ozone Depletion
PMF Particulate Matter Formation
POF Photochemical Oxidant Formation
xi
RE Respiratory Effects
ReCiPe Netherlands based LCIA
RO Reverse Osmosis
SM Smog
TA Terrestrial Acidification
TE Terrestrial Ecotoxicity
TKN Total Kjeldahl Nitrogen
TN Total Nitrogen
TP Total Phosphorus
TRACI Tool for Reduction and Assessment of Chemicals and Other Environmental
Impacts
TSS Total Suspended Solids
UF Ultra-filtration
ULO Urban Land Occupation
USEPA United States Environmental Protection Agency
UV Ultraviolet
WD Water Depletion
WWTP Wastewater Treatment Plant
1
1 Introduction
A significant amount of clean water is consumed in fruit processing for washing the
harvested produce, hydro-conveying, cooling, processing, and cleaning the residue. Wastewater
generated from fruit processors usually contains high biological oxygen demand (BOD), total
suspended solids (TSS), total nitrogen (TN), and total phosphorus (TP), which may lead to surface
water pollution and eutrophication in the receiving waters. Consequently, strict environmental
regulations have been established so that wastewater is adequately treated before discharging into
the surrounding environment. In addition, many municipalities impose a surcharge fee on
industrial wastewater released to the sewer system exceeding the by-law limit for specific and
treatable parameters (Lam et al., 2015). The limits for BOD, TSS, TP, and TKN parameters within
Toronto area are 300 mg/L, 350 mg/L, 10 mg/L, and 100 mg/L, respectively (City of Toronto,
2016). To reduce the surcharge fee, many industries are attempting to implement on-site
wastewater treatment facilities and water reuse systems.
Many fruit processing industries are looking for possible technologies to efficiently treat
the wastewater and control the cost. Currently, several studies have targeted wastewater treatment
in related industries. Membrane-bioreactor (MBR) is considered a state-of-art technology to treat
fruit processing wastewater and has been proven to effectively remove solids, organic
contaminants and nutrients. Moore et al. (2016) showed that an MBR system could provide
excellent removal efficiency at 97% COD, 99% BOD, 99.9% TSS, 90% TKN, and 60% TP, which
could eliminate the surcharge for wastewater. Mundi and Zytner (2015) studied the potential
application of dissolved air flotation (DAF) and centrifuge, followed by ultraviolet (UV)
2
disinfection to treat the wastewater to a reusable condition. It has been found that DAF and
centrifuge processes had high removal efficiency for TSS. The performance of filtration and UV
disinfection units were enhanced, so that treated water could be considered for reuse in food
processing. Researchers are also conducting studies on tertiary treatment technologies such as RO
and electrocoagulation (EC) to further reduce TN, TP, and pathogens, which could mitigate the
eutrophication and increase the feasibility of water reuse. Despite the effectiveness of the on-site
wastewater treatment processes, many processors are concerned about the additional costs and not
willing to apply advanced technologies. As such, an Ontario Ministry of Agriculture, Food and
Rural Affairs (OMAFRA) funded a project studying a fruit processor who has applied an on-site
wastewater treatment and water recycling system. The research evaluates the benefits of treating
fruit processing wastewaters with MBR and reverse osmosis system. The case study aims at raising
awareness of all stakeholders in the fresh cut sector on the importance and benefits of advanced
treatment of fruit processing wastewaters with the option of recycling, which matches an
OMAFRA priority on sustainability.
It is a very complicated process to assess the environmental friendliness of a system. The
parameters measured for treated wastewater, such as BOD, can only reflect the direct impacts of
water discharged into the surface water on the environment. This cannot reflect its full
environmental impacts because those parameters do not reveal the impacts related to the
wastewater treatment systems. For example, electricity is consumed during the operation of the
treatment systems, which is generated from natural resources such as natural gas and coal. The
electricity generation processes produce large amounts of CO2, CH4 and other greenhouse gases,
which contribute to global warming. These issues associated with the wastewater treatment cannot
3
be ignored. Therefore, it is necessary to find an approach to evaluate the environmental footprint
of the wastewater treatment systems, not only through the treatment effects on sewage but also all
impacts of the treatment systems within their life-cycle.
Life-cycle assessment (LCA) is a methodology that quantitatively assesses the
environmental impacts of a product throughout its life-cycle from raw material acquisition through
production, use, end-of-life treatment, recycling and final disposal (i.e. cradle-to-grave) (ISO,
2006). LCA allows researchers to evaluate the impacts of a single technology or compare different
techniques from environmental perspectives. Therefore, LCA would be an effective tool that can
be used for evaluating the environmental impacts of applying wastewater treatment systems in the
fruit processing industry.
1.1 Research Gap
LCA has been implemented in the wastewater treatment field since the 1990s. Now, it has
been successfully applied in many kinds of projects, which comprehensively cover small and large
scale municipal, industrial, and institutional wastewater treatment technologies. However, there is
a lack of LCA studies targeting sewage management in the fruit processing sector. Additionally,
most of the previous studies aimed at comparing among different technology alternatives, but not
considering a no-treatment scenario. Without including a no-treatment scenario, the studies could
provide evidence on proper technology selection and process improvement, but would not be
sufficient for proving the environmental friendliness of implementing the treatment technologies.
Unlike wastewater generated from common sources, the contaminant contents in the
fruit/vegetable processing wastewater could be extremely higher. For example, most LCA studies
4
have focused on the municipal wastewater treatment plants (WWTP), where the BOD, TSS, TKN
and TP in wastewater influent typically range from 100-300, 200-1000, 20-50 and 3-7 mg/L,
respectively. In fruit and vegetable processors, the average concentrations of BOD, TSS, TKN and
TP could range from 1200-4400, 220-2400, 20-230, and 10-46 mg/L, respectively (Lam et al.,
2015; Mundi and Zytner, 2015; Moore et al., 2016). The environmental impact of this tremendous
contamination load should be quantified, especially when wastewater is not properly treated.
1.2 Objectives and Thesis Layout
The main objective of this thesis is to use LCA as a tool to quantitatively assess the total
environmental impacts of MBR and tertiary wastewater treatment technologies in the fruit
processing industry. Furthermore, the study aims at comparing the impacts of different treatment
options, including discharge without treatment. The quantitative metrics will show other users the
benefits of being environmentally proactive and provide scientific evidence for all stakeholders in
the fruit processing sector on how to optimize their treatment options and make policy decisions.
The detailed objectives of this work are summarized as follows:
(1) Conduct a cradle-to-grave life-cycle inventory of the fruit processing treatment options,
including all the inputs, outputs, and emissions of each unit process within the system boundary.
(2) Perform a life-cycle impact assessment using different life-cycle impact assessment
methods.
5
(3) Interpret the life-cycle impact assessment results, with focus on the comparison of
treatment options, improvable processes, and the total environmental footprints within each
specific impact category.
(4) Perform a data uncertainty analysis.
This thesis is divided into five chapters, which are:
Chapter 1, Introduction, which briefly introduces the research background and gaps to be
fulfilled.
Chapter 2, Literature Review, which introduces the history, development and rules related
to life-cycle assessment, and previous research works conducted in the related fields.
Chapter 3, Methodology, which is developed according to the ISO-14040 and ISO-14044
standards for LCA including the goal and scope, methods for data collection, impact assessment,
and uncertainty analysis.
Chapter 4, Results and Discussion, where the life-cycle inventory, life-cycle impact
assessment, interpretation and uncertainty analysis results are presented, with discussion of the
treatment options, impact assessment models and uncertainties.
Chapter 5, Conclusions and Recommendations, which summarizes the major outcomes of
this study and provides recommendations for the treatment technologies and future research.
6
2 Literature Review
2.1 The History and Standardization of Life-cycle Assessment
In 1969, the Coca Cola Company commissioned an internal work by a group of researchers
to compare different beverage containers in order for investigating which kind of container had
the lowest environmental releases and consumed the least natural resources. Against the traditional
idea that plastics should release more pollution to the environment, the results showed that glass
bottles caused more pollution. Though this report has not been published due to confidential
content, the Coca Cola Company switched from glass to plastic bottles based on the results (Hunt
& Franklin, 1996). This case proved that results from LCA could differ from traditional
methodologies when considering the processes that were rarely noticed such as raw material
extraction and waste disposal. Therefore, the conventional approaches considering single units
were proved not sufficient for analyzing the environmental impacts of product systems.
In the late 1960s, the initial term of LCA was called Resource and Environmental Profile
Analysis (REPA) in the U.S. and Ecobalance in Europe. At the same time, the oil shortage was a
significant issue in Eastern countries. Many studies relied on this methodology to address the
energy shortage, which took the LCA approach a step further. In the mid-1980s, solid waste
became major concern, and LCA studies were applied to the hazardous waste and household waste
management areas (Hunt & Franklin, 1996). With the expansion of processes and sectors being
included, and the improvement of databases, the cradle-to-grave life-cycle assessment
methodology has quickly developed and been applied worldwide.
7
However, in the early years, there were no uniform LCA procedures to follow. Each report
had its particular logic and structure, making it difficult for the public to read and compare among
different LCA papers. The market of LCA expanded quickly at the early stage of its development,
which contributed to the development of services and products provided by the industrial
practitioners as well as development of LCA databases and standardization. Due to the growing
need of a standard, LCA standardization began at the Technical Committee of the International
Organization for Standardization (ISO) in 1993 (Marsmann, 1997). Between 1997 and 2000, the
first international systematic frameworks for performing LCA were published by ISO, which were
the standards ISO 14040 General Principles (1997), ISO 14041 Life Cycle Inventory Analysis
(LCI) (1998), ISO 14042 Life Cycle Impact Assessment (LCIA) (2000) and 14043 Interpretation
(2000). Then in 2006, the standards were updated and further replaced by ISO 14040
Environmental management - Life cycle assessment - Principles and framework and ISO 14044
Environmental management - Life cycle assessment - Requirements and guidelines, which are the
editions currently applied worldwide (Pryshlakivsky and Searcy, 2012). In a standardized LCA
study, four phases should be included:
(1) goal and scope definition;
(2) life-cycle inventory (LCI);
(3) life-cycle impact assessment (LCIA);
(4) interpretation.
8
Figure 2.1 illustrates the phases and their relationship with LCA applications as described
in the ISO 14040. Based on objectives and requirements within different cases, the contents in
each phase should be specifically defined.
The goal and scope phase defines the objective of the study and the system boundary, which
is the basic stage that decides how detailed the LCA is. The boundary conditions of LCA studies
can differ significantly based on the specific goal defined at this stage. To sufficiently describe the
goal of an LCA study, four elements should be stated: 1) intended application; 2) reasons for
carrying out the study; 3) intended audience; 4) whether the results are intended to be disclosed to
the public (ISO, 2006). The scope definition decides the width and depth of an LCA study that
should be compatible with the goal stated. It should clearly state the product system studied,
functions of the system, functional unit, reference flows, system boundary, allocation procedures,
Life cycle assessment framework
Goal and scope
definition
Inventory analysis
Impact assessment
Interpretation
Direct applications:
- Product development
and improvement
- Strategic planning
- Public policy making
- Marketing
- Other
Figure 2.1: Stages of an LCA (ISO, 2006)
9
methods for impact assessment, data quality and requirements, assumptions and limitations (ISO,
2006).
The inventory analysis phase, namely life-cycle inventory (LCI), is an inventory of all the
data required to achieve the goal defined in the first stage including unit processes, inputs, and
outputs. The LCI can quantify all the resources consumed and emissions generated within the
system boundary. To collect data for each unit process, it is suggested in the ISO standard to sort
the unit processes into major categories, which include: 1) energy, raw material and other physical
inputs; 2) products, co-products and wastes; 3) emissions released into air, water or soil; 4) other
inventories (ISO, 2006). Data collection is a very resource-intensive procedure, in most cases,
assumptions and estimations have to be made in order to complement the data unavailable.
Therefore, data from estimation, assumption and secondary sources should be validated. In the
LCI phase, all data collected should be related to unit processes, and assigned to the functional
unit defined in the scope (ISO, 2006).
After LCI is properly documented, the inventory data are further translated by relating the
flows to different environmental impact categories and category indicators (ISO, 2006), which is
known as life-cycle impact assessment (LCIA). This phase is also able to be excluded in an LCA
study. If doing so, only the life-cycle inventory will be provided without additional explanation.
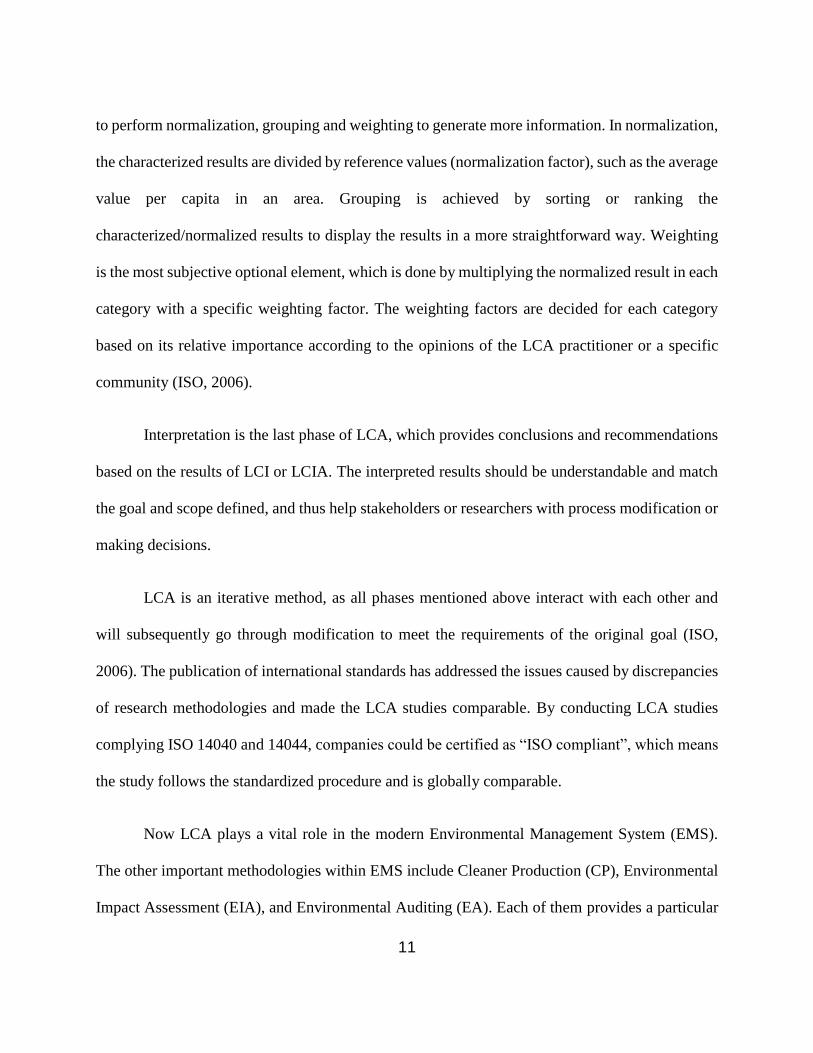
Figure 2.2 shows the standardized procedure for performing LCIA according to ISO 14040. A
complete LCIA comprises six elements, which are selection, classification, characterization,
normalization, grouping and weighting.
10
The first three elements are mandatory while the last three are optional (ISO, 2006).
Selection is the procedure of selecting impact categories, category indicators and characterization
models, which depends on the objectives and major interests of an LCA study. Classification refers
to assigning all LCI data to the impact categories selected. Characterization means calculating the
LCI data into environmental impacts using the indicators (characterization factors) and models
selected. After the three mandatory elements are completed, LCA practitioners can further choose
Figure 2.2 Elements of the LCIA phase (ISO, 2006)
11
to perform normalization, grouping and weighting to generate more information. In normalization,
the characterized results are divided by reference values (normalization factor), such as the average
value per capita in an area. Grouping is achieved by sorting or ranking the
characterized/normalized results to display the results in a more straightforward way. Weighting
is the most subjective optional element, which is done by multiplying the normalized result in each
category with a specific weighting factor. The weighting factors are decided for each category
based on its relative importance according to the opinions of the LCA practitioner or a specific
community (ISO, 2006).
Interpretation is the last phase of LCA, which provides conclusions and recommendations
based on the results of LCI or LCIA. The interpreted results should be understandable and match
the goal and scope defined, and thus help stakeholders or researchers with process modification or
making decisions.
LCA is an iterative method, as all phases mentioned above interact with each other and
will subsequently go through modification to meet the requirements of the original goal (ISO,
2006). The publication of international standards has addressed the issues caused by discrepancies
of research methodologies and made the LCA studies comparable. By conducting LCA studies
complying ISO 14040 and 14044, companies could be certified as “ISO compliant”, which means
the study follows the standardized procedure and is globally comparable.
Now LCA plays a vital role in the modern Environmental Management System (EMS).
The other important methodologies within EMS include Cleaner Production (CP), Environmental
Impact Assessment (EIA), and Environmental Auditing (EA). Each of them provides a particular
12
function in this system. As for LCA, it is the only methodology that has an international standard
and can quantify the environmental impacts of a specific product or service from cradle to grave.
2.2 Life-cycle Assessment Tools
Among the four phases demonstrated above, life-cycle inventory (LCI) and life-cycle
impact assessment (LCIA) are the two most complicated and time-consuming phases that require
LCA practitioners to quantify all materials and energy flows within the life-cycle of products, as
well as to translate the life-cycle inventories into quantitative environmental impacts.
In the analysis of LCI, all inputs and outputs of a product system should be investigated
and calculated. Despite specific inventories that should be directly investigated according to the
project assessed, such as the amount of materials and energy consumed, there are also existing
databases containing background inventories of common processes such as the inputs and
emissions of electricity generation, transportation and waste disposal. Many institutions provide
LCI databases that are well documented such as Ecoinvent, USLCI and Agri-footprint (PRé, 2018).
These databases are commonly adopted when dealing with general processes or processes that are
difficult to investigate privately.
Studies have been conducted on understanding the fate of contaminants and their effects
on the environment for many years. Now there are many well developed LCIA methods containing
models for selection, classification, characterization, and even the optional elements. These
methods were released by different institutions. Some of the LCIA methods aim at single issues
such as the IPCC method developed by the Intergovernmental Panel on Climate Change (IPCC),
13
which mainly focuses on climate change (Matthews et al., 2015). Some other methods can assess
comprehensive environmental issues in a specific region such as the Tool for Reduction and
Assessment of Chemicals and Other Environmental Impacts (TRACI) method released by the
United States Environmental Protection Agency (USEPA), which was developed for the US
condition that contains ten impact categories (Matthews et al., 2015). Figure 2.3 shows the
summary of impact categories in popular LCIA methods. Based on the goal and scope defined in
an LCA study, the proper method is typically adopted for performing LCIA.
14
Most LCI database and LCIA method developers have released well-constructed excel
spreadsheets for the database or methods they provide. In addition to these, there are also many
kinds of software available that contain the majority of the database and functions required for
conducting a complete LCA study. SimaPro is one of the world’s leading LCA software developed
by a Dutch company called © PRé Consultants B.V., and has been applied worldwide for 25 years
in over 80 countries. (PRé, 2018). SimaPro provides functions needed for the four phases regulated
Model C
lim
ate
chan
ge
Ozo
ne
dep
leti
on
Res
pir
ato
ry I
norg
anic
s
Hu
man
to
xic
ity
Ion
izin
g r
adia
tio
n
Eco
toxic
ity
Ozo
ne
form
atio
n
Aci
dif
icat
ion
Ter
rest
. eu
tro
ph
icat
ion
Aq
uat
ic e
utr
op
hic
atio
n
Lan
d u
se
Res
ou
rce
dep
leti
on
CED ×
CML2002 × × × × × × × × × × ×
Eco-indicator 99 × × × × × × × × × ×
EDIP 2003/EDIP976 × × × × × × × × × × ×
EPS 2000 × × × × × × × × × × × ×
Impact 2002+ × × × × × × × × × × ×
IPCC ×
LIME × × × × × × × × × × ×
LUCAS × × × × × × × × × ×
MEEuP × × × × × × × × × ×
ReCiPe × × × × × × × × × × × ×
Swiss Ecoscarcity 07 × × × × × × × × × × × ×
TRACI × × × × × × × × × ×
USEtox × ×
Figure 2.3 Summary of impact categories (characterization models) available in popular LCIA models (Matthews et al., 2015)
15
by ISO 14040. In the goal and scope description phase, LCA practitioners can easily input text
describing the necessary information mentioned in the ISO framework such as reasons, intended
application and intended audience.
The most important function in SimaPro is the comprehensive collection of popular LCI
databases and LCIA methods. The LCI data libraries built in SimaPro include Agri-footprint,
Ecoinvent 3, European Life Cycle Database (ELCD), The U.S. Life Cycle Inventory (USLCI),
Industry Data 2.0, and input-output (IO) databases for Swiss, USA, EU and Denmark (PRé, 2018).
Among the above data libraries, Ecoinvent is one of the largest databases covering over 10,000
processes and thus was used as the major background inventory source in this study. In the LCIA
method libraries in SimaPro, most of the popular LCIA models shown in Figure 2.3 are included
(PRé, 2018). After the product systems are properly set up in SimaPro using primary data and LCI
databases, the software can run the calculation models in the LCIA method selected, and display
LCI or LCIA results as figures or tables. Finally, LCA practitioners can implement interpretation
according to the main findings. Notably, many of the databases and models involve uncertainties
to different extent. Therefore, the uncertainties and limitations should be considered. SimaPro can
also be used for performing uncertainty analysis such as Monte Carlo analysis and sensitivity
analysis, using the functions offered with a professional licence (PRé, 2018).
2.3 Development of LCA in Conventional Wastewater Treatment
Water sanitation systems are very common in modern life. The first activated sludge
process can be traced back to the early 20th century in the UK (Ardern & Lockett, 1914). The
performance of wastewater treatment systems was commonly evaluated by the removal efficiency
16
of contaminants. Gaining importance are environmental costs of the treatment processes, which
were not fully recognized in the early years. LCA, as it was initially developed for products, after
the concept of sustainable development was proposed by the World Commission on Environment
and Development (WCED) in 1987, the methodology started to be applied in the wastewater
treatment field (Corominas et al., 2013).
In early studies, the structure of LCA reports was not complete when compared to recent
years. Review of the literature suggests that, the first international journal article of LCA in
wastewater management field was published by Emmerson et al. (1995). The article contained a
life-cycle inventory focusing on the construction, operation and demolition phases of a small-scale
sewage treatment plant. In the LCI phase, the CO2 and energy flows have been identified in a
global scale. Their environmental impacts have been discussed, but no quantitative analysis was
further conducted due to the lack of methodologies. Overall, the research concluded that LCA
could be an effective method for analyzing the environmental impacts of small-scale sewage
treatment systems. Although mass and energy flows in the wastewater treatment consisted only
1% of the total flows in the world, it was still considerable. The contribution of energy
consumption and construction materials were especially important (Emmerson et al., 1995).
In the same year of the publication of ISO 14040, a paper focusing on the sustainability of
municipal wastewater treatment was published. An impact assessment through classification,
characterization and evaluation was conducted in this study, which was the embryo of the
quantitative method for life-cycle impact assessment as it is known nowadays (Roeleveld et al.,
1997). The environmental impacts have been divided into different categories including global
warming, ozone layer depletion, human toxicity, ecotoxicity, etc., which were very similar to
17
recent practices. Several representative substances have been selected as indicators to quantify the
potential of each impact category. It has been found that sludge production and discharge from
pollution were major contributors to the total environmental impacts, showing that more attention
should be paid to these areas. Accordingly, Roeleveld et al. (1997) suggested that LCA should be
conducted on regional level rather than national level to classify the actual practice of sludge
treatment. This was a successful practice of using LCA to evaluate the sustainability of WWTPs.
Since the beginning of the 21st century, LCA in the wastewater treatment field has attracted
more attention and it has been implemented on more kinds of treatment technologies and unit
processes. Meanwhile, the structures of LCA reports have become more standardized under the
guidance of ISO 14040. Most of the papers have been organized based on the four elements
regulated in the ISO standard, namely goal and scope, inventory, impact assessment and
interpretation.
Municipal wastewater treatment systems are very connected to people’s daily life, and as
such have attracted much attention. Lundin et al. (2000) conducted an LCA with case studies on
conventional activated sludge technologies at both small and large scales. Construction, operation
and transport phases have been considered. Like early findings, the operation phase had the
greatest contribution in most impact categories. However, the electricity consumption per
population equivalent in small-scale facilities was almost four times higher than in large-scale
systems (Lundin et al., 2000). Eventually, many case studies were carried out using LCA to assess
the total environmental impacts of municipal WWTPs (Clauson-Kaas et al., 2001; Hospido et al.,
2004; Hospido et al., 2008). In addition to construction, transportation and operation phases that
were typically considered, sludge treatment was included in the system boundaries.
18
Multiple environmental indicators or well developed LCIA methods such as the CML
method were adopted for performing LCIA. From the obtained results, the importance of sludge
treatment within the life cycle of WWTPs was emphasized. Wastewater discharge contributed to
over 80% of total impacts in eutrophication and ecotoxicity (Clauson-Kaas et al., 2001). This was
mainly caused by the ammonia and phosphorus contents in the wastewater released (Hospido et
al., 2008). Sludge treatment affected the total impacts in various ways depending on the sludge
management method. For example, sludge incineration generates many slag and ashes that have
negative impacts to human health (Clauson-Kaas et al., 2001). When applying sludge to the land,
some impact reduction could be gained and biogas generated from sludge digestion also had
benefits to energy recovery. However, heavy metals and pathogens should be properly handled if
land application was applied (Hospido et al., 2004, Hospido et al., 2008).
Some of the studies have focused on specific aspects of municipal WWTPs. Pasqualino et
al. (2009) and Bravo and Ferrer (2011) focused on the energy aspect of municipal WWTP.
Consistent with previous findings, sludge treatment was found to be the most important phase
regarding energy efficiency. It was suggested to promote energy recovery of biogas generated from
sludge digestion (Pasqualino et al., 2009; Bravo & Ferrer, 2011). Risch et al. (2015) were the first
to include the construction and operation of sewer systems bonded with municipal WWTPs. The
construction of sewer infrastructure took into account component materials, civil works and road
rehabilitation, while the operation of sewer systems included emissions and energy consumption
of pump stations, and water released from sewer leaks. Results showed that construction and
operation phases of sewer infrastructure had greater environmental impacts than WWTPs in half
of the eighteen selected impact categories. Accordingly, the authors claimed that the sewer
19
infrastructure is also an important damage source to the environment that cannot be neglected
(Risch et al., 2015).
Several researchers have used LCA to individually assess different sludge treatment
technologies. This was mainly due to the continuous growing urban population and the
development of approaches for managing sewage sludge as described in many papers (Suh &
Rousseaux, 2002; Beavis & Lundie, 2003; Svanström et al., 2004; Houillon & Jolliet, 2005).
Conventional sludge treatment methods (agricultural spreading, landfilling, thermic oxidation,
etc.) raised concerns for governments because of the potential hazards of pathogens. Thus,
restrictions on sludge treatment processes have become more rigid (Suh & Rousseaux, 2002;
Houillon & Jolliet, 2005). With an increasing need for a clearer overview of the environmental
impacts of sludge treatment alternatives, LCA was chosen as a practical tool. Aims of the studies
were mainly to compare the life-cycle impacts of various technologies treating sewage sludge
generated from municipal WWTPs, which included conventional approaches (Suh & Rousseaux,
2002; Houillon & Jolliet, 2005) and new technologies such as supercritical water oxidation
(SCWO) (Beavis & Lundie, 2003). Construction, operation and transport phases have been
commonly included in the system boundary of each technology. However, in the case of impact
assessments, varieties existed. Many LCA societies have presented different versions for doing the
assessment (Suh & Rousseaux, 2002). Suh and Rousseaux (2002) applied SETAC and CML
methods in their study, which included nine impact categories. Other researchers have selected
specific indicators for different categories. Global warming, eutrophication, human toxicity, eco-
toxicity and photochemical smog formation have attracted the most attention. The results showed
that energy consuming processes such as preheating and pumping were major contributors to most
20
impacts. Among the conventional technologies, agricultural spreading has been found as the most
advantageous method, but benefits reduced with the increase of transport distance. Additionally,
anaerobic digestion performed better than aerobic digestion, which has been proved in many cases
(Suh & Rousseaux, 2002; Beavis & Lundie, 2003; Houillon & Jolliet, 2005).
2.4 LCA of Membrane Bioreactor Technology
Membrane bioreactor (MBR) is an upgrade of conventional activated sludge (CAS)
technology and has been widely applied in municipal and industrial wastewater treatment during
the past two decades (Hospido et al., 2012; Ioannou-Ttofa et al., 2016). It is a combination of
activated sludge and membrane filtration technologies, which has many advantages over
conventional systems, such as compact design and high effluent quality (Hospido et al., 2012).
However, it has been pointed out in many studies that the electricity consumption of MBR is an
important issue as it consumes up to three times the power compared to CAS technology, and
could constitute up to 60% of overall WWTP energy consumption (Hospido et al., 2012; Pretel et
al., 2013).
Many studies have implemented LCA technique to identify the total environmental
footprints of MBR systems (Hospido et al., 2012; Pretel et al., 2013; Ioannou-Ttofa et al., 2016;
Cashman et al., 2018). In general, all the studies have complied the ISO 14040 standard to conduct
research and report the outcomes. SimaPro was the most commonly used software in the studies
due to its comprehensive collection of databases and LCIA methods (Hospido et al., 2012; Pretel
et al., 2013; Ioannou-Ttofa et al., 2016). The typical choice for a functional unit was “one cubic
meter (m3) of wastewater treated”, which was especially appropriate for representing the system
21
function when considering the final effluent quality (Hospido et al., 2012; Pretel et al., 2013). The
scale of system boundaries was relatively flexible, with electricity consumption, water discharge
and sludge disposal commonly considered.
The purposes of conducting LCA on MBR differ between each other. Hospido et al. (2012)
assessed four configurations of MBR and attempted to see if all MBRs are equal from an
environmental perspective. Pilot-scale facilities have been chosen for case studies, with flow rate
ranging from 0.26 to 16.32 m3/d. The system boundary only included the operation phase of the
selected systems including water income and output, electricity production and consumption,
chemical manufacture and sludge management. LCIA was accomplished using the CML method,
with five environmental hot spots selected as impact categories. Results showed that electricity
consumption played a vital role in all the categories, while land application of sludge was important
to toxicity-related categories. From the comparison, the ranking of the four configurations has been
successfully carried out, which could be consulted for MBR system design (Hospido et al., 2012).
Pretel et al. (2013) assessed the environmental impact of submerged anaerobic MBR at
different operating temperatures (20 and 33 °C) treating municipal wastewater. Operation, treated
water discharge and sludge disposal were included in the system boundary, while construction,
pre-treatment, transportation, demolition and other airborne emissions or thermal impacts were
ignored. Inventory data were gathered from an industrial-scale MBR system. The CML method
was adopted for LCIA. The results revealed the importance of operating MBR at ambient
temperature and recovering the nutrients and methane from permeate (Pretel et al., 2013).
22
Ioannou-Ttofa et al. (2016) conducted a cradle-to-gate LCA study on a pilot-scale MBR in
Cyprus in Europe. The innovation of this study was to systematically investigate possible
improvement for the overall sustainability of MBR systems, and assessing the impact of MBR
treating urban sewage that contains antibiotic contents. Comprehensive processes were included
in the system boundary including materials, construction, transportation of materials to the
installation site, energy consumption, air- and waterborne emissions and land use. Since it was a
cradle-to-gate study, end-of-life disposal and sludge treatment were not considered. Inventory data
were collected from the pilot-scale unit and correlative literatures that fitted the condition in
Cyprus. The IPCC 2013 and ReCiPe (European model) methods were used for performing LCIA.
Similar to previous studies, electricity production was found to be the most important process
affecting the overall impact, while the materials of membrane units were at the second place.
Construction phase was found having a minimal impact compared to the operation phase. There
was a notable finding obtained from the sensitivity analysis results. The energy mix turned out to
significantly affect the overall impacts of MBR system. By decreasing the portion of fossil-fuel-
fired electricity, the total environmental footprints could be significantly reduced (Ioannou-Ttofa,
2016).
Cashman et al. (2018) conducted an energy and greenhouse gas LCA of aerobic and
anaerobic MBR based on the North American condition, which especially focused on the influence
of scale, population, climate and methane recovery of MBR systems. Wastewater collection, MBR
operation, electricity generation, water disinfection, water reuse and potable water displacement
were included in the system boundary. The life cycle inventory was estimated based on theoretical
data of U.S. decentralized WWTPs. The TRACI method was adopted in this study for impact
23
assessment. By comparing the MBR systems operated at different scale, temperature and climate,
the most environmentally friendly operating condition has been identified. One of the important
outcomes was that when taking into account the displacement of drinking water, net energy
benefits could be gained. Cashman et al. (2018) suggested that multiple options should be
investigated and compared before choosing or managing water treatment technologies.
2.5 Summary of Literature Review
Life cycle assessment has almost 50 years of history and now plays an important role in
the modern environmental management system. With the development of correlative databases,
assessment models and methodologies, LCA has become a mature technique for assessing the total
environmental impacts of product systems from cradle-to-grave. In order to make the LCA studies
globally comparable and eliminate barriers between different research, ISO 14040 and 14044, the
international standards for LCA should be complied. According to the ISO standard, four phases
should be included: 1) goal and scope definition phase; 2) inventory analysis phase; 3) impact
assessment phase and 4) interpretation phase.
In the LCI phase, many professional databases such as Ecoinvent can be adopted as
secondary data to provide general background information such as materials processing, electricity
production and waste disposal. There are also many well-developed methods for performing LCIA
such as TRACI and ReCiPe. Notably, either LCI databases or LCIA methods were developed
based on specific regional conditions. Therefore, according to the goal and scope of an LCA study,
databases and LCIA methods should be properly selected. There are many LCA software programs
containing majority of functions as well as comprehensive collection of data libraries and LCIA
24
methods for conducting LCA. One of the most widely used software is SimaPro, which has been
applied in many studies.
LCA has been implemented in the wastewater treatment field for almost 25 years. It has
been successfully applied in many kinds of projects, which comprehensively cover small and large
scale municipal, industrial, and institutional wastewater treatment technologies. In most cases,
electricity generation and sludge disposal have been discovered as the most important phases
contributing to the total environmental footprints of water treatment systems. Construction,
transportation and demolition phases were found to be less important, but results could differ
depending on the scale of wastewater treatment facilities.
Membrane bioreactor, as an upgrade to the conventional activated sludge systems, has
attracted increasing attention. Especially in recent years, many studies have used LCA as a tool to
assess their environmental impacts. Generally speaking, LCA has been proved to be a feasible
technique for assessing MBR systems. It can be used for either assessing single MBR system or
comparing systems with different configurations, operating conditions or other operating
parameters. Since MBR is a relatively bulky and complicated system, data collection turned out to
be a challenge. Studies have been carried out based on either pilot-scale, industrial-scale or dummy
systems estimated according to average conditions. Processes taken in to account were also diverse,
which are highly dependant on the data available and aspects focused in each study. LCIA method
was selected in each case based on the specific area where the study was conducted. For example,
ReCiPe (Europe) and CML methods were popular in the cases carried out in Europe, while TRACI
was always selected for the studies conducted in North America. Based on the literature review,
some of the gaps can be identified regarding LCA implemented in MBR technology, include:
25
(1) Instead of full-scale facility, pilot-scale MBR systems have been assessed in many
studies (Hospido et al., 2012; Ioannou-Ttofa et al., 2016). Since the scale has found to be affecting
the total environmental impacts of wastewater treatment systems (Lundin et al., 2000; Cashman et
al., 2018), results would likely be different when it comes to full-scale facilities in real practice.
(2) All of the research has focused on MBR applied in urban wastewater treatment
(Hospido et al., 2012; Pretel et al., 2013; Ioannou-Ttofa et al., 2016; Cashman et al., 2018.) There
is a lack of LCA studies targeting specific sectors, such as where wastewater has high contaminant
contents or hazardous ingredients.
(3) System boundaries defined in previous research were commonly not comprehensive.
Electricity consumption, wastewater treatment, water discharge, and sludge disposal have been
included in most cases (Hospido et al., 2012; Pretel et al., 2013; Ioannou-Ttofa et al., 2016;
Cashman et al., 2018). However, other phases such as construction and end-of-life disposal were
sometimes neglected (Hospido et al., 2012; Pretel et al., 2013; Ioannou-Ttofa et al., 2016).
(4) All of the previous studies focused on the comparison of different systems or system
operated at various conditions (Hospido et al., 2012; Pretel et al., 2013; Cashman et al., 2018), or
comprehensively assessed the total environmental impacts of a single system (Ioannou-Ttofa et al.,
2016). The relative impacts of applying MBR compared with a scenario that wastewater is directly
discharged without any treatment have not been revealed.
26
3 Methodology
3.1 Goal and Scope
3.1.1 Goal Definition
Many fruit processing industries are looking for proper on-site technologies treating the
process wastewater that contain high organic content. MBR is a common approach that is
sometimes followed by RO and disinfection process to implement water reuse. This study aims at
systematically assessing the environmental impacts of the systems. In addition, many fruit
industries are not willing to implement on-site wastewater treatment facilities due to the additional
costs. In this context, it is important to show the impacts of “no treatment” to help the stakeholders
realize the significance of treatment as well.
Due to the reasons explained above, the goal of this study is to use LCA methodology to
quantitatively assess the environmental impacts of MBR and tertiary treatment technologies in the
fruit processing sector from raw material acquisition through production, construction,
transportation, operation and sludge disposal. This comparative analysis will show the impacts of
different treatment options, including discharge without treatment. The quantitative metrics will
show other users the benefits of being environmentally proactive, and provide scientific evidence
for all stakeholders in the fruit processing sector on how to optimize their treatment options and
make informed policy decisions. SimaPro 8.0.4.26 is deemed to be one of the most famous LCA
software worldwide and was applied as a software tool for conducting the LCA in this study.
27
3.1.2 Functional Unit
Four treatment scenarios have been defined for assessment and comparison:
Scenario 1: No on-site treatment (wastewater directly discharged into the environment);
Scenario 2: No on-site treatment (wastewater treated in local WWTP);
Scenario 3: On-site treatment using MBR;
Scenario 4: On-site treatment using MBR + RO + UV;
The primary function of the treatment systems is to treat/discharge the fruit processing
wastewater. Therefore, the functional unit of this study was set as “1 m3 of treated/discharged
wastewater” regardless of the treatment efficiency (impacts of the unremoved contaminants were
counted), to normalize the inventory of each scenario and provide uniform results that can be
directly compared with similar systems in other studies.
The design life of membrane systems was assumed to be 20 years based on a study with
similar research objectives (Ioannou-Ttofa et al., 2016). According to the study, the life-spans of
major components (except membrane modules) composing the membrane system ranged from 20-
50 years, which exceed the life-time of the entire system. Since the components cannot be directly
used after the facility reaches its end-of-life, it was assumed for all mechanical parts that the life-
time was 20 years regardless of the actual time they could last for. As an exception, the life-span
of MBR and RO modules was approximately 10 years as suggested by the industrial partner
(Algoma, 2018).
28
3.1.3 System Descriptions
Data from the real facility managed by our industrial partner (Algoma, 2018) was adopted
in this study to generate life-cycle inventories for membrane systems. The scenarios with no on-
site treatment options did not really exist, thus they were developed based on feasible assumptions,
general data, and correlative literatures.
The full-scale fruit processing wastewater treatment system is owned by Algoma Orchards
Ltd., an apple grower located in the rural area of Durham Region, Ontario. In addition to apple
production, the company also runs a juice processing segment, which is clarified as the largest
fresh apple juice producer in Ontario, with an approximate water consumption of 45,000 L/day. A
water recycling system called System HydroKleenTM has been developed to manage apple sizing,
hydro conveying, and juice processing wastewater as well as to fulfill the needs of fresh water
supply.
Figure 3.1 illustrates the technical process of the wastewater treatment facility. The system
consists of three parts. After primary screening, the wastewater stream goes into a high-efficiency
membrane bioreactor (MBR) consisting of an anoxic chamber and two ultra-filtration (UF)
membrane tanks.
29
Sludge settled in the anoxic tank is pumped into a sludge holding tank, with part of the
sludge recycled back into the anoxic zone. The permeate is then further treated through reverse
osmosis (RO) and UV disinfection as tertiary treatments to meet the quality requirements for
potable water. At the end of the process, a 10,000 L stainless steel tank is used for holding the
clean water permeate, while the concentrate from RO is collected and mixed with the rest of the
sludge. The mixed sludge is transported to the local WWTP by truck for final disposal.
In order to show the impacts of wastewater discharged without treatment, a scenario was
built by assuming the sewage generated from the fruit industry was discharged into the nearest
lake by underground pipeline without any preliminary treatments. A steel tank was used for
Figure 3.1: Schematic diagram of wastewater treatment plant at Algoma
30
temporal storage at peak flows. The environmental footprints of materials, transportation,
construction of steel tank and pipeline, as well as the contaminants in wastewater were considered.
However, most provinces across Canada have developed strict regulations on wastewater
discharge to water bodies, specially those that are prone to contamination due to high organic
content. Accordingly, direct discharge is always not a feasible way in real practice. As an
alternative, industries commonly dispose of their wastewater utilizing local centralized WWTPs
for treatment. Consequently, a scenario describing such cases was also defined. In this scenario,
raw sewage was assumed to be treated by primary screening in order to remove large particles and
stored on-site, then transported to the receiving WWTP by truck once per day.
3.1.4 System Boundaries
The system boundaries for all scenarios comprise raw materials extraction and processing,
transportation, construction, operation and waste disposal. Inventories with respect to
infrastructures such as vehicles and construction tools were excluded from all scenarios, while
only their emissions and fuel consumption were considered. According to the specific conditions
and assumptions related to each scenario, the details of each phase were particularly defined. More
details are demonstrated below.
3.1.4.1 Direct Discharge
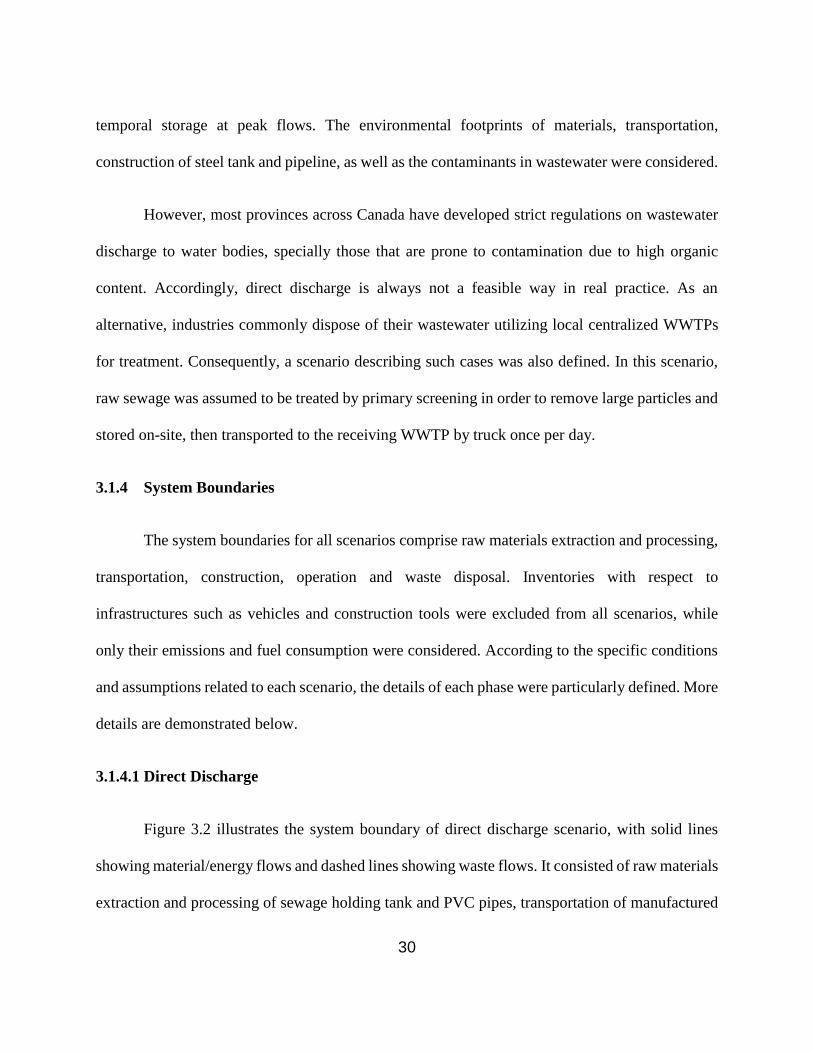
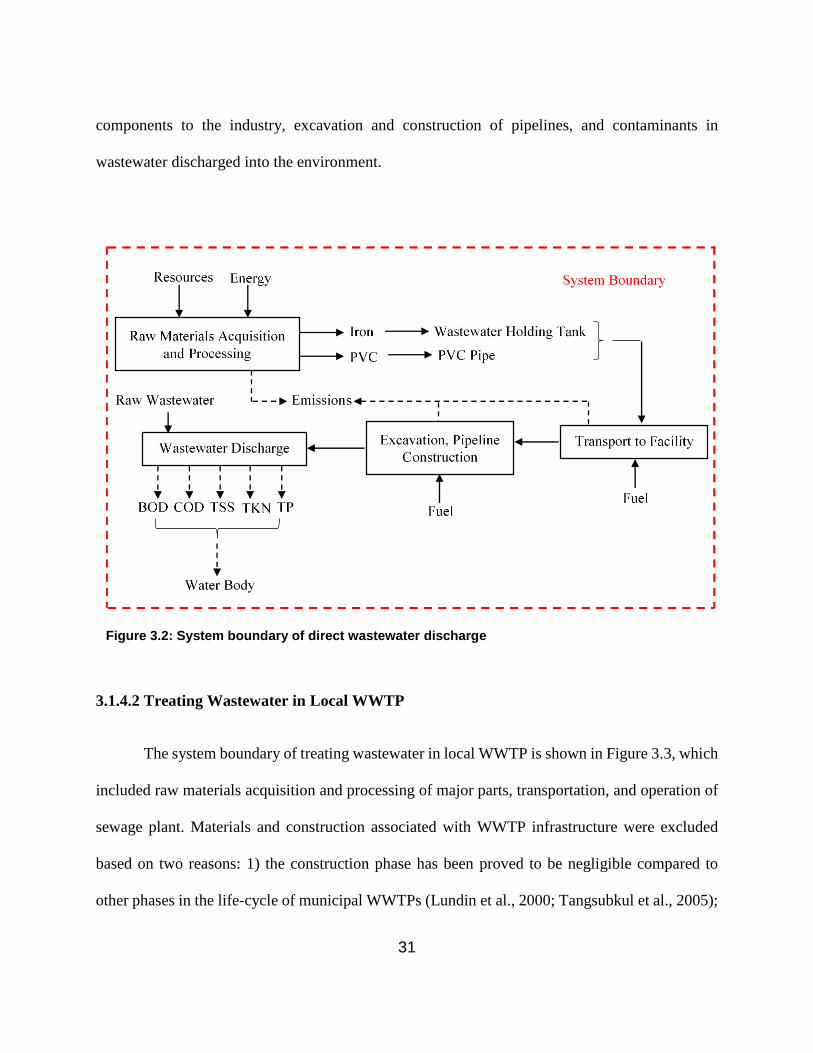
Figure 3.2 illustrates the system boundary of direct discharge scenario, with solid lines
showing material/energy flows and dashed lines showing waste flows. It consisted of raw materials
extraction and processing of sewage holding tank and PVC pipes, transportation of manufactured
31
components to the industry, excavation and construction of pipelines, and contaminants in
wastewater discharged into the environment.
3.1.4.2 Treating Wastewater in Local WWTP
The system boundary of treating wastewater in local WWTP is shown in Figure 3.3, which
included raw materials acquisition and processing of major parts, transportation, and operation of
sewage plant. Materials and construction associated with WWTP infrastructure were excluded
based on two reasons: 1) the construction phase has been proved to be negligible compared to
other phases in the life-cycle of municipal WWTPs (Lundin et al., 2000; Tangsubkul et al., 2005);
Figure 3.2: System boundary of direct wastewater discharge
32
2) municipal WWTPs are built to serve the entire region and the amount of wastewater generated
from the industrial partner is marginal compared to the capacity of sewage plant. Therefore, only
the operation phase (electricity consumption) of sewage plant was considered.
3.1.4.3 Membrane Systems
The scenarios of MBR and MBR combined with tertiary treatments are discussed together
in this section as they share the same system boundary. For clarity, it was roughly divided into
three parts, namely the construction phase, operation phase and end-of-life phase.
Figure 3.3: System boundary of treating wastewater in WWTP
33
System boundary of the construction phase is shown in Figure 3-4. The transport of
equipment and labours used for construction was included because their impacts are not negligible
due to a previous study (Ioannou-Ttofa et al., 2016).
In the operation phase, electricity consumption, water discharge/reuse and sludge disposal
were all involved as shown in Figure 3.5.
Figure 3.4: System boundary of the on-site wastewater treatment plant construction phase
Figure 3.5: System boundary of the on-site wastewater treatment plant operation phase
34
System boundary of the end-of-life phase is shown in Figure 3.6. Deconstructed materials
are commonly managed in different ways including recycling and landfill disposal. The disposal
of these materials consumes much energy for transport and end-of-life treatments, thus, these
processes are included in the boundary. Fuel/energy consumptions and emissions related to the
demolition of facility were neglected, because the impact of demolition phase is negligible
compared to the overall impact (Emmerson et al., 1995; Lopsik, 2013), and was excluded in
previous works (Garfí et al., 2017; Hospido et al., 2012).
3.1.5 Major Assumptions and Limitations
A couple of hypotheses were made on determination of the system boundaries. The major
assumptions and their correlative limitations are:
Figure 3.6 System boundary of the on-site wastewater treatment plant end-of-life phase
35
(1) Direct discharge and treating sewage in local centralized WWTP were defined mainly
based on assumptions, without real case studies. Therefore, the systems could not ideally reflect
the conditions in real practice.
(2) Materials and construction related to the centralized WWTP infrastructure were ignored.
Although they have been proved having minor impacts compared to the overall environmental
footprints of WWTP, uncertainties still exist.
(3) Demolition phase was excluded from the boundary of membrane systems due to the
lack of data as well as its marginal impacts. This could bring uncertainties to the study.
3.2 Life-cycle Inventory (LCI)
The raw wastewater data were collected from the lab report of Algoma, which were applied
in all scenarios. The electricity mix of Ontario was acquired from the annual energy output report
of 2018 supplied by the Independent Electricity System Operator (IESO), which comprised 61%
of nuclear, 25% of hydro, 6% of gas/oil, 7% of wind, 0.05% of biofuel and 0.05% of solar (IESO,
2019). Other specific data sources for each scenario are described in the following sections.
3.2.1 Direct Discharge
The sources of raw materials acquisition and processing data came from the professional
databases built within SimaPro. Fuel consumption and emissions generated from soil excavation
for burying pipeline were taken into consideration as construction phase, which were estimated
according to corresponding literatures (Howard, 1996; Yi, 2013). In order to perform an impact
assessment, a complete life-cycle comprising unit processes has to be built in SimaPro. The
36
process of sewage discharge did not really exist. To define it in the software, product output from
the process was set as 1 m3 of wastewater discharge into the nearby lake, with 100% of
contaminants released into the water body while no other inputs were required.
Google Earth Pro was applied for locating the discharge point and measuring distance and
slope. As a result, Lake Ontario has been found to be the nearest discharge site, with a 2 km of
distance and 0.025 of slope from Algoma Orchard.
The dimension of PVC sewer pipe was calculated based on Manning’s Equation:
𝑄 = 1
𝑛× 𝐴 × 𝑅
23 × √𝑆
In which:
Q = volume flow rate (m3/s);
n = Manning's Roughness Coefficient (n = 0.01 for PVC pipe with smooth inner walls);
A = cross sectional area of flow (m2);
R = hydraulic radius (m);
S = slope.
37
𝑅 = 𝐴
𝑃
In which:
P = wetted perimeter (m).
It was assumed the pipe is half-full. The nominal pipe size calculated from the equation
would be rounded to 6 inch if it did not exceed this value, since the minimum size of PVC
underground drainage pipe available on the market is 6 inch according to the European standard
BS EN 752: Drain and sewer systems outside building.
Life-cycle inventory of construction phase was presented by calculating the fuel
consumption of excavation for burying the underground pipeline, with a fuel efficiency of 0.52 L
diesel /m3 soil (Yi, 2013).
3.2.2 Treatment in Local WWTP
Port Darlington Water Pollution Control Plant is the nearest WWTP to Algoma Orchard
and serves the entire Durham Region. Therefore, it was the receiving plant in this case (Port
Darlington Water Pollution Control Plant, 2018). Transport distance, wastewater parameters,
effluent parameters, airborne emission data and energy efficiency data were acquired from the
annual report of Port Darlington Water Pollution Control Plant, monitoring data of Algoma
Orchard and corresponding literatures (Port Darlington Water Pollution Control Plant, 2018;
Monteith et al., 2018; Ahn et al., 2010; Upadhyay et al., 2013; Vaccari et al., 2018). Energy
consumption of wastewater treatment was estimated based on the following equations:
38
𝐸 = 𝑃𝐸 × 𝑒
𝑉
In which:
E = specific energy consumption (kWh/m3);
PE = population equivalent;
e = annual energy consumption per PE (kWh/PE/year);
V = annual flow rate of wastewater (m3/year).
𝑃𝐸 = 𝐵𝑂𝐷 × 𝑣
60 𝑔 · 𝑑−1
In which,
BOD = biological oxygen demand of wastewater (g/m3);
v = daily flow rate of wastewater (m3/day);
60 g·d-1 = the daily emission of BOD considered as one PE.
Sludge generated from the sewage plant is treated on-site by anaerobic digestion, and then
hauled to the Courtice Water Pollution Control Plant for further treatment, where digested sludge
is 100% incinerated. Distance between the two plants was identified to be 10.3 km.
3.2.3 MBR and Tertiary Treatment Technologies
Inventories for all kinds of membrane systems are described together in this section, since
their data collection methods were generally in common.
39
Raw materials consumption of the mechanical components was estimated based on primary
data measured from the industry, including the dimensions, quantities and model numbers of the
tanks, pumps, blowers, valves, rails, pipes and membrane modules. The model numbers were used
for acquiring technical parameters such as power of pumps as well as for estimating the total
weight of each component. LCI of raw materials processing was developed on the basis of
professional databases built in SimaPro.
Construction service was provided by the Altech Technology Systems Inc. Therefore, it
was assumed all components were transported from the construction company to Algoma by truck.
The transport distance was about 75 km as estimated by Google Maps. Life-cycle inventory for
construction was estimated based on the study of Pullen (2000). Construction energy was
displayed as embodied energy which took into account all correlative construction activities
including fuel consumption, commuting and machinery transportation (Pullen, 2000).
The influent and effluent data of wastewater from MBR was gained from the analysis
report of Algoma, which is shown in Table 3.1. Since the wastewater treated by MBR was not
recycled, contaminants within the effluent were counted as emissions to water. The combination
of MBR and tertiary treatments could implement water reuse by removing nearly 99.99% of BOD
and COD, and almost 100% of TSS, TKN and TP according to Algoma’s case study report.
Accordingly, for the MBR + RO + UV system, no contaminant was released into the environment,
while the use of 1 m3 potable water could be avoided from 1 m3 wastewater treated.
40
Table 3.1: Wastewater data of MBR (ALS, 2011)
Influent Effluent
BOD (mg/L) 2550 8.4
COD (mg/L) 8280 95
TSS (mg/L) 2200 < 3.0
TKN (mg/L) 119 0.85
TP (mg/L) 11.8 0.352
There was a lack of data demonstrating airborne emissions generated during the operation
of membrane systems. Data in Table 3.2 were adopted in this study as emissions to technosphere,
which were collected from previous studies aiming at MBR in municipal WWTP done by Ortiz et
al. (2007) and Foley et al. (2010). This assumption involves a degree of uncertainty that will be
addressed in the next chapter. As the operation of RO and UV did not generate any emissions, the
same data were applied on all membrane treatment scenarios.
Table 3.2: Airborne emissions data for MBR operation treating municipal wastewater (Ortiz et al., 2007; Foley et al., 2010)
Emission per 1 m3 WW treated
CO2 0.77 kg
SOx 2.79 g
NOx 1.40 g
NMVOC 0.46 g
Dust 0.72 g
Electricity consumption was estimated based on the power of each mechanical parts, while
the electricity mix of Ontario by fuel type was implemented. Raw sludge was collected weekly by
truck and carried away for treatment. It was assumed all sludge was hauled to the Courtice Water
41
Pollution Control Plant for digestion and incineration based on real practice in the Durham Region
(Courtice Water Pollution Control Plant, 2018). Metal wastes from the decommissioned facility
were assumed to be 100% recycled. Other wastes such as plastics were assumed to be treated by
landfilling. Data of sludge and end-of-life treatments were provided by the SimaPro databases.
3.3 Life-cycle Impact Assessment (LCIA) Methods
Two methods (ReCiPe v1.11 and TRACI v2.1) were chosen for conducting the life-cycle
impact assessment (LCIA) in this study to validate between each other. Descriptions of the
methods are shown in the following sections.
3.3.1 ReCiPe
The characterization factors of ReCiPe method have been originally derived from the
Dutch National Institute for Public Health and the Environment (RIVM) in order to assist
researches conducted on environmental protection in Europe. However, along with an update in
2008, it has been expanded from the European category to Global. The most recent update of
ReCiPe method was done in 2016, which provides assessment at both European and global scales.
Results are presented with different accuracies and complexities at both midpoint (problem-
oriented) and endpoint (damage-oriented) levels. It is available in 3 versions:
42
1) ReCiPe (I): individualist, which considers short-term effects;
2) ReCiPe (H): hierarchist, which provides results regarding time-frame and other issues
based on the most common policies;
3) ReCiPe (E): egalitarian, which considers long-term effects.
The midpoint assessment consists of 18 categories focusing on single environmental
problems including Climate Change, Stratospheric Ozone Depletion, Ionizing Radiation, Ozone
Formation (human health), Fine Particulate Matter Formation, Ozone Formation (terrestrial
ecosystems), Terrestrial Acidification, Freshwater Eutrophication, Marine Eutrophication,
Terrestrial Ecotoxicity, Freshwater Ecotoxicity, Marine Ecotoxicity, Human Carcinogenic
Toxicity, Human Non-carcinogenic Toxicity, Land Use, Mineral Resource Scarcity, Fossil
Resource Scarcity, and Water Use (PRé, 2018). At this level, the quantified impacts are given with
relatively higher accuracies as well as higher complexities, which require interpretations in detail
to be fully understood. Endpoint category simplifies the midpoints by multiplying damage factors
which makes single environmental impacts aggregated into three categories. It provides more
straightforward results, but higher uncertainty could not be avoided. In this case, the ReCiPe
Midpoint (H) at world scale with a 100-year time frame was chosen for generating results with
higher accuracy.
43
3.3.2 TRACI
The Tool for the Reduction and Assessment of Chemical and other environmental Impacts
(TRACI) is developed by the U.S. Environmental Protection Agency (EPA), which is a site-
specific LCIA methodology at midpoint level, with time frame of 100 years. The characterization
factors applied in this methodology was originally generated based on the investigation in America.
In 2002, the initial version of TRACI was released and followed by an updated to TRACI 2.0 in
2011. Now the latest version is TRACI 2.11, which was published in 2012. Due to the similarity
of conditions between Canada and America, this methodology is able to be implemented in Canada
as well. There are 10 main impact categories in this methodology, which are: Ozone Depletion,
Global Warming, Smog, Acidification, Eutrophication, Carcinogenics, Non-carcinogenics,
Respiratory Effects, Ecotoxicity, and Fossil Fuel Depletion (PRé, 2018).
3.3.3 Impact Categories
In order to present a comprehensive result of impact assessment, all impact categories
involved in the methods have been selected, with more attention paid to the environmental hot
spots. As shown in Table 3.3, the classification methods of impact categories are slightly different
between the two methods, but some of them could be discussed together since they represent the
same content. In this section, the specific approaches chosen for quantifying the impacts of each
category in both LCIA methods are demonstrated.
44
Table 3.3 Classification of the impact categories in ReCiPe and TRACI
ReCiPe TRACI
Climate Change (kg CO2 eq) Global Warming (kg CO2 eq)
Ozone Depletion (kg CFC-11 eq) Ozone Depletion (kg CFC-11 eq)
Photochemical Oxidant Formation (kg NOx eq) Smog (kg O3 eq)
Freshwater Eutrophication (kg P eq)
Marine Eutrophication (kg N eq)
Eutrophication (kg N eq)
Terrestrial Acidification (kg SO2 eq) Acidification (kg SO2 eq)
Human toxicity (kg 1,4-DCB eq) Carcinogenics (CTUcancer)
Non-Carcinogenics (CTUnoncancer)
Terrestrial ecotoxicity (kg 1,4-DCB eq)
Freshwater ecotoxicity (kg 1,4-DCB eq)
Marine ecotoxicity (kg 1,4-DCB eq)
Ecotoxicity (CTUeco)
Particulate Matter Formation (kg PM2.5 eq) Respiratory Effects (kg PM2.5 eq)
Fossil Depletion (kg oil eq) Fossil Fuel Depletion (MJ surplus)
Agricultural Land Occupation (m2)
Urban Land Occupation (m2)
Natural Land Transformation (m2)
Water Depletion (m3)
Metal Depletion (kg Fe eq)
Ionising Radiation (kg Uranium 235 eq)
3.3.3.1 Climate Change/ Global Warming
Climate change is one of the major concerns across the world nowadays. Since 1880, global
temperature has increased by 1.8°F according to NASA’s statistics. It is mainly caused by
greenhouse gas emissions mainly including CO2, CH4, and N2O. Within the processes of material
extraction, component production, transportation, system assembly and operation, large amount of
fuel and electricity are consumed, which leads to the emission of greenhouse gases.
45
The same method is applied for analyzing global warming effects in both ReCiPe and
TRACI, which is based on the report from The Intergovernmental Panel on Climate Change
(IPCC). In the most recent version, 207 greenhouse gases were identified. Results are quantified
by the calculation of global warming potential, which is in the unit of kg CO2 equivalent (eq.) A
hierarchy of data sources is applied as consistent international practice.
3.3.3.2 Ozone Depletion
The ozone layer surrounds the earth surface preventing most of the harmful ultraviolet light
passing through the atmosphere. Ozone depletion is a joint designation made up of two phenomena,
namely the thickening of ozone layer and the appearance of stratospheric ozone hole. This could
impair the protection of the ozone layer, which leads to increase of UV passing through atmosphere.
Accordingly, many negative effects will occur such as biodiversity reduction and higher risk of
skin cancer. The main reason of man-made ozone depletion is the emission of ozone-depleting
substances (ODS) mainly including halocarbon refrigerants, solvents, propellants, and foam-
blowing agents.
In ReCiPe, kg CFC-11 eq. was adopted to quantify the impacts of ODS anthropogenically
released into atmosphere (PRé, 2018). Ozone depletion potentials (ODPs) were used as indicators
in TRACI, which was proposed by the World Meteorological Organization (WMO). The most
recent version of ODPs list maintained by the US EPA was applied for each substance (Bare, 2012).
3.3.3.3 Eutrophication
Eutrophication is caused by excessive nutrients such as nitrogen and phosphorous in water
46
bodies that leads to drastic growth of plants and algae. Dissolved oxygen in the affected water will
reduce significantly, which is negative for the aquatic systems. Now, this issue is raising significant
awareness worldwide. It was focused as a major concern in this study due to the high organic,
nitrogen and phosphorus contents in fruit processing sewage.
The ReCiPe method divided this impact into two categories – freshwater eutrophication
and marine eutrophication. The method simulating freshwater eutrophication impacts mainly
focused on the fate of P containing nutrients, while for marine eutrophication, N containing
nutrients are the main objective. Therefore, the units of characterization factors were kg P to
freshwater eq. and kg N to marine eq. respectively. The models applied were based on the state-
of-the-art global fate of each substance instead of European fate models (PRé, 2018). In contrast,
TRACI has aggregated all kinds of eutrophication impacts into one category represented by kg N
eq. It was notable that in the current version of TRACI, site-specific factors originally supported
in early versions such as slope and precipitation were not available. Instead, additional
contaminants potentially causing eutrophication impacts were added (Bare, 2012).
3.3.3.4 Acidification
Acidification is a phenomenon of growing concentration of hydrogen ion (H+) within an
area, through either air or water. The major acidification sources include nitric acid, sulfuric acid
and ammonia, which raise the acidity in the environment by multiple kinds of chemical or
biological reactions and further impair the buildings, water bodies, plants, animals, etc. (Bare,
2012).
Acidification Potential (AP) in the unit of kg SO2 eq. was adopted in both methods to
47
describe the effects of acidification causing substances. In TRACI, the model developed by
Wenzel et al. (1999) was used for calculation, with only incorporation of AP in the environment
instead of site-specific characteristics such as the buffering capability of local eco-system (PRé,
2018). The AP in the ReCiPe method was counted as the emission weighted world average fate
factor of SO2 as introduced in the manual book, while no specific model was informed (Bare,
2012).
3.3.3.5 Human Toxicity and Ecotoxicity
Potential toxicity to human health and eco-system caused by the persistence and
accumulation of toxic substances such as polychlorinated biphenyls (PCBs) could impair the life
and health of human beings in the long term. Classification methods of impact categories
concerning human and eco- toxicities were much different in the two methods.
Ecotoxicity was divided into three subsets in ReCiPe including terrestrial, freshwater and
marine ecotoxicity, while human toxicity was not subdivided. The model applied in the newest
ReCiPe method was the Uniform System for the Evaluation of Substances adapted for LCA
(USES-LCA) version 3.0 updated from the work done by Van Zelm et al. (2009), in which USEtox
database including 3094 substances was implemented. In order to simplify the results, only liner
factors associated with the fate and accumulation of substances in the human food chain, and their
toxicities were considered. Results were presented in the unit of kg 1,4-dichlorobenzeen (1,4-DCB)
emitted.
In TRACI, human toxicity was divided into carcinogenic and non-carcinogenic effects,
while there was only one category for ecotoxicity. USEtox model was selected to quantify the
48
three categories, for which the recommended comparative toxic units were CTUcancer,
CTUnoncancer and CTUeco respectively (Bare, 2012). Although the carcinogenic and non-
carcinogenic impacts could be combined together according to USEtox guidance, it was
recommended to keep them separately in TRACI.
3.3.3.6 Photochemical Oxidant Formation/ Smog
Ground level ozone occurs from chemical reactions between nitrogen oxides (NOx),
volatile organic compounds (VOCs) and sunlight. The product of such reactions is known as
photochemical oxidant or photochemical smog, which is harmful to the ecosystem and respiratory
health, especially for seniors and children. Contaminants are typically derived from industrial,
vehicular and fuel combustion emissions, which is very common in electricity generation and
transportation.
Characterization factors in ReCiPe were derived from the research of Van Zelm et al.
(2016), which considered the emission and atmospheric fate of NOx and non-methane volatile
organic compounds (NMVOCs). The unit of kg NOx eq. was adopted for quantification. In the
most recent ReCiPe version, the European factor was replaced by a world average factor.
CML 2002 characterization factors for smog formation were adopted in TRACI since they
were developed on the basis on US conditions and thus recommended by the US EPA and
individual states within America (Bare, 2012). The modeling of CML 2002 considered
photochemical ozone creation potentials (POCPs) and maximum incremental reactivity (MIR) of
substances, the full list of which originally covered 128 and nearly 1200 substances respectively.
With the development of TRACI, the MIRs were updated to the latest version of 2010 (Bare, 2012).
49
3.3.3.7 Particulate Matter Formation/ Respiratory Effects
Particulate matter is a mixture of small solid or liquid particles suspended in ambient air
which could damage the respiratory system of human beings. Although this is one of the human
health criteria pollutants category, it was always taken apart as an individual category as done in
the two methods. Particulate matter is classified into two major groups, namely inhalable coarse
particles (particles between 2.5 and 10 µm in diameter) and fine particles (particles 2.5 µm or less
in diameter).
The same research as conducted by Van Zelm et al. (2016) on photochemical oxidant
formation was consulted in ReCiPe to address the impacts of particulate matter formation, and the
results were presented in the unit of kg PM2.5 eq. The modeling covered from emission of primary
sources (NOx, NH3, SO2 or PM2.5), through atmospheric fate and chemistry, human inhale,
mortality and finally the damage to human health (Huijbregts et al., 2017).
IMPACT North America, a site-specific model developed for North America, was
implemented in TRACI to address the damage of particulate matter (Humbert, 2009). It took into
consideration the fate of contaminants and human intake fractions, with the latter a function of the
amount of pollutants released into the atmosphere, the resulting increase of pollutants
concentration in air and the inhaling rate of the exposed population. The growth of air
concentrations was directly related to the local background concentrations which might affect
secondary particle formation (Bare, 2012). Results were characterized using PM2.5 eq.
50
3.3.3.8 Other Effects
ReCiPe also provides the assessments of land occupation, natural land transformation,
resource depletion and ionising radiation. Results of land and resource depletion were
characterized based on the amount (m2 or m3) of land or resource depleted per year, while the unit
of ionising radiation effects was kg Uranium 235 eq. (PRé, 2018). In the current version of TRACI,
only the fossil depletion model was included. As addressed by the developer, resource depletion
is one of the most difficult issues to quantify. They will keep updating models for land and water
use over the next few years (Bare, 2012).
3.3.4 Normalization
Normalization was performed in this study based on the reference values provided in both
ReCiPe and TRACI methods to determine the environmental hot spots and explore the most
significant impact categories.
Normalization factors in the ReCiPe method were obtained based on the study of Sleeswijk
et al. (2008), who have chosen the year 2000 as the reference year. At global level, which is the
spatial condition defined in this study, the world’s total characterized values of the reference year
for each impact category were adopted as normalization factors. In SimaPro, the normalization
figures of ReCiPe are recalculated per citizen. At global level, the world’s population was assumed
to be 6,055,000,000 (PRé, 2014). Normalization factors adopted in the TRACI method were
gathered from the study of Ryberg et al. (2014). The Canada 2005 normalization factors were
applied, which represents the average impact of a Canadian citizen per year (Ryberg et al., 2014).
51
3.4 Sensitivity Analysis
In LCA, the selection of data and methods brings uncertainty to the final results.
Uncertainty analysis is recommended by the ISO 14040 and ISO 14044 to improve the robustness
of an LCA (ISO, 2006). Sensitivity analysis, as an important tool that can determine the influence
of data uncertainties on the results, was conducted in this study. The data sources and main
uncertainties are summarized in Table 3.4.
Table 3.4: Data sources and uncertainties
Data quality and sources Uncertainties
Raw materials Primary data from the industry Measurement errors
Materials processing Secondary data from databases Temporal, technological and
geographical errors
Transportation Secondary data from databases and
estimation
Temporal and geographical
errors
Construction Secondary data from databases,
literatures and estimation
Temporal, technological and
geographical errors
Operation Primary data
Secondary data from literatures and
databases
Measurement errors
Temporal and technological
errors
Sludge treatment Primary data
Secondary data from literatures,
reports, databases and estimation
Temporal, technological and
geographical errors
End-of-life Secondary data from databases,
literatures and assumptions
Temporal, technological and
geographical errors
52
To comprehensively assess the influence of data uncertainties related to all inputs, each
scenario has been divided into several phases, namely raw materials extraction and processing,
construction, transportation (including maintenance), operation, and sludge treatment. A ±20%
disturbance was given to all data inputs within each phase according to a previous study
(Tangsubkul et al., 2005). The changes of total impacts were displayed to show the influence of
data uncertainty on each phase.
In addition to the data sorted by life cycle phases, the influence of uncertainties related to
some important assumptions was also analyzed. Table 3.5 shows the data or scenarios included in
the sensitivity analysis as well as their alternatives. Notably, based on the literature review, sludge
treatment was found to be an important phase affecting the total environmental impact of
wastewater treatment systems. The sludge management scenario defined in this study was selected
to be incineration after anaerobic digestion according to real practice in the Durham region
(Courtice Water Pollution Control Plant, 2018). There are many other ways for managing sewage
sludge such as land application and landfilling, which are different from each other. Unfortunately,
there is a lack of database describing the land application and landfilling of sewage sludge.
Therefore, sensitivity analysis for sludge treatment alternatives was not included in this study.
53
Table 3.5 Sensitivity analysis for specific assumptions
Baselines Alternatives
Airborne emission data of MBR
operation
CO2 (kg/m3)
SOx (g/m3)
NOx (g/m3)
NMVOC (g/m3)
Dust (g/m3)
0.77
2.79
1.40
0.46
0.72
(Ortiz et al., 2007; Foley et
al., 2010)
+20% -20%
0.924 0.616
3.348 2.232
1.68 1.12
0.552 0.368
0.864 0.576
End-of-life disposal Metals: 100% recycling
Plastics: 100% landfilling
(1) Metals: 100% landfilling
Plastics: 100% landfilling
(2) Metals: 100% recycling
Plastics: 100% incineration
(3) Metals: 100% landfilling
Plastics: 100% incineration
54
4 Results and Discussion
In order to make the results more comprehensive and mitigate uncertainties related to LCIA
methods, LCI were assessed by both ReCiPe and TRACI methods instead of single formula, and
all impact categories available in the methods were selected as shown in Table 3.3. The outcomes
of LCIA were generated at mid-point level that did not take into account the long-term effects with
time frames more than 100 years. This was mainly because the 100-year time frame was defined
based on the most common policy principles (PRé, 2018), and uncertainties might increase with
the extension of time horizons. In this chapter, LCIA results obtained from the two methods are
interpreted separately. Then the major result discrepancies between the two methods are compared
and discussed to validate the reliability of outcomes.
4.1 ReCiPe
Using the ReCiPe method, the environmental impacts associated to the four scenarios were
specified into 18 categories [Climate Change (CC), Ozone Depletion (OD), Terrestrial
Acidification (TA), Freshwater Eutrophication (FEP), Marine Eutrophication (MEP), Human
Toxicity (HT), Photochemical Oxidant Formation (POF), Particulate Matter Formation (PMF),
Terrestrial Ecotoxicity (TE), Freshwater Ecotoxicity (FET), Marine Ecotoxicity (MET), Ionizing
Radiation (IR),Agricultural Land Occupation (ALO), Urban Land Occupation (ULO), Natural
Land Transformation (NLT), Water Depletion (WD), Metal Depletion (MD), Fossil Depletion
(FD)] (PRé, 2018). Figure 4.1 shows the comparison of quantified impacts by showing the ratio
of each scenario to the one with greatest damage, with negative values representing net profits to
the corresponding category.
55
In general, discharge into lake without treatment had enormous eutrophication impact
compared to other scenarios, with 0.12 kg N eq. and 0.012 kg P eq. per 1 m3 wastewater discharged.
The significance of this impact was shown in a more intuitive way in Figure 4.2, which shows the
normalization results based on the average impact of one person over the world population. By
simply discharging 1 m3 of wastewater into the surrounding water bodies, freshwater
eutrophication and marine eutrophication were increased by more than 4 and 1.6% per capita
respectively, which was much greater than the increase in other categories. Nevertheless, minor
impacts were noticed on other categories such as global warming and ecotoxicity, which was
justifiable as few materials and energy were required during direct discharge process.
Figure 4.1: Comparison of characterization results of the four scenarios using ReCiPe
-100%
-80%
-60%
-40%
-20%
0%
20%
40%
60%
80%
100%
CC OD TA FEP MEP HT POF PMF TE FET MET IR ALO ULO NLT WD MD FD
ReCiPe Midpoint (H) V1.11 / World Recipe H / Characterization / Excluding long-term emissions
MBR MBR+RO+UV Direct Discharge Treating in WWTP
No
rmal
ized
rat
io t
o t
he
hig
hes
t im
pac
t
Climate Change (CC), Ozone Depletion (OD), Terrestrial Acidification (TA), Freshwater Eutrophication (FEP), Marine Eutrophication
(MEP), Human Toxicity (HT), Photochemical Oxidant Formation (POF), Particulate Matter Formation (PMF), Terrestrial Ecotoxicity (TE), Freshwater Ecotoxicity (FET), Marine Ecotoxicity (MET), Ionizing Radiation (IR),Agricultural Land Occupation (ALO), Urban
Land Occupation (ULO), Natural Land Transformation (NLT), Water Depletion (WD), Metal Depletion (MD), Fossil Depletion (FD)
56
Eutrophication could be effectively mitigated by treating wastewater using MBR or
disposing of wastewater in WWTP instead of direct discharge. However, treating wastewater in
municipal WWTP had the most significant impact when compared to almost all other categories.
Comparing to this, MBR was proved to be a more environmental friendly approach with 12, 26,
28, 29, 20, and 60% impact reduction in climate change, ozone depletion, human toxicity,
photochemical oxidant formation, particulate matter formation and ecotoxicity, respectively.
According to Figure 4.1, MBR combined with tertiary treatment processes was identified
as the best scenario as predicted in ReCiPe since it had the lowest impacts in most categories
Figure 4.2: Comparison of normalization results of the four scenarios using ReCiPe
-0.005
0
0.005
0.01
0.015
0.02
0.025
0.03
0.035
0.04
0.045
CC OD TA FEP MEP HT POF PMF TE FET MET IR ALO ULO NLT WD MD FD
No
rmal
ized
rat
io t
o t
he
no
rmal
izat
ion
fac
tor
-u
nit
less
ReCiPe Midpoint (H) V1.11 / World Recipe H / Normalization / Excluding long-term emissions
MBR MBR+RO+UV Direct Discharge Treating in WWTP
Climate Change (CC), Ozone Depletion (OD), Terrestrial Acidification (TA), Freshwater Eutrophication (FEP), Marine Eutrophication
(MEP), Human Toxicity (HT), Photochemical Oxidant Formation (POF), Particulate Matter Formation (PMF), Terrestrial Ecotoxicity (TE), Freshwater Ecotoxicity (FET), Marine Ecotoxicity (MET), Ionizing Radiation (IR),Agricultural Land Occupation (ALO), Urban
Land Occupation (ULO), Natural Land Transformation (NLT), Water Depletion (WD), Metal Depletion (MD), Fossil Depletion (FD)
57
except metal depletion. Some net environmental offsets were also revealed in natural land
transformation and water depletion. Especially in the water depletion category, huge benefits were
generated because all treated wastewater was recycled. Compared to solely implementing MBR,
MBR combined with tertiary treatments could mitigate 28, 44, 33, 20, 21, 38 and 20% impacts in
climate change, ozone depletion, acidification, human toxicity, photochemical oxidant formation,
particulate matter formation and ecotoxicities, respectively. This was mainly due to the equal
amount of water saved from water reuse. Meanwhile, eutrophication risk was reduced to a
negligible level because of the high treatment efficiency of membrane systems, which released
only 6.7 × 10⁻⁴ kg N eq. and 3.8 × 10⁻⁵ kg P eq. to the aquatic system per 1 m3 wastewater treated.
Figure 4.3 shows the contribution of processes within the system boundary in direct
discharge scenario. Almost all eutrophication risks were caused by the discharge of wastewater
with high pollutant load. Materials extraction and processing turned out to be the most important
phase affecting the other categories, which contributed more than 90% to climate change,
acidification, human toxicity, photochemical oxidants, particulate matter, agricultural land
occupation and resources depletion, and more than 60% to ecotoxicity and metal depletion. The
construction of sewer pipes was another important factor, especially in ozone depletion and
ionizing radiation, where 60 and 90% of total impacts were caused by the pipeline installation.
Transportation and end-of-life treatment did not play an important role in this scenario, while the
latter could slightly benefit the natural land transformation.
58
The impact constitution of treating sewage in a municipal WWTP is shown in Figure 4.4.
As the infrastructure of WWTP was excluded from the system boundary, only the materials
acquisition, transportation, operation, sludge treatment and end-of-life disposal were presented.
Transportation, operation, and sludge disposal turned out to be the most important phases. Due to
the frequent conveyance of a large amount of sewage, transportation contributed to nearly 30% in
most categories, and more than 60% in terrestrial ecotoxicity, marine ecotoxicity and land
occupation. More than 85% of the eutrophication and ionizing radiation risks were caused by the
operation of WWTP because of the electricity consumption and residual contaminants discharged.
Operation of the WWTP also caused nearly 20% of the damage to climate change and fresh water
Figure 4.3: Process contribution to impact categories for direct discharge scenario using ReCiPe
-20%
0%
20%
40%
60%
80%
100%
CC OD TA FEP MEP HT POF PMF TE FET MET IR ALO ULO NLT WD MD FD
ReCiPe Midpoint (H) V1.11 / World Recipe H / Characterization / Excluding long-term emissions
Materials Construction Transportation Sewage Discharge End-of-life
Climate Change (CC), Ozone Depletion (OD), Terrestrial Acidification (TA), Freshwater Eutrophication (FEP), Marine Eutrophication (MEP), Human Toxicity (HT), Photochemical Oxidant Formation (POF), Particulate Matter Formation (PMF), Terrestrial Ecotoxicity
(TE), Freshwater Ecotoxicity (FET), Marine Ecotoxicity (MET), Ionizing Radiation (IR),Agricultural Land Occupation (ALO), Urban
Land Occupation (ULO), Natural Land Transformation (NLT), Water Depletion (WD), Metal Depletion (MD), Fossil Depletion (FD)
No
rmal
ized
rat
io t
o t
he
hig
hes
t im
pac
t
59
eco-system, and almost 50% to ozone depletion, which were all environmental hotspots. The
sludge treatment phase was also a significant contributor, with more than 50% contribution to
climate change, acidification, human toxicity, particulate matter formation, photochemical oxidant
formation and fresh water ecotoxicity. Marginal benefits were gained from the end-of-life
recycling of the stainless-steel in the primary screen, while materials only contributed few impacts
to metal depletion.
Figure 4.4: Process contribution to impact categories for treating wastewater in municipal WWTP scenario using ReCiPe
-20%
0%
20%
40%
60%
80%
100%
CC OD TA FEP MEP HT POF PMF TE FET MET IR ALO ULO NLT WD MD FD
ReCiPe Midpoint (H) V1.11 / World Recipe H / Characterization / Excluding long-term emissions
Materials Transportation Operation Sludge Treatment End-of-life
Climate Change (CC), Ozone Depletion (OD), Terrestrial Acidification (TA), Freshwater Eutrophication (FEP), Marine Eutrophication
(MEP), Human Toxicity (HT), Photochemical Oxidant Formation (POF), Particulate Matter Formation (PMF), Terrestrial Ecotoxicity
(TE), Freshwater Ecotoxicity (FET), Marine Ecotoxicity (MET), Ionizing Radiation (IR),Agricultural Land Occupation (ALO), Urban Land Occupation (ULO), Natural Land Transformation (NLT), Water Depletion (WD), Metal Depletion (MD), Fossil Depletion (FD)
No
rmal
ized
rat
io t
o t
he
hig
hes
t im
pac
t
60
Other than treating wastewater in WWTP, the influence of transportation in the MBR
system was not significant. Sludge treatment was found as one of the most important phases in
MBR as well, as it was the greatest contributor in 10 out of 18 categories as illustrated in Figure
4.5. Although it brought a few benefits to natural land transformation, it caused considerable
damage to other important environmental issues especially the human toxicity and ecotoxicity.
Like the results of treating sewage in WWTP, the impacts on eutrophication and ionizing radiation
were mainly caused by system operation. However, thanks to the higher treatment efficiency of
MBR, 15% P eq. and 80% N eq. could be mitigated compared to the WWTP. Although materials
extraction and processing was not a significant factor in MBR, its proportion in many categories
has increased compared to the WWTP scenario. In some categories such as ozone depletion,
particulate matter formation and marine ecotoxicity, its contribution could reach nearly 20%,
which was not negligible.
61
Figure 4.6 shows the results of MBR + RO + UV system. Because of the high removal
efficiency and water reuse achieved by tertiary technologies, the operation phase could bring net
benefits to eutrophication, human toxicity, respiratory effects, ecotoxicity and resources depletion.
The influence of operation in other categories was also decreased to a minor level, with only a 10%
contribution in climate change and ozone depletion. Sludge disposal was especially important in
the tertiary treatment scenario, with the largest contribution in 15 out of 18 categories. However,
sludge could be generated either from MBR or WWTP, which is not a specific issue related to the
application of RO and UV. Therefore, implementing tertiary technologies would be a
recommended approach to mitigating environmental footprints.
Figure 4.5: Process contribution to impact categories for MBR scenario using ReCiPe
-60%
-40%
-20%
0%
20%
40%
60%
80%
100%
CC OD TA FEP MEP HT POF PMF TE FET MET IR ALO ULO NLT WD MD FD
ReCiPe Midpoint (H) V1.11 / World Recipe H / Characterization / Excluding long-term emissions
Materials Construction Transportation Operation Sludge Treatment End-of-life
Climate Change (CC), Ozone Depletion (OD), Terrestrial Acidification (TA), Freshwater Eutrophication (FEP), Marine Eutrophication (MEP), Human Toxicity (HT), Photochemical Oxidant Formation (POF), Particulate Matter Formation (PMF), Terrestrial Ecotoxicity
(TE), Freshwater Ecotoxicity (FET), Marine Ecotoxicity (MET), Ionizing Radiation (IR),Agricultural Land Occupation (ALO), Urban Land Occupation (ULO), Natural Land Transformation (NLT), Water Depletion (WD), Metal Depletion (MD), Fossil Depletion (FD)
No
rmal
ized
rat
io t
o t
he
hig
hes
t im
pac
t
62
4.2 TRACI
Other than the characterization and normalization factors in ReCiPe developed on the basis
of world condition, TRACI provides assessments suitable for North America. Ten impact
categories are provided in TRACI [Ozone Depletion (OD), Global Warming (GW), Smog (SM),
Acidification (AC), Eutrophication (EU), Carcinogenics (CA), Non-carcinogenics (NC),
Respiratory Effects (RE), Ecotoxicity (ET), and Fossil Fuel Depletion (FD)] (PRé, 2018). The
comparison of characterized results is displayed in Figure 4.7.
Figure 4.6: Process contribution to impact categories for MBR+RO+UV scenario using ReCiPe
-100%
-80%
-60%
-40%
-20%
0%
20%
40%
60%
80%
100%
CC OD TA FEP MEP HT POF PMF TE FET MET IR ALO ULO NLT WD MD FD
ReCiPe Midpoint (H) V1.11 / World Recipe H / Characterization / Excluding long-term emissions
Materials Construction Transportation Operation Sludge Treatment End-of-life
Climate Change (CC), Ozone Depletion (OD), Terrestrial Acidification (TA), Freshwater Eutrophication (FEP), Marine Eutrophication
(MEP), Human Toxicity (HT), Photochemical Oxidant Formation (POF), Particulate Matter Formation (PMF), Terrestrial Ecotoxicity
(TE), Freshwater Ecotoxicity (FET), Marine Ecotoxicity (MET), Ionizing Radiation (IR),Agricultural Land Occupation (ALO), Urban Land Occupation (ULO), Natural Land Transformation (NLT), Water Depletion (WD), Metal Depletion (MD), Fossil Depletion (FD)
No
rmal
ized
rat
io t
o t
he
hig
hes
t im
pac
t
63
In the TRACI method, the eutrophication impacts on different aquatic systems were
aggregated into one single category, where the damage of direct discharge scenario was much
higher than other treatment options. The normalized impacts in TRACI were related to the average
impact of a Canadian citizen per year, as illustrated in Figure 4.8. About 4.5% N eq. per capita
would be increased by 1 m3 of wastewater discharged. So in general, there would be a severe
hazard if the industries discharge wastewater directly into the environment without management.
Impacts on carcinogenic effects caused by the treatment scenarios should also be noticed. The
MBR scenario turned out to be the least environmentally friendly regarding carcinogenic effects,
with more than 1% CTUcancer raised per citizen per year, followed by MBR+RO+UV (0.9%) and
treating sewage in WWTP (0.8%).
Figure 4.7: Comparison of characterization results of the four scenarios using TRACI
0%
10%
20%
30%
40%
50%
60%
70%
80%
90%
100%
OD GW SM AC EU CA NC RE ET FD
TRACI 2.1 V1.02 / Canada 2005 / Characterization / Excluding long-term emissions
MBR MBR+RO+UV Direct Discharge Treating in WWTP
Ozone Depletion (OD), Global Warming (GW), Smog (SM), Acidification (AC), Eutrophication (EU), Carcinogenics
(CA), Non-carcinogenics (NC), Respiratory Effects (RE), Ecotoxicity (ET), and Fossil Fuel Depletion (FD)
No
rmal
ized
rat
io t
o t
he
hig
hes
t im
pac
t
64
Apart from the eutrophication and carcinogenic categories, treating wastewater in WWTP
turned out to be the worst option among the three treatment scenarios according to Figure 4.7, as
it caused greater damage compared to membrane systems. In comparison with the WWTP scenario,
implementing MBR could reduce 40, 30, 35, 50% of damage in ozone depletion, smog formation,
ecotoxicity and fossil depletion, respectively, and around 10% in the other categories. However, it
brought 25% more carcinogenic effects, with 1.88 × 10⁻⁷ CTUcancer per functional unit. If
combined with tertiary treatments, 30% more damage could be reduced in global warming,
acidification and respiratory effects.
Figure 4.8: Comparison of normalization results of the four scenarios using TRACI
0
0.005
0.01
0.015
0.02
0.025
0.03
0.035
0.04
0.045
0.05
OD GW SM AC EU CA NC RE ET FD
No
rmal
ized
rat
io t
o t
he
no
rmal
izat
ion
fac
tor
-u
nit
less
TRACI 2.1 V1.02 / Canada 2005 / Characterization / Excluding long-term emissions
MBR MBR+RO+UV Direct Discharge Treating in WWTP
Ozone Depletion (OD), Global Warming (GW), Smog (SM), Acidification (AC), Eutrophication (EU), Carcinogenics
(CA), Non-carcinogenics (NC), Respiratory Effects (RE), Ecotoxicity (ET), and Fossil Fuel Depletion (FD)
65
The impact constitution of direct discharge scenario using TRACI method is presented in
Figure 4.9. It can be seen that materials were the largest source of impacts in most categories, with
more than 90% contribution to global warming, smog formation, acidification, carcinogenic, non-
carcinogenic, fine particulate matter and fossil depletion, as well as 60% contribution to
ecotoxicity. Construction of sewer pipes contributed more than 95% to ozone depletion, while all
eutrophication impacts were caused by the contaminants released. The influence of transportation
and end-of-life disposal was not significant, with only 10% contribution to ecotoxicity.
Figure 4.9: Process contribution to impact categories for direct discharge scenario using TRACI
0%
10%
20%
30%
40%
50%
60%
70%
80%
90%
100%
OD GW SM AC EU CA NC RE ET FD
TRACI 2.1 V1.02 / Canada 2005 / Characterization / Excluding long-term emissions
Materials Construction Transportation Sewage Discharge End-of-life
Ozone Depletion (OD), Global Warming (GW), Smog (SM), Acidification (AC), Eutrophication (EU), Carcinogenics
(CA), Non-carcinogenics (NC), Respiratory Effects (RE), Ecotoxicity (ET), and Fossil Fuel Depletion (FD)
No
rmal
ized
rat
io t
o t
he
hig
hes
t im
pac
t
66
Process contribution of the scenario treating wastewater in centralized WWTP is shown in
Figure 4.10. Sludge treatment is the primary process that should be noticed. It was the most
significant contributor in 7 out of 10 impact categories. Especially for the environmental hotspots,
carcinogenic and non-carcinogenic impacts, sludge treatment contributed to 93% and 80%
respectively. Due to the frequent transport of wastewater and sludge between the industry and
wastewater treatment plant, transportation turned out to be the second important unit process.
Compared to the two major processes above, the other unit processes were less important. The
contribution of activities related to raw materials and end-of-life disposal was negligible because
minor infrastructure was required in this scenario. The operation phase contributed to more than
40% of total impacts in ozone depletion and eutrophication categories. Therefore, reducing
electricity consumption and improving the removal efficiency of the contaminants would be an
effective way to mitigate ozone depletion and eutrophication impacts.
67
Figure 4.11 shows the process contribution of the MBR scenario. Consistent with treating
wastewater in WWTP, primary attention should be paid to the sludge treatment. It was the most
important process in 80% impact categories. Especially in the environmental hotspots, it
contributed to 70% in carcinogenic and 88% in noncarcinogenic impacts respectively.
Transportation was, however, the least important process in this scenario due to the minor
conveyance required. Regarding the process of materials extraction and processing, it was the
second contributor to human health impacts and ecotoxicity due to the high amount of materials
Figure 4.10 Process contribution to impact categories for treating wastewater in municipal WWTP scenario using TRACI
-20%
0%
20%
40%
60%
80%
100%
OD GW SM AC EU CA NC RE ET FD
TRACI 2.1 V1.02 / Canada 2005 / Characterization / Excluding long-term emissions
Materials Transportation Operation Sludge Treatment End-of-life
Ozone Depletion (OD), Global Warming (GW), Smog (SM), Acidification (AC), Eutrophication (EU), Carcinogenics
(CA), Non-carcinogenics (NC), Respiratory Effects (RE), Ecotoxicity (ET), and Fossil Fuel Depletion (FD)
No
rmal
ized
rat
io t
o t
he
hig
hes
t im
pac
t
68
required in the MBR system. However, in the other impact categories, the impacts caused by
materials were not significant. The operation phase was another critical process should be drawn
attention. It was the most crucial process in ozone depletion (59%) and eutrophication (79%),
while it also had significant impacts on global warming, smog and acidification. The end-of-life
disposal could bring slight benefits to the environment due to the recycling and proper treatment
of deconstructed materials.
Figure 4.11 Process contribution to impact categories for MBR scenario using TRACI
-20%
0%
20%
40%
60%
80%
100%
OD GW SM AC EU CA NC RE ET FD
TRACI 2.1 V1.02 / Canada 2005 / Characterization / Excluding long-term emissions
Materials Construction Transportation Operation Sludge Treatment End-of-life
Ozone Depletion (OD), Global Warming (GW), Smog (SM), Acidification (AC), Eutrophication (EU), Carcinogenics
(CA), Non-carcinogenics (NC), Respiratory Effects (RE), Ecotoxicity (ET), and Fossil Fuel Depletion (FD)
No
rmal
ized
rat
io t
o t
he
hig
hes
t im
pac
t
69
Figure 4.12 illustrates the process contribution of the MBR + RO + UV scenario. Same as
the other treatment options, sludge treatment was the most crucial phase among all unit processes.
It was the most significant contributor in 9 out of 10 impact categories, with dominant
contributions. Implementing water reuse technologies could bring significant benefits to the
environment according to the contribution of the operation phase. Compared to the MBR scenario,
the environmental impacts of operation significantly reduced, and even showed net benefits in
some impact categories such as eutrophication, human health effects, ecotoxicity and fossil
depletion. However, it still contributed to 50% of total impacts in ozone depletion. Consistent with
the MBR scenario, materials extraction and processing was the second important phase, while
impacts of the other phases were negligible.
Figure 4.12 Process contribution to impact categories for MBR+RO+UV scenario using TRACI
-60%
-40%
-20%
0%
20%
40%
60%
80%
100%
OD GW SM AC EU CA NC RE ET FD
TRACI 2.1 V1.02 / Canada 2005 / Characterization / Excluding long-term emissions
Materials Construction Transportation Operation Sludge Treatment End-of-life
Ozone Depletion (OD), Global Warming (GW), Smog (SM), Acidification (AC), Eutrophication (EU), Carcinogenics
(CA), Non-carcinogenics (NC), Respiratory Effects (RE), Ecotoxicity (ET), and Fossil Fuel Depletion (FD)
No
rmal
ized
rat
io t
o t
he
hig
hes
t im
pac
t
70
4.3 Life Cycle Impact Assessment Comparisons
Implementing multiple LCIA methods could support the results from different aspects and
allow practitioners to evaluate the reliability of models. In this section, the life-cycle impacts
predicted by the two methods (ReCiPe v1.11 and TRACI v2.1) are compared to draw robust
conclusions for the intended audiences. Table 4.1 summarizes the characterization results of the
four scenarios obtained from the two methods, which are sorted by the related impact categories
according to Table 3.3. In Table 4.1, S1 to S4 refer to the four scenarios defined in this study,
while the largest environmental impacts of them are displayed in red. Since the current version of
TRACI does not provide assessments for land occupation, natural land transformation, water and
metal depletion, and ionizing radiation, impacts of these categories could only be seen in ReCiPe
method.
Generally, results obtained from the two methods were similar in most impact categories.
Slight differences were found in eutrophication, ozone depletion and particulate matter formation,
while there was a big discrepancy in the human toxicity impact. Further comparisons will be
discussed in the following sub-sections.
71
Table 4.1: Comparison of the characterization results from ReCiPe and TRACI
ReCiPe S1* S2 S3 S4 TRACI S1 S2 S3 S4
Climate Change (kg CO2 eq) 4.7×10⁻² 2.8 2.5 1.8 Global Warming (kg CO2 eq) 4.7×10⁻² 2.8 2.5 1.8
Ozone Depletion (kg CFC-11 eq) 2.2×10⁻⁹ 5.0×10⁻⁷ 3.7×10⁻⁷ 2.1×10⁻⁷ Ozone Depletion (kg CFC-11 eq) 1.8×10⁻⁹ 5.9×10⁻⁷ 3.5×10⁻⁷ 2.9×10⁻⁷
Freshwater Eutrophication (kg P eq)
Marine Eutrophication (kg N eq)
1.2×10⁻²
0.12
4.9×10⁻⁴
5.4×10⁻³
4.2×10⁻⁴
1.6×10⁻³
3.8×10⁻⁵
6.7×10⁻⁴
Eutrophication (kg N eq) 0.58 3.8×10⁻³ 8.1×10⁻³ 1.5×10⁻³
Terrestrial Acidification (kg SO2 eq) 1.9×10⁻⁴ 1.4×10⁻² 1.3×10⁻⁹ 8.6×10⁻³ Acidification (kg SO2 eq) 2.1×10⁻⁴ 1.6×10⁻² 1.4×10⁻² 9.6×10⁻³
Human toxicity (kg 1,4-DCB eq) 6.0×10⁻³ 0.72 0.52 0.42 Carcinogenics (CTUcancer)
Non-Carcinogenics (CTUnoncancer)
9.1×10⁻⁹
3.8×10⁻⁹
1.9×10⁻⁷
9.2×10⁻⁷
2.5×10⁻⁷
8.4×10⁻⁷
2.2×10⁻⁷
6.9×10⁻⁷
Terrestrial ecotoxicity (kg 1,4-DCB eq)
Freshwater ecotoxicity (kg 1,4-DCB eq)
Marine ecotoxicity (kg 1,4-DCB eq)
1.5×10⁻⁶
1.1×10⁻⁵
1.6×10⁻⁵
7.4×10⁻⁴
2.9×10⁻³
6.2×10⁻³
2.7×10⁻⁴
2.3×10⁻³
3.0×10⁻³
2.1×10⁻⁴
1.8×10⁻³
2.5×10⁻³
Ecotoxicity (CTUeco) 4.3×10⁻³ 5.7 3.7 3.1
Particulate Matter Formation (kg PM2.5 eq) 6.8×10⁻⁵ 5.7×10⁻³ 4.6×10⁻³ 2.9×10⁻³ Respiratory Effects (kg PM2.5 eq) 1.1×10⁻⁵ 1.5×10⁻³ 1.2×10⁻³ 4.0×10⁻⁴
Photochemical Oxidant Formation (kg NOx eq) 1.1×10⁻⁴ 1.6×10⁻² 1.1×10⁻² 8.9×10⁻³ Smog (kg O3 eq) 2.3×10⁻³ 0.34 0.24 0.19
Fossil Depletion (kg oil eq) 2.1×10⁻² 0.64 0.34 0.16 Fossil Fuel Depletion (MJ surplus) 0.12 3.7 1.9 1.3
Agricultural Land Occupation (m2)
Urban Land Occupation (m2)
Natural Land Transformation (m2)
Water Depletion (m3)
Metal Depletion (kg Fe eq)
Ionising Radiation (kg Uranium 235 eq)
2.4×10⁻⁴
8.1×10⁻⁵
2.0×10⁻⁶
9.1×10⁻⁵
1.4×10⁻⁴
5.0×10⁻⁴
6.4×10⁻²
8.8×10⁻²
3.5×10⁻⁴
3.2×10⁻²
0.15
0.56
6.0×10⁻²
2.9×10⁻²
2.2×10⁻⁵
2.7×10⁻²
0.50
0.44
3.5×10⁻²
2.2×10⁻²
-6.8×10⁻⁵
-0.97
0.45
0.41
*S1: Direct discharge; S2: Treating wastewater in WWTP; S3: MBR; S4: MBR+RO+UV
72
4.3.1 Climate Change/ Global Warming
Both ReCiPe and TRACI applied the model developed by IPCC to evaluate global
warming impact, thus results from the two methods were exactly the same. Global warming
potential was used for describing the total impacts, expressed in the unit of kg CO2 eq. Compared
to treating wastewater in WWTP, applying MBR could reduce the total damage to global warming
by 12%, while the reduction could reach 36% if combined with tertiary treatments. Regarding the
impact constitutions, sludge treatment contributed to more than 50% impacts in all treatment
scenarios, followed by system operation. Consequently, to mitigate global warming effects, more
attentions should be paid to the optimization of sludge treatment methods as well as the operation
of treatment systems.
4.3.2 Ozone Depletion
Slight difference existed with respect to the ozone depletion category between the two
LCIA methods. As carried out by the ReCiPe method, the masses of CFC-11 generated as a result
of the application of WWTP, MBR and MBR+RO+UV systems were 5.0 × 10⁻⁷, 3.7 × 10⁻⁷ and
2.1 × 10⁻⁷ kg respectively, while they were 5.9 × 10⁻⁷, 3.5 × 10⁻⁷ and 2.9 × 10⁻⁷ respectively for
TRACI. Although the Ozone Depleting Potential (ODP), expressed in kg CFC-11 eq. was adopted
in both methods, different lists were used for calculating the relative importance of substances
contributing to ozone depleting effects (Huijbregts et al., 2017; Bare, 2012). The list developed by
the World Meteorological Organization (WMO) was applied in both methods. However, in
addition to the WMO inventory, a list maintained by the USEPA was also implemented in TRACI,
with a most recent update in 2008. Despite the slight differences caused by the list of ozone
73
depleting substances, conclusions drawn from the two methods were the same, namely the water
recycling system had the best environmental performance among the three scenarios assessed. In
order to mitigate the breakdown of the ozone layer, operation and sludge disposal processes should
be optimized.
4.3.3 Eutrophication
Eutrophication in ReCiPe was broken down into two sub-categories: fresh water
eutrophication (expressed in kg P eq.) and marine eutrophication (expressed in kg N eq.). In
TRACI method, eutrophication is expressed in kg N eq.
In ReCiPe, it was predicted that by discharging 1 m3 of wastewater, 0.012 kg P eq. and
0.12 kg N eq. were added to the freshwater and marine systems respectively. This was calculated
based on the study of Helmes et al. (2012), Azevedo (2013), Azevedo et al. (2014), Cosme et al.
(2015) and Cosme and Hauschild. (2017), from which a global fate model was developed. The
model was derived based on the transfer of contaminants from the soil to water bodies, their
residence time in aquatic systems, background contaminant concentrations and their attenuation
rates. The freshwater eutrophication potentials (FEP) of phosphorus (P), phosphate (PO43-), and
the marine eutrophication potentials (MEP) of nitrogen (N), ammonia (NH4+) and nitrogen dioxide
(NO2) were calculated and further aggregated into the categories presented (Huijbregts et al., 2017).
Different from the ReCiPe method, 0.58 kg N eq. of eutrophication potential was estimated
by the model in TRACI. Although phosphorus commonly has more negative impacts to the aquatic
systems, nitrogen is more harmful to the coastal environments, as explained in the TRACI’s
manual book (Bare, 2012). It has taken into account the migration of contaminants caused by the
74
slope of fields, precipitation and volatilization of the fertilizer. However, no specific information
regarding the target contaminants and model selection was provided.
From the information summarized above, it can be seen that the factors considered in the
two methods were different. The conclusions, however, were similar, and could be supported from
different aspects by the two methods. Primarily, eutrophication risks would significantly increase
if industries do not include wastewater treatments in their business operation.
4.3.4 Acidification
Results obtained from the two methods in acidification also have slight differences. The
SO2 eq. calculated from the TRACI method were about 10% higher than those from the ReCiPe
method in all scenarios. The substances counted for the calculation of terrestrial acidification in
ReCiPe included NOx, NH3 and SO2. The adopted model combined the environmental persistence,
atmospheric deposition, geochemical acidification capacity, and ecotoxicity of the pollutants
(Huijbregts et al., 2017). References for model development in TRACI were mainly from the
USEPA, but it did not propose specific procedures. In spite of the 10% discrepancies, MBR and
MBR+RO+UV systems have around 10 and 30% less acidification impacts compared to treating
sewage in a WWTP. Sludge treatment phase was also the biggest contributor, to which more
attention should be paid.
4.3.5 Human Toxicity
The greatest difference between the two methods appeared in the categories regarding
human health issues. It was concluded by ReCiPe that the MBR caused 28% less damage than the
75
treatment in WWTP, and 14% more reduction could be gained by applying tertiary treatments. On
the contrary, TRACI method showed that MBR and MBR+RO+UV systems brought 34 and 15%
more damage to carcinogenic issues respectively compared to the WWTP scenario, while only 8
and 16% less impacts were found in the non-carcinogenic category.
In the ReCiPe method, the corresponded inventories are classified into a single impact
category, namely the human toxicity, which is expressed in kg 1,4-DCB eq. The ReCiPe method
implements the USEtox database containing the toxicity factors of 3094 substances, and assesses
their environmental fate, accumulation and toxicity within human bodies. The adopted model for
assessment was the Uniform System for the Evaluation of Substances adapted for LCA (USES-
LCA) model developed by Van Zelm et al. (2009). Although results were presented in a single
category, characterization factors for human cancer and non-cancer effects were separately
considered (PRé, 2018). Regarding carcinogenicity, carcinogenic risk of 844 substances provided
by the International Agency for Research on Cancer (IARC) was cited in the ReCiPe Midpoint (H)
sub-method. It accounted for all human exposure routes including air, drinking water and food.
Results achived based on the USEtox model in TRACI classified the total human health
impacts into cancer and non-cancer effects. The Comparative Toxic Unit (CTU) developed by the
USEtox team was adopted as the characterization factor, which was calculated from the fate,
exposure and effect factors of chemicals. In the case of cancer and non-cancer impacts, CTU values
can be understood as the disease cases per kg contaminants emitted (Fantke et al., 2018). Although
cancer and non-cancer effects could be aggregated into one category, it was recommended by the
developer to keep them separate (PRé, 2018).
76
From the facts mentioned above, major difference between the two methods is that, ReCiPe
only used the database provided by the USEtox, but implemented the USES-LCA model for
assessment, which accounted for the fate, exposure and effects of contaminants and expressed
them as relative values to 1,4-DCB.TRACI, however, not only adopted the database, but also the
analytic models of USEtox were adopted in TRACI. The characterized results are then expressed
in CTU that indicates the morbidity as a result of emitted pollutants.
Overall, although the ReCiPe and TRACI methods assessed the environmental impacts of
treating wastewater in WWTP, MBR and MBR+RO+UV through different ways, they all showed
notably negative impacts to human health. To mitigate such effects, the sludge disposal processes
should be optimized, since it contributed to almost 80% of the total human health impacts in all
scenarios.
4.3.6 Ecotoxicity
The ReCiPe method broke down ecotoxicity into three subsets based on the media of
contamination, namely the terrestrial, freshwater and marine ecotoxicity. Only the impacts to
freshwater were counted in TRACI, which were expressed in one category named as ecotoxicity.
According to ReCiPe, treating wastewater in WWTP caused the greatest damage, with 7.4 × 10⁻⁴,
2.9 × 10⁻³ and 6.2 × 10⁻³ kg 1,4-DCB eq. emitted to land, freshwater and seawater respectively.
MBR had 63, 21, and 51% less impacts than the WWTP scenario in the three categories
respectively, while MBR+RO+UV had about 10% less impacts. As shown in TRACI, WWTP was
also the worst scenario, followed by MBR (34% less impacts) and MBR+RO+UV (45% less
impacts).
77
In the manual book of both methods, ecotoxicity impacts were discussed together with
human toxicity, consistent with model selection and characterization approaches. The USES-LCA
model adopted in ReCiPe calculated the 1,4-DCB eq. emitted to the corresponded systems for
terrestrial, freshwater and marine ecotoxicity. Moreover, the unit expressing ecotoxicity in USEtox
was CTUeco. This could be understood as the potentially affected fraction of species (PAF)
integrated over time and volume per unit mass of a chemical emitted (Fantke et al., 2018).
Generally, ReCiPe method provides more comprehensive assessment than TRACI in the
ecotoxicity impacts. Results regarding freshwater ecotoxicity were similar, so that MBR and
MBR+RO+UV systems had slightly fewer negative impacts than the WWTP scenario. In addition
to this, the ReCiPe method also showed that there would be more benefits brought by the
application of membrane technologies to the terrestrial and marine ecosystems.
4.3.7 Photochemical Oxidant Formation/ Smog
The characterization factors adopted in the two methods with respect to photochemical
oxidant formation were different. The impacts were expressed in kg NOx eq. in ReCiPe, while it
was kg O3 eq. in TRACI. In spite of the differences in reference chemicals, the results were
somewhat similar. The WWTP scenario turned out to be the worst scenario as shown in Table 4.1,
with nearly 30 and 45% more damage compared to MBR and MBR+RO+UV respectively.
In ReCiPe, both human health and terrestrial ecosystem damage caused by photochemical
oxidants were taken into account. Results were calculated from a global chemical transport model,
the FAst Scenario Screening Tool for Global Air Quality and Instantaneous Radiative Forcing
(TM5-FASST), which divided the whole world into 56 receptor regions and considered the spatial
78
features at each emission site (Huijbregts et al., 2017). To estimate the influence of individual
substances on photochemical ozone formation, the Photochemical Ozone Creation Potentials
(POCPs) model developed by Derwent and Jenkin (1991) was adopted.
On the other hand, TRACI method implemented the Maximum Incremental Reactivity
(MIR) model instead of the POCPs, although both methods have been mentioned in the CML 2002
Handbook (Bare, 2012). As claimed in their manual book, there were many advantages of this
practice, including: 1) MIR was developed for the US instead of global condition. 2) The most
recent version of MIR covered nearly 1200 substances, which was much more than the 128
substances covered by the POCPs (Bare, 2012). 3) This method has been recommended by the
USEPA and individual states within the US for other environmental projects (Bare, 2012). 4) This
method takes into account both human health and environmental impacts.
In conclusion, in the photochemical oxidant formation category, the results calculated from
TRACI would be recommended, since it was more suitable for the projects conducted in North
America and a more comprehensive list of substances was used. Sludge treatment played an
important role in the formation of photochemical smog. In the life-cycle of treating sewage in
municipal WWTP, the impact of transportation was also not negligible, as it contributed to more
than 35% of total impacts.
4.3.8 Particulate Matter Formation/ Respiratory Effects
Both ReCiPe and TRACI have adopted kg PM2.5 eq. as characterization factor in their
modeling. However, the results turned out to be different. According to ReCiPe, the fine particulate
matter increased by treating 1 m3 wastewater in WWTP, MBR and MBR+RO+UV systems were
79
5.7 × 10⁻³, 4.6 × 10⁻³ and 2.9 × 10⁻³ kg PM2.5 eq. respectively. The results obtained from TRACI,
however, were 1.5 × 10⁻³, 1.2 × 10⁻³ and 4.0 × 10⁻⁴ kg PM2.5 eq. respectively, which are much
smaller than ReCiPe results.
Consistent with the global source-receptor model implemented for photochemical oxidant
formation, TM5-FASST has been applied on assessing particulate matter formation in ReCiPe
(Huijbregts et al., 2017). It traces the fate and chemistry of primary aerosols (SO2, NOx, NH3 and
PM2.5) in the atmosphere, evaluated the human intake fraction and mortality cases, and finally
calculated the total damage to human health (Huijbregts et al., 2017). The site-specific factors were
generated on the basis of global condition. On the other hand, TRACI method consulted the
dissertation of Humbert (2009) to generate a site-specific model for North America. It has taken
into account the emission of primary contaminants, the background concentration in the
atmosphere, the resulting increase of pollutants, the human intake rate and the exposed population
(Bare, 2012).
As a consequence, the TRACI method would be recommended due to its suitability for the
North America condition. The combination system of MBR and tertiary technologies turned out
to be much better than the other systems, with 66 and 74% less damage compared to MBR and
WWTP respectively. Sludge treatment is still the most important phase in all scenarios.
Nevertheless, the importance of transportation of sewage in the WWTP scenario, and materials in
the membrane systems was higher than the others in respiratory effects. The transportation phase
consisted of 45% total impacts in the treatment of WWTP, while the contribution of processes
related to materials in membrane systems was nearly 35%.
80
4.3.9 Other Effects
The importance of resources depletion is not questionable. But unfortunately, the current
version of TRACI only provides the assessment for fossil fuel depletion, while the modeling of
land use and water use is still in progress (Bare, 2012). Instead, ReCiPe method can provide a
more comprehensive assessment for resource depletion impacts, including agricultural land
occupation, urban land occupation, natural land transformation, water depletion, metal depletion,
and an assessment for ionizing radiation.
Based on the results of ReCiPe method, the application of MBR+RO+UV could bring
much less impacts to the depletion of resources compared to the other systems. In addition, thanks
to water recycling achieved by the tertiary treatment techniques, net profits were found in the
natural land transformation and water depletion categories. On the other hand, the membrane
systems were not very friendly to the metal depletion, as they caused three times the impacts
compared to treating sewage in WWTP. This was justifiable since the materials and construction
of WWTP infrastructure were excluded from the system boundary. However, treating wastewater
in centralized WWTP showed the largest impacts in land occupation, water depletion and ionizing
radiation, which made it a worse choice regarding resource depletion issues.
4.3.10 Summary of the LCIA Comparisons
In general, both ReCiPe and TRACI have their own advantages and disadvantages. The
ReCiPe method can cover more comprehensive impacts in many categories such as ecotoxicity,
resources depletion and ionizing radiation. On the other hand, many models adopted in TRACI
81
were developed on the basis of North America rather than the global condition considered in
ReCiPe, which would be more suitable for the projects conducted in this study.
As a result, discharging wastewater without treatment should always be avoided, otherwise
it would bring significant hazards of eutrophication to the environment. Among the three treatment
options assessed, MBR combined with RO and UV turned out to be the best choice. Regarding the
impact constitution of different phases, sludge treatment had the biggest influence on most
categories. This study also revealed the contribution of transportation in the WWTP scenario, and
materials and operation phases in the membrane systems were not negligible as well.
4.4 Sensitivity Analysis
Sensitivity analysis was conducted on the ReCiPe method as a representative in this study.
A ±20% disturbance was given to major assumptions and data within each life-cycle phase
classified. This 20% value was taken to generate noticeable results that could be easily observed..
Several alternatives of end-of-life disposal methods for the MBR and MBR plus tertiary treatment
systems were also assessed. The sensitivity analysis results are displayed in the following sections.
4.4.1 Direct Discharge
The entire life-cycle of direct discharge scenario has been divided into four phases, namely
the raw materials acquisition and processing, transportation, construction and sewage discharge.
The detailed inventories included in each phase are illustrated in Table 4.2.
82
Table 4.2: Life-cycle phases of the direct discharge scenario
Life-cycle phases Inventories
Materials (extraction,
processing)
1. Wastewater holding tank
2. Drainage pipes
Transportation Transportation of tank and pipes (from manufacturer to construction
site)
Construction 1. Soil excavation
2. Pipeline construction
Sewage Discharge Release of the contaminants in wastewater into the aquatic system
Figure 4.13 illustrates the sensitivity analysis results of the direct discharge scenario, which
shows the percentage change of characterization results caused by the ±20% disturbance. The
materials extraction and processing phase showed the greatest influence on most impact categories
except eutrophication, ionizing radiation and natural land transformation, with the variation of total
impacts ranging from 0 to 20%. The change of transportation data had negligible impacts on the
LCIA results, while the eutrophication impacts changed linearly with the contaminant content in
the sewage discharged. The data of construction phase was especially important to the natural land
transformation, with a ±20% disturbance resulting in a ±25% variation of the total impacts.
In general, the influence of data uncertainties in the direct discharge scenario was
acceptable. Only a 25% change was found in natural land transformation within the construction
phase. In other major categories such as climate change, total impacts changed by the ±20%
variation were no greater than 20%.
83
Figure 4.13: Sensitivity analysis for direct discharge impacts using ReCiPe method
-50%
-40%
-30%
-20%
-10%
0%
10%
20%
30%
40%
50%
CC OD TA FEP MEP HT POF PMF TE FET MET IR ALO ULO NLT WD MD FD
Chan
ge
of
resu
lts
Materials
-50%
-40%
-30%
-20%
-10%
0%
10%
20%
30%
40%
50%
CC OD TA FEP MEP HT POF PMF TE FET MET IR ALO ULO NLT WD MD FD
Chan
ge
of
resu
lts
Transportation
-50%
-40%
-30%
-20%
-10%
0%
10%
20%
30%
40%
50%
CC OD TA FEP MEP HT POF PMF TE FET MET IR ALO ULO NLT WD MD FD
Chan
ge
of
resu
lts
Construction
-50%
-40%
-30%
-20%
-10%
0%
10%
20%
30%
40%
50%
CC OD TA FEP MEP HT POF PMF TE FET MET IR ALO ULO NLT WD MD FD
Chan
ge
of
resu
lts
Wastewater Discharge
+20% -20%
84
4.4.2 Treatment in Local WWTP
Table 4.3 shows the phases and specific inventories included in the WWTP treatment
scenario, where the entire life-cycle has been divided into raw materials extraction and processing,
transportation, operation and sludge treatment.
Table 4.3: Life-cycle phases of the treatment in local WWTP scenario
Life-cycle phases Inventories
Materials (extraction,
processing)
1. Screening System
2. Wastewater holding tank
Transportation 1. Transportation of screen and tank (from manufacturer to construction
site)
2. Transportation of wastewater (from industry to WWTP)
Operation 1. Electricity consumption
2. Airborne emissions
3. Residual contaminants
Sludge Treatment Sludge digestion and incineration
The sensitivity analysis results are illustrated in Figure 4.14. Data related to the raw
materials of the sewage tank and screening system had negligible impacts on the total results.
Within other phases, the change of results caused by the ±20% disturbance did not exceed 20% in
all categories. The greatest variation of total impacts was found in the water depletion phase within
the operation phase.
Overall, in the treatment in local WWTP scenario, the influence of data uncertainties
related to all phases were not significant. Most of the changes in results were around ±10% when
given a ±20% disturbance, especially in the environmental hot spots.
85
Figure 4.14: Sensitivity analysis for treatment in local WWTP impacts using ReCiPe method
-50%
-40%
-30%
-20%
-10%
0%
10%
20%
30%
40%
50%
CC OD TA FEP MEP HT POF PMF TE FET MET IR ALO ULO NLT WD MD FD
Chan
ge
of
resu
lts
Materials
-50%
-40%
-30%
-20%
-10%
0%
10%
20%
30%
40%
50%
CC OD TA FEP MEP HT POF PMF TE FET MET IR ALO ULO NLT WD MD FD
Chan
ge
of
resu
lts
Transportation
-50%
-40%
-30%
-20%
-10%
0%
10%
20%
30%
40%
50%
CC OD TA FEP MEP HT POF PMF TE FET MET IR ALO ULO NLT WD MD FD
Chan
ge
of
resu
lts
Operation
-50%
-40%
-30%
-20%
-10%
0%
10%
20%
30%
40%
50%
CC OD TA FEP MEP HT POF PMF TE FET MET IR ALO ULO NLT WD MD FD
Chan
ge
of
resu
lts
Sludge Treatment
+20% -20%
86
4.4.3 Membrane and Tertiary Treatment Technologies
The system boundaries for MBR and MBR+RO+UV systems are same in this study.
Therefore, sensitivity analysis for both scenarios are discussed together in this section. Five phases
were included, which are: raw materials extraction and processing, transportation, construction,
operation and sludge treatment. The detailed inventory is shown in Table 4.4.
Table 4.4: Life-cycle phases of the MBR and MBR+RO+UV scenarios
Life-cycle phases Inventories
Materials (extraction,
processing)
1. Tanks (reactor tank, sludge/water holding tank)
2. Mechanical parts (blower, pump)
3. Accessories (valve, railing, pipeline, control panel)
4. Membrane modules
Transportation 1. Transportation of all components (from manufacturer to construction
site)
2. Transportation of sludge (from industry to WWTP)
Construction 1. Construction works
2. Transport of equipment and labors
Operation 1. Electricity consumption
2. Airborne emissions
3. Residual contaminants
4. Water reuse*
Sludge Treatment Sludge digestion and incineration
*: apply to the MBR+RO+UV scenario
The sensitivity results are displayed in Figure 4.15. It can be seen that the influence of data
uncertainties within the materials, transportation and construction phases was negligible, while
only a ±16% change was found in metal depletion within the materials acquisition and processing
phase. However, there was huge change in natural land transformation within the operation and
87
sludge treatment phases, with 80% and 67% of total impacts changed by the ±20% disturbance. In
addition to this, other changes in total impacts were all no greater than 20%.
Conclusively, the uncertainties in operation and sludge treatment data would significantly
affect the results obtained in the natural land transformation category. But the influence was
generally acceptable, since the other major environmental impacts were not significantly sensitive
to the data disturbance.
-100%
-80%
-60%
-40%
-20%
0%
20%
40%
60%
80%
100%
CC OD TA FEP MEP HT POF PMF TE FET MET IR ALO ULO NLT WD MD FD
Chan
ge
of
resu
lts
Materials
-100%
-80%
-60%
-40%
-20%
0%
20%
40%
60%
80%
100%
CC OD TA FEP MEP HT POF PMF TE FET MET IR ALO ULO NLT WD MD FD
Chan
ge
of
resu
lts
Transportation
88
Figure 4.15: Sensitivity analysis for MBR and MBR+RO+UV impacts using ReCiPe method
-100%
-80%
-60%
-40%
-20%
0%
20%
40%
60%
80%
100%
CC OD TA FEP MEP HT POF PMF TE FET MET IR ALO ULO NLT WD MD FD
Chan
ge
of
resu
lts
Construction
-100%
-80%
-60%
-40%
-20%
0%
20%
40%
60%
80%
100%
CC OD TA FEP MEP HT POF PMF TE FET MET IR ALO ULO NLT WD MD FD
Chan
ge
of
resu
lts
Operation
-100%
-80%
-60%
-40%
-20%
0%
20%
40%
60%
80%
100%
CC OD TA FEP MEP HT POF PMF TE FET MET IR ALO ULO NLT WD MD FD
Chan
ge
of
resu
lts
Sludge Treatment
+20% -20%
89
Figure 4.16 shows the sensitivity analysis results of major assumptions related to the MBR
system. By giving a ±20% disturbance to the airborne emission data, only minor changes have
been found in climate change, terrestrial ecotoxicity, marine eutrophication, photochemical
oxidant formation and particulate matter formation, which were all under 10%. No change was
found in the other categories. Therefore, the uncertainties caused by adopting airborne emission
data from other sources were acceptable.
The original end-of-life scenario for MBR was assumed to be: 100% metal wastes are
recycled while 100% plastic wastes are landfilled. The influence of switching to other alternative
end-of-life scenarios was assessed, which are:
Alternative 1: 100% metal wastes are landfilled, 100% plastic wastes are landfilled;
Alternative 2: 100% metal wastes are recycled, 100% plastic wastes are incinerated;
Alternative 3: 100% metal wastes are landfilled, 100% plastic wastes are incinerated.
It can be seen that no change was found in Alternative 2 in all impact categories. When
switching to Alternatives 1 and 3, minor changes (less than 10%) were identified in most categories
except natural land transformation (NLT), in which the impact increased by nearly 60%.
Considering that natural land transformation is not a major concern, the influence of uncertainties
caused by assuming end-of-life disposal scenarios were acceptable in general.
90
Figure 4.16 Sensitivity analysis for major assumptions within the MBR system using ReCiPe method
-100%
-80%
-60%
-40%
-20%
0%
20%
40%
60%
80%
100%
CC OD TA FEP MEP HT POF PMF TE FET MET IR ALO ULO NLT WD MD FD
Chan
ge
of
resu
lts
Airborne Emissions
+20% -20%
-100%
-80%
-60%
-40%
-20%
0%
20%
40%
60%
80%
100%
CC OD TA FEP MEP HT POF PMF TE FET MET IR ALO ULO NLT WD MD FD
Chan
ge
of
resu
lts
End-of-life Disposal
Alternative 1 Alternative 2 Alternative 3
91
4.5 Research Application
Four treatment options for fruit processing wastewater were quantitatively compared using
LCA in this study, including treating wastewater in local centralized WWTP, MBR and MBR plus
tertiary technologies, as well as discharging without any treatment. The scenarios defined are some
of the most common practices for treating fruit processing wastewater in real life.
Stakeholders in the fresh-cut sector who are seeking approaches for treating their
wastewater, could consult this research for input to their decision making from an environmental
perspective. Specifically, the the results show the benefits of treating the wastewater to reduce the
environmental footprint of their system. The results show that consideration of advanced treatment
technologies like MBR and RO can sufficiently treat fruit processing wastewater to a condition
that allows water recycling, making their facility sustainable. Much is gained for all stakeholders
if advanced treatment technologies are selected.
92
5 Conclusions and Recommendations
5.1 Conclusions
The environmental impacts of common wastewater treatment technologies in fruit
processing sector has been assessed in this study using LCA, and were compared with the impacts
when no on-site treatment is applied. Four scenarios have been defined for assessment, namely the
1) no treatment, 2) treatment in local WWTP, 3) MBR, and 4) MBR+RO+UV.
Discharge of wastewater into the aquatic system without treatment had enormous
eutrophication impact compared to the other scenarios, with 0.12 kg N eq. and 0.012 kg P eq.
accumulated in the environment per 1 m3 wastewater discharged according to ReCiPe, and 0.58
kg N eq. according to TRACI, which equals to about 4% of the eutrophication potentials per world
(ReCiPe) / Canadian (TRACI) population. Consequently, although this scenario contributed to the
least impacts in the other categories due to the minor amount of materials and energy required,
direct discharge should always be avoided.
Among the three treatment options, MBR combined with tertiary treatment processes was
identified as the best scenario as predicted in both methods, since it had the lowest impacts in most
categories except metal depletion. Some net environmental offsets were also revealed in natural
land transformation and water depletion due to water reuse achieved by the tertiary treatments.
Treating wastewater in local WWTP was the least satisfied option compared to the others, as it
had the greatest contribution in most impact categories (14 out of 18 in ReCiPe, and 8 out of 10 in
TRACI).
93
In the direct discharge scenario, almost all eutrophication risks were caused by the
discharge of wastewater with high pollutant load. Materials extraction and processing turned out
to be the most important phase affecting the other impacts, with more than 90% contribution in
most categories. Construction of sewer pipes was another important phase, especially for ozone
depletion according to both methods, and ionizing radiation solely provided by ReCiPe.
To treat wastewater in local WWTP, sludge treatment turned out to be the most important
phase, with nearly 50% contribution in most impact categories. Transportation and operation were
not negligible as well. Due to the frequent conveyance of large amount of sewage, transportation
contributed to nearly 30% impacts in most categories, and was especially harmful for ecotoxicity
and resource depletion. Most of the ozone depletion and eutrophication effects were caused by the
operation of the WWTP.
Sludge treatment was the most important phase in the MBR scenario, which was the biggest
contributor in most categories, especially in global warming, human toxicity, ecotoxicity and
resource depletion, where more than 60% of damage was caused by the digestion and incineration
of sludge. The operation of MBR contributed to the majority of ozone depletion (50%) and
eutrophication (80%) impacts. The contribution of materials extraction and processing phase was
not significant compared to sludge treatment and operation, but still not negligible in many
categories such as ozone depletion, particulate matter formation and ecotoxicity, with nearly 20%
constitution.
Because of the high removal efficiency and water reuse achieved by tertiary technologies,
the operation phase could bring net benefits to eutrophication, human toxicity, ecotoxicity,
94
respiratory effects, and resources depletion. The influence of operation in other categories was also
decreased to a minor level, with only 10% contribution in climate change and ozone depletion.
Sludge disposal was especially important in the tertiary treatment scenario, with largest
contribution in 15 out of 18 categories according to ReCiPe, and 9 out of 10 categories according
to TRACI. Although sludge treatment could bring negative impacts to the environment, this issue
also appeared in the other treatment options. Therefore, implementing tertiary technologies would
be a recommended approach to mitigate the environmental footprints.
Impact categories provided by the two LCIA methods were compared in this study based
on the impact types. In most categories, results obtained from the two methods were similar. Slight
differences were found in eutrophication, ozone depletion and particulate matter formation, while
there was a big discrepancy in the human toxicity impact.
It was concluded by comparing the models selected for each impact category, both ReCiPe
and TRACI have their own advantages and disadvantages. The ReCiPe method can cover more
comprehensive impacts in many categories such as ecotoxicity, resource depletion and ionizing
radiation. On the other hand, many models adopted in TRACI were developed on the basis of
North America rather than the global condition, such as in ozone depletion, acidification,
photochemical oxidant formation and respiratory effects, which would be more suitable for the
projects conducted in this study.
Sensitivity analysis has been conducted in this study on all the phases in each scenario and
major assumptions (airborne emission data and end-of-life treatment). The results showed that,
with a ±20% disturbance imposed on the unit processes, changes greater than 40% were only found
95
in the impacts of fossil fuel depletion within maintenance and material acquisition phases in
membrane systems. In all other categories, the changes of results were less than 20%. When the
±20% disturbance was imposed on the airborne emission data, only minor changes have been
found in 5 categories out of 18, while there was no change in the other categories. Regarding the
end-of-life disposal, switching to the other alternatives defined in this study only caused a nearly
60% change in natural land transformation, which was not a major concern. Therefore, it can be
concluded that, the influence of data uncertainties was acceptable, especially for the most
important categories assessed.
5.2 Recommendations
In this thesis, the life-cycle impacts of typical wastewater treatment technologies in fruit
processing industry have been assessed by LCA, with case studies conducted in a full-scale facility.
Comparison was made to the no-treatment scenarios, which were defined on the basis of
assumptions and available databases. This approach was proved to be feasible, but there was a
shortage in reflecting the specific technical parameters and local conditions. Therefore, it is
recommended to performs case studies to make the LCI of no-treatment scenarios more realistic.
There were several cut-offs of the system boundaries in all scenarios, including the
infrastructure of WWTP and deconstruction of treatment facilities. Although they were proved to
be insignificant compared to the other phases, uncertainties still existed. In addition, the end-of-
life treatment for the deconstructed materials was defined based on assumptions, which leads to
uncertainties as well. Thus, it is recommended in the next step to complete the system boundaries
and indeterminate data to make the results more reliable.
96
REFERENCES
Ahn, J. H., Kim, S., Park, H., Rahm, B., Pagilla, K., & Chandran, K. (2010). N2O Emissions from
Activated Sludge Processes, 2008-2009: Results of a National Monitoring Survey in the United
States. Environmental Science & Technology 44 (12), 4505-4511. doi:10.1021/es903845y
ALS. (2011). Certificate of Analysis. Toronto, Altech Technology Systems Inc.
Ardern, E., & Lockett, W. T. (1914). Experiments on the oxidation of sewage without the aid of
filters. Journal of the Society of Chemical Industry, 33(10), 523-539.
doi:10.1002/jctb.5000331005
Azevedo, L. B. (2014). Development and application of stressor – response relationships of
nutrients. Chapter 8 (Doctoral Dissertation, Radboud University Nijmegen, the Netherlands).
Retrieved from http://repository.ubn.ru.nl.
Azevedo, L. B., Henderson, A. D., Van Zelm, R., Jolliet, O., & Huijbregts, M. A. J. (2013).
Assessing the Importance of Spatial Variability versus Model Choices in Life Cycle Impact
Assessment: The Case of Freshwater Eutrophication in Europe. Environmental Science &
Technology 47(23), 13565-13570. doi: 10.1021/es403422a
Bare, J. C. (2012). Tool for the Reduction and Assessment of Chemical and other Environmental
Impacts (TRACI): Version 2.1 User’s Manual. Retrieved from https://www.pre-
sustainability.com/download/TRACI_2_1_User_Manual.pdf
Beavis, P., & Lundie, S. (2003). Integrated environmental assessment of tertiary and residuals
treatment - LCA in the wastewater industry. Water Science and Technology, 47(7-8), 109-116.
doi: 10.2166/wst.2003.0678
Bravo, L., & Ferrer I. (2011). Life Cycle Assessment of an intensive sewage treatment plant in
Barcelona (Spain) with focus on energy aspects. Water Science & Technology, 64(2), 440-447.
doi: 10.2166/wst.2011.522
Cashman, S., Ma, X., Mosley, J., Garland, J., Crone, B., & Xue, X. (2018). Energy and greenhouse
gas life cycle assessment and cost analysis of aerobic and anaerobic membrane bioreactor
systems: Influence of scale, population density, climate, and methane recovery. Bioresource
Technology, 254, 56-66. doi:10.1016/j.biortech.2018.01.060
City of Toronto. (2016). Toronto Municipal Code Chapter 681, Sewers. Retrieved from
https://www.toronto.ca/legdocs/municode/1184_681.pdf
Clauson-Kaas, J., Poulsen, T. S., Jacobsen, B. N., Guildal, T., & Wenzel, H. (2001).
Environmental accounting - a decision support tool in WWTP operation and
management. Water Science and Technology, 44(2-3), 25-30. doi: 10.2166/wst.2001.0749
97
Corominas, L., Foley, J., Guest, J. S., Hospido, A., Larsen, H. F., Morera, S., & Shaw, A. (2013).
Life cycle assessment applied to wastewater treatment: State of the art. Water
Research, 47(15), 5480-5492. doi:10.1016/j.watres.2013.06.049
Cosme, N., & Hauschild, M. Z. (2017). Characterization of waterborne nitrogen emissions for
marine eutrophication modelling in life cycle impact assessment at the damage level and global
scale. The International Journal of Life Cycle Assessment 22(10), 1558-1570. doi:
10.1007/s11367-017-1271-5
Cosme, N., Koski, M., & Hauschild, M. Z. (2015). Exposure factors for marine eutrophication
impacts assessment based on a mechanistic biological model. Ecological
Modelling, 317(Complete), 50-63. doi:10.1016/j.ecolmodel.2015.09.005
Courtice Water Pollution Control Plant. (2018). 2017 Annual Performance Report. Retrieved from
https://www.durham.ca/en/living-here/resources/Documents/WaterandSewer/Accessible-
version-Courtice-2017.pdf
Derwent, R. G., & Jenkin, M. E. (1991). Hydrocarbons and the long-range transport of ozone and
pan across europe. Atmospheric Environment Part A, General Topics, 25(8), 1661-1678.
doi:10.1016/0960-1686(91)90025-3
Emmerson, R. H. C., Morse, G. K., Lester, J. N., & Edge, D. R. (1995). The Life‐Cycle analysis
of Small‐Scale Sewage‐Treatment processes. Water and Environment Journal, 9(3), 317-325.
doi:10.1111/j.1747-6593.1995.tb00945.x
Fantke, P., Bijster, M., Guignard, C., Hauschild, M., Huijbregts, M., Jolliet, O., Kounina, A.,
Magaud, V., Margni, M., McKone, T.E., Posthuma, L., Rosenbaum, R.K., van de Meent, D.,
& Van Zelm, R. (2017). USEtox® 2.0 Documentation (Version 1.1). Retrieved from
http://usetox.org
Foley, J., de Haas, D., Hartley, K., & Lant, P. (2010). Comprehensive life cycle inventories of
alternative wastewater treatment systems. Water Research, 44(5), 1654-1666.
doi:10.1016/j.watres.2009.11.031
Garfí, M., Flores, L., & Ferrer, I. (2017). Life cycle assessment of wastewater treatment systems
for small communities: Activated sludge, constructed wetlands and high rate algal ponds.
Journal of Cleaner Production, 161, 211-219. doi:10.1016/j.jclepro.2017.05.116
Helmes, R. J. K., Huijbregts, M. A. J., Henderson, A. D., & Jolliet O. (2012). Spatially explicit
fate factors of phosphorous emissions to freshwater at the global scale. The International
Journal of Life Cycle Assessment, 17(5), 646-654. doi: 10.1007/s11367-012-0382-2
Hospido, A., Moreira, M. T., & Feijoo, G. (2007). A comparison of municipal wastewater
treatment plants for big centres of population in Galicia (Spain). The International Journal of
Life Cycle Assessment, 13(1), 57-64. doi: 10.1065/lca2007.03.314
98
Hospido, A., Moreira, M., Fernández-Couto, M., & Feijoo, G. (2004). Environmental performance
of a municipal wastewater treatment plant. The International Journal of Life Cycle
Assessment, 9(4), 261-271. doi:10.1007/BF02978602
Hospido, A., Sanchez, I., Rodriguez-Garcia, G., Iglesias, A., Buntner, D., Reif, R., . . . Feijoo, G.
(2012). Are all membrane reactors equal from an environmental point of
view? Desalination, 285, 263-270. doi:10.1016/j.desal.2011.10.011
Houillon, G., & Jolliet, O. (2005). Life cycle assessment of processes for the treatment of
wastewater urban sludge: Energy and global warming analysis. Journal of Cleaner Production,
13(3), 287-299. doi:10.1016/j.jclepro.2004.02.022
Howard, A. K. (1996). Pipe Bedding and Backfill. Denver, Colorado: United States Department
of the Interior Bureau of Reclamation
Huijbregts, M. A. J., Steinmann, Z. J. N., Elshout, P. M. F., Stam, G., Francesca, V., Vieira, M.,
Zijp, M., Hollander, A., & Van Zelm, R. (2017). ReCiPe 2016—a life cycle impact assessment
method which comprises harmonised category indicators at the midpoint and the endpoint level.
The International Journal of Life Cycle Assessment, 22(2), 138-147.
Humbert, S. (2009). Geographically Differentiated Life-cycle Impact Assessment of Human
Health. (PhD’s thesis). Retrieved from https://escholarship.org/uc/item/1xv927gv
Hunt, R., Franklin, W., & Hunt, R. (1996). LCA — how it came about: — personal reflections on
the origin and the development of LCA in the USA. The International Journal of Life Cycle
Assessment, 1(1), 4-7. doi:10.1007/BF02978624
IESO. (2018). Yearly Energy Output by Fuel Type. Retrieved from http://www.ieso.ca/en/Power-
Data/Supply-Overview/Transmission-Connected-Generation
Ioannou-Ttofa, L., Foteinis, S., Chatzisymeon, E., & Fatta-Kassinos, D. (2016). The environmental
footprint of a membrane bioreactor treatment process through life cycle analysis. Science of the
Total Environment, 568, 306-318. doi:10.1016/j.scitotenv.2016.06.032
ISO. (2006a). ISO 14040: Environmental management -- Life cycle assessment -- Principles and
framework. Int. Organ. Stand.
Jamieson J. (2018, Aug 3). Personal interview with Jamieson J. at the Algoma Orchards Ltd.
Ka Yee, L., Zytner, R. G., & Chang, S. (2016). Treatment of high strength vegetable processing
wastewater with a sequencing batch reactor. GSTF journal on Agricultural Engineering (JAE),
2(1), 1-9. doi: 10.7603/s40872-015-0005-4
Lopsik, K. (2013). Life cycle assessment of small-scale constructed wetland and extended aeration
activated sludge wastewater treatment system. International Journal of Environmental Science
and Technology, 10(6), 1295-1308. doi:10.1007/s13762-012-0159-y
99
Lundin, M., Bengtsson, M., & Molander, S. (2000). Life Cycle Assessment of Wastewater
Systems: Influence of System Boundaries and Scale on Calculated Environmental Loads.
Environmental Science & Technology, 34(1), 180-186. doi: 10.1021/es990003f
Marsmann, M. (1997). Editorial: ISO 14040 - the first project. The International Journal of Life
Cycle Assessment, 2(3), 122-123. doi:10.1007/BF02978798
Matthews, H. S., Hendrickson, C. T., & Matthews, D. H. (2015) Life Cycle Assessment:
Quantitative Approaches for Decisions That Matter. Retrieved from:
https://www.lcatextbook.com
Monteith, H. D., Sahely, H. R., MacLean, H. L., & Bagley, D. M. (2005). A rational procedure for
estimation of greenhouse-gas emissions from municipal wastewater treatment plants. Water
Environment Research : A Research Publication of the Water Environment Federation, 77(4),
390-403. doi:10.1002/j.1554-7531.2005.tb00298.x
Moore, A. W., Zytner, R. G., & Chang, S. (2016). Potential Water Reuse for High Strength Fruit
and Vegetable Processor Wastewater with an MBR. Water Environment Research, 88, 852-
870. doi:10.2175/106143016X14609975747649
Mundi, G. S., Zytner, R. G. (2015). Effective solid removal technologies for wash-water treatment
to allow water reuse in the fresh-cut fruit and vegetable industry. Journal of Agricultural
Science and Technology, A(5), 396-407. doi: 10.17265/2161-6256/2015.06.003
Ortiz, M., Raluy, R. G., & Serra, L. (2007). Life cycle assessment of water treatment technologies:
Wastewater and water-reuse in a small town. Desalination, 204(1-3), 121-131.
doi:10.1016/j.desal.2006.04.026
Pasqualino, J.C., Meneses, M., Abella, M., & Castells, F. (2009). LCA as a Decision Support Tool
for the Environmental Improvement of the Operation of a Municipal Wastewater Treatment
Plant. Water Science & Technology, 43(9), 3300-3307. doi: 10.1021/es802056r
Port Darlington Water Pollution Control Plant. (2018). 2017 Annual Performance Report.
Retrieved from https://www.durham.ca/en/living-
here/resources/Documents/WaterandSewer/Accessible-version-Port-Darlington-2017.pdf
PRé. 2014. SimaPro Database Manual - Methods. PRé Consultants B.V., Amersfoort, the
Netherlands
PRé. 2018. SimaPro Database Manual - Methods. PRé Consultants B.V., Amersfoort, the
Netherlands
Pretel, R., Robles, A., Ruano, M. V., Seco, A., & Ferrer, J. (2013). Environmental impact of
submerged anaerobic MBR (SAnMBR) technology used to treat urban wastewater at different
temperatures. Bioresource Technology, 149, 532-540. doi:10.1016/j.biortech.2013.09.060
100
Pryshlakivsky, J., & Searcy, C. (2013). Fifteen years of ISO 14040: A review. Journal of Cleaner
Production, 57, 115-123. doi:10.1016/j.jclepro.2013.05.038
Pullen, S. F. (2000). Energy used in the construction and operation of houses. Architectural
Science Review, 43(2), 87-94. doi:10.1080/00038628.2000.9697439
Risch, E., Gutierrez, O., Roux, P., Boutin, C., & Corominas, L. (2015). Life cycle assessment of
urban wastewater systems: Quantifying the relative contribution of sewer systems. Water
Research, 77, 35-48. doi:10.1016/j.watres.2015.03.006
Roeleveld, P. J., Klapwijk, A., Eggels, P. G., Rulkens, W. H., & van Starkenburg, W. (1997).
Sustainability of municipal wastewater treatment. Water Science and Technology, 35(10), 221-
228. doi:10.2166/wst.1997.0386
Ryberg, M., Vieira, M., Zgola, M., Bare, J., & Rosenbaum, R. (2014). Updated US and canadian
normalization factors for TRACI 2.1. Clean Technologies and Environmental Policy, 16(2),
329-339. doi:10.1007/s10098-013-0629-z
Sleeswijk, A. W., van Oers, L. F. C. M., Guinée, J. B., Struijs, J., & Huijbregts, M. A. J. (2008).
Normalisation in product life cycle assessment: An LCA of the global and european economic
systems in the year 2000. Science of the Total Environment, 390(1), 227-240.
doi:10.1016/j.scitotenv.2007.09.040
Suh, Y., & Rousseaux, P. (2002). An LCA of alternative wastewater sludge treatment
scenarios. Resources, Conservation and Recycling, 35(3), 191-200. doi:10.1016/S0921-
3449(01)00120-3
Svanström, M., Fröling, M., Modell, M., Peters, W. A., & Tester, J. (2004). Environmental
assessment of supercritical water oxidation of sewage sludge. Resources, Conservation and
Recycling, 41(4), 321-338. doi:10.1016/j.resconrec.2003.12.002
Tangsubkul, N., Beavis, P., Moore, S. J., Lundie, S., & Waite, T. D. (2005). Life cycle assessment
of water recycling technology. Water Resources Management, 19(5), 521-537.
doi:10.1007/s11269-005-5602-0
Upadhyay, N., Sun, Q., Allen, J. O., Westerhoff, P., & Herckes, P. (2013). Characterization of
aerosol emissions from wastewater aeration basins. Journal of the Air & Waste Management
Association, 63(1), 20-26. doi:10.1080/10962247.2012.726693
Vaccari, M., Foladori, P., Nembrini, S., & Vitali, F. (2018). Benchmarking of energy consumption
in municipal wastewater treatment plants – a survey of over 200 plants in Italy. Water Science
& Technology, 77 (9), 2242-2252. doi: 10.2166/wst.2018.035
Van Zelm, R., Huijbregts, M., & Meent, D. (2009). USES-LCA 2.0—a global nested multi-media
fate, exposure, and effects model. The International Journal of Life Cycle Assessment, 14(3),
282-284. doi:10.1007/s11367-009-0066-8
101
Van Zelm, R., Preiss, P., van Goethem, T., Van Dingenen, R., & Huijbregts, M. (2016).
Regionalized life cycle impact assessment of air pollution on the global scale: Damage to
human health and vegetation. Atmospheric Environment, 134, 129-137.
doi:10.1016/j.atmosenv.2016.03.044
Wenzel, H., Hauschild, M., Alting, L., & Overcash, M. (1999). Environmental assessment of
products volume 1: Methodology, tools, and case studies in product. The International Journal
of Life Cycle Assessment, 4(1), 6-6. doi:10.1007/BF02979388
Yi, K. (2013). Modelling of On-Site Energy Consumption Profile in Construction Sites and a Case
Study of Earth Moving. KICEM Journal of Construction Engineering and Project
Management, 3(3), 10-16. doi:10.6106/JCEPM.2013.3.3.010