MSc Program Environmental Technology & International Affairs A Master’s Thesis submitted for the degree of “Master of Science” supervised by Life Cycle Assessment of PET Bottle Recycling: A Case Study for Mexico Dr. Helmut Rechberger Daniela Izábal Nogueda 1128039 Vienna, 03.06.2013
Transcript
MSc Program Environmental Technology & International Affairs
A Master’s Thesis submitted for the degree of “Master of Science”
supervised by
Life Cycle Assessment of PET Bottle Recycling: A Case Study for Mexico
Dr. Helmut Rechberger
Daniela Izábal Nogueda
1128039
Vienna, 03.06.2013
Affidavit I, DANIELA IZÁBAL NOGUEDA, hereby declare
1. that I am the sole author of the present Master’s Thesis, " LIFE CYCLE ASSESSMENT OF PET BOTTLE RECYCLING: A CASE STUDY FOR MEXICO", 58 pages, bound, and that I have not used any source or tool other than those referenced or any other illicit aid or tool, and
2. that I have not prior to this date submitted this Master’s Thesis as an examination paper in any form in Austria or abroad.
Vienna, 03.06.2013
Signature
Abstract Mexico is the world’s largest per capita consumer of bottled water and soft drinks; both of
which are contained in PET bottles. The extensive use of PET bottles in Mexico has
become a severe environmental problem due to the lack of proper governmental
management and public awareness. Most PET bottles end up pilled in landfills around
Mexico. The lack of recycled PET bottles represents not only a serious environmental
and social problem, but also a missed business opportunity. Throughout the last decade,
significant efforts have been made by the private sector in order to increase the collection
and recycling rate of PET bottles; however, the results are still far from sufficient. Hence,
this thesis has three main objectives. The first is to gain further knowledge about the LCA
methodology. The second objective is to analyze the PET flows in Mexico, and finally, the
third objective is to determine which parameters need to be considered so as to carry out
an LCA for PET recycling in Mexico. A complete LCA is not performed due to the lack of
available information; nevertheless, it does establish the system necessary to carry out a
proper LCA. The results should provide useful information that can assist various
stakeholders in the development of PET recycling programmes in Mexico that are
economically advantageous, environmentally friendly, and socially accepted.
Acknowledgements I would like to thank my parents for all their support; without them this
accomplishment would not have been possible. Moreover, I would like to thank my
supervisor for his guidance and assistance during this “scientific” adventure. Finally,
I am very grateful with Yann Huguenard for his moral support and motivation.
Table of Contents
Abstract .................................................................................................................... ii
Acknowledgements .................................................................................................. iii
List of Figures .......................................................................................................... vi
List of Abbreviations ............................................................................................... vii
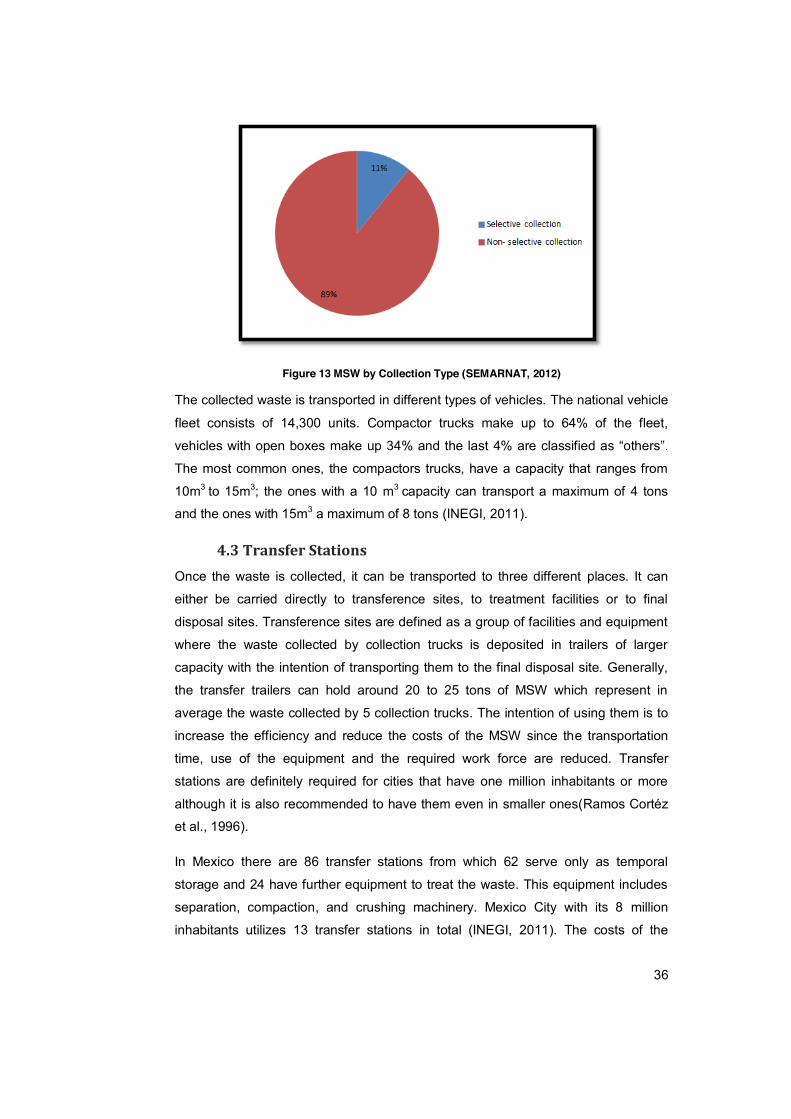
List of Figures Figure 1 Combination of two main aspects of the decision-context (EC/IES, 2010) . 9 Figure 2 Ecosphere, Technosphere and the System Boundary (EC/IES, 2010) ..... 12 Figure 3 Generic Unit Flow Diagram (SAIC, 2006) ................................................. 13 Figure 4 Fictitious Example of an LCI (Pålsson and Riise, 2013) ........................... 16 Figure 5 LCIA Schematic Steps from Inventory to Category Endpoints (EC/IES, 2010) ..................................................................................................................... 17 Figure 6 Interpretation Step with other Phases of the LCA (SAIC, 2006) ............... 21 Figure 7 Global Solid Waste Composition (Hoornweg and Bhada-Tata, 2012) ...... 25 Figure 8 PET Production Process (HITACHI, 2013) ............................................... 27 Figure 9 Post- Consumer PET Recycling Rate (Coelho et al., 2011) ..................... 28 Figure 10 Worldwide Applications of Recycled PET in 2007 (Shen et al., 2010) .... 29 Figure 11 MSW Generation by Region (SEMARNAT, 2012) .................................. 33 Figure 12 Evolution of MSW Composition (SEDESOL, 2012) ................................ 34 Figure 13 MSW by Collection Type (SEMARNAT, 2012) ....................................... 36 Figure 14 Distribution of the Acquired Materials in Collection Centers (SEDESOL, 2012) ..................................................................................................................... 37 Figure 15 Post-consumer PET Bottle Value Chain (Gutiérrez, 2012) ..................... 41 Figure 16 National Post-consumer PET Collection (ECOCE, 2012) ....................... 43 Figure 17 Destination of PET Collected in Mexico (Gasnier & Portales Derbez, 2008) .............................................................................................................................. 44 Figure 18 Installed Recycling Capacity for FDA grade PET (Schwanse, 2011) ...... 45 Figure 19 LCA System Flow Diagram .................................................................... 47 Figure 20 MFA of PET in Mexico, 2011 ................................................................. 48 Figure 21 Collection rate in different collection centers .......................................... 49
List of Abbreviations
PET Polyethylene Terephthalate
LCA Life Cycle Assessment
ISO International Standards Organization
UNEP United Nations Environmental Programme
SETAC Society of Environmental Toxicology and Chemistry
REPA Resource and Environmental Profile Analysis
LCI Life Cycle Inventory
LCIA Life Cycle Impact Assessment
CLCA Consequential Life Cycle Assessment
ALCA Attributional Life Cycle Assessment
DQI Data Quality Indicators
MSW Municipal Solid Waste
PTA Purified Terephthalic Acid
EG Ethylene Glycol
TCCC The Coca Cola Company
PETRA PET Resin Association
EEE Electronic and Electric Equipment
SMA Environment Improvement Sub-secretary
MT Metric Tons
ECOCE Ecology and Corporate Commitment
MXN Mexican
IMER Industria Mexicana del Reciclaje
FDA Food and Drugs Administration
IFC International Finance Corporation
CPR Centro de Procesado de Resinas
BTB Bottle To Bottle
1
1. Introduction In the quest for better materials to achieve technological development, scientists
have created man-made polymers that are resistant, stable and long-lasting;
materials which have become essential for scientific innovation and high living
standards. Polyethylene Terephthalate (PET) is one of them. This versatile polymer
that can be easily transformed to consumer products by automated machines has a
plethora of different applications. PET is largely used in the textile industry, alone or
combined with cotton or wool, to increase the durability and resistance of textiles. In
fact, it represents more than 50% of the synthetic manufacture in the world (Sinha et
al., 2008).
Furthermore since the 1950s, it has been widely used as a film for video, photos and
x-rays. Finally, in recent decades, it has positioned itself internationally as the most
convenient packaging bottle material for most beverages (Sinha et al., 2008). This
attainment is due to the inherent characteristics of the material; its low weight
compared to similar packaging materials, good barrier properties towards moisture
and oxygen, durability, and high transparency (Vest, 2003). PET bottles have partly
replaced glass and metal cans and as a result the global demand for PET is
exponentially increasing. These bottles are mainly use to pack water and
carbonated soft drinks; however, they have been recently introduced to the market
for energy drinks, ice teas, beer, wine and juices.
According to Smithers Pira, the global average demand for PET will increase by 4.8%
for the period 2010-15. It will reach 14.5 million metric tons (Mt), which represents 8%
of the total demand of standard plastics (Brooks, 2012). In 2005, about 65% of PET
production was used to fabricate fiber and 30% was used for bottles (Shen et al.,
2010). This trend might change in the near future since the soft drink sector has
been growing more rapidly than any other PET application (Sinha et al., 2008). PET
experienced the biggest growth in the developing markets of Asia Pacific, Latin
America and Eastern Europe. Nevertheless, the largest consumer of PET is still the
United States, followed by Mexico and China.
The rising production of PET has raised a major environmental challenge as it is
produced from fossil fuels (crude oil or gasoline) and takes a long time to
biodegrade or photo degrade; around 1-3% in 100 years (Perugini et al., 2003). This
dramatically increases the packaging waste in the already crowded disposal sites.
2
However, it is important to point out that PET, once produced, does not pose a
direct risk to the environment by itself but it does significantly increase the amount of
waste volume piled up in landfills, clog sewages, and provide incubation for various
pests (Foolmaun and Ramjeawon, 2012).
To address this situation, different technologies have been developed in order to
recycle the material or to recover its energy content. In this regard, the major
advantage of PET is that it can be 100% recycled; either in a closed loop recycling
route or in an open one, and by doing so the solid waste problem is reduced and the
efficient use of raw petrochemical materials is promoted. In some countries like
Germany, Sweden, Japan and Denmark, the recycling industry is reasonably
consolidated. However, it is widely accepted that further actions must be
implemented in order to truly obtain an advantageous management of the waste
(Perugini et al., 2003).
The PET open loop recycling route is much more mature than the closed loop route.
In the former, PET bottles are recycled into fibers or other items while in the latter,
one they are reconverted into bottles. The technology to recycle PET for use in food
packaging applications is relatively new because there were several safety concerns
preventing its use in the past. However, this is no longer the case and recycled PET
has proven to have the quality required for use in the food industry. In 2007, around
4.5 Mt of PET bottles were recycled into 3.6 Mt of flakes (Shen et al., 2010) of which
around 72% were transformed into fibers, 18% into sheets and strapping tapes, and
just 10% into recycled bottles. It is expected that in the near future more and more
post-consumer PET bottles will be recycled back into new bottles (Shen et al., 2011).
Formerly, many studies have been conducted concerning the utilization of PET.
Most of these studies used the Life Cycle Assessment (LCA) methodology; although
with different purposes. While some studies aimed at identifying environmental
performance indicators or comparing different goods or materials; others sought to
establish a benchmark for various product policies or to provide relevant information
to support the decision making process. In fact, the different applications of LCAs
are quite vast and diverse. Regardless of the specificities of the different PET LCAs,
all of them concluded that recyclying PET is an environmentally friendly practice that
reduces the negative burden of the material production. However, the degree to
which the burden is reduced varies from case to case (Gironi and Piemonte, 2011;
Nakatani et al., 2010; Shen et al., 2011;Foolmaun and Ramjeeawon, 2012;
3
Pasqualino et al., 2011; Romero-Hernández et al., 2008; Schwanse, 2011;Coelho et
al., 2011).
For this thesis, Mexico has been selected as a case study due to the enormous
amount of PET bottles used and disposed of in the country. Mexico is the leading
consumer of soft drinks in the world with a per capita consumption of approximately
163 liters per year (Fox News, 2011). Mexico is also the leader in consumption per
capita of bottled water since the government has failed to provide clean drinking
water from the pipes (Malkin, 2012a). The lack of PET bottles recycling represents a
serious environmental and social problem but also a missed business opportunity.
Therefore, it is crucial to find an adequate waste management solution that is in line
with the principles of sustainable development.
Considering the forementioned information, this thesis has three main objectives.
The first is to gain further knowledge regarding LCA methodology. The second
objective is to analyze PET flows in Mexico and finally, the third objective is to
determine which parameters need to be considered in order to carry out an LCA for
PET recycling in Mexico. A complete LCA will not be performed due to the lack of
available information; nevertheless, it does establish the required system to carry it
out. The results of this thesis will hopefully assist in the development of PET
recycling programmes in Mexico that are economically advantageous,
environmentally friendly, and socially accepted.
In order to attain these three objectives, this thesis will be divided into six different
sections. The first section will provide a broad and detailed description of the
requirements for LCA studies according to the most prominent international
standards, as a detailed understanding of LCA form the basis for its proper
application. The second section will outline some general features of PET and it’s
impact on a global scale; the third will describe the waste generation and
management in Mexico while the forth will analyze the issues regarding PET in the
country. The fifth section will determine the necessary parameters that must be
included in the LCA system and finally, the sixth section will draw some policy
recommendations and conclude the study.
4
2. Life Cycle Assessment Due to rapid environmental degradation and a growing awareness of this issue, a
transition to greener production methods is already taking place. However, there is
still a long way to go in order to truly regard the world economy as a “green one”. An
increasing amount of producers, consumers, governments, and the society in
general seek to know and better understand the production chain of the products
they are either consuming or producing. The idea behind it is to lead their activities
towards sustainability. It is a well know fact that sustainable development comprises
many different components even though its definition is still vague and highly
conceptual1. For Hoffman et al. (1997), sustainable development requires several
circumstances to be met but mostly, it requires urgent improvements in the way we
use energy and natural resources and in the way in which we dispose of the waste
generated from those resources; i.e. eco-efficiency.
The collection and generation of consistent data is one of the bases for a successful
transition to a low carbon economy. It allows the proper quantification and
comprehension of the environmental impacts and resource and energy consumption
that are involved in the life cycle of various products. With the appropriate
information, it is possible to develop solutions to reduce negative environmental
impacts while maintaining the living standards of a society.
One of the most recognized tools that have been developed with the
aforementioned purposes is the LCA. Its principal objective is to reform the
unsustainable consumption and production by transforming processes and products
into more environmentally friendly versions of themsleves. An LCA has been defined
as “a structured, comprehensive and internationally standardized method;; [since] it
quantifies all relevant emissions and resources consumed and the related
environmental and health impacts and resource depletion issues that are associated
with any goods or services (EC/IES, 2010).” In an LCA, the entire product’s life cycle
is taken into consideration: from the extraction of the raw materials, passing through
1“Sustainable development is development that meets the needs of the present without compromising the ability of future generations to meet their own needs. It contains within it two key concepts: the concept of needs, in particular the essential needs of the world's poor, to which overriding priority should be given; and the idea of limitations imposed by the state of technology and social organization on the environment's ability to meet present and future needsWorld Commission on Environment and Development, 1987.”
5
the production line, the use phase, the reuse and recycling of it up to the final
disposal of the generated waste.
Hence, LCA is an influential decision support tool, that when used in combination
with other methodologies, can assist in the transition to a truly sustainable
development given that it identifies environmental impacts that might not have
otherwise been recognized (Nakatani and Hirao, 2011). In order to fully understand
what an LCA is, its benefits and how it has been applied up to this point, this section
will describe in detail the history and the methodological framework of this tool.
2.1 History and Development of Life Cycle Assessment During the 1960s, there was a growing social concern about the availability of
natural resources; which is considered the “first environmental wave”. These
concerns initiated a scientific effort to find the real energy used in different products
and processes in order to determine the future availability of supplies and the time it
would take to deplete them. In 1963 during the World Energy Conference, Harold
Smith, the pioneer in this field, calculated the energy requirements for the production
of chemical intermediates and products. However, the most transcendent study of
the time was “The Limits to Growth” which showed how a growing population and
economy interact with limited resources. Its conclusions served as an inspiration for
the development of further research. In fact, following the publication of the study,
several new studies have been conducted to examine the environmental and
economic implications of various energy sources (SAIC, 2006).
In 1969, the foundation for the contemporary methodology used to conduct an LCA
was developed. The Coca Cola Company carried out an internal study to determine
which beverage container had the lowest environmental impacts and consumed the
least natural resources. In this study, the raw materials and energy requirements
were calculated for each package made out of different material. However, Coca
Cola was not the only company with this idea; as several other companies in
developed countries began performing similar studies. These studies had different
names in the United States and in Europe. In the former they were referred to as
Resource and Environmental Profile Analyses (REPA) while in the latter they were
called Ecobalances. The main problem that these early LCAs faced was a lack of
information due to the fact that their only sources were government documents and
technical papers which were rarely available for the general public (SAIC, 2006).
6
Throughout this period, the initial assumptions and methodologies were revised by
different experts in the field and industry which lead to reasonable improvements.
During the early 1970s, the main public concern was the availability and use of fossil
fuels since the world was in the middle of the first oil crisis. In accordance with the
spirit of the time, Ian Boustead calculated the amount of energy required for the
production of various beverages containers with the intention of determining which
material (glass, plastic, steel and aluminium) should be preferred in terms of energy
efficiency. Over the years the author sophisticated its methodology and by 1979, the
first Handbook of Industrial Energy Analysis was published (Hoffman et al., 1997).
After the oil crisis and throughout the 1980s, the environmental concerns around the
scarcity of fossil fuels shifted to issues concerning waste management. Furthermore,
when hazardous waste became a global problem in the late 1980s, an LCA was the
preferred tool to evaluate the situation. Once again the LCA methodology had to be
improved upon in order to address environmental problems of a different nature
(SAIC, 2006). Finally, during the early 1990s a real interest for the LCA methodology
permeated a large range of industries. It was even considered by the UN Earth
Summit to be the most promising tool to support environmental management
(Hoffman et al., 1997).
The use of LCAs grew so much that they were even improperly used as
advertisement tools. To avoid this situation, different stakeholders successfully
campaigned for the standardization of the LCA methodology and as a consequence
the International Standards Organization (ISO) began the standarization process.
ISO is not the only organization taking on this task, as several other international
institutions and organizations have joined the cause of standardizing the LCA
methodology. In 2002, the United Nations Environment Programme (UNEP) and the
Society of Environmental Toxicology and Chemistry (SETAC) initiated the Life Cycle
Initiative with the purpose of improving this methodological tool with enhanced
statistics and indicators (UNEP, 2000). In the next section the state of the art of LCA
methodology is described by outlining guidelines, principles, and models.
2.2 LCA Methodological Framework According to ISO 14040, an LCA is a “compilation and evaluation of the inputs,
outputs and potential environmental impacts of a product system throughout its life
cycle (Guinée et al., 2001).” Therefore, it can be considered as an analytical tool
that depicts the environmental footprint caused by a product or process from cradle
7
to grave. This term means that an LCA will consider all production stages; from the
extraction of raw materials to its final disposal. As is the case with most scientific
tools, LCAs should, first and foremost, be quantitative in nature and only when the
specific circumstances do not allow it, qualitative aspects should be considered.
LCAs can be used for diverse applications by a vast range of stakeholders. Eco-
labeling is one common example of their application. In this case, an LCA is used to
compare different products with the same function in order to assign a green label to
the products that show better environmental performances. The Green Swan eco-
labeling programme in Nordic countries and the Blue Angel programme in Germany
are considered to be quite successful. Another application of LCAs is eco-design,
which aims at designing and producing new products that are in line with the
environmental concerns. Most of these studies are performed for internal use in
private companies. The use of an LCA is not limited to its direct application in
specific products. Actually, it can be used in a much broader sense such as in
investment development, business strategies or governmental policies (Guinée et al.,
2001).
However, it must be clearly understood that LCAs do have limitations and risks. For
example, they cannot verify which product is more cost effective or which one
provides more satisfaction to clients, as these tasks are out of the scope of the
methodology. Since carrying out an LCA can be time and resource consuming, the
objective must be established in advance in order to determine if an LCA is the
proper tool to reach it (SAIC, 2006). In any case, the results of an LCA must be
considered in combination with other decision making tools.
As such, it provides information for decision support [yet] LCA cannot replace the decision making process itself. One cannot say: ‘The LCA has proved that this decision must be made,’ but rather ‘Based on an LCA study and other evidence, the following decision has been made’(Guinée et al., 2001).
The structured framework established by ISO must be followed in order to perform
an appropriate LCA. This is not a sequential process but an iterative technique,
which means that some elements of the study may have to be redefined over and
over again as the study progresses and the data availability increases or decreases.
The ISO framework, which is supported by wide international consensus, divides the
LCA methodology in four steps: goal and scope definition, Life Cycle Inventory (LCI),
Life Cycle Impact Assessment (LCIA) and interpretation (ISO 14040, 2006).
However, it only serves as a basis for LCA because each individual study should
8
design a suitable process that is attuned to fulfill its particular objective. In the
following sections the four methodological steps are described in greater detail.
2.2.1Goal and Scope Definition
The definition of the goal is the first step in every LCA and is crucial for the design of
the subsequent steps. Therefore, a clear goal is indispensable to design and
interpret an LCA correctly. In order to achieve an appropriate goal some basic
aspects must be defined:
Intended application of the results→ the purpose of the LCA should be
stated in an accurate and explicit way. It is also possible that a single LCA
has distinct intended applications. Depending on these applications, the
requirements and methodological approaches stated by ISO 14040 can
slightly change.
Limitations due to the method, assumptions, and impact coverage→ once
the goal is defined, the limitations resulting from the applied methodology
and assumptions should be clearly stated as to avoid inappropriate
comparability or transferability of results.
Reasons for carrying out the study→ the goal must include a justification that
explains the author’s rationale for Given this rationale, it is possible to
determined the type and quality of data required to perform the study.
Decision context→ the definition of this aspect is of great importance
because it directly influences the modelling framework (attributional versus
consequential) and the LCI method approach (allocation versus substitution)
that will be used. The decision context can be divided into Situations A, B
and C, which will be explained in further detail later in this section.
Target audience of the results→ the audience must be considered so as to
establish the appropriate structure and languageto be used in the delivery of
the results and if any critical review is necessary. There are many different
types of audiences: internal, external, public, private, technical, non-technical,
etc.
Commissioner of the study and other influential actors→ the goal must
clearly state who commissioned or supported financially the study (ISO
14040, 2006).
From all of the various aspects that must be considered, it is necessary to provide
furhter details regarding the decision context. As mentioned before, the decision
9
context can be classified into 3 categories, situations A, B or C. The differentiation
arises from two variables. The first is whether a study explores the consequences of
certain decision or not and the second considers the extent of change that a
decision might produce. Therefore, if a study examines the potential consequences
of a decision, the LCA should reflect these consequences. Otherwise, the study
should simply describe the selected system without considering any aspects of the
decision making process. Regarding the second variable, studies can be classified
by the size of the consequences in the background system.2 Small scale changes
mean that it does not require the installation of further infrastructure. On the other
hand, large scale changes, which are not so common, describe a situation where
the decision transforms part of the economy and the installed equipment. It is
important to point out that these are only changes for the background system since
the foreground system has to be modelled explicitly in both cases (EC/IES, 2010).
Figure 1 Combination of two main aspects of the decision-context (EC/IES, 2010)
As seen in Figure 1, situation A accounts for studies that are carried out to inform
consumers about products that are already on the market or ones that will be
entering it soon. It should be noted that the term product is used for goods and
services. In this situation, the life cycle of a product, either leads to no or very few
changes in the background system. For example, the use of the installed capacity
may be changed, but without the installation of new facilities.
On the other hand, situation B covers circumstances where the consequences of a
certain decision have a large impact on the background system; the consequences
are so far-reaching that extra capacity must be installed. This type of decision
2 Background system is defined as a system that “comprises those processes that are operated as part of the system but that are not under direct control or decisive influence of the producer of the good (or operator of the service, or user of the good)(EC/IES, 2010).”
10
context is mainly applied for policy information and development. Finally, situation C
is used when the objective of the study is a mere description of the product without
the involvement of any decision making that could create changes in the system.
This decision context has two subcategories: C1 and C2. The first describes a
system and its external interactions while the second provides an illustration of the
system in itself (EC/IES, 2010).
These situational concepts can be further classified into two categories: an
attributional life cycle assessment (ALCA) or a consequential life cycle assessment
(CLCA). ALCA, which includes situations C1 and C2, has the objective of describing
the significant environmental input and output flows within the life cycle and its
interactions. On the other hand, CLCA, which includes situations A and B, has the
objective of describing how the same input and output flows will be affected in
response to changes introduced into the life cycle. Decision theorists recognize that
CLCA information is essential in order to make rational decisions (Ekvall and
Weidema, 2004). Some scholars consider a CLCA to be superior to an ALCA
(Earles and Halog, 2011); however, it must be pointed out that it is not about
superiority but appropriateness. Whether the ALCA or the CLCA are “superior” will
depend on the goal of the study in question.
Once the goal has been set, the scope must be defined too. The scope determines
the most important characteristics of an LCA. It covers such matters as “temporal,
geographical and technology coverage; the mode of analysis employed; and the
overall level of sophistication of the study (Guinée et al., 2001).” The scope must be
defined in great detail in order to facilitate the achievement of the LCA goal. While
establishing the scope, some key items must be determined: the functional unit, the
reference flows and the system boundaries and functions.
The functional unit shows the principal function fulfilled by the product’s system and
qualitatively and quantitatively defines the features of the unit by using the questions
what, how, how well, and how long (EC/IES, 2010). International System (SI) units
should be used for the functional unit and reference flows and can be determined
randomly or derived from a standardized measure; however, in each case a
justification must be provided. When making comparisons, it is necessary to choose
a functional unit that can be used equivalently in alternative products systems and to
determine the reference flows for each of them. Reference flows are defined as the
11
“measure[s] of the outputs from processes in a given product system which are
required to fulfill the function expressed by the functional unit (Guinée et al., 2001).”
While comparing functional units and reference flows the LCA practitioners must
make sure that they are indeed equivalent. One of the most common mistakes is to
make a comparison between diverse materials considering their mass (EC/IES,
2010). However, this comparison will be inadequate since 1 kg of gold is not
comparable with the functional unit of 1 kg of silver. In this case it would be more
accurate to use the function of the metals to compare them; 1 gold necklace against
1 silver necklace.
Regarding system boundaries, they determine which stages and processes of the
life cycle belong to the system which is being analyzed. In fact, this boundary
separates the system from the rest of the technosphere. In some cases it is difficult
to draw the line between ecosphere and technosphere; therefore,
[t]he boundary technosphere / ecosphere can hence be more suitably be defined by determining the elementary flow as single substance or energy entering the system being studied that has been drawn from the ecosphere without previous human transformation, or single substance or energy leaving the system being studied that is released into the ecosphere without subsequent human transformation (EC/IES, 2010).
It is very important to accurately define the system boundaries so as to ensure that
all processes and potential environmental impacts are included in them. All
economic activities are interconnected in to certain extent and consequently, in
theory, all should be included in the system. However, not all of these activities have
the same relevance for the analyzed product. Therefore, all flows that are not
especially relevant for the system can be “cut-off”, which means that they can be
excluded. It should be mentioned that only normal and abnormal processes are
covered by the LCA methodology; accidents or similar situations must not be
included (ISO 14044, 2006).
As was previously mentioned, the system boundaries determine which stages and
flows are included and therefore analyzed. This selection of stages and flows is
comprised of a qualitative and a quantitative aspect. The qualitative aspect
determines which phases of the life cycle must be included to guarantee a proper
data set and valid comparison. In attributional LCAs, the life cycle is considered to
be a generic supply chain, while in consequential LCAs, the phases in the
background system that are affected by the decisions made in the foreground
12
system must be considered. This means that elements which are not part of the
analyzed system should be included in the system boundary. The quantitative
aspect ranks the processes and flows in order of relevance. For those that are least
relevant, low quality data can be used with the intention of focusing on the collection
of high class quality data for those that are more relevant. As for the irrelevant ones,
they can be cut-off entirely. These cut-offs must be stated in relation to the
approximate excluded environmental impacts; e.g. 75% shows the cut-off of 15% of
the total environmental impacts (EC/IES, 2010).
Figure 2 Ecosphere, Technosphere and the System Boundary (EC/IES, 2010)
Figure 2 shows a standard system flow diagram with its boundaries, flows and
interactions between the technosphere and the ecosphere. It is strongly
recommended to depict the analyzed system in this way in order to facilitate an
understanding of the product system. Boxes are used to illustrate unit processes
while arrows are used for linking flows; the direction of the arrow indicates the
direction of the flow. In the system flow diagram three types of boundaries can be
distinguished: boundaries between the product and the environmental system,
boundaries between the relevant, and irrelevant system and boundaries between
the analyzed system and other systems (Guinée et al., 2001).
After the determination of all the above mentioned elements, the outcome can be
used to start the LCIA step which is described in greater detail in the next section.
13
2.2.2 Life Cycle Inventory
The second step in an LCA is the LCI. During this phase, all the input (energy and
resources requirements) and output data (solid, liquid and gas emissions) are
collected and organized. Without further analysis, the LCI can be used on its own to
assist in the decision making process. For example, it could be used by the
government to develop emissions limits or natural resources regulations. Basically,
an LCI is a list that contains the energy and materials used in the production of the
analyzed system plus the contaminants that are released to the environment due to
this activity (Pålsson and Riise, 2013). In order to perform an LCI four steps must be
followed: “[d]evelop a flow diagram of the processes being evaluated, [d]evelop a
data collection plan, [c]ollect data [and e]valuate and report results (SAIC, 2006).”
Firstly, it is necessary to develop a flow diagram; what needs to be included in this
diagram is determined by using the goal and scope information. The flow diagram
illustrates the inputs and outputs from the process units. In order to get more
accurate results, the flow diagram should be designed in a more complex way.
However, the more complex it is the more time and resources must be devoted to
data collection and analysis (ISO 14044, 2006). Figure 3 shows a generic flow
diagram.
Figure 3 Generic Unit Flow Diagram (SAIC, 2006)
In order to facilitate the collection of data, it is recommended to divide the analyzed
system into subsystems. Subsystems are individual steps that, when put together,
form a complete system. For each one of the subsystems, input, output, and
transportation data must be collected and specified as much as possible. The
performed activities should also be described.
14
Data should be gathered for the amounts and kinds of material inputs and the types and quantities of energy inputs. The environmental releases to air, water, and land should be quantified by type of pollutant […]Transportation [should be] quantified in terms of distance and weight shipped, and identified by the mode of transport used (SAIC, 2006).
If a process produces more than one product, all co-products should be quantified.
Output products that have no value should be considered as waste; but if they have
a market value they should be treated as co-products. In a multi-input/output system
it is necessary to allocate the burdens between the different co-products. The
allocation can be done by using different methods i.e. allocation based on indicators
of economic value. The inclination towards the preferred allocation method should
be clearly justified (Guinée et al., 2001). The collection of data should be measured
using the formal data quality indicators (DQIs); which are completeness, accuracy,
precision and representativeness. However, it is also recommended to include an
explanation of how the data were generated.
Secondly, a data collection plan should be developed. To start with it, a quality goal
should be determined to use as a benchmark during the collection of data. The level
of accuracy needed for the decision making process will serve as guidance for the
quality goal since there is not a predefined value that fits all LCAs. The decision of
which DQI to use depends on the particular characteristics of the analyzed system
(SAIC, 2006).
In order to maximize time and resources, it is recommended to define which data
sources and types will be used for the LCI in advance; some data sources are
government documents, industry data reports, academic journals, patent reference
books, etc. Data types can be classified into three groups: specific, average, and
generic data. However, in practice the data available is a mixture of three. Specific
data refers to data that has been measured for a specific technology in a specific
site; average data refers to data that combine and average a set of specific data and
generic data refers to data that have been calculated using only a certain amount of
specific data. The types and sources of data that are more suitable for an LCI
depend on the defined goal and scope. Usually, when an LCA is designed to be
publicly available, average or generic data are used, and when the LCA is for the
internal use of an industry it uses specific data (EC/IES, 2010).
As a part of the data collection plan a spreadsheet should be designed to facilitate
the construction of an electronic database. It should include: “system boundaries,
15
type of data used, data collection procedure and data quality measures (SAIC,
2006).” Nonetheless, it can include other categories that seem appropriate for the
case. Each subsystem and element should be included and linked in the
spreadsheet in order to avoid omissions and double counting.
Thirdly, data must be collected. This stage includes the collection of data from
different sources which range from industrial visits to academic publications. Since
this can be very time and resource consuming, many LCA practitioners use
commercial LCA software as a cost effective option even though there is the risk of
losing a certain degree of transparency (Guinée et al., 2001).
Finally, the data must be evaluated and reported. In the final report, all previous
stages should be clearly described and the assumptions explained. An LCI will
contain a great amount of information that is sometimes very different in nature.
Therefore, it is necessary to select a model to consistently aggregate all of it. In
addition, the temporal, geographical and technological representativeness of the
data inventory must be verified. The modelling of a system involves the
transformation of all data from the systems’ processes into a proper scale. This
scale is determined in relation to the processes’ participation in the whole system
and functional unit. To scale all inputs and outputs, the data must be multiplied by
the unit process. The resultant units show the amount of each input needed to
produce one functional unit and the amount of output that is generated after its
production (Pålsson and Riise, 2013). While performing the LCI calculations, it is
indispensable to apply the same calculation procedure throughout. The final LCI
results should only represent the functional unit and the elementary flows that cross
the system’s boundaries (SAIC, 2006).
In order to report the results of the LCI, different formats can be used. The two main
formats are graphical and tabular. It is also useful to divide the results into different
categories. For example, the energy data could be further divided in total energy
process and total energy from the material resource; waste can be divided into
industrial and post-consumer waste; environmental emissions can be divided into
atmospheric and water emissions, etc. By doing so, it is possible to better
understand, handle and report the data. It is recommended to use a combination of
tabular and graphical formats. The inventory itself is better presented in a tabular
way; however, the contents of the tables vary from study to study and depend on the
goal and scope they have. The graphical presentation should assist in the
16
interpretation and reporting of the tables. The objective is to ensure clarity,
especially when the target audience is not comprised by experts in the field (EC/IES,
2010).
Figure 4 Fictitious Example of an LCI (Pålsson and Riise, 2013)
Once the four steps have been realized, the LCI is complete. Figure 4 shows an
example of an LCI in a tabular format. With the LCI information, an LCIA can be
performed. The LCIA is explained in the next section.
2.2.3 Life Cycle Impact Assessment An LCIA is performed with the intention of evaluating the possible environmental
impacts of the analyzed system; i.e. its goal is to link the product or process with
potential environmental negative consequences. Nevertheless, it does not intend to
find out specific impacts associated with the analyzed system. LCI only determines
stressors, which are a series of circumstances that can lead to a determined impact.
The results of LCIAs should not be considered as predictions of actual
environmental effects but only as impact potential indicators (EC/IES, 2010).
To execute an LCIA, it is necessary to have the data previously collected in the LCI.
However, some other elements, mandatory and optional, should be considered. The
mandatory elements are the selection, classification and characterization of the
impact categories, while the optional elements are the normalization, grouping and
weighting of them (ISO 14044, 2006). Each element is explained below in further
detail.
17
The selection of the impact categories must be in accordance with the goal and
scope of the analyzed system. The impacts are the consequences on the
environment that the analyzed system will most likely produce. The impacts are
typically divided into three areas of protection: human health, natural environment,
and natural resources (SAIC, 2006). While performing an LCIA, two types of
practice can be followed: the midpoint or the endpoint. The midpoint, also known as
the problem oriented practice, classifies the flows into a few environmental areas
which facilitate the evaluation of a large number of flows and therefore, it reduces
the complexity of the model. The endpoint, also known as the damage oriented
practice, classifies the flows into different environmental categories, and also
classifies the damage according to human health, natural environment and damage
to natural resources (Pålsson and Riise, 2013). Figure 5 illustrates how the data
from the LCI is used and transformed into an LCIA and the difference between mid-
points and end-points.
Figure 5 LCIA Schematic Steps from Inventory to Category Endpoints (EC/IES, 2010)
In order to decide which impact categories should be included in an LCA, some
features have to be considered. The largest number of relevant impact categories
should be included in the impact assessment so as to fulfill the defined goal and
scope. The impact categories should be considered as independent entities in order
to avoid double counting but they should be kept down to a practical number. Finally,
they should be based on the scientific method (Pålsson and Riise, 2013).
On the subject of classification, the input and output data from the LCI is divided and
grouped according to their environmental impact. The goal is to organize all the data
information from the databases into particular impact categories. For the data that
18
have an impact on only one category, the classification is not problematic; however,
if an indicator can be placed into two categories a classification rule should be
established. According to the ISO (2006), there are two methods of classification.
The first one is applied when the effects are dependent on one another. In that case,
the indicator is divided and proportionally placed in different categories according to
its contribution to each one. On the other hand, the second one is used when the
effects are independent of each other. In such cases, the indicator is placed into all
categories where it fits.
As for characterization, it describes and quantifies the contribution that LCI data
have on the category indicator. First it converts all the different units of an impact
category into a single one and then it adds them all together in order to determine
the total contribution of the analyzed system.
For example, the category indicator Global warming potential is measured in CO2 equivalents. In this case the characterization involves:
1. Converting all emissions to air from the product system that contribute to global warming (CO2, methane, nitrous oxides, freons etc.) into CO2 equivalents, and;
2. Adding up the contribution from each emission into the total CO2 equivalents for the product system (Pålsson and Riise, 2013).
In order to achieve a successful characterization, it is necessary to utilize the proper
characterization factor. For some categories such as global warming there is an
international consensus concerning its appropriateness; however, for some others
such as resource depletion it is still under debate (SAIC, 2006). It is important to
point out that since the impact categories use different characterization factors, it is
not possible to sum them up or to compare them.
At this point, all the mandatory elements have been fulfilled; however, three more
optional steps can be performed. The first is normalization. The objective of
normalization is to improve the level of interpretation of the results. Sometimes due
to the usage of different units it is difficult to correctly understand the results,
especially for a non technical target group. Normalization compares the results with
a reference value, which can be chosen ad hoc e.g. total emissions per capita in a
country, average consumption of certain product, a baseline scenario, etc. Therefore
by showing the normalized results, it is possible to clearly identify and compare the
contribution of the different impact categories on the system. Nevertheless, this
19
comparison only reflects the contribution to a category but not the severity or
relevance of it (EC/IES, 2010).
The second optional step is grouping, and it intends to divide the results into
different categories according to the goal and scope of the analyzed system. The
categories can be also ranked; although this ranking always involves value choices.
The third and final optional step is weighting, which aims to calculate an
environmental value that describes the entire system. To do this, all the impact
categories are multiplied by a weighting factor, which finally allows all the categories
to be summed up.3 The problem with this method is the high level of subjectivity
involved because the weighting factor is not derived scientifically and it is only based
on social sciences. It shows the preferences of the author at a particular place and
time. Consequently, its use cannot be extended any further; its preferences are not
considered to be stable. It is not possible to develop an objective set of weights to
apply to every LCIA, though some weighting methods do exist e.g. Modified Delphi
Technique. This step is considered to be the least developed element of an LCIA
(Pålsson and Riise, 2013).
2.2.4 Interpretation
Once all the previously mentioned steps are fulfilled, their different results can be
interpreted together by considering their levels of accuracy, completeness, and
precision. Also, the assumptions taken throughout the study should be revised. The
interpretation phase has two objectives. First, it analyzes the conclusions, clarifies
the study limitations, and recommends certain strategies that are deduced from the
LCA and second, it should report and present the results in a complete and clear
manner in order to transmit them to the target audience. The presentation should be
in line with the goal and scope of the LCA. The interpretation of the results is not a
straightforward method, can typically directly settle the best alternative. However,
there are some cases where it is not possible to determine the best alternative due
to the high level of uncertainty in the results. Even in these cases, the LCA is still
useful as it provides information to the decision makers in terms of pros and cons of
each alternative (Guinée et al., 2001).
In order to fulfil the interpretation step, three activities must be completed:
identification of significant issues; completeness, sensitivity, and consistency of data
3 Under ISO 14044 (2006) weighting shall not be used in comparative intended for the general public.
20
evaluation and finally, deduction of recommendations and conclusions (EC/IES,
2010). The process involved in each of these activities is described below.
The first activity is the identification of significant issues from all the data collected in
the previous LCA steps. The significant issues can be elementary flows, parameters,
assumptions, processes, products, etc that have had the biggest impact throughout
the LCA. To determine which issues are indeed significant, the data collected should
be evaluated in a broad manner. Due to the large amount of data collected
throughout the entire process, it is necessary to identify the aspects that contribute
the most in order to complete the next steps. The selection of significant issues can
turn into a complex problem from time to time. In order to facilitate the process,
different analyses can be applied. The contribution analysis compares the
contribution of the data results. The dominance analysis ranks the results
qualitatively or quantitatively and the anomaly assessment points out atypical
deviations from the “usual” results. All of them define the relevance of the different
results components (ISO 14044, 2006).
The second activity is the evaluation of the completeness, sensitivity, and
consistency of the results. The objective of this activity is to create confidence in the
results. The completeness check warrants that all the data that are needed are
readily available and complete. A checklist can be developed in order to show that
each relevant area is included in the system boundaries. If relevant data are missing,
measures must be taken in order to remediate the gaps. On the other hand, the
sensitivity check determines the precision and reliability of the results. Previous
studies or the opinion of an expert can be part of this analysis. This type of analysis
is not obligatory; however, it is recommended. Lastly, the consistency check verifies
if the methods, assumptions, models and data are in compliance with the defined
goal and scope. In the event of inconsistencies, it is necessary to justify them with
the purpose of assuring the study’s validity (SAIC, 2006).
The third activity is the deduction of the conclusion and recommendations for the
LCA. The objective is to integrate the LCA limitations, the conclusions derived from
it and the recommendations for the decision makers (Guinée et al., 2001). With the
intention of increasing transparency, it is better to clearly separate the facts from the
judgement. It is advised to present final conclusions separately from
recommendations. The conclusions state if the goal defined at the beginning of the
LCA was reached; if the goal was accomplished the conclusions can be considered
21
as final, but if that is not the case the conclusions must be reformulated and verified
once more. The conclusions must clearly indicate any limitations of the study and
should be as straight forward as possible in order to avoid misinterpretations. Finally,
the recommendations are strategies that should be followed considering the final
results. They should be logical, feasible, and practical and made in a conservative
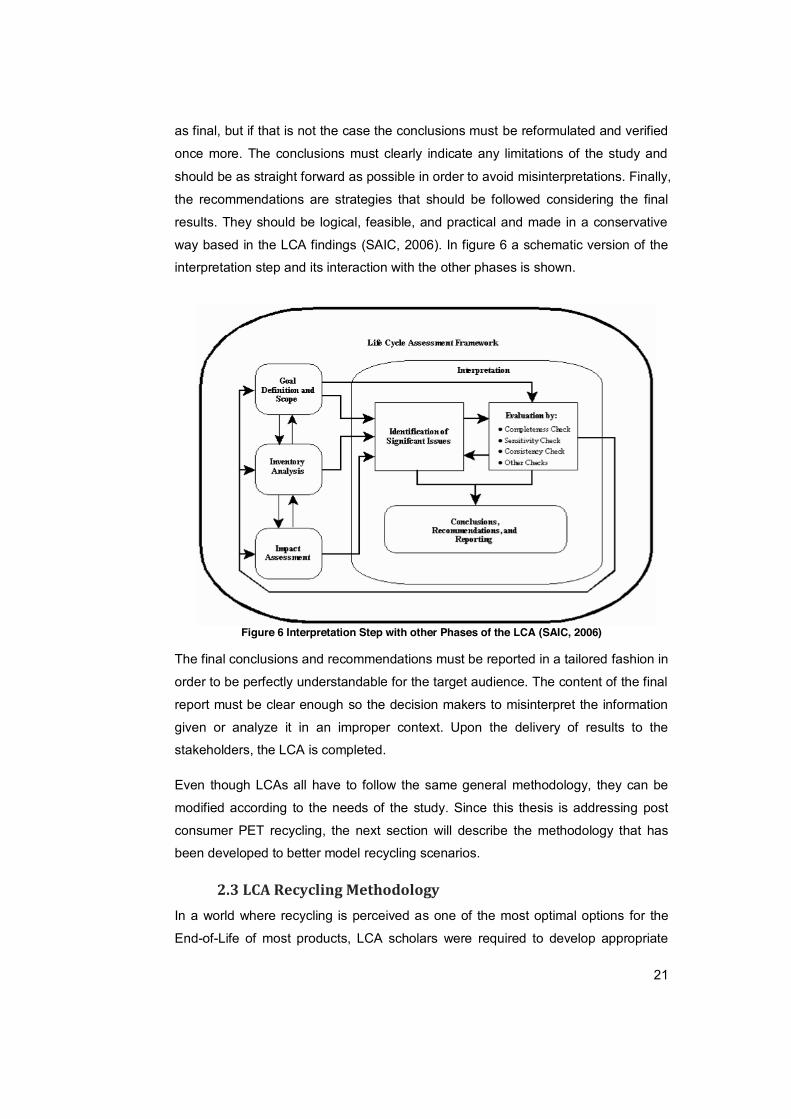
way based in the LCA findings (SAIC, 2006). In figure 6 a schematic version of the
interpretation step and its interaction with the other phases is shown.
Figure 6 Interpretation Step with other Phases of the LCA (SAIC, 2006)
The final conclusions and recommendations must be reported in a tailored fashion in
order to be perfectly understandable for the target audience. The content of the final
report must be clear enough so the decision makers to misinterpret the information
given or analyze it in an improper context. Upon the delivery of results to the
stakeholders, the LCA is completed.
Even though LCAs all have to follow the same general methodology, they can be
modified according to the needs of the study. Since this thesis is addressing post
consumer PET recycling, the next section will describe the methodology that has
been developed to better model recycling scenarios.
2.3 LCA Recycling Methodology In a world where recycling is perceived as one of the most optimal options for the
End-of-Life of most products, LCA scholars were required to develop appropriate
22
ways to measure and prove the various benefits of recycling. This task raised
specific challenges such as the correct placement of the system boundaries and
product allocation.
In order to properly place the system boundaries of a recycling system, it is
necessary to define the kind of recycling route that the product follows. Theoretically,
recycling routes can be classified into 3 different categories: closed-loop recycling,
open-loop recycling and semi-closed-loop recycling. Closed-loop recycling takes
place when the recycled materials are introduced again into the same manufacturing
process. This is possible because the recycled material has the same properties as
the virgin material. In contrast, open loop recycling occurs when the recycled
materials are used in a different manufacturing process since its properties vary
significantly from the properties of the virgin material. Finally, semi-closed-loop
recycling takes place when the recycled materials, albeit conserving the
characteristics of the virgin material, is used in diverse production processes
(Guinée et al., 2001). Closed loop and semi-closed loop are regarded as one
category by most scholars.
The main challenge regarding the allocation of post-consumer products is how to
divide the impacts of the system. Several allocation methods have been developed
thus far. The most utilized ones are: cut-off, system expansion, economic allocation,
input oriented, substitution, value-corrected substitution and multiple recycling. In all
of these, the inputs and outputs can be allocated differently; therefore, in each case,
the allocation method must be clearly explained and documented. If many allocation
methods can be applied to a specific case, a sensitivity analysis can be carried out
to select the method that is most appropriate (ISO 14044, 2006). In the next few
paragraphs each allocation method is explained in greater detail.
1) The Cut-off Method is one of the simplest methods to apply as there is no
need to collect data from other processes that are outside the system
boundaries. The environmental burdens caused directly by a product in the
different stages of its life cycle are assigned to that product. The first life
includes the environmental burdens of the virgin material production while
the second life comprises the burdens of the refurbishing process and the
recycled material. The environmental burden of waste disposal will not be
counted until the materials are finally disposed of in sinks (Link et al., 2009).
This method is seen as a promoter of products that contain a high amount of
23
recycled materials.
2) The System Expansion Method is used to avoid allocation problems. All the
processes involved with a product are placed inside the system boundaries.
Actually, ISO 14044 (2006) greatly encourages the use of system expansion.
However, the inclusion of new processes witin the system boundaries can
greatly increase the level of complexity and could even lead to new
allocation problems (Guinée et al., 2001).
3) The Economic Allocation Method is based on the monetary value of the
inputs and outputs of the system, and its goal is to find the economic
equilibrium of the different flows. It assumes that since the system is part of
the economy, it is possible to base allocation decisions on economic data.
Nevertheless, this method is complicated as market prices oscillate with
supply and demand (Franklin Associates, 2009).
4) The Input Oriented Method is based on the cut-off approach. It only
considers the system inputs including collection, recycling and waste
disposal. However, the output of the system in not placed inside the system
boundaries (Ligthart and Ansems, 2002).
5) The Substitution or Avoided Burden Method is based on the assumption that
recycled material is substituted for virgin material. It is especially useful when
the recycling route is a closed loop since virgin and recycled materials share
the same properties. ISO 14044 (2006) states that for the closed- loop route,
allocation is not necessary due to the complete substitution of the virgin
material. This method also includes the refurbishing of new material since
some of the virgin material is disposed of without recycling. It promotes the
benefits of recycling as an increase in the recycle rate leads to a reduction of
environmental impacts (EC/IES, 2010).
6) The Value-corrected Substitution Method takes into account the difference in
quality between the virgen material and the recycled one. It uses the material
to price ratio to determine the quality loss in the recycled material. This ratio
will then determine the amount of recycled material that can be substituted
for the virgin one, i.e. the market prices are considered as a proxy for
material quality. It is necessary to have a constant price relation between
both materials otherwise, as in the economic allocation method, this method
becomes quite complicated due to the price volatility. Environmental burdens
change in relation to the price variation, even if the rest of the system
remains the same (Ligthart and Ansems, 2002).
24
7) The Multiple Recycling Method is used for open-loop and semi-closed -loop
recycling routes where the recycled material slightly changes its
characteristics. It is used for recycling processes that have more than one
life cycle. Several parameters are needed in order to determine the
cumulative amount of product for the number of cyles and the environmental
impact of the system. The parameters are: recovery rate, yield of the
recovery process, impact of the primary production, impact of the secondary
production, and the number of life cycles (Ligthart and Ansems, 2002).
3. PET Problematic In the last few decades, due to rapid economic development and high rates of
urbanization, the disposal of garbage started to become a genuine and ever-growing
global problem. In urban areas most of the world’s rubbish is generated; however in
general, they have better waste management than their rural counterparts. In 2012,
cities all around the world “generate[d] around 1.3 billion tonnes of MSW a year, or
1.2kg per city-dweller per day, nearly half of which comes from OECD countries
(The Economist Online, 2012).” It must be emphasized that these averages are
broad estimations since the garbage generation greatly diverges from one place to
another. Also the composition of waste varies and is shaped by a number of
different factors like income level, culture, weather, natural resources, among
several others. For example developing countries have a larger proportion of
organic waste than developed countries which present high amounts of plastic and
paper (Hoornweg and Bhada-Tata, 2012).
25
Figure 7 Global Solid Waste Composition (Hoornweg and Bhada-Tata, 2012)
As seen in Figure 7, plastic represents 10% of the global MSW, which is a
considerable percentage; especially if it is compared to other inorganic materials like
glass or metal. Since its invention, plastic has been used to substitute other
materials and it is considered as the engineering material of our time. It is the “most
intelligent application of crude oil, since more than 80% of this valuable source is still
used for the direct production of energy (Perugini et al., 2003).” PET is a variety of
plastic that has experienced an exponential growth due to its numerous convenient
properties. This material has been so successful because it presents several
economic and environmental advantages over similar materials. Its production is
cheaper and less energy consuming than other material, and it is easier to transport
given that it is significantly lighter. Furthermore, it fulfills the same quality
requirements as other materials in order to be used in food packaging (Coelho et al.,
2011).
According to a study from Smithers Pira, the global consumption of PET will be
around 19.1 million tonnes by 2017(Brooks, 2012). The United States is the leading
consumer of PET packaging followed by China and Mexico. This increase is mainly
due to the massive consumption of beverages that are packaged in PET bottles. In
2007, the global consumption of PET bottles was 15 million tonnes, which
accounted for 8% of the world plastic production (Shen et al., 2010). The increasing
consumption of PET has lead to a serious environmental problem. Due to its
26
chemical composition, PET biodegrade in an extreme low pace which means that
PET bottles occupy an important fraction of landfill space that is already crowded
and scarce (Perugini et al., 2003). Furthermore, it is possible that this disposal
technique will not be accepted anymore since it contributes to ground water pollution,
gaseous emissions and health problems.
As a consequence, proper waste disposal of PET has become a relevant issue. PET
non returnable beverage bottles entered gradually into different recycling schemes.
Today, the recycling of post consumer bottles can be seen as an industry under
consolidation in most developed countries. The most successful case of PET bottle
recycling is that of Japan, which in 1997 introduced national legislation in order to
promote PET recycling. In a decade, the collection rate increased to 88.4%
(Nakatani and Hirao, 2011). However, around the world the collection rate is much
lower than in Japan even for developed countries.
Environmental awareness and strategies are no longer considered to be a
temporary tendency but they have become a central part of the plastic industrial
philosophy. The business environmental approach, once implemented due to
stringent legislation is now implemented as a market strategy and company
guideline. The idea of sustainable packaging; where all stakeholders prosper, has
genuinely permeated the PET industry. The main idea behind it is to decouple the
economic development from the environmentally negative consequences that it
produces (Welle, 2011). The analysis of the production and disposal chain is
necessary to determine the environmental impacts of a product. Therefore, in the
next section, PET bottle production and recycling is explained in greater detail with
the intention of better understanding the dynamics of the industry.
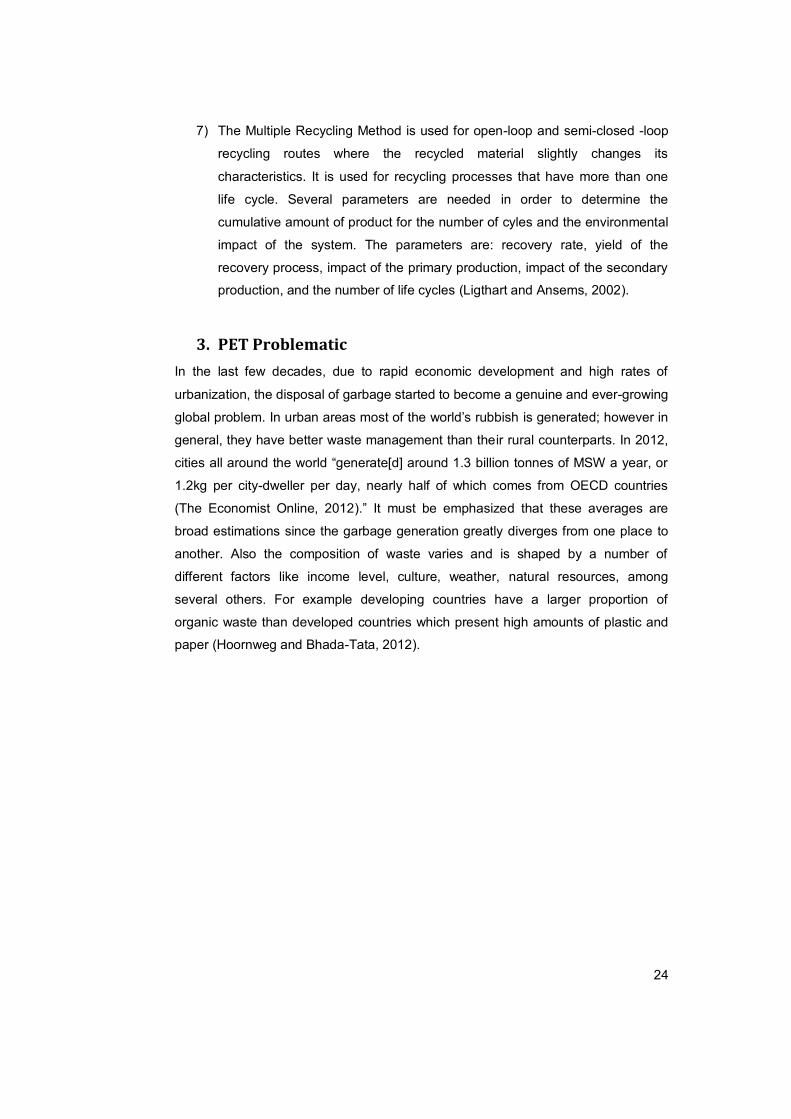
3.1 PET Bottles Production PET is produced from non renewable resources such as crude oil or natural gas. It
is “made through a polycondensation of [Purified Terephthalic Acid] (PTA) with
ethylene glycol (EG)(HITACHI, 2013).” In Figure 8, the PET production process is
depicted.
27
Figure 8 PET Production Process (HITACHI, 2013)
Once PET is produced, it is transformed into different products by diverse processes.
In the case of PET bottles, the production consists of mainly three stages.
First, the polymer is synthesized from crude oil usually using
antimony trioxide as a catalyst and pure PET flakes are produced.
Then, small and dense test-tube like pre-forms which weigh the same
as the final bottle are injection moulded from the PET flakes. Finally,
the bottles are formed by stretch-blow moulding of these pre-
forms(Best Food Forward, 2008).
Once the bottles are formed, they are ready to be filled up and distributed to the
consumers. When consumers finish using PET bottles, they can be disposed of in
different ways; recycling is one of them. In the next section PET recycling is
explained.
3.2 PET Recycling Many developed countries operate municipal waste incinerators as a solution for
crowded landfills and to produce energy from waste. However, this solution has not
satisfied some important stakeholders and has created long lasting conflicts with
environmentalist groups and the waste recovery industry. Regarding the plastic
portion of waste, the main problem is that during simple incineration toxic gases are
produced. Hence, complementary solutions needed to be established and waste
recycling was one of the most popular solutions proposed to reduce garbage.
28
Recycling comprises the reintroduction into the system of used material and energy
that was previously considered merely as disposable waste. Besides, it extends the
lifetime of material since once it is consumed and disposed of, it can be processed
into new raw material (Coelho et al., 2011).
Recycling strategies and technologies have been implemented for a long time in
most of the developed world and lately, it has turned out to be much more common
practice in developing and transition countries as well. In Europe, member states
first introduced these practices in order to comply with the European Council
Directive 94/62/EC on packaging and its waste (Sevigné et al., 2011). Nevertheless,
the packaging industry embraced the idea of producing sustainable packaging
options and set recovery and recycling rates for their products. Evian, a producer of
mineral water, is aiming to use 50% of recycled PET in all its products and the Coca
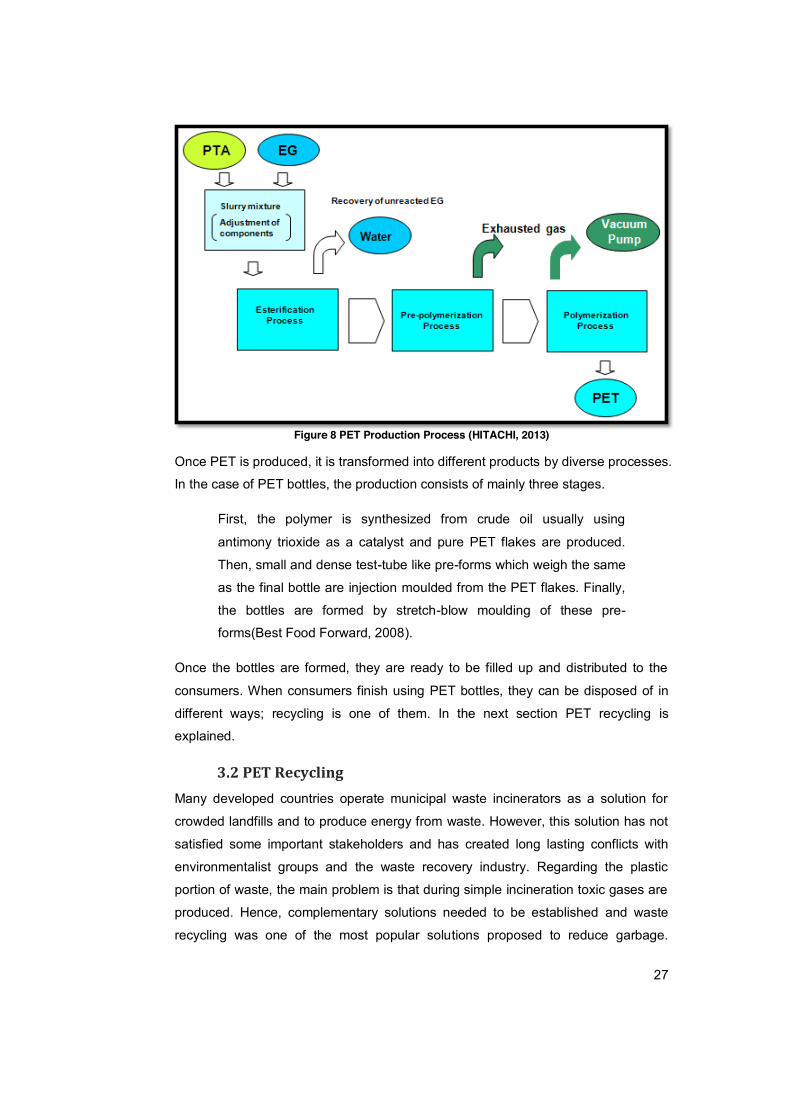
Cola Company (TCCC) is aiming for 25% (Schwanse, 2011). Figure 9 illustrates the
post-consumer recycling rate of some developed and developing countries. One
interesting fact is that some developing countries have higher rates of PET recycling
than developed countries. Brazil has a higher recycling rate than Europe and
Argentina has a higher one than the United States.
Figure 9 Post- Consumer PET Recycling Rate (Coelho et al., 2011)
Even though, the recycling of PET has become a well founded industry around the
world PET recycling rates are still very low. Since most of the PET garbage is
comprised of PET bottles, their recycling can be considered to be a good
approximation of PET garbage recycling as a whole. In 2007, only 30% of the post
consumer PET bottles were collected and reprocessed into flakes, which can be
used as raw material in the manufacturing of new PET products (Shen et al., 2010).
Even if there is real determination and willpower from several stakeholders to
increase the PET recycling rates several difficulties are still in the way. The main two
29
obstacles are the process costs and the lack of a guarantee in the supply (Brooks,
2012). However, it is expected that with the proper strategies, these difficulties will
be overcome.
As seen in Figure 10, from the PET that was recycled, 72% was transformed into
fibers, 10% into new bottles and the rest into different applications. This proportion
might change in the near future since it is expected that PET bottles will be recycled
mainly into new bottles.
Figure 10 Worldwide Applications of Recycled PET in 2007 (Shen et al., 2010)
As noted, PET bottles can be recycled into different final products. The recycling
routes for PET can be broadly divided in two categories: open loop recycling and
closed- loop recycling (Nakatani et al., 2010).
Open-loop recycling, also called mechanical recycling, refers to a process where a
product that is composed of one type of material is transformed by recycling
techniques into another product (Coelho et al., 2011). This kind of recycling can be
further classified into open-loop with the same primary route and open-loop with a
different primary route. The first one refers to recycling that does not change the
intrinsic characteristics of the product, and the second one describes one that
changes them (ISO 14044, 2006). In the case of PET bottles, these are transformed
into polyester fibres, sheets, strapping tape, bristles of brooms and brushes, shower
stalls, film, etc. Mechanical recycling converts PET flakes into a diversity of products
by melt-extrusion. In fact there are two ways to produce recycled fibres. One is to
extrude directly the PET flakes into fibres and the other is to transform the PET
flakes into PET pellets and then extrude them into fibres. During this process around
30
1% of the PET flakes cannot be reused and are discarded as PET scrap (Shen et al.,
2010). Even if recycled PET fibres have a wide range of applications, it does not
replace 100% the virgin PET fibres since this one is used to produce some products
that cannot be produced using recycled PET as raw material. While virgin PET
fibres can be used in technical applications, high performance applications and
apparel; recycled PET fibres can only be used in technical ones due to its limited
dyeing ability and lack of capacity to produce microfiber (Shen et al., 2011).
On the other hand closed-loop recycling, also called chemical recycling, refers to a
process where the waste or by-product of a product is used to manufacture the
same product once again. Theoretically, closed-loop recycling could be used in the
creation of new products without having to use virgin materials (Coelho et al., 2011).
During the chemical recycling process the PET bottles are transformed by
depolymerisation techniques into monomers or oligomers. Nowadays, there are
several common depolymerisation technologies like “glycolysis, methanolysis and
alkaline hydrolysis (Shen et al., 2010).” By applying substantial cleaning and
processing, the recycled PET obtains the same quality as the virgin one.
However, this was not always regarded as true and a major concern has always
been the decontamination of the PET pellets for their reintroduction into food
packaging. The most problematic contaminants are adhesives (Coelho et al., 2011)
However, with the development of new technology, closed- loop recycling is a reality.
The downside is that it is significantly more expensive than open-loop recycling due
to quality requirements. In order to determine the quality of the recycled PET, the
intrinsic viscosity, color, visible unwanted materials, and invisible unwanted
materials (Nakatani and Hirao, 2011) are checked out and ensured. Therefore,
chemical recycling usually needs to be performed in a large scale so as to become
profitable.
4. Waste Current Situation in Mexico In Mexico, the industrialization process created a higher demand for raw materials in
order to satisfy the consumers increasing consumption of goods and services.
Moreover, the economic development led to an enhancement of the purchasing
power of the population, which consumed more and therefore increased waste
Even if Mexico is a middle income country, its waste management system lags way
behind its level of development. Actually, the Mexican waste management system
could be categorized as a pre-modern one due to the fact that is mainly based on a
single disposal technology i.e. landfilling (Aparcana and Salhofer, 2013).
Furthermore, it uses equipment that is essentially out of date or inadequate and
infrastructure which is managed by local governments. The involvement of private
stakeholders is quite limited and is predominantly present in the recycling sector
where informal and uncontrolled activities take place. Therefore, nowadays, one of
the most pressing matters in the country is the collection, treatment, and disposal of
waste. “These aspects have not only environmental and sanitary implications, but
economical, commercial, technological, social and political ones as well; these
implications can spread even beyond the country’s borders turning it into a global
issue which can affect other countries as well (Armijo de la Vega et al., 2006).”
In Mexico, environmental awareness started around the 1970s when environmental
degradation reached a very high level. In 1976, the national authorities finally
recognized this pressing matter with the creation of the Subsecretaría de Mejoramiento Ambiental (SMA). During the next few decades, the SMA
implemented several projects in major cities with the intention of developing a
standard MSW management (Armijo de la Vega et al., 2006). However, due to the
lack of real political will and public investment, the installed infrastructure was
neither sufficient nor effective. There is a significant lack of correspondence
between the growth rate of the waste generated and the new infrastructure that is
introduced.
Regarding legislation, Mexico introduced federal waste related laws rather late. The
General Law for Waste Prevention and Waste Integral Management entered into
force in 2003. It was designed to fill in many regulation gaps concerning MSW
management. In this law, waste has two different connotations. The first one is as a
pollutant that should be avoided, reduced and handled in a sustainable way and
should apply the polluter pays principle. The second one is as a valuable material
that can be reused, recycled or incinerated in order to recover the energy contained
in it.
Also, it classifies the waste in three different groups according to its characteristics
and origin: MSW, special treatment waste and hazardous waste. With this law as a
guideline, new regulations have been issued to facilitate waste prevention,
32
generation, management and disposal. However, the complexity of the geographic,
economic, social and political situation is often an obstacle that hinders the
development of reforms in order to improve the Mexican MSW management
(Schwanse, 2011).
In the next sections, the different steps of the MSW generation and management
are described so as to provide a better understanding of the current waste situation
in Mexico. This information will be useful to develop recommendations concerning
management strategies for PET waste.
4.1 MSW Generation MSW is defined as the waste that is generated by private homes, schools, hospitals
and businesses and it is the result of the everyday items that are used and then
discarded. MSW includes packaging, furniture, clothes, food scrap, newspaper,
appliances, and batteries, among others (EPA, 2012).
In Mexico, the MSW has shown a steady growth due to industrialization,
urbanization, introduction of new technologies and changes in consumption patterns.
In 1992, the MSW generated was around 21,967 thousand tons and by 2011, that
amount nearly doubled. In 2011, Mexico had 112,336,538 inhabitants that produced
around 41, 062 thousand tons of waste, which means that 112 tons were generated
each day nationwide (SEMARNAT, 2012). This amount of garbage places Mexico
as the 10th biggest MSW producer worldwide (Gasnier and Portales Derbez, 2008).
The per capita waste generation was 0.870 kg per day (Armijo de la Vega et al.,
2006). If compared with the rest of the OECD countries, the Mexican per capita
waste generation is one of the lowest; just surpassed by Slovakia and Poland
(OECD, 2007).
Nevertheless, it presents important variations within the country; it ranges from
0.680 kg in the Southern part of the country to 1.40 kg in Mexico City (SEMARNAT,
2012). It has been suggested that more economic development leads to higher rates
of waste generation and as a whole, this trend is accurate for the Mexican case. The
states that generated more waste per capita were the ones which had a larger
contribution to the GDP. In fact, positive lineal relation was found between
contribution to the GDP and the MSW generation. From 32 states, only two were
regarded as outsiders: Mexico City and the State of Mexico. For the first one, the
contribution to the GDP is higher than the one of its waste generation and for the
State of Mexico the opposite is true (SEMARNAT, 2012).
33
Figure 11 MSW Generation by Region (SEMARNAT, 2012)
As seen in Figure 9, half of the national waste is generated in the central region of
the country while the south contributes the least to waste generation. If instead of
classifying waste generation by region, it is classified by state, then only seven
states account for 53.7% of the national waste generation. These states are Mexico
City, State of Mexico, Jalisco, Veracruz, Guanajuato, Tamaulipas and Nuevo Leon.
Alternatively, if it is classified by locality size, then the cities that have more than one
million inhabitants contribute to 44.9% of the total waste generated. Furthermore,
the waste generation rate of these cities increased by around 48% in the last
decade while the small cities and rural areas showed a smaller increase of only 15%
(SEMARNAT, 2012).
In terms of waste composition, half of it is comprised of organic waste while the
other half is divided into potentially recycled materials (32.3%) and others.
Nonetheless, these shares have changed following the economic situation. During
the 1950s, the percentage of organic waste was around 70% while nowadays it only
accounts for 50.4% (SEMARNAT, 2012).
34
Figure 12 Evolution of MSW Composition (SEDESOL, 2012)
As seen in Figure 12, all components besides “others”, presented an increase in
terms of quantity. Since 2000, the plastic share increased far more than the rest of
the MSW components and it is expected to keep growing at a high rate.
Nevertheless, it accounted for merely 10.9% of the MSW while paper and cardboard
represented 13.8%, textile 1.4%, glass 5.9%, metal 3.4% and other residues 12.1%
(Mascott Sánchez et al., 2012)
In order to dispose of all the waste that is generated in the country, several different
steps are involved. In Mexico, MSW management involves four activities which are
collection, transfer and transportation, treatment and final disposal. In the next
sections each is described in greater detail.
4.2 Collection and Transportation In Mexico, one of the main challenges of collection is the lack of proper storage
facilities in private households, schools, hospitals and businesses. “Temporary
waste storage is perhaps the one element of the cleaning system that has received
the least technical and professional attention (Armijo de la Vega et al., 2006).” The
major problem is that most of the time, the places used for temporary storage for the
waste were not designed for this purpose, and therefore, they are typically highly
inadequate and risky.
One common difficulty that arises is that storage facilities of poor quality ofetn break
apart while being carried to the collection trucks. However, the majority of
35
households place their garbage outside their houses in plastic bags. Therefore,
kerbside collection is inefficient because it has to be done manually house by house
(Armijo de la Vega et al., 2006). Waste collection is the most expensive MSW
management stage, and it uses around 60 to 70% of the total budget. Nevertheless,
the collection costs strongly vary from $30 to $640 per ton depending on the
population density, the amount of waste collected, the filling efficiency of the truck,
the condition of the vehicles and the routes’ designs (Gutiérrez Avedoy, 2006). From
all the collection costs, the salaries of the employees represent around 60% of the
overall collection. An increase in the labor force productivity could reduce a
significant fraction of the total MSW management costs (DEFRA/Embajada Británica
en México, 2009).
Regarding the MSW collection rate, it has improved in the last decades. In 1996, it
was around 70% nationwide; however, it reached 88.4% by the year 2007. As for
waste generation, the collection rate highly depends on the location’s income level,
urbanization and size; the bigger and richer the cities, the higher collection rate they
have. For example Mexico City collects 98% of the volume that is generated while
the state of Oaxaca collects 78.9 % (SEMARNAT, 2012).
With reference to collection routes, Mexico is quite underdeveloped. The most
common method used for the design of collection routes is based on the experience
and judgment of the cleaning chief or of the truck drivers (DEFRA/Embajada
Británica en México, 2009). In the entire country just 26.67% of the routes can be
considered efficient since they were designed by technical methods. The local
governments, which are in charge of the collection routes’ designs, do not have
enough resources to develop adequate collection strategies, and therefore, the
majority of cities are provided with ineffective and insufficient collection routes.
Even though in recent years several stakeholders have actively promoted the
garbage separation, it is still quite low. In the majority of the country, waste is
disposed of without any distinction between organic and inorganic. Sometimes even
if it is separated at the source, it is mixed during the collection process since the
trucks do not have separated spaces for each type. In 2010, only 11% of the
collection was selective while the rest was mixed (SEDESOL, 2012).
36
Figure 13 MSW by Collection Type (SEMARNAT, 2012)
The collected waste is transported in different types of vehicles. The national vehicle
fleet consists of 14,300 units. Compactor trucks make up to 64% of the fleet,
vehicles with open boxes make up 34% and the last 4% are classified as “others”.
The most common ones, the compactors trucks, have a capacity that ranges from
10m3 to 15m3; the ones with a 10 m3 capacity can transport a maximum of 4 tons
and the ones with 15m3 a maximum of 8 tons (INEGI, 2011).
4.3 Transfer Stations Once the waste is collected, it can be transported to three different places. It can
either be carried directly to transference sites, to treatment facilities or to final
disposal sites. Transference sites are defined as a group of facilities and equipment
where the waste collected by collection trucks is deposited in trailers of larger
capacity with the intention of transporting them to the final disposal site. Generally,
the transfer trailers can hold around 20 to 25 tons of MSW which represent in
average the waste collected by 5 collection trucks. The intention of using them is to
increase the efficiency and reduce the costs of the MSW since the transportation
time, use of the equipment and the required work force are reduced. Transfer
stations are definitely required for cities that have one million inhabitants or more
although it is also recommended to have them even in smaller ones(Ramos Cortéz
et al., 1996).
In Mexico there are 86 transfer stations from which 62 serve only as temporal
storage and 24 have further equipment to treat the waste. This equipment includes
separation, compaction, and crushing machinery. Mexico City with its 8 million
inhabitants utilizes 13 transfer stations in total (INEGI, 2011). The costs of the
37
transfer stations vary greatly but in general they account for around 22% of the
MSW management budget. The cost ranges from $22 to $145 per ton (Gutiérrez
Avedoy, 2006).
4.4 Waste Treatment In Mexico, waste treatment has not shown the desired results, and its application is
still rather low. From the 2,456 municipalities only 6% utilized any type of waste
treatment facility. In the case of organic waste, it is necessary to install composting
plants in order to treat it. In Mexico, the composting market is not fully developed
and the compost produced presents serious quality problems. The capacity of these
plants varies significantly. For example, the composting plant with the biggest
capacity is located inside the main landfill of Mexico City and receives around 10
tons of organic waste per day. Nevertheless, there are others that only receive 1 or
2 tons per month (INE, 2006).
Regarding inorganic waste, different processes are necessary to recycle a variety of
materials. Even though serious efforts have been made nationwide to increase the
volume of waste that is recycled, the recycling rate is extremely low. In 1998, 2.4%
of the total waste was recycled and a decade later the rate only increased to 3.9%
(SEMARNAT, 2011). One of the governmental strategies to improve the recycling
process was the establishment of collection centers around the country. In 2010
there were 241 collection centers that received around 103 tons of waste per day
(INEGI, 2011). In Figure 14, the distribution of the collected materials in these
collection centers can be seen. The most collected materials are paper and
cardboard while cooper, bronze and lead are the least collected.
Figure 14 Distribution of the Acquired Materials in Collection Centers (SEDESOL, 2012)
38
In 2007, the materials which had the highest recycling rates according to their
consumption were metals at 24.1% recycled followed by glass at 17.8%, and paper
at 8.5%. The lowest ones were plastics and textiles at 0.3% each. However, the
recycling rates change if they are measured according to the total volume of MSW.
In that case, the highest recycling rate corresponds to paper at 38.7% followed by
glass at 34.7% and metals at 26%. The lowest ones were once again plastics and
textiles at 0.5% and 0.2%, respectively (INEGI, 2011). The overall recycling rate
ranges between 5-8%; a low rate compared to other countries with the same level of
development (Schwansee, 2007).
4.5 Final Disposal The final disposal refers to the permanent placement of MSW in a certain location
(Mascott Sánchez et al., 2012). As mentioned before, the majority of the waste is
not treated and goes directly to its final disposal in landfills. It is estimated that the
41,062 thousand tons produced in the country require around 115,123 m3 of space
for disposal (SEDESOL, 2012). It is necessary to find new strategies to reduce the
MSW as land has become a scarce and valuable resource. In Mexico, landfills are
regarded as an adequate disposal method of MSW; however only 13% of all waste
is disposed of in controlled landfills. Nowadays, there are 1,882 registered final
disposal sites from which 1,644 are considered open air dumps since they do not
comply with the minimum legal requirements (Armijo de la Vega et al., 2006).
However, it must be taken into account that the volume capacity of the landfills is
much higher than into open air dumps. In fact, 67% of the total municipal solid waste
goes to landfills. Furthermore, there has been a significant improvement in the
amount of landfills constructed in the country. In 1995, there were as few as 30
landfills but by 2011 the number reached 238 (SEMARNAT, 2011).
5. PET Situation in Mexico The extended use of PET products in the world has produced serious environmental
concerns, and efforts have been made to try and reduce these concerns in the last
past few decades. In this section the PET situation in Mexico is analyzed as to show
the extent of the issue on a national level.
Plastics account for 10.9% of the MSW in Mexico; and even though this may seem
to be a small fraction, the plastic share has increased far more than the other shares
since 2000. From the plastic share of waste, 10% consists of PET products (Conde
39
Ortiz, 2012). Most of the PET consumed is produced locally; there are 90 PET bottle
industries that produce between 700 and 800 tons of bottles per year. This amount
is likely to increase due to the 13% annual demand growth (Diaz Dosamante, 2010).
This trend is mainly attributed to two factors. The first is that the water coming from
the pipes in Mexico is not potable, even when there have been important public
investments to remediate the situation. Hence, most water consumption comes from
purchasing and drinking bottled water. According to the Inter-American
Development Bank, each Mexican consumes around 450 liters of bottled water per
year, which places the country in first place for bottled water consumption per capita
in the world (Malkin, 2012a). The second factor is that Mexico is also the biggest
soft drink consumer per capita in the world. Each Mexican consumes 163 liters of
soft drinks per year (Fox News, 2011) and discards about 365 bottles or 8.7 kg of
PET annually (Schwanse, 2011). A typical Mexican household spends a large
portion of their food expenses on soft drinks; in fact, the only food expenditures that
surpass this portion are tortillas and milk (Medina and Smith, 2013). As a
consequence of the enormous consumption, the lack of recycling awareness among
the population and PET non biodegradability, PET bottles have turned into a
national environmental curse.
Millions of bottles are inappropriately disposed of in public places, roads, etc.
creating visual contamination. Moreover when PET bottles end up in water bodies,
they endanger the wildlife, damage the fishing nets, and ruin the coastal areas. It is
estimated that over 80% of all marine debris is composed of plastic waste,
principally plastic bags and bottles (UNEP, 2009). When they do not reach water
bodies, PET bottles highly contribute to the clogging of sewage systems causing
floods. In landfills, they represent 2-5% of the total MSW and 7-10% of the total
volume (Schwansee, 2007). These high percentages are due to the fact that the
PET recycling industry in Mexico is quite young and that the amount of recovered
material is extremely low compared to the total production. The current national PET
recycling rate is around 6.7%.
5.1 PET Collection in Mexico In order to promote the recycling industry, first it was necessary to guarantee the
supply of post-consumer material. In Mexico as stated in the previous section, the
collection of recyclable materials varies from municipality to municipality, and it is
mainly uncontrolled. The collection is essentially done by the informal sector
40
because separated MSW collection programmes and government collection centers
are quite limited. The informal sector consists of scavengers, street sweepers and
employees of the MSW cleaning department (Armijo de la Vega et al., 2006). In
2003, it was estimated that there were 25,000 to 30,000 scavengers only in Mexico
City (Velasco Pérez Alonso, 2011). There are no official figures but the number is
expected to be higher by now.
The majority of these people work directly in open dumps and landfills without any
protection gear thus they face high health risks due to their constant contact with
waste. In addition, they do not have any kind of social security and they have to
work long hours for a very low amount of money. “Each scavenger earns $39 to $62
a week (Malkin, 2012b).” As with other marginalized groups, scavengers often suffer
from different types of addiction and domestic violence; besides, half of the adults
are women and many of them are single mothers. In many cases entire families,
which have in average 6 children, work in the landfills. “A survey [conducted] in
seven cities showed that 40% of [them] had no formal education, 10% had been
educated for 2 years and only 4% had completed elementary education (OECD,
2003).” Since children are more vulnerable, the constant and direct contact with the
polluted environment leads to a high rate of gastrointestinal, respiratory and skin
diseases as well as psychological damage (Medina and Smith, 2013). This
unfavorable situation can perpetrate their poverty, and keep them in the landfills or
trucks for the rest of their lives.
Other scavengers work as “volunteers” for the government collection trucks, where
they try to separate as much waste as possible before the truck gets to the landfill.
These volunteers earn less than they would working in the landfills, but they prefer it
because they aquire less infections and diseases this way (Malkin, 2012b).
In most landfills, scavenger associations and unions have been formed. Two
examples of these associations are: Asociación de Selectores de Desechos Sólidos de la Metrópoli which works at the San Juan Aragón landfill and the Unión de los Pepenadores del DF of Rafael Gutiérrez Moreno which works at Santa Catarina
(OECD, 2003). These Unions work as lobbying groups with a high level of political
influence and control over all transactions made in their landfills. The money the
scavengers receive as compensation is less than the market prices since the sorted
products are collected by these leaders so as to sell them afterwards to middlemen
and PET brokers. This last group sorts, washes and granulates the PET bottles
41
(Schwanse, 2011). On average a post consumer PET bottle goes through three to
five stakeholders before it is actually recycled. In each step, the market value of the
bottle increases since its quality increases as well. As seen in figure 15, the
scavengers receive at least one Mexican (MXN) Peso for 1 kg of PET from their
union leaders, which represents around 40 bottles. After that, the unions sell the
collected material to the middlemen for 5 MXN Pesos per kg and finally after
treatment, the middlemen receive 16 MXN Pesos for the same kg.4 The money the
middlemen receive depends on the method used to treat the collected material. The
post-consumer PET price has been increasing since 2004 when 0.70 MXN pesos
per kg was paid. By 2010, the price reached 4.50 MXN pesos from which 2.5 MXN
Pesos were paid to the scavengers (Schwanse, 2011).
Figure 15 Post-consumer PET Bottle Value Chain (Gutiérrez, 2012)
Another challenge for the recycling industry is the legal background. At the end of
the 1990s, the Mexican authorities exerted some pressure on the PET industries by
warning them that if voluntary recycle and recovery programmes were not
implemented, the government would establish mandatory compliance measures. As
a consequence in Mexico there are no legal requirements for recycling or recovery
as the packaging and bottling industries created the Ecology and Corporate
Commitment (ECOCE) in 2002. This private non-profit organization financed by
private funds has the objective of collecting post consumer PET bottles in order to
assure the supply for the recycling industry. Also, it promotes environmental
awareness through national recycling campaigns and actively participates in policy
4 1 MXN Peso is around 0.08 US Dollars.
42
proposals in order to improve the legal environment for recycling activities. It is
formed by 30 groups and more than 60 brands from the beverage and food industry
that represent 61% of the total PET bottling and packaging market in Mexico. Some
participant brands are Jumex, Nestlé, Coca Cola, Pepsi, La Costeña, among others
(ECOCE, 2012).
In order to promote post-consumer PET collection, ECOCE has implemented three
different programmes: one for the private industrial sector, one for schools and one
for the general public. The industrial programme promotes the separation of PET
bottles in the workplace by giving the employees cash or different items as
incentives. Most of the time, the money accumulated by the employees is donated
to charity. The school programme is called ECO RETO and it promotes the
separation of PET bottles in educational institutions. Collection centers have been
installed in 6,463 schools throughout the country, and involve the participation of
around 1.8 million students. According to the number of PET bottles collected,
schools receive prizes that can vary from soccer balls to computers for the IT labs.
Finally, the programme for the general public involves the installation of 12 collecting
centers around the main cities to facilitate the PET purchasing from the whole
population (Medina and Smith, 2013). Most of the time, the collected material comes
from scavenger leaders. ECOCE has tried to avoid this situation by buying the
materials directly from scavengers in the landfills. However, this was not possible
since the access to the landfills is granted by the leaders, who won’t allow entrance
to ECOCE trucks unless they purchase the material from them. As a consequence,
ECOCE have had to work within the established structure, where the leaders
receive the payment. Unfortunately, the way this money is distributed among the
scavengers is not under the control of ECOCE (ECOCE, 2012).
43
Figure 16 National Post-consumer PET Collection (ECOCE, 2012)
As seen in Figure 16, the collection of PET has grown exponentially since the
foundation of ECOCE and by 2012, 300,000 tons were collected. The blue fraction
of the bars represents the amount of PET collected by ECOCE while the yellow
fraction is the collection achieved by other stakeholders. The percentage shown by
each bar represents the amount of PET collected by ECOCE in comparison with the
total production of its members, which accounts for 58% of the Mexican PET
packaging and bottle industry (ECOCE, 2012). It must be pointed out that the
collection done by other stakeholders has grown significantly more than ECOCE
collection in the past few years.
5.2 PET Exports
From the 300,000 tons of PET that were collected in 2012, 244,700 tons were
exported. This trade trend can be explained by legal and economic factors. First,
foreign customers pay higher prices. In fact, the average price per kg paid by foreign
customers can be up to 80% higher than the price paid locally. They can afford to
pay more because the payment is made in cash avoiding the corresponding taxes
and tariffs. This takes advantage of the containers that transport products to Mexico
since then post-consumer PET is exported under a fraction tariff that is neither clear
nor effectively controlled. Furthermore, they do not demand a high quality for the
collected product (Gutiérrez, 2012). In Figure 17, the different destinations for the
exported PET are showed.
44
Figure 17 Destination of PET Collected in Mexico (Gasnier & Portales Derbez, 2008)
5.3 PET Recycling Industry in Mexico Even if collection is promoted, the PET recycling industry cannot develop without the
proper infrastructure. Until very recently, Mexico only used openloop recycling
technology that transformed PET bottles into a variety of products. The situation
changed in 2005 when the Industria Mexicana del Reciclaje (IMER) was founded.
This recycling plant has the technology to convert used PET bottles into FDA (Food
and Drugs Administration) grade PET pellets that can be used safely by the food
and beverage industry. The PET pellets produced in this facility are already
substituting virgin PET in Coca Cola bottles production (Schwanse, 2011).
In 2007, PETSTAR the second bottle to bottle (BTB) recycling plant was opened in
Toluca, a city 56 km away from Mexico City. PETSTAR was partly funded by a
US$33.48 million loan from the International Finance Corporation (IFC), a member
of the World Bank Group. Its operation has been regarded as a success and in 2012,
Coca Cola and its Mexican subsidiaries decided to invest $34 million more in order
to double the plants recycling capacity (Medina and Smith, 2013). Finally in 2009,
Centro de Procesado de Resinas (CPR) was funded by Brazilian investment in
Celaya, a city in the central region of Mexico. These three recycling plants have the
joint installed capacity to transform 72,000 tons of post-consumer PET (Schwanse,
2011). Figure 18 summarizes some important details of each recycling plant.
45
Figure 18 Installed Recycling Capacity for FDA grade PET (Schwanse, 2011)
The market value of the Mexican PET recycling industry has already surpassed
4,000 million MXN Pesos, which represents around 10% of the national plastic
industry. Nowadays, the PET recycling sector is estimated to include around 180
different companies (Gutiérrez, 2012).
6. Life Cycle Assessment of PET in Mexico As mentioned before, in order to comprehensively analyze a system or a product, it
is necessary to consider its overall performance in the different stages of its life
cycle. LCA is an ideal tool to achieve this goal. Previously, many studies have been
conducted around the utilization of PET. While some studies aimed to identify
environmental performance indicators or to compare PET to different goods or
materials: others sought to establish a benchmark for product policy or to provide
relevant information to support the decision making process. Regardless of their
specificities, all of them have concluded that to recycle PET is an environmentally
friendly practice that reduces the negative burden of the material. However, the
degree to which the burden is reduced varies from case to case. In this section the
necessary parameters for an LCA for BTB PET recycled in Mexico is developed.
Unfortunately, a complete LCA is not performed due to the lack of available
information.
As described in section 1, all LCAs start with the goal and scope definition. The goal
of this study is to assist in the development of PET recycling programmes in Mexico
that are economically advantageous, environmentally friendly and socially accepted.
Also, it intends to identify processes where improvements can be implemented so
as to propose policy recommendations. Therefore, a consequential LCA should be
carried out in order to determine the recycling rate and the collecting routes
distances that would generate the best practicable environmental result.
46
The decision context for the study is regarded as situation B because the decisions
made could have far reaching consequences that would require the installation of
extra BTB recycling capacity. The target audience is considered to be the several
private and governmental stakeholders that are involved in the MSW management
and PET recycling industries. The results of the study intend to help these
stakeholders in the decision making process. Finally, the main limitation of this LCA
is that it only considers the environmental impacts of PET recycling. However, in
Mexico an important percentage of the industry is built on the work of thousands of
scavengers who work under terrible conditions. Therefore, the study might
underestimate this social factor.
The system boundary is cradle to grave; thus, it must include all the processes that
are involved from the extraction of the raw materials to their final disposition. The
functional unit is 40 kg of PET, which can be in the form of resin, pellets or bottles.
The latest was not defined by number of units since there are different bottles sizes
that have specific weights. Nevertheless, the functional unit was not chosen
randomly. This choice is justified because it represents the weight of 1000 units of
2L bottles, the most consumed size of soft drinks in the country (Ghirardelly, 2013).
The geographic scope of the study covers the entire country and the technology
analyzed is BTB recycling.
After examining several studies carried out in different contexts (Gironi & Piemonte,
2011; Nakatani et al., 2010; Shen et al., 2011; Foolmaun & Ramjeeawon, 2012;
Pasqualino et al., 2011; Romero-Hernández et al., 2008; Schwanse, 2011; Coelho
et al., 2011) several parameters were identified. However, not all the parameters
found were applicable to the Mexican context; especially because MSW
management is not highly developed like in most industrialized countries.
Figure 21 shows the case study system flow diagram. As seen in the figure, inside
the system boundaries, 9 different processes are involved in BTB recycling in
Mexico. These processes were considered as relevant and were thus included.
They can be classified into 3 categories: production phase, consumption phase and
disposal phase. Also, the transportation between processes was taken into
consideration since it affects the overall benefits of recycling (Coelho et al., 2011). In
fact, there is a limit for collection where the route distances overweigh the benefits of
PET recycling. The maximum collection distance could be determined by carrying
out the LCA. The disposal phase of the system has major discrepancies with the
47
ones carried out in developed countries. In Mexico, there are very few mechanical
treatment processes before the waste is deposited in landfills, and there is not a
separated collection for each type of waste. The sorting activities, which are done
mechanically in developed countries, are performed manually by the informal sector
and therefore, they do not cause energy requirements. Therefore, they were cut off
from the analysis and were regarded as insignificant.
Figure 19 LCA System Flow Diagram
In order to determine the reference flows of the system and obtain a complete
picture of the system metabolism, a Material Flow Analysis (MFA) was performed. It
is based on the information acquired from a variety of sources including research
papers, governmental reports and ECOCE statements. The figures shown in the
MFA use two significant figures.
48
Figure 20 MFA of PET in Mexico, 2011
In 2011, the national production of PET bottles was 790,000 tons (Schwanse, 2011).
In order to produce this amount, 810,000 tons were imported into the system. This
amount was calculated considering that there is a 3% loss of material during the
bottle manufacturing (Gironi and Piemonte, 2011). The industrial waste was
disposed of directly in landfills. The other 97% of production was manufactured and
filled with different kinds of beverages, which are ready to be sent to the market.
Once consumers have used the PET bottles, there were several routes to discard
them. The first route was by littering. Schwanse (2011) estimates that approximately
5% of the bottles consumed are left in inappropriate public locations; where they
create visual contamination, sewage clogging, and marine debris. Littering, which
accounted for 40,000 tons, left the system as an export flow. This amount was
calculated with the total production and the littering percentage.
The second route is by taking the bottles to different collection centers. These can
be divided into ECOCE, government, and private centers. According to ECOCE
(2012), 300,000 tons were collected in the different collection centers, which
49
accounts for 38% of the total production. From all the PET collected, 47% was
aquired through ECOCE and the rest through Government and private collection
centers. The amount of PET collected by the Government centers was taken from
the INEGI (2011) database. The last year reported was 2010; however, it had been
assumed that this figure did not vary significantly from one year to the other and can
still be valid for the year 2011. The ECOCE and governmental centers mainly
receive bottles that were separated from the generation source while the private
ones mainly buy bottles that have been sorted manually by scavengers in landfills.
In Figure 20, the collection rates of the different centers are shown. These figures
represent the percentage of collected tons from the total bottle production.
Figure 21 Collection rate in different collection centers
The third route is by disposing of PET bottles with the rest of the MSW. Since there
are so few separate collection programmes and sorting plants in Mexico, they can
be considered as negligible (SEMARNAT, 2012). Therefore, it is assumed that all
waste collected is mixed and that it goes directly to the landfills. With this route, 75%
of the bottles consumed end up in the landfills without any treatment. This amount
was calculated by substracting the ECOCE and Government collection and the
littering from the total PET consumed. Once in the landfills, the waste is sorted
manually by thousands of scavengers. The amount of PET collected by them was
calculated by substracting the Government and ECOCE shares from the total PET
collection reported by ECOCE (2012). From all the PET that reached the landfill,
140,000 tons were sorted by scavengers and sold to private collectors; which means
that scavengers had a sorting efficiency of 24%. The share of PET that was not
sorted in the landfills is considered as stock.
Once the PET was collected, it was either recycled in the country or sent abroad for
the same purpose. In 2011, 81.5% of the collected material, which represents 30%
of the total production, was exported. Therefore, 240,000 tonnes, left the system as
an export flow. This amount was calculated by substracting the amount of PET
recycled in the country from the total PET collected. The quantity of PET recycled
was taken from Schwanse (2011). The material that remained in the country, around
55,000 tonnes, was recycled by mechanical and chemical treatments. Most of it was
recycled in a closed-loop while the remaining 7.7% was used to produce a variety of
50
products. Open-loop recycling is also considered as an export flow and therefore,
4,300 tonnes of PET left the system.
In order to recycle the PET bottles, it is necessary to produce FDA pellets.
According to Gironi and Piemonte (2011), 10% of the input material is lost during
this process. The industrial waste was sent to landfills. The remaining 90% was
used as raw material to produce new bottles. The FMA shows that in 2011, only 5.8%
of the produced bottles were recycled into new bottles in the entire country.
7. Conclusions and Policy Recommendations The generation of waste is unavoidable since most human activities produce it. Due
to rapid economic development and high rates of urbanization, its disposition has
raised enormous challenges. One of the waste components that has produced a
major environmental problem is PET. The global demand for it has increased in the
few last decades and this trend is expected to continue given the convenience of its
inherent characteristics. Among them durability, once considered as it major
advantage, has become an environmental torment. Attributable to its chemical
composition, PET neither biodegrades nor photo degrades or at least not in 1,000
years or less. Furthermore, its production is based on crude oil or gasoline which
are non renewable resources.
For many years, post consumer PET bottles were placed in disposal sites without
any previous treatment. However with its expanding production, landfilling has
become an unpractical and irresponsible practice. In the last decades, developed
countries have followed several strategies in order to reduce the amount of material
that is sent to landfills. Since PET can be 100% recycled, different technologies
have been developed in order to do so. By recycling PET, developed countries have
reduced their solid waste stream and have promoted the efficient use of non
renewable materials.
However, this is not the case for transitional and developing countries where the
MSW is still placed, in the best case scenario, in controlled landfills. In Mexico, the
economic development of the last few decades has derived in an increasing
consumption of goods and services. In the case of PET bottles, Mexico is the
second largest consumer in the world. This is mainly attributed to two factors: the
lack of potable water from the pipes and the high soft drinks consumption. In fact,
51
Mexico has the biggest consumption per capita of water bottles and soft drinks. This
massive consumption combined with a lack of environmental awareness has lead to
serious problems that have caused negative impacts among the population and the
environment. Therefore, it is crucial to find an adequate waste management solution
that is in line with the principles of sustainable development. Recycling has been
regarded as the most promising option.
For decades many scholars have been conducting studies in order to measure and
prove the real benefits of recycling. Most of them have used an LCA methodology
for that purpose. In particular, in the case of PET, all of them have concluded that
PET recycling is an environmentally friendly practice that reduces the negative
burdens of the material production and disposal. Nonetheless, the degree to which
the burden is reduced varies from case to case. Therefore, the principal objective of
this thesis was to determine which parameters needed to be considered so as to
carry out an LCA for PET recycling in Mexico. Unfortunately, a complete LCA was
not performed due to the lack of available information.
In order to determine the parameters, the MSW and the post-consumer PET
management were extensively analyzed. It was found that the MSW situation in
Mexico can be regarded as pre-modern since it is mainly based on a single disposal
technology i.e. landfilling. The lack of investment and political determination has
lead to obsolete and inefficient collecting and disposal facilities. Regarding recycling
activities, they are carried out mainly by private stakeholders who do not gain any
fiscal incentives or benefits by doing so. Besides, the lack of a national recycling
culture and proper collection trucks has made selective collection impossible.
Therefore, the recycling material supply is mostly provided by thousands of
scavengers who sort the waste manually. This marginalized group works informally
in the landfills without any protective gear or social security. Furthermore, they work
long hours for very little pay and they are under the “patronage” of leaders who have
total control over the landfills.
From all PET bottles collected, around 80% are exported, mainly to China and the
USA. The above is explained because foreign customers provide higher payments
and require low quality standards. In fact, they can pay higher prices because they
do not pay taxes and take advantage of a fraction tariff that is not clearly regulated.
As for the 20% that remains in the country, it is recycled by locals either by
52
mechanical or chemical recycling routes. The majority of it is recycled into new
bottles. Yet in 2011, only 5.8% of the produced bottles were recycled into new
bottles at a national level.
From the above analysis, the parameters necessary to perform a CLCA for the
Mexican BTB recycling were determined. The system, which is defined as cradle to
grave, is composed of 9 processes. They are: oil extraction and refining, resin
production, bottle production and manufacture, bottles use phase, MSW collection,
collection centers, landfill, middlemen and RPET manufacture. Also, the
transportation between the processes was included in the system boundaries since
it affects the overall benefits of recycling. An MFA was also conducted so as to
analyze the reference flows and to obtain an enhanced picture of the system’s
metabolism. Considering the most important flows, a series of recommendations
were derived. They address generation, collection and recycling issues.
Regarding generation, it is necessary to implement environmental awareness
campaigns with the objective of promoting a recycling culture among the population.
It is necessary to encourage waste separation in every household and to put an end
to the Mexican antipathy towards waste separation. If waste is separated at its
source, even if the government does not have the infrastructure to collect it
separately, the labor of the scavengers would essened and would become more
efficient. Thus, more PET bottles could be sorted out from the waste stream in the
landfills.
As for collection, routes have to be designed according to technical elements and
not based on the experience and judgment of the truck drivers. With proper planning,
collection can become much more cost-efficient. The more efficient use of resources
could help make funds for separated garbage trucks available in the future.
Concerning recycling, three recommendations arose. First, any effort towards the
modernization of the sector must include the scavengers given that most of the
sorted material is provided by them. Most importantly, thousands of families depend
on the income generated by this activity for their survival and their exclusion could
lead to severe social tensions. Moreover, the scavengers’ unions are a strong
lobbying group with heavy political influence. Their lack of inclusion will only create
an unnecessary obstacle for the recycling industry.
53
Second, the government should promote recycling by granting tax reliefs and other
economic incentives to recycling industries. By doing so, the Mexican stakeholders
would be in a better position to compete with their foreign counterparts. Finally, the
national authorities should close the loop-hole in the fraction tariff that has been
used by foreigners in order to export the collected PET bottles at low cost. By doing
so, the national recycling industry could guarantee its supply and expand its
capacity.
This thesis revealed that PET BTB recycling in Mexico is the most suitable option to
significantly decrease the amount of post consumer PET bottles piled up in landfills
and to make more efficient use of non renewable resources. However, the scope of
its benefits will be quantified only after the complete conduction of an LCA. The
established parameters for the Mexican case should be used in order to develop
recycling strategies that result in higher profits, social inclusion and enhanced
environmental protection.
54
Bibliography
Aparcana S. and Salhofer S. (2013): Application of a methodology for the social life cycle assessment of recycling systems in low income countries: three Peruvian case studies. The International Journal of Life Cycle Assessment 1–13.
Armijo de la Vega C., Ojeda-Benítez S. and Quintanilla Montoya A. L. (2006): Waste management system in Mexico : history , state of the art and trends. The Journal of Solid Waste Technology and Management 354–364.
Best Food Forward (2008): The carbon impact of bottling Australian wine in the UK : PET and glass bottles. (March), 1–34. [online] Available from: http://www.bestfootforward.com/media/upload/report/Carbon_Impact_of_Bottling_Australian_Wine_in_the_UK-_PET_and_Glass_Bottles.pdf - accessed: Apr. 23 , 2013.
Brooks J. (2012): Global PET consumption to grow 5 % per year to 2017 : study. Packaging News 1–2. [online] Available from: http://www.packagingnews.co.uk/news/global-pet-consumption-to-grow-5-per-year-to-2017-study/ - accessed: May 13 , 2013.
Coelho T. M., Castro R. and Gobbo J. a. (2011): PET containers in Brazil: Opportunities and challenges of a logistics model for post-consumer waste recycling. Resources, Conservation and Recycling 55(3), 291–299.
Conde Ortiz M. P. (2012): Presente Futuro de la Industria del Plástico en México. Ambiente Plástico 1–85.
DEFRA/Embajada Británica en México (2009): Proyecto de Limpieza de Tiraderos a Cielo Abierto en 22 Municipios de Nuevo León , “ Closure of Municipal Dumps ”. Manual de Gestión de Residuos 1–141. [online] Available from: http://www.nl.gob.mx/pics/pages/sdsustentable_ma_base/Manual-Residuos.pdf - accessed: Apr. 24 , 2013.
Diaz Dosamante C. P. (2010): Comercialización Internacional del PET Reciclado Mexicano en China”, 110 pp., Universidad Michoacana de San Nicolás de Hidalgo.
Earles J. M. and Halog A. (2011): Consequential life cycle assessment: a review. The International Journal of Life Cycle Assessment 16(5), 445–453.
EC/IES (2010): International Reference Life Cycle Data System Handbook, 1st Editio., edited by European Commission/Institute for Environment and Sustainability, Publications Office of the European Union, Luxembourg.
ECOCE (2012): ¿Que es ECOCE? ECOCE [online] Available from: http://www.ecoce.org.mx/ecoce.php - accessed: Apr. 23 , 2013.
Ekvall T. and Weidema B. P. (2004): System boundaries and input data in consequential life cycle inventory analysis. The International Journal of Life Cycle Assessment 9(3), 161–171.
55
EPA (2012): Municipal Solid Waste. Waste [online] Available from: http://www.epa.gov/epawaste/nonhaz/municipal/index.htm - accessed: May 13 , 2013.
Foolmaun R. K. and Ramjeawon T. (2012): Life cycle sustainability assessments (LCSA) of four disposal scenarios for used polyethylene terephthalate (PET) bottles in Mauritius. Environment, Development and Sustainability 1–24.
Foolmaun R. K. and Ramjeeawon T. (2012): Comparative life cycle assessment and social life cycle assessment of used polyethylene terephthalate (PET) bottles in Mauritius. The International Journal of Life Cycle Assessment 18(1), 155–171.
Fox News (2011): Mexico Leads World in Consumption of Sugary Drinks. FoxNews [online] Available from: http://latino.foxnews.com/latino/health/2011/09/06/mexico-leads-world-in-consumption-sugary-drinks-study-says/
Franklin Associates (2009): Life Cycle Assessment of Drinking Water Systems : Bottle Water , Tap Water , and Home / Office Delivery Water. Final Peer-Reviewed Appendix 1–293. [online] Available from: http://www.deq.state.or.us/lq/pubs/docs/sw/LifeCycleAssessmentDrinkingWaterReportOnly.pdf - accessed: Apr. 23 , 2013.
Gasnier A. and Portales Derbez L. E. (2008): PETSTAR : Adding value to the chain of recycling and improving the scavengers ’ working conditions The garbage issue in Mexico, Mexico City.
Ghirardelly F. (2013): ¿ Qué beben los mexicanos para calmar su sed ? Alto Nivel 1–3. [online] Available from: http://www.altonivel.com.mx/34081-que-consumen-los-mexicanos-para-calmar-su-sed-azucar.html - accessed: May 13 , 2013.
Gironi F. and Piemonte V. (2011): Life Cycle Assessment of Polylactic Acid and Polyethylene Terephthalate Bottles for Drinking Water. Environmental Progress and Sustainable Energy 30(3), 459–468.
Guinée J. (ed. ., Gorrée M., Heijungs R. and Huppes G. (2001): Life cycle assessment An operational guide to the ISO standards, Maastricht.
Gutiérrez Avedoy V. (coord. . (2006): Diagnóstico básico para la gestión integral de residuos, 1st editio., INE-SEMARNAT, Mexico City.
Gutiérrez G. (2012): Desorden plástico. CNN Expansión 1–6. [online] Available from: .
HITACHI (2013): Production process for polyethylene terephthalate (PET). Industrial Plant Systems [online] Available from: http://www.hitachi-pt.com/products/ip/process/pet.html - accessed: Apr. 19 , 2013.
Hoffman L., Schmidt A., Jensen A. and Moller B. (1997): Life Cycle Assessment A guide to approaches, experiences and information sources. Environmental Issues Series (6), 1–119.
56
Hoornweg D. and Bhada-Tata P. (2012): What a Waste: A Global Review of Solid Waste Management. 1–116.
INE (2006): Experiencias de la producción de composta en México. Manual de Compostaje Municipal [online] Available from: http://www2.ine.gob.mx/publicaciones/consultaPublicacion.html?id_pub=499 - accessed: Apr. 29 , 2013.
Ligthart T. N. and Ansems T. A. M. M. (2002): Modelling of Recycling in LCA. Post-Consumer Waste Recycling and Optimal Production 1–27. [online] Available from: http://www.intechopen.com/books/post-consumer-waste-recycling-and-optimal-production/modelling-of-recycling-in-lca - accessed: Apr. 10 , 2013.
Link C., Nicholson A. L., Olivetti E. A., Gregory J. R., Field F. R. and Kirchain R. E. (2009): End-of-life LCA allocation methods : open loop recycling impacts on robustness of material selection decisions. Sustainable Systems and Technology 1–7. [online] Available from: http://hdl.handle.net/1721.1/60047 - accessed: Apr. 20 , 2013.
Malkin E. (2012a): Bottled Water Habit Keeps Tight Grip on Mexicans. New York Times [online] Available from: http://www.nytimes.com/2012/07/17/world/americas/mexicans-struggle-to-kick-bottled-water-habit.html?ref=bottledwater&_r=1&
Malkin E. (2012b): For Some in Mexico , Trash Is a Treasure Worth Defending. New York Times 1–5. [online] Available from: http://www.nytimes.com/2012/02/17/world/americas/for-some-in-mexico-trash-is-a-treasure-worth-defending.html?pagewanted=all&_r=0
Mascott Sánchez M. de los Á., González Rodríguez J. de J., Moreno Pérez S. and Aguirre Quezada J. P. (2012): Residuos sólidos urbanos en México, Mexico.
Medina M. and Smith C. (2013): Social inclusion in Mexico ’ s PET plastic recycling. Our World 2.0 1–6. [online] Available from: http://ourworld.unu.edu/en/social-inclusion-and-pet-recycling-in-mexico/ - accessed: May 1 , 2013.
Nakatani J., Fujii M., Moriguchi Y. and Hirao M. (2010): Life-cycle assessment of domestic and transboundary recycling of post-consumer PET bottles. The International Journal of Life Cycle Assessment 15(6), 590–597.
Nakatani J. and Hirao M. (2011): Multicriteria Design of Plastic Recycling Based on Quality Information and Environmental Impacts. Journal of Industrial Ecology 15(2), 228–244.
OECD (2007): OECD Environmental Data. Compendium 2006/2007 1–35. [online] Available from: www.oecd.org/document/49/0,3343,en_2825_495628_39011377_1_1_1_1,00.html - accessed: May 5 , 2013.
Pålsson A.-C. and Riise E. (2013): Life Cycle Assessment. Tosca Sustainability Framework [online] Available from: http://www.tosca-life.info/getting-started-guides/life-cycle-assessment/ - accessed: Apr. 8 , 2013.
Pasqualino J., Meneses M. and Castells F. (2011): The carbon footprint and energy consumption of beverage packaging selection and disposal. Journal of Food Engineering 103(4), 357–365.
Perugini F., Arena U. and Mastellone M. L. (2003): Life Cycle Assessment of a Plastic Packaging Recycling System. Plastic Packaging Recycling 8(2), 92–98.
Ramos Cortéz C., Carmona Morales R., Cano Leal P. and Semadeni Mora I. (1996): Estaciones de transferencia de residuos sólidos en áreas urbanas, Mexico City.
Romero-Hernández O., Romero Hernández S., Muñoz D., Detta-Silveira E., Palacios-Brun A. and Laguna A. (2008): Environmental implications and market analysis of soft drink packaging systems in Mexico. A waste management approach. The International Journal of Life Cycle Assessment 14(2), 107–113.
SAIC (2006): Life Cycle Assessment: Principles and Practice. EPA7600/R-06/060 (May), 1–88. [online] Available from: http://www.epa.gov/nrmrl/std/lca/pdfs/chapter1_frontmatter_lca101.pdf - accessed: Apr. 3 , 2013.
Schwanse E. (2011): Recycling policies and programmes for PET drink bottles in Mexico. Waste management & research : the journal of the International Solid Wastes and Public Cleansing Association, ISWA 29(9), 973–81.
Schwansee E. (2007): El Mexicano y su botella de PET. Medio Ambiente, Conservación y Puntos Intermedios 50–52. [online] Available from: http://playambiental.wordpress.com/2010/04/19/el-mexicano-y-su-botella-de-pet/ - accessed: Apr. 5 , 2013.
SEDESOL (2012): Sexto Informe de Labores. 1–116. [online] Available from: http://inapam.gob.mx/work/models/SEDESOL/Resource/2820/1/images/1307_12_INT_6o._INFORME_SEDESOL_.pdf - accessed: Apr. 27 , 2013.
SEMARNAT (2011): El ambiente en números. El ambiente en números 1–61. [online] Available from: http://www.semarnat.gob.mx/informacionambiental/Documents/SNIARN/pdf/el_ambiente_numero_2011.pdf - accessed: Apr. 24 , 2013.
SEMARNAT (2012): Residuos Sólidos Urbanos. Informe de la Situación del Medio Ambiente en México [online] Available from: http://app1.semarnat.gob.mx/dgeia/informe_12/00_intros/introduccion.html - accessed: Apr. 23 , 2013.
58
Sevigné E., Gasol C. M., Oliver-sola J. and Mitjans V. (2011): Comparative LCA of container deposit scheme and green dot system for PET bottles , cans and beverage carton waste in Spain. 1–10. [online] Available from: http://www.lcm2011.org/papers.html?file=tl_files/pdf/poster/day2/Sevigne_Itoiz-Comparative_LCA_of_container_deposit_scheme_and_green_dot_system-665_b.pdf. - accessed: Apr. 12 , 2013.
Shen L., Nieuwlaar E., Worrell E. and Patel M. K. (2011): Life cycle energy and GHG emissions of PET recycling: change-oriented effects. The International Journal of Life Cycle Assessment 16(6), 522–536.
Shen L., Worrell E. and Patel M. K. (2010): Open-loop recycling: A LCA case study of PET bottle-to-fibre recycling. Resources, Conservation and Recycling 55(1), 34–52.
Sinha V., Patel M. R. and Patel J. V. (2008): Pet Waste Management by Chemical Recycling: A Review. Journal of Polymers and the Environment 18(1), 8–25.
The Economist Online (2012): A rubbish map. The Economist 2025. [online] Available from: http://www.economist.com/blogs/graphicdetail/2012/06/daily-chart-3
UNEP (2000): Evaluation of Environmental Impacts in Life Cycle Assessment. Meeting Report (November 1998), 1–98. [online] Available from: http://jp1.estis.net/builder/includes/page.asp?site=lcinit&page_id=F511DC47-8407-41E9-AB5D-6493413088FB - accessed: Apr. 13 , 2012.
UNEP (2009): UNEP Head Calls for World-Wide Ban on Pointless Thin Film Plastic Bags. (June), 1–5. [online] Available from: http://rona.unep.org/documents/pressreleases/2009PR-LaunchOfMarineLitterReport.pdf - accessed: May 23 , 2013.
Velasco Pérez Alonso M. G. (2011): Generation and Disposition of MSW in Mexico and Potential for Improving Waste Management in Toluca Municipality, 1–149 pp., Columbia University.
Vest H. (2003): Production and Recycling of PET-Bottles, Eschborn.
Welle F. (2011): Twenty years of PET bottle to bottle recycling—An overview. Resources, Conservation and Recycling 55(11), 865–875.
World Commission on Environment and Development (1987): Our Common Future. 1–247.