i THESIS FOR THE DEGREE OF LICENTIATE OF ENGINEERING Life Cycle Assessment of Present and Future Marine Fuels SELMA BENGTSSON Department of Shipping and Marine Technology CHALMERS UNIVERSITY OF TECHNOLOGY Gothenburg, Sweden, 2011
Transcript
i
THESIS FOR THE DEGREE OF LICENTIATE OF ENGINEERING
Life Cycle Assessment of Present and Future Marine Fuels SELMA BENGTSSON Department of Shipping and Marine Technology Chalmers University of Technology ABSTRACT Interest in new fuels for marine propulsion is growing, mainly as a result of stricter environmental regulations but also due to increased attention to air pollution, greenhouse gas emissions and the uncertainty of future oil supply. Several different fuels and exhaust abatement technologies are proposed for marine transportation, all of which have different advantages and disadvantages in relation to the environment and human health. It is interesting to assess the upstream environmental impact of a fuel change in order to avoid problem shifting from one phase in the life cycle to another.
Life Cycle Assessment (LCA) is a common tool for environmental assessments of products and services and it addresses the potential environmental impact of a product or service from a cradle-to-grave perspective. LCA is already well established for evaluating alternative fuels for road transportation. It is therefore considered an appropriate tool for assessing the environmental performance of marine fuels. Here, LCA has been used in two different studies for assessing the environmental impact of marine fuels.
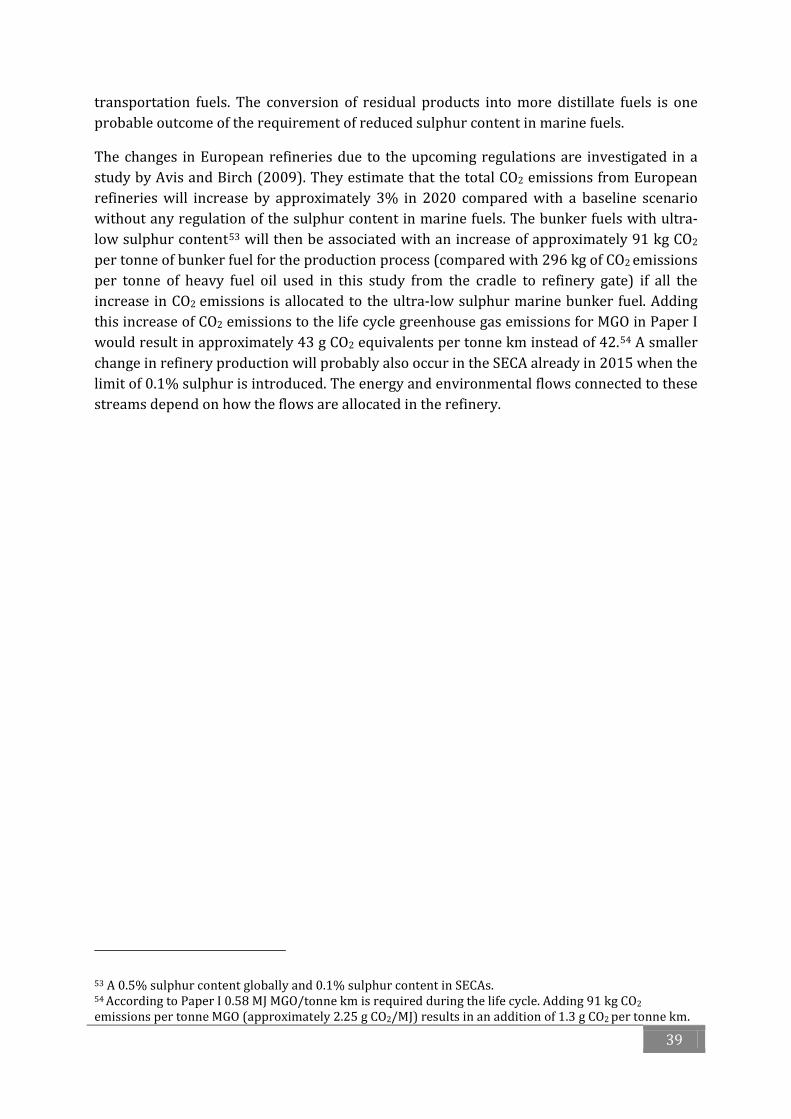
In the first study, Paper I, the life cycle environmental impact of changing fuel and/or installing abatement techniques in order to comply with upcoming environmental regulations is explored. The alternatives investigated were heavy fuel oil with and without scrubber, marine gas oil with and without selective catalytic reduction, liquefied natural gas and synthetic diesel with and without selective catalytic reduction. This study thus only involved fossil fuels and indicated that the global warming potential of the investigated fuels are of the same order of magnitude. The best overall environmental performance was reached, not surprisingly, for the fuels that fulfil the most stringent upcoming environmental regulations: liquefied natural gas and marine gas oil with SCR. Synthetic diesel was ruled out as being too energy intensive.
In the second study, Paper II, two routes, a diesel route and a gas route, towards the use of renewable fuels in the shipping industry were investigated. The study started from the traditional fuel used today: heavy fuel oil. For 2015, two possible paths were assessed: marine gas oil and liquefied natural gas. For 2020, these fuels were blended with a small proportion of a first-generation biofuel of the same type, and for 2025 they were fully replaced with a second-generation biofuel. This study indicated that the gas route has better overall environmental performance than the diesel route. The study also illustrated that biofuels are one possible measure to decrease the global warming impact from shipping but that it can be at the expense of greater environmental impact from other impact categories.
Keywords: marine fuels, environmental impact, Life Cycle Assessment, LCA, heavy fuel oil, marine gas oil, liquefied natural gas, LNG, biofuels
v
ACKNOWLEDGEMENTS This thesis comprises work that was carried out at the Department of Shipping and Marine Technology at Chalmers University of Technology. The project, which is concerned with environmental assessment of marine fuels, is funded by Vinnova grants to Lighthouse. Lighthouse is a multidisciplinary maritime competence and research centre initiated by Chalmers, the School of Business, Economics and Law at the University of Gothenburg and the Swedish Shipowners’ Association.
First and foremost, I would like to thank my supervisors Associate Professor Karin Andersson and Adjunct Professor Erik Fridell who have supported me and contributed to this thesis by critically examining my assumptions, sharing their valuable comments and suggestions. Thanks also to Karin for always being available for questions and discussions and to Erik for questioning my opinions, correcting my fuzzy expressions and contributing with his impressive knowledge in the field.
Moreover, I would like to thank Sara Heimersson who read a draft of this thesis and gave me much-appreciated feedback and Fredrik Lindgren who helped me to write the text on antifouling paint. I would also like to thank all the participants in the Effship WP2 project as their discussions on marine fuels were very interesting and fruitful and gave me new perspectives and new information.
Furthermore, I am very grateful to everyone who has shown an interest in my work. They have all made it worthwhile and their interest in the subject has given my work meaning. I am grateful to all the informants and everyone who asked me questions and made comments. This has improved the work and I hope they will continue to show interest in my work and in which fuels will/should/could be used in shipping in the future.
Finally, I would like to thank all my colleges at Shipping and Marine Technology who helped me with information, comments, questions, discussions, supported me and cheered me up. I would also like to thank my family and friends for their support and for just being there. Special thanks go to Fredrik for putting up with and listening to all my talk about marine fuels, engines, emissions, LCA methodology and life as a Ph.D. student.
Selma Bengtsson
Gothenburg, November 2011
vii
LIST OF APPENDED PAPERS AND OTHER PUBLICATIONS
APPENDED PAPERS
Paper I Bengtsson, S., Andersson, K. & Fridell, E. 2011. A comparative life cycle assessment of marine fuels; liquefied natural gas and three other fossil fuels. Proceedings of the Institution of Mechanical Engineers, Part M: Journal of Engineering for the Maritime Environment 225, 97-110.
The author of this thesis contributed to the ideas presented, took part in the planning of the paper, collected data, carried out the calculations in the Life Cycle Assessment and wrote most of the manuscript.
Paper II Bengtsson, S., Fridell, E. & Andersson, K. Environmental assessment of two pathways torwards the use of biofuels in shipping. Submitted to scientific journal.
The author of this thesis contributed to the ideas presented, took part in the planning of the paper, collected data, carried out the calculations in the Life Cycle Assessment and wrote most of the manuscript.
OTHER PUBLICATIONS
Bengtsson, S., Andersson, K. & Fridell, E. 2011. Life cycle assessment of marine fuels - A comparative study of four fossil fuels for marine propulsion. Gothenburg: Chalmers University of Technology.
Bengtsson, S., Andersson, K. & Fridell, E. 2011. Environmental feasibility of biogas and biodiesel as fuel for passenger ferries. SETAC Europe 17th LCA Case Study Symposium, 28 February -1March, 2011 Budapest. 53-54.
ix
TABLE OF CONTENTS Abstract ....................................................................................................................................................................... iii
Acknowledgements ................................................................................................................................................. v
List of Appended Papers and Other Publications ..................................................................................... vii
Abbreviations, Acronyms and Terminology ................................................................................................ xi
1.4 Purpose and Research Questions .................................................................................................... 5
1.5 Outline of the Thesis............................................................................................................................. 5
2 Approaches to Environmental Evaluation ............................................................................................ 7
2.1 Systems Theory ...................................................................................................................................... 7
2.2 Life Cycle Assessment .......................................................................................................................... 8
3 Assessment of Environmental Impact ..................................................................................................15
3.1 Environmental Impact of Marine Transportation ..................................................................15
ABBREVIATIONS, ACRONYMS AND TERMINOLOGY This thesis uses terminology from two different fields. A list of terminology has therefore been included in order to make it easier for the readers. All abbreviations and acronyms used in the report are listed first, followed by terms and concepts specific to life cycle assessment and for shipping.
ABBREVIATIONS AND ACROMYMS
BTL Biomass-to-liquid (here called synthetic biodiesel) CBA Cost Benefit Analysis CFC Chlorofluorocarbons CH4 Methane CO Carbon monoxide CO2 Carbon dioxide DALY Disability-adjusted life year ECA Emission Control Area EEDI Energy Efficiency Design Index EIA Environmental Impact Assessment ERA Environmental Risk Assessment GTL Gas-to-liquid (here called synthetic diesel) GWP Global warming potential HC Hydrocarbons HCFC Hydrochlorofluorocarbons HFC Hydrofluorocarbons HFO Heavy fuel oil IMO International Maritime Organization IPCC Intergovernmental Panel on Climate Change LBG Liquefied biogas LCA Life Cycle Assessment LNG Liquefied natural gas LPG Liquefied petroleum gas MARPOL International Convention on the Prevention of Pollution from Ships MCDA Multi-Criteria Decision Analysis MGO Marine gas oil N2O Nitrous oxide NECA NOX Emissions Control Area NH3 Ammonia NMVOC Non-methane volatile organic compounds NO Nitrogen monoxide NO2 Nitrogen dioxide NOX Nitrogen oxides O3 Ozone ODP Ozone Depletion Potential PM Particulate matter PM10 Particulate matter with a diameter of 10 micrometres or less PM2.5 Particulate matter with a diameter of 2.5 micrometres or less POCP Photochemical Ozone Creation Potential RME Rapeseed methyl ester Ro-ro Roll-on-roll-off SCR Selective Catalytic Reduction SECA Sulphur Emission Control Area
xii
SEEMP Ship Energy Efficiency Management Plan SETAC Society of Environmental Toxicology and Chemistry SO2 Sulphur dioxide SOX Sulphur oxides TBT Tributylin UNEP United Nations Environment Programme VOC Volatile organic compounds TERMINOLOGY
Allocation Allocation refers to the distribution of flows between multiple units. Allocation problems occur in LCA when several products (or functions) share the same processes and the environmental load of these processes need to be expressed for only one product. Allocation is here denoted as one method to solve allocation problems. Thus, allocation methods include both allocation (also called partitioning) and system expansion. Allocation can be achieved by, for example, a physical relationship or the monetary value of the products.
Areas of Protection The entities that we want to protect. The Areas of Protection can be divided into ‘Human Health’, ‘Natural Environment’ and ‘Natural Resources’.
Attributional A type of LCA study that strive to be as complete as possible, accounting for all environmental impacts of a product. Answers questions such as ‘What would be the overall environmental impact of marine transportation with Fuel A?’
Consequential A type of LCA study that compares the environmental consequences of alternative causes of actions. Answers questions such as ‘What would be the environmental consequence of using Fuel A instead of Fuel B?’
Elemental flows The flows of resources and emissions connected to each process in the system.
Functional unit A quantitative unit representing the function of the system. The use of a functional unit enables comparisons of different products fulfilling the same function.
Goal and scope The first part of an LCA study describes the studied system and the purpose of the study. The goal should include, for example, the intended application and reasons for the study.
Human Health Here, an Area of Protection. Damage to Human Health is measured by mortality and morbidity over space and time.
Impact assessment The third step of an LCA study. The impact assessment includes classification of the elemental flows into different impact categories and characterisation of these, e.g. the relative contribution of the
xiii
emissions and resource consumptions to the impact categories are calculated
Inventory analysis The second step of an LCA study. It consists of three parts: construction of a flow model according to the system boundaries, data collection and calculation of resource use and emissions of the system in relation to the functional unit.
MARPOL The main international convention regulating the pollution from shipping is the ‘International Convention on the Prevention of Pollution from Ships’, known as MARPOL 73/78. The convention aims to reduce pollutant emissions from ships during accidents and routine operations.
Natural Environment Here, an Area of Protection. The impact on the Natural Environment is measured by loss or disappearance of species and loss of biotic productivity.
Natural Resources Here, an Area of Protection. The natural resources considered can be further divided into subcategories: atmospheric resources, land, water, minerals, metal ores, nuclear energy, fossil fuels and renewables.
Photochemical ozone Ozone formation is complex and depends on a number of factors, e.g. the concentrations of NO, NO2, and VOC as well as on the level of ultraviolet radiation.
Prospective Forward-looking. Used to denote forward-looking LCA studies.
Retrospective Backward-looking. Used to denote backward-looking LCA studies.
Ro-pax ferry A ro-pax ferry is a ro-ro ship with high freight capacity and limited passenger facilities.
Ro-ro ships Roll-on-roll-off (ro-ro) ships are designed to load and unload rolling cargo over ramps.
System expansion An allocation model in LCA. System expansion implies expanding the system to include affected processes outside the cradle-to-grave system.
1
1 INTRODUCTION Interest in new fuels for marine propulsion is growing, mainly as a result of stricter environmental regulations. Requirements on fuel quality and exhaust emissions for marine transportation will be enforced in different regions of the world in coming years, requiring the adoption of new technologies and/or fuels in the shipping industry. Increased attention to greenhouse gas emissions and uncertainty of future oil supply are also driving forces for change.
Several different fuels and exhaust abatement technologies are proposed for marine transportation, all of which have advantages and disadvantages in relation to the environment and human health. As new technologies and fuels are considered for marine transportation, knowledge of the performance at different system levels and from different perspectives will increase in importance. Evaluations of different aspects of the fuel choice will offer important support for decisions by shipowners as well as business, administrators and policymakers. This thesis will discuss the environmental assessment of marine fuels, with particular attention to their life cycle performance.
1.1 REGULATION OF EXHAUST EMISSIONS FROM MARINE TRANSPORTATION Emissions to air from shipping are constantly increasing, and this has been well-documented since the end of the 1990s (Corbett and Fischbeck, 1997, Corbett and Koehler, 2003, Endresen et al., 2003, Buhaug et al., 2009, Eyring et al., 2005). This increase can be attributed to a lack of strict emission regulations and an annual growth of 4% or more in sea-transported cargo from 1986 onwards (Buhaug et al., 2009, Eyring et al., 2010). The focus is now on regulating emissions of sulphur and nitrogen oxides from shipping. Moreover, the regulation of greenhouse gas emissions has been on the agenda for the last few years. The health risks associated with emissions of particles from shipping also raise concerns (Corbett et al., 2007), and regulations may be expected in the future.
The main international convention regulating pollution from shipping is the ‘International Convention on the Prevention of Pollution from Ships’, known as MARPOL 73/78. It was first adopted by the International Maritime Organization (IMO) in 1973. The convention aims to reduce pollutant emissions from ships in the event of accidents and during routine operations. It includes six technical annexes, with the last one, Annex VI, entitled ‘Regulations for the Prevention of Air Pollution from Ships’, entering into force in May 2005. Annex VI regulates deliberate emissions of ozone-depleting substances and sets limits on nitrogen oxides (NOX) and sulphur oxides (SOX) emissions from ship exhausts (IMO, 2006). In July 2011, mandatory measures to reduce greenhouse gas emissions were adopted by parties to MARPOL Annex VI (IMO, 2011).
Stricter emission regulations have been enforced in some sensitive areas, called Emission Control Areas (ECAs). From 2015, the emission of SOX will be limited to the equivalent of 0.1% sulphur1 in the combusted fuel within the Sulphur Emission Control Areas (SECAs) in the Baltic Sea, the North Sea and the English Channel (IMO, 2006). A SECA will also enter
1 Sulphur oxides are formed when sulphur in the fuel reacts with oxygen.
2
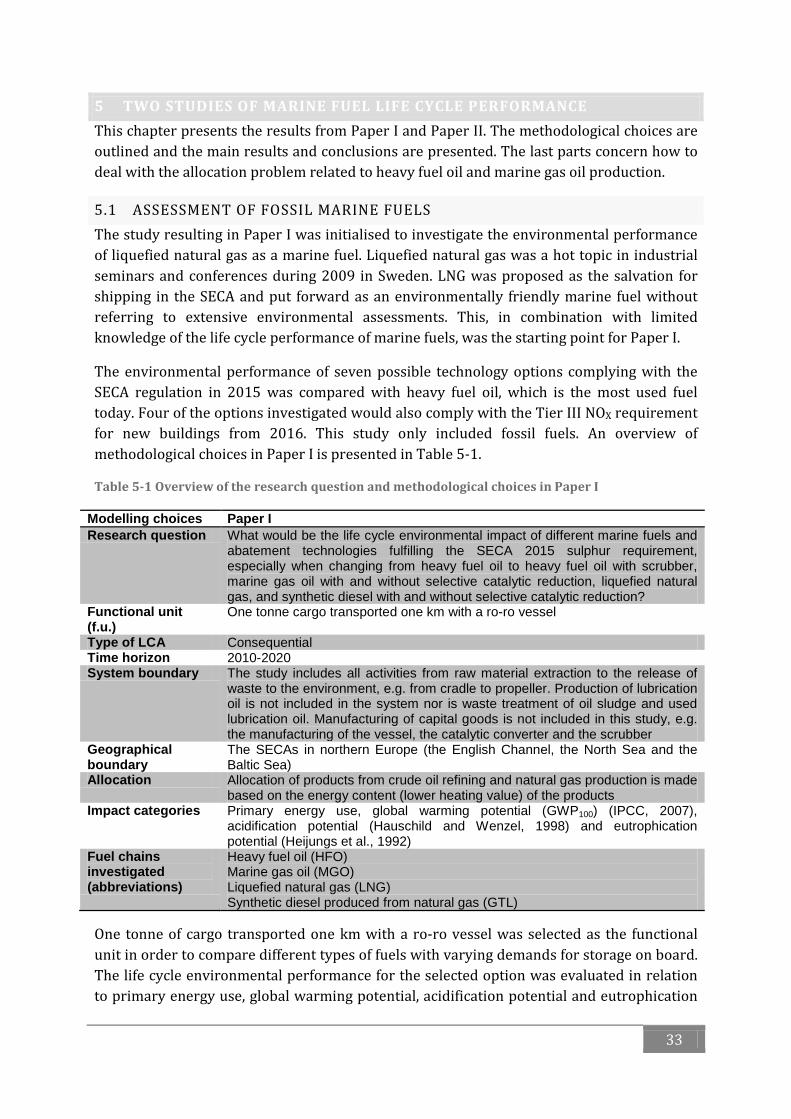
into force along the coast of the United States and Canada in 2012 (U.S. EPA, 2010). The limit of 0.1% sulphur in SECAs is a noticeable reduction compared with the maximum of 4.5%, which is allowed globally today, but it is still high compared with the limit of 10 ppm2 for diesel fuels used in road vehicles in the EU (EU, 2003). The global limit for the sulphur content of marine fuels will be reduced significantly to 0.5% sulphur by 20203. The stepwise reduction in the permitted sulphur content of fuel is shown in Figure 1-1.
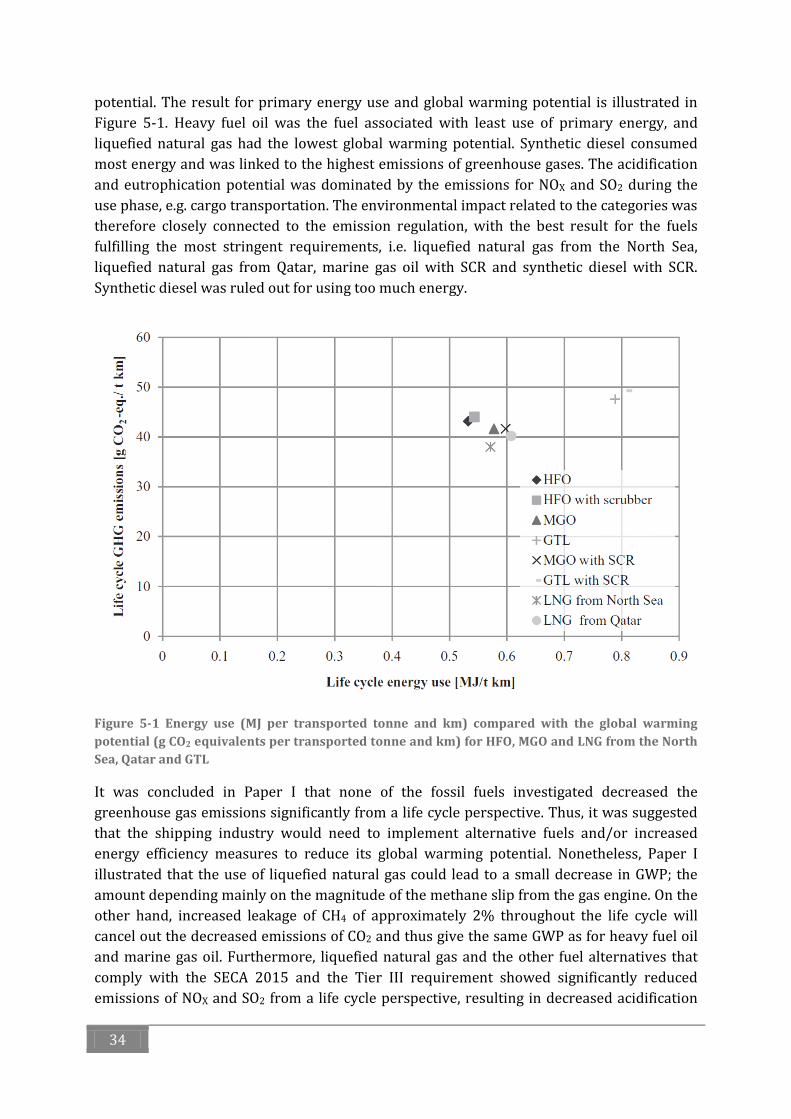
The emissions of NOX allowed in the MARPOL regulations depend on the engine speed, as illustrated in Figure 1-2. The first regulations were introduced for engines produced after the year 2000 (Tier I engines). For engines produced after 2011, the Tier II standard applies, representing a decrease of approximately 20% in NOX emissions. In special NOX Emission Control Areas (NECAs), Tier III will be applied from 2016, representing a decrease of approximately 80% in NOX emissions compared with Tier I. An ECA zone of up to 200 nautical miles from the coast of the United States and Canada, for both SOX and NOX, will enter into force in 2012 (U.S. EPA, 2010). This is the only NECA adopted so far.
Emissions of greenhouse gases from the shipping industry are not regulated by the Kyoto Protocol; instead, this responsibility is delegated to IMO. Buhaug et al. (2009) have estimated that in the absence of global policies to control greenhouse gas emissions from international shipping, emissions may increase by between 220% and 310% (compared with the emissions in 2007) by the year 2050 due to the expected growth in international seaborne trade. In order to decrease greenhouse gas emissions from shipping, the development of the Energy Efficiency Design Index (EEDI) for new vessels is being negotiated within IMO. The EEDI is intended to set a minimum requirement for fuel efficiency of new vessels and enable comparisons between similar vessels of the same size. The historic decision to regulate greenhouse gas emissions from shipping was taken in IMO in July 2011, when mandatory measures consisting of the EEDI with a minimum requirement for energy efficiency and the Ship Energy Efficiency Management Plan (SEEMP) were adopted by parties to MARPOL Annex VI (IMO, 2011).
These regulations will have an impact on the selection of marine fuels and abatement technologies4. The sulphur limit in SECAs5 in 2015 will demand a reduction of sulphur content in marine fuel or the use of sulphur abatement technologies. The Tier III NOX regulation will only apply to new buildings, thus the impact on emissions of NOX from shipping can be expected to be seen much later (Winnes et al., 2010). Whether the EEDI and the SEEMP will have any effect on the selection of marine fuels is still uncertain.
2 0.001% 3 A review to determine the availability of fuel oil with 0.5% sulphur content or below will be completed in 2018 and could postpone the global cap of 0.5% sulphur from 2020 to 2025. The global regulation of SOX emissions is described in detail in Svensson (2011). 4 There are also regional regulations related to the use of marine fuels in, for example, Europe and the USA, but these regulations are not considered here. 5 The SECAs adopted so far are a zone of up to 200 nautical miles from the coast of the United States and Canada, the Baltic Sea, the North Sea and the English Channel.
3
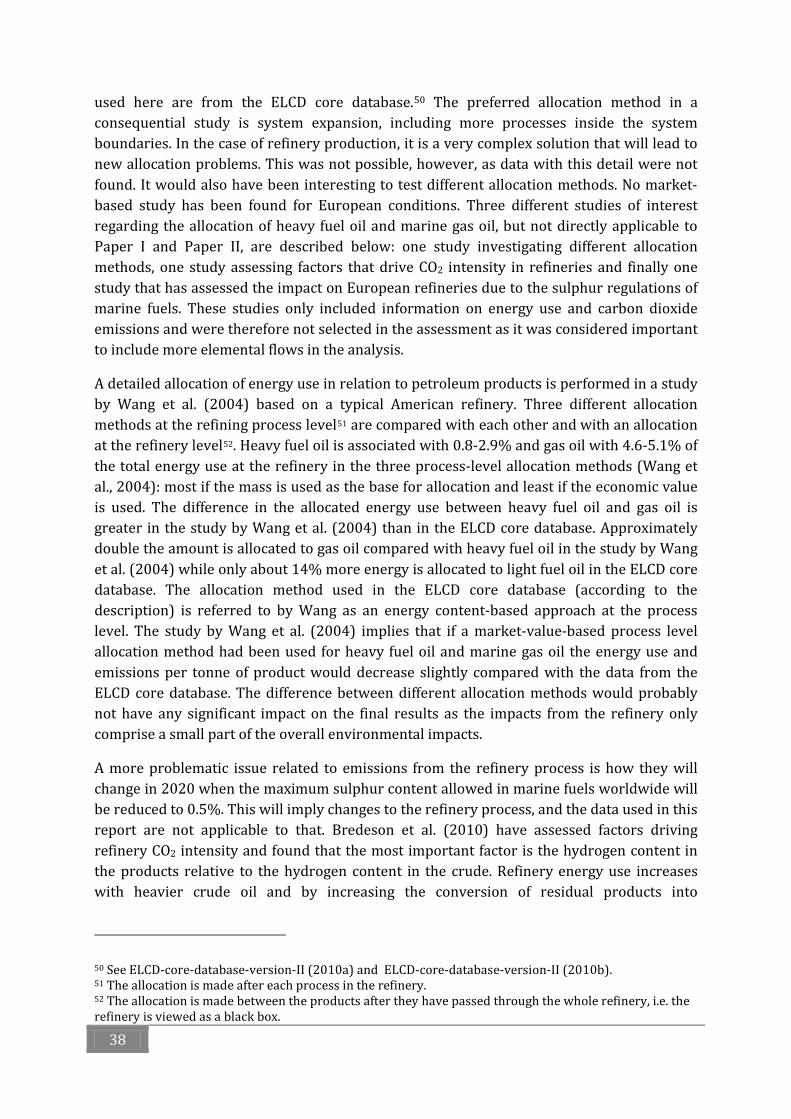
Figure 1-1 MARPOL Annex VI fuel sulphur limits
Figure 1-2 MARPOL Annex VI NOX emissions limits
1.2 TECHNOLOGY OPTIONS AND ALTERNATIVE FUELS Today, marine transportation uses mainly low-quality fuels from crude oil refining, called residual oil or heavy fuel oil. In this thesis, the name heavy fuel oil will be used. The price of heavy fuel oil is usually lower than of crude oil and substantially lower than of diesel fuel used for land transportation6. The sulphur content is usually above 1% in heavy fuel oil7. Large two-stroke and four-stroke engines are used with typical NOX emissions of 17g/kWh and 13g/kWh respectively before the Tier regulations (Cooper and Gustafsson, 2004).
‘New’ fuels and abatement technologies will be necessary to comply with the SECA and NECA requirements. The most pronounced fuels in the discussion regarding alternative fuels fulfilling the SECA regulation for 20158 are marine gas oil and liquefied natural gas. It is also possible to use a scrubber that removes the SO2 emissions from the exhaust gas instead of low sulphur fuels. Scrubbers in combination with high sulphur fuels may be an economically attractive option (Bosch et al., 2009).
In order to comply with the NECA regulation, a maximum of 2-3.4 g NOX per kWh (depending on the engine speed) will be allowed for new engines from 2016. Liquefied natural gas can comply with this requirement without any exhaust abatement technology. If this is not possible, however, exhaust abatement technologies will have to be used. One of the most promising abatement technologies is selective catalytic reduction (SCR) in which NOX and urea are converted into nitrogen and water in the presence of a solid catalyst.
6 The price of Brent crude in 2010 was 15.55$/GJ (BP, 2011), while the price of IFO380 (a heavy fuel oil quality) and MGO were 15.52$/GJ and 22.4 $/GJ respectively in Rotterdam on 30 October 2011 (Bunkerworld, 2011). 7Endresen et al. (2005) estimated the average sulphur content in residual oils at 2.7% in 2001 based on sales figures for international marine bunkers. 8 A maximum of 0.1% sulphur on a mass basis.
0%
1%
2%
3%
4%
5%
2010 2015 2020 2025
Fuel
sul
phur
con
tent
, wt.
%
Year
Global
SECA
0
2
4
6
8
10
12
14
16
18
100 600 1100 1600 2100
Lim
it of
nitr
ogen
oxi
des,
g/k
Wh
Rated engine speed (rpm)
Tier III (NECA)
Tier II (Global)
Tier I (Global)
4
A portfolio of different fuels may be used for shipping in the future. All fuels discussed so far have been fossil fuels but, from a longer time perspective, it would also be interesting to consider renewable fuels. Increased global awareness of the importance of reducing greenhouse gas emissions and the uncertainty of future oil supply make renewable fuels particularly interesting. It can also be foreseen that these issues will receive more focus when local and regional pollution concerns from shipping are addressed.
Some fuels will require large changes in infrastructure, such as liquefied natural gas, whereas other fuels will only require modification of the existing infrastructure, for example, marine gas oil. Moreover, the fuels will have different environmental and economic performance affecting the choice of fuel. Altogether, this makes it interesting to investigate the environmental performance of marine fuels that fulfil the upcoming environmental regulations and to evaluate fuels that can reduce the emissions of greenhouse gases and the dependence of oil from a longer time perspective.
1.3 ENVIRONMENTAL ASSESSMENT Environmental considerations can be integrated into a number of different types of decisions using environmental assessments. There is a wide range of environmental assessment methods and tools that can be used for evaluation and benchmarking of different technology options (Wrisberg, 2002). These methods include Life Cycle Assessment (LCA), Environmental Impact Assessment (EIA), Environmental Risk Assessment (ERA), Cost Benefit Analysis (CBA) and Multi-Criteria Decision Analysis (MCDA).
These tools are suitable for different types of evaluations and for assessing different types of questions. LCA is a common tool for environmental assessments of products and services and addresses the potential environmental impact of a product or service from a cradle-to-grave perspective (ISO, 2006a). The cradle represents raw material acquisition, which is followed by production, transportation, use, waste management and final disposal: the grave. As the regulation of emissions from shipping may require a fuel change, it is interesting to assess the upstream environmental impact of such a change in order to avoid problems shifting for one phase in the life cycle to another. LCA is therefore considered an appropriate tool for assessing the environmental performance of marine fuels in this thesis.
Furthermore, LCA is well established for evaluations of alternative fuels for road transportation (Weiss et al., 2000, Brinkman et al., 2005, Hekkert et al., 2005, Strömman et al., 2006, Edwards et al., 2007a, Arteconi et al., 2010). The majority of these studies, however, has focused on a limited number of impact categories, mainly primary energy use and greenhouse gas emissions (Weiss et al., 2000, Hekkert et al., 2005, Edwards et al., 2007a, Arteconi et al., 2010). The use of LCA to assess the environmental performance of fuels is widespread; however, methodological problems such as differences in results for apparently similar bioenergy systems are also well known (Cherubini et al., 2009, Malça and Freire, 2011, Plevin, 2010, Hillman, 2008).
Data from studies of road transportation fuels can also be used to assess marine fuels. Some aspects differ however. First, the basis of comparisons differ, as the fuels used at present in shipping (mainly residual oils) are different from those used in road vehicles (petrol and
5
diesel). The infrastructure needs and storage requirements also differ, as do the engines. It is therefore possible that fuels that are not well adjusted for road transport may be advantageous as marine fuels and vice versa.
The information regarding the overall environmental impact of marine fuels from a life cycle perspective is still inadequate. Only a limited number of studies have previously assessed the environmental life cycle performance of fossil marine fuels (Winebrake et al., 2007, Corbett and Winebrake, 2008).9 Winebrake et al. (2007) also included biofuels but only soybean-based biodiesel.
1.4 PURPOSE AND RESEARCH QUESTIONS The purpose of this thesis is to evaluate the environmental performance of present and future marine fuels. The challenge of performing relevant comparisons between different types of fuels/energy sources for future shipping is a driving force. Two main questions have been assessed in this thesis:
(i) What would be the life cycle environmental impact of different marine fuels and abatement technologies fulfilling the SECA 2015 sulphur requirement, especially when changing from heavy fuel oil to heavy fuel oil with scrubber, marine gas oil with and without selective catalytic reduction, liquefied natural gas, and synthetic diesel with and without selective catalytic reduction?
(ii) What are the differences from a life cycle perspective between diesel and gaseous fuels for marine transportation and what will be the effect of a transition towards the use of renewable fuels?
Furthermore, during the work on the above questions, LCA has continuously been evaluated as a decision-support tool for the choice of fuel in the shipping industry. Difficulties and problematic issues with the use of LCA are identified and elaborated on.
1.5 OUTLINE OF THE THESIS This thesis is divided into eight chapters that describe the environmental assessment of marine fuels with the focus on environmental performance from a life cycle perspective. The following chapter, Approaches to Environmental Evaluation, describes the theoretical framework for this thesis: systems theory and life cycle assessment.
Chapter 3, Assessment of Environmental Impact, gives an overview of the current environmental impact of marine transportation. This is followed by a description of some of the most common impact categories used in LCA. The importance of including each impact category is related to whether it is affected by a change in the fuels used in marine transportation. Chapter 4, Fuels, Engines and Exhaust Abatement Technologies, describes the fuels assessed in Paper I and Paper II. The engines used and the different exhaust abatement technologies needed to fulfil the upcoming environmental regulations are also described.
9 The result from these studies is compared with the result from Paper I in Bengtsson et al. (2011).
6
The results from Paper I and Paper II are presented in Chapter 5, Two Studies of Marine Fuel Life Cycle Performance. Paper I deals with the first research question, while Paper II deals with the second research question. Based on the application of life cycle assessment to marine fuels in Paper I and Paper II, the applicability of life cycle assessment as a tool for the evaluation of marine fuels will be elaborated on in Chapter 6, Life Cycle Assessment as a Tool for Sustainability Assessment. The main conclusions are summarised in Chapter 7, Conclusions, and ideas for further research and some reflections on marine fuel choices are given in the last chapter, Further Research and Reflections.
7
2 APPROACHES TO ENVIRONMENTAL EVALUATION Systems theory provides the theoretical framework for this thesis. In the first part of this chapter, basic principles from a tradition of system studies are introduced and concepts used in the thesis are described at a general level. The later part of the section will focus on LCA.
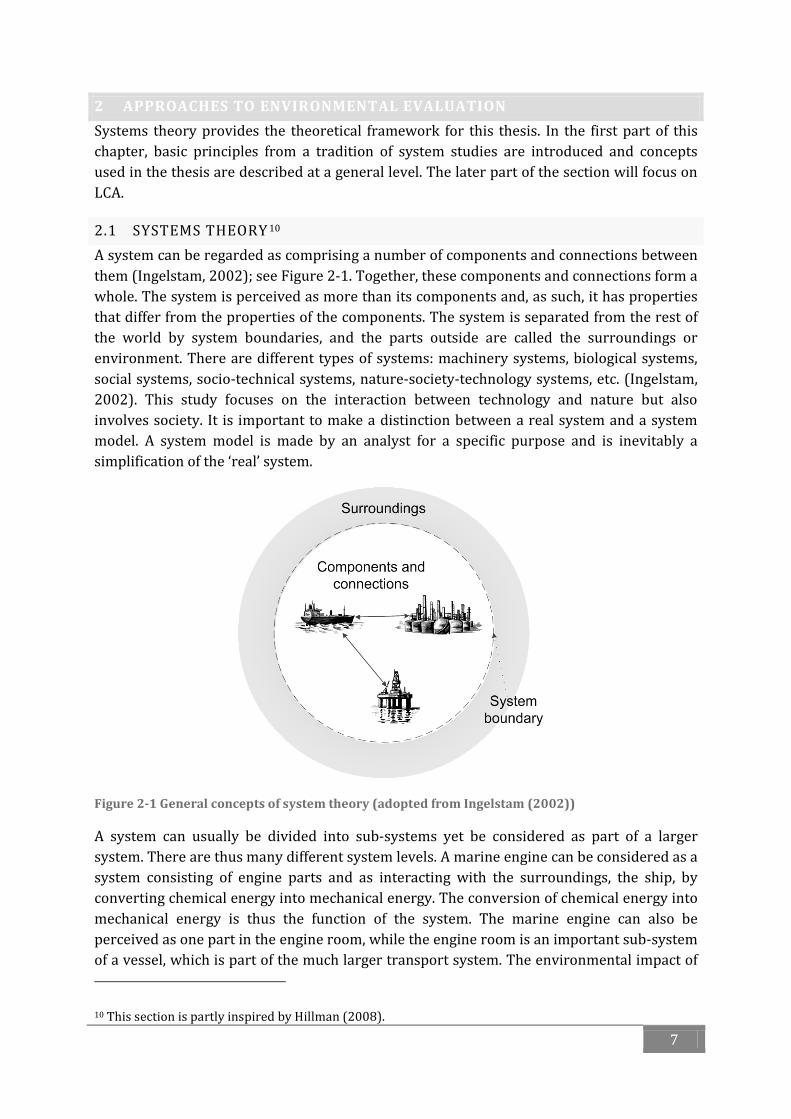
2.1 SYSTEMS THEORY 10 A system can be regarded as comprising a number of components and connections between them (Ingelstam, 2002); see Figure 2-1. Together, these components and connections form a whole. The system is perceived as more than its components and, as such, it has properties that differ from the properties of the components. The system is separated from the rest of the world by system boundaries, and the parts outside are called the surroundings or environment. There are different types of systems: machinery systems, biological systems, social systems, socio-technical systems, nature-society-technology systems, etc. (Ingelstam, 2002). This study focuses on the interaction between technology and nature but also involves society. It is important to make a distinction between a real system and a system model. A system model is made by an analyst for a specific purpose and is inevitably a simplification of the ‘real’ system.
Figure 2-1 General concepts of system theory (adopted from Ingelstam (2002))
A system can usually be divided into sub-systems yet be considered as part of a larger system. There are thus many different system levels. A marine engine can be considered as a system consisting of engine parts and as interacting with the surroundings, the ship, by converting chemical energy into mechanical energy. The conversion of chemical energy into mechanical energy is thus the function of the system. The marine engine can also be perceived as one part in the engine room, while the engine room is an important sub-system of a vessel, which is part of the much larger transport system. The environmental impact of
10 This section is partly inspired by Hillman (2008).
8
marine transportation can be studied with different system boundaries. The system boundaries can be extended both in time and place, and so forth.
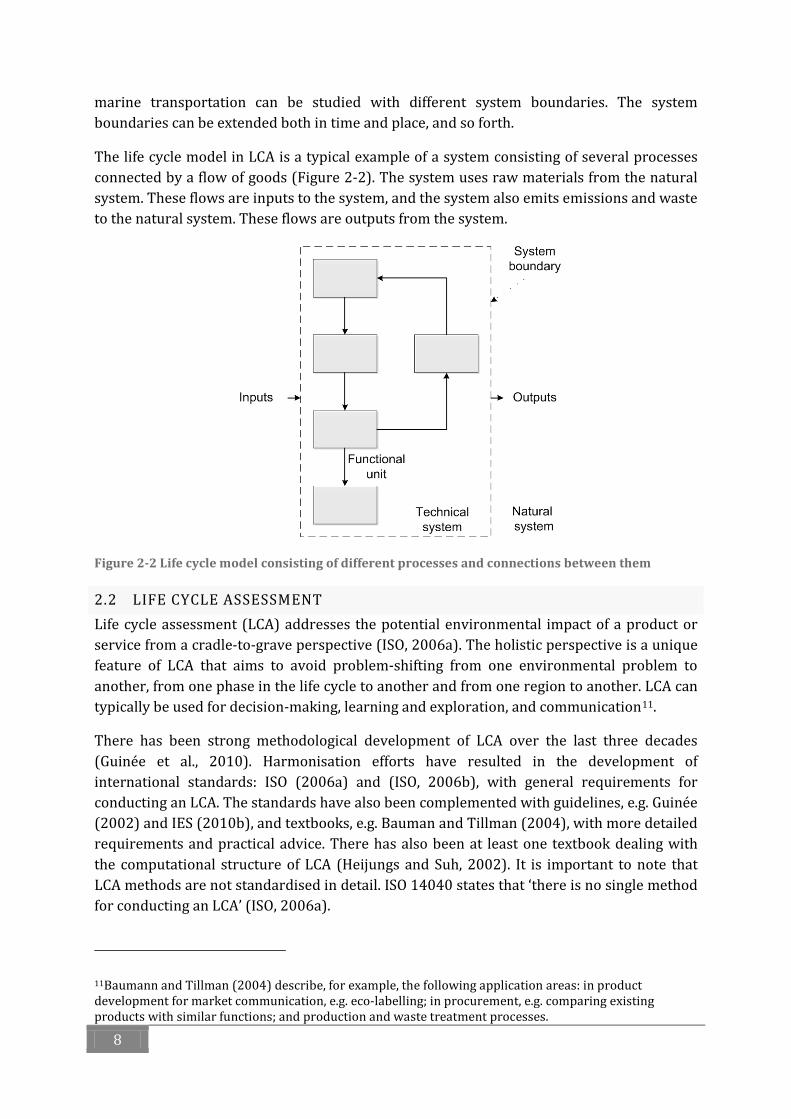
The life cycle model in LCA is a typical example of a system consisting of several processes connected by a flow of goods (Figure 2-2). The system uses raw materials from the natural system. These flows are inputs to the system, and the system also emits emissions and waste to the natural system. These flows are outputs from the system.
Figure 2-2 Life cycle model consisting of different processes and connections between them
2.2 LIFE CYCLE ASSESSMENT Life cycle assessment (LCA) addresses the potential environmental impact of a product or service from a cradle-to-grave perspective (ISO, 2006a). The holistic perspective is a unique feature of LCA that aims to avoid problem-shifting from one environmental problem to another, from one phase in the life cycle to another and from one region to another. LCA can typically be used for decision-making, learning and exploration, and communication11.
There has been strong methodological development of LCA over the last three decades (Guinee et al., 2010). Harmonisation efforts have resulted in the development of international standards: ISO (2006a) and (ISO, 2006b), with general requirements for conducting an LCA. The standards have also been complemented with guidelines, e.g. Guinée (2002) and IES (2010b), and textbooks, e.g. Bauman and Tillman (2004), with more detailed requirements and practical advice. There has also been at least one textbook dealing with the computational structure of LCA (Heijungs and Suh, 2002). It is important to note that LCA methods are not standardised in detail. ISO 14040 states that ‘there is no single method for conducting an LCA’ (ISO, 2006a).
11Baumann and Tillman (2004) describe, for example, the following application areas: in product development for market communication, e.g. eco-labelling; in procurement, e.g. comparing existing products with similar functions; and production and waste treatment processes.
9
The procedure for conducting an LCA consists of four phases, according to the ISO 14040 standard: (1) goal and scope definition, (2) inventory analysis, (3) impact assessment and (4) interpretation. The phases are dependent on each other, and conducting an LCA is therefore often an iterative process. An example of this is that the goal and scope definition usually needs to be refined during the study.
The goal and scope definition describes the studied system and the purpose of the study. The goal should include, for example, the intended application and reasons for the study. The question addressed in the LCA study affects the modelling choice: defining the goal and scope is therefore a central step of an LCA study. This will be further elaborated on in Section 2.2.1. An important modelling specification that should be stated in the goal and scope is the choice of functional unit, i.e. a quantitative unit representing the function of the system. This enables comparisons of different products fulfilling the same function. For marine transportation, the functional unit could be, for example, one tonne of cargo transported one km with a roll-on-roll-off (ro-ro) vessel, which is the functional unit in Paper I, or one year of ro-pax12 ferry service between the island of Gotland and the Swedish mainland, which is the functional unit in Paper II.
The inventory analysis consists of three parts: construction of a flow model according to the system boundaries, data collection, and calculation of resource use and emissions of the system in relation to the functional unit. There are three major types of system boundaries in LCA: between the technical system and the environment, between significant and insignificant processes, and between the technological system under study and other technological systems (Finnveden et al., 2009). The flows of resources and emissions connected to each process in the system are often called elemental flows in LCA. This term will also be used in this report.
The elemental flows quantified in the inventory analysis are classified in the impact assessment into different impact categories and characterised, e.g. the relative contribution of the emissions and resource consumptions are calculated. Emissions of greenhouse gases, for example, are aggregated into one indicator of global warming. This results in more aggregated information that is easier to interpret. The use of characterisation models, on the other hand, may increase the uncertainties of the result as they are simplified. This step is compulsory. An LCA without an impact assessment is called a life cycle inventory analysis. A more comprehensive description of impact categories and different characterisation models is presented in Section 3.2.
Interpretation is the final phase of the LCA in which the results from either or both of the inventory analysis and the impact assessment are summarised and discussed. This can be used as a basis for conclusions and recommendations.
LCA addresses environmental impacts of a service or production system. Economic and social impacts are typically not included. LCA needs to be combined with other tools for
12 A ro-pax ferry is a roll-on-roll-off (ro-ro) ship with high freight capacity and limited passenger facilities.
10
more extensive assessments. There are some recent trends in LCA towards more comprehensive Life Cycle Sustainability Assessments (Guinee et al., 2010).
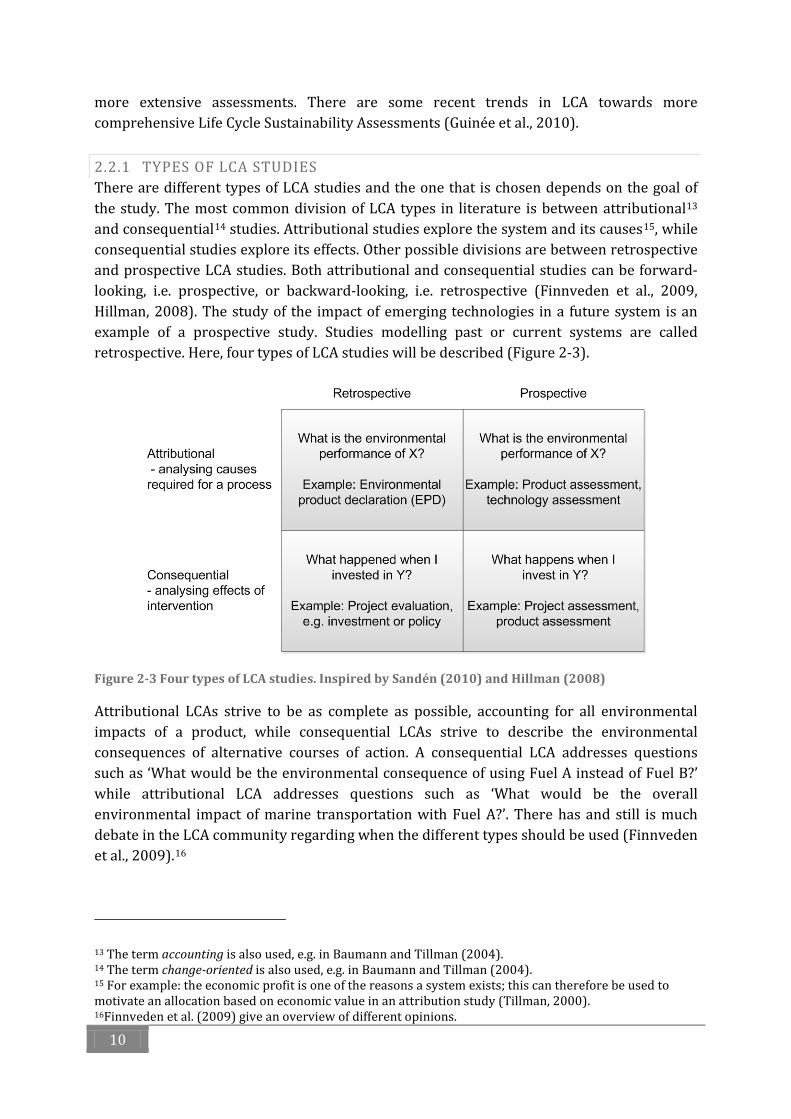
2.2.1 TYPES OF LCA STUDIES There are different types of LCA studies and the one that is chosen depends on the goal of the study. The most common division of LCA types in literature is between attributional13 and consequential14 studies. Attributional studies explore the system and its causes15, while consequential studies explore its effects. Other possible divisions are between retrospective and prospective LCA studies. Both attributional and consequential studies can be forward-looking, i.e. prospective, or backward-looking, i.e. retrospective (Finnveden et al., 2009, Hillman, 2008). The study of the impact of emerging technologies in a future system is an example of a prospective study. Studies modelling past or current systems are called retrospective. Here, four types of LCA studies will be described (Figure 2-3).
Figure 2-3 Four types of LCA studies. Inspired by Sandén (2010) and Hillman (2008)
Attributional LCAs strive to be as complete as possible, accounting for all environmental impacts of a product, while consequential LCAs strive to describe the environmental consequences of alternative courses of action. A consequential LCA addresses questions such as ‘What would be the environmental consequence of using Fuel A instead of Fuel B?’ while attributional LCA addresses questions such as ‘What would be the overall environmental impact of marine transportation with Fuel A?’. There has and still is much debate in the LCA community regarding when the different types should be used (Finnveden et al., 2009).16
13 The term accounting is also used, e.g. in Baumann and Tillman (2004). 14 The term change-oriented is also used, e.g. in Baumann and Tillman (2004). 15 For example: the economic profit is one of the reasons a system exists; this can therefore be used to motivate an allocation based on economic value in an attribution study (Tillman, 2000). 16Finnveden et al. (2009) give an overview of different opinions.
11
Which type of LCA study used will affect the results and interpretation of the LCA study. Hillman (2008) discusses two major problems regarding the use and interpretation of assessment results for emerging technologies17 both of which are relevant to this study. First, there is a risk that more advanced future technologies will be favoured as they are likely to display better environmental performance in a prospective attributional study. This could result in ‘there will always be more advanced future technologies worth waiting for’ (Hillman, 2008, p. 64). The second problem highlighted is linked to consequential studies. In consequential LCAs of near-term interventions, it is impossible to include all relevant cause-effect chains thoroughly. This results in only the easily accountable effects being included.
There are several methodological choices related to whether the LCA study is attributional or consequential18. One choice is marginal versus average data. Average data are proposed for attributional studies while marginal data are proposed for consequential studies. Consequential studies are intended to assess the effects of change and, thus, if more electricity is used, it is the marginal electricity use that increases. In attributional studies, on the other hand, it is assumed that the environmental performance of all the products in the world can be added together to obtain the environmental impact for the world, average data are therefore preferred. The system boundaries are also affected. In a consequential study, only the systems that differ need to be included whereas in attributional studies, which aim to be as complete as possible, all processes with significant contributions are generally included. A third issue affected by whether the study is attributional or consequential is how to deal with products with multi-outputs or multi-inputs.
2.2.2 ALLOCATION OR SYSTEM EXPANSION 19 Allocation problems occur when several products (or functions) share the same processes and the environmental load of these processes has to be expressed by only one function (see Figure 2-4). One example of a process with multiple outputs is refining of crude oil, which results in a number of products (e.g. liquefied petroleum gas, petrol, diesel, asphalt) that are used in different applications. When assessing the life cycle impact of, for example, truck transportation, the environmental impacts between the outputs need to be distributed. Another example is leachate from landfills. How much leachate should be associated with food waste and how much with other types of waste? This is an example of a problem connected to a process with multiple inputs.
Allocation can be achieved by, for example, a physical relationship or the monetary value of the products. It is also possible to avoid the allocation problem by using system expansion, incorporating additional functions into the system. The ISO standard states that allocation shall, if possible, be avoided either by refining the system or by expanding it (ISO, 2006b).
System expansion implies expanding the system to include the affected processes outside the cradle-to-grave system. This is the preferred option for consequential LCAs20, as
17 In this case, renewable transportation fuels. 18 These are described in, for example, Tillman (2000), and Baumann and Tillman (2004). 19 In the thesis, allocation is denoted as one method to solve allocation problems. Thus, allocation methods include both allocation (also called partitioning) and system expansion.
12
consequential LCAs aim to include all the activities that contribute to the environmental consequences of change, regardless of whether they are inside or outside of the cradle-to-grave system. Many authors argue for partitioning as a way to solve allocation problems for attributional LCA studies (Finnveden et al., 2009).
Figure 2-4 Examples of multi-output and multi-input processes (adapted from Baumann and Tillman (2004, p. 84))
2.2.3 UNCERTAINTIES IN LCA 21 Uncertainty is often not considered in LCA studies even if it can be high. Finnveden et al. (2009) distinguish between sources and types of uncertainties. These are described in Table 2-1. Many of these uncertainties show up in a typical LCA study.
Table 2-1 Sources and types of uncertainties in LCA. Adopted from Finnveden et al. (2009).
Sources of uncertainties
Types of uncertainties Example
Data
Variability Fuel consumption may vary between different engines of the same type, change over time or depend on external conditions
Miss-specified Instead of data for natural gas extraction in the North Sea in 2010, there may be data for natural gas extraction in North Africa in 2006.
Erroneous A typing error, a mistake in units or a decimal point may have been confused for a thousands separator.
Incomplete Information about some environmental flows are missing Round-off 0.564 may have been entered as 0.6
Choices
Inconsistent with Goal and Scope
Average technology for a certain technology instead of best available technology
Inconsistent across alternatives
Different allocation methods used for different processes in the same study
Relations
Wrong A linear dependence on acidification from SO2 emissions may not reflect the true relationship.
Incomplete Influence of background levels of contaminants may be incomplete.
Inaccurate implementation in software
Matrix inversion routines may be sensitive to the choice of algorithm.
Finnveden et al. (2009) also suggest three methods to deal with uncertainties in LCA: (i) the ‘scientific way’, (ii) the ‘social way’ and (iii) the ‘statistical way’. The scientific way includes finding better data, making better models, etc. The social way, on the other hand, deals with uncertainties through discussion with stakeholders. The aim is to reach consensus on data and choices with the stakeholders. The last method, the statistical way, aims to include the uncertainties in the analysis instead of removing them. This method can include, for example, parameter variation and scenario analysis or Monte Carlo simulation.
21 This section is based on Finnveden et al. (2009).
15
3 ASSESSMENT OF ENVIRONMENTAL IMPACT The impact assessment phase of LCA is aimed at ‘understanding and evaluating the magnitude and significance of the potential environmental impacts of a product system’ (ISO, 2006b). The purpose of the phase is to interpret the impact of life cycle emissions and resource consumption of the product or service on the entities that we want to protect, often denoted Areas of Protection. The Areas of Protection can be divided into ‘Human Health’, ‘Natural Environment’ and ‘Natural Resources’22.
Damage to Human Health is measured by mortality and morbidity over space and time. The impact on the Natural Environment is measured by loss or disappearance of species and loss of biotic productivity. The third Area of Protection, Natural Resources, is difficult to quantify in one common indicator. The Natural Resources considered can be further divided into subcategories: atmospheric resources, land, water, minerals, metal ores, nuclear energy, fossil fuels and renewables (Dewulf et al., 2007).
The best-known environmental impact of shipping is perhaps the considerable damage to mammals, birds and beaches by oil spills, but ships interact in many ways with the environment. This section starts by describing the environmental impacts caused by shipping. This is followed by a description of the environmental impact categories typically used in LCA. The relevance of each impact category on the fuel choice in shipping is scrutinised.
3.1 ENVIRONMENTAL IMPACT OF MARINE TRANSPORTATION A screening life cycle assessment of marine transportation was performed by Johnsen and Magerholm-Fet (1998). Their study showed that the operation phase was the main contributor to most environmental impact categories. Building, maintenance and scrapping were shown to be important to the impact categories of ozone depletion, solid waste and material use.
Building and scrapping can be affected by the choice of fuel, mainly with regard to different types of engines and the fuel storage system. The environmental impact caused by this difference is likely to be very small however. The effects during the building and scrapping of a vessel are therefore not assumed to be affected by the choice of fuel in the shipping industry. Other environment impacts from shipping include construction and management of ports and inland channels. Dredging, for instance, changes the physical, biological and chemical structure of the ecosystem (Hensher and Button, 2003).
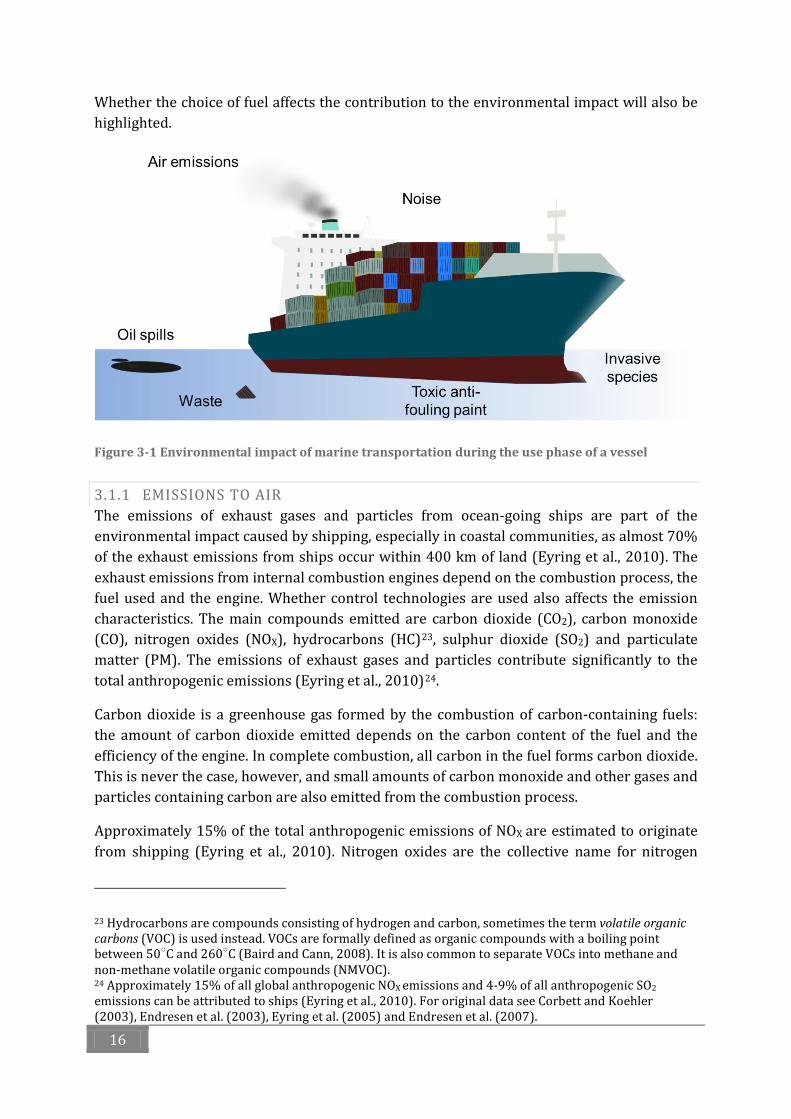
During the operating phase, shipping affects the environment through, for example, air emissions, release of oil to the environment from accidents and routine discharges of oily bilge and ballast water, release of toxic substances from anti-fouling paint, introduction of invasive species transported by vessels, dumping of non-biodegradable solid waste into the ocean and noise (Figure 3-1). Some of these impacts will be described in more detail below.
22 These areas are considered in IES (2010a) and generally accepted in the LCA community (Finnveden et al., 2009). A fourth Area of Protection, the Man-Made Environment, is sometimes also considered (Finnveden et al., 2009).
16
Whether the choice of fuel affects the contribution to the environmental impact will also be highlighted.
Figure 3-1 Environmental impact of marine transportation during the use phase of a vessel
3.1.1 EMISSIONS TO AIR The emissions of exhaust gases and particles from ocean-going ships are part of the environmental impact caused by shipping, especially in coastal communities, as almost 70% of the exhaust emissions from ships occur within 400 km of land (Eyring et al., 2010). The exhaust emissions from internal combustion engines depend on the combustion process, the fuel used and the engine. Whether control technologies are used also affects the emission characteristics. The main compounds emitted are carbon dioxide (CO2), carbon monoxide (CO), nitrogen oxides (NOX), hydrocarbons (HC)23, sulphur dioxide (SO2) and particulate matter (PM). The emissions of exhaust gases and particles contribute significantly to the total anthropogenic emissions (Eyring et al., 2010)24.
Carbon dioxide is a greenhouse gas formed by the combustion of carbon-containing fuels: the amount of carbon dioxide emitted depends on the carbon content of the fuel and the efficiency of the engine. In complete combustion, all carbon in the fuel forms carbon dioxide. This is never the case, however, and small amounts of carbon monoxide and other gases and particles containing carbon are also emitted from the combustion process.
Approximately 15% of the total anthropogenic emissions of NOX are estimated to originate from shipping (Eyring et al., 2010). Nitrogen oxides are the collective name for nitrogen
23 Hydrocarbons are compounds consisting of hydrogen and carbon, sometimes the term volatile organic carbons (VOC) is used instead. VOCs are formally defined as organic compounds with a boiling point between 50○C and 260○C (Baird and Cann, 2008). It is also common to separate VOCs into methane and non-methane volatile organic compounds (NMVOC). 24 Approximately 15% of all global anthropogenic NOX emissions and 4-9% of all anthropogenic SO2 emissions can be attributed to ships (Eyring et al., 2010). For original data see Corbett and Koehler (2003), Endresen et al. (2003), Eyring et al. (2005) and Endresen et al. (2007).
17
dioxide (NO2) and nitrogen monoxide (NO). NOX emissions originate mainly from the high temperature reaction of atmospheric nitrogen and oxygen present in the combustion chamber. A small part also originates from nitrogen in the fuel. The NOX emitted from a large two-stroke engine typically consists of 5-7% NO2, while the rest is NO (Henningsen, 1998). The NO emissions are oxidised to NO2 in the atmosphere. Nitrogen oxides contribute to acidification, eutrophication and photochemical ozone formation and also affect human health (Harrison, 2001).
Emissions of hydrocarbons are a consequence of incomplete combustion of fuel and consist of unburned and partially oxidised hydrocarbons (Heywood, 1988). Unburned lubrication oil from cylinder lubrication can also be a major contributor to HC emissions for two-stroke engines (Henningsen, 1998). Hydrocarbons act as precursors of photochemical ozone, and some hydrocarbons are toxic, for example, benzene and polycyclic aromatic hydrocarbons (Harrison, 2001). Methane is a greenhouse gas.
Sulphur oxides are formed when sulphur in the fuel reacts with oxygen. More than 90% of the sulphur oxides formed in marine engines are SO2 (Karle and Turner, 2007). Marine fuels have much higher sulphur content than road fuels. SO2 emissions contribute to the formation of acid rain and impact human health (Harrison, 2001).
Particulates are usually divided into primary and secondary particles. Primary particles results mainly from incomplete combustion of the fuel (soot) and from ash, and some are attributed to lubricating oil. Secondary particles are formed in the atmosphere from, for example, emissions of SO2 and NOX, which create sulphate and nitrate aerosols and by coagulation and condensation of vapours. The global emissions of particulate matter from shipping is estimated to 0.90 Tg annually (Lack et al., 2009), consisting of about 46% sulphate, 39% organic matter and 15% black carbon based on mass. Average emissions of particles from ship engines according to published measurements of on-board data vary between 0.33 and 1.34g/kWh for marine diesel oils and heavy fuel oils respectively (Winnes and Fridell, 2009). Winnes and Fridell (2009, p. 1397) further state that ‘harmful particles in ship exhausts are far from eliminated by a fuel shift to low-sulfur-gas oil.’ The main concern about emissions of particles is the health effects (Harrison, 2001)25, but particles also contribute to climate change due to both the direct effects on the radiative balance and indirect through increased cloud formation (Lauer et al., 2007, Eyring et al., 2010).
3.1.2 OIL SPILLS Accidental oil spills from tanker vessels have decreased since the 1970s; however, there are still many spills in ecologically sensitive locations (Burgherr, 2007). The release of oil to the environment from shipping originates from the transportation of fuels in tanker vessels as well as from fuel used for propulsion. The part that originates from fuel used for propulsion will be affected by the choice of fuel in marine transportation. Only about 7% of the oil spills from vessels were from non-tank vessels during the period 1990-1999 (National Research
25 The smallest particles are considered most harmful to humans (Pope et al., 2002).
18
Council, 2003). There is also operational oil pollution from, for example, bilge and ballast water.
3.1.3 INVASIVE SPECIES Transportation of invasive alien marine species in ballast water and from hull fouling is also linked to global marine transportation of goods. Ballast water is needed to ensure vessel stability. In port, the ballast water may be pumped into specially designed tanks to compensate for the variance in weight distribution as cargo is removed and be released when cargo is loaded. It is estimated that at any given time some 10,000 different species are being transported between geographic regions in ballast tanks alone (Bax et al., 2003). While many of the alien species become part of the background flora and fauna, others become invasive and come to dominate the native flora and fauna. An example of the economic impacts is a decrease in economic production by fisheries, aquaculture, tourism and marine infrastructure. Human health can also be affected, for instance, the Asian strain of the cholera bacterium was probably introduced into Latin America through the discharge of ballast water (Hensher and Button, 2003). The introduction of alien species is not connected to the fuels used but rather to transportation over large distances between regions with different flora and fauna.
3.1.4 TOXIC SUBSTANCES FROM ANTI-FOULING PAINT Antifouling paints are applied to hulls to prevent growth of fouling organisms such as barnacles, mussels, bryozoans and algae. Antifouling systems are required wherever unwanted biological growth occurs, and the need to protect ship hulls from fouling is as old as the use of ships (Almeida et al., 2007). Fouling leads to increased weight, resistance and drag, thereby increasing fuel consumption and emissions to the air as well as loss of manoeuvrability and increased frequency of dry dockings (Yebra et al., 2004). It has been estimated that fuel consumption increases by 6% for every 100 µm increase of hull roughness due to fouling (Voulvoulis et al., 1999). In recent decades, the paint systems used in shipbuilding have undergone development corresponding to emerging regulations and legislation after the phasing out and ban on tributylin (TBT) based paints (Chambers et al., 2006). TBT-based paints are very efficient antifouling paints but have shown to have huge negative effects on ecosystems (Antizar-Ladislao, 2008). This impact from shipping is not connected to the fuel used or the cargo transported, even if fouling increases fuel consumption.
3.2 ENVIRONMENTAL IMPACT CATEGORIES 26 The environmental impacts related to shipping have been described above with the focus on elemental flows from shipping. In this section, the environmental impact categories typically used in LCA are described as well as the elemental flows connected to these categories. It also highlights which of these categories are relevant to the assessment of marine fuels.
26 This section is mainly based on Baumann and Tillman (2004), IES (2010a) and Finnveden et al. (2009).
19
An indicator of an impact category can be chosen anywhere along the impact pathway. The impact pathway is the chain from emissions and resource use to the final impact on the Areas of Protection. Most impact categories used are midpoint impacts that affect at least one of the Areas of Protection. The most common impact categories27 used in life cycle assessment are presented in Figure 3-2. These impact categories will be described and their relevance to the evaluation of marine fuels assessed in the following section.
Figure 3-2 Framework of impact categories for the characterisation of elementary flows at the midpoint and endpoint (adapted from IES (2010))
3.2.1 CLIMATE CHANGE Climate change impacts both the Natural Environment and Human Health through a number of different environmental mechanisms. Climate change is caused by greenhouse gas absorption of infrared radiation. Greenhouse gases differ in their warming influence on the global climate system due to their different radiative properties and lifetimes in the atmosphere.
A globally recognised model has been developed by the Intergovernmental Panel on Climate Change (IPCC). The IPCC has calculated the radiate forcing properties of all greenhouse gases and denoted it Global Warming Potentials (GWPs). The potential contribution of a
27 Other impact categories not mentioned here include impacts of water use, noise and indoor air etc.
20
substance to climate change is expressed as its GWP. The GWP of 1 kg of a substance is defined as the ratio between the increased infrared absorption it causes and the infrared absorption caused by 1 kg of CO2. The GWP of a substance will depend on the time horizon, as different substances have different lifetimes in the atmosphere (IPCC, 2007). The most used time horizon in LCA is 100 years. The IES (2010a) recommends the use of the IPCC’s GWPs at the midpoint. The three most common greenhouse gases and their GWPs are shown in Table 3-1.
Table 3-1 Global warming potential for different time horizons expressed relative to CO2 (IPCC, 2007)
There are emissions other than greenhouse gases covered by the IPCC, however, that have a secondary impact on radiative forcing. These are emissions that contribute to the formation of ozone (O3), aerosols and cloud formation. Ship emissions of CO2, SO2, NOX and other precursors perturb atmospheric concentrations of greenhouse gases (CO2, CH4, N2O and O3) and aerosols. They contribute to both negative and positive radiative forcing28.
3.2.2 OZONE DEPLETION Ozone is continuously being formed and destroyed by sunlight and chemical reactions in the atmosphere. Ozone depletion refers to the thinning of the stratospheric ozone layer by anthropogenic emissions of ozone-depleting substances such as chlorofluorocarbons and halons (Harrison, 2001). These are persistent chemicals that contain chlorine or bromine atoms. Chlorine and bromine have the ability to destroy large quantities of ozone molecules that act as free radical catalysts in a sequence of degradation reactions. The ozone depletion potential (ODP) of a substance is calculated by a theoretical steady-state model that reflects the change in the stratospheric ozone column due to the amount of emissions of that substance relative to that of CFC-11.
Ozone-depleting substances are used on-board ships for refrigeration/freezers of cargo and provisions, and in air conditioners. Ozone-depleting substances may be emitted to the atmosphere by leakage of ozone-depleting substances during operation and maintenance as well as when a unit containing these substances is scrapped. Buhaug et al. (2009) estimated the change in emissions of ozone-depleting substances from shipping between 1998 and 2006. Emissions of chlorofluorocarbons (CFCs) and hydrochlorofluorocarbons (HCFCs) had decreased by 98% and 78% respectively, whereas the emissions of hydrofluorocarbons (HFCs) had increased by 315% as HCFs substitute CFCs and HCFCs. The emission of ozone-depleting substances is not linked to the use of fuels but rather to the transportation of different types of cargo and is therefore not relevant to assess in this thesis.
28 The radiative forcing of total shipping is estimated at 0.001 W m-2 excluding indirect aerosol effects an -0.408 W m-2 including indirect aerosol effects (Eyring et al., 2010).
21
3.2.3 TOXICITY Human and ecotoxicological impacts are considered difficult to incorporate in LCA due to a lack of inventory data for emissions and problems with the models used and the related data (Finnveden et al., 2009).
According to the IES (2010a), the model for human toxicity effects must account for environmental fate, exposure, dose response of a chemical for midpoint factors and additionally severity for endpoint factors. On the other hand, characterisation factors for ecotoxicological effects account for the environmental persistence and ecotoxicity of a chemical. A model that aims for scientific consensus for Life Cycle Impact Assessment of chemicals, USEtox, has been developed under the umbrella of the Life Cycle Initiative, a joint effort by the United Nations Environment Programme (UNEP) and the Society of Environmental Toxicology and Chemistry (SETAC) (Hauschild et al., 2008). USEtox aims to form the basis of future recommendations from the Life Cycle Initiative (Finnveden et al., 2009).
The human and ecotoxicological impacts will probably vary between different fuels and should therefore ideally be included in a LCA of marine fuels. The work environment for marine engineers may, for example, be very different for different types of fuels.
3.2.4 PARTICULATE MATTER Particulate matter (PM) has a well-established impact on human health, and long-term exposure to fine particles has been shown to increase the risk of premature mortality (Pope et al., 2002). It has also been estimated by Corbett et al. (2007) that about 3-5% of global mortalities caused by PM2.5 are attributed to marine transportation. The concentration of particulate matter in the air is elevated by particulate emissions.
The characterisation factors for particulate matter include environmental fate, exposure, dose-response of pollutant midpoint factors and severity of endpoint factors. The fate and exposure can be combined into an intake fraction, while the dose-response and severity can be combined into an effect factor. Characterisation factors for human health effects of fine particulates in Europe have been developed by van Zelm et al. (2008). The characterisation factors express the change in disability-adjusted life years (DALYs) of European inhabitants due to a change in the emissions of ammonia, nitrogen oxides, sulphur dioxide and PM10.
3.2.5 PHOTOCHEMICAL OZONE FORMATION Ground level ozone is a secondary pollutant formed in the troposphere. Ozone formation is complex and depends on a number of factors, e.g. NO, NO2, volatile organic compounds (VOC) and ultraviolet radiation. The effect of different emissions depends on the background concentration of NOX as well as the location.
There are two different types of characterisation models based on two different types of simplification. The first approach29 is based on the Photochemical Ozone Creation Potential
29 Described in, for example, Guinée (2002)
22
(POCP) concept. Individual characterisation factors are provided for many different VOCs, but local conditions like the simultaneous presence of other non-methane VOCs and NOX, and the solar radiation intensity are not included in the model. The second approach30 is adopted in regionally differentiated models that attempt to capture the non-linear nature of ozone formation, but it largely ignores the variation between different VOCs. The photochemical ozone formation is quite similar to many substances, except for halogenated hydrocarbons, CH4 and CO (IES, 2010a).
Emissions of NOX and VOC are dependent on the fuel used and therefore important to consider. In order to use the POCP model, detailed knowledge is required of which VOCs are emitted. It can therefore be easier to apply the second approach in order to characterise the impact of the photochemical ozone formation potential.
3.2.6 ACIDIFICATION POTENTIAL Acidification potential is an important impact category for the assessment of marine fuels, as acidifying emissions from marine transportation are a major downside of the fuels today. The acidification potential addresses the impact generated by emissions of airborne acidifying pollutants. These pollutants have effects on soil, groundwater, surface waters, biological organisms, ecosystems and materials (buildings).
The major acidifying pollutants are SO2, NOX and NH3. They form acidifying H+ ions and can be characterised based on this capacity. The acidification potential is defined as the number of H+ ions produced per kg of substance relative to SO2. This simplified model does not take into account the effect of fate, background deposition and ecosystem sensitivity. The actual acidifying potential depends on where the acidifying pollutants are deposited. There have been models that have tried to take this into account, e.g. Huijbregts et al. (2000a). The Area of Protection affected by acidification is mainly the Natural Environment in the form of a decrease in biodiversity and bio-productivity.
3.2.7 EUTROPHICATION POTENTIAL Eutrophication potential is associated with high levels of nutrients, which leads to increased biological productivity, e.g. algae bloom. Nitrogen and phosphorus are the most common limiting nutrients. Terrestrial eutrophication is mainly caused by NOX emissions from combustion and ammonia from agriculture. As different ecosystems are limited by different nutrients, the actual eutrophication potential also varies geographically. There have been models that have tried to take this into account, e.g. Huijbregts et al. (2000a)31. The main Area of Protection affected by eutrophication is the natural environment.
Nitrogen oxides are a major pollutant from marine transportation. The eutrophication potential is also important to consider when assessing crop-based biofuels, as these can be linked to emissions of ammonia from agriculture.
30 Described in, for example, Hauschild et al. (2006) 31Concerns terrestrial eutrophication.
23
3.2.8 IMPACTS OF LAND USE Land use is an elementary flow that leads to an impact category or a group of impact categories. The impacts of land use cover the damage to ecosystems caused by occupation and transformation of land. There is currently no agreement on how these impacts should be included in LCA (Finnveden et al., 2009). Land use affects the Natural Environment and Natural Resources directly and Human Health indirectly. Land use is an important factor when evaluating biofuels. Biofuels produced from dedicated crops are generally connected to land use and/or land use changes.
3.2.9 RESOURSE DEPLETION The earth contains a finite amount of non-renewable resources, such as metals and fuels. This impact category considers both renewable and non-renewable resources. There is a wide variety of characterisation methods available for assessing non-renewable resources. Which one should be used is debatable (Finnveden et al., 2009). Many ‘well-to-wheel’ studies of road fuels are limited to the assessment of primary energy use.32
The only resources considered for marine fuels are raw materials for fuel production, e.g. natural gas, crude oil and biomass. It is thus the assessment of primary energy use that is of interest and not all types of resource depletion. If, however, the life cycle impact of a vessel is considered, resources other than fuels could be included.
32 See, for example, Edwards et al. (2007b).
25
4 FUELS, ENGINES AND EXHAUST ABATEMENT TECHNOLOGIES 33 Figure 4-1 illustrates the fuels and production routes investigated in this thesis. They originate from three types of feedstock: crude oil, natural gas and biomass. Paper I includes the four fossil fuels: heavy fuel oil, marine gas oil, liquefied natural gas and synthetic diesel, while Paper II includes all fuels except synthetic diesel from natural gas (gas-to-liquid). The figure also illustrates that the fuels can be classified according to the type of energy carrier. The type of energy carrier will have an impact on the type of engine and fuel distribution infrastructure that is required. The fuel and engine together affect which exhaust abatement technologies are required to meet the upcoming environmental regulations34.
Figure 4-1 Fuel chains assessed for marine transportation
4.1 FUELS In 2007, almost 350 million tonnes of fuel were consumed by shipping, of which about 250 million tonnes were heavy fuel oil (Buhaug et al., 2009). Heavy fuel oil is one of the heaviest fractions obtained from crude oil refining. Marine gas oil and liquefied natural gas are alternatives to heavy fuel oils discussed for a short-term perspective. Marine gas oil is a distilled fraction from crude oil refining and is lighter than heavy fuel oil. The typical sulphur content of marine gas oil is below 0.1% in Europe35.
Liquefied natural gas is produced from another fossil feedstock: natural gas. The density of liquefied natural gas is about 600 times higher than that of natural gas at normal temperature and pressure. The interest in using liquefied natural gas comes mainly from its
33 This section is partly based on Bengtsson et al. (2011) and Paper II. 34 Upcoming environmental regulations refer to the MARPOL SECA regulation in 2015 and the NOX Tier III requirement. 35 The average sulphur content during the period 01/08/2010 to 31/12/2010 from 49 samples collected by the Swedish Transport Agency was 0.07% (Transportstyrelsen, 2011).
Crude oil Natural gas Lignocellulosic biomassFeedstock
low sulphur content but also from reduced emissions of PM and NOX. Liquefied natural gas is also expected to be available at a competitive price (Gullberg and Gahnström, 2011). Obstacles to the use of LNG include lack of infrastructure for LNG36, increased storage requirements and high investment costs37 (Gullberg and Gahnström, 2011). LNG has a lower density than heavy fuel oil and marine gas oil and requires pressurised containers of a certain design. There are suggestions to use unpressurised containers that can be shaped to fit the hull, but this has not been implemented so far. Experiences from Norwegian LNG ferries suggest that about two and half to four times as much space is needed (Hellén, 2009, SWECO, 2009).
Natural gas could also be used to produce synthetic diesel and in this way make use of the existing infrastructure. Synthetic diesel, or gas-to-liquid (GTL) as it also is called, is produced by the Fischer-Tropsch or other similar process. It is a three-step process consisting of syngas generation, hydrocarbon synthesis and upgrading. The Fischer-Tropsch process can be used to produce diesel from hydrocarbons such as coal, natural gas and biomass.
Two renewable alternatives to marine gas oil and LNG are biodiesel and biogas respectively; both can be blended with fossil fuels38 (diesel and natural gas, respectively). Biodiesel is a fuel tested for marine propulsion by, for example, Maersk (Gallagher, 2010) and the US Navy (Bruckner-Menchelli, 2011). It is also promoted as a fuel suitable for marine propulsion by, for example, Mihic et al. (2011) and Lin and Huang (2012). The possibility of switching from LNG to liquefied biogas (LBG) is one advantage put forward in the marketing of LNG39.
Biofuels are usually categorised as first or second generation. First-generation biofuels are primarily produced from food crops such as grains and oil seeds. Examples of first-generation biofuels are rapeseed methyl ester (RME) and ethanol. The sustainability of first-generation biofuels is debated. Issues raised include competition for land with food production, limited production potential and questionable environmental performance (Sims et al., 2008). It is argued that second-generation biofuels can avoid many of the concerns facing first-generation biofuels, but they still face economic and technical challenges (Naik et al., 2010). Second generation biofuels are produced from lingo-cellulosic materials such as forest residues. A typical example of a second-generation biofuel is synthetic biodiesel.40
This study includes both first- and second-generation biofuels of diesel and gas quality. A first-generation fuel of diesel quality is represented here by rapeseed methyl ester. Rapeseed methyl ester is produced through transesterification from rapeseed oil. A second-generation biofuel of diesel quality can instead be produced through gasification followed by
36 The only existing LNG filling station infrastructure is along parts of the Norwegian coast. 37 The capital costs of constructing an LNG ship are approximately 20% higher than for a traditional ship, for example, (Gullberg and Gahnström, 2011). 38 See, for example, Karavalakis et al. (2008). They have investigated the impact of using biodiesel/marine gas oil blends on exhaust emissions from a stationary diesel engine. 39See, for example, the report by SMTF (2010). 40Also called biomass-to-liquid (BTL)
27
Fischer-Tropsch synthesis. The two different production routes for gaseous fuels that are included are anaerobic digestion of biomass (biogas, first-generation biofuel) and gasification of biomass followed by methanation (here called bio-methane, second-generation biofuel).
4.2 ENGINES Most marine engines in operation today are two-stroke or four-stroke diesel engines. There are also vessels with steam turbines and high-speed ferries with gas turbines. Gas engines for marine applications have been developed, and it is possible to buy gas engines and dual-fuel engines on the market.
Diesel engines can be used for the diesel fuels in Figure 4-1, though some modifications may be required, depending on the type of diesel fuel used. The gaseous fuels with methane as the energy carrier can be used in gas or dual-fuel engines. There may be some differences in methane content between different qualities of liquefied natural gas41 and between liquefied natural gas and liquefied biogas, which may also require some modifications.
4.2.1 DIESEL ENGINES Slow-speed diesel engines are two-stroke engines with a typical shaft power of between 1500 and 100,000 kW operating at 50 to 250 revolutions per minute. A two-stroke engine can reach a thermal efficiency of up to 65% and has an exhaust gas temperature of about 325-375°C (Kuiken, 2008). Medium-speed diesel engines are four-stroke engines with typical shaft power between 500 and 30,000 kW operating at 400 to 1000 revolutions per minute. The thermal efficiency of a four-stroke engine is in the range of 25% to 55% and the exhaust gas temperature is 400 to 500°C (Kuiken, 2008). Exhaust emissions are affected by fuel and combustion parameters, i.e. temperature, oxygen concentration and residence time.
Marine diesel engines are currently fuelled by heavy fuel oil or distilled fuels, but synthetic diesel is also a possible fuel. Synthetic diesel has not been tested in two-stroke diesel engines or in large four-stroke marine engines as far as the author knows. There have been emission tests with synthetic diesel in trucks and small marine engines however42. Emissions of particles, NOX and CO were reduced by 33.5%, 5.2% and 19.5% respectively with GTL compared with conventional diesel in a test with an intercooled and turbocharged Euro III diesel engine (Wang et al., 2009). A similar reduction in NOX and particle emissions was reported by Cerne et al. (2008) during a test with EcoPar (a synthetic diesel fuel produced from natural gas) in small marine engines. The particle and NOX emissions decreased by 24% and 7% respectively. The emission of particles relates both to the properties of the fuel (e.g. sulphur content) and to the combustion characteristics, while emissions of NOX and CO mainly depend on the characteristics of the engine.
Biodiesels, according to the standard EN 14214:2008 (CEN, 2008), can also be used in marine diesel engines and be blended with distillate fuels according to Haraldsson (2010).
41 See, for example, Kavalov et al. (2009). 42 See, for example, Larsson (2007), Wang et al. (2009) and Cerne et al. (2008).
28
Cerne et al. (2008) reported that the NOX emissions were increased by 9% while the particle emissions were reduced by 38% with rapeseed methyl ester (RME) compared with a diesel fuel with less than 50 ppm sulphur43.
4.2.2 GAS AND DUAL-FUEL ENGINES 44 Today, there are about 20 ships with gas engines operating in Norwegian waters (Nielsen and Stenersen, 2010). The LNG-propelled ships in operation in Norway are either equipped with lean-burn gas engines or dual-fuel engines. It is also possible to use boilers combined with steam turbines for propulsion with LNG. This dominates LNG carrier propulsion today. Steam turbines are less efficient than diesel engines, and the propulsion trend for new LNG carriers is toward diesel or dual-fuel engines (Wiggins, 2011, Chang et al., 2008). This section will describe the main types of gas and dual-fuel engines on the market today.
The lean-burn gas engines run only on gas; lean refers to a high air-fuel ratio. The extremely lean air-fuel mixtures lead to lower combustion temperatures and therefore lower NOX formation. The engine operates according to the Otto cycle and combustion is trigged by a spark plug ignition. The gas is injected at low pressure. Rolls-Royce (i.e. its Norwegian subsidiary Bergen Diesel) started the development of lean-burn gas-fuelled engines in the 1980s for land power and cogeneration. It is now also used for the propulsion of some of the LNG-fuelled ships in Norway. Its lean-burn combustion system is based on spark plug ignition in a pre-chamber where pure gas is mixed with the lean mixture in the cylinder, thus forming a rich mixture that is easily ignited. Combustion of the lean mixture in the cylinder is fostered by the ignition discharge from the pre-chamber (Doug, 2010). Wärtsilä has a similar lean-burn spark-ignited engine with a pre-chamber but currently has no intentions of using it for marine applications (Stenhede, 2010).
Dual-fuel engines can run in either gas mode or diesel mode. The engine works according to the lean-burn Otto principle in gas mode, but the lean air mixture is ignited by the injection of a small amount of diesel fuel into the combustion chamber instead of a spark plug. The injected diesel fuel is normally less than 1% of the total fuel based on energy (Haraldsson, 2011). In diesel mode, the engine works according to the normal diesel cycle with diesel fuel injected at high pressure just before top dead centre. Gas admission is activated but pilot diesel fuel is still injected (Doug, 2010).
MAN has developed a new series of two-stroke dual-fuel engines (ME-GI Dual Fuel MAN B&W Engines). It was developed specially for LNG carriers but can also be used for other segments such as liquefied petroleum gas (LPG), ro-ro, and container vessels. The working principle is similar to MAN’s traditional two-stroke engines but with the difference that the combustion process is based on higher air surplus and a pressurised gas injection system, injecting pressurised gas at a maximum pressure of about 250 bar (Doug, 2010). MAN expects it to fulfil the Tier III NOX requirements in combination with an exhaust gas recirculation system (Clausen, 2010).
43 A review of emission tests with biodiesel and vegetable oil in marine engines is presented in Paper II. 44 The emission factors for gas and dual-fuel engines are presented in Bengtsson et al. (2011) and Paper I.
29
The ‘methane slip’, unburned methane emitted from gas and dual-fuel engines, is important to consider, since it has a great impact on the global warming potential. This is caused by the 25 times higher global warming potential of CH4 than of CO2 over a 100-year perspective (IPCC, 2007). The methane slip has three main causes: (1) gas in intake port together with scavenging45, (2) incomplete combustion and (3) crevices in the combustion chamber (Järvi, 2010). The methane emissions from measurements of installed marine and stationary engines as well as from the engine manufacturers are presented in Table 4-1. The emissions of methane can be very high at low engine loads, as demonstrated in Table 4-1. Engine manufacturers are working to reduce the methane slip; the methane slip is not desirable from an engine efficiency or environmental point of view. The methane slip reported from Wärtsilä’s engine is much lower than from the engines installed on ships operating in Norway. The reasons for the low methane slips from Wärtsilä’s gas engines are different engine conditions and engine developments to reduce it. According to Järvi (2010), primary methods have the potential to reduce the methane slip by more than 30%, and with secondary methods, i.e. different kinds of after-treatment methods, a reduction of more than 90% is possible.
Table 4-1 Methane emissions from marine and stationary gas engines
Methane emissions from marine engines Reference Methane emissions from engines installed on ships operating in Norwegian waters: Engine load 25% 50% 75% 100% Lean-burn engines [g CH4/MJ LNG]
2.8-2.3 0.9-1 0.8-0.9 0.7-0.9 Nielsen and Stenersen (2010)
Dual-fuel engine46 [g CH4/MJ LNG]
3.2 2.2 1.5 1.4 Nielsen and Stenersen (2010)
Methane emissions from Wärtsilä’s gas engines (100% load, nominal speed): Lean-burn gas engine [g CH4/MJ LNG] 0.3 i Hattar (2010) Dual-fuel engine (gas mode) 0.5 i Hattar (2010)
Methane emissions from MAN’s gas engines: Engine load 50% 75% 100% ME-GI dual-fuel MAN B&W engine47 [g/MJ]
0.11i
0.08i
0.06i
Bäckström (2010)
Methane emissions from stationary and reciprocating gas engines from US EPA: Four-stroke lean-burn gas engines [g CH4/MJ LNG] 0.5 U.S. EPA (2000) Dual-fuel engines [g CH4/MJ LNG] 0.3 U.S. EPA (1996) Two-stroke lean-burn gas engines [g CH4/MJ LNG] 0.6 U.S. EPA (2000)
i Emissions of hydrocarbons (HC)
4.3 EXHAUST ABATEMENT TECHNOLOGIES Possible measures to reduce sulphur dioxide emissions are scrubbing and fuel switching to low sulphur fuels, whereas a number of different options to reduce NOX emissions from shipping are available48 (Table 4-2). Selective catalytic reduction (SCR) is the technology with the highest reduction potential. Humid air motor abatement technology has the second
45Removal of spent gases from an internal combustion engine cylinder and replacement by a fresh charge or air 46 The measurements are from one offshore supply vessel. 47 Two-stroke engine, fulfils NOX Tier II requirements 48 For a more detailed overview of different NOX abatement technologies, see Magnusson (2011).
30
highest reduction potential in the table, but it is not expected to be able to reach the NOX Tier III reduction demands. Exhaust gas recirculation has varying potential depending on the amount of gas that is recirculated. MAN is planning to use an exhaust gas recirculation system together with its ME-GI engine in order to comply with Tier III (Clausen, 2010). It expects to reduce the emissions of nitrogen oxides much more than suggested in Table 2-5 (but with gas as the fuel). The abatement technologies also vary in availability, i.e. they cannot be used in all operating conditions. This affects the actual reduction potential. Only scrubbing and selective catalytic reduction have been included in this thesis. They are described briefly below.
Table 4-2 Measures to reduce emissions of NOX and their emission-reduction efficiency (adapted from Winnes (2007))
NOX abatement technique
Weighted reduction potential
Availability (Nielsen and Stenersen,
2010)
Actual reduction potential
Reference
Basic internal engine modifications
20% 100% 20% Entec (2005)
Advanced internal engine modifications
~30-37% 100% ~30-37% Entec (2005), Goldsworthy (2002), Prior et al. (2005), Sletnes et al. (2005) and Nielsen and Stenersen (2010)
Direct water injection
35-55% 95% 33-52% Entec (2005), Prior et al. (2005) and Nielsen and Stenersen (2010)
Humid air motor 55-70% 95% 52-67% Entec (2005), and Nielsen and Stenersen (2010)
Water-Oil Emulsion
20-25% - - Prior et al. (2005)
Exhaust gas recirculation
22-69% - - Goldsworthy (2002)
Selective catalytic reduction (SCR)
87-90% 95% 83-86% Entec (2005), and Nielsen and Stenersen (2010)
4.3.1 SCRUBBING Gas scrubbing is a technique in which sulphur oxides react with water and form sulphates. The scrubber will also remove particles and NOX to some extent. There are two types of units for on-board flue gas scrubbing: open (seawater) scrubbers and closed (freshwater) scrubbers. It is also possible to use a combination of these, e.g. closed in harbours and sensitive areas like the Baltic Sea and open in open ocean water (Bosch et al., 2009). In an open system, seawater with natural alkalinity is used to capture the sulphur oxides. The amount of sulphur oxides captured depends on the alkalinity of the water. In the Baltic Sea where the alkalinity is low compared with the open sea, much more sea water is needed to capture the same amount of sulphur oxides. In a closed system, the water is instead re-circulated with a continuous addition of alkali, normally caustic soda.
31
4.3.2 SCR The experience of SCRs is much more extensive for heavy-duty vehicles than for marine transportation (Magnusson, 2011). However, SCR has been commercially installed on more than 300 vessels around the world and it is the most common method to reduce NOX emissions from ships (Lövblad and Fridell, 2006). In marine applications, a water solution with urea is injected into the hot exhaust gas upstream of the catalytic converter. The urea is decomposed into ammonia and reacts with the NOX in the exhaust gas over the solid catalyst, forming nitrogen and water (Magnusson, 2011). The efficiency of the SCR depends on the amount of injected urea, approximately 15 g of urea per kWh energy from the engine is needed to achieve a 90% reduction (Lövblad and Fridell, 2006).
SCR systems can be installed in any type of engine, but a minimum exhaust gas temperature is needed for efficient operation, this is normally around 300°C but depends on the sulphur content of the fuel (Bosch et al., 2009). Hence, SCRs are less effective at low loads and for two-stroke engines, when the exhaust gas temperature is lower. There is also a period during start up and before the catalyst has reached operational temperature at which the SCR cannot be used at all (Fridell and Steen, 2007).
A slip of ammonia may occur when the reaction between NOX and urea is incomplete, causing a release of ammonia to the air. Ammonia slip can be caused by, for example, an exhaust gas temperature that is too low or urea dosage that has not been tuned properly (Fridell and Steen, 2007). An oxidation catalyst after the SCR can be used to reduce the ammonia slip (Bosch et al., 2009).
33
5 TWO STUDIES OF MARINE FUEL LIFE CYCLE PERFORMANCE This chapter presents the results from Paper I and Paper II. The methodological choices are outlined and the main results and conclusions are presented. The last parts concern how to deal with the allocation problem related to heavy fuel oil and marine gas oil production.
5.1 ASSESSMENT OF FOSSIL MARINE FUELS The study resulting in Paper I was initialised to investigate the environmental performance of liquefied natural gas as a marine fuel. Liquefied natural gas was a hot topic in industrial seminars and conferences during 2009 in Sweden. LNG was proposed as the salvation for shipping in the SECA and put forward as an environmentally friendly marine fuel without referring to extensive environmental assessments. This, in combination with limited knowledge of the life cycle performance of marine fuels, was the starting point for Paper I.
The environmental performance of seven possible technology options complying with the SECA regulation in 2015 was compared with heavy fuel oil, which is the most used fuel today. Four of the options investigated would also comply with the Tier III NOX requirement for new buildings from 2016. This study only included fossil fuels. An overview of methodological choices in Paper I is presented in Table 5-1.
Table 5-1 Overview of the research question and methodological choices in Paper I
Modelling choices Paper I Research question What would be the life cycle environmental impact of different marine fuels and
abatement technologies fulfilling the SECA 2015 sulphur requirement, especially when changing from heavy fuel oil to heavy fuel oil with scrubber, marine gas oil with and without selective catalytic reduction, liquefied natural gas, and synthetic diesel with and without selective catalytic reduction?
Functional unit (f.u.)
One tonne cargo transported one km with a ro-ro vessel
Type of LCA Consequential Time horizon 2010-2020 System boundary The study includes all activities from raw material extraction to the release of
waste to the environment, e.g. from cradle to propeller. Production of lubrication oil is not included in the system nor is waste treatment of oil sludge and used lubrication oil. Manufacturing of capital goods is not included in this study, e.g. the manufacturing of the vessel, the catalytic converter and the scrubber
Geographical boundary
The SECAs in northern Europe (the English Channel, the North Sea and the Baltic Sea)
Allocation Allocation of products from crude oil refining and natural gas production is made based on the energy content (lower heating value) of the products
Impact categories Primary energy use, global warming potential (GWP100) (IPCC, 2007), acidification potential (Hauschild and Wenzel, 1998) and eutrophication potential (Heijungs et al., 1992)
Fuel chains investigated (abbreviations)
Heavy fuel oil (HFO) Marine gas oil (MGO) Liquefied natural gas (LNG) Synthetic diesel produced from natural gas (GTL)
One tonne of cargo transported one km with a ro-ro vessel was selected as the functional unit in order to compare different types of fuels with varying demands for storage on board. The life cycle environmental performance for the selected option was evaluated in relation to primary energy use, global warming potential, acidification potential and eutrophication
34
potential. The result for primary energy use and global warming potential is illustrated in Figure 5-1. Heavy fuel oil was the fuel associated with least use of primary energy, and liquefied natural gas had the lowest global warming potential. Synthetic diesel consumed most energy and was linked to the highest emissions of greenhouse gases. The acidification and eutrophication potential was dominated by the emissions for NOX and SO2 during the use phase, e.g. cargo transportation. The environmental impact related to the categories was therefore closely connected to the emission regulation, with the best result for the fuels fulfilling the most stringent requirements, i.e. liquefied natural gas from the North Sea, liquefied natural gas from Qatar, marine gas oil with SCR and synthetic diesel with SCR. Synthetic diesel was ruled out for using too much energy.
Figure 5-1 Energy use (MJ per transported tonne and km) compared with the global warming potential (g CO2 equivalents per transported tonne and km) for HFO, MGO and LNG from the North Sea, Qatar and GTL
It was concluded in Paper I that none of the fossil fuels investigated decreased the greenhouse gas emissions significantly from a life cycle perspective. Thus, it was suggested that the shipping industry would need to implement alternative fuels and/or increased energy efficiency measures to reduce its global warming potential. Nonetheless, Paper I illustrated that the use of liquefied natural gas could lead to a small decrease in GWP; the amount depending mainly on the magnitude of the methane slip from the gas engine. On the other hand, increased leakage of CH4 of approximately 2% throughout the life cycle will cancel out the decreased emissions of CO2 and thus give the same GWP as for heavy fuel oil and marine gas oil. Furthermore, liquefied natural gas and the other fuel alternatives that comply with the SECA 2015 and the Tier III requirement showed significantly reduced emissions of NOX and SO2 from a life cycle perspective, resulting in decreased acidification
35
potential by 82-90% and decreased eutrophication potential by 78-90% compared with heavy fuel oil.
5.2 TWO POSSIBLE ROUTES TOWARDS THE USE OF RENEWABLE FUELS Based on the partly expected conclusion from Paper I that all fossil fuels were connected to a life cycle global warming potential of the same order of magnitude, it was interesting to screen what the possible role could be for biofuels in the shipping industry. Paper I concluded that the global warming potential was of the same order of magnitude for fossil fuels and that all options fulfilling both the future SECA and NECA regulation showed analogous environmental performance. The fossil fuels that were left as possible to fulfil the most stringent environmental regulations adopted were therefore marine gas oil and liquefied natural gas. These fuels are completely different energy carriers: a diesel and a gaseous fuel. It was therefore interesting to investigate whether one of these fuels would be preferable in a transition towards the use of biofuels in the shipping industry. Two different routes for using biofuels are assessed in Paper II. Starting from marine gas oil on the diesel route, it would be blended with biodiesel in the first step and later fully replaced with a synthetic biodiesel. The gas route starts from LNG, which would be blended with liquefied biogas and later fully replaced by synthetically produced liquefied bio-methane49. An overview of the methodological choices made in Paper II is presented in Table 5-2.
Table 5-2 Overview of the research question and methodological choices in Paper II
Modelling choices Paper II Research question What are the differences from a life cycle perspective between diesel and
gaseous fuels for marine transportation and what will be the effect of a transition towards renewable fuels?
Functional unit One year of ro-pax service to and from the Swedish mainland and Gotland Type of LCA Consequential Time horizon 2010-2025 (different fuel options are evaluated at different time horizons) System boundary The whole fuel life cycle is included from raw material extraction to
combustion in marine engines. Production of capital goods is not included (e.g. ships, terminals, abatement technology, etc.)
Geographical boundary
The use phase is set to Sweden and fuel production is mainly situated in Europe
Allocation Different types of allocation methods were analysed where it was possible Impact categories Agricultural land use, primary energy use, global warming potential (GWP100)
(IPCC, 2007), acidification potential (Huijbregts et al., 2000a), eutrophication potential (Huijbregts et al., 2000a) and particle emissions (PM10) as an indication of the impact on Human Health
Fuel chains investigated (abbreviations)
Heavy fuel oil (HFO) Marine gas oil (MGO) Rapeseed methyl ester (RME) Synthetic biodiesel (BTL) Liquefied natural gas (LNG) Liquefied biogas (LBG) Liquefied bio-methane (LB-CH4)
49 Here, the difference between biogas and what is known as bio-methane is the production route; see Figure 4-1. Biogas is produced from anaerobic digestion, while bio-methane is produced by gasification of forest residues followed by methanation.
36
The ferry traffic to Gotland was selected as the study objective, as it has an opportunity to be an early mover with environmentally sustainable shipping solutions. Today, the passenger ferries use heavy fuel oil (HFO) with 0.5% sulphur in the main engines and ultra-low sulphur HFO (<0.05% sulphur) in the auxiliary engines. All engines are equipped with selective catalytic reduction units that already fulfil the MARPOL NOX Tier III requirements, but the sulphur content of the fuel needs to be further reduced in 2015. The ferry traffic is procured by a Swedish authority. An investigation regarding future ferry traffic has been conducted that stresses long-term economic, social and environmental sustainability as conditions for future ferry traffic (Rikstrafiken, 2010).
The result of the life cycle assessment of the seven investigated fuels is presented in Figure 5-2, which shows large differences between the fuels. The fossil fuels show lower energy use than the bio-based fuels while the opposite is true for the global warming potential. The acidification potential, eutrophication potential and emissions of particles were the overall lowest for the gaseous fuels.
Figure 5-2 Results for the impact categories agricultural land use, primary energy use, global warming potential, acidification potential, eutrophication potential and particle emissions for heavy fuel oil (HFO), marine gas oil (MGO), rapeseed methyl ester (RME), liquefied natural gas (LNG), liquefied biogas (LBG) and liquefied bio-methane (LB-CH4) split as well-to-tank (black) and tank-to-propeller (white)
Figure 5-3 illustrates the life cycle environmental performance during the transition towards biofuels for the two routes. Heavy fuel oil is used in 2010, and in 2015 it is interchanged with marine gas oil and liquefied natural gas respectively for the two routes. A small proportion of biofuel is blended into the fossil fuel in 2020. Finally, in 2025 a full transition to biofuels is completed. The final biofuel used is synthetic biodiesel for the diesel route and liquefied bio-methane for the gas route. The gas route showed the lowest
0 2 4 6 8x 10⁴
HFO
MGO
RME
BTL
LNG
LBG
LB-CH4
Agricultural land use
Life cycle use of agricultural land (ha/f.u.)
Well-to-tankTank-to-propeller
0 2000 4000 6000 8000
HFO
MGO
RME
BTL
LNG
LBG
LB-CH4
Primary energy
Life cycle use of primary energy (TJ/f.u.)0 0.5 1 1.5 2 2.5
x 105
HFO
MGO
RME
BTL
LNG
LBG
LB-CH4
Global warming potential
Life cycle carbon dioxide emissions (tonne CO2-eq./f.u.)
0 200 400 600 800
HFO
MGO
RME
BTL
LNG
LBG
LB-CH4
Acidification potential
Life cycle acidifying emissions (tonne SO2-eq./f.u.)
0 500 1000 1500
HFO
MGO
RME
BTL
LNG
LBG
LB-CH4
Eutrophication potential
Life cycle eutrophicating emissions (tonne NOX-eq./f.u.)
0 10 20 30 40 50
HFO
MGO
RME
BTL
LNG
LBG
LB-CH4
Emissions of particles
Life cycle emissions of particles (tonne/f.u.)
37
environmental impact for all impact categories and all years, except for the primary energy use in 2020 and the global warming potential in 2025. These are highlighted in Figure 5-3.
Figure 5-3 Change over time in the two scenarios of the impact categories agricultural land use, primary energy use, global warming potential, acidification potential, eutrophication potential and emissions of particles. The diesel route is represented by white bars and the gas route by black bars. The cases in which the diesel route showed better environmental performance than the gas route are marked.
Two main conclusions were drawn from the study. First, that the gas route indicated better overall environmental performance than the diesel route. Secondly, that biofuels are one possible measure to decrease the global warming impact from shipping but that it can be at the expense of greater environmental impact for other impact categories. This can be exemplified by the eutrophication potential and the primary energy use increased with biofuels. One difference between the two routes that was not investigated but is important to highlight is the fuel distribution infrastructure. There is currently a lack of infrastructure for gaseous fuels and the construction of new infrastructure is connected to economic and environmental costs. The result raises the question of whether the slightly better environmental performance of the gas route is enough to motivate the required infrastructure changes.
5.3 ALLOCATION OF HEAVY FUEL OIL AND MARINE GAS OIL PRODUCTION The only allocation used for heavy fuel oil and marine gas oil in Paper I and Paper II is based on the energy content of the fuel. The data for heavy fuel oil and marine gas oil production
2010 2015 2020 20250
0.5
1
1.5
2
2.5x 10⁴ Agricultural land use
Life
cyc
le u
se o
fag
ricul
tura
l lan
d(h
a/f.u
.)
2010 2015 2020 20250
2000
4000
6000
8000Primary energy
Life
cyc
le u
se o
fpr
imar
y en
ergy
(TJ/
f.u.)
2010 2015 2020 20250
0.5
1
1.5
2
2.5x 10⁵ Global warming potential
Life
cyc
leca
rbon
dio
xide
em
issi
ons
(tonn
e C
O2-e
q./f.
u.)
2010 2015 2020 20250
200
400
600
800Acidification potential
Life
cyc
leac
idify
ing
emis
sion
s(to
nne
SO
2-eq.
/f.u.
)
2010 2015 2020 20250
200
400
600
800
1000Eutrophication potential
Life
cyc
leeu
troph
icat
ing
emis
sion
s(to
nne
NO
X-e
q./f.
u.)
2010 2015 2020 20250
10
20
30
40
50Particle emissions
Life
cyc
leem
issi
ons
of p
artic
les
(tonn
e/f.u
.)
Gas routeDiesel route
38
used here are from the ELCD core database.50 The preferred allocation method in a consequential study is system expansion, including more processes inside the system boundaries. In the case of refinery production, it is a very complex solution that will lead to new allocation problems. This was not possible, however, as data with this detail were not found. It would also have been interesting to test different allocation methods. No market-based study has been found for European conditions. Three different studies of interest regarding the allocation of heavy fuel oil and marine gas oil, but not directly applicable to Paper I and Paper II, are described below: one study investigating different allocation methods, one study assessing factors that drive CO2 intensity in refineries and finally one study that has assessed the impact on European refineries due to the sulphur regulations of marine fuels. These studies only included information on energy use and carbon dioxide emissions and were therefore not selected in the assessment as it was considered important to include more elemental flows in the analysis.
A detailed allocation of energy use in relation to petroleum products is performed in a study by Wang et al. (2004) based on a typical American refinery. Three different allocation methods at the refining process level51 are compared with each other and with an allocation at the refinery level52. Heavy fuel oil is associated with 0.8-2.9% and gas oil with 4.6-5.1% of the total energy use at the refinery in the three process-level allocation methods (Wang et al., 2004): most if the mass is used as the base for allocation and least if the economic value is used. The difference in the allocated energy use between heavy fuel oil and gas oil is greater in the study by Wang et al. (2004) than in the ELCD core database. Approximately double the amount is allocated to gas oil compared with heavy fuel oil in the study by Wang et al. (2004) while only about 14% more energy is allocated to light fuel oil in the ELCD core database. The allocation method used in the ELCD core database (according to the description) is referred to by Wang as an energy content-based approach at the process level. The study by Wang et al. (2004) implies that if a market-value-based process level allocation method had been used for heavy fuel oil and marine gas oil the energy use and emissions per tonne of product would decrease slightly compared with the data from the ELCD core database. The difference between different allocation methods would probably not have any significant impact on the final results as the impacts from the refinery only comprise a small part of the overall environmental impacts.
A more problematic issue related to emissions from the refinery process is how they will change in 2020 when the maximum sulphur content allowed in marine fuels worldwide will be reduced to 0.5%. This will imply changes to the refinery process, and the data used in this report are not applicable to that. Bredeson et al. (2010) have assessed factors driving refinery CO2 intensity and found that the most important factor is the hydrogen content in the products relative to the hydrogen content in the crude. Refinery energy use increases with heavier crude oil and by increasing the conversion of residual products into
50 See ELCD-core-database-version-II (2010a) and ELCD-core-database-version-II (2010b). 51 The allocation is made after each process in the refinery. 52 The allocation is made between the products after they have passed through the whole refinery, i.e. the refinery is viewed as a black box.
39
transportation fuels. The conversion of residual products into more distillate fuels is one probable outcome of the requirement of reduced sulphur content in marine fuels.
The changes in European refineries due to the upcoming regulations are investigated in a study by Avis and Birch (2009). They estimate that the total CO2 emissions from European refineries will increase by approximately 3% in 2020 compared with a baseline scenario without any regulation of the sulphur content in marine fuels. The bunker fuels with ultra-low sulphur content53 will then be associated with an increase of approximately 91 kg CO2
per tonne of bunker fuel for the production process (compared with 296 kg of CO2 emissions per tonne of heavy fuel oil used in this study from the cradle to refinery gate) if all the increase in CO2 emissions is allocated to the ultra-low sulphur marine bunker fuel. Adding this increase of CO2 emissions to the life cycle greenhouse gas emissions for MGO in Paper I would result in approximately 43 g CO2 equivalents per tonne km instead of 42.54 A smaller change in refinery production will probably also occur in the SECA already in 2015 when the limit of 0.1% sulphur is introduced. The energy and environmental flows connected to these streams depend on how the flows are allocated in the refinery.
53 A 0.5% sulphur content globally and 0.1% sulphur content in SECAs. 54 According to Paper I 0.58 MJ MGO/tonne km is required during the life cycle. Adding 91 kg CO2 emissions per tonne MGO (approximately 2.25 g CO2/MJ) results in an addition of 1.3 g CO2 per tonne km.
41
6 LIFE CYCLE ASSESSMENT AS A TOOL FOR SUSTAINABILITY ASSESSMENT This chapter includes a discussion on LCA as a tool for environmental assessment of marine fuels. Advantages and downsides are presented as well as some recommendations for further use.
6.1 FOR WHICH QUESTIONS CAN LCA PROVIDE GUIDANCE Here, LCA has been applied to the evaluation of the environmental performance of marine fuels in two different studies, described previously in Section 5.1 and Section 5.2. The questions elaborated on in these studies were related to the life cycle performance of marine fuels in the case of a fuel change. These questions were answered, but they also brought forth new questions. With regard to Paper I, the question was raised of whether the choice of allocation methods for HFO and MGO production could change the result.
Another question highlighted in Paper II was whether considering the environmental impact of infrastructure could affect the result. The diesel fuels and the gaseous fuels have different requirements regarding infrastructure and it is therefore also possible that the impact-related construction, maintenance and demolition of infrastructure could impact the result. This is especially the case since the differences between the gas and the diesel route were not considered clear-cut. These questions can be elaborated on further using life cycle assessments, but methodological considerations and availability of data are obstacles.
Other questions were also raised where, perhaps, life cycle assessment is not the best tool for guidance. For example, in the case of a vessel accident, how would the choice of fuel affect the outcome? Would one fuel be preferable to another in the case of a fuel spill? And what are the risks of explosions? These are very relevant questions to ask in the case of a fuel change in marine transportation, and suitable tools for decision support regarding these questions would probably be Risk Assessment or Environmental Risk Assessment.
Another question is whether information on environmental life cycle performance gives enough guidance for decisions. There are a number of other factors that are important to consider such as infrastructure requirements, maintenance, fuel availability, fuel price and so forth. These considerations are not included in a life cycle assessment. One possible tool to include more aspects in the assessment is Multi-Criteria Decision Analysis. This method is designed for multi-criteria problems for which ‘there is much information of a complex and conflicting nature, often reflecting different viewpoints and often changing with time’ (Belton and Stewart, 2003). The question regarding which fuel to choose for marine transportation is definitely a problem of this type.
Competition with other sectors for the same fuels is also an interesting topic. The question is which fuels should be used in shipping and which should be used in other industries? There have been, for example, a number of studies evaluating in which sector biofuels should be used in order to reduce CO2 emissions most cost-effectively. For an overview of these, see Grahn (2009). None of these has focused on the marine transportation sector or modelled it in great detail however. One conclusion of these studies is that biomass is used more cost-effectively for heat and cogeneration of heat and electricity than as a transportation fuel (Grahn et al., 2009, Grahn et al., 2007). Nevertheless, if CO2-neutral hydrogen/electricity
42
does not become available at a reasonable cost and performance, biomass will be needed to bring down the emissions of CO2 in the transportation sector (Grahn et al., 2009, Grahn et al., 2007). It would be interesting to develop these models further with more detailed information from the shipping industry. This could offer information regarding which fuels should be used in shipping in the future.
LCAs can address questions related to the life cycle environmental performance of marine fuels but are less appropriate for dealing with other aspects of the fuel choice. LCAs should therefore be complemented with other tools for comprehensive assessments. It is also possible that results from an LCA study will not have any effect on the final decision of which fuel to choose but will still be used as arguments for the decision.
6.2 PROBLEMS WITH THE USE OF LCA During the studies presented in Paper I and Paper II, problems regarding methodological choices and the availability of data were identified. The problems are highlighted in Table 6-1. Many of these problems are interconnected. Data availability, for example, is one such problem that is connected to all the others.
First of all, both studies raised methodological problems of how to deal with old and new technologies in order to make the data representative for a future technological system. Old technologies have been assumed to be the same as they are now in 2015 and 2020 in Paper I, while the new technologies were modelled according to the best available technologies. Paper II considered a longer time perspective, from 2010 to 2025. Technologies that are not commercial today were assumed to be available in 2025. Data for these technologies are more uncertain than data for existing technologies used on a large scale55.
Both Paper I and Paper II aimed for a holistic assessment of the environmental performance of marine fuels. It was therefore desirable to assess all impact categories connected to the use of fuel.56 The most critical environmental impact of shipping is not greenhouse gas emissions or energy use. This makes it important to consider more impact categories than for the well-to-wheel studies on road fuels, which normally only consider energy use and global warming potential. Finding data with as complete information as possible concerning different elemental flows for different possible fuels was therefore an important part of the work in Paper I and Paper II.
The impact categories considered important to assess were climate change, human toxicity, ecotoxicity, acidification potential, eutrophication potential, photochemical ozone formation, land use and primary energy use. Some of these categories were omitted due to difficulties with their use, such as unreliable results. The other impact categories were omitted due to a lack of data. In some cases it was a combination of both.
55 Problems related to the assessment of emerging technologies are assessed in, for example, Hillman (2008), and Sandén and Karlström (2007). 56 These were identified in Chapter 3.
43
Table 6-1 Problems with the use of LCA as a tool for environmental assessment of marine fuels, identified during the work in Paper I and Paper II
Problems with use of LCA
Identified in
Specific to marine
fuels
Ways to overcome the problems in this work
Modelling old and emerging technologies
Paper I and Paper
II No
Old technologies were considered to be the same in the future. New and emerging technologies were modelled according to the best available technologies or according to data from pilot plants.
Availability of data Paper I
and Paper II
No
The ‘best’ data that were found were used even if they were not felt to be satisfactory in all cases. Data with more extensive information on elemental flows were preferred to newer data.
How to deal with multi-output problems
Paper I and Paper
II No Different allocation methods were used in Paper II
to show how the result was affected.
Allocation related to use of HFO and MGO
Paper I and Paper
II Yes
Allocation methods for these fuel qualities have not been scrutinised previously. Different allocation methods could not be assessed due to a lack of data.
Difficulty using some impact categories
Paper I No Problems with the use of impact categories for human toxicity and photochemical zone formation resulted in the exclusion of these results.
Discrepancy between different data sources
Paper II No Different data sets for biodiesel and synthetic biodiesel production were included in the evaluation of robustness.
Methodological issues when dealing with biofuels
Paper II No Discrepancy between different assessments of the same fuel, availability of data, allocation into by-products.
Evaluation of the robustness of the result
Paper I and Paper
II No
Different parameters were varied in the study presented in Paper I.Different scenarios and allocation methods were varied in Paper II.
Type of LCA study Paper I
and Paper II
No A mix of approaches was used due to, for example, the availability of data.
Construct the functional unit
Paper I and Paper
II
Yes, to some extent
As LNG is more space-consuming than, for example, HFO, this would probably result in less cargo being able to be transported in a vessel of the same size. This needed to be considered in the assessment and could possibly vary between different vessels.
Human toxicity was not assessed57, instead the life cycle emissions of particles with 10 µm or less (PM10) were assessed in this study. However, it is the fine particles with a diameter of 2.5 µm or less (PM2.5) that are considered most harmful (Pope et al., 2002). PM10 have been chosen since there are not much data on emissions of PM2.5. In a continuation, it is interesting to incorporate this impact category again. Ecotoxicity was not evaluated at all. Photochemical ozone formation based on the Photochemical Ozone Creation Potential approach was included in Bengtsson et al. (2011), but the result was considered uncertain
57 It was considered in the beginning of the study that resulted in Paper I but was excluded as the results could not be interpreted. However, at this stage the inventory result also included emissions from metals from the combustion of marine fuels, which contributed to the difficulty of using the impact category human toxicity based on Huijbregts (1999) and Huijbregts et al. (2000b).
44
as emissions of non-methane hydrocarbons were not included, only nitrogen oxides and methane. It could be interesting to see what the result would be in a model treating all non-methane VOCs together, however, as was done by Hauschild, Potting et al. (2006). Land use was not considered in Paper I, which only included fossil fuels, but in Paper II, which also included the use of renewable fuels. Land use was only assessed from the occupancy perspective, i.e. m2 of agricultural land use per year. The only resources considered for marine fuels were raw materials for fuel production, e.g. natural gas, crude oil and biomass. The total primary energy use was assessed in Paper I and Paper II as the resources connected to fuel use above are all fuels. In a continuation and refining of the work on the environmental performance of marine fuels, it is recommended that all impact categories that are considered important to marine fuels are included in the assessment.
The methodological choices made in an LCA study should be in accordance with the goal of the study. Here, the methodological choices were found to be affected by the availability of data and partly by the time requirements. The data and time restrictions are closely connected, as more time is required if data are difficult to find. Paper I and Paper II could be classified either as prospective attributional LCAs with some elements from a consequential study (similar parts of the life cycle have been left out) or as prospective consequential LCAs with some elements from an attributional approach (allocation based on energy content instead of system expansion).
In Paper II, the electricity use in the baseline scenario was assumed to be the average Swedish electricity consumption, which would have been a typical choice in an attributional approach. The impact of the electricity choice was evaluated in a scenario analysis. This analysis considered an average Swedish electricity mix, electricity produced from natural gas and electricity produced from biogas. It showed that the choice of electricity production did not affect the result significantly. This was due to the low overall use of electricity in the systems studied. Paper II used an allocation based on the energy content in the base scenario, but different allocation methods for biofuels were investigated as the necessary information was available. It was shown that different allocation methods for biofuel production could change the results. Allocation methods were therefore considered more important than choice of electricity in this study.
The problems with the assessment of biofuel were related to the discrepancy between different assessments of the same fuel, the availability of data, the allocation to by-products and great uncertainties, as the production today is mostly on a pilot scale, and much larger facilities would be necessary to use biofuels commercially. These problems correlate with many of those of biofuel assessments that have been identified previously (Cherubini et al., 2009, Malça and Freire, 2011, Plevin, 2010, Hillman, 2008).
45
7 CONCLUSIONS The present study has shown that LCA provides useful decision support regarding which fuels to use in marine transportation. Here, the method was applied to the evaluation of the environmental performance of marine fuels in two different studies.
In the first study, Paper I, the life cycle environmental impact of changing fuel and/or installing abatement techniques in order to comply with upcoming environmental regulations was explored. The alternatives investigated were heavy fuel oil with and without scrubber, marine gas oil with and without selective catalytic reduction, liquefied natural gas and synthetic diesel with and without selective catalytic reduction. This study thus only involved fossil fuels and indicated that the global warming potentials of the investigated fuels were of the same order of magnitude. The best overall environmental performance was, not surprisingly, achieved for fuels fulfilling the most stringent upcoming environmental regulations: liquefied natural gas and marine gas oil with SCR. Synthetic diesel was ruled out because it consumed too much energy.
In the second study, Paper II, two routes, a diesel route and a gas route, towards the use of renewable fuels in the shipping industry were investigated. The study started from the traditional fuel used today. For 2015, two possible paths were assessed: marine gas oil and liquefied natural gas. For 2020, these fuels was blended with a small proportion of a first-generation biofuel of the same type and fully replaced with a second-generation biofuel in 2025. This study indicated that the gas route has better overall environmental performance than the diesel route. The study also illustrated that biofuels are one possible measure to decrease the global warming impact from shipping but that it can be at the expense of greater environmental impact for other impact categories.
During the studies presented in Paper I and Paper II, some difficulties were identified regarding the methodological choices and the availability of data. First of all, the allocation of the impact of the refining of crude oil into marine fuels was problematic as there are many different refineries and the choice of allocation method could change the results significantly, e.g. marine gas oil, heavy fuel oil and blends of these. A further issue was that different qualities from the refineries could be used as marine fuels. Data concerning environmental flows for fractions other than gasoline and diesel were very limited in the literature. It was therefore not possible to investigate the impact of different allocation methods. Instead, data from the ELCD core database were used. These data are from steady state heavy fuel oil and marine gas oil production, with allocation based on the lower heating value of the streams after each sub-process in the refinery. Other problems identified were related to dealing with old and new technologies, which impact categories to assess and the assessment of biofuels. It was also difficult to apply strictly all the methodological choices connected to prospective consequential LCAs.
At a time when marine propulsion needs to change its configurations to adapt to the upcoming regulatory demands, it is important to assess the effects of change from a systems perspective. LCA is a possible tool for assessing the environmental impact and resource use within shipping and the effect of changes in technology or energy sources. The importance of considering environmental life cycle performance has been exemplified with a higher
46
overall environmental impact throughout the life cycle for synthetic diesel from natural gas even though the impact during the use phase was lower than for heavy fuel oil and marine gas oil.
Furthermore, in a longer time perspective it is possible that other driving forces for fuel change will increase in importance, such as attention to greenhouse gas emissions and future oil supply. Interest in fuels other than fossil fuels may increase, as fossil fuels cannot reduce greenhouse gas emissions significantly. Energy efficiency is important and can probably do much to decrease the environmental impact of shipping. It will take many years before vessels become efficient enough not to need an external fuel supply however. Until then, it is possible that biofuels or other renewable fuels may play a role in shipping.
47
8 FURTHER RESEARCH AND REFLECTIONS The shipping industry is in an interesting phase with new fuels and configurations being proposed and discussed. A number of different zero emission concept ships have been proposed, for example, by Wallenius Marine AB (2011) and Germanischer Lloyd (2011). The importance of evaluating the limitations and opportunities of different types of fuels and propulsion systems for the shipping industry is increasing due to growing interest in the new options.
This thesis is a start in the work off assessing the environmental performance of marine fuels. This thesis is, however, limited to one type of assessment, LCA. Even if LCA has proven appropriate for assessing fuel and technology changes in the shipping industry, there are other tools that could provide input for other aspects and from other perspectives that may be even more suitable or perhaps important to consider as complements. A possible continuation of this work would be to consider, for example, Multi-Criteria Decision Analysis, which includes environmental problems but also other aspects. Another possibility is to work together with researchers who have built models to assess in which sector different fuels should be used most cost efficiently in order to reduce CO2 emissions and to refine these models with more detailed information about the shipping sector, i.e. to assess which fuels ‘should’ be used in shipping based on specified criteria.
Another potential avenue for future research is to work more on the difficulties identified with life cycle assessment of new fuels for the shipping industry by refining the methodology and collecting new and more accurate data. Possible areas for improvement are: (1) emission measurements from gas and dual-fuel engines, (2) studies of the effects of different allocation methodologies of crude oil refinement, (3) the inclusion of more impact categories and elemental flows in the assessment, and (4) the inclusion of the impact of capital goods and infrastructure. The last issue is important in order to be able to compare the environmental performance of marine transportation with other transportation modes.
This study has focused on assessing marine fuels that could be used in the relatively near future. It would also be interesting to assess the marine fuels that could be used in 2050 and beyond. Information that one particular fuel will show the lowest impact in five years is probably not enough information on which to base a decision, especially not since the lifetime of a vessel is more than 20 years. If a shipping company were to change fuel, it would need to know that the fuel was economically and environmentally viable from a longer time perspective. This would raise new questions concerning, for example, how to evaluate marine fuel performance in 2050. What will the future technological system look like and what will be relevant to investigate in the future? Could it be something that is totally disregarded today, as in the case of Henry Ford’s automobile in the beginning of the 20th century? Could vessels be so efficient that it is not the fuels that cause the biggest environmental problem but the manufacturing of the vessel? Will there be any shipping at all? What radical new ideas will there be?
49
9 REFERENCES
Almeida, E., Diamantino, T. C. & de Sousa, O. 2007. Marine paints: The particular case of antifouling paints. Progress in Organic Coatings, 59, 2-20.
Antizar-Ladislao, B. 2008. Environmental levels, toxicity and human exposure to tributyltin (TBT)-contaminated marine environment. A review. Environment International, 34, 292-308.
Arteconi, A., Brandoni, C., Evangelista, D. & Polonara, F. 2010. Life-cycle greenhouse gas analysis of LNG as a heavy vehicle fuel in Europe. Applied Energy, 87, 2005-2013.
Avis, M. J. & Birch, C. H. 2009. Impacts on the EU refining industry & markets of IMO specification changes & other measures to reduce the sulphur content of certain fuels. Purvin & Gerts Inc.
Baird, C. & Cann, M. 2008. Environmental chemistry, New York, W.H. Freeman & Co.
Baumann, H. & Tillman, A.-M. 2004. The hitchhiker's guide to LCA : an orientation in life cycle assessment methodology and application, Lund, Studentlitteratur.
Bax, N., Williamson, A., Aguero, M., Gonzalez, E. & Geeves, W. 2003. Marine invasive alien species: a threat to global biodiversity. Marine Policy, 27, 313-323.
Belton, V. & Stewart, T. J. 2003. Multiple criteria decision analysis - an integrated approach, Boston, Kluwer Academic.
Bengtsson, S., Andersson, K. & Fridell, E. 2011. Life cycle assessment of marine fuels - A comparative study of four fossil fuels for marine propulsion. Gothenburg: Chalmers University of Technology.
Bosch, P., Coenen, P., Fridell, E., Åström, S., Palmer, T. & Holland, M. 2009. Cost Benefit Analysis to support the impact assessment accompanying the revision of Directive 1999/32/EC on the sulphur content of certain liquid fuels. In: Woodfield, M. (ed.). Didcot.
BP 2011. BP Statistical Review of World Energy 2011.
Bredeson, L., Quiceno-Gonzalez, R., Riera-Palou, X. & Harrison, A. 2010. Factors driving refinery CO2 intensity, with allocation into products. International Journal of Life Cycle Assessment, 1-10.
Brinkman, N., Wang, M., Weber, T. & Darlington, T. 2005. Well-to-Wheels Analysis of Advanced Fuel/Vehicle Systems — A North American Study of Energy Use, Greenhouse Gas Emissions, and Criteria Pollutant Emissions.
Bruckner-Menchelli, N. 2011. US Navy targets 2016 for green fuel use. Sustainable shipping [Online]. Available: http://www.sustainableshipping.com/news/i100853.print [Accessed 23th of February 2011].
Buhaug, Ø., Corbett, J. J., Endresen, Ø., Eyring, V., Faber, J., Hanayama, S., Lee, D. S., Lee, D., Lindstad, H., Markowska, A. Z., Mjelde, A., Nelissen, D., Nilsen, J., Pålsson, C., Winebrake, J. J. & Wu, W., Yoshida, K. 2009. Second IMO GHG Study 2009. London, UK: International Maritime Organization.
50
Bunkerworld. 2011. Bunker prices [Online]. Available: http://www.bunkerworld.com/prices/ [Accessed 30th of October 2011].
Burgherr, P. 2007. In-depth analysis of accidental oil spills from tankers in the context of global spill trends from all sources. Journal of Hazardous Materials, 140, 245-256.
Bäckström, U. 28th of April 2010 2010. E-mail conversation with Ulf Bäckström, Managing Director, MAN Diesel Sverige AB, regarding estimated emissions from 6S60ME-C and S60ME-C-GI. Type to Bengtsson, S.
CEN 2008. EN 14214:2008. Automotive fuels - Fatty acid methyl esters (FAME) for diesel engines - Requirements and test methods. European Committe for Standardization.
Cerne, O., Strandberg, J., Fridell, E., Peterson, K., Allard, A.-S., Rydberg, T., Vaske, B., Jägersten, C., Östman, N. & Eklund, B. 2008. Rena turen - Utevärdering av miljöanpassade bränslen i fritidsbåtar. IVL Svenska Miljöinstitutet
Chambers, L. D., Stokes, K. R., Walsh, F. C. & Wood, R. J. K. 2006. Modern approaches to marine antifouling coatings. Surface and Coatings Technology, 201, 3642-3652.
Chang, D., Rhee, T., Nam, K., Chang, K., Lee, D. & Jeong, S. 2008. A study on availability and safety of new propulsion systems for LNG carriers. Reliability Engineering & System Safety, 93, 1877-1885.
Cherubini, F., Bird, N. D., Cowie, A., Jungmeier, G., Schlamadinger, B. & Woess-Gallasch, S. 2009. Energy- and greenhouse gas-based LCA of biofuel and bioenergy systems: Key issues, ranges and recommendations. Resources, Conservation and Recycling, 53, 434-447.
Clausen, N. B. 2010. Market, Scrubber, Low Sulphur Fuels, LNG/LPG. MAN tekniskt seminarium den 20 april 2010. Gothenburg.
Cooper, D. & Gustafsson, T. 2004. Methodology for calculating emissions from ships: 1 Update of emission factors. Swedish Methodolgy for Environmental data (SMED). Norrköping.
Corbett, J. J. & Fischbeck, P. 1997. Emissions from ships. Journal Name: Science; Journal Volume: 278; Journal Issue: 5339; Other Information: PBD: 31 Oct 1997, Medium: X; Size: pp. 823-824.
Corbett, J. J. & Koehler, H. W. 2003. Updated emissions from ocean shipping. Journal of Geophysical Research-Atmospheres, 108.
Corbett, J. J. & Winebrake, J. J. 2008. Emissions tradeoffs among alternative marine fuels: Total fuel cycle analysis of residual oil, marine gas oil, and marine diesel oil. Journal of the Air and Waste Management Association, 58, 538-542.
Corbett, J. J., Winebrake, J. J., Green, E. H., Kasibhatla, P., Eyring, V. & Lauer, A. 2007. Mortality from ship emissions: A global assessment. Environmental Science and Technology, 41, 8512-8518.
Dewulf, J., Bösch, M. E., Meester, B. D., Vorst, G. V. d., Langenhove, H. V., Hellweg, S. & Huijbregts, M. A. J. 2007. Cumulative Exergy Extraction from the Natural Environment (CEENE): a comprehensive Life Cycle Impact Assessment method for resource accounting. Environmental Science & Technology, 41, 8477-8483.
51
Doug, W. 2010. Dual-Fuel and Gas Engines. Pounder's Marine Diesel Engines and Gas Turbines (Ninth edition). Oxford: Butterworth-Heinemann.
Edwards, R., Larivé, J.-F., Mahieu, V. & Rouveirolles, P. 2007a. Well-to-Wheels analysis of future automotive fuels and powertrains in the European context - Well-to-Tank Report Version 2c. JEC Well-to-wheels study Joint Research Centre of the EU Commission, ECUAR and CONCAWE.
Edwards, R., Larivé, J.-F., Mahieu, V. & Rouveirolles, P. 2007b. Well-to-Wheels analysis of future automotive fuels and powertrains in the European context - Well-to-Wheels Report Version 2c. JEC Well-to-wheels study Joint Research Centre of the EU Commission, ECUAR and CONCAWE.
ELCD-core-database-version-II 2010a. Process data set: Heavy fuel oil; from crude oil; consumption mix, at refinery. 12th of March 2010 ed.: European Commission - Joint Reaserch Centre - LCA Tools, Services and Data.
ELCD-core-database-version-II 2010b. Process data set: Light fuel oil; from crude oil; consumption mix, at refinery; 2000 ppm sulphur. 12th of March 2010 ed.: European Commission - Joint Reaserch Centre - LCA Tools, Services and Data.
Endresen, O., Bakke, J., Sorgard, E., Berglen, T. F. & Holmvang, P. 2005. Improved modelling of ship SO2 emissions - a fuel-based approach. Atmospheric Environment, 39, 3621-3628.
Endresen, O., Sorgard, E., Sundet, J. K., Dalsoren, S. B., Isaksen, I. S. A., Berglen, T. F. & Gravir, G. 2003. Emission from international sea transportation and environmental impact. Journal of Geophysical Research-Atmospheres, 108.
Endresen, Ø., Sørgård, E., Behrens, H. L., Brett, P. O. & Isaksen, I. S. A. 2007. A historical reconstruction of ships' fuel consumption and emissions. J. Geophys. Res., 112, D12301.
EU 2003. Directive 2003/17/EC of the European Parliament and of the Council - of 3 March 2003 - amending Directive 98/70/EC relating to the quality of petrol and diesel fuels. Official Journal of the European Union.
Eyring, V., Isaksen, I. S. A., Berntsen, T., Collins, W. J., Corbett, J. J., Endresen, O., Grainger, R. G., Moldanova, J., Schlager, H. & Stevenson, D. S. 2010. Transport impacts on atmosphere and climate: Shipping. Atmospheric Environment, 44, 4735-4771.
Eyring, V., Köhler, H. W., Van Aardenne, J. & Lauer, A. 2005. Emissions from international shipping: 1. The last 50 years. Journal of Geophysical Research D: Atmospheres, 110, 171-182.
Finnveden, G., Hauschild, M. Z., Ekvall, T., Guinée, J., Heijungs, R., Hellweg, S., Koehler, A., Pennington, D. & Suh, S. 2009. Recent developments in Life Cycle Assessment. Journal of Environmental Management, 91, 1-21.
Fridell, E. & Steen, E. 2007. Ammonia slip measurements on ships with NOx converters - A study of different techniques. Gothenburg: IVL Swedish Environmental Research Institute Ldt.
Gallagher, T. L. 2010. Maersk to Run Biodiesel Test. Journal of Commerce Online [Online]. Available: http://proquest.umi.com/pqdlink?did=1976466351&sid=3&Fmt=3&clientId=19460&RQT=309&VName=PQD [Accessed 24th of March 2011].
52
Germanischer Lloyd. 2011. Design Concept for a Zero-Emission Container Feeder Vessel [Online]. Available: http://www.gl-group.com/en/23603.php [Accessed 8th of November 2011].
Goldsworthy, L. 2002. Design of ship engines for reduced emissions of oxides of nitrogen. Australian Maritime College.
Grahn, M. 2009. Cost effective fuel and technology choices in the transportation sector in a future carbon constained world - Results from the Global Energy Transition (GET) model Thesis for Doctor of philosophy, Chalmers University of Technology.
Grahn, M., Azar, C. & Lindgren, K. 2009. The role of biofuels for transportation in CO2 emission reduction scenarios with global versus regional carbon caps. Biomass and Bioenergy, 33, 360-371.
Grahn, M., Azar, C., Lindgren, K., Berndes, G. & Gielen, D. 2007. Biomass for heat or as transportation fuel? A comparison between two model-based studies. Biomass and Bioenergy, 31, 747-758.
Guinée, J. B. (ed.) 2002. Handbook on life cycle assessment : operational guide to the ISO standards Boston: Kluwer Academic Publishers.
Guinee, J. B., Heijungs, R., Huppes, G., Zamagni, A., Masoni, P., Buonamici, R., Ekvall, T. & Rydberg, T. 2010. Life Cycle Assessment: Past, Present, and Future†. Environmental Science & Technology, 45, 90-96.
Gullberg, M. & Gahnström, J. 2011. Baseline report. North European LNG Infrastructure Project - A feasibility study for an LNG filling station infrastructure and test of recommmendations. Danish Maritime Authority: ÅF Industry AB, SSPA Sweden AB.
Haraldsson, L. 2010. Engine technical adjustment Workshop on alternative marine fuels. Långedrag: EffShip.
Haraldsson, L. 9th of September 2011 2011. E-mail conversation with Lennart Haraldsson at Wärtsilä Sweden AB regarding the amount of pilot fuel used in dual fuel engines. Type to Bengtsson, S.
Harrison, R. M. 2001. Pollution: causes, effects and control, Cambridge, Royal Society of Chemistry.
Hattar, C. 2010. Typical emissions from Wärtsiläs gas fuelled engines. E-mail to Ingemar Nylund, General Manager, Wärtsilä Corporation concerning typical emissions from Wärtsilä’s gas fuelled engines from Hattar C, Wärtsilä Corporation, 9th of March 2010.
Hauschild, M. & Wenzel, H. 1998. Environmental Assessment of products. Vol. 1: Methodology, tools and case studies in product development - Vol. 2: Scientific background.
Hauschild, M. Z., Huijbregts, M., Jolliet, O., Macleod, M., Margni, M., van de Meent, D., Rosenbaum, R. K. & McKone, T. E. 2008. Building a Model Based on Scientific Consensus for Life Cycle Impact Assessment of Chemicals: The Search for Harmony and Parsimony. Environmental Science & Technology, 42, 7032-7037.
53
Hauschild, M. Z., Potting, J., Hertel, O., Schöpp, W. & Bastrup-Birk, A. 2006. Spatial Differentiation in the Characterisation of Photochemical Ozone Formation: The EDIP2003 Methodology. The International Journal of Life Cycle Assessment, 11, 72-80.
Heijungs, R., J. Guinée, G. H., Lankreijer, R. M., Haes, H. A. U. d., Sleeswijk, A. W., Ansems, A. M. M., Eggels, P. G., Duin, R. v. & Goede, H. P. d. 1992. Environmental Life Cycle Assessment of products. Guide and Backgrounds. Leiden: Centre of Environmental Sciense (CML), Leiden University.
Heijungs, R. & Suh, S. 2002. The Computational Structure of Life Cycle Assessment, Dordrecht, Kluwer Academic Publishers.
Hekkert, M. P., Hendriks, F., Faaij, A. P. C. & Neelis, M. L. 2005. Natural gas as an alternative to crude oil in automotive fuel chains well-to-wheel analysis and transition strategy development. Energy Policy, 33, 579-594.
Hellén, G. 2009. Naturgas – ett renare bränsle för fartygsmotorer. Sveriges Energiting, 2009 Stockholm.
Henningsen, S. 1998. Chapter 14 - Air Pollution from Large Two-Stroke Diesel Engines and Technologies to Control It. In: Eran, S. (ed.) Handbook of Air Pollution From Internal Combustion Engines. San Diego: Academic Press.
Hensher, D. A. & Button, K. J. 2003. Handbook of transport and the environment, Amsterdam, Pergamon.
Heywood, J. B. 1988. Internal combustion engine fundamentals, New York, McGraw-Hill.
Hillman, K. 2008. Environmental Assessment and Strategic Technology Choice: The Case of Renewable Transport Fuels. Thesis for Doctor of Philosophy, Chalmers University of Technology, Göteborg.
Huijbregts, M. A. J. 1999. Priority assessment of toxic substances in LCA. Development and application of the multi-media fate, exposure and effect model USES-LCA. IVAM environmental research, University of Amsterdam, Amsterdam.
Huijbregts, M. A. J., Schöpp, W., Verkuijlen, E., Heijungs, R. & Reijnders, L. 2000a. Spatially Explicit Characterization of Acidifying and Eutrophying Air Pollution in Life-Cycle Assessment. Journal of Industrial Ecology, 4, 75-92.
Huijbregts, M. A. J., U. Thissen, Guinée, J. B., Jager, T., Meent, D. v. d., Ragas, A. M. J., Sleeswijk, A. W. & Reijnders, L. 2000b. Priority assessment of toxic substances in life cycle assessment, I: Calculation of toxicity potentials for 181 substances with the nested multi-media fate, exposure and effects model USES-LCA. Chemosphere, 541-573.
IES 2010a. International Reference Life Cycle Data System (ILCD) Handbook - Framework and Requirements for Life Cycle Impact Assessment Models and Indicator. First edition March 2010 ed. Luxembourg: Publications Office of the European Union: European Commission - Joint Research Centre - Institute for Environment and Sustainability.
IES 2010b. International Reference Life Cycle Data System (ILCD) Handbook - General guide for Life Cycle Assessment - Detailed guidance. First edition March 2010 ed. Luxembourg: Publications Office of the European Union: European Commission - Joint Research Centre - Institute for Environment and Sustainability.
54
IMO 2006. MARPOL consolidated edition 2006 - Articles, Protocols, Annexes, Unified Interpretations of the International Convention for the Prevention of Pollution from Ships, 1973, as modified by the Protocol of 1978 relating thereto, London, International Maritime Organzation.
IMO. 2011. Resolution MEPC.203(62) - Amendments to the Annex of the Protocol of 1997 to amend the International Convention for the Prevention of Pollution from Ships, 1973, as modified by the Protocol of 1978 relating thereto (MARPOL) [Online]. International Maritime Organzation. Available: http://www.imo.org/MediaCentre/HotTopics/GHG/Documents/eedi%20amendments%20RESOLUTION%20MEPC203%2062.pdf [Accessed 10th of November 2011].
Ingelstam, L. 2002. System - att tänka över samhälle och teknik, Eskilstuna, Statens energimyndighet.
IPCC 2007. Climate Change 2007: The Physical Science Basis. Contribution of Working Group I to the Fourth Assessment. Report of the Intergovernmental Panel on Climate Change. In: Solomon, S., D. Qin, M. M., Z. Chen, M. Marquis, K.B. Averyt, Tignor, M. & Miller, H. L. (eds.).
ISO 2006a. ISO 14040:2006. Environmental management – Life cycle assessment – Principles and framework.
ISO 2006b. ISO 14044:2006. Environmental management - Life Cycle Assessment - Requirements and guidelines.
Johnsen, T. & Magerholm-Fet, A. 1998. Screening Life Cycle Assessment of M/V Color Festival.
Jonge, E. d., Hugi, C. & Cooper, D. 2005. Entec UK Limited, Service Contract on Ship Emissions: Assignment, Abatement and Market-based Instruments, Task 2b – NOX Abatement. Northwich, England: European Commission Directorate General Environment.
Järvi, A. 2010. Methane slip reduction in Wärtsilä lean burn gas engines. 26th CIMAC World Congress on Combustion Engines. Bergen.
Karavalakis, G., Tzirakis, E., Mattheou, L., Stournas, S., Zannikos, F. & Karonis, D. 2008. The impact of using biodiesel/marine gas oil blends on exhaust emissions from a stationary diesel engine. Journal of Environmental Science and Health - Part A Toxic/Hazardous Substances and Environmental Engineering, 43, 1663-1672.
Karle, I.-M. & Turner, D. 2007. Seawater Scrubbing - reduction of SOx emissions from ship exhaust. Gothenburg: AGS office at Chalmers.
Kavalov, B., Petric´, H. & Georgakaki, A. 2009. Liquefied Natural Gas for Europe – Some Important Issues for Consideration. Luxembourg: European Commission, Joint Research Centre, Institute for Energy.
Kuiken, K. 2008. Diesel engines - for ship propulsion and power plants I, Onnen, Target Global Energy Training.
Lack, D. A., Corbett, J. J., Onasch, T., Lerner, B., Massoli, P., Quinn, P. K., Bates, T. S., Covert, D. S., Coffman, D., Sierau, B., Herndon, S., Allan, J., Baynard, T., Lovejoy, E., Ravishankara, A. R. & Williams, E. 2009. Particulate emissions from commercial shipping: Chemical, physical, and optical properties. J. Geophys. Res., 114.
55
Larsson, M. 2007. An Experimental Study of Fischer-Tropsch Fuels in a Diesel Engine. Thesis for Licentiate of Engineering Chalmers University of Technology.
Lauer, A., Eyring, V., Hendricks, J., Jockel, P. & Lohmann, U. 2007. Global model simulations of the impact of ocean-going ships on aerosols, clouds, and the radiation budget. Atmospheric Chemistry and Physics, 7, 5061-5079.
Lin, C.-Y. & Huang, T.-H. 2012. Cost–benefit evaluation of using biodiesel as an alternative fuel for fishing boats in Taiwan. Marine Policy, 36, 103-107.
Lövblad, G. & Fridell, E. 2006. Experiences from use of some techniques to reduce emissions from ships. Gothenburg: Profu, IVL Svenska miljöinstitutet.
Magnusson, M. 2011. NOx abatement technique for marine applications: improved SCR systems. Thesis for Licentiate of Engineering Chalmers University of Technology.
Malça, J. & Freire, F. 2011. Life-cycle studies of biodiesel in Europe: A review addressing the variability of results and modeling issues. Renewable and Sustainable Energy Reviews, 15, 338-351.
Mihic, S., Golusin, M. & Mihajlovic, M. 2011. Policy and promotion of sustainable inland waterway transport in Europe - Danube River. Renewable and Sustainable Energy Reviews, 15, 1801-1809.
Naik, S. N., Goud, V. V., Rout, P. K. & Dalai, A. K. 2010. Production of first and second generation biofuels: A comprehensive review. Renewable and Sustainable Energy Reviews, 14, 578-597.
National Research Council 2003. Oil in the sea III: inputs, fates, and effects, Washington, D.C, National Academy Press.
Nielsen, J. B. & Stenersen, D. 2010. Emission factors for CH4, NOX, particulates and black carbon for domestic shipping in Norway, revision 1. Klima og forurensningsdirektoratet: Marintek.
Plevin, R. J. 2010. Life cycle regulation of transportation fuels: Uncertainty and its policy implications. Thesis for Doctor of Philosophy, University of California, Berkeley.
Pope, C. A., Burnett, R. T., Thun, M. J., Calle, E. E., Krewski, D., Ito, K. & Thurston, G. D. 2002. Lung Cancer, Cardiopulmonary Mortality, and Long-term Exposure to Fine Particulate Air Pollution. JAMA: The Journal of the American Medical Association, 287, 1132-1141.
Prior, A., Jääskeläinen, H. & Walsh, J. 2005. NOX emission study: An Investigation of Water-Based Emission Control Technologies. Prepared for Transportation Development Centre (TDC). Fleetway Inc.
Rikstrafiken 2010. Långsiktigt hållbar linjesjöfart till Gotland 2015-2030 - samrådsversion.
Sandén, B. 2010. Technical change and environmental assessments. Presentation in the course Environmentaland energy systems analysis: roots and branches.
Sandén, B. A. & Karlström, M. 2007. Positive and negative feedback in consequential life-cycle assessment. Journal of Cleaner Production, 15, 1469-1481.
56
Sims, R., Taylor, M., Saddler, J. & Mabee, W. 2008. From 1st- to 2nd-Generation Biofuel Technologies - An overview of current industry and RD&D activities. France. International Energy Agency (IEA).
Sletnes, H., Skogen, K. & Andersen, A. B. 2005. Reduksjoner av NOx i fartøyer – Tiltaksanalyse. DNV.
SMTF 2010. LNG ship to ship bunkering procedure. Swedish Marine Technology Forum, Linde Cryo AB, FKAB Marine Design, Det Norske Veritas AS, LNG GOT, White Smoke AB.
Stenhede, T. 22th of June 2010 2010. Gas engines
Strömman, A. H., Stolli, C. & Hertwich, E. G. 2006. Hybrid Life-Cycle Assessment of Natural Gas Based Fuel Chains for Transportation. Environmental Science and Technology, 40, 2797-2804.
SWECO 2009. LNG för fartygsdrift i Sverige. SWECO: Stockholm.
Svensson, E. 2011. The Regulation of Global SOx Emissions from Ships: IMO proceedings 1988-2008. Thesis for Licentiate of Engineering Chalmers University of Technology.
Tillman, A.-M. 2000. Significance of decision-making for LCA methodology. Environmental Impact Assessment Review, 20, 113-123.
Transportstyrelsen 2011. Rapportering enligt svaveldirektiv för år 2010.
U.S. EPA 1996. Large Stationary Diesel and All Stationary Dual-fuel Engines. AP 42, Fifth Edition, Volume I - Chapter 3: Stationary Internal Combustion Sources.
U.S. EPA 2000. Natural Gas-fired Reciprocating Engines. AP 42, Fifth Edition, Volume I - Chapter 3: Stationary Internal Combustion Sources.
U.S. EPA 2010. Regulatory Announcement - Designation of North American Emission Control Area to Reduce Emissions from Ships. In: Quality, O. O. T. a. A. (ed.). United States Evironmental Protection Agency.
Wallenius Marine AB. 2011. Zero - a roadmap to our future emission free ships [Online]. Available: http://www.walleniuslines.com/PageFiles/1721/Broschyr%20ZERO%20may%202010.pdf [Accessed 8th of November 2011].
van Zelm, R., Huijbregts, M. A. J., den Hollander, H. A., van Jaarsveld, H. A., Sauter, F. J., Struijs, J., van Wijnen, H. J. & van de Meent, D. 2008. European characterization factors for human health damage of PM10 and ozone in life cycle impact assessment. Atmospheric Environment, 42, 441-453.
Wang, H., Hao, H., Li, X., Zhang, K. & Ouyang, M. 2009. Performance of Euro III common rail heavy duty diesel engine fueled with Gas to Liquid. Applied Energy, 86, 2257-2261.
Wang, M., Lee, H. & Molburg, J. 2004. Allocation of Energy Use In Petroleum Refineries to Petroleum Products - Implications for Life-Cycle Energy Use and Emission Inventory of Petroleum Transportation fuels. The International Journal of Life Cycle Assessment 9, 34-44.
57
Weiss, M. A., Heywood, J. B., Drake, E. M., Schafer, A. & AuYeung, F. F. 2000. On the road 2020 - A life-cycle analysis of new automobile technologies. Massachusetts: Energy Laboratory, Massachusetts Institute of Technology, Cambridge.
Wiggins, E. 2011. COGAS propulsion for LNG ships. Journal of Marine Science and Application, 10, 175-183.
Winebrake, J. J., Corbett, J. J. & Meyer, P. E. 2007. Energy use and emissions from marine vessels: A total fuel life cycle approach. Journal of the Air and Waste Management Association, 57, 102-110.
Winnes, H. 2007. Overview of ship emissions of NOX and SO2, their effects and the cost-effectiveness of certain reduction-techniques (Draft report in the project Competitive Environmental Shipping). Gothenburg: Department of Shipping and Marine Technology, Chalmers University of Technology.
Winnes, H. & Fridell, E. 2009. Particle Emissions from Ships: Dependence on Fuel Type. Journal of the Air & Waste Management Association, 59, 1391–1398.
Winnes, H., Fridell, E., Åström, S. & Andersson, K. 2010. Improved air quality and associated cost from regulations on ship emissions - case study on the Port of Gothenburg. Manuscript in preperation. Shipping and Marine Technology, Chalmers University of Technology.
Voulvoulis, N., Scrimshaw, M. D. & Lester, J. N. 1999. Alternative Antifouling Biocides. Applied organometal chemistry, 13, 135-143.
Wrisberg, N. 2002. Analytical tools for environmental design and management in a systems perspective: the combined use of analytical tools, Dordrecht, Kluwer.
Yebra, D. M., Kiil, S. & Dam-Johansen, K. 2004. Antifouling technology - past, present and future steps towards efficient and environmentally friendly antifouling coatings. Progress In Organic Coatings, 50, 75-104.