56
Life Cycle Cost and Pavement Preservation Issues Prepared by: Douglas D Carlson Vice President Asphalt Products Presenter: Mark Belshe

Life Cycle Cost and Pavement Preservation Issues
Prepared by: Douglas D Carlson
Vice President
Asphalt Products
Presenter: Mark Belshe

Crude Oil, Gas and Asphalt Costs Oil, Asphalt and Gas
$0.00
$0.50
$1.00
$1.50
$2.00
$2.50
$3.00
$3.50
$4.00
$4.50
$5.00
Jul-9
6
Jan-97
Jul-9
7
Jan-98
Jul-9
8
Jan-99
Jul-9
9
Jan-00
Jul-0
0
Jan-01
Jul-0
1
Jan-02
Jul-0
2
Jan-03
Jul-0
3
Jan-04
Jul-0
4
Jan-05
Jul-0
5
Jan-06
Jul-0
6
Jan-07
Jul-0
7
Jan-08
Jul-0
8
Jan-09
Jul-0
9
Jan-10
Jul-1
0
Jan-11
Jul-1
1
$/G
allo
n
Asphalt Crude Oil Gasoline

Life Cycle Costs Analysis for
Asphalt Rubber Paving Materials
by
R. Gary Hicks and Ding Cheng
CP2 Center prepared for
RPA Annual Meeting
San Antonio Texas
February 8, 2011

Background
• Asphalt rubber used since 1960s
• Primary uses include: – Chip seals
– Interlayers
– Hot mix applications
• Other uses – Crack sealants
– Membranes

Chip Seals
• Use began in 1960s
• Used for preventive
maintenance
• Now used by many
agencies

Chip Seals
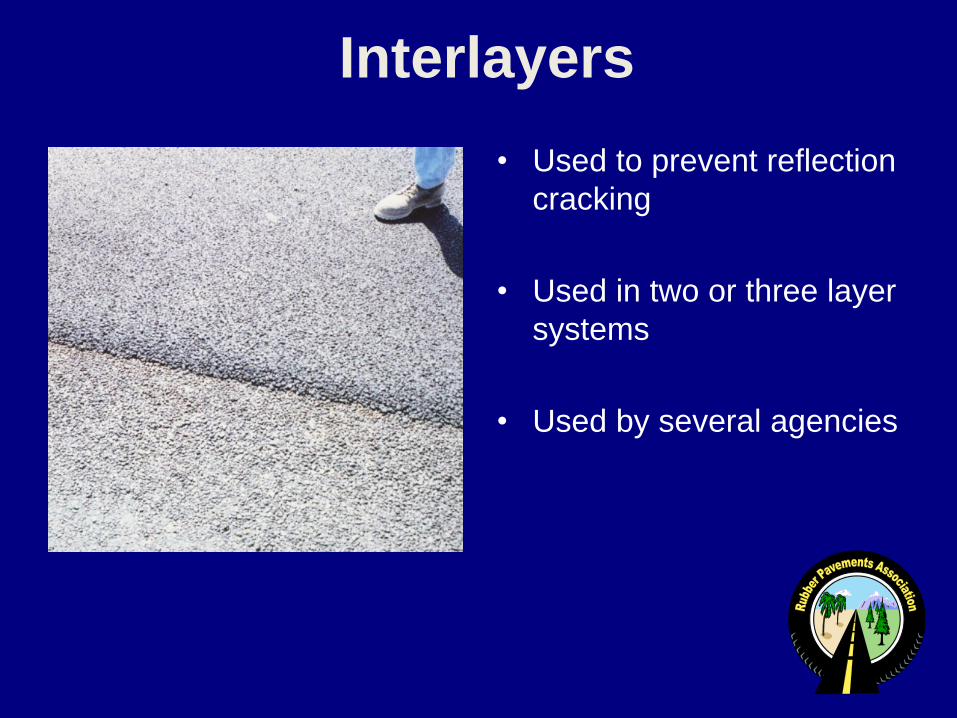
Interlayers
• Used to prevent reflection
cracking
• Used in two or three layer
systems
• Used by several agencies

Rubberized Hot Mix Asphalt
• Used in gap-, open-, and
dense-graded mixes
• Used primarily in Arizona,
California, and Texas
• Reduced thickness is
allowed by some
agencies

LCCA Process
• Establish strategies for analysis period
• Establish M&R activity timing
• Estimate agency costs
• Estimate user and non-user costs
• Develop expenditure streams
• Compute net-present value
• Analyze results

Establish Strategies & Timing
• What?
• When?
• How long?

Analysis Period P
ave
me
nt
Co
nd
itio
n
Pavement
Life Analysis Period
Include at least one Rehab.
30-40 yrs

Agency Costs
• Design & engineering
• Initial construction
• Rehabilitation and maintenance

User and Non-User Costs
• Vehicle operating
• User delay
• Accident
• Impacts to adjacent businesses
• Disruptions to local residents

Develop Expenditure Streams
• Agency costs
• User and non-user costs
• Salvage value

Calculate Net Present Value (NPV)
NPV = Initial Cost + Future Cost
where
i = discount rate
n = year of expenditure
N
K=1 (1 + i)n
1 [ ]

Typical Expenditure Stream
Initial
Construction Rehabilitations
Analysis Period
TIME Salvage Value

Net Present Value
0
$325
Rehab #1
15 30
Costs
($1,0
00)
Time (years) Salvage Value $217
$1,100
Initial Cost
$300
User Costs
$269 User Cost
$361 User Cost
$325
Rehab #2

Analyze Results
• Deterministic approach
(w/o variability)
• Probabilistic approach (w/
variability)

Summary
• LCCA is a
– Decision support tool
– Results are not decisions
– Used to improve M&R strategies

LCCA Example Calculations
• System preservation - chip seals
• System preservation - thin hot overlays
• Structural overlay - reduced thickness

Inputs
• Discount rate, % 2.5, 4.0, 5.5
• Analysis period, yrs 40
• Average expected life Conv. AR
– Chip seals 5 10
– Thin HMA overlay 3 7
– Thick HMA overlay 10 15

1995 Agency Costs - Average
Treatment Conv. AR
Chip Seals ($/yd2) 1.00 2.00
HMA overlays ($/ton) 35 50
Routine maintenance 0.15 0.15
($/yd2 per year )

Scenarios Investigated
System Preservation Alternates
- Chip Seals Conventional chip seal followed by 100mm
HMA-DG.
AR chip seal followed by 50mm RHMA-GG over
50mm HMA-DG.
- Thin Hot Overlays 25mm HMA-DG followed by 100mm
HMA-DG.
25mm RHMA-GG followed by 50 mm RHMA-GG
over 50mm HMA-DG.
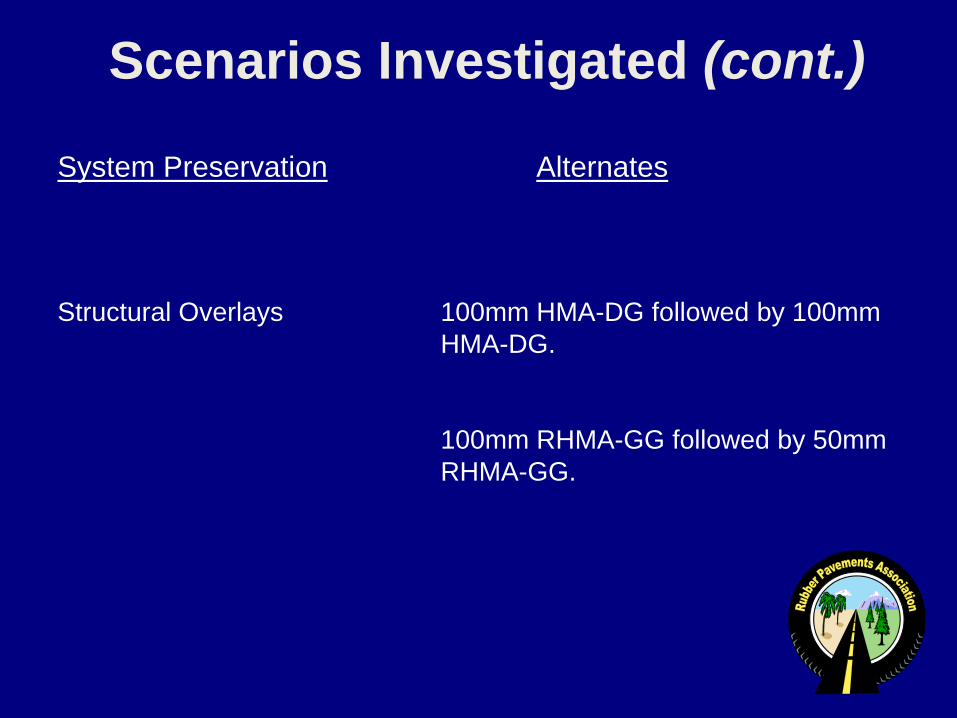
Scenarios Investigated (cont.)
System Preservation Alternates
Structural Overlays 100mm HMA-DG followed by 100mm
HMA-DG.
100mm RHMA-GG followed by 50mm
RHMA-GG.

User Costs Considerations
• Only consider delays costs due to interruption
• Other user and non-user cost are assumed
equal
• Concept of lane rental fees used as surrogate
for delay costs

Results - Deterministic Approach
Scenario Present Worth ($/yd)
Preservation – Chip Seal
• Conventional 18.39
• AR 15.87 2.25
Preservation – Thin HMA
• Conventional 20.69
• AR 17.33 3.36
Structural Overlay
• Conventional 21.97
• AR 14.63 7.34

Results - Probabilistic Model
Percentage of times
Scenario savings result using AR
Preservation - chip seal 86
Preservation - thin HMA 82
Structural Overlay 86

Summary-LCCA
• Asphalt rubber is cost effective for the scenarios
evaluated
• When variability in the inputs is considered, the AR
alternate would be the best choice over 80% of the time
• Asphalt rubber may not be cost effective in all situations.
LCCA allows one to determine when and where it will be
cost effective.
Update to LCCA
• Include current initial costs
• Real life performance data
• Compare more materials, Conventional, Rubber,
Polymer, and Soluble Rubber (Recycled TR
Polymers) binders

30

Example of Survey Data – Estimated Pavement Life (AR
Chip Seal, RHMA-G, RHMA-O)
Development of Scenarios
• Consider the following for the modified binders
– Extended life between treatments
– Reduced overlay thickness
– Reduced maintenance
– More variable lives
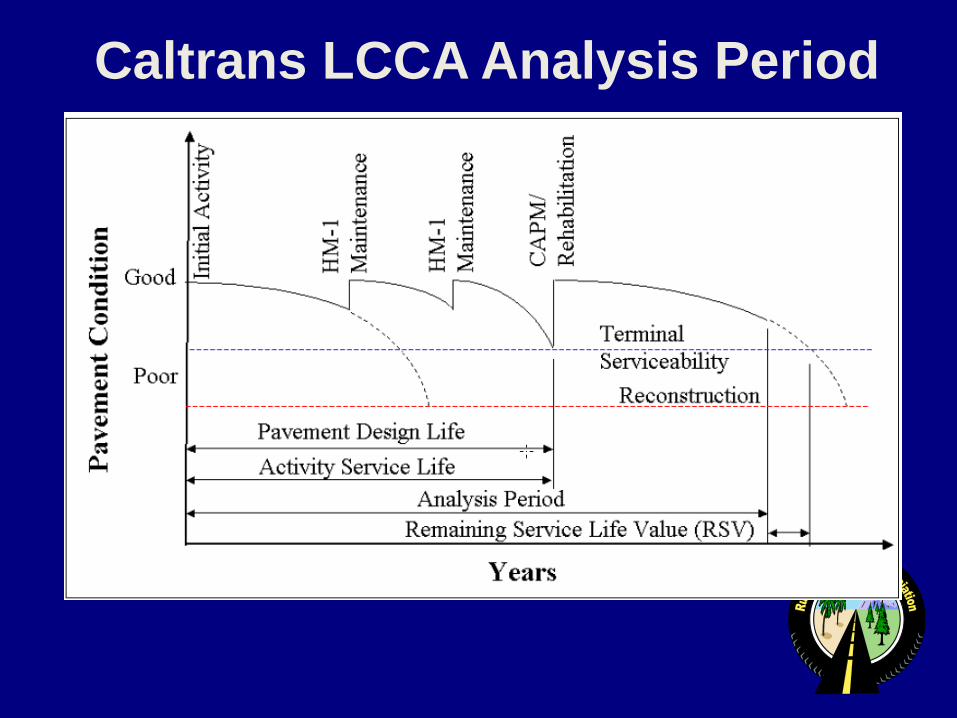
Caltrans LCCA Analysis Period

Objective Approach Needed
• Variables affecting performance include
– Traffic and Climate
– Quality control
– Existing pavement condition
Timing of Treatments Affect
Performance
• Good- minor distress (< 5% cracking)
• Fair-minor to moderate distress (5-20%
cracking)
• Poor- moderate to severe distress (>20%
cracking)

Cost Data Being Collected
• In-place construction costs
• Maintenance costs
• User costs

In-place Construction Costs
• All modified binders cost more than un
modified asphalt
• As such, they must last longer or be used in
reduced thickness
• Typical costs in $/ton are being determined for
– AR ($115/ton Gap graded, $90/ton Open graded)
– Conventional ($89/ton large, $96/medium)

Maintenance Cost Comparisons

User Costs
• Fuel consumption-about the same
• Safety costs-about the same
• Vehicle maintenance-about the same
• User delay costs-about the same
• Do we need to include user costs-only if the agencies do
• Realcost software has the capability to include user costs.

Questions to be Addressed with
Real Cost Calculations
• What life extension is needed to make the following cost effective? – AR
– PMA
– Terminal blends
• How much does the thickness need to be reduced to make these products cost effective?
• How does the variability in pavement performance impact the cost effectiveness?

Summary
• AR is cost effective assuming it produces greater lives or can be used in reduce thickness
• Later this year, we will have updated results on the cost effectiveness of AR and modified binders

In 20 years, 3 surface
treatments and 19008
gallons
In 20 years, 2 surface
treatments and 16896
gallons
TEXAS
Treatment Performance Capacity – A tool to
predict the Effectiveness of Maintenance
Strategies
By
Dr. Jorge B. Sousa
and George Way

Study Approach-estimating
Treatment Lives
• How to Bring in the Effect of Climate in Life
of Treatments?
• How to Bring in the Effect of Traffic in Life of
Treatments?
• How to Bring in the Effect of Existing
Pavement Condition?
• How to Bring in the Intrinsic Maintenance
Material Properties?
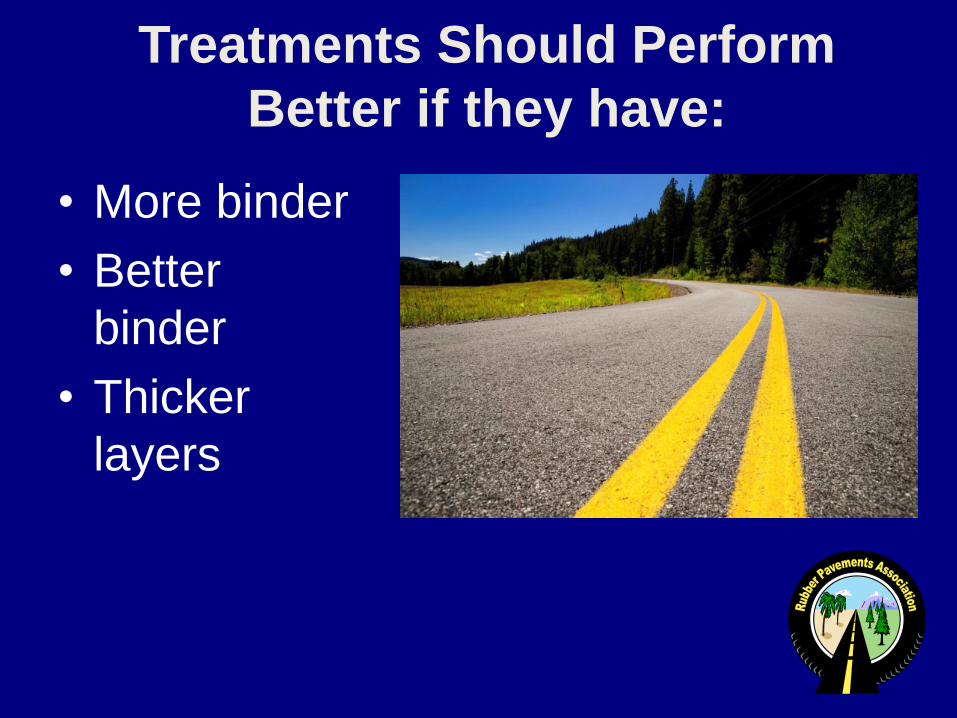
Treatments Should Perform
Better if they have:
• More binder
• Better
binder
• Thicker
layers

Traffic Index
• Low TI < 6 • [Less than 33,000 ESAL’s]
• Intermediate 6 < TI < 12 • [Between 33,000 and 1.1 million ESAL’s]
• Heavy TI >12 • [Greater than 1.1 million ESAL’s]

Existing Pavement Condition
Affects Treatment Life
• Good- Minor distress (< 5 % cracking).
– Expected life of 8-10 years or more
• Fair- minor to moderate distress (5-20%
cracking).
– Expected life of 4-6 years
• Poor condition (>20 % cracking). Moderate to
severe distress and with structural problems.
– Expected life of 1-3 years

Effect of Binder
• Quantity of binder,
• Aging characteristics of the binder used in
treatments
• Elastic characteristics of binder,
• Strain energy at break of the binder,
• Types of additives (none, polymer, rubber,
others),
• Mix stiffness (if applicable)


Effect of Type of Binder
TPF-5(019) Accelerated Loading Facility Status Report Jan. 2005
0
10
20
30
40
50
60
70
80
90
100
25000 50000 75000 100000 125000 150000 175000 200000 225000 250000 275000 300000
Number of Load Passes
Cum
ula
tive C
rack
Length
(m
)
Control L2 SBS LG L4 CR-AZ L1
ALF - FHWA Test Results 2004
Control SBS Polymer
Asphalt Rubber

ASPHALT RUBBER
“Can undergo about five times
the strain before rupture than can
asphalt”
1977 ADOT Research Report
By Green and Tolonen
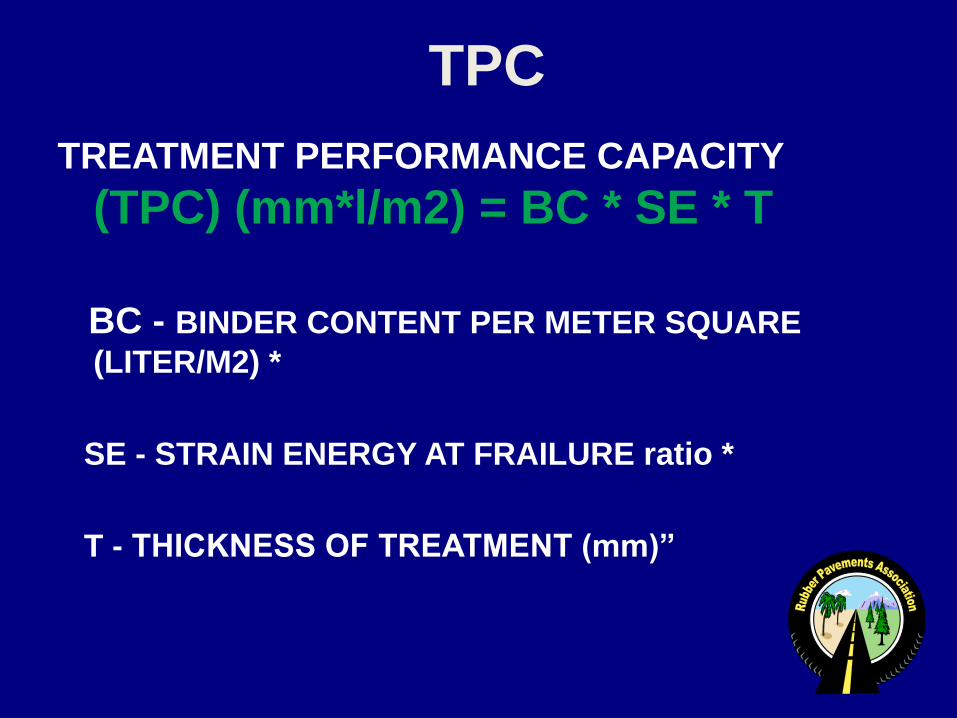
TPC
TREATMENT PERFORMANCE CAPACITY
(TPC) (mm*l/m2) = BC * SE * T
BC - BINDER CONTENT PER METER SQUARE
(LITER/M2) *
SE - STRAIN ENERGY AT FRAILURE ratio *
T - THICKNESS OF TREATMENT (mm)”


CONCLUSIONS
• This research made clear that better treatments are
those that have higher Treatment Performance Capacity
(TPC), which indicates, what is intuitively known from all
pavement engineers, that treatments perform better if
they have more binder, are made with better binder and
are thicker (i.e. more long lasting and more
waterproofing).
• Currently most cost effective treatments (i.e. highest
TPC/$) are those with asphalt rubber.

COST SAVINGS
Three Ways To Save
1. Reduce Thickness
2. Substitute Virgin Polymers
3. Less Maintenance Over Time

Any questions?


