46
Life Cycle Costing – Challenges and Tools SCAF February 2012

Life Cycle Costing – Challenges and Tools SCAF February 2012
2
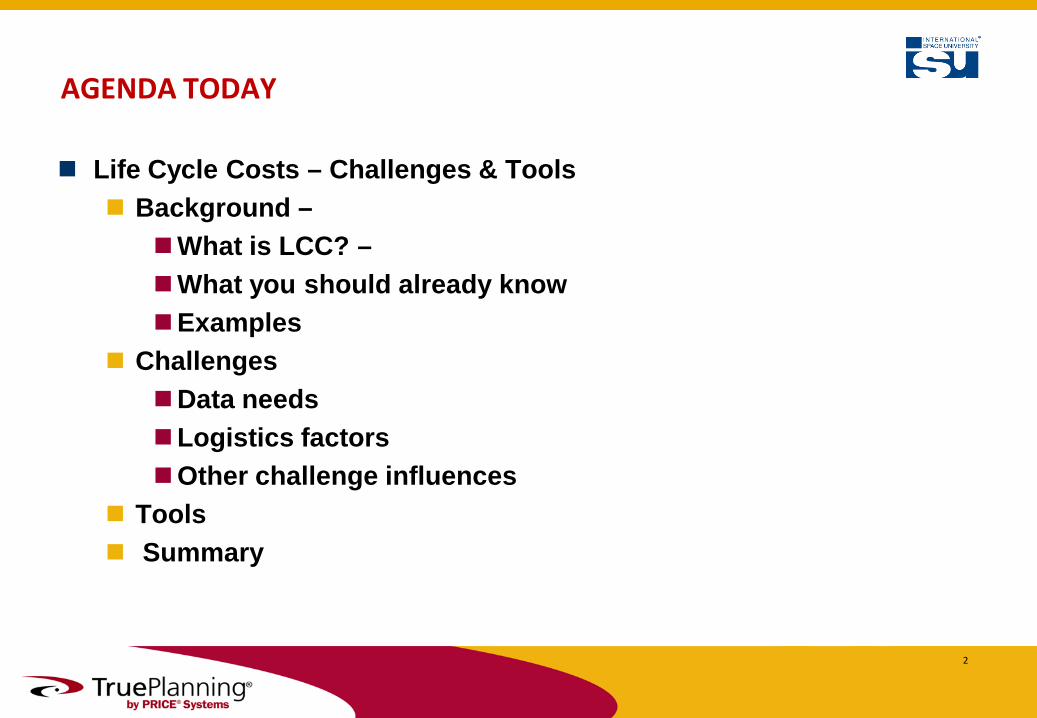
AGENDA TODAY
Life Cycle Costs – Challenges & Tools Background –
What is LCC? – What you should already know Examples
Challenges Data needs Logistics factors Other challenge influences
Tools Summary

3
BACKGROUND
4
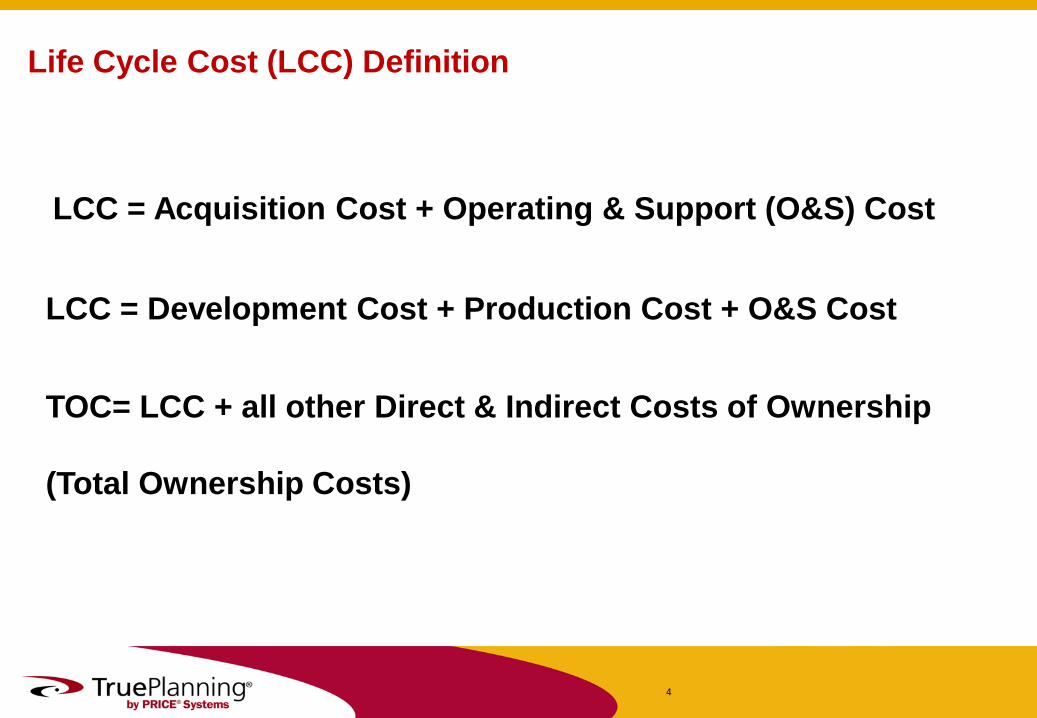
Life Cycle Cost (LCC) Definition
LCC = Acquisition Cost + Operating & Support (O&S) Cost
LCC = Development Cost + Production Cost + O&S Cost
TOC= LCC + all other Direct & Indirect Costs of Ownership (Total Ownership Costs)

5
WHAT YOU SHOULD ALREADY KNOW
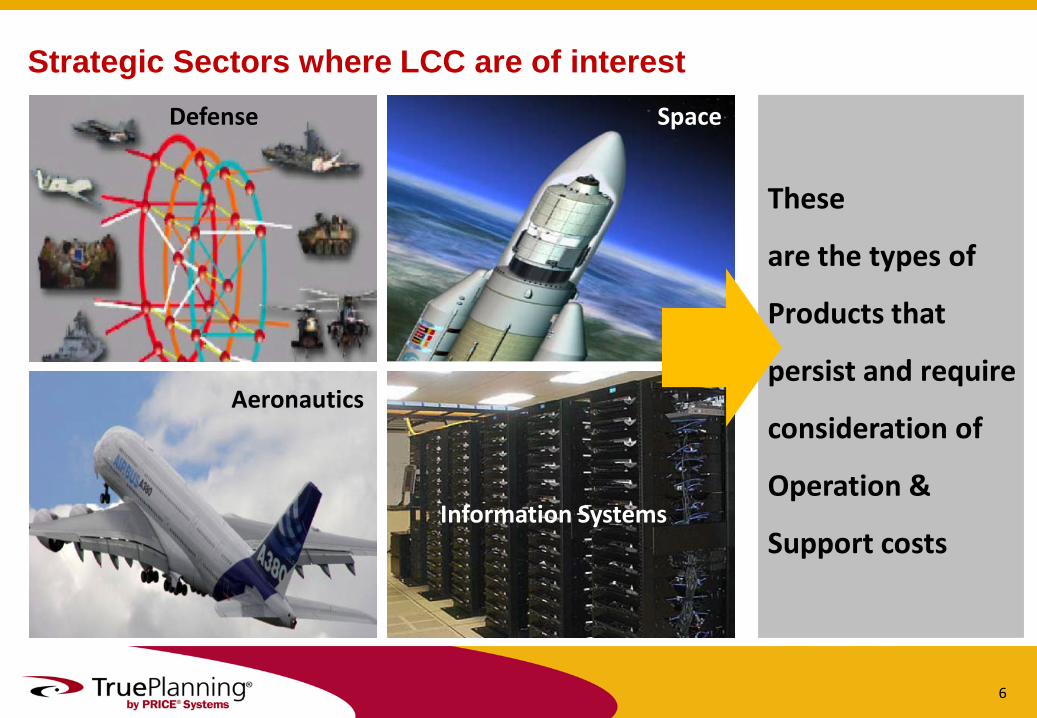
Strategic Sectors where LCC are of interest Defense
Information Systems
Aeronautics
Space
These
are the types of
Products that
persist and require
consideration of
Operation &
Support costs
6
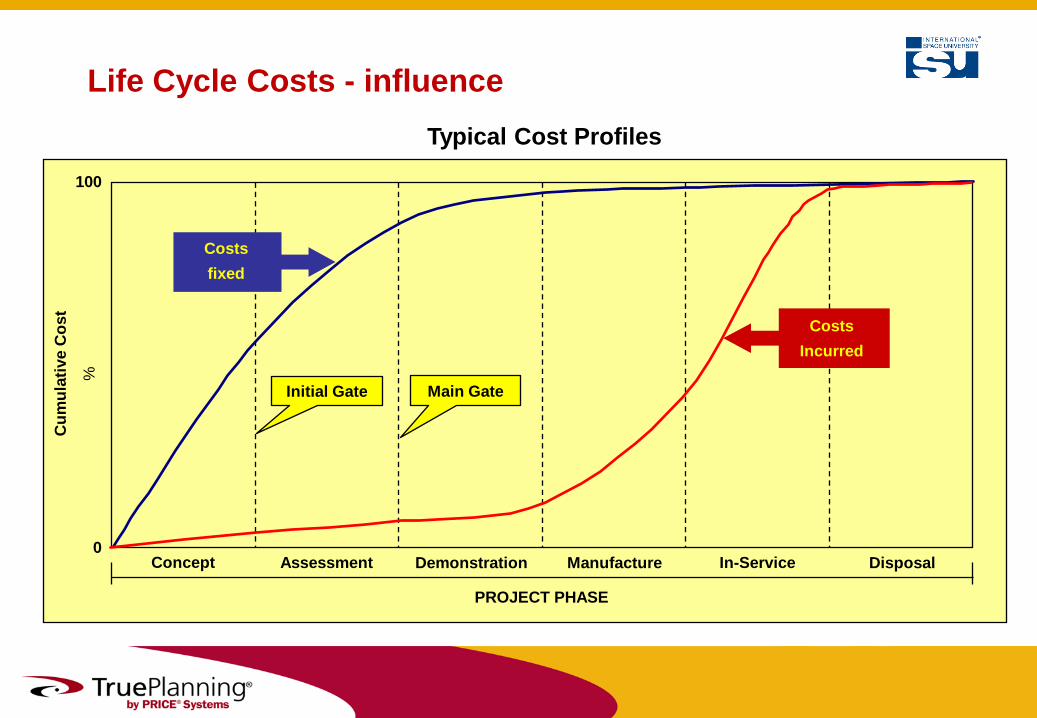
Life Cycle Costs - influence
Concept Assessment Demonstration Manufacture In-Service Disposal
PROJECT PHASE
Cum
ulat
ive
Cos
t
%
0
100
Initial Gate Main Gate
Costs fixed
Costs Incurred
Typical Cost Profiles
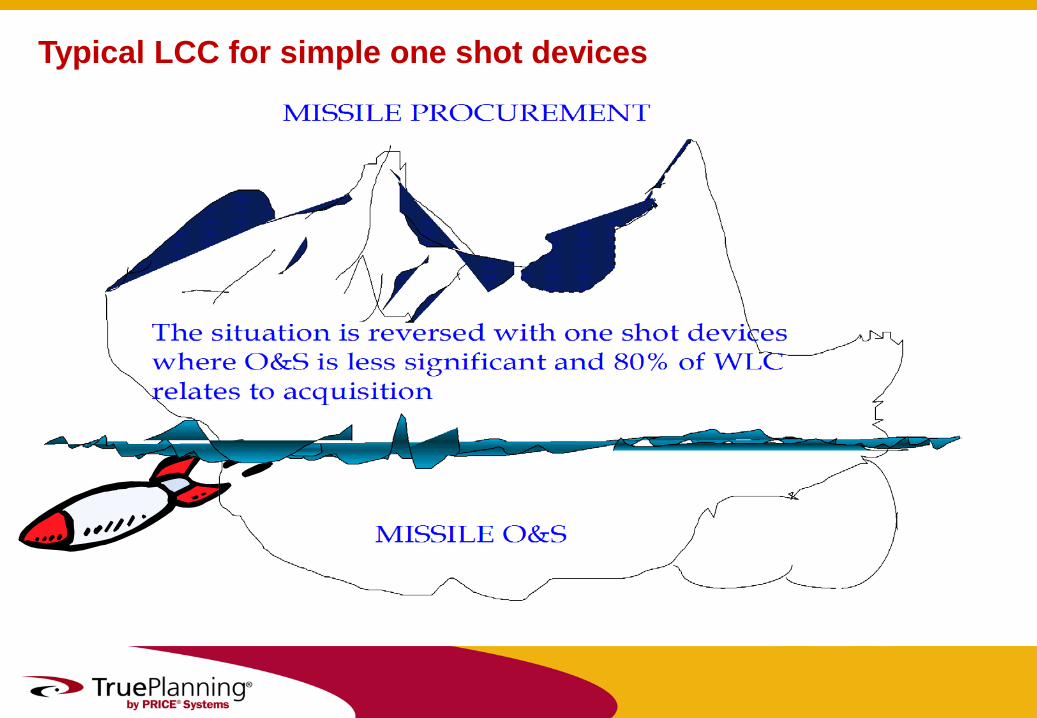
Typical LCC for simple one shot devices
©
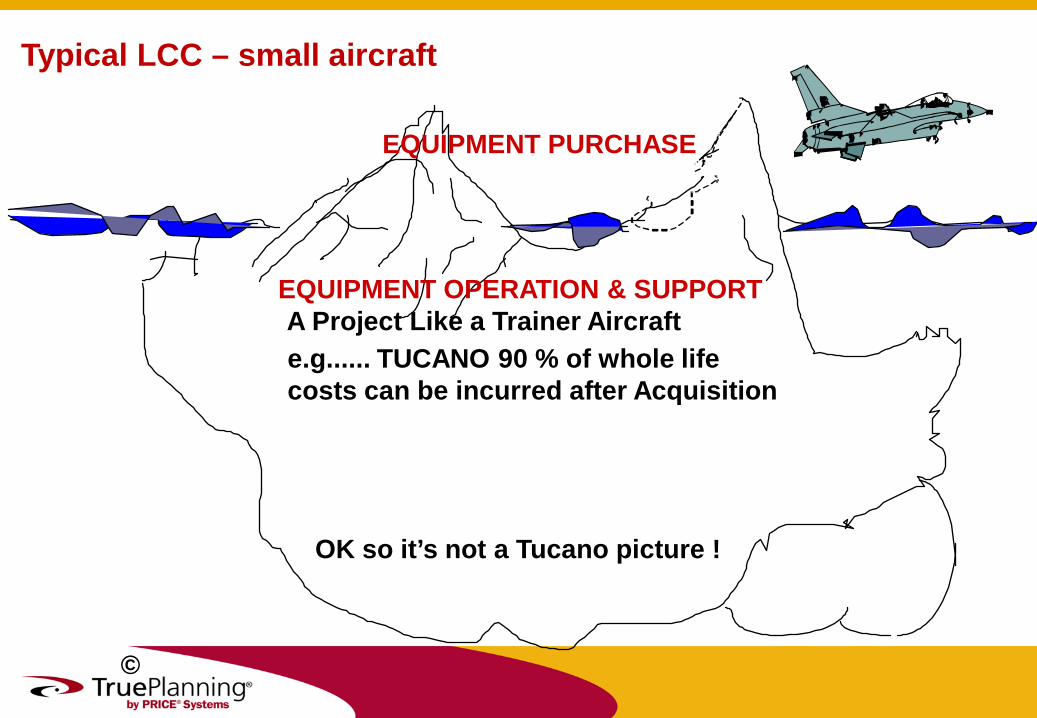
Typical LCC – small aircraft
A Project Like a Trainer Aircraft e.g...... TUCANO 90 % of whole life costs can be incurred after Acquisition
EQUIPMENT PURCHASE
EQUIPMENT OPERATION & SUPPORT
OK so it’s not a Tucano picture !

10
CHALLENGES

Estimating Accuracy the Traditional View
Post costing
Contract changes Invoices
Contracts Bid data analysis
Broad order
estimates
Higher cost
Lower cost
IG MG
Concept Manufacture Assessment Demonstration Upgrades
In-Service Phase Disposal
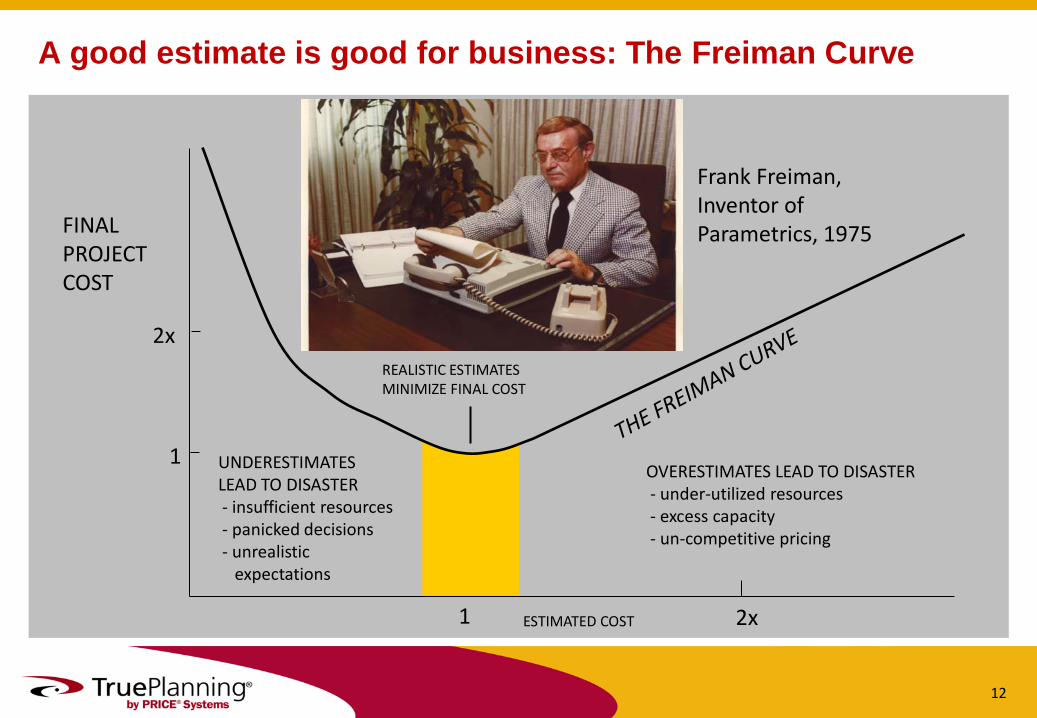
A good estimate is good for business: The Freiman Curve
ESTIMATED COST
1
1 2x
UNDERESTIMATES LEAD TO DISASTER - insufficient resources - panicked decisions - unrealistic expectations
REALISTIC ESTIMATES MINIMIZE FINAL COST
OVERESTIMATES LEAD TO DISASTER - under-utilized resources - excess capacity - un-competitive pricing
FINAL PROJECT COST
2x
Frank Freiman, Inventor of Parametrics, 1975
12
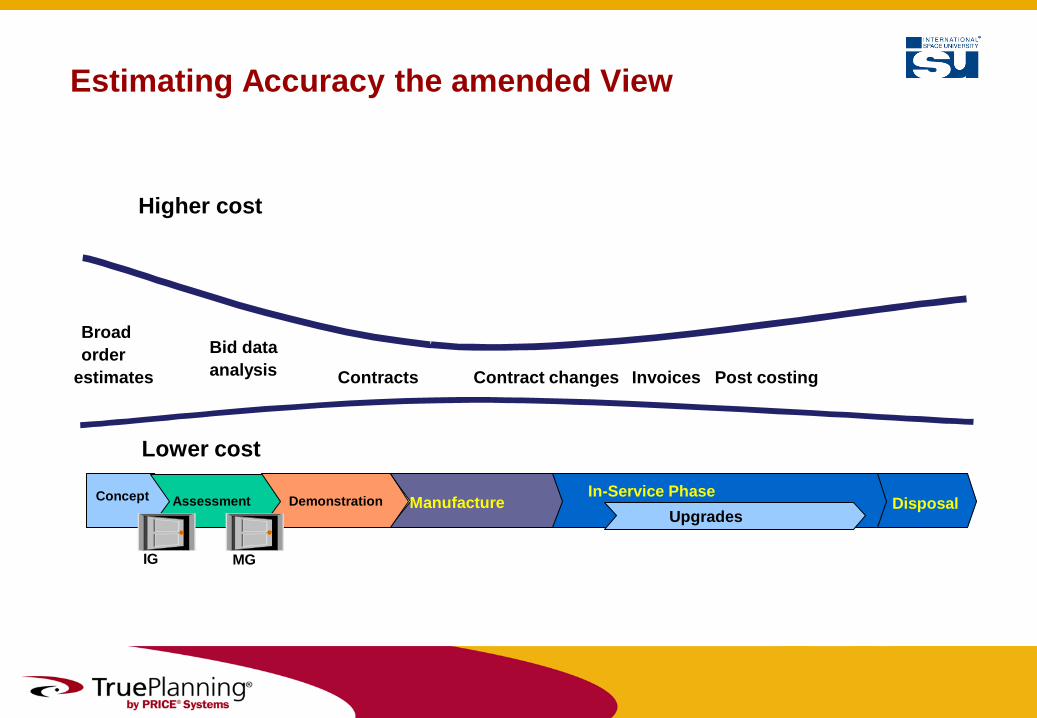
Estimating Accuracy the amended View
Post costing Contract changes Invoices Contracts
Bid data analysis
Broad order
estimates
Higher cost
Lower cost
IG MG
Concept Manufacture Assessment Demonstration Upgrades
In-Service Phase Disposal

14
Parametrics As Basis-of-Estimate (BoE)
Today the use of parametric techniques as basis of economic analysis is widely accepted by Industry and Government organisations and growing. Some of the more common applications are: Development of independent cost estimates (ICE) (e.g., "sanity checks" on
the primary estimating methodology ), Rough Order Of Magnitude estimates (ROMs), life cycle cost estimates (LCCEs), and BoE.
Economic basis for trade studies such as Design-To-Cost (DTC), Cost as An Independent Variable (CAIV), Total Ownership Cost (TOC) and Reduced TOC (RTOC) analyses.
Parametric techniques are also used to perform cost or price analyses. In fact, the US Federal Acquisition Regulation (FAR) identifies parametrics as an acceptable price analysis technique in 15.404-1(b)(2)(iii).
Basis of Estimate for cost proposals
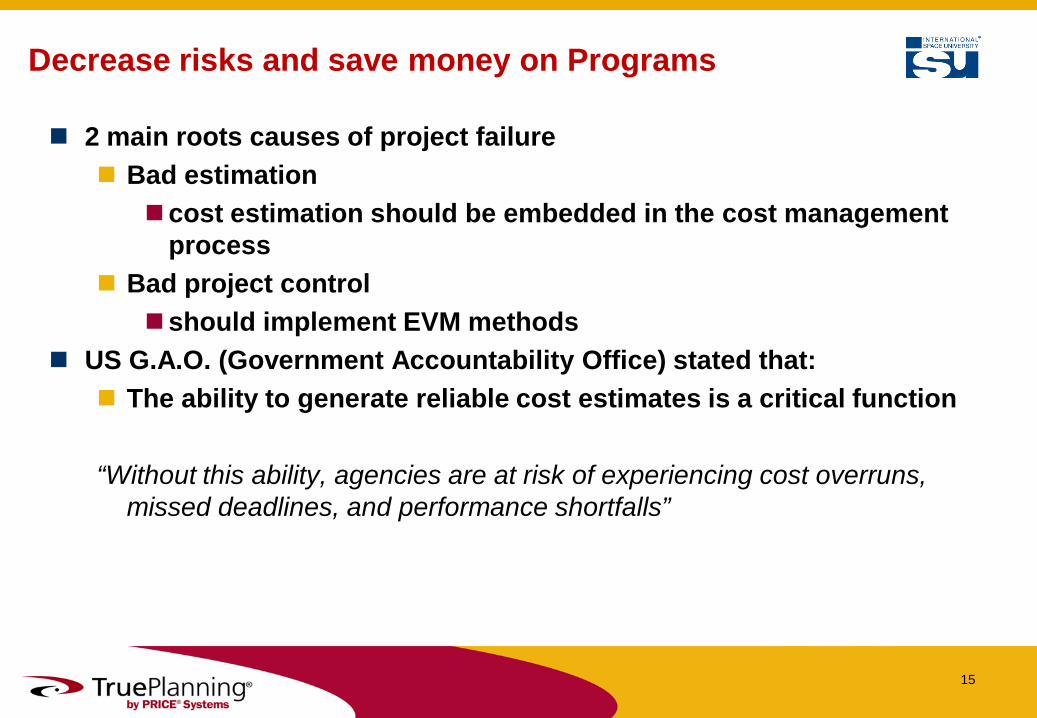
Decrease risks and save money on Programs
2 main roots causes of project failure Bad estimation
cost estimation should be embedded in the cost management process
Bad project control should implement EVM methods
US G.A.O. (Government Accountability Office) stated that: The ability to generate reliable cost estimates is a critical function
“Without this ability, agencies are at risk of experiencing cost overruns,
missed deadlines, and performance shortfalls”
15

ESTIMATING Boundaries ?
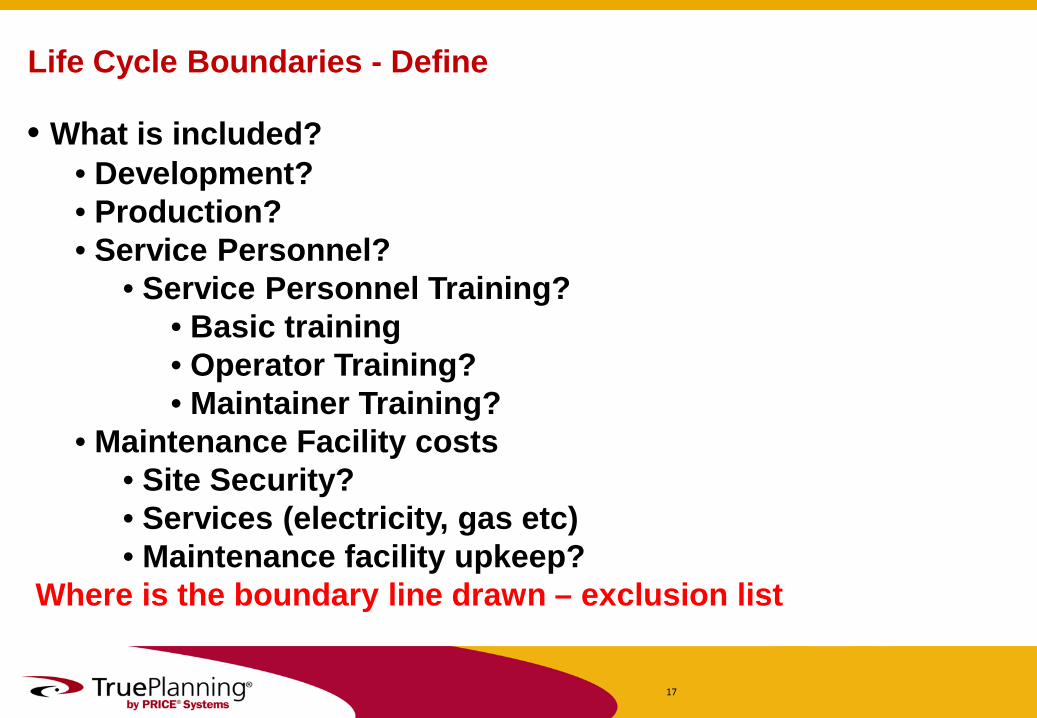
Life Cycle Boundaries - Define
17
• What is included? • Development? • Production? • Service Personnel?
• Service Personnel Training? • Basic training • Operator Training? • Maintainer Training?
• Maintenance Facility costs • Site Security? • Services (electricity, gas etc) • Maintenance facility upkeep?
Where is the boundary line drawn – exclusion list
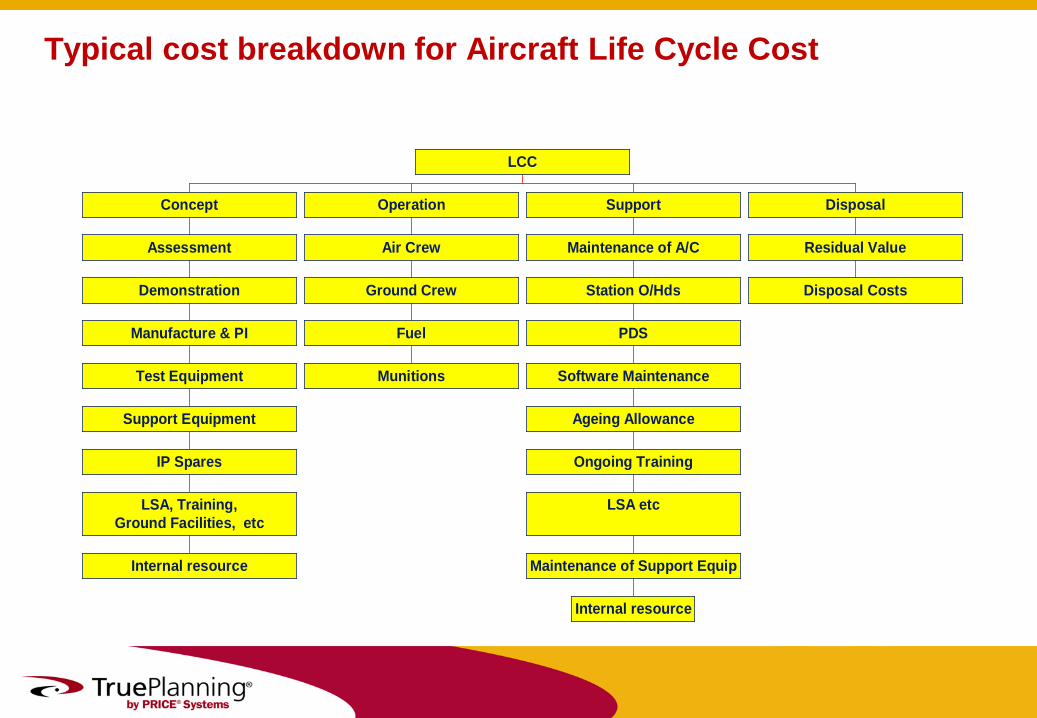
Typical cost breakdown for Aircraft Life Cycle Cost
Internal resource
LSA, Training,Ground Facilities, etc
IP Spares
Support Equipment
Test Equipment
Manufacture & PI
Demonstration
Assessment
Concept
Munitions
Fuel
Ground Crew
Air Crew
Operation
Internal resource
Maintenance of Support Equip
LSA etc
Ongoing Training
Ageing Allowance
Software Maintenance
PDS
Station O/Hds
Maintenance of A/C
Support
Disposal Costs
Residual Value
Disposal
LCC
19
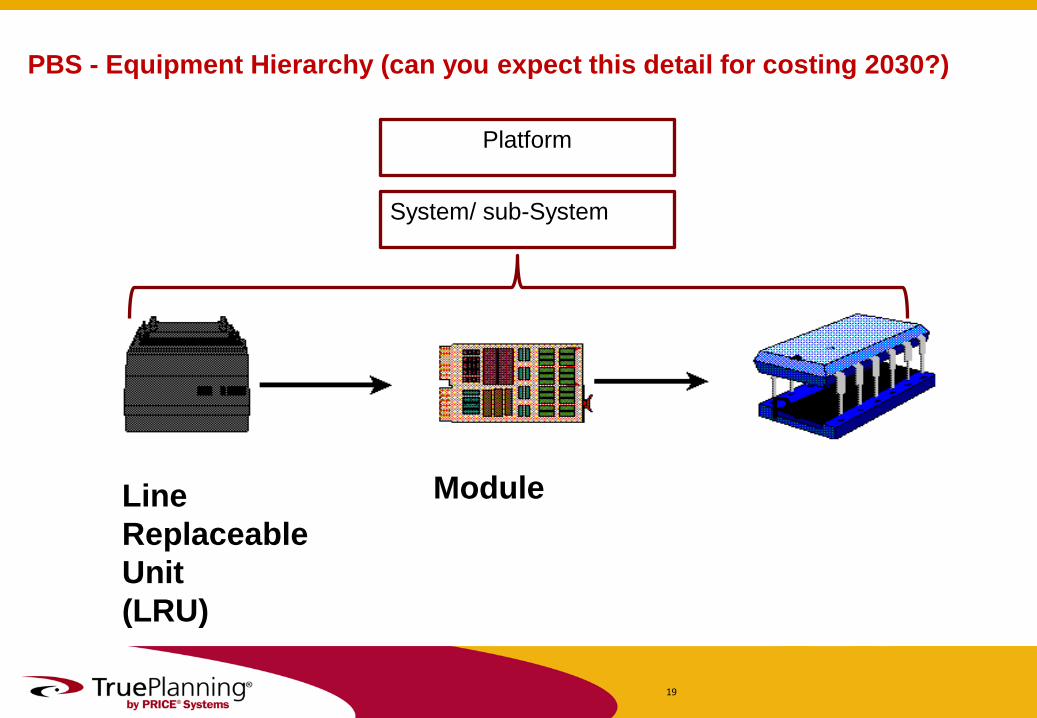
PBS - Equipment Hierarchy (can you expect this detail for costing 2030?)
Line Replaceable Unit (LRU)
Module
Part
System/ sub-System
Platform
20
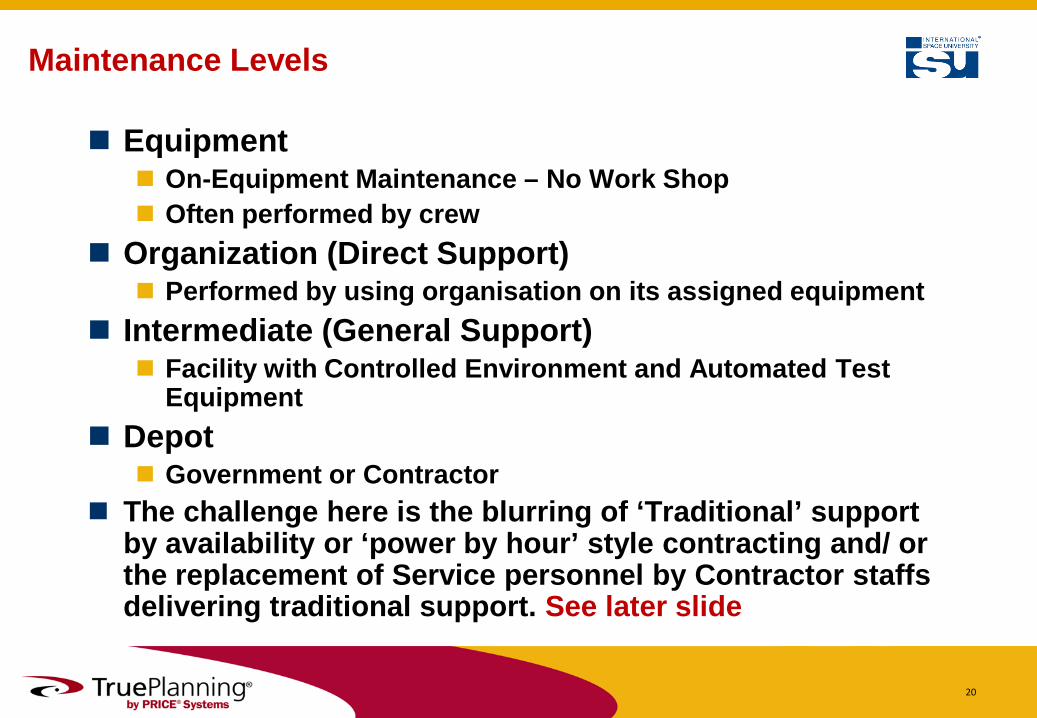
Maintenance Levels
Equipment On-Equipment Maintenance – No Work Shop Often performed by crew
Organization (Direct Support) Performed by using organisation on its assigned equipment
Intermediate (General Support) Facility with Controlled Environment and Automated Test
Equipment Depot
Government or Contractor The challenge here is the blurring of ‘Traditional’ support
by availability or ‘power by hour’ style contracting and/ or the replacement of Service personnel by Contractor staffs delivering traditional support. See later slide
21
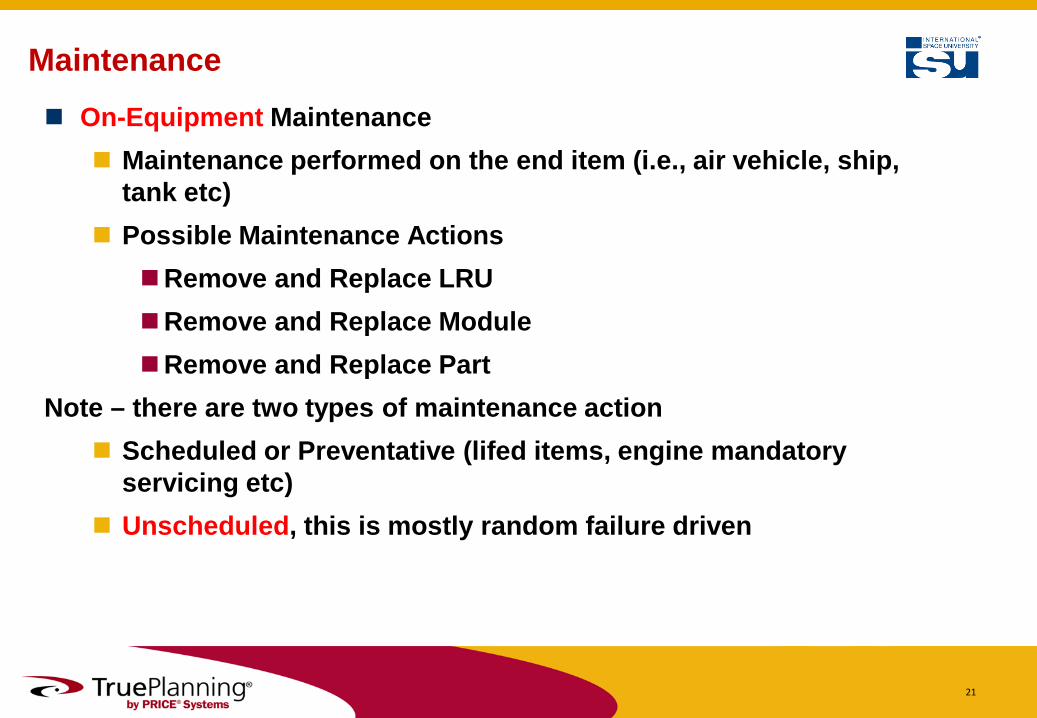
Maintenance On-Equipment Maintenance
Maintenance performed on the end item (i.e., air vehicle, ship, tank etc)
Possible Maintenance Actions Remove and Replace LRU Remove and Replace Module Remove and Replace Part
Note – there are two types of maintenance action Scheduled or Preventative (lifed items, engine mandatory
servicing etc) Unscheduled, this is mostly random failure driven
22
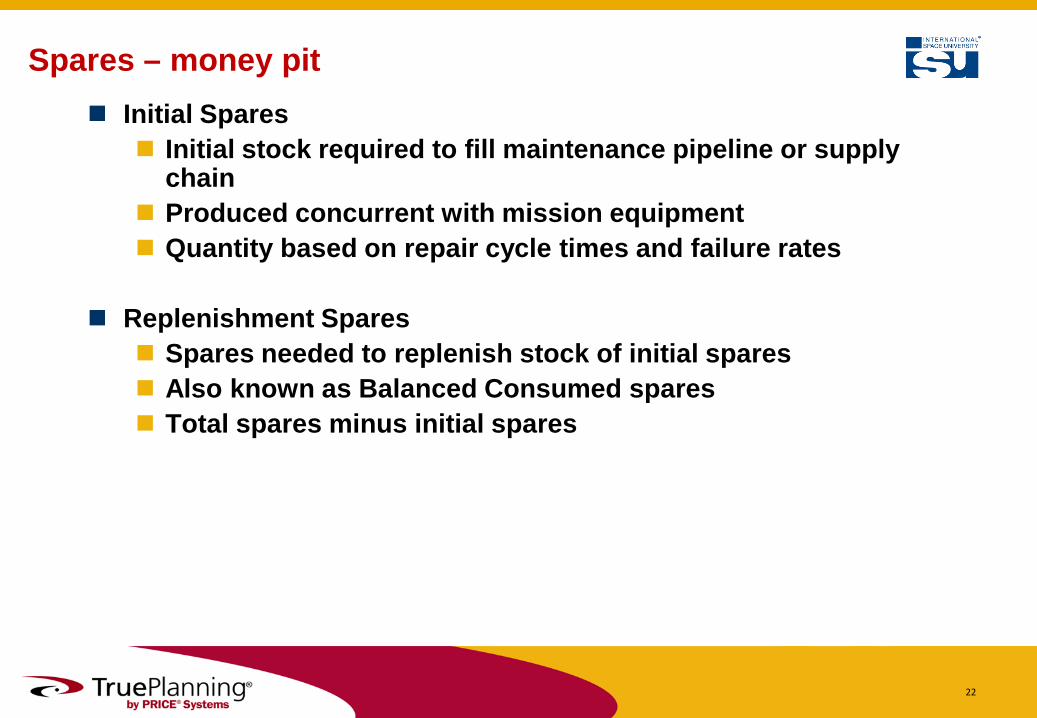
Spares – money pit Initial Spares
Initial stock required to fill maintenance pipeline or supply chain
Produced concurrent with mission equipment Quantity based on repair cycle times and failure rates
Replenishment Spares Spares needed to replenish stock of initial spares Also known as Balanced Consumed spares Total spares minus initial spares

23
OTHER CHALLENGING INFLUENCES

24
Two key Maintenance Drivers Scheduled or Preventative
For major platforms this is usually: Routine test, cleansing or POL changes 400/ 800 mandatory servicing (aero engines etc) Fatigue life replacements Fixed overhaul & upgrade cycles (ships/ submarines)
These are not dealt with in detail by commercial cost models and can be very large cost items
Unscheduled, this is dealt with and calculated in some detail by commercially available models: Driven by 3 key drivers
Maintenance Concept Mean Time Between Failures Mean Times to Repair
25
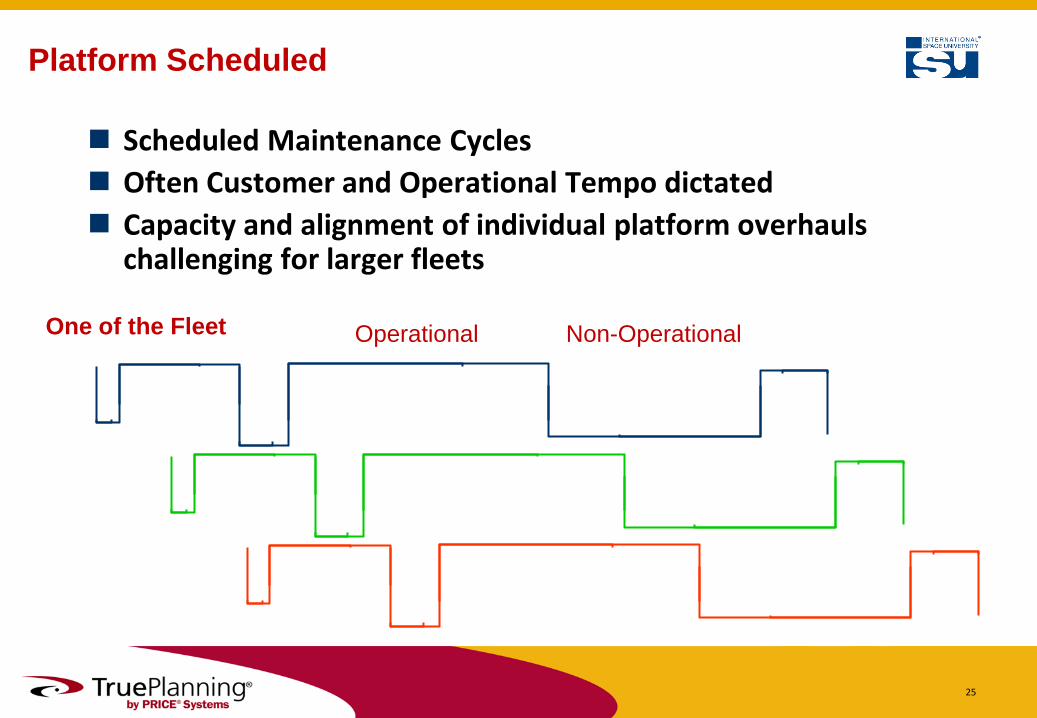
Platform Scheduled
Scheduled Maintenance Cycles Often Customer and Operational Tempo dictated Capacity and alignment of individual platform overhauls
challenging for larger fleets
Operational Non-Operational One of the Fleet
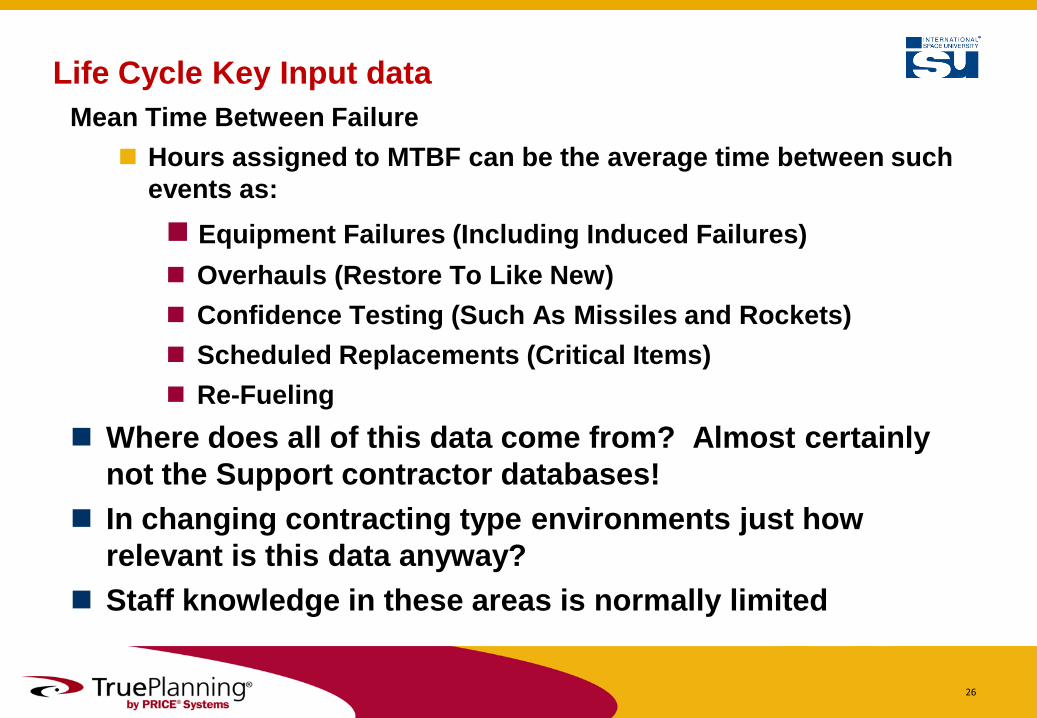
26
Life Cycle Key Input data Mean Time Between Failure
Hours assigned to MTBF can be the average time between such events as: Equipment Failures (Including Induced Failures) Overhauls (Restore To Like New) Confidence Testing (Such As Missiles and Rockets) Scheduled Replacements (Critical Items) Re-Fueling
Where does all of this data come from? Almost certainly not the Support contractor databases!
In changing contracting type environments just how relevant is this data anyway?
Staff knowledge in these areas is normally limited
27
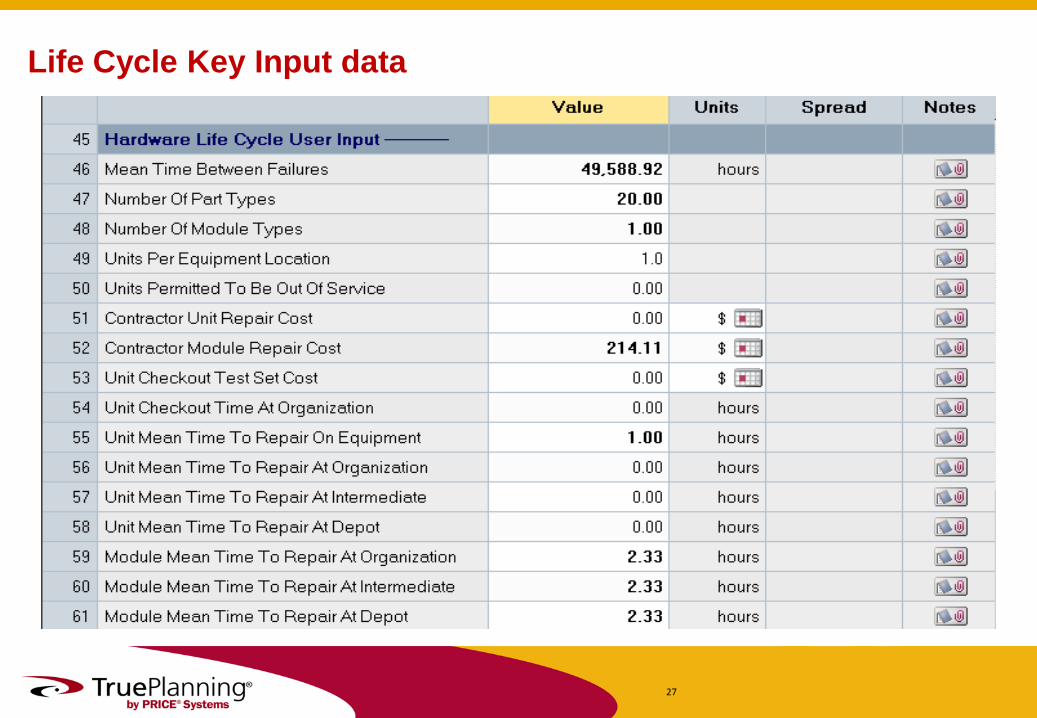
Life Cycle Key Input data
28
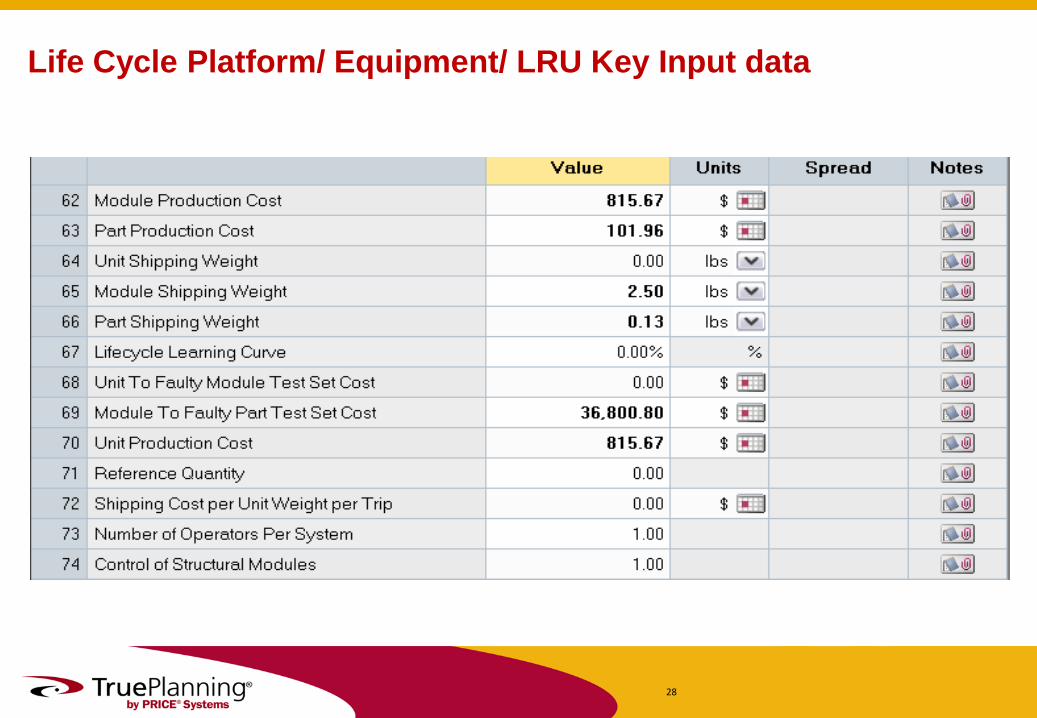
Life Cycle Platform/ Equipment/ LRU Key Input data
29
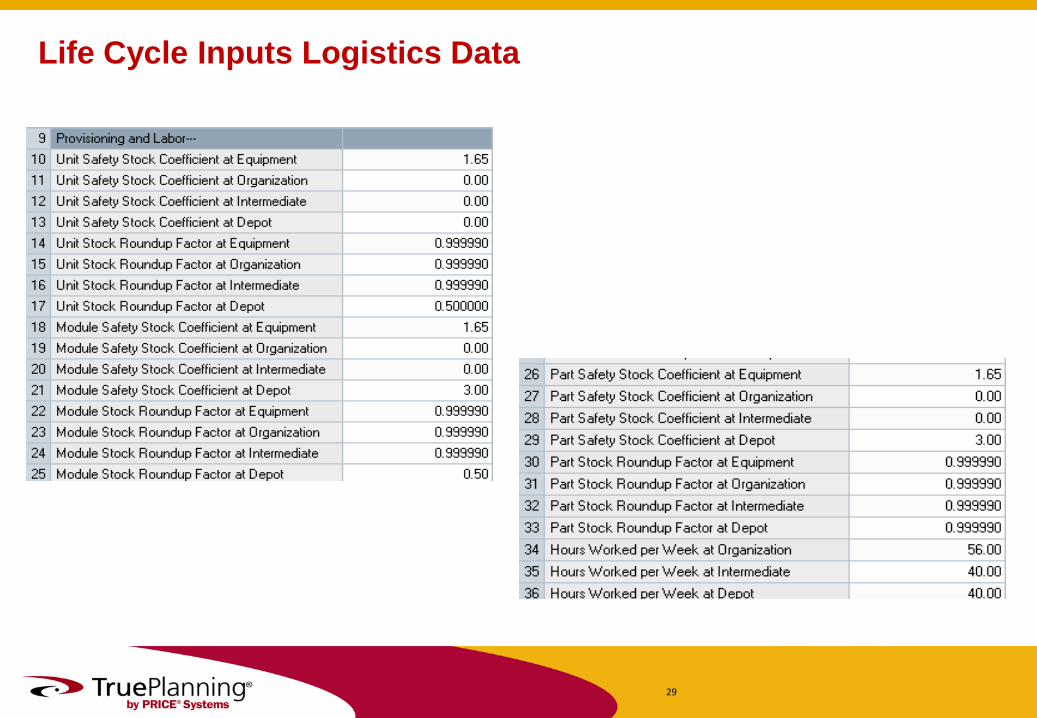
Life Cycle Inputs Logistics Data
30
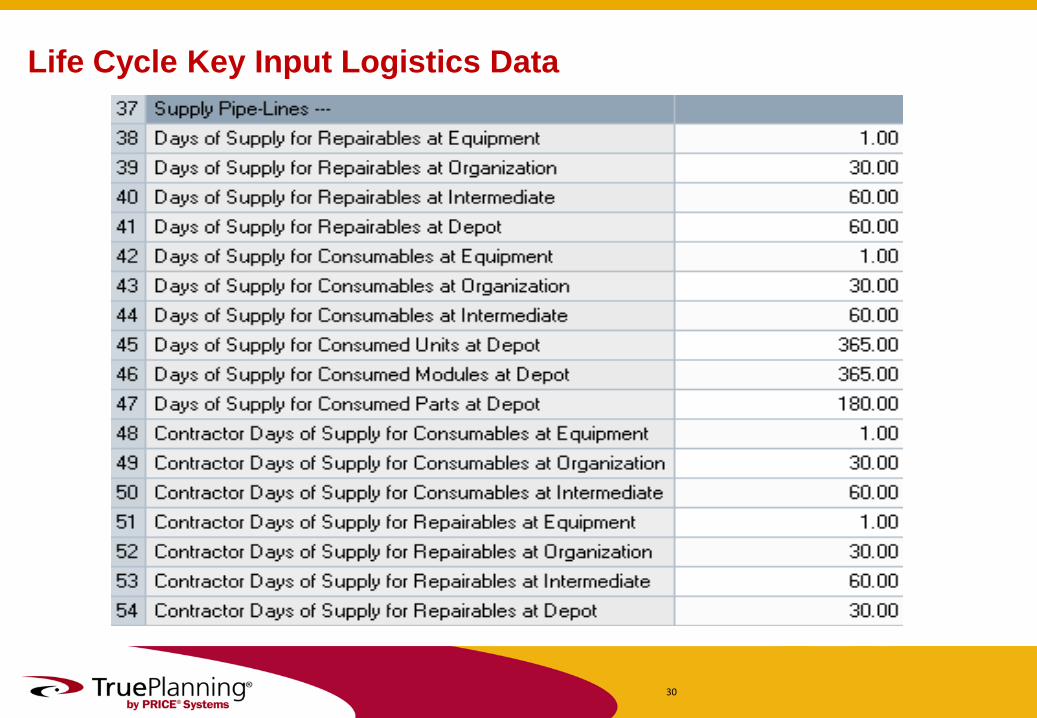
Life Cycle Key Input Logistics Data
31
Existing Platform/ System support
New contract types Transfer of risks from Customer to Provider AGE! (not PC but crucial)
Elements of O&S With Age Effects
It has been observed that there is an AGE effect in some elements of O&S costs, including: Scheduled Overhaul Repair Parts Other POL Centrally Provided Materials
The AGE effects in Scheduled Overhaul, Repair Parts, and Other POL were presented at SCEA in June 2003: Ship Scheduled Overhaul Costs Over Time, Summerville, Coleman, Dameron, Leach.
Since that paper was written there have been changes to the Scheduled OH, Repair Parts, and Other POL methodologies.
Another paper, presented since, at the 37th ADoDCAS, has also shown age effects in high-level O&S costs: Analysis of the Impact of OPTEMPO on Navy O&S Cost, Octeau, Hardin

33
AGE - Discovery of Overhaul Cycles
Cost vs. Avg. Age
$-
$2
$4
$6
$8
$10
$12
0.0 5.0 10.0 15.0 20.0 25.0 30.0
Avg. Age
Cost
(FY0
3$M
)CG 16CG 26CG 47DD 963DDG 51DDG 993FFG 7
The line is a 5th degree polynomial. The 2 peaks are believed to be caused by Navy policy - scheduled overhauls are set to be a given number of years apart.
1st overhaul
2nd/3rd overhaul – The steam ships may be on a different OH cycle. More data is
required to know if the steam ships have 2 or 3 overhauls in their lifetime.
34
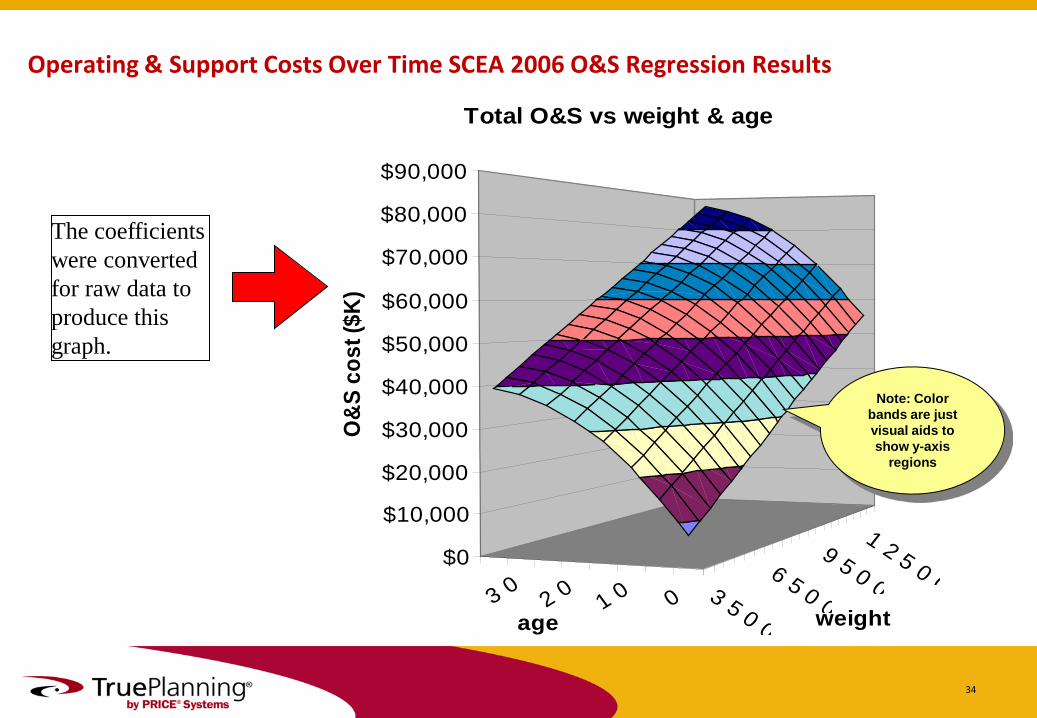
Operating & Support Costs Over Time SCEA 2006 O&S Regression Results
01 02 03 0 3 5 0 0
6 5 0 0
9 5 0 0
1 2 5 0 0$0
$10,000
$20,000
$30,000
$40,000
$50,000
$60,000
$70,000
$80,000
$90,000
O&S
cos
t ($K
)
age weight
Total O&S vs weight & age
The coefficients were converted for raw data to produce this graph.
Note: Color bands are just visual aids to show y-axis
regions

35
Finally…… One last subject which tends to be
glossed over!

Software Support
Software Support Cost for War Fighting Systems Increases with Size Increases if it is Safety Critical Decreases with Age –
Software Support for Non-War fighting Systems
Increases with Age Increases with the presence of Software Of Unknown Pedigree
(SOUP) Decreases if it’s a Training/Testing System
My (safe) bet is that no-one is collecting suitable metrics! Note: War Fighting software is software which would critically affect the
mission (e.g. terminate it if failed).

37
TOOLS

A general guide to Method Vs Phase
38
Analogy [near neighbour]
Parametric Top down or Bottom up
[Extrapolation From]
Actuals
Engineering [Bottom - Up]
Concept and Assessment
Development and
Demonstration
Manufacture and Entry Into
Service
In-Service Operation &
Support
Cost Forecasting Cost Estimating
Pre-concept
Note – the above is a guide, no tool is exclusive in a particular phase

39
Commercially Available tools CASA EDCAS OPUS OSCAM (Air/ Land/ Sea) PRICE SEER FACET
First three bullets are not parametric models, OSCAM is a ‘systems dynamics model, PRICE & SEER are parametric models and FACET is Bayesian.
They all do a job and require significant amounts of input data with the exception of FACET
They all have gaps in coverage so one or more may be needed with assistance from bespoke Excel models to achieve a complete predictive capability
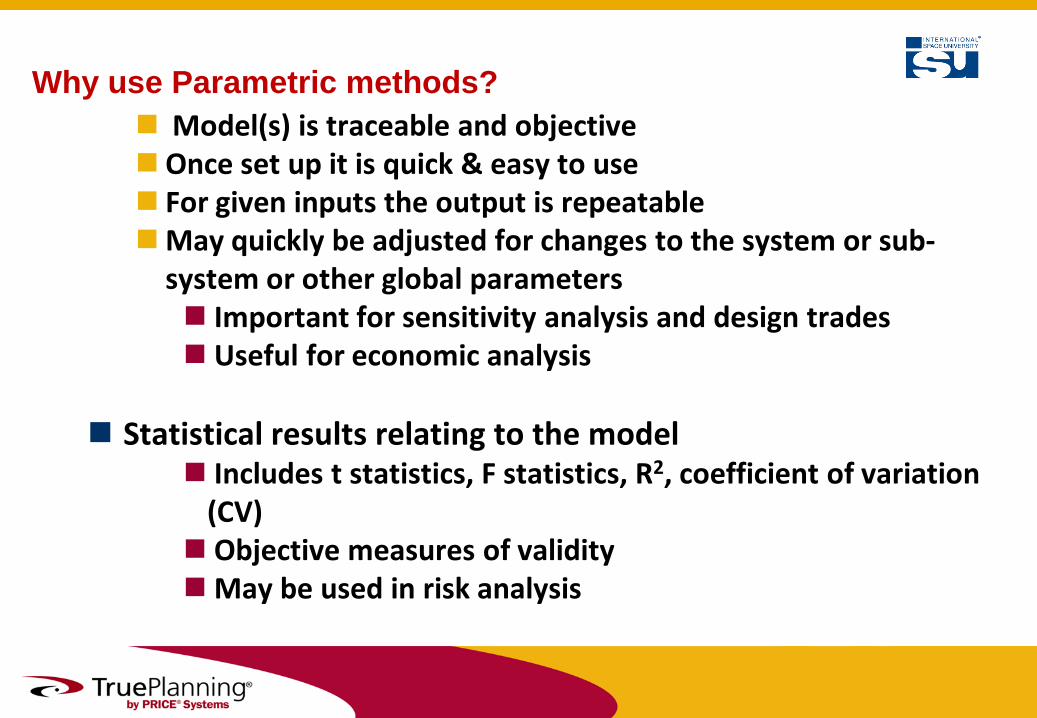
Why use Parametric methods? Model(s) is traceable and objective Once set up it is quick & easy to use For given inputs the output is repeatable May quickly be adjusted for changes to the system or sub-
system or other global parameters Important for sensitivity analysis and design trades Useful for economic analysis
Statistical results relating to the model
Includes t statistics, F statistics, R2, coefficient of variation (CV) Objective measures of validity May be used in risk analysis
41
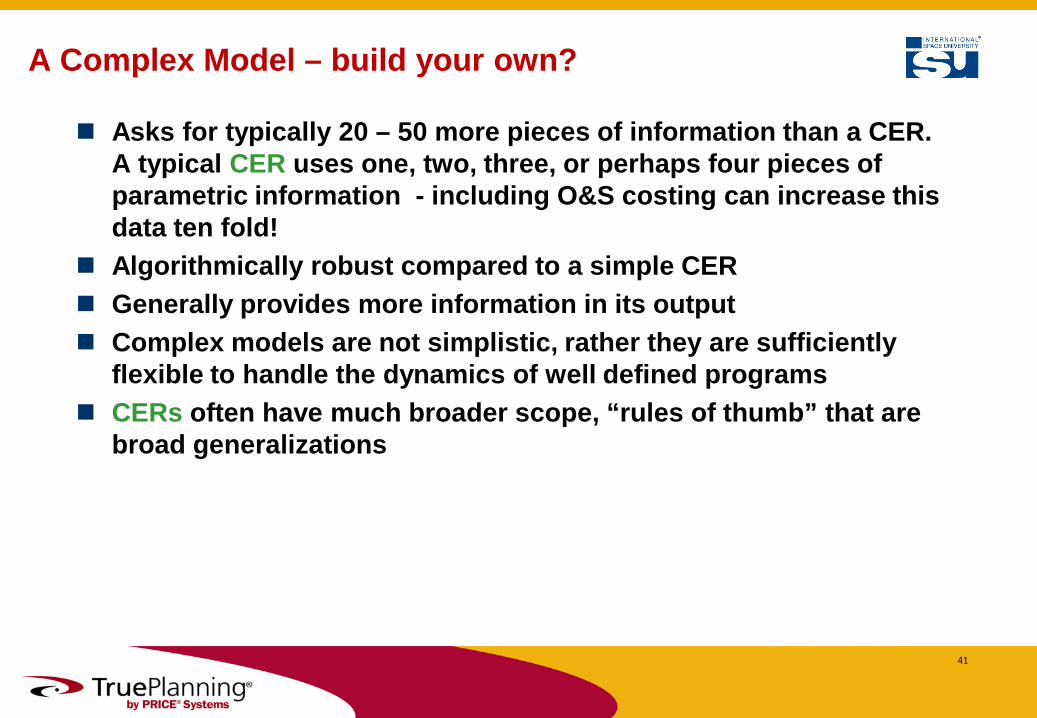
A Complex Model – build your own?
Asks for typically 20 – 50 more pieces of information than a CER. A typical CER uses one, two, three, or perhaps four pieces of parametric information - including O&S costing can increase this data ten fold!
Algorithmically robust compared to a simple CER Generally provides more information in its output Complex models are not simplistic, rather they are sufficiently
flexible to handle the dynamics of well defined programs CERs often have much broader scope, “rules of thumb” that are
broad generalizations
42
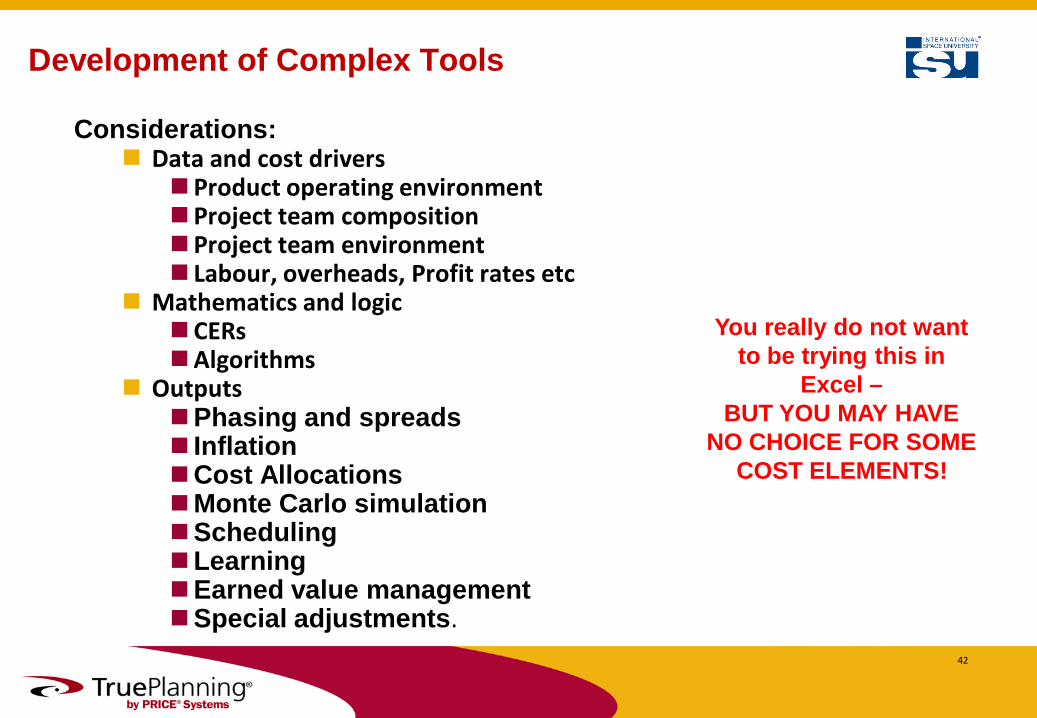
Development of Complex Tools
Considerations: Data and cost drivers
Product operating environment Project team composition Project team environment Labour, overheads, Profit rates etc
Mathematics and logic CERs Algorithms
Outputs Phasing and spreads Inflation Cost Allocations Monte Carlo simulation Scheduling Learning Earned value management Special adjustments.
You really do not want to be trying this in
Excel – BUT YOU MAY HAVE
NO CHOICE FOR SOME COST ELEMENTS!

43
SUMMARY
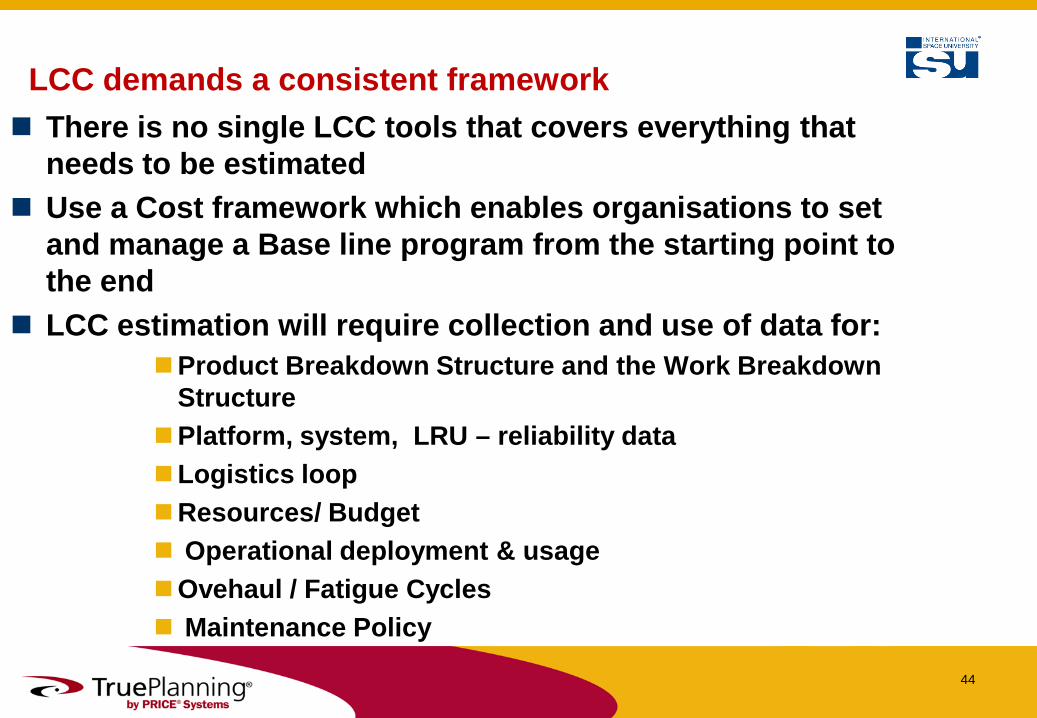
LCC demands a consistent framework There is no single LCC tools that covers everything that
needs to be estimated Use a Cost framework which enables organisations to set
and manage a Base line program from the starting point to the end
LCC estimation will require collection and use of data for: Product Breakdown Structure and the Work Breakdown
Structure Platform, system, LRU – reliability data Logistics loop Resources/ Budget Operational deployment & usage Ovehaul / Fatigue Cycles Maintenance Policy
44
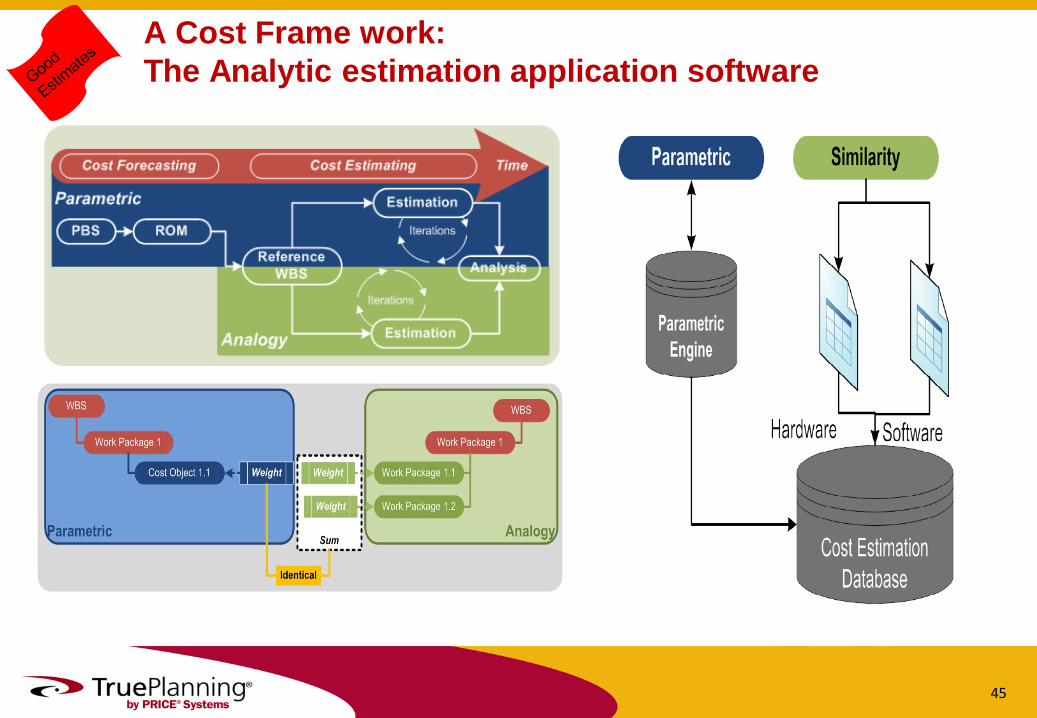
A Cost Frame work: The Analytic estimation application software
45

Any Questions?
Andy Nicholls Phone: +44 (0) 1256 760012 Mobile: +44 (0) 7500 866822
[email protected] [email protected]
PRICE Systems Ltd.
PRICE House, Meridian Office Park Osborn Way
Hook, Hampshire RG27 9JY
www.PRICESystems.co.uk
46


