Life Cycle Engineering in the Oil and Gas Industries, with Reference to Hydrodesulphurization of Gas Oil
Antonis C. Kokossis§, Feyi Thompson§, and Tapas K. Das§§
§ University of Surrey, Dept of Chemical and Process Engineering, Guildford, Surrey GU2 7XH, UK §§ Washington Department of Ecology, P.O. Box 47600, Olympia, WA 98504 USA
Key words: Life Cycle Analysis, Life Cycle Engineering, Hydrodesulphurization of Gas Oil
Submitted to Topical Conference: Sustainable Engineering, Paper # 5c, AIChE
Annual Proceedings, Austin, TX, November 7-12, 2004
§Author to whom correspondence should be addressed Email: [email protected] Tel: +44(0)1483876573, Fax: +44(0)1483876581
Introduction
The oil and gas industry was selected as a vehicle for studying Life Cycle
Engineering because of the breadth and complexity of this sector of industry.
Methods that work for the oil and gas industry will be generally applicable. It is
not possible for any single study to trace the whole production process from
cradle-to-grave. Modern developments in Life Cycle Analysis (LCA) thus
concentrate on an incremental approach. Each step of the production process
is analysed and the whole integrated to give a total life cycle impact. This
research project adopts the incremental approach. One process,
hydrodesulphurization of gas oil, is studied in detail. The research then
establishes how this study can be integrated with other similar studies to give
total life-cycle environmental impact.
There are sulfur impurities present in crude oil and natural gas. These
impurities need to be removed before the oil can be converted to useful
products such as fuel oil, motor oil, and petrochemicals. If they are not removed,
they will give acid gases upon combustion, will damage motor and industrial
catalysts, and are, themselves, very toxic. Thus, at some point in the refinery
operations, these sulfur impurities have to be extracted from the oil to produce
quality fuel oil products which have no major environmental impact. In principle,
the sulfur could be removed at any point in the life-cycle, from the wellhead to
the final product. In this limited study, we concentrate on one typical refinery
desulphurization process. In this case, a gas oil hydro finer process for treating
high-sulfur gas oil. The detailed life cycle engineering case study will then be
generalized to reflect the possible routes of waste minimization, sulfur reduction
and possible energy savings in the different stages of the processes involved in
the petroleum industry.
In the oil and gas industry, movement towards sustainability requires an
integrated approach to process/product design. Fossil fuel (crude oil), a non-
renewable reserve, extracted, processed and used by the petroleum industry
generally causes environmental problems from its extraction right through to the
production, consumption and final disposal or recycle (Finnegan 2002). It has
been established from statistics that carbon dioxide (CO2) is the predominant
substance released during the burning of these fossil fuels, one of the main
contributing factors to global warming (Besemer 2001). Other compounds such
as oxides of sulphur, nitrogen and methane are also emitted by the
petrochemical industries, which are contributors to acidification of rainwater and
global warming respectively, thus damaging the soil and depletion of the ozone
layer. Though it is generally known that carbon dioxide is the main hazardous
compound emitted by the petroleum industry, there are still scientific debates on
the certainty that the main cause of global warming is solely from anthropogenic
emissions of carbon dioxide (Zwick).
Despite this fact, there is a great dependence on these non-renewable
reserves now and in the future despite their harmful environmental effects. Data
according to ABB report, 2002 shows that presently 16% of electricity is
generated from renewable energy sources, which implies a larger amount, is
from the use of non-renewable resources. There is therefore an essential need
to shift from the use of non-renewable resources to a renewable energy supply
(Klass 2003).
For the purpose of this research therefore, the methods of environmental
critical assessment, process integration and eco-efficiency are adopted. These
are used to establish a cost and emission trade-off as well as to minimize capital
cost on utilities, and are the bases of the life cycle analysis/engineering tool.
Life Cycle Engineering Tools Life Cycle Engineering (LCE) takes into consideration the technical,
environmental and economic aspects of the life cycle of products and processes
with the use of LCA and life cycle cost (LCC) tools. According to Keys (1990),
“the principal unique aspect of life cycle engineering is that the complete life
cycle of the product is kept in consideration and treated in each phase of the
product development”.
LCE is a system-based tool and requires the evaluation of alternative products through decision support technology that is applied to determine best and most effective alternatives (Asiedu and Gu 1997).
The holistic nature of LCE enhances its use in the oil and gas industry,
taking into consideration the upstream and downstream processes as well as
the transportation and cost of the products and/or process. The products of the
oil and gas industries are varied and numerous and most are used in the
transport sector (as gasoline, diesel, petrol, engine oil and others) in heating and
electricity generation (EPA 1998) and in the chemical industry which consumes
most of the products. During the process of extraction, production, and
transportation of raw materials, by-products and products, there are emissions
involved that have negative impact environmentally, socially and economically.
Thus an inventory of the substances is necessary using life cycling
methodology.
Recently, petrochemical and petroleum companies, being also a
business enterprise, are developing new tools of assessing the environmental
impact of their processes and products, taking into consideration cost
effectiveness. The life cycle engineering methods permit technical, economic
and environmental analysis of processes, procedures and products and this is
used by some oil and gas industries to optimise their product and production.
One of the leading chemical and petrochemical companies utilizing the
life cycle engineering model is BASF that makes use of an Eco-efficiency
analysis model developed by the WBCSD, to evaluate its products and
processes. This idea by BASF is based on the fact that “to an increasing extent,
environmental aspects of economic activity are being ranked alongside the
financial issues” (Saling et al. 2002).
Tools and Models for Waste Minimization.
The tools of waste minimization as mentioned are varied in application.
However, newly developing approaches to life cycle analysis and engineering
involve the use of eco-efficient methodologies for the development of eco-
efficient products, processes and competitiveness. Also other environmental
models for product efficiency are being developed in the petroleum industries
Eco-Efficiency The principal approach of eco-efficiency is environmental and economic viability. Eco-Efficiency
Economic Impact Environmental Impact
The life cycle Eco-efficiency tool is designed to address not only strategic
issues, but issues posed by the market place, politics and research. It is based
on assessing environmental behaviour, environmental impact, possible impact
on human health and the Eco-system and on the cost of products and
processes from the cradle-to-grave” (Intl. J. LCA 2002).
‘The eco-efficiency tool is designed to promote improving both
environmental and economic performance at a company level by addressing the
whole life cycle of a product or process’. (Azapagic and Perden 2000). From the
view point of World Business Council for Sustainable Development (WBCSD),
“Eco-efficiency is reached by the delivery of competitively priced goods and
services that satisfy human needs and bring quality of life, while progressively
reducing ecological impact and resource intensity to a level at least in line with
the earth’s estimated carrying capacity”. (WBCSD Presentation 1995). However,
in most cases, Eco-efficiency is taken to mean “ecological optimisation of overall
systems while not disregarding economic factors” (von Weizsacker EU, Seiler-
Hausmann 1999). “It is expressed as the ratio of economic creation to
ecological destruction” (Hungerbuhler et al. 1999). Ciba Spezialitatenchemie,
also states that the improvement of purely ecological factors, for example better
utilization of resources through more efficient processes, is referred to as Eco-
efficiency. It is a useful model for comparing products and processes in terms of
their economic and environmental impacts, taking into consideration other
factors such as toxicity level of products, as well as risk factors of both products
and processes. This is to ensure the health and safety of workers and
consumers related to the products.
Oil and Gas Industry
The stages involved in the operations of crude oil processing can be
categorized into two main categories: the upstream and downstream processes
(Exxon Mobil 2002). The upstream side involves mainly the exploration and
production processes, while downstream aspects of the operation include the
refining, conversion, purification and distribution to end-users. Refining of crude
is the most energy intensive stage of the refinery operations and it is further
divided into other stages. Conversion, purification and separation are stages of
the petroleum refinery operations.
According to Wittcoff and Reuben (1996), about 90% of products in the
chemical industry and therefore for daily use originate from the petroleum and
natural gas industry. These products range from the heavy oil products to the
light gases. Statistics from Environmental Defence (1999) shows the distribution
of refinery products below.
Figure 1 - Distribution of Refinery products. Source: http://www.environmentaldefense.org/article.cfm?ContentID=1537
5%
4%
4%4%3% 0%
45%
21%
9%
3%1%
1%
Gasoline 45%
Distillate fuel oil (e.g., home heating oil, diesel) 21% Kerosene-type jet fuel 9% Residual fuel oil (e.g., industrial fuels) 5%
Liquefied petroleum gases (e.g., propane, butane) 4%
Still gas 4% Coke 4% Asphalt and road oil 3% Petrochemical feedstock 3% Lubricants 1% Other 1% Kerosene 0.5%
Oil and Gas impurities and Mitigation approaches
Considering the different emission reduction tools in use by the oil and
gas industry, this project focuses on the gas oil desulfurization process as it is
common knowledge that to a large extent, naturally occurring crude oil contains
an amount of sulphur compounds (Ukoli; CONCAWE report 1998). In the
extraction of crude oil, there are numerous organic compounds, which may
occur as impurities. Among these is the sulfur atom and its associated
compounds, nitrous oxides, particulates, and volatile organic compounds. These
sulphur compounds exist as hydrogen sulphide (H2S), elemental sulfur (S),
mercaptans (R-SH), sulphides (R-S-R’), disulphides (R-S-S-R’), cyclic sulphides
(S8), thiophenes, Benzothiophenes, Bibenzothiophenes (Pfeiffer 1975). During
the cracking and combustion of crude oil, these sulfur atoms undergo chemical
reactions and form sulfur dioxide (SO2), as well as other noxious and harmful
gases formed from the combustion of carbon, and nitrogen atoms, such as
carbon dioxide (CO2), carbon monoxide (CO), from incomplete combustion of
hydrocarbons), nitrogen oxide as well as methane gas, and particulate. As
discussed by van Ravenswaay, toxic these emissions arise at every stage of the
petroleum industry processing, from extraction to the use stage. These include
volatile organic compounds (VOC), carbon monoxide (CO), nitrogen oxide
(NOx), oxides of sulfur (SOx), particulate matter (PM) and hydrogen sulphide
(H2S) as well as other organic matter.
The effect of emission of these substances into the atmosphere has
detrimental impacts on humans and the environment if not treated before the
products leave the manufacturer’s gate. Some effects of pollutants include skin
cancer, breathing impediments, acidification of rainwater, mortality and many
other effects. (Kunzli et al. 2000).
Nevertheless, mitigation strategies are being developed to minimize the
concentration of these pollutant as well as other above-mentioned substances
as a result of strict legislations. (CONCAWE 1998). According to the CONCAWE
report, sulfur atoms and their compounds in crude oil leave the refinery either in
product form or are emitted to the atmosphere and these compounds are
released from a number of sources. This is illustrated in the figure below. This
sulfur undergoes combustion reaction to form oxides of sulfur, which have a
toxic negative impact on the environment (Nagpal and Sen 2002) causing acid
rain.
Figure 2: Sources of SO2 emission from refinery Source: CONCAWE report, 1998:
http://www.concawe.be/Download/Reports/Rpt_02-10.pdf
Flue gas desulphurization (Nagpal and Sen 2002), is an essential part of
the oil and gas purification process for gas oil products, which have uses in
diesel power engines, fuels for ethylene plants and other uses. Nagpal and Sen,
further discuss other methods of sulfur removal from crude oil.
Life Cycle Analysis and Responsible Care
Life cycle engineering, as earlier mentioned as an integrated approach to
waste minimization, is useful in the identification of areas of possible emission,
decision making on alternative steps of process and product design. This
environmental tool ensures a holistic approach to design including energy and
material balances of input and output resources.
The use of LCA in the petroleum/petrochemical industry has some
shortcomings in terms of costing and allocation of emission burdens to multiple
products and by-products. This is typical in the case of the multi-production
section of which the oil and gas industry is a major part. The products and by-
products of crude oil are varied and may be feed to other industrial
manufacturing sectors or may be used within the petroleum industry such as to
generate electricity and heat. In order to trace the life cycle of these products, a
continuous backward analysis needs to be undertaken to determine the feed
and product from other process steps as well as their corresponding impacts,
which is the essence of the cradle-to-grave nature of LCE. The case of the
production of low sulphur gas oil is an example in which the process results in
the production of desulfurized gas oil, naphtha products, fuel gas and hydrogen
sulphide; which is later sent to the Claus plant for sulphuric acid manufacture for
fertilizer and other chemical uses. Other products from the process include fuel
oil, used as diesel fuel. In summary, the process equation is as follows:
Gas oil desulphurization = fuel gas + Naphtha + Purified gas oil + Hydrogen sulphide
To conduct a life cycle engineering assessment of this simple process,
information on the emission, energy use in the crude oil extraction and
transportation processes are needed as well as the potential uses of the
products, up to their disposal stage.
Eco-Efficiency Methodology
This analysis compares alternatives by considering both the environmental
profile and the economic cost of the process. It provides a series of ways of
visualising the relative impact and cost, so that the best compromise is
achieved. BASF has utilized this tool on a number of its products with a
published case study of indigo dye manufacturing process.
The first step to the use of this methodology is the generation of realistic
alternative options of processes or products.
The second step in Eco-efficiency analysis is the determination of
environmental impact of the various alternatives and the calculation of these
impacts based on the International Standardization Organization (ISO 14040).
Environmental impacts are determined on the basis of 5 main aspects. These
include:
Raw material consumption
Energy consumption
Toxicity potential
Abuse and risk factor
Resulting emissions
The emissions considered are:
- Emission to land
- Emission to air and
- Emission to water.
These aspects are tackled individually to analyze the effect of each product and
process on the environment, which will assist in deciding the optimum option.
Environmental Impact
The emissions to air, land (soil) and water are determined individually and the
results for each are aggregated following normalization to obtain the ecological
fingerprint. The emission potential of a substance to air is assessed following
an inventory analysis of the various substances and the impact affected. These
inventories are categorized in a tabular form with the calculated impact
categories. The categories are the global warming potential (GWP), ozone
depletion potential (ODP), photochemical ozone creation potential (POCP),
acidification potential (AP).
Table 1 - Impact potential for air emissions
Factors
Categories
GWP (g) ODP(g) POCP(g) AP(g)
CO2 1
SO2 1
NOx 07
CH4 0.009 0.007
HC 0.000022 1 0.416
NH3 0.0037 1.88
N2O
HCL 0.88
HF 1.2 Source: International LCA Journal, 2002 (BASF report pg. 4) http://www.basf.de/basf/img/umwelt/oeko/LCA_2002_OnlineFirst_Saling.pdf?id=*C2yHMo**bsf9
00
CO2 is carbon dioxide, SO2 is sulfur dioxide, HC is hydrocarbons, N2O is
nitrous oxide, HF is hydrogen fluoride, NOx is oxide of nitrogen.
The values obtained each are plotted graphically for the various alternatives.
This gives a picture of the process with the highest potential emission hazard for
a particular factor, for example CO2.
The emission to water is determined from the inventory use of chemical
oxygen demand (COD), biological oxygen demand (BOD), the compounds of
ammonia, hydrocarbons, phosphate, absorbable organic halogens, and heavy
metals. The extent to which each of these compounds contaminates surface
water is evaluated using the critical volume for discharge to surface water. The
regulation on discharge of wastewater into surface water is used to determine
the limit of surface water contamination. Each of the alternative options has
varied potential of emitting the above listed compounds to water, and it is the
extent to which these compounds are present in the alternative and the ability to
contaminate water, that is calculated. Also 1the amount of clean water needed
to dilute the contaminated water back to the acceptable limit is estimated. The
larger the hazard caused by a compound, the lesser its limit. These limits are
then expressed as reciprocals to ensure that the most problematic contributor is
given a large critical value, expressing this fact.
Table 2 - Potential Impact for emission to water
Limit Factor (1/limit)
COD 75 .013
BOD 15 0.067
N-tot 18 .056
NH4+ 10 0.1
P-tot 1 1
AOX 1 1
HMs 1 1
HC 2 0.5
SO4- 1000 0.001
Cl- 1000 0.01 Source: International LCA journal LCA, 2002 (BASF report, pg. 5)
The sums of these emissions are calculated to arrive at a total emission
value that is then normalized. Determination of the product or process with the
most emission to water is determined easily from a graphical plot of the impact
to water of the individual alternatives.
1 COD is chemical oxygen demand, BOD is biological oxygen demand, N-tot is total nitrogen
The potential impact of the various products to soil is estimated from the
average cost of waste disposal and these wastes are categorized into 3
aspects: Special waste, building material waste and domestic waste. The costs
for the disposal of the various categories are calculated and factored. The
values obtained are combined to determine the contributing factor of each
alternative.
Material consumption needed for the processes or products are obtained
by inventory analysis. This results in the weighting (scientifically and socially) of
the various identified materials based on their reserves i.e. the length of time a
particular raw material will be productive considering the present economic
methods. It is on the basis of these reserves that estimation of the factors for
each material inventory of product and processes are made.
The chemical industry uses the classification and labelling guidelines of
the German Chemical Act to determine the toxicity potential of alternatives
under consideration, in which each product to be calculated is balanced from the
cradle to grave. The toxicity of a particular product is labelled using hazard
symbols with arithmetic factors based on a logarithmic scaling LD50 (lethal dose
at 50% mortality). As with the other impact evaluations, the individual processes
are tackled separately and weighting is done on various toxicity factors. Cases
where there are direct contacts and impacts on humans are given more
attention as opposed to those in which humans have limited exposure. The
potential of the alternative products/processes is also displayed graphically to
determine the most toxic substance to humans.
Energy consideration is factored in for the entire life of the products and
processes. Each of the different sectors such as steam generation, are
evaluated on the basis of energy consumption for each alternative considered.
The aggregate of the various energy uses is then normalized with respect to the
others resulting in the least favorable alternative having the highest value of
one.
The abuse and risk potential of environmental impact is based on
probability of occurrence of risk from the extraction through the transportation to
the recycle or disposal stage. Information on this is obtained from workplace
statistics of accidents from the insurance companies.
The information obtained from the environmental impact of the various
alternatives is combined following scientific and social weighting, coupled with
normalization. The result is represented on an ecological fingerprint. This plot
shows the ecologically sound alternatives to consider, points out the least
environmentally Eco-efficient alternative and displaces areas where necessary
optimization is needed for a better product. A typical ecological fingerprint is
shown below:
Figure 3 - Ecological fingerprint of various alternatives
Sources: International LCA Journal, 2002 (BASF website, 2002)
The pentagonal shape of the fingerprint is drawn in 3 dimensions to
represent the 5 environmental impact considerations and each of these is
independent of the other. An alternative with a value of one for a particular
impact is least favorable while that with zero is the most eco-efficient
product/process. The goal of all petrochemical companies is to tend towards
the centre with ZERO environmental impact.
Economic Impact
The ecological operational and capital costs and total cost of the
alternative products are calculated based on real cost data. This gives the
overall cost. For a comprehensive representation of the most eco-efficient
product, the ‘Eco-Efficiency Portfolio’ model was adopted, which displays the
environmental as well as economic potential of each system, product or process
on an x/y graph. The most Eco-efficient process or product is situated on the
upper right hand side with the lowest total cost and lowest environmental
impact. The adoption of the diagram plot with point (0, 0) on the top right-hand
corner, does not give a comprehensive illustration, therefore, the point (0, 0) at
the bottom left-hand side of the Cartesian co-ordinate system is used in this
study. An illustrative example is given below.
Emissions (tonne/yr)
* * * *
* * * * * * * * * * * * * 0 Total Cost [$/yr.]
Figure 4 - Environmental Envelope of Emission vs. Total cost Source: BASF in North America, 2002. (http://www.basf.com/newsinfo/pdffiles/EcoEfficiency.pdf)
This is a hypothetical “Pareto curve”, in with points generated at the top
right-hand corner are feasible options, and can be modified towards the lower
left-hand corner. However, below this line, are infeasible points because no
other point can be better that the Pareto optimum. Furthermore, the eco-
efficiency tool has no methodology for computing the Pareto line, but from the
generation of alternative processes, it is possible to identify the most feasible
path of the curve.
Modification of the points and curve obtained results in the identification
of processes with low environmental impact and high profits. There is the
possibility of designs that lie on the curve with improved economic and
environmental performance. However, a point on the line, with better economic
impact cannot be further improved without possible detrimental effect on the
environmental impact, thus, the need for an established trade-off between the
impact factors.
Therefore, it is the goal to identify a design that lies on or close to the line
and the location of this line is determined to a large extent by compromise
between environmental impacts and economic profit. A high economic priority
design will cause the line to lie towards the right-hand curve, while high
environmental priority design results in the curve tending towards the left-hand
corner of the plot.
Central to the success of any eco-efficiency study, is the ability to
generate feasible designs in order to determine a design close to the Pareto
curve. The next section describes how the points on the eco-efficiency diagram
can be generated and possible ways that the Pareto curve might be computed.
Model Description and Development: Hydro-desulphurization of Gas Oil Process
The hydro-desulphurisation process, sometimes the fourth stage of crude
oil manufacture from raw material, is an essential part of the supply chain of the
petroleum industry. This is a process whereby sulphur compounds in all its
forms are removed from the products of crude oil distillation process, with the
use of gas fuel, with a high percentage of hydrogen and an amine compound.
This occurs in a two-stage process. In the first stage, sulphur in the crude oil is
converted into hydrogen sulphide by the reaction with the high content hydrogen
gas. The second stage is the removal of the hydrogen sulphide from the
hydrocarbon mixture by the use of an amine compound. These amine
compounds may include mono-ethanolamine, di-ethanolamine or tri-
ethanolamine. The reaction takes place in the presence of a catalyst, which
breaks down the bond between the carbon and sulphur atoms of the fuel.
The model used for this research work is based on an existing refinery
process of the Gas Oil hydro finer for the removal of sulphur and its compounds
from the gas oil feed. The original model design was part of an undergraduate
design project. The gas oil feed has 1.0 %wt sulfur content with the aim to
reduce this to 0.05 %wt sulfur gas oil content. The processes of
desulphurization consist essentially of two sections:
• The Reaction section
• The stripping section
The reaction section involves the hydro treating of the gas oil mixture with a
rich treat gas feed, while the stripping section deals with the separation of oil
and gas mixtures resulting from the treatment with an alkaline.
The hydro finer process has two main feed streams, the high sulfur
content gas oil feed and the treat gas feed. This treat gas has a high hydrogen
content to desulfurize the gas oil feed. This feed gas comes in at a temperature
of about 43°C and is preheated to 112.5°C, by two condensers and two heat
exchangers. The gas oil feed exits the fourth side-stream of the crude oil
distillation column at a temperature of 88°C, and it then undergoes through two
heat exchangers, the first at 240°C and the second at 270°C. This is followed
by heating from a fire heater, which operates at 300°C. The heated gas oil feed
is then mixed with the preheated treat gas and both are reacted in the reactor at
292°C.
The reaction is endothermic in the presence of a cobalt molybdenum
catalyst, with high to medium desulfurization potential. The chemical reaction is
shown below. The desulphurization reaction occurs in the reactor with most of
the carbon-sulphur broken to for hydrogen sulphide. The reactor products are
then cooled by counter current heat exchangers to 270°C at which temperature
they enter the hot flash drum. The liquid and gas products from the reactor are
separated in this column at the same temperature. Two other heat exchangers
and a small air cooler cools the gas phase before entering the second flash
drum at a lower temperature of 38 °C. Most of the hydrogen sulphides are
contained in this tail gas, which are routed to the amine scrubber. This strips the
hydrogen sulfide from the treat gas. The later is then recycled back into the
process.
The liquid phase from the flash drum flows to the distillation column in the
presence of steam at 200°C. The gas oil product is then separated from the
light gases. Some naphtha products are produced from this column at 38°C.
The liquid phase of low content sulphur is cooled to 90°C where another flash
drum separates the liquefied gas oil product with 0.05 %wt sulfur from the other
naphtha product at 38°C.
The amine used in this model is mono-ethanolamine and this absorbs the
hydrogen sulfide in the scrubber and is removed from the system. The sulphide
is routed to the Claus plant, which is not included in this model.
This model desulfurization plant operates for 8,760 hr/yr and the annual
production for the products are as follow:
1. Gas oil = 1,601,958 ton/yr
2. Wild naphtha = 5416 ton/yr
3. fuel gas = 59,635 ton/yr
Also the costs of products are as follows:
Table 3 - Product and feed costs
Feed and product Price (US$)
Hydro fined Gas oil Product $230 per tonnes
Wild Naphtha $240 per tonnes
Fuel gas $120 per tonnes
Gas oil feed $215 per tonnes
Treat gas feed $150 per tonnes
Results and Data Analysis
This section gives the results in three parts with an overall analysis of the
life cycle engineering of the hydro-treating process of the oil and gas industry.
The stepwise results from the process simulations are presented
illustrating a comparison with the base case. This is used in the eco-efficiency
plot from which it is possible to select a process design, demonstrating the
“best” compromise between cost and emission.
The environmental impact of the process is then analysed with the use of
the stream data and critical assessment forms. This shows the environmental
areas of concern as well as the mitigation suggestions for consideration and
possible benefits.
The energy and cost conservation analysis, using the pinch analysis is
illustrated to demonstrate ways of minimizing energy use by maximizing heat
recovery which result in the modification for use of minimum number of heat
exchanger network, thus reducing cost. The comparison is made with respect to
the base case.
The overall analysis and correlation of all the tools used is summarized
and analyzed, to show the relevance and correlation of the use of these tools in
the industrial sector of concern.
Process Simulation
The process of simulating the gas oil hydro finer model was conducted on
a knowledge basis i.e., physical condition changes were made to the process to
generate possible alternative designs based on different alterations.
The base case consists of two inlet streams, each has life cycle costs
from the process prior to the desulphurization process. Calculations of the cost
of the feed streams are based on the individual mass flow rates and the cost per
tonne of feed. The calculations are as follows:
Cost of gas oil feed = $ 215/tonne
Cost of treat gas feed = $ 150/tonne
Mass flow rate of gas oil = 203814.517 Kg/hr
Mass flow rate of treat gas = 9360.892 Kg/hr
∴Cost of gas oil feed = $215/tonne * 203.8145 tonne/hr * 7440hr/yr
= $ 326,021,674/yr
∴Cost of treat gas = $ 150/tonne * 9.36089 tonne/hr *7440 hr/yr
= $ 10,446,755.6 /yr
Total feed cost = $ 336,468,429.8/yr
The energy cost used in the running of the plant includes electricity and
steam cost at $58.1 MWh and $ 12.1/ tonne respectively (obtained from gas oil
hydro finer process description). These are used as utilities in the operation of
the compressors, fire heater, pumps and boilers. The cost allocation to each of
this equipment is based on the heat loads. The life cycle cost is as follows:
Electricity cost = $58.1 MWh
Steam cost = $ 12.1/ tonne
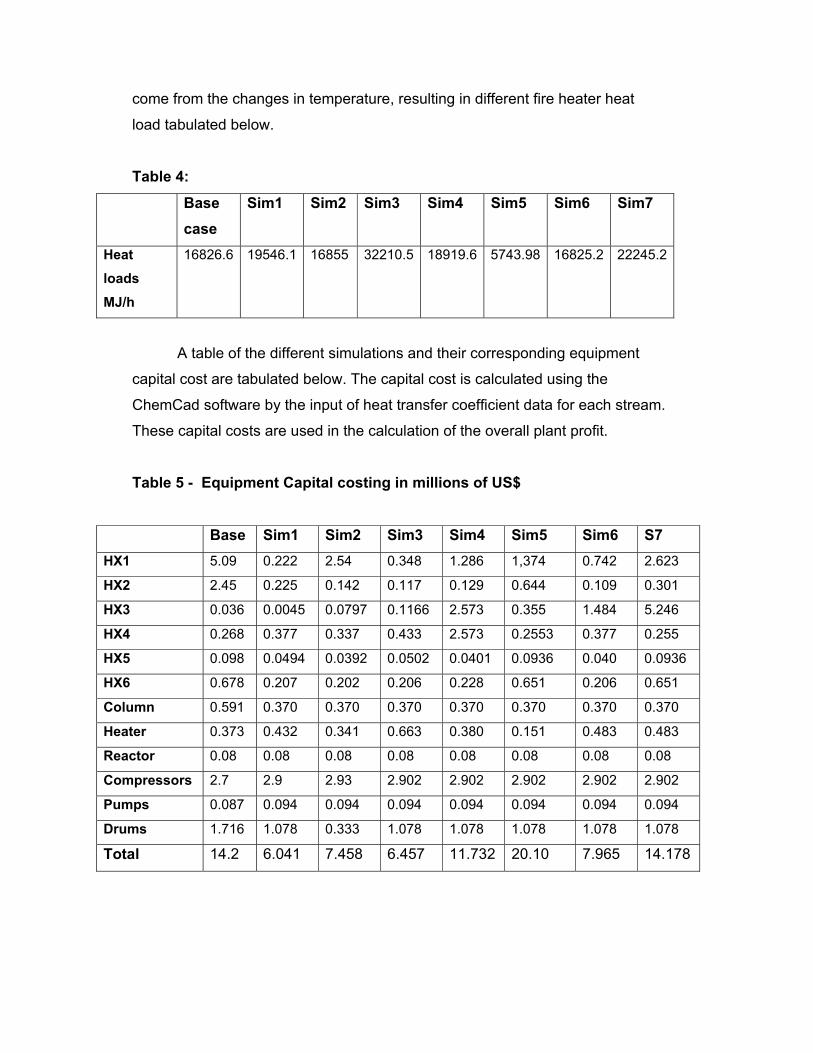
There were a total of 7 simulations excluding the base case. These
resulted in changes in energy use as well as cost of equipment. The alterations
come from the changes in temperature, resulting in different fire heater heat
load tabulated below.
Table 4:
Base case
Sim1 Sim2 Sim3 Sim4 Sim5 Sim6 Sim7
Heat loads MJ/h
16826.6 19546.1 16855 32210.5 18919.6 5743.98 16825.2 22245.2
A table of the different simulations and their corresponding equipment
capital cost are tabulated below. The capital cost is calculated using the
ChemCad software by the input of heat transfer coefficient data for each stream.
These capital costs are used in the calculation of the overall plant profit.
Table 5 - Equipment Capital costing in millions of US$
Base Sim1 Sim2 Sim3 Sim4 Sim5 Sim6 S7 HX1 5.09 0.222 2.54 0.348 1.286 1,374 0.742 2.623
HX2 2.45 0.225 0.142 0.117 0.129 0.644 0.109 0.301
HX3 0.036 0.0045 0.0797 0.1166 2.573 0.355 1.484 5.246
HX4 0.268 0.377 0.337 0.433 2.573 0.2553 0.377 0.255
HX5 0.098 0.0494 0.0392 0.0502 0.0401 0.0936 0.040 0.0936
HX6 0.678 0.207 0.202 0.206 0.228 0.651 0.206 0.651
Column 0.591 0.370 0.370 0.370 0.370 0.370 0.370 0.370
Heater 0.373 0.432 0.341 0.663 0.380 0.151 0.483 0.483
Reactor 0.08 0.08 0.08 0.08 0.08 0.08 0.08 0.08
Compressors 2.7 2.9 2.93 2.902 2.902 2.902 2.902 2.902
Pumps 0.087 0.094 0.094 0.094 0.094 0.094 0.094 0.094
Drums 1.716 1.078 0.333 1.078 1.078 1.078 1.078 1.078
Total 14.2 6.041 7.458 6.457 11.732 20.10 7.965 14.178
The costs of the different product streams are also taken into
consideration. The product streams include the desulfurized gas oil, fuel gas, as
well as some wild naphtha products.
The production rate of gas oil is estimated at 1,601,958 tonnes per year
at a value of $230 per tonne. The wild naphtha product is at the rate of 5416
tonnes per year while the fuel gas is at 59,879 tonnes per year. Therefore, the
total amounts of product taken into consideration are as follows:
Cost of gas oil per year = 1601958 tonnes/yr. * $230/tonne
= $ 368,450,340/yr
Cost of Wild Naphtha per year = 5416 tonnes * $240/ tonne
= $ 1299, 840/ yr.
Cost of Fuel gas = 59879 tonnes/yr. * $ 120 tonnes
= $ 7,185,480/ yr.
Each of these products has environmental emission potentials and this
has to be taken into consideration in the life cycle of the process. This study
looks mainly at the environmental impact of producing the products, while the
estimation of the cost of the product is done by the end users. Therefore, for the
users to conduct environmental impact estimation; values from this study are
adopted.
The emissions taken into consideration are the carbon dioxide, sulphur
dioxide, hydrogen sulphide emissions, and monoethanolamine. The life cycle
costs of these pollutants are calculated based on the amount of tonnage of
gases emitted during the use of electricity and steam in the equipment. These
calculations are carried out for all the simulations that follow as well as the
individual heat loads for potential emission area. These heat loads are obtained
from the ChemCad simulation process and Table 6 gives the different alteration.
Table 6 - Table of heat loads for potential emission areas for the different simulations
Compressor 1 Compressor 2 Heater Pump1 Pump2 Boiler Base case 578336.31 1717619.6 16826599.4 876658. 202438 1938 Sim1 (KJ/hr) 578336.31 1717536.1 19546400 8766568 202438 1938 Sim2 (KJ/hr) 578336.31 5144090 16855000 8766568 202438 1938 Sim3 (KJ/hr) 578336.31 171238.25 32210500 8766568 202438 1938 Sim4 (KJ/hr) 578336.31 1717536.1 18919600 8766568 202438 1938 Sim5 (KJ/hr) 578336.31 2451457.1 5743980 8766568 202438 1938 Sim6 (KJ/hr) 578336.31 2451457.1 16825200 8766568 202438 1938 Sim7 (KJ/hr) 578336.31 2451457.1 22245200 8766568 202438 1938
Assuming the use of a 16-carbon hydrocarbon as fuel for the running of this
equipment, the amount of CO2 found in a kilogram of combustion fuel is
determined from the molar equations.
C16H34 + 23/2O2 → 16 CO2 + 17 H2O ∆ Hc = -4.587*104 KJ/Kg
This implies 1nKg of the hydrocarbon => 16nKg of CO2
i.e. 226 Kg C16H34 => 704 Kg CO2 in the fraction 3.115
Therefore the amount of CO2 in the fuel = 1 ÷ 4.587E-4 Kg/KJ * 3.115
= 0.0679 Kg of CO2/ KJ of fuel.
It is assumed that the compressors have 70% efficiency. Therefore the amount
of CO2 per KJ of fuel would be 100/70 * 0.0679 Kg of CO2 = 0.097 Kg of CO2/KJ
of fuel.
For the emission of SO2 resulting from the conversion of elemental sulfur to its
oxide, the quantity is calculated. From literature, the gas oil feed has 1 %wt
sulfur content. Therefore, there is 0.01 Kg of sulfur per Kg of gas oil
The mass flow rate of the gas oil is 203814.5Kg/hr, which gives 2038.1 Kg of
Sulfur.
A 1:2 ratio exists between sulphur and sulphur dioxide considering the equation:
S (g) + O2 (g) SO2 (g)
32 Kg of S gives 64 Kg of SO2
=> 2038.1 Kg of S = 4076.3 Kg of SO2
∴ The ratio of SO2 to fuel is 1:50 = 0.02
Heat of combustion of the fuel is 4.587E4
The Kg of SO2 per KJ of fuel therefore is 1 ÷4.587E4 Kg/KJ * 0.02
This gives = 4.36 E-7 Kg of SO2 per KJ of fuel.
Monoethanolamine (MEA) losses are based on the amount of the difference in
inlet and outlet flow rate from the process, which is 356.444 tonnes of MEA per
year.
Hydrogen sulphide quantities are calculated from the molecular weight of the
compound and the heat of combustion of the 16-carbon atom fuel at –4.587 exp
4 KJ/Kg.
Molecular weight of H2S = 34 Kg/mol
226 Kg of C16H33S => 34 Kg H2S
34 / 226 = 0.15
1 / 4.587exp 4 *0.15 = 3.27 exp –6 Kg of H2S per KJ of fuel
Assuming a 70% efficiency of compressors, the amount of H2S per Kg of
fuel would be 3.27 exp –6 Kg/KJ * (100 /70)
= 4.67 exp –6 Kg of H2S per KJ of fuel.
Results for the emission of CO2, H2S, SO2 and Monoethanolamine are tabulated
below:
Table 7 - Emission losses from the different simulations
Base
case
Sim1 Sim2 Sim3 Sim4 Sim5 Sim6 Sim7 Total
CO2 1960.9 2681.1 2830.9 3541.0 2638.6 1743.9 2496.4 2864.37 21,292.8
SO2 1.26 1.58 1.47 2.13 1.54 0.77 1.25 1.49 11.49
MEA 356.44 356.44 356.44 356.44 356.44 356.44 356.44 356.44 2851.55
H2S 0.11 0.103 0.111 0.15 0.10 0.06 0.09 0.112 0.84
This gives the total emission of each simulation in tonnage per year.
The major emission from the overall simulation processes and thus the highest
pollutant of the process can be determined and compared graphically.
0.00
10,000.00
20,000.00
30,000.00
Tota
l em
issi
ons
in
tonn
es
Emission types
Comparson of emission from gas oil process
Series1 21,292. 0.84 11.49 2851.5CO2 H2S SO2 MEA
Figure 5 - Emission comparison from gas oil processes
Efficiency Envelope
The establishment of a trade-off between the emission cost and profit
assist in the decision making process as a tool in the petroleum and
petrochemical industry. This entails the use of the life cycle engineering, eco-
efficiency tool.
In the calculation of the profit made from the process, the feed, utility and
capital costs are deducted from the total profit cost. For the calculation of the
capital cost, the equipment costs are taken into consideration excluding the
labor cost, taxes and other miscellaneous costs, because that in the analysis of
the emission impacts of a process, these costs, which are constant, do not have
significant impact on the environmental and total profit trade-off.
In the calculation of the total profit, the equation used is:
Total profit = totals product value – raw material cost – 0.2 (capital cost)
The capital costs are annualized with the multiplication of the factor 0.2, which
can be computed using discounted cash flow. This cost is based on the
equipment costing shown in table 6 above, which does not include the discount
factor. Table 9 below gives the annualized values for the capital costs, which are
also based on the equipment costing shown in table 6 above multiplied by the
discount factor of 0.2, i.e. (0.2 * equipment capital cost).
Table 8 - Annualised capital cost values
Base case
Sim1 Sim2 Sim3 Sim4 Sim5 Sim6 Sim7
Cost (Million US$)
2.840 1.208 1.492 1.407 1.907 1.546 1.593 2.836
Operating cost for the process analyses includes the utility cost and the
feed cost. Maintenance costs are not taken into consideration in this study. The
feed costs are calculated in page 45 for the gas oil and treat gas feed, at a total
cost of $336,468,429.8/yr for each of the seven simulations, as they have the
same feed streams at equal flow rates.
Also the calculation for utilities at $ 58.1/MWh and $12.1/tonne for
electricity and steam respectively, for each simulation are given earlier.
However, the overall results from the calculation are as follows:
Table 9 - Utility Costs per annum (Million US$) for the different simulations
Base case
Sim1 Sim2 Sim3 Sim4 Sim5 Sim6 Sim7
Electricity $3.608 $3.992 $4.095 $5.778 $3.903 $2.045 $3.608 $4.344
Steam $0.458 $0.458 $0.458 $0.458 $0.458 $0.458 $0.458 $0.458
Total $4.067 $4.450 $4.554 $6.236 $4.361 $2.962 $4.066 $4.805
Therefore total operating cost for the process is the sum of the feed cost and the
above utility costs to give the figures in Table 10.
Table 10 - Total Operating Cost
Operating Costs
(US$)
Base
Case
340,535,185/yr
Sim1 340,918,703/yr
Sim2 340,022,147 /yr.
Sim3 342,704,871/yr
Sim4 340,830,363/yr
Sim5 339,430,410/yr
Sim6 340,534,977/y
Sim7 341,273,692/yr
The total profit, therefore made in each simulated process is equivalent
Base Case: Product value –raw material cost – 0.2 (equipment capital cost)
= $376,935,600 /yr. - $340,535,185/yr - $2,840,000/yr
= $ 33,560,415 /yr. This is conducted for each of the simulations to arrive at total profit per year
illustrated in the table below. Table 11 - Total profit of simulation processes.
Profit
Base Case $ 33,560,415 /yr.
Sim1 $ 34,808,744/yr.
Sim2 $ 35,421,777/yr
Sim3 $ 32,823,508
Sim4 $ 34,197,970
Sim5 $ 35,959,546
Sim6 $ 34,807,534
Sim7 $ 32,826,390
The decision making ability of a refinery process operation is based on the
ability to establish a trade-off between the environmental and economic
efficiencies for the best design process. This can be illustrated on the x/y eco-
efficiency curve. This gives the eco-efficiency of each process relative to the
base case. The plot of this curve assists in the choice of the best available
design option for a segment of the oil and gas industrial processes.
Table 12 - Plotted emissions vs. Profit
Base Case
Sim1 Sim2 Sim3 Sim4 Sim5 Sim6 Sim7
Profit 33.6 34.8 35.4 32.8 34.2 36 34.8 32.83
Emission 2318.71 3039.2 3188.92 3899.73 2996.64 2101.20 2854.13 3222.41
Eco-efficiency plot of emissions vs. profit
34.8 35.4
32.8
34.2
36
34.832.83
33.6
0.00
500.00
1,000.00
1,500.00
2,000.00
2,500.00
3,000.00
3,500.00
4,000.00
4,500.00
32.5 33 33.5 34 34.5 35 35.5 36 36.5
total ptofit (NPW million US$)
tota
l em
issi
ons
(tonn
es o
f CO
2)
Figure 6 - Environmental and economic financial Analysis plots.
Pareto
Interpretation of Result
The significance of this plot is used in the selection of a preferred process
design. The seven different simulations are compared with the base case and
the results can be summarized in the plot above.
As calculated from above, the different processes and their
corresponding economic profits as well as environmental emission costs show
that the fifth simulation process with co-ordinated (36, 2101.20) can be a better
hydro finer design process, compared to the base case in terms of both profit
and emissions. The other processes however do not prove to be
environmentally viable options. From the plot above, a comparison of the base
case with the other simulation, i.e. 1, 2,3,4,6 and 7 shows that the base case
emits fewer pollutants compared to the others. The case with profit 32.83, 33.6
and 36 are all candidates for the “best process” design depending on the
balance of profit and pollution.
In terms of profit, simulation 5 is also the process with the most beneficial
cost effectiveness while the 3rd and 7th process designs are the least profitable
design. This is mainly as a result of the high utility cost and the high capital cost
respectively for the two processes. The implication of this in the life cycle of the
gas oil desulphurization process is to illustrate the process simulation that has
the most environmental impact, so as to take necessary mitigation steps to
minimize or avoid these emissions. This is also useful in this project case, for
the re-design of processes.
For the avoidance of these emissions summarized in the eco-efficiency
plot, and to conform to the environmental regulations, the environmental critical
analysis tool is used to determine the areas of possible potential environmental
concerns as well as the pollutants to consider in this process. Alternatives and
mitigation options are also suggested.
Environmental Critical Assessment Review
The goal of the critical review is to generate environmental variants that
are of concern in this process. This analysis generated a number of possible
environmental issues and possible emitted pollutants, which have adverse
effects, such as global warming, acidification and other effects.
The critical analysis considered variants such as carbon dioxide releases,
hydrogen sulphide losses, sulphur dioxide losses, damages to equipment, and
possibility of explosion. These were considered relevant to the reference case of
a hydro finer process as a result of the presence of toxic gases.
The use of a stream date form helped to determine physical and chemical
properties of streams that were considered to have an impact on the process
design. Data extraction is based on the ChemCad software package used in the
design process. The information on the data form gives an indication of the
tendency of the stream to cause hazard and also shows possible mitigation
strategies.
The analyses are provided in an environmental critical assessment review
illustrated in Table 13.
Table 13 - Environmental critical assessment review Project Title Gas Oil Hydro finer Process (Desulphurization process) Page No. Action Ref. Concerns Mitigation steps Possible Benefits Comments/Action
s GO001 CO2 release
• Fired Heater
• Boiler or steam generation
• Electricity supply for condensers,
pumps
• Reduce energy use
• Conduct a heat
integration and recovery
process
• Ensure energy efficiency
• Conserves natural
resources
• Saves cost on utility and
cost of emissions
This is done in the
project by the use
of pinch analysis to
reduce the amount
of heat requirement
and therefore
reduction in capital
cost. • Alternative reactor
design
• Use of Biotechnology
• Enhance the use of CO2
sequestration
Generally reduces global
warming Ongoing research
in the area
GO002 • Fugitive emission from pumps,
valves, and seals
• Monitoring and
maintenance of
equipment.
• Install mechanical
and dual seals
• Reduces the rate of
explosions in
process plant
• Ensure safety of
workers and the
environment
GO003 • SO2 and H2S emissions • Reduced Fugitive
emissions
• Improved health and
safety of workers
and the environment
in general
• Change to the use of
bio-catalytic
desulphurization
using irradiation
techniques
• Reduced emission
and complete
conversion of
sulphur atoms to
hydrogen sulphide
No used in the
study
GO004 • Possibility of explosion • Reduce the flow rate
of light gases from
process streams
• Safer working
environment.
GO005 • Disposal of sour water • Treatment of waste
water before
disposal
• Preservation of
aquatic life as well
as safer domestic
water use
Conclusive Thoughts
The use of environmental assessment tools such as life cycle assessment is useful only
in the analysis of environmental aspects of processes and products in the supply chain.
However, an extension to the use of the engineering approach to products and processes
further enhances sustainability.
This study on the life cycle engineering the oil and gas industry was tackled using the
responsible care approach to systems, with the aim of accumulating environmental impact at
each stage of the industrial process. The goal of the study was to use life cycle engineering
tools to determine the efficiency of industrial processes, conservation of energy and material,
to determine emissions impacts and cost. This was carried out in collaboration with other
environmental tools: process simulation, environmental critical assessment and pinch analysis.
To demonstrate the use of these tools in the petroleum industry, a process from the
refinery supply chain was dwelt upon, gas oil desulphurization, mainly as a result of its
availability. As a result of these tools, it was established that possible savings in energy use is
possible by the simulation of industrial process (changing physical conditions such as
temperature and heat loads) as well as the use of the process integration (pinch analysis)
approach. This saving in energy use results in the reduction of environmental emission from
the processes.
Systems approaches side-by-side with business-oriented context can lead to a
systematic approach to new designs and solutions. Possibilities of improvement with evolving
technology can also be achieved with the environmental critical analysis tool, which suggests
alternatives to processes and mitigation potentials for emission. As a result of these steps,
environmental impacts are then calculated for two acid gas emissions to assess the
environmental impact of products. The aim of this is to ensure the accurate allocation of
environmental costs by end users to products.
This study is not extensive as it were and further work on the extension of this model to
the entire petroleum process is required.
References
ABB Group (2000). Life cycle assessment tool for eco-efficient products. Annual report,
Technology report.
Asiedu , M. Y., and Gu. P. (1998). Product life cycle cost analysis- the state of the art
review. Int. J. Prod. Res., vol. 36, No. 4, 883-908.
Azapagic, A., and Perden, S. (2000). Indicators of sustainable development for industry: A
general framework. Trans Ins. Chem. Eng. Vol. 78, B4, pp. 243-261.
Barwis, J. H., Sustainability and the oil & gas industry: the role of technology in minimizing
environmental impacts.
http://www.copernicus.org/EGS/egsga/nice01/programme/abstracts/aac7349.pdf
Besermer, J. J. (2001). Global Warming: The Big Picture.
http://www.ocs.orst.edu/forum/BigPicture.htm
CHEMCAD, Chemstations INC. (2003). Chemical Process Simulation
http://www.chemstations.net
Ciba Spezialitätenchemie, Umwelt, Gesundheit und Sicherheit– Innovationen im
Umweltbereich
CONCAWE report (1998). Sulphur dioxide emissions from oil refineries and combustion of
oil products in Western Europe and Hungary.
.
.
Environmental Defence (1999). Oil refining main page
http://www.environmentaldefense.org/article.cfm?ContentID=1537
Finnegan, L. (2002). The Environmental Effects of Fossil Fuel.
http://www.personal.psu.edu/users/l/a/laf208/environmental_effects_of_fossil.htm.
Hungerbühler K, J. Ranke, T. Mettier (1999). Chemische Produkte und Prozesse. Springer
Verlag Berlin, ISBN 3-540- 64854-2.
Keys, L. K. (1990). System life cycle engineering and DF, ‘X. IEEE Transactions on
component, Hybrid and Manufacturing Technology, 13(1), 83-93.
Klass, D. (2003). A critical assessment of renewable energy usage in the USA. Energy
policy 31 (2003) 353-367. Presented at the online conference “Energy Resource”, 2001.
Kunzli, N., et al. (2000). Public-health impact of outdoor and traffic-related air pollution- a
European assessment. The Lancet, vol. 356. September. 795-801.
Nagpal, S., and Sen, P.K. (2002). Selecting the solvent for SO2 removal absorption.
Environmental Management: Air-Pollution Control
Pfeiffer, J. B. (Ed) (1975). Sulfur Removal and Recovery from Industrial Processes
(Advances in Chemistry Series: No 139). Oxford University Press.
Saling, P., A. Kicherer, B. Dittrich-Krämer, R. Wittlinger, W. Zombik, I.Schmidt, W. Schrott
and S. Schmidt: International LCA Journal: Eco-efficiency by BASF, The Method
(International LCA Journal, 2002)
(http://www.basf.de/basf/img/umwelt/oeko/LCA)
SETAC (1993) Guidelines for life cycle assessment. A code of practice.
http://www.setac.org/guidelife.html
Ukoli, M. K., Environmental factors in the management of oil and gas industry in Nigeria.
http://www.cenbank.org/out/annual/ACZRU/2001/Owe-01-2.pdf
van Ravenswaay, E. O. PRM 255 Pollution prevention case study on petroleum refining.
Von Weizacker EU, Seiler-Hausmann J. (Ed) (1999): Ökoeffizienz Management der
Zukunft.
WBSD Presentation (1995).
Welford R. (1998). Corporated Environmental Management, Earthscan publication.
Wittcoff, H. A., and Reuben, B. G. (1996). Industrial organic chemicals.
Zwick, A., Decisions in a climate of uncertainty - Addressing CO2 issues.
http://www.jrc.es/iptsreport/vol02/english/art2.doc