20
Life Cycle Implications of ECC-Bridge Components Andrew Shuck May 3, 2010
| Date post: | 19-Dec-2015 |
| Category: |
Documents |
| View: | 222 times |
| Download: | 0 times |

Life Cycle Implications of ECC-Bridge Components
Andrew ShuckMay 3, 2010

Areas of Progress
1. Tensile samples with CKD replacement are sanded, glued, and ready to test
2. Components ordered for structural testing3. Beginning to parameterize LCA aspects of
bridge project

ECC Mix Design LCA
Draws on an LCI of different components of ECC ingredients (and alternative mix designs), which are:
–Cement–Sand–Fly ash–PVA fiber–HRWRA–Water
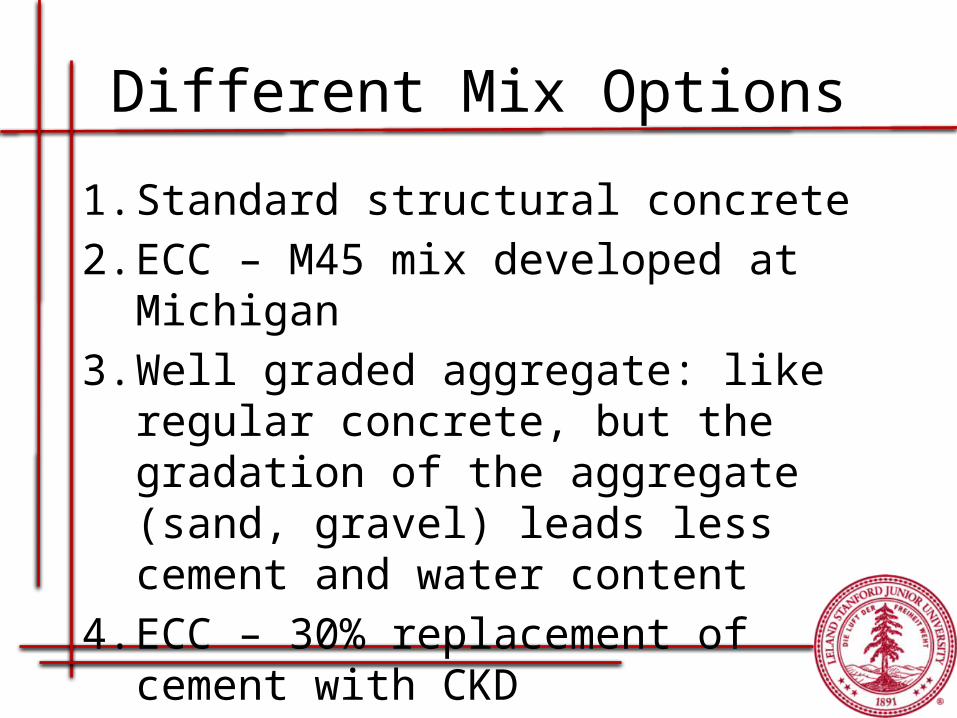
Different Mix Options
1. Standard structural concrete2. ECC – M45 mix developed at Michigan3. Well graded aggregate: like regular
concrete, but the gradation of the aggregate (sand, gravel) leads less cement and water content
4. ECC – 30% replacement of cement with CKD
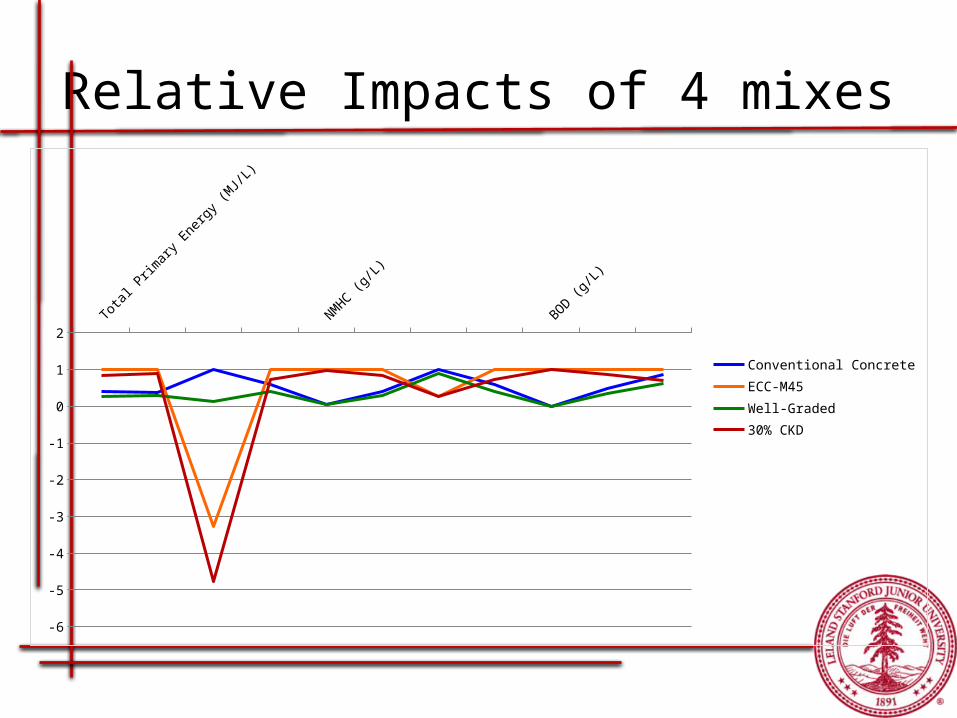
Relative Impacts of 4 mixes
Total
Primary
Energ
y (MJ/L
)
Carbon Dioxid
e (kg
/L)
PM_10 (g
/L)
Susp
ended
Matt
er (g/
L)
-6
-5
-4
-3
-2
-1
0
1
2
Conventional ConcreteECC-M45Well-Graded30% CKD
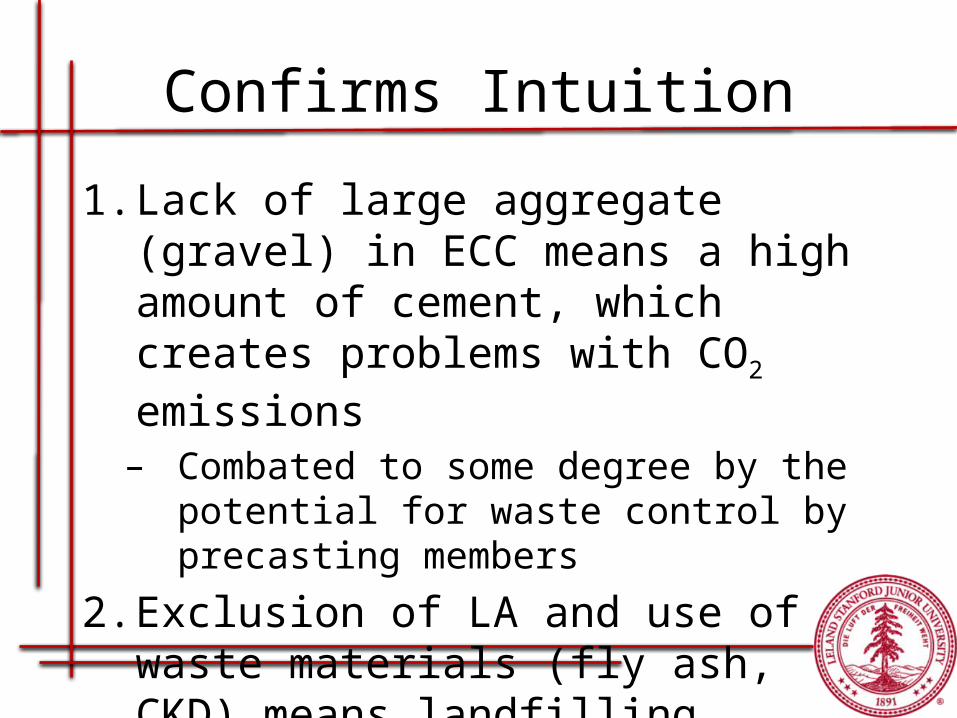
Confirms Intuition
1. Lack of large aggregate (gravel) in ECC means a high amount of cement, which creates problems with CO2 emissions– Combated to some degree by the potential for
waste control by precasting members
2. Exclusion of LA and use of waste materials (fly ash, CKD) means landfilling benefits with ECC

Application of Mix Designs
1. Enter into Simapro to develop full process-based LCA of the bridge superstructure (not the effect its actual construction process has…)
2. Important to establish average (or at least sensitivities of) waste factors of the different materials to realistically capture the impacts of different material options

Traffic Congestion Model
CO3 (COnstruction, COngestion, COst)In their own words:“The CO3 System is a tool with which engineers can estimate the magnitude and impacts of traffic congestion, including its cost impact on road users, that can be expected during a construction project.”“CO3 measures the impact of congestion in two basic ways: (1) variables such as delay, diverted vehicles, and backup measure different characteristics of congestion and (2) user cost provides a common unit of measure with which to sum traffic impacts and compare them with construction cost.”

There’s a Catch, Though
“The following description of Microsoft Excel assumes that the user is familiar with a keyboard and how it works…”
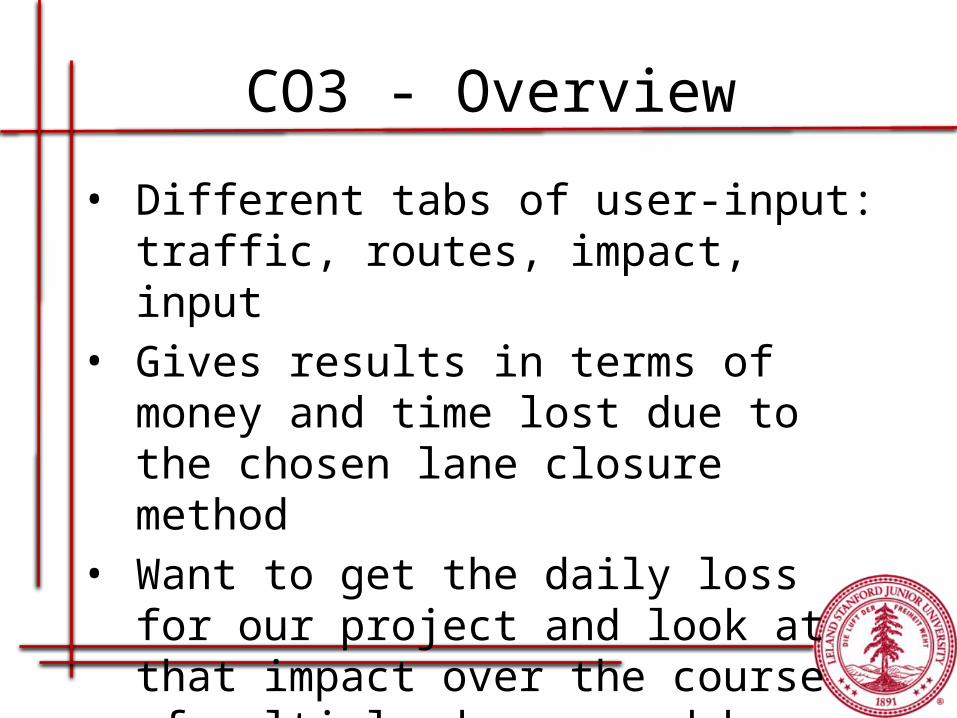
CO3 - Overview
• Different tabs of user-input: traffic, routes, impact, input
• Gives results in terms of money and time lost due to the chosen lane closure method
• Want to get the daily loss for our project and look at that impact over the course of multiple days saved by using an ECC-based structural system
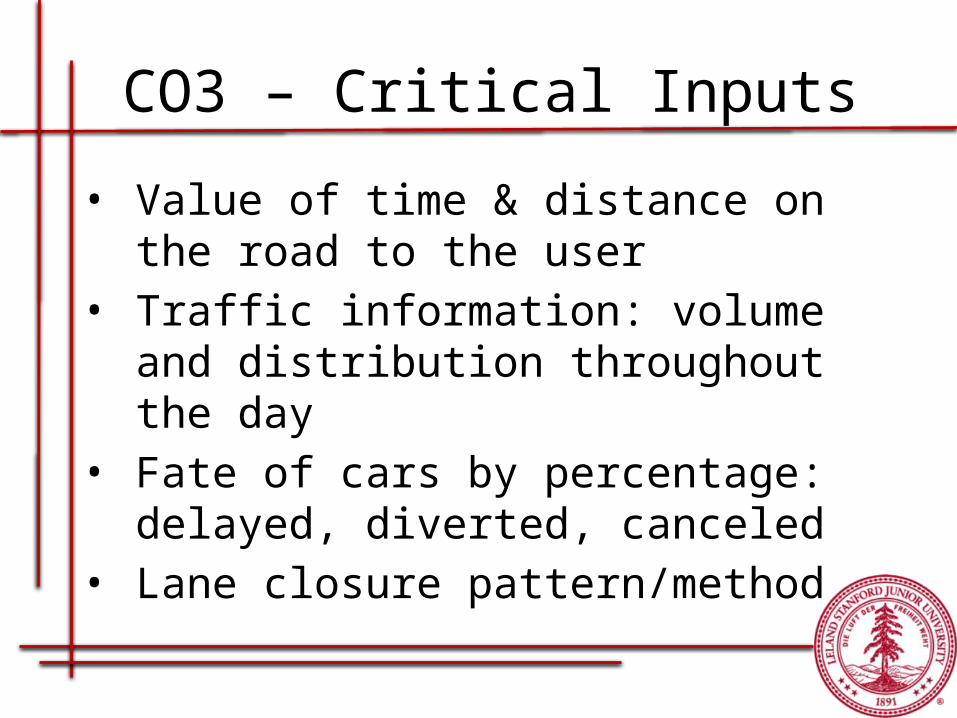
CO3 – Critical Inputs
• Value of time & distance on the road to the user
• Traffic information: volume and distribution throughout the day
• Fate of cars by percentage: delayed, diverted, canceled
• Lane closure pattern/method

CO3 – Value to User
• This value should be easily parameterized, and will probably be pretty linear– Simply take multiple values of the user loss per
time/mile and the results of those different values and fit a line to the relationship
– Someone wanting to perform an LCA of the ECC bridge option can simply choose their user value based on a to-be-determined basis
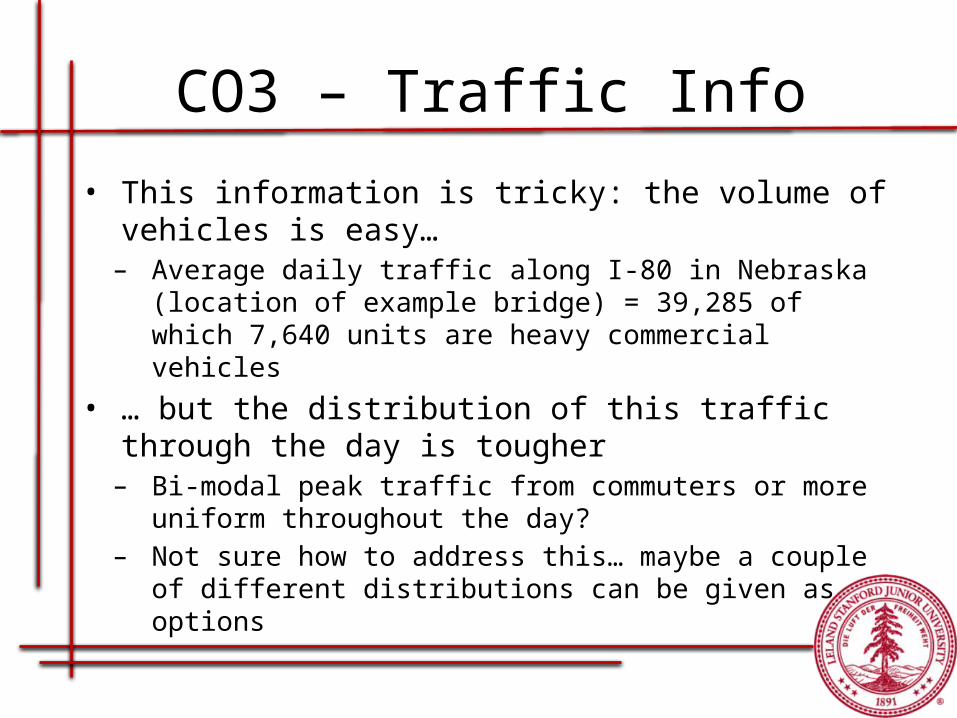
CO3 – Traffic Info
• This information is tricky: the volume of vehicles is easy…– Average daily traffic along I-80 in Nebraska (location of
example bridge) = 39,285 of which 7,640 units are heavy commercial vehicles
• … but the distribution of this traffic through the day is tougher– Bi-modal peak traffic from commuters or more uniform
throughout the day?– Not sure how to address this… maybe a couple of
different distributions can be given as options
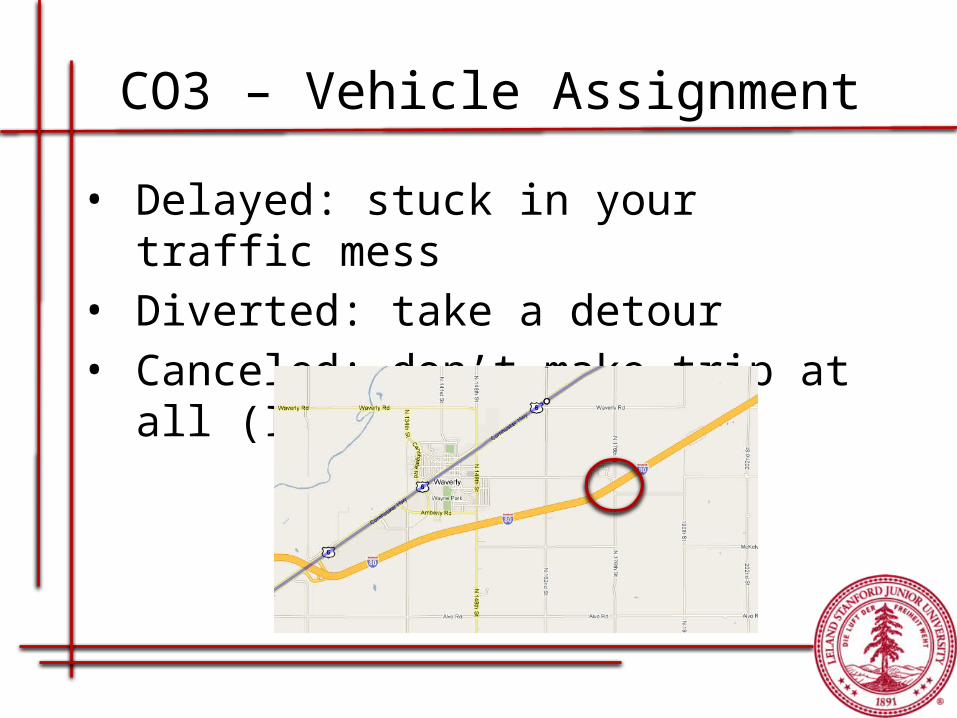
CO3 – Vehicle Assignment
• Delayed: stuck in your traffic mess• Diverted: take a detour• Canceled: don’t make trip at all (I think)
CO3 – Problems with Assignments
• Importance of Route: In terms of generalizing this information, how can we identify the percentage of people that HAVE to make a trip everyday? (i.e., cannot “cancel”)
• Detour: Very site-specific, and difficult to limit to a couple of options
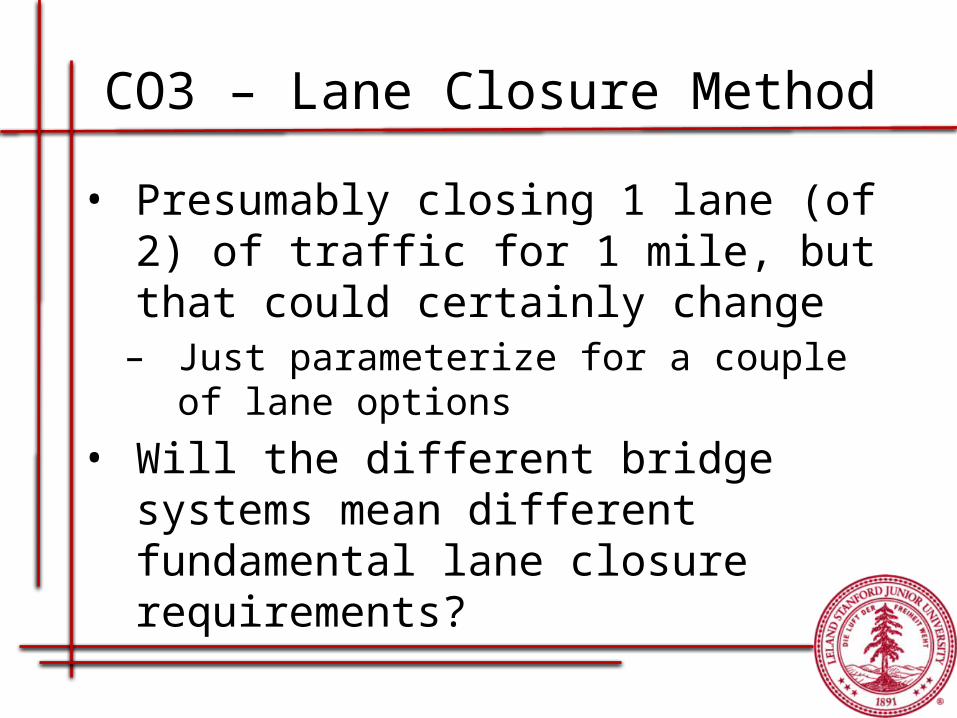
CO3 – Lane Closure Method
• Presumably closing 1 lane (of 2) of traffic for 1 mile, but that could certainly change– Just parameterize for a couple of lane options
• Will the different bridge systems mean different fundamental lane closure requirements?

CO3 – In Sum
• Hang-ups are certainly surmountable, but I need to get a better idea of what the results are most sensitive to when making assumptions
• 250 page CO3 user manual will be my best friend for a few weeks more
• But wait, there’s more!
Additional LCA Models
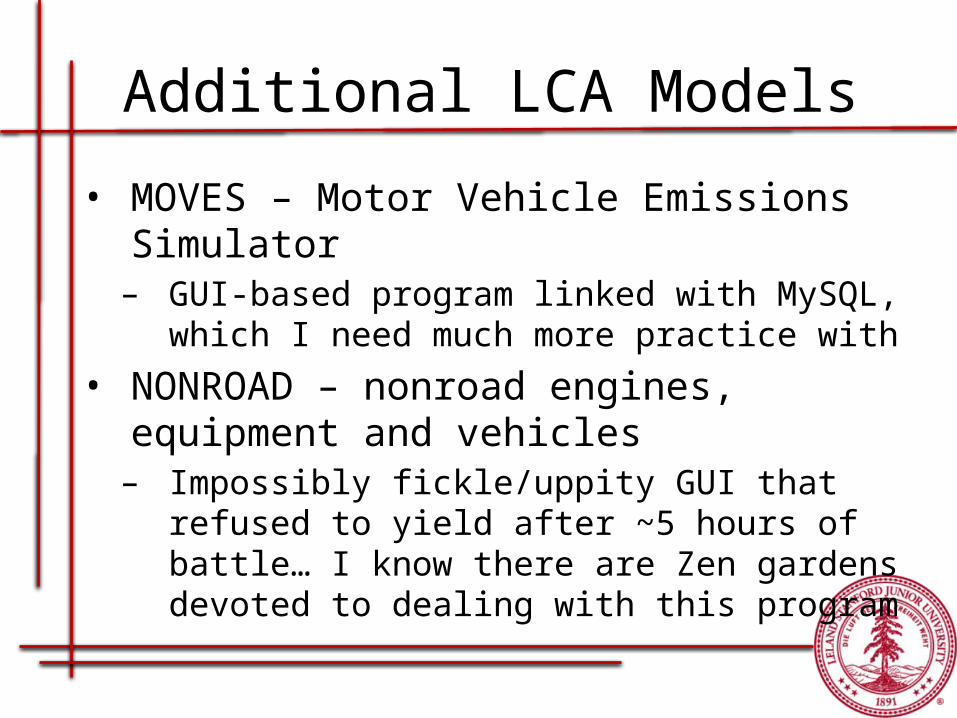
• MOVES – Motor Vehicle Emissions Simulator– GUI-based program linked with MySQL, which I
need much more practice with• NONROAD – nonroad engines, equipment
and vehicles– Impossibly fickle/uppity GUI that refused to yield
after ~5 hours of battle… I know there are Zen gardens devoted to dealing with this program
Archaeological Aside: Old Concrete
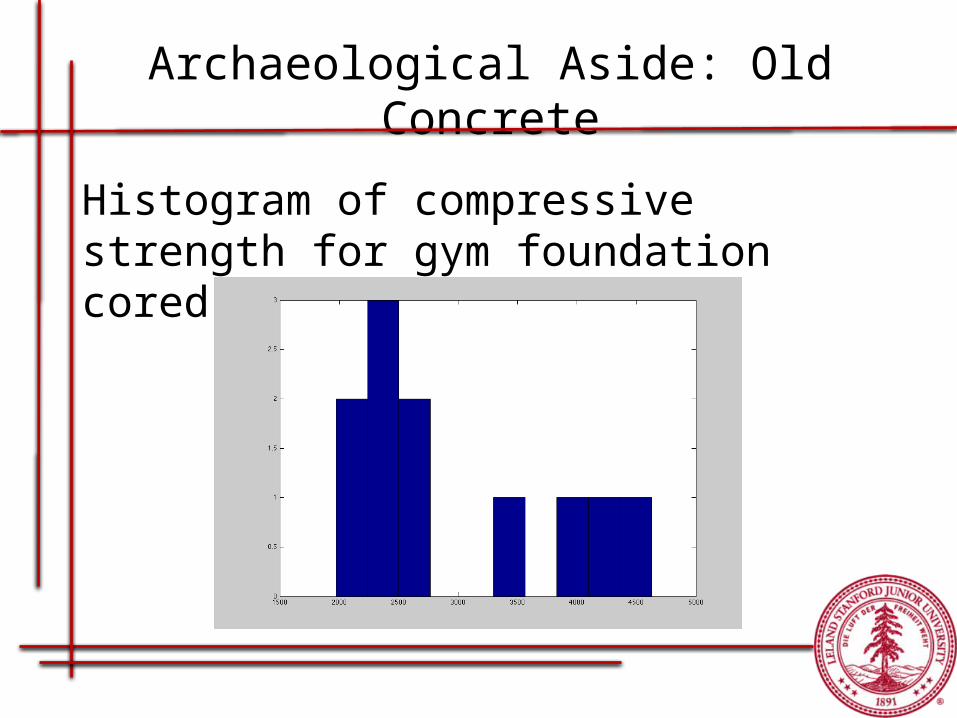
Histogram of compressive strength for gym foundation cored samples (in psi)

Questions?
Thank you!


