Abstract I argue that the relationship between life expectancy and schoolingcrucially depends on which measure of life expectancy one uses. In particular,I show that while the change in life expectancy at birth between 1960 and1990 is positively correlated with percentage change in schooling, the changein life expectancy at age 5 is, at best, uncorrelated with percentage changein schooling. This evidence suggests that increasing life horizon beyond theearly crucial childhood years for formal acquisition of human capital is not asquantitatively important as previously thought.
Keywords Life expectancy · Human capital · Economic growth
JEL Classification J24 · O11
1 Introduction
Conventional wisdom suggests that longer life increases the horizon overwhich the returns to education can be reaped off and induced higher invest-ment in human capital. This hypothesis dates back to Ben-Porath (1967), andthe link to economic growth has been made by Kalemli-Ozcan et al. (2000)
Responsible editor: Junsen Zhang
Electronic supplementary material The online version of this article(doi:10.1007/s00148-011-0392-6) contains supplementary material,which is available to authorized users.
M. Hazan (B)Department of Economics, The Hebrew University of Jerusalem,Mt. Scopus, Jerusalem 91905, Israele-mail: [email protected]
and Boucekkine et al. (2002) among others. Hazan and Zoabi (2006) criticizedthis literature, arguing that in a setting where parents choose fertility andthe education of their children, a rise in the life expectancy of the children,increases not only the returns to quality but also the returns to quantity,mitigating the incentive to invest more in the children’s education.1 Morebroadly, reduction in mortality might have positive effects on human capitaland growth via other channels, some of which have been analyzed in Zhanget al. (2001), Kalemli-Ozcan (2002), Zhang et al. (2003), and Bar and Leukhina(2010).
On the empirical side, the evidence on the effect of falling mortality rateson investment in human capital is mixed. Jayachandran and Lleras-Muney(2009) examined declines in maternal mortality in Sri Lanka and estimatedthat the time in school rises 0.11 year/1 year of additional expected adultlife. In contrast, Acemoglu and Johnson (2006) and Lorentzen et al. (2008)found no effect of life expectancy on school enrollment in cross-section data.Hazan (2009) showed theoretically that the Ben–Porath mechanism suggeststhat as individuals live longer, they invest more in human capital, if and onlyif, their lifetime labor supply increases. He then showed that this conditiondoes not hold for American men between 1840 and 1970 and concluded thatgreater longevity cannot account for any of the substantial observed increasein educational attainment in the USA during the nineteenth and twentiethcenturies.
Soares (2005) argued that changes in life expectancy can be the cause behindthe changes in fertility choice and educational attainment over the time period1960–1995 in cross-country data. This argument is motivated by the facts thatwhile the cross-sectional relationships between income on the one hand, andlife expectancy at birth, schooling and fertility on the other hand have shiftedbetween 1960 and 1995, the cross-sectional relationships among life expectancyat birth on the one hand, and total fertility rate and schooling, on the otherhand, have remained constant.
Soares concluded that “. . . there is a dimension of change in life expectancythat is not associated with income, but that is associated with fertility andeducational attainment”, and that “while fertility and education are direct ob-jects of individual choice, life expectancy has a large exogenous component . . .This suggests that exogenous reductions in mortality together with a stablebehavioral relationship between life expectancy, educational attainment, andfertility, may be behind the observed changes.” (p. 585).
The argument put forward in this paper is simple. Since many mechanismsrelating life expectancy to schooling may be at work, it is important to looknot only at the relationship between life expectancy at birth and education,
1See also (Moav 2005).
Life expectancy and schooling: new insights from cross-country data 1239
0
20
40
60
80
100
120
140
160
180
0 5000 10000 15000 20000 25000 30000
per Capita GDP (2000 US$)
Infa
nt
mo
rtal
ity
rate
1960 1990 Power (1990) Power (1960)
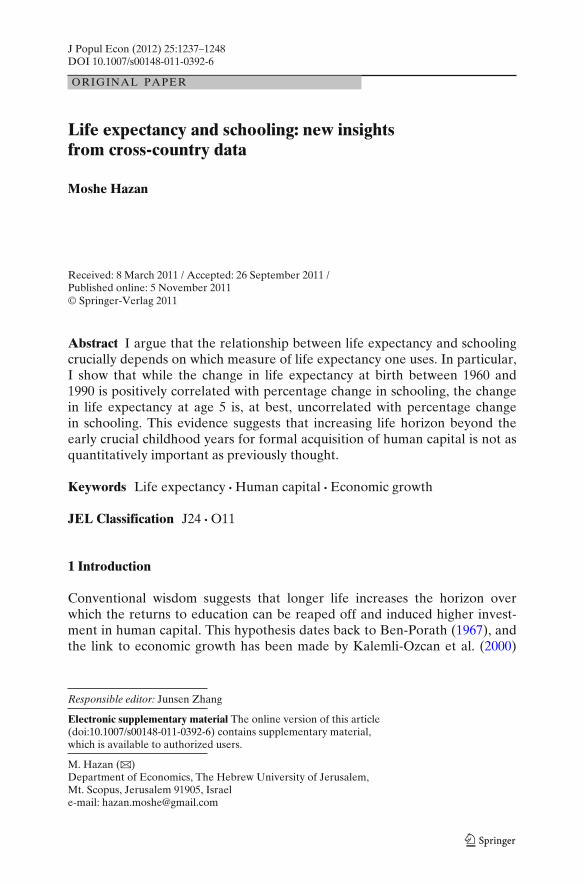
Fig. 1 Relationship between per capita income and infant mortality rate: post-demographictransition countries (1960–1990)
but also at the relationship between life expectancy beyond the crucial earlychildhood years and education.
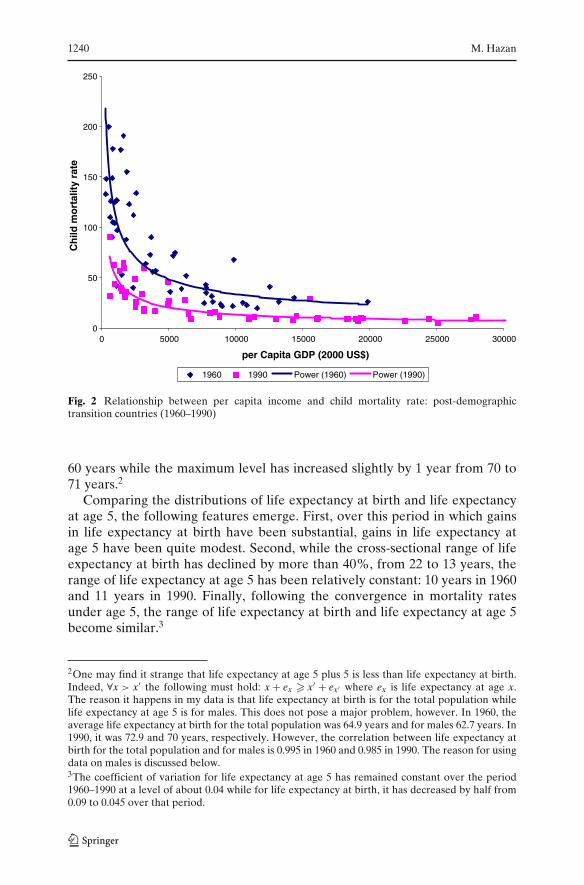
It is well known that infant and child mortality rates have been declin-ing sharply at least since 1960 and that these reductions were greateramong less developed countries, compared with more developed economies.Figure 1 shows the cross-sectional relationship between income per capita andinfant mortality rate in 1960 and 1990, and Fig. 2 shows the cross-sectionalrelationship between income per capita and child mortality rate in 1960 and1990. As can be seen, infant and child mortality have declined over time.Moreover, the decline is much more pronounced for poorer countries, sug-gesting that infant and child mortality rate has been converging over this timeperiod.
The convergence in mortality rates under age 5 suggests that gains in lifeexpectancy at birth are greater for poorer than for richer countries. In 1960,the minimum level of life expectancy at birth in my sample was 52 years androse to 66 years in 1990, an increase of 14 years. In contrast, the maximumlevel of life expectancy at birth in my sample was 74 years in 1960 and79 years in 1990, an increase of 5 years. The sharp reduction in infant andchild mortality rates also suggest that gains in life expectancy at age 5 are moremodest than at birth. Indeed, in my data, the minimum level has remained
1240 M. Hazan
0
50
100
150
200
250
0 5000 10000 15000 20000 25000 30000
per Capita GDP (2000 US$)
Ch
ild m
ort
alit
y ra
te
1960 1990 Power (1960) Power (1990)
Fig. 2 Relationship between per capita income and child mortality rate: post-demographictransition countries (1960–1990)
60 years while the maximum level has increased slightly by 1 year from 70 to71 years.2
Comparing the distributions of life expectancy at birth and life expectancyat age 5, the following features emerge. First, over this period in which gainsin life expectancy at birth have been substantial, gains in life expectancy atage 5 have been quite modest. Second, while the cross-sectional range of lifeexpectancy at birth has declined by more than 40%, from 22 to 13 years, therange of life expectancy at age 5 has been relatively constant: 10 years in 1960and 11 years in 1990. Finally, following the convergence in mortality ratesunder age 5, the range of life expectancy at birth and life expectancy at age 5become similar.3
2One may find it strange that life expectancy at age 5 plus 5 is less than life expectancy at birth.Indeed, ∀x > x′ the following must hold: x + ex � x′ + ex′ where ex is life expectancy at age x.The reason it happens in my data is that life expectancy at birth is for the total population whilelife expectancy at age 5 is for males. This does not pose a major problem, however. In 1960, theaverage life expectancy at birth for the total population was 64.9 years and for males 62.7 years. In1990, it was 72.9 and 70 years, respectively. However, the correlation between life expectancy atbirth for the total population and for males is 0.995 in 1960 and 0.985 in 1990. The reason for usingdata on males is discussed below.3The coefficient of variation for life expectancy at age 5 has remained constant over the period1960–1990 at a level of about 0.04 while for life expectancy at birth, it has decreased by half from0.09 to 0.045 over that period.
Life expectancy and schooling: new insights from cross-country data 1241
The average years of schooling of the population aged 15 and above has alsoincreased over the period 1960–1990. In my sample, the mean average yearsof schooling has increased from 5.74 to 8.08 while the standard deviation hasslightly declined, suggesting a convergence in schooling as well. However, theage at which investment in education begins has remained constant: 5 or 6 yearsold. I therefore, exploit data on life expectancy at birth and at age 5 on theone hand and school attainment on the other hand, to assess the relationshipbetween life expectancy and school attainment.
In this paper, I provide evidence that illustrates the importance of dis-tinguishing between life expectancy at birth and life expectancy beyond thecrucial early childhood years when examining the relationship between lifeexpectancy and schooling. In particular, I look at the correlation between thechange in life expectancy and change in schooling. This correlation providesa first look toward answering the question, did countries that gain more inlife expectancy also invested more in schooling? I first show that the absolutechange in life expectancy at birth and the percentage increase in schooling arepositively correlated and that this correlation is statistically significant. Similarresults are obtained if one looks at the correlation between the percentageincrease in life expectancy at birth and percentage increase in schooling.4
However, once life expectancy at birth is replaced with life expectancy at age 5,the correlation becomes negative and marginally significant. When I limit thesample by throwing outliers, or countries for which life expectancy at age 5 didnot increase, I basically find no correlation among these variables.5
How should these results be interpreted? Clearly, the lack of correlationbetween gains in life expectancy at age 5 and gains in schooling weakens thequantitative importance of increasing life horizon beyond the first few crucialyears for formal acquisition of human capital. The results also suggests thatreductions in mortality rates before the age at which formal education begins,are perhaps more important than reductions in mortality rates after that age.In Section 4, I discuss a potential hypothesis that may be at work.
The rest of the paper is organized as follows. Section 2 briefly describesdata sources. Section 3 presents evidence on the correlation between gains inlife expectancy and the rise in average years of schooling. Finally, Section 4concludes.
2 Data sources
The data come from the World Development Indicators (WDI), except theeducational attainment which comes from the Barro and Lee (2000) dataset.
4Interestingly, there is no correlation between the absolute gain in life expectancy at birth andabsolute gain in average years of schooling.5Similarly, Maoz (2008) empirically shows that countries do not seem to share a common dynamicpath of fertility and income. This severely weakens the ability to study the relationship betweenthese two variables from cross-section analysis.
1242 M. Hazan
Table 1 Summary statistics
Mean Standard deviation Min Max DifferenceFull Small Full Small Full Small Full Small
LE 0 1960 64.87 66.64 6.58 5.98 51.02 52.06 73.52 73.52 −1.77LE 0 1990 72.94 74.04 3.89 3.50 64.09 66.09 78.86 78.86 −1.10LE 5 1960 NA 65.92 NA 2.54 NA 60.27 NA 70.49 NALE 5 1990 NA 67.45 NA 2.84 NA 60.27 NA 71.42 NAAYS 1960 5.33 5.74 2.15 2.14 1.35 1.86 9.73 9.73 −0.29AYS 1990 7.65 8.08 2.06 2.03 4.02 4.15 11.74 11.74 −0.43
The full sample contains 61 countries, the Small contains 37 countries. Life expectancy at age 5 forthe year 2000 is available for only 24 countries. Correspondingly, “AYS 2000” refers to these 24countriesLE 0 life expectancy at birth, LE 5 life expectancy at age 5 for males, AYS average years ofschooling of the population aged 15 and above, Dif ference is the difference in means betweenthe full and small samples. None of these differences is significant at 10% or lower level
The WDI dataset, however, does not contain data on life expectancy at age 5.Hence, data for this variable are from the Historical supplement of the De-mographic Yearbook, Table 9a, published by the United Nations in 1997, andfrom the Human Mortality Database.6 In terms of country selection, Similarto Soares (2005) I confine the analysis to countries that had life expectancyat birth above 50 years in 1960. Soares referred to these countries as “PostDemographic Transition Countries”.
Data on life expectancy at age 5, however, are not available for all thecountries in the sample that Soares (2005) uses. Nevertheless, my sample ofcountries for which I have data on life expectancy at age 5 is not substantiallydifferent from the data that meets the criterion of Soares (2005). Table 1 showssummary statistics for the data that meet this criterion, referred to as the “Full”sample and for the subset of countries for which I have data on life expectancyat age 5, referred to as “Small” sample. Fortunately, the subsample, is quitecomparable to the full sample: the difference in means of each variable is notstatistically different from zero at any conventional significant level.
3 Gains in life expectancy and the rise in schooling
In this section I examine the correlation between gains in life expectancy andgain in average years of schooling between 1960 and 1990. This correlationprovides a first look toward answering the question, did countries that gainmore in life expectancy also invested more in schooling? Figure 3 shows nocorrelation between the absolute gains in life expectancy at birth between 1960
6The expectation of life at age 5 from the Demographic Yearbook is available only for eachgender separately. I use data on the expectation of life at age 5 for males because there are moreobservations for males than for females.
Life expectancy and schooling: new insights from cross-country data 1243
Fig. 3 Absolute gains in life expectancy at birth and gains in average years of schooling: post-demographic transition countries (1960–1990)
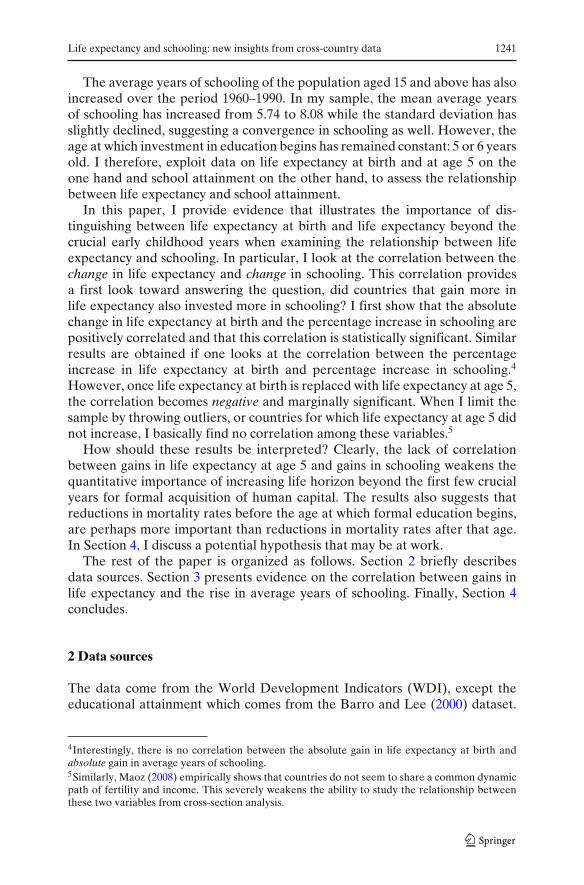
and 1990 and the absolute gains in average years of schooling over the sameperiod.7 But there is no reason a priori for a linear relationship between gainsin life expectancy and gains in average years of schooling. In Fig. 4, I look atthe correlation between the absolute gains in life expectancy at birth between1960 and 1990 and the difference between the log of average years of schoolingof the population aged 15 and above in 1990 and 1960. As can be seen, thereis a positive and significant correlation between these two variables. That is,countries that gain more years in life expectancy at birth have increased theiraverage years of schooling by more, in percentage term. The OLS estimate ongains in life expectancy equals 0.021 and has a p value of 0.03. This suggests thata gain of one extra year in life expectancy at birth is associated with an increasein average years of schooling of 2% over a period of 30 years. With a mean gainin life expectancy at birth of 7.39 years, this implies that at the mean, gains inlife expectancy are associated with an increase of average years of schoolingof 15.2% over the period 1960 and 1990. Since the average increase in yearsof schooling is about 39%, gains in life expectancy at birth may explain up to40% of the increase in schooling.
7The OLS estimate is negative, −0.027, but highly insignificant with a p value of 0.51.
1244 M. Hazan
1
1.2
0.6
0.8
0.2
0.4
Dif
fere
nce
in lo
g a
vera
ge
year
s o
f sc
ho
olin
g
0
0 2 10 12 14 16 18
Absolute gains in life expectancy at birth (in years)
4 6 8
Fig. 4 Absolute gains in life expectancy at birth and the difference in log average years ofschooling: post-demographic transition countries (1960–1990)
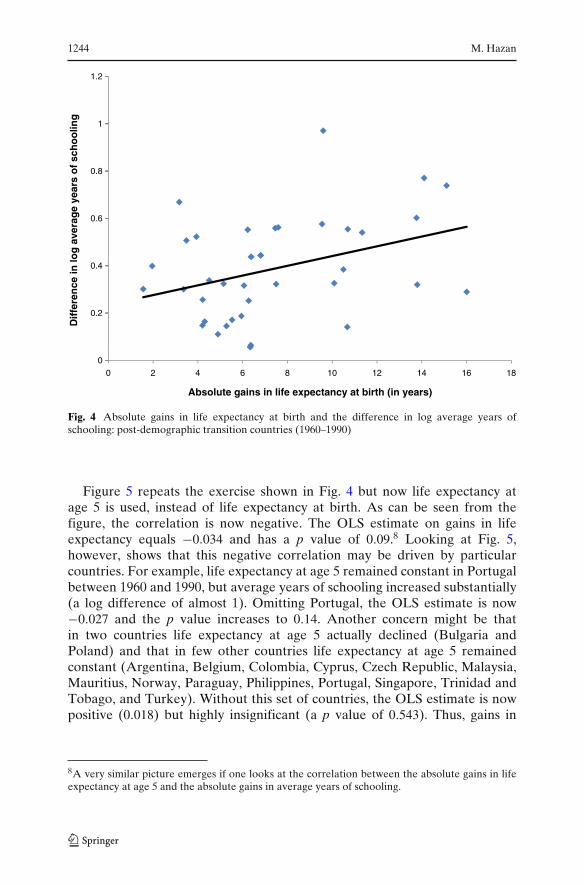
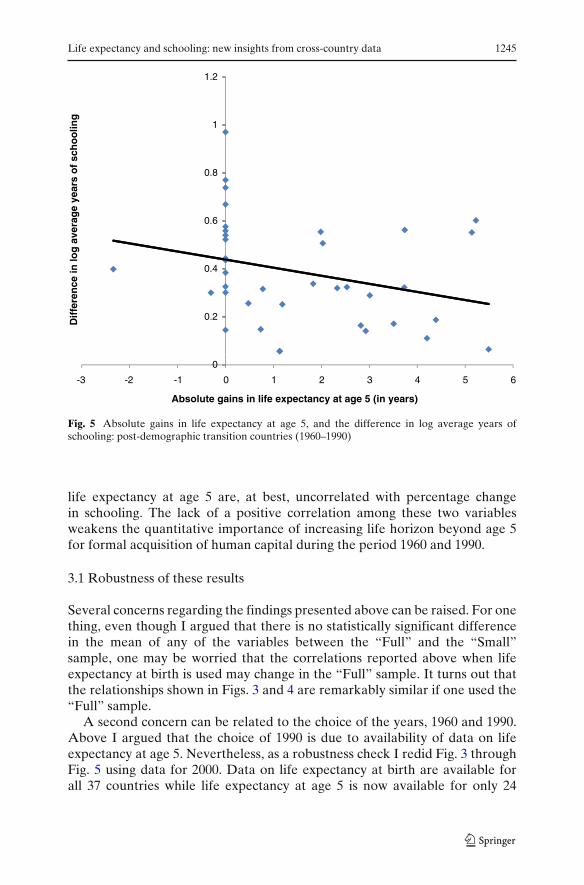
Figure 5 repeats the exercise shown in Fig. 4 but now life expectancy atage 5 is used, instead of life expectancy at birth. As can be seen from thefigure, the correlation is now negative. The OLS estimate on gains in lifeexpectancy equals −0.034 and has a p value of 0.09.8 Looking at Fig. 5,however, shows that this negative correlation may be driven by particularcountries. For example, life expectancy at age 5 remained constant in Portugalbetween 1960 and 1990, but average years of schooling increased substantially(a log difference of almost 1). Omitting Portugal, the OLS estimate is now−0.027 and the p value increases to 0.14. Another concern might be thatin two countries life expectancy at age 5 actually declined (Bulgaria andPoland) and that in few other countries life expectancy at age 5 remainedconstant (Argentina, Belgium, Colombia, Cyprus, Czech Republic, Malaysia,Mauritius, Norway, Paraguay, Philippines, Portugal, Singapore, Trinidad andTobago, and Turkey). Without this set of countries, the OLS estimate is nowpositive (0.018) but highly insignificant (a p value of 0.543). Thus, gains in
8A very similar picture emerges if one looks at the correlation between the absolute gains in lifeexpectancy at age 5 and the absolute gains in average years of schooling.
Life expectancy and schooling: new insights from cross-country data 1245
0.8
1
1.2
0.6
0.2
0.4
Dif
fere
nce
in lo
g a
vera
ge
year
s o
f sc
ho
olin
g
0
-3 -2 -1 1 6
Absolute gains in life expectancy at age 5 (in years)
0 2 3 4 5
Fig. 5 Absolute gains in life expectancy at age 5, and the difference in log average years ofschooling: post-demographic transition countries (1960–1990)
life expectancy at age 5 are, at best, uncorrelated with percentage changein schooling. The lack of a positive correlation among these two variablesweakens the quantitative importance of increasing life horizon beyond age 5for formal acquisition of human capital during the period 1960 and 1990.
3.1 Robustness of these results
Several concerns regarding the findings presented above can be raised. For onething, even though I argued that there is no statistically significant differencein the mean of any of the variables between the “Full” and the “Small”sample, one may be worried that the correlations reported above when lifeexpectancy at birth is used may change in the “Full” sample. It turns out thatthe relationships shown in Figs. 3 and 4 are remarkably similar if one used the“Full” sample.
A second concern can be related to the choice of the years, 1960 and 1990.Above I argued that the choice of 1990 is due to availability of data on lifeexpectancy at age 5. Nevertheless, as a robustness check I redid Fig. 3 throughFig. 5 using data for 2000. Data on life expectancy at birth are available forall 37 countries while life expectancy at age 5 is now available for only 24
1246 M. Hazan
countries. Nevertheless, using gains in life expectancy and schooling over theperiod 1960 to 2000 makes no qualitative change, compared to the period1960 to 1990. First, there is no correlation between the absolute gains in lifeexpectancy at birth between 1960 and 2000 and the absolute gains in averageyears of schooling over the same period. The OLS estimate equals 0.002 witha p value of 0.945. Second, the correlation between the absolute gains in lifeexpectancy at birth between 1960 and 2000 and the difference between thelog of average years of schooling of the population aged 15 and above in 2000and 1960 is positive and significant. The OLS coefficient equals to 0.024 witha p value of 0.01. Finally, when I use life expectancy at age 5, the correlationbetween absolute gain in life expectancy and log of average years of schoolingof the population aged 15 and above is negative, though not significant. TheOLS estimate equals to −0.02 with a p value of 0.18.
Finally, I argued above that a priori there is no reason for a specificfunctional form between gains in life expectancy and gains in average years ofschooling. One can then wonder what is the correlation between the differencebetween the log of life expectancy and the difference between the log averageyears of schooling of the population aged 15 and above. It turns out that sucha specification yields very similar result to the one reported in Figs. 4 and 5.That is, when life expectancy at birth is used, there is a positive and significantcorrelation while using life expectancy at age 5 results in no correlation withthe difference between the log average years of schooling of the populationaged 15 and above.
4 Concluding remarks
I argue that the relationship between life expectancy and schooling cruciallydepends on which measure of life expectancy one uses. In particular, I showthat while the change in life expectancy at birth between 1960 and 1990is positively correlated with percentage change in schooling, the change inlife expectancy at age 5 is, at best, uncorrelated with percentage change inschooling. This evidence suggests that increasing life horizon beyond the earlycrucial childhood years for formal acquisition of human capital is not asquantitatively important as previously thought.
But what can account for the positive relationship between gains in lifeexpectancy at birth and percentage change in average years of schooling?One may suggest, that a reduction in infant and child mortality may lead toa reduction in fertility and an increase in the investment in human capital ofthe surviving children along the quantity–quality tradeoff. In fact, Kalemli-Ozcan (2002) formalized this argument. She showed that if the marginalutility of a surviving child is convex, then there is a precautionary demandfor children, an effect that is also known as the “hoarding effect”. Underthis setup, a decline in child mortality rate also reduces the uncertainty withrespect to the number of surviving children and, therefore, the demand for
Life expectancy and schooling: new insights from cross-country data 1247
children decreases. Furthermore, she showed that lower mortality encourageseducational investment in children.9
Doepke (2005) studied the effect of a reduction in child mortality onfertility. Doepke allowed for sequential fertility, which introduces on top of thehoarding effect a “replacement” effect: parents may condition their fertilitydecisions on the survival of children that were born previously, and in theoccurrence of a death they can “replace” the deceased child by having an extrabirth. He showed that once sequential fertility choice is allowed for, hoardingbehavior does not arise even if parents are highly risk averse.10
Interestingly, without the hoarding effect, the intuition that as a result of areduction in child mortality, parents waste less resources on children who donot survive to age 5, and this will lead to higher investment in the childrenwho survived to age 5 may be misleading. Incorporating child mortality into astandard setup such as the one of Galor and Weil (2000), shows that the largerthe saving on wasteful resources, the larger is the increase in net fertility andthe reduction in human capital investment. This is simply due to a standardsubstitution effect: a reduction in child mortality lowers the cost of a survivorchild and increase the cost of educating all of the surviving children. Thus,through a substitution effect net fertility increases and the investment in thehuman capital of each child declines. In fact, Doepke (2005) showed that this isprecisely the effect of a reduction in child mortality on fertility and education inthe Barro and Becker (1989) framework as well. The on-line Appendix showsthis formally.
Given the inconclusiveness of the theoretical literature on this issue, assess-ing empirically the link between infant and child mortality on the one hand andfertility and education on the other hand, is highly desirable. Nevertheless, thisis beyond the scope of the current paper and is left for future research.
Acknowledgements I thank two anonymous referees, Oded Galor and Yishay Maoz. I alsothank Shalva Zonenashvili for research assistance.
References
Acemoglu D, Johnson S (2006) Disease and development: the effect of life expectancy oneconomic growth. NBER working paper no. 12269
Angeles L (2010) Demographic transitions: analyzing the effects of mortality on fertility. J PopulEcon 23(1):99–120
9Using cross-country data, Angeles (2010) showed that mortality plays a significant role in fertilityreductions.10Galor (2011) provides a thorough discussion of the necessary conditions which must meet for areduction in child mortality to have a negative effect on the number of surviving children. He thenlooked at the evidence for currently advanced economies and concludes that it is highly unlikelythat declines in mortality rates caused the observed decline in net fertility.
1248 M. Hazan
Bar M, Leukhina O (2010) The role of mortality in the transmission of knowledge. J Econ Growth15:291–321
Barro RJ, Becker GS (1989) Fertility choice in a model of economic growth. Econometrica 57:481–501
Barro RJ, Lee JW (2000) International data on educational attainment: updates and implications.CID working paper no. 42
Ben-Porath Y (1967) The production of human capital and the life cycle of earnings. J Polit Econ75:352–365
Boucekkine R, de la Croix D, Licandro O (2002) Vintage human capital, demographic trends, andendogenous growth. J Econ Theory 104:340–375
Doepke M (2005) Child mortality and fertility decline: does the Barro–Becker model fit the facts?J Popul Econ 18(2):337–366
Galor O (2011) Unified growth theory. Princeton University Press, PrincetonGalor O, Weil DN (2000) Population, technology, and growth: from Malthusian stagnation to the
demographic transition and beyond. Am Econ Rev 90(4):806–828Hazan M (2009) Longevity and lifetime labor supply: evidence and implications. Econometrica
77:1829–1863Hazan M, Zoabi H (2006) Does longevity cause growth? A theoretical critique. J Econ Growth
11(4):363–376Jayachandran S, Lleras-Muney A (2009) Life expectancy and human capital investments: evidence
from maternal mortality declines. Q J Econ 124(1):349–397Kalemli-Ozcan S (2002) Does the mortality decline promote economic growth? J Econ Growth
7:411–439Kalemli-Ozcan S, Ryder HE, Weil DN (2000) Mortality decline, human capital investment, and
economic growth. J Dev Econ 62:1–23Lorentzen P, McMillan J, Wacziarg R (2008) Death and development. J Econ Growth 13:81–124Maoz YD (2008) Backslanted X fertility dynamics and macroeconomics. J Public Econ 21(1):
159–172Moav O (2005) Cheap children and the persistence of poverty. Econ J 115(500):88–110Soares RR (2005) Mortality reductions, educational attainment, and fertility choice. Am Econ Rev
95(3):580–601Zhang J, Zhang J, Lee R (2001) Mortality decline and long-run economic growth. J Public Econ
80:485–507Zhang J, Zhang J, Lee R (2003) Rising longevity, education, savings, and growth. J Dev Econ