17
Life expectancy in the EU 25 Jean-Marie Robine, Sophie Le Roy and the EHEMU team Europe Blanche XXVI Budapest November 2005
| Date post: | 30-Dec-2015 |
| Category: |
Documents |
| Upload: | mckenzie-joyce |
| View: | 23 times |
| Download: | 0 times |

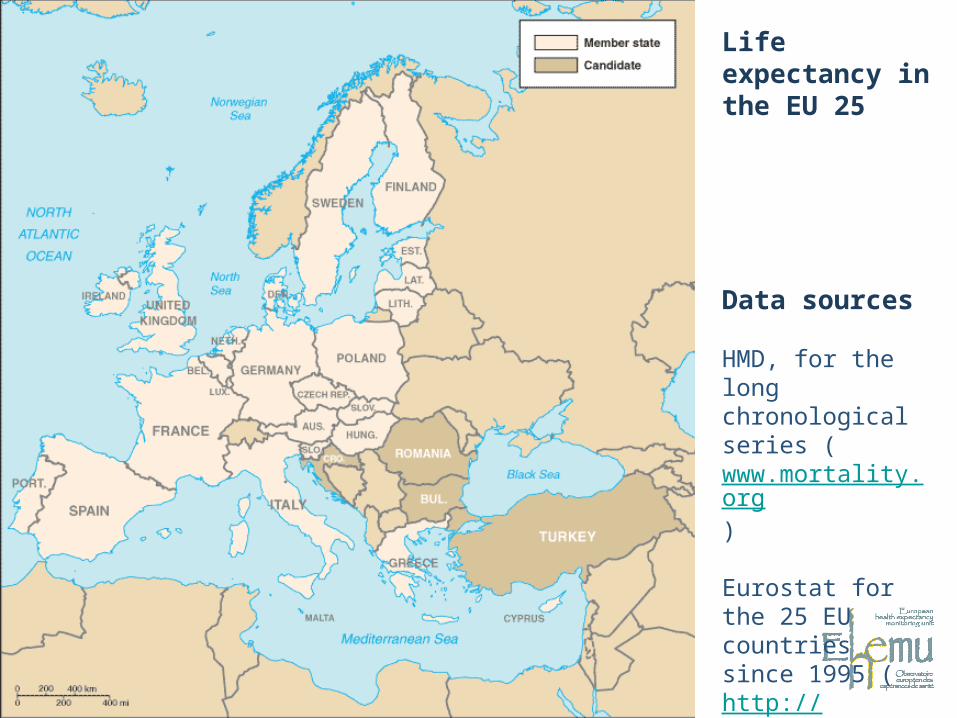
Life expectancy in the EU 25
Jean-Marie Robine, Sophie Le Roy
and the EHEMU team
Europe Blanche XXVI
Budapest November 2005

EHEMU
To assist the European Commission:• to monitor inequalities in health and
longevity among the EU countries• to explore compression or expansion
of healthy life through cross-national comparisons of healthy life expectancy at birth and age 65
• to explore gender differences in health, longevity and healthy life expectancy
• with analysis of the new EU structural indicator Healthy Life Years


More on EHEMU
• EHEMU reports• General reports on life and healthy life
expectancies in the European Union• Country reports
• EHEMU database on LE and HE• EHEMU collaborator networks
• The public health actor network• The expert network
• EHEMU website
(http://www.hs.le.ac.uk/reves.ehemutest /index.html)
Life expectancy in the EU 25
Data sources HMD, for the long chronological series (www.mortality.org) Eurostat for the 25 EU countries since 1995 (http://epp.eurostat.cec.eu.int)

0
10
20
30
40
50
60
70
80
90
1825 1850 1875 1900 1925 1950 1975 2000 2025
Austria Belgium Bulgaria Czech RepublicDenmark England&Wales Finland France
Hungary Italy Latvia LithuaniaNetherlands Norw ay Spain Sw edenSw itzerland
0
5
10
15
20
25
30
35
1825 1850 1875 1900 1925 1950 1975 2000 2025
Life expectancies at birth in European countries since 1825 and deviations from the
maximum values, females
0
10
20
30
40
50
60
70
80
90
1825 1850 1875 1900 1925 1950 1975 2000 2025
Austria Belgium Bulgaria Czech RepublicDenmark England&Wales Finland France
Hungary Italy Latvia LithuaniaNetherlands Norw ay Spain Sw edenSw itzerland
0
5
10
15
20
25
30
35
1825 1850 1875 1900 1925 1950 1975 2000 2025
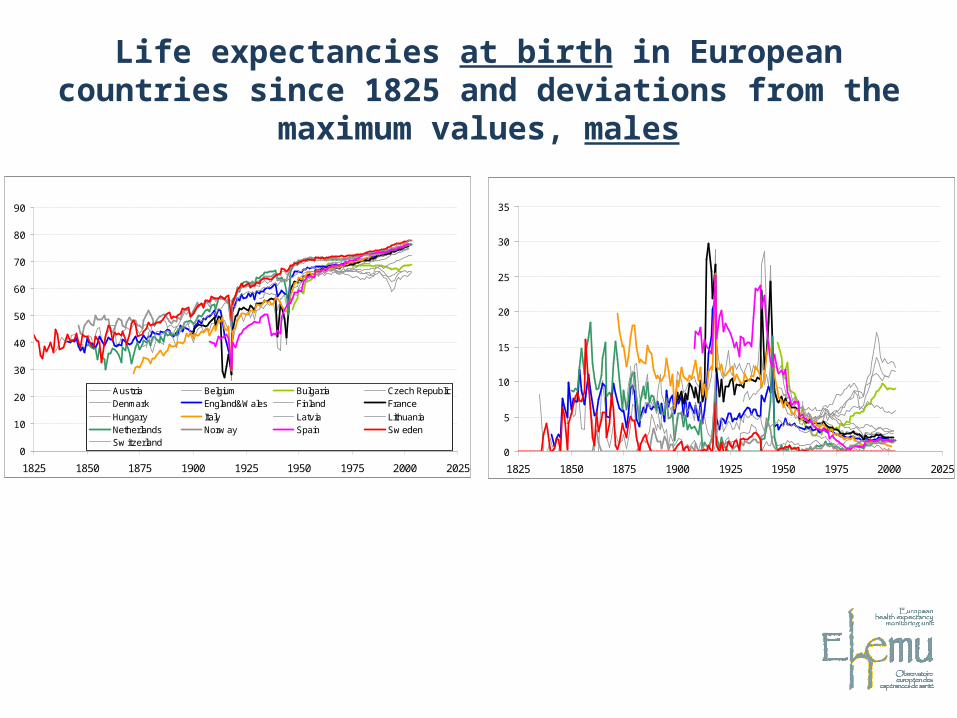
Life expectancies at birth in European countries since 1825 and deviations from the
maximum values, males

Life expectancies at age 65 in European countries since 1825 and deviations from the
maximum values, females
0
5
10
15
20
25
1825 1850 1875 1900 1925 1950 1975 2000 2025
Austria Belgium Bulgaria Czech RepublicDenmark England&Wales Finland France
Hungary Italy Latvia LithuaniaNetherlands Norw ay Spain Sw edenSw itzerland
0
1
2
3
4
5
6
7
8
1825 1850 1875 1900 1925 1950 1975 2000 2025
0
5
10
15
20
25
1825 1850 1875 1900 1925 1950 1975 2000 2025
Austria Belgium Bulgaria Czech RepublicDenmark England&Wales Finland France
Hungary Italy Latvia LithuaniaNetherlands Norw ay Spain Sw edenSw itzerland
0
1
2
3
4
5
6
7
8
1825 1850 1875 1900 1925 1950 1975 2000 2025
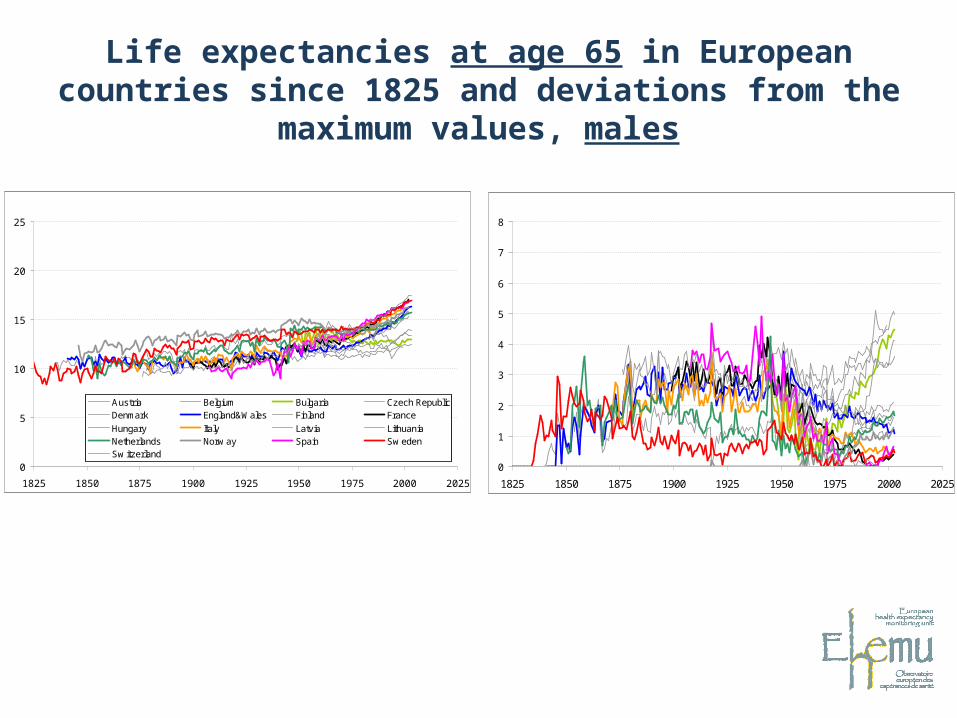
Life expectancies at age 65 in European countries since 1825 and deviations from the
maximum values, males

LE at birthin European countriessince 1945and deviations from maximum values,females:
high convergence, low convergence, divergent group
50
55
60
65
70
75
80
85
1945 1950 1955 1960 1965 1970 1975 1980 1985 1990 1995 2000 2005
Austria Belgium BulgariaCzech Republic Denmark England&WalesFinland France HungaryItaly Latvia LithuaniaNetherlands Norway SpainSweden Switzerland
High convergence
50
55
60
65
70
75
80
85
1945 1950 1955 1960 1965 1970 1975 1980 1985 1990 1995 2000 2005
Austria Belgium BulgariaCzech Republic Denmark England&WalesFinland France HungaryItaly Latvia LithuaniaNetherlands Norway SpainSweden Switzerland Max LE
Divergent group
50
55
60
65
70
75
80
85
1945 1950 1955 1960 1965 1970 1975 1980 1985 1990 1995 2000 2005
Austria Belgium Bulgaria
Czech Republic Denmark England&WalesFinland France Hungary
Italy Latvia LithuaniaNetherlands Norway Spain
Sweden Switzerland
Low convergence basse
0
2
4
6
8
10
12
14
16
18
20
1945 1950 1955 1960 1965 1970 1975 1980 1985 1990 1995 2000 2005
0
2
4
6
8
10
12
14
16
18
20
1945 1950 1955 1960 1965 1970 1975 1980 1985 1990 1995 2000 2005
0
2
4
6
8
10
12
14
16
18
20
1945 1950 1955 1960 1965 1970 1975 1980 1985 1990 1995 2000 2005
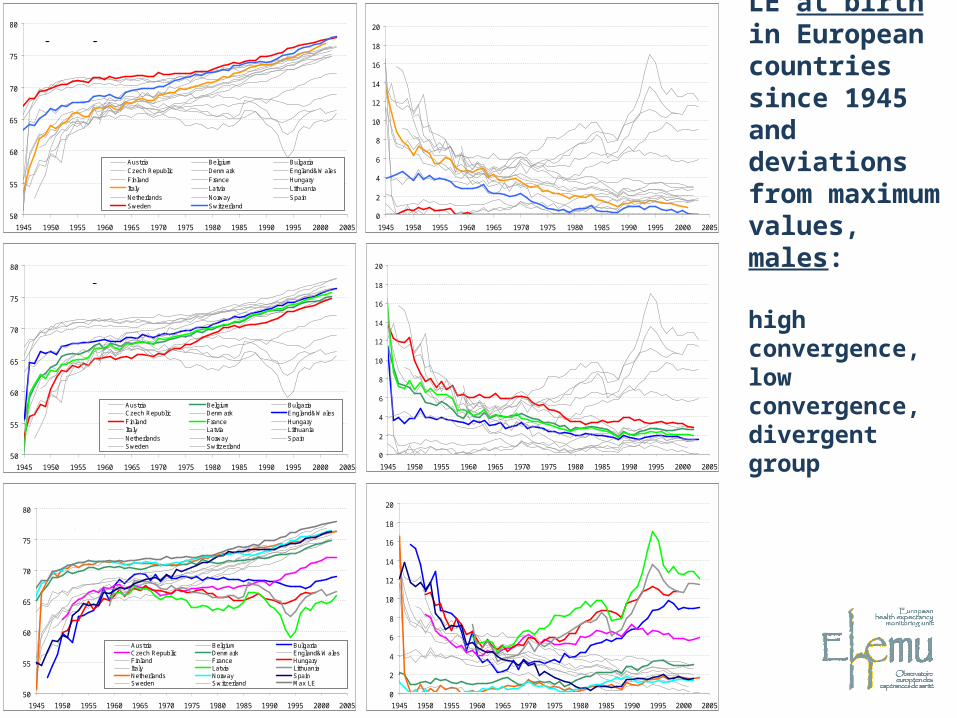
LE at birthin European countriessince 1945and deviations from maximum values,males:
high convergence, low convergence, divergent group
50
55
60
65
70
75
80
1945 1950 1955 1960 1965 1970 1975 1980 1985 1990 1995 2000 2005
Austria Belgium BulgariaCzech Republic Denmark England&WalesFinland France HungaryItaly Latvia LithuaniaNetherlands Norway SpainSweden Switzerland
High convergence
50
55
60
65
70
75
80
1945 1950 1955 1960 1965 1970 1975 1980 1985 1990 1995 2000 2005
Austria Belgium BulgariaCzech Republic Denmark England&WalesFinland France HungaryItaly Latvia LithuaniaNetherlands Norway SpainSweden Switzerland Max LE
Divergent group
50
55
60
65
70
75
80
1945 1950 1955 1960 1965 1970 1975 1980 1985 1990 1995 2000 2005
Austria Belgium BulgariaCzech Republic Denmark England&WalesFinland France HungaryItaly Latvia LithuaniaNetherlands Norway SpainSweden Switzerland
Low convergence
0
2
4
6
8
10
12
14
16
18
20
1945 1950 1955 1960 1965 1970 1975 1980 1985 1990 1995 2000 2005
0
2
4
6
8
10
12
14
16
18
20
1945 1950 1955 1960 1965 1970 1975 1980 1985 1990 1995 2000 2005
0
2
4
6
8
10
12
14
16
18
20
1945 1950 1955 1960 1965 1970 1975 1980 1985 1990 1995 2000 2005

LE at age 65 in European countries since 1945 and deviations from the maximum values,
females: divergent group
5
10
15
20
25
1945 1950 1955 1960 1965 1970 1975 1980 1985 1990 1995 2000 2005
Austria Belgium BulgariaCzech Republic Denmark England&WalesFinland France HungaryItaly Latvia LithuaniaNetherlands Norway SpainSweden Switzerland Max LE
Divergent group
0
1
2
3
4
5
6
7
8
1945 1950 1955 1960 1965 1970 1975 1980 1985 1990 1995 2000 2005
5
10
15
20
25
1945 1950 1955 1960 1965 1970 1975 1980 1985 1990 1995 2000 2005
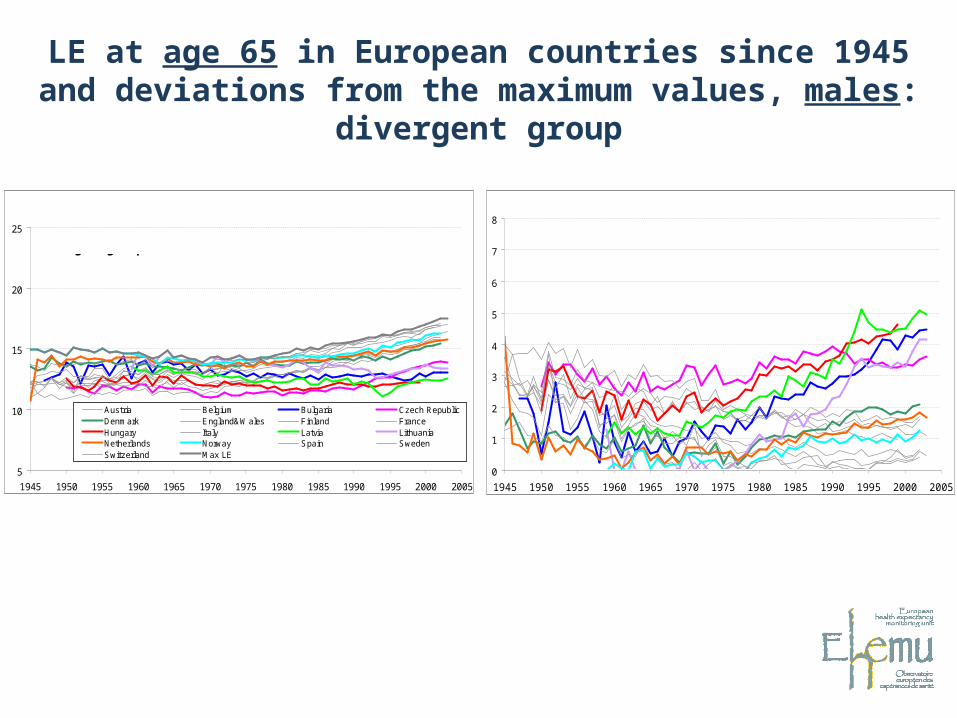
Austria Belgium Bulgaria Czech RepublicDenmark England&Wales Finland FranceHungary Italy Latvia LithuaniaNetherlands Norway Spain SwedenSwitzerland Max LE
Divergent group
0
1
2
3
4
5
6
7
8
1945 1950 1955 1960 1965 1970 1975 1980 1985 1990 1995 2000 2005
LE at age 65 in European countries since 1945 and deviations from the maximum values, males:
divergent group
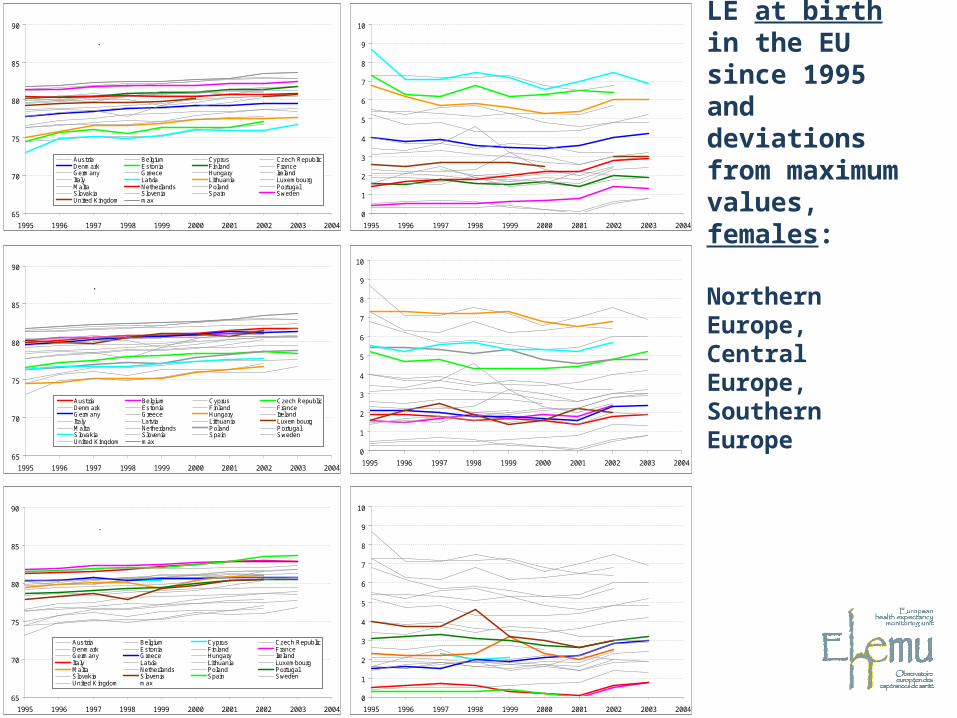
LE at birthin the EUsince 1995and deviations from maximum values,females:
Northern Europe, Central Europe, Southern Europe
65
70
75
80
85
90
1995 1996 1997 1998 1999 2000 2001 2002 2003 2004
Austria Belgium Cyprus Czech RepublicDenmark Estonia Finland FranceGermany Greece Hungary IrelandItaly Latvia Lithuania LuxembourgMalta Netherlands Poland PortugalSlovakia Slovenia Spain SwedenUnited Kingdom max
Northern Europe
0
1
2
3
4
5
6
7
8
9
10
1995 1996 1997 1998 1999 2000 2001 2002 2003 2004
65
70
75
80
85
90
1995 1996 1997 1998 1999 2000 2001 2002 2003 2004
Austria Belgium Cyprus Czech RepublicDenmark Estonia Finland FranceGermany Greece Hungary IrelandItaly Latvia Lithuania LuxembourgMalta Netherlands Poland PortugalSlovakia Slovenia Spain SwedenUnited Kingdom max
Central Europe
0
1
2
3
4
5
6
7
8
9
10
1995 1996 1997 1998 1999 2000 2001 2002 2003 2004
65
70
75
80
85
90
1995 1996 1997 1998 1999 2000 2001 2002 2003 2004
Austria Belgium Cyprus Czech RepublicDenmark Estonia Finland FranceGermany Greece Hungary IrelandItaly Latvia Lithuania LuxembourgMalta Netherlands Poland PortugalSlovakia Slovenia Spain SwedenUnited Kingdom max
Southern Europe
0
1
2
3
4
5
6
7
8
9
10
1995 1996 1997 1998 1999 2000 2001 2002 2003 2004

LE at birthin the EUsince 1995and deviations from maximum values,males:
Northern Europe, Central Europe, Southern Europe
60
65
70
75
80
85
1995 1996 1997 1998 1999 2000 2001 2002 2003 2004
Austria Belgium Cyprus Czech RepublicDenmark Estonia Finland FranceGermany Greece Hungary IrelandItaly Latvia Lithuania LuxembourgMalta Netherlands Poland PortugalSlovakia Slovenia Spain SwedenUnited Kingdom max
Northern Europe
0
2
4
6
8
10
12
14
16
1995 1996 1997 1998 1999 2000 2001 2002 2003 2004
60
65
70
75
80
85
1995 1996 1997 1998 1999 2000 2001 2002 2003 2004
Austria Belgium Cyprus Czech RepublicDenmark Estonia Finland FranceGermany Greece Hungary IrelandItaly Latvia Lithuania LuxembourgMalta Netherlands Poland PortugalSlovakia Slovenia Spain SwedenUnited Kingdom max
Central Europe0
2
4
6
8
10
12
14
16
1995 1996 1997 1998 1999 2000 2001 2002 2003 2004
60
65
70
75
80
85
1995 1996 1997 1998 1999 2000 2001 2002 2003 2004
Austria Belgium Cyprus Czech RepublicDenmark Estonia Finland FranceGermany Greece Hungary IrelandItaly Latvia Lithuania LuxembourgMalta Netherlands Poland PortugalSlovakia Slovenia Spain SwedenUnited Kingdom max
Southern Europe
0
2
4
6
8
10
12
14
16
1995 1996 1997 1998 1999 2000 2001 2002 2003 2004
Conclusions for LE
The deviations in life expectancy are considerable within the European Union:
- reaching a maximum of 12 years for men at birth- reaching a maximum of 7 years for women at birth- at birth as well as at age 65
The current trends do not suggest that life expectancies are converging
Monitoring changes in life expectancy is crucial for the EU

Thank you!


