10/21/2011 1 Life histories of fishes Presented by Nikolai Klibansky Outline I. What is a life history? II. Life history events and traits III. Life history information in fisheries IV. Trends in empirical data V. Life history theory What is a life history? life history – the set of events and traits that define the life cycle of a species walleye (Sander vitreus) Typical life cycle of an oviparous species juvenile larvae egg adult
Transcript
10/21/2011
1
Life histories of fishesPresented by Nikolai Klibansky
Outline
I. What is a life history?II. Life history events and traits
III. Life history information in fisheriesIV. Trends in empirical data
V. Life history theory
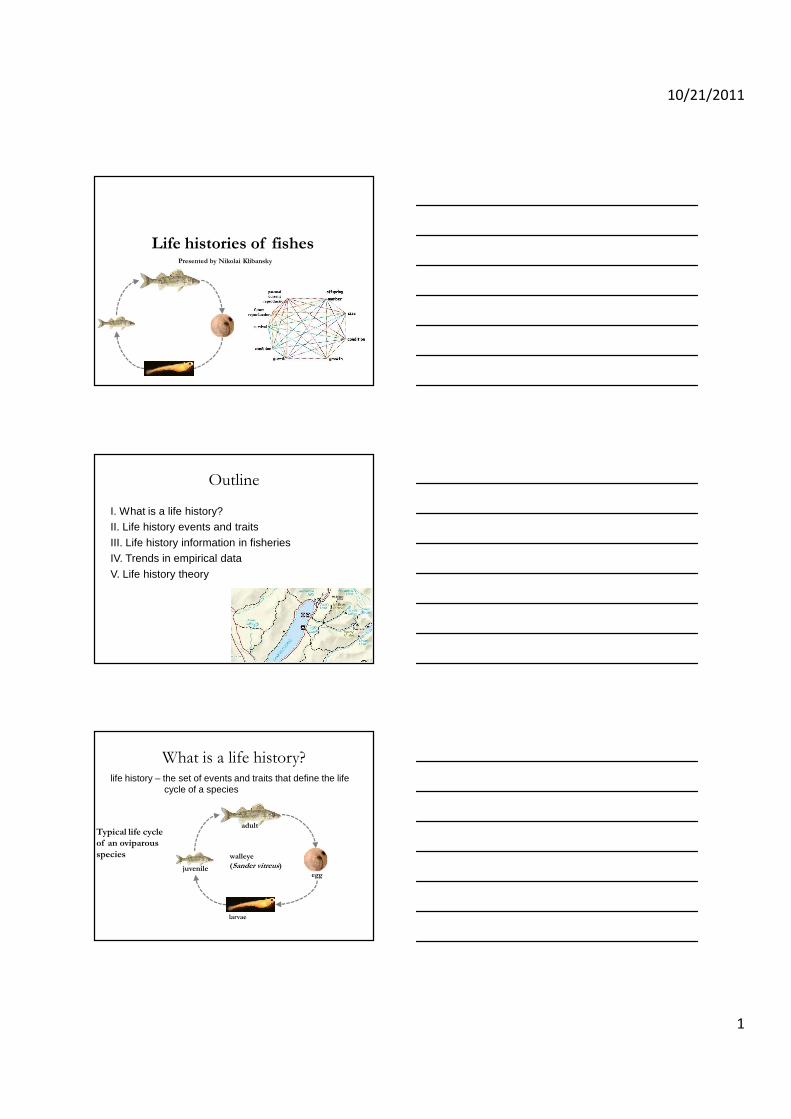
What is a life history?life history – the set of events and traits that define the life
cycle of a species
walleye
(Sander vitreus)
Typical life cycle
of an oviparous
species
juvenile
larvae
egg
adult
10/21/2011
2
Life history events1. birth2. hatching3. metamorphosis4. maturity5. reproduction6. death
birthjuvenile
larvae
egg
maturity & reproduction
death
death
death
death
hatching
metamorphosis
adult
Traits we measure in individuals
1. Size2. Age
…
15
3
2
1
0
15
3
2
1
0
Traits we measure in individuals
…
1. Size2. Age3. Sex4. Maturity stage5. Fecundity
mature
immature
…
10/21/2011
3
Major life history in fisheries
Traits we measure in individuals
1. Sex
2. Age3. Size
4. Maturity stage5. Fecundity
Major life history traits we calculatein populations
1. Size at age (growth)2. Death and age
A. survivorshipB. mortality
3. Size at maturity4. Age at maturity5. Fecundity at size6. Fecundity at age7. Size at sex transition8. Age at sex transition
t = ageN = number of individualsZ = mortality ratee = base of the natural log
10/21/2011
5
Mortality
0
10,000
20,000
30,000
40,000
50,000
60,000
70,000
80,000
90,000
100,000
0 5 10
Nu
mb
er
of
ind
ivid
ua
ls
Age (yrs)
Z=0.5
Z=1.0
Mortality
0
10,000
20,000
30,000
40,000
50,000
60,000
70,000
80,000
90,000
100,000
0 5 10
Nu
mb
er
of
ind
ivid
ua
ls
Age (yrs)
Z=0.5
Z=1.0
Z=1.5
y = 623.83x - 448765
R² = 0.82
0
2
4
6
8
10
0 5000 10000 15000
Fecu
nd
ity
Mil
lio
ns
Total weight (g)
Fecundity at weight
10/21/2011
6
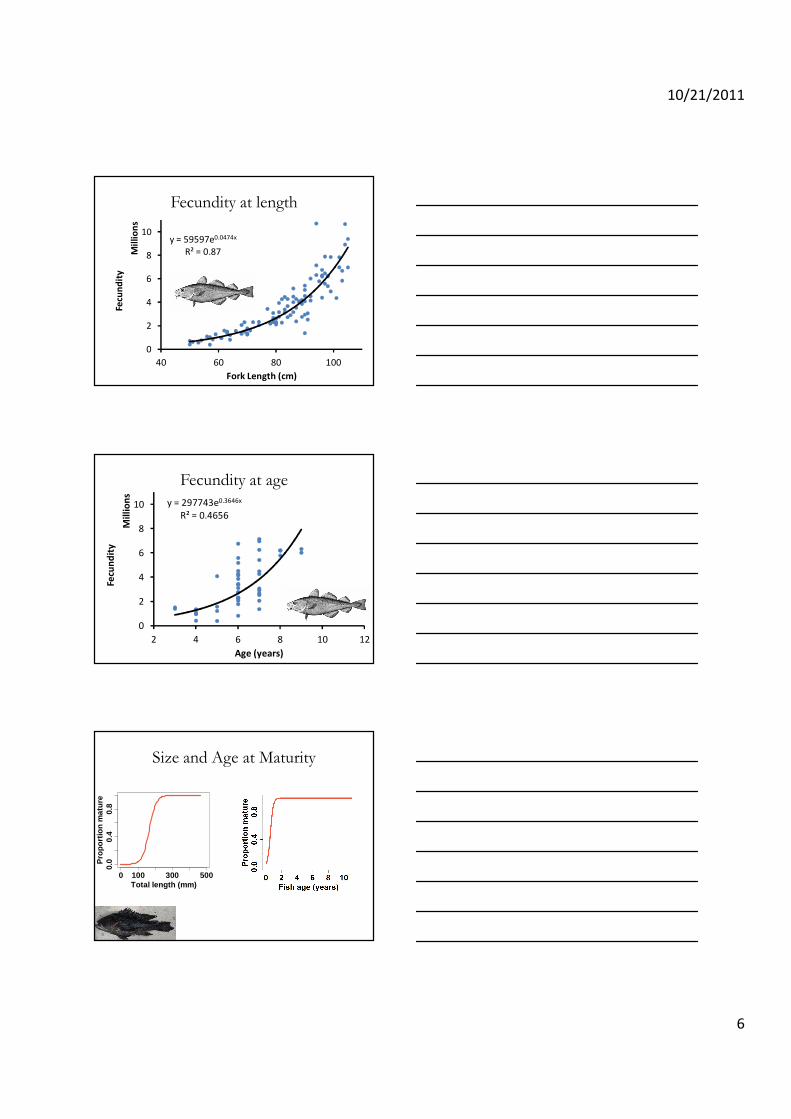
Fecundity at length
y = 59597e0.0474x
R² = 0.87
0
2
4
6
8
10
40 60 80 100
Fecu
nd
ity
Mil
lio
ns
Fork Length (cm)
y = 297743e0.3646x
R² = 0.4656
0
2
4
6
8
10
2 4 6 8 10 12
Fecu
nd
ity
Mil
lio
ns
Age (years)
Fecundity at age
Size and Age at Maturity
0 100 300 500
0.0
0.4
0.8
Total length (mm)
Pro
po
rtio
n m
atu
re
10/21/2011
7
Size and Age at Sex Change
0 100 300 500
0.0
0.4
0.8
Total length (mm)
Pro
po
rtio
n m
ale
0 2 4 6 8 10
0.0
0.4
0.8
Age (years)
Pro
po
rtio
n m
ale
Life history data and fisheries management
050
100150
200250
300350
400450
500
0
5
10
Tota
l len
gth
(mm
)
Age (yr)
0 2 4 6 8 10
0.0
0.4
0.8
Maturity ogive
Fish age (years)
Pro
po
rtio
n m
atur
e
0 2 4 6 8 10
0.0
0.4
0.8
Sex change ogive
Fish age (years)
Pro
por t
ion
mal
e
����+1 = ������−��
BIG SCARY
STOCK ASSESSMENT
MODEL
Trends in empirical data
10/21/2011
8
Teleost orders in
Winemiller and Rose (1992)
Winemiller, K.O., and Rose, K.A. 1992. Patterns of life history diversification in North American fishes - implications for population regulation. Canadian Journal of Fisheries and Aquatic Sciences 49(10): 2196-2218.
12 Clupeiformes
28 Salmoniformes
30 Cypriniformes
12 Siluriformes
71 Perciformes
16 Scorpaeniformes
11 Pleuronectiformes
216 teleost species
Age at maturity
(Average age at maturity)
-age at maturity usually <6-a little higher in marine species-mean overall = 3 years
Winemiller, K.O., and Rose, K.A. 1992. Patterns of life history diversification in North American fishes - implications for population regulation. Canadian Journal of Fisheries and Aquatic Sciences 49(10): 2196-2218.
Spawning season length
-spawning season usually < 4 months-more marine species spawn longer-mean overall = 2.7 months
Winemiller, K.O., and Rose, K.A. 1992. Patterns of life history diversification in North American fishes - implications for population regulation. Canadian Journal of Fisheries and Aquatic Sciences 49(10): 2196-2218.
10/21/2011
9
Parental care
-marine: usually no care, or placement-fresh: many with placement and/or low care
Winemiller, K.O., and Rose, K.A. 1992. Patterns of life history diversification in North American fishes - implications for population regulation. Canadian Journal of Fisheries and Aquatic Sciences 49(10): 2196-2218.
Size at sex change vs. maximum body size
Allsop, D.J., and West, S.A. 2003. Constant relative age and size at sex change for sequentially hermaphroditic fish. Journal of Evolutionary Biology 16: 921-929.
-strong relationship-Fish change sex at:
80% maximum size2.5 times size at maturity
Reproductive investment vs. body size
Duarte, C.M., and Alcaraz, M. 1989. To produce many small or few large eggs: a size-independent reproductive tactic of fish. Oecologia 80(3): 401-404.
-NOTE: reproductive investment is more correct in this case because we’re only dealing with the mass put into reproduction, which does not include energy spent on reproductive behaviors
-Across species reproductive investment increases with fish length
10/21/2011
10
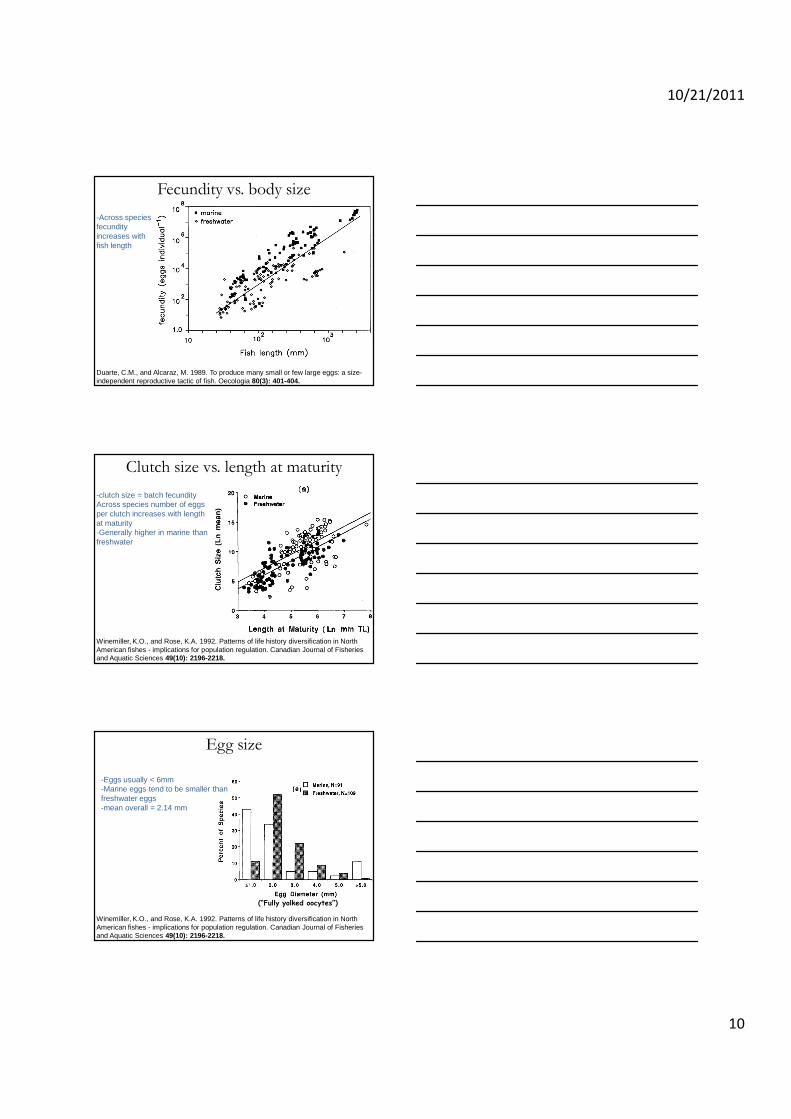
Fecundity vs. body size
Duarte, C.M., and Alcaraz, M. 1989. To produce many small or few large eggs: a size-independent reproductive tactic of fish. Oecologia 80(3): 401-404.
-Across species fecundity increases with fish length
Clutch size vs. length at maturity
Winemiller, K.O., and Rose, K.A. 1992. Patterns of life history diversification in North American fishes - implications for population regulation. Canadian Journal of Fisheries and Aquatic Sciences 49(10): 2196-2218.
-clutch size = batch fecundityAcross species number of eggs per clutch increases with length at maturity-Generally higher in marine than freshwater
Egg size
-Eggs usually < 6mm-Marine eggs tend to be smaller than freshwater eggs-mean overall = 2.14 mm
(“Fully yolked oocytes”)
Winemiller, K.O., and Rose, K.A. 1992. Patterns of life history diversification in North American fishes - implications for population regulation. Canadian Journal of Fisheries and Aquatic Sciences 49(10): 2196-2218.
10/21/2011
11
Egg size
Duarte, C.M., and Alcaraz, M. 1989. To produce many small or few large eggs: a size-independent reproductive tactic of fish. Oecologia 80(3): 401-404.
-Eggs usually < 6mm-Marine eggs tend to be smaller than freshwater eggs-mean overall = 2.3 mm
Egg size vs. body size
Duarte, C.M., and Alcaraz, M. 1989. To produce many small or few large eggs: a size-independent reproductive tactic of fish. Oecologia 80(3): 401-404.
-Mean egg size doesn’t increase with fish size-Egg size rangeseems to increasewith fish size
Egg size vs. offspring size
Duarte, C.M., and Alcaraz, M. 1989. To produce many small or few large eggs: a size-independent reproductive tactic of fish. Oecologia 80(3): 401-404.
bigger eggs = bigger larvae
10/21/2011
12
Mortality rate and body size
Peterson, I., and Wroblewski, J.S. 1984. Mortality rate of fishes in the pelagic ecosystem. Canadian Journal of Fisheries and Aquatic Sciences 41(7): 1117-1120.
smaller fish die faster
Mortality rate and body size
Peterson, I., and Wroblewski, J.S. 1984. Mortality rate of fishes in the pelagic ecosystem. Can. J. Fish. Aquat. Sci. 41(7): 1117-1120.
0 2000 4000 6000 8000
0.5
1.0
1.5
weight (g)
nat
ura
l mo
rtal
ity
rate
(m
) smaller fish die faster
Life history theory
10/21/2011
13
Big questions
Why do we see patterns in life history traits?
Why do we see the specific patterns that we see?
Why don’t we see certain patterns?
e.g. DARWINIAN DEMONS-born mature-grow extremely fast
- massive eggs- high fecundity
-long life
300 years old
Key concepts
1. Fitness2. Phenotype3. Genotype
4. Quantitative traits5. Phenotypic plasticity
6. Reaction norms7. Constraints8. Tradeoffs
9. Life history strategy (pattern)
Key conceptsfitness
– the expected contribution of an allele, genotype, or phenotype to future generations (Stearns, 1992)
– often called reproductive success (Futuyma, 2005)– average per capita rate of increase in numbers (Futuyma, 2005)
0 20 40 60 80 100
050
010
0015
0020
00
time (years)
nu
mb
er o
f ad
ult
s
• Imagining 3 populations of squid which differ only in one life history trait (fecundity)
• High fecundity• Medium fecundity• Low fecundity
10/21/2011
14
Key conceptsgenotypephenotype
TTGCGAATCAACGCTTAG
GTGCGATTCCACGCTAAG
TTGAGATTCAACTCTAAG
TTGCGATCAAACGCTAGT
Scale pattern in carp (Cyprinus carpio)
Key concepts
Scale pattern in carp is a
Mendelian genetic trait
offspring
parents
offspring
parents
Traits like size are
quantitative genetic traits
quantitative traits
Key conceptsphenotypic plasticity
TTGAGATTCAACTCTAAG
TTGAGATTCAACTCTAAG
TTGAGATTCAACTCTAAG
differentdifferentdifferentdifferentphenotypes
identical
genotypes
differentdifferentdifferentdifferentenvironments
POORPOORPOORPOOR
FAIRFAIRFAIRFAIR
GOODGOODGOODGOOD
+ =
10/21/2011
15
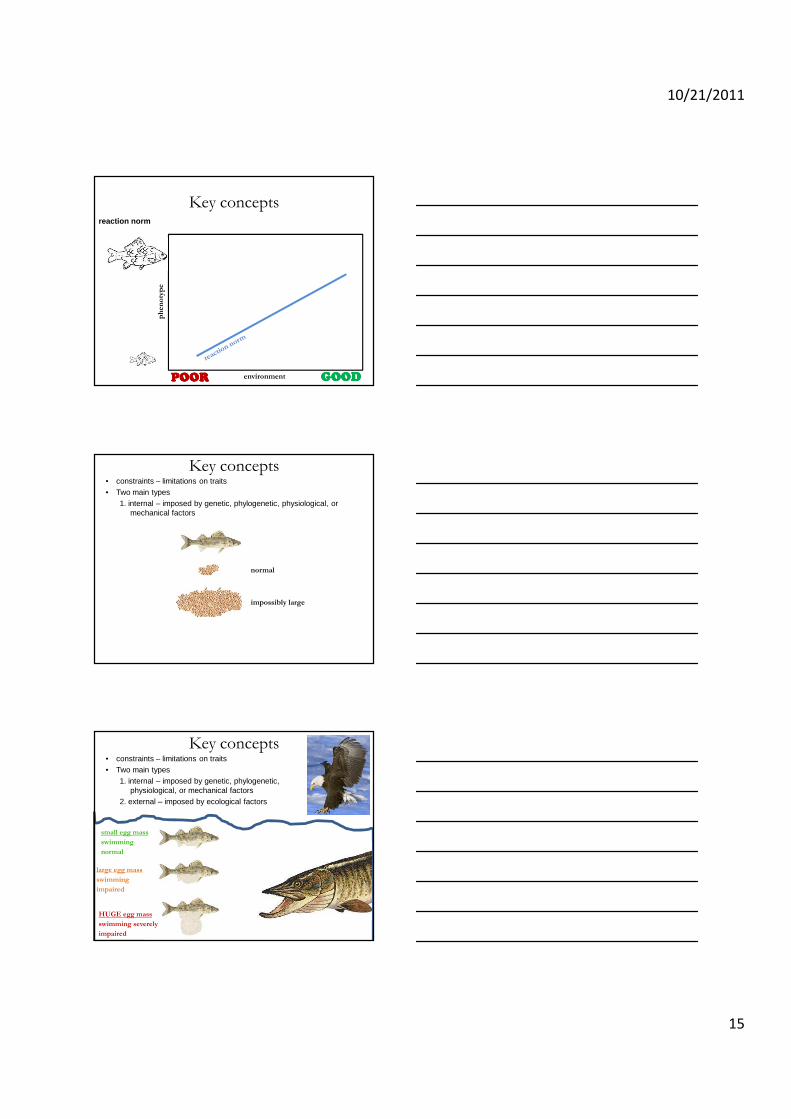
Key conceptsreaction norm
environment
phenotype
POORPOORPOORPOOR GOODGOODGOODGOOD
Key concepts• constraints – limitations on traits• Two main types
1. internal – imposed by genetic, phylogenetic, physiological, or mechanical factors
normal
impossibly large
Key concepts• constraints – limitations on traits• Two main types
1. internal – imposed by genetic, phylogenetic, physiological, or mechanical factors
2. external – imposed by ecological factors
large egg mass
swimming
impaired
small egg mass
swimming
normal
HUGE egg mass
swimming severely
impaired
10/21/2011
16
Key conceptstradeoff – relationship where an increase in one thing implies a decrease in
another (Stearns, 1992)
EXAMPLEEnergy allocated to growth and reproduction
surplusgrowth
reproduction
TOTAL
maintenance
reproduction
growth
Key concepts
• Many life history traits make up the phenotype of each individual fish• Major life history traits according to Stearns (1992)
parental traits
(describing the individual)
growth
number
offspring traits
(describing it’s offspring)
condition
survival
future
reproduction
current
reproduction
size
condition
growth
tradeoff
Key concepts
• Any two traits may exhibit a tradeoff resulting, in a complex network of tradeoffs (Stearns, 1992)
parental traits
(describing the individual)
growth
number
offspring traits
(describing it’s offspring)
condition
survival
future
reproduction
current
reproduction
size
condition
growth
tradeoff
10/21/2011
17
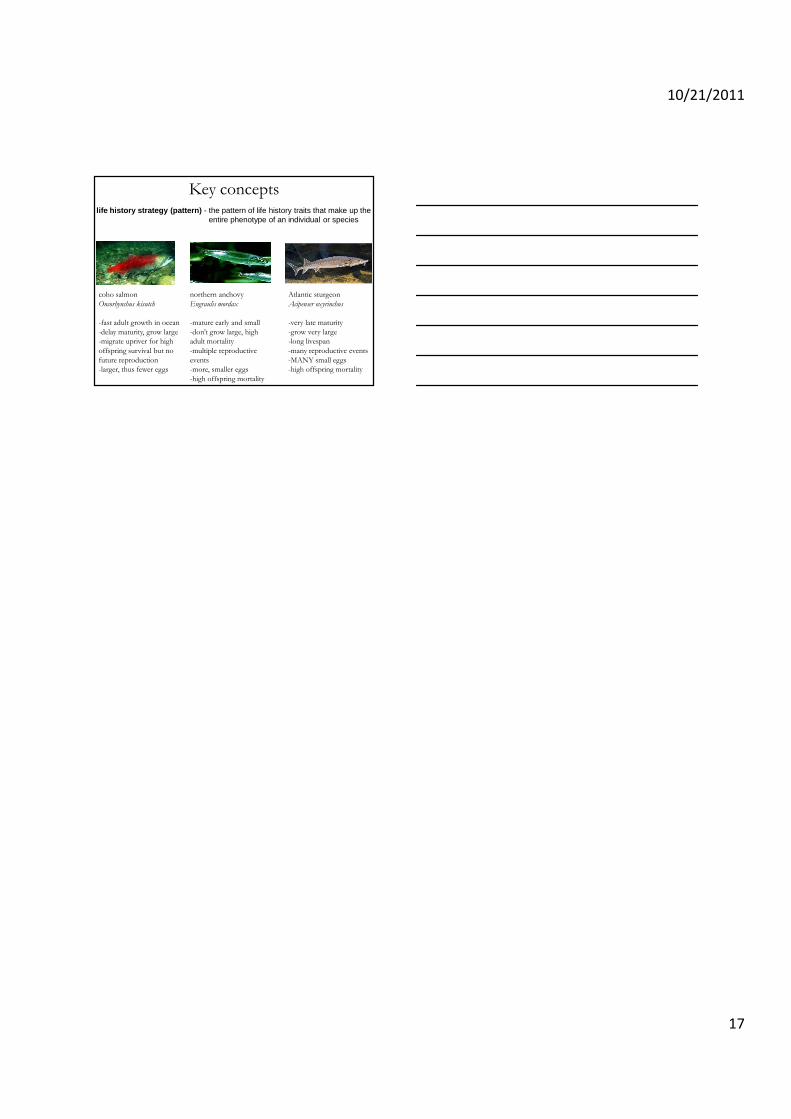
Key conceptslife history strategy (pattern) - the pattern of life history traits that make up the