Life Science Journal 2014;11(3) http://www.lifesciencesite.com 42 Swarm Optimized Fuzzy Reasoning Model (SOFRM) for Diabetes Diagnosis Atiq ur Rehman, Aasia Khanum College of Electrical & Mechanical Engineering, National University of Sciences and Technology (NUST), Islamabad, Pakistan [email protected]Abstract: Early diagnosis of diabetes is important as it reduces the chances of related complications to arise. Several clinical factors are taken into account for reaching conclusion regarding presence or absence of the disease in a given case. However, the exact relationship between these factors and the incidence of disease is not known. Moreover, there is no general consensus regarding relative importance of these factors in determining the disease. Classification systems that rely on such factors tend to be computationally complex due to large number of factors and associations. The aim of this paper is to employ succinct yet effective clinical rules for diagnosis of diabetes. The proposed Swarm Optimized Fuzzy Reasoning Model (SOFRM) employs feature selection for selecting the most discriminative features for diagnosis. The selected features are embedded in a Fuzzy Rule Base with the aim of tolerance to imprecisions in feature measurements and individual fluctuations. Further, the fuzzy rule base is optimized using Swarm Intelligence to achieve highest possible accuracy level. Experimental results demonstrate that SOFRM gives comparable or better accuracy in diabetes diagnosis than many other state-of-art machine learning approaches. [Rehman A, Khanum A. Swarm Optimized Fuzzy Reasoning Model (SOFRM) for Diabetes Diagnosis. Life Sci J 2014;11(3):42-49]. (ISSN:1097-8135). http://www.lifesciencesite.com . 7 Keywords: Diabetes diagnosis; swarm intelligence; fuzzy reasoning model; medical data mining. 1. Introduction Diabetes is a metabolic disease characterized by high blood glucose level, accruing from deficiency of insulin in the body and/or decreased ability to use insulin (Mostafa and Mohammad, 2010). In USA about 8.3% population (about 25 million) is estimated to have diabetes. It is forecasted that by year 2050 about one-third of American people will be diabetic (www.cdc.gov , 2012). To make matters even more complicated, about one-third of diabetic population is unaware of their disease. Notwithstanding, early diagnosis of diabetes is critical to avoid problems like blindness, heart diseases, and renal diseases (www.cdc.gov , 2012), (Takeshi, 2000), (Harris et al, 1992). There are two types of diabetes: Diabetes Type 1 and Diabetes Type 2. Of these, Diabetes Type 2 is more common, and is hard to detect at early stages. Many factors have to be taken into account for concluding that diabetes is present in a person. However the exact relationship between these factors and the incidence of disease is not known as these factors tend to be present in other diseases as well. Moreover, there is no general consensus regarding relative importance of these factors in determining the disease. In this scenario, a clinical expert’s experience plays a significant role in inferring the disease. The clinical expert may use his/her experiential knowledge to decide on the present case. This suggests the possibility of applying computational learning paradigms in developing Computer Aided Diagnosis (CAD) systems for diagnosis of diabetes (Temurtas et al, 2009), (Michalski et al, 1998), (Mostafa and Mohammad, 2010). CAD systems have become a very relevant inter-disciplinary research topic (Antony et all, 2013). In case of diabetes, CAD systems tend to be computationally complex due to large number of indicatory variables and their associations. The aim of this paper is to employ succinct yet effective clinical rules for diagnosis of diabetes. The proposed Swarm Optimized Fuzzy Reasoning Model (SOFRM) employs feature selection for selecting the most discriminative features towards diagnosis. The selected features are embedded in a Fuzzy Rule Base (Zadeh, 1965) with the aim of tolerance to imprecisions in feature measurements and individual fluctuations. Fuzzy rules also make the resultant CAD classifier transparent and interpretable for clinicians. Further, the fuzzy Rule Base is optimized using Swarm Intelligence to achieve highest possible level of accuracy Swarm Intelligence algorithms (Zhu and Tang, 2010) solve complex optimizations problems by studying the behavior of swarms of natural species like ants, wasps, firefly etc. Cuckoo Search belongs to a class of Computational Intelligence systems called Swarm Intelligence algorithms (Zhu and Tang, 2010). Cuckoo Search algorithm is a recent swarm- based algorithm derived from brood parasitic behavior of some cuckoo species as well as Levy
Transcript
Life Science Journal 2014;11(3) http://www.lifesciencesite.com
42
Swarm Optimized Fuzzy Reasoning Model (SOFRM) for Diabetes Diagnosis
Atiq ur Rehman, Aasia Khanum
College of Electrical & Mechanical Engineering, National University of Sciences and Technology (NUST), Islamabad, Pakistan
Abstract: Early diagnosis of diabetes is important as it reduces the chances of related complications to arise. Several clinical factors are taken into account for reaching conclusion regarding presence or absence of the disease in a given case. However, the exact relationship between these factors and the incidence of disease is not known. Moreover, there is no general consensus regarding relative importance of these factors in determining the disease. Classification systems that rely on such factors tend to be computationally complex due to large number of factors and associations. The aim of this paper is to employ succinct yet effective clinical rules for diagnosis of diabetes. The proposed Swarm Optimized Fuzzy Reasoning Model (SOFRM) employs feature selection for selecting the most discriminative features for diagnosis. The selected features are embedded in a Fuzzy Rule Base with the aim of tolerance to imprecisions in feature measurements and individual fluctuations. Further, the fuzzy rule base is optimized using Swarm Intelligence to achieve highest possible accuracy level. Experimental results demonstrate that SOFRM gives comparable or better accuracy in diabetes diagnosis than many other state-of-art machine learning approaches. [Rehman A, Khanum A. Swarm Optimized Fuzzy Reasoning Model (SOFRM) for Diabetes Diagnosis. Life Sci J 2014;11(3):42-49]. (ISSN:1097-8135). http://www.lifesciencesite.com. 7 Keywords: Diabetes diagnosis; swarm intelligence; fuzzy reasoning model; medical data mining.
1. Introduction
Diabetes is a metabolic disease characterized by high blood glucose level, accruing from deficiency of insulin in the body and/or decreased ability to use insulin (Mostafa and Mohammad, 2010). In USA about 8.3% population (about 25 million) is estimated to have diabetes. It is forecasted that by year 2050 about one-third of American people will be diabetic (www.cdc.gov , 2012). To make matters even more complicated, about one-third of diabetic population is unaware of their disease. Notwithstanding, early diagnosis of diabetes is critical to avoid problems like blindness, heart diseases, and renal diseases (www.cdc.gov, 2012), (Takeshi, 2000), (Harris et al, 1992).
There are two types of diabetes: Diabetes Type 1 and Diabetes Type 2. Of these, Diabetes Type 2 is more common, and is hard to detect at early stages. Many factors have to be taken into account for concluding that diabetes is present in a person. However the exact relationship between these factors and the incidence of disease is not known as these factors tend to be present in other diseases as well. Moreover, there is no general consensus regarding relative importance of these factors in determining the disease. In this scenario, a clinical expert’s experience plays a significant role in inferring the disease. The clinical expert may use his/her experiential knowledge to decide on the present case. This suggests the possibility of applying computational learning paradigms in developing
Computer Aided Diagnosis (CAD) systems for diagnosis of diabetes (Temurtas et al, 2009), (Michalski et al, 1998), (Mostafa and Mohammad, 2010).
CAD systems have become a very relevant inter-disciplinary research topic (Antony et all, 2013). In case of diabetes, CAD systems tend to be computationally complex due to large number of indicatory variables and their associations. The aim of this paper is to employ succinct yet effective clinical rules for diagnosis of diabetes. The proposed Swarm Optimized Fuzzy Reasoning Model (SOFRM) employs feature selection for selecting the most discriminative features towards diagnosis. The selected features are embedded in a Fuzzy Rule Base (Zadeh, 1965) with the aim of tolerance to imprecisions in feature measurements and individual fluctuations. Fuzzy rules also make the resultant CAD classifier transparent and interpretable for clinicians. Further, the fuzzy Rule Base is optimized using Swarm Intelligence to achieve highest possible level of accuracy
Swarm Intelligence algorithms (Zhu and Tang, 2010) solve complex optimizations problems by studying the behavior of swarms of natural species like ants, wasps, firefly etc. Cuckoo Search belongs to a class of Computational Intelligence systems called Swarm Intelligence algorithms (Zhu and Tang, 2010). Cuckoo Search algorithm is a recent swarm-based algorithm derived from brood parasitic behavior of some cuckoo species as well as Levy
Life Science Journal 2014;11(3) http://www.lifesciencesite.com
43
Flight behavior of some birds (Yang and Deb, 2010). Cuckoo Search was proposed by Yang and Deb in 2010. Cuckoo Search is superior to frontline Swarm Intelligence algorithms including Particle Swarm Optimization (PSO) and Genetic Algorithms (GA) due to two advantages: firstly, Cuckoo Search is a population based approach and thus has a capability to reach global optima without getting trapped in local optima. Secondly, exploring random solutions in Cuckoo Search is found to be more efficient as its steps follow a heavy-tailed distribution. Also, when compared to GA and PSO, Cuckoo Search has to tune lesser number of parameters making it more generic in nature. In this paper, we apply Cuckoo Search to optimize a Fuzzy Rule Based classifier for diagnosis of diabetes type II. Results confirm that the proposed classifier provides better results than other conventional approaches.
In the past few years, use of Swarm Intelligence to optimize medical CAD systems has been increasing. For instance, (Mostafa and Mohammad, 2010) used Ant Colony Optimization to optimize Fuzzy Logic for rule selection of diabetes. They proposed a new framework for learning fuzzy rules. Their classifier showed better classification rate and more comprehensibility of fuzzy rules as compared to many other contemporary methods. Their implementation of Ant Colony Optimization paid more attention to cooperation rather than to the aspect of competition among ants. This resulted in a set of strong fuzzy rules.
(Ling et al, 2010) used Fuzzy Reasoning Model (FRM) for hypoglycemia detection. The FRM parameters were optimized by Hybrid Particle Swarm Intelligence with wavelet mutation. The proposed approach overcomes the drawback of getting trapped in local minima in basic PSO. Varying the number of membership functions used in FRM, they also enhanced sensitivity and specificity of their classifier.
(Chi et al, 2008) applied Weighted Least Square-Support Vector Machines (WLS_SVM) for diabetes diagnosis such that the SVM was simplified using PSO. They showed that this combination of PSO and SVM can handle large data samples and also overcomes the problem of slow model building.
(Jyun, 2010) used a hybrid approach of Case Based Reasoning (CBR) system and Particle Swarm Optimization (PSO) for liver disorder diagnosis. First, the dataset is preprocessed using CBR and features are given weights with respect to their contribution towards classification. Later, PSO performs clustering of the given dataset. Initially the number of clusters is kept large to reduce the effect of initial conditions. Finally, the number of clusters is reduced to two.
(Karim et al, 2010) used PSO and a controller based upon Hammerstein model to regulate the value of insulin to be injected for blood glucose level optimization. Use of Swarm Intelligence technique resulted in improvement of controller’s operation.
(Zadeh et al, 2006) used Swarm Intelligence for medical data mining. Their approach also handles missing values in the dataset. This data mining strategy uses interactive rules extraction. They have shown that Swarm Intelligence techniques are superior to the traditional techniques in data mining and rule extraction. Swarm Intelligence techniques are more flexible and robust than traditional probabilistic techniques such as Bayesian Believe Networks (BNN). 2. Theoretical Background a. Fuzzy Reasoning Model
In 1965 Zadeh (Zadeh, 1965) introduced Fuzzy Logic to approximate the behavior of a system which is too complex to be described in the form of precise mathematical model. In contrast to Boolean logic which takes only two values (0 and 1) Fuzzy Logic is a many-valued logic. As an example we can say that if traditional logic deals with truth and false, Fuzzy Logic deals with values which range from complete truth to partial truth, partial false and ultimately to complete false.
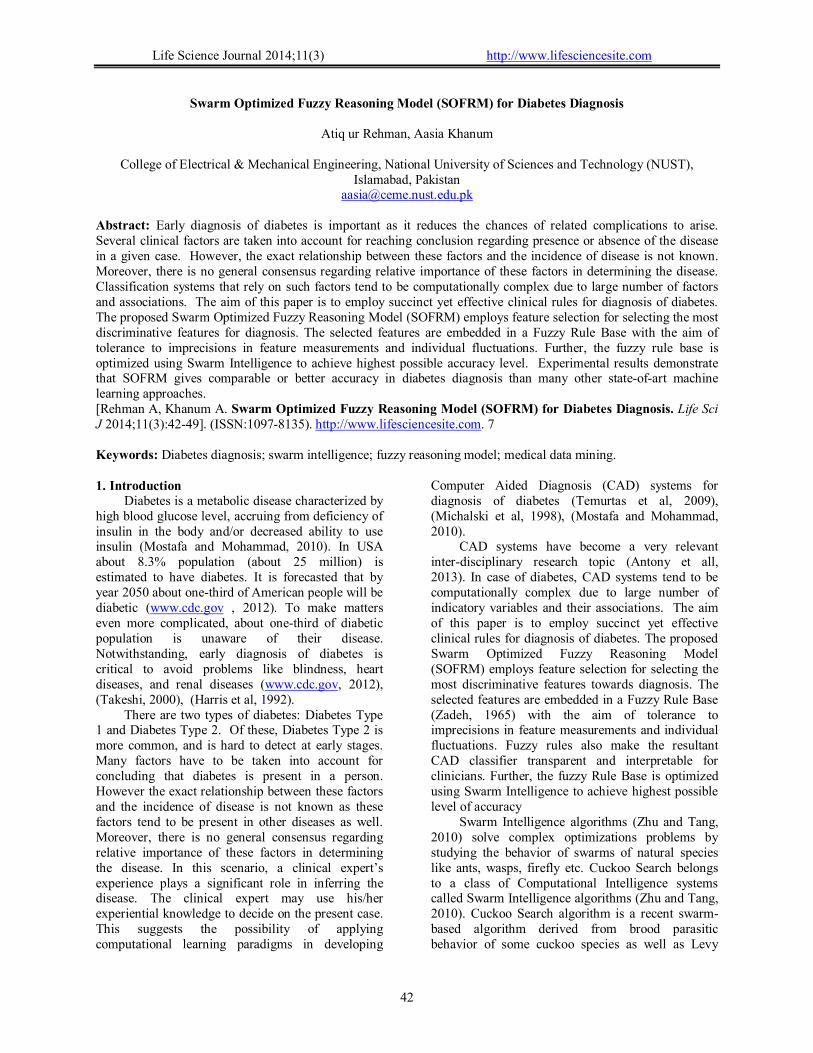
A typical Fuzzy Reasoning Model (FRM) consists of three steps, as shown in Figure 1:
Figure 1. Steps in FRM execution Step 1 (Fuzzification): This step converts crisp input to fuzzy truth values with help of fuzzy membership functions. Membership functions can have any shape, but in general Gaussian functions are used due to their better approximation capabilities. Step 2 (Reasoning by Fuzzy If-then rules): Reasoning is performed by an inference engine that infers a decision depending on collective activation
Fuzzifier
Input 1
Input 2
Input n
Fuzzy Rules
Inference Engine
Defuzzifier Output
Life Science Journal 2014;11(3) http://www.lifesciencesite.com
44
degrees of rules in a rule base. Each fuzzy rule takes this form:
where are input parameters, are
membership functions, and is output parameter. Step 3 (Defuzzification): The result of above reasoning is a fuzzy value which is converted into a corresponding crisp value with help of a defuzzification function. Generally the Center of Gravity (COG) defuzzifier is used. 2. Cuckoo Search
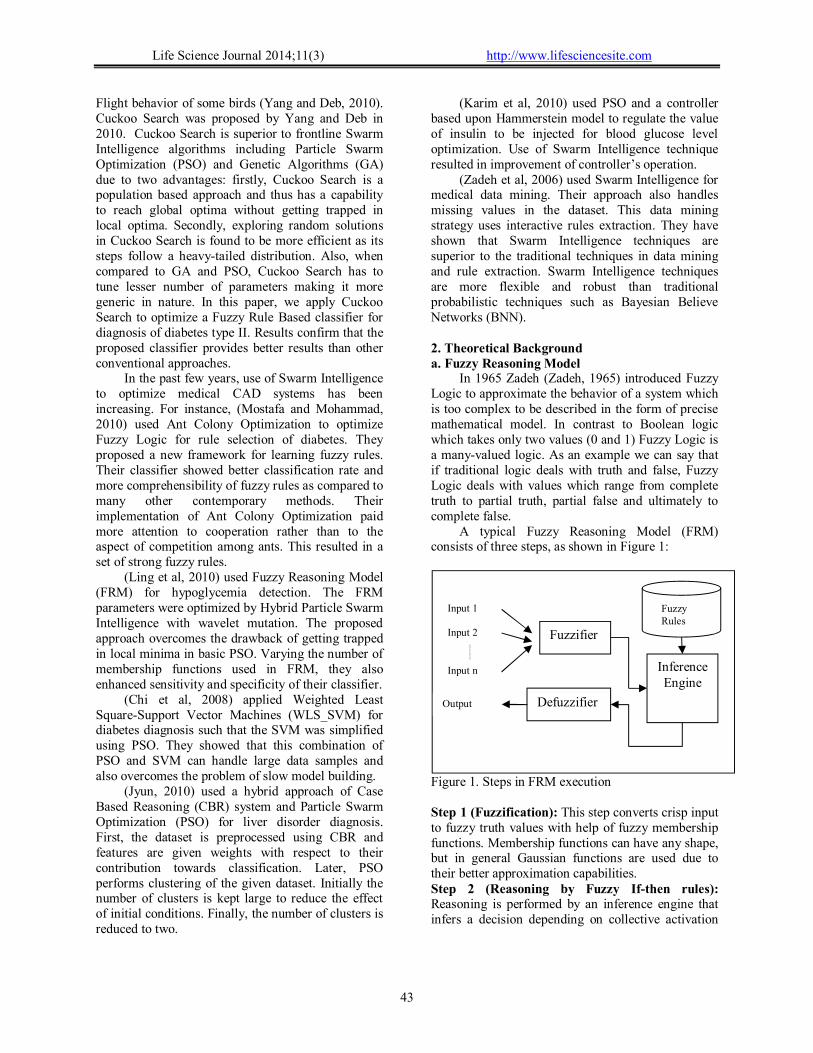
Cuckoo Search algorithm is based upon parasitic reproductive strategy of some cuckoo species. These birds lay their eggs in some other species’ (host) nest. If host becomes aware of the alien eggs, it throws away those parasitic eggs. To avoid this scenario (Yang and Deb, 2010), following strategies are possible: One, some cuckoo species may mimic the color and pattern of host eggs. Two, cuckoos may lay eggs in a nest where host has just laid its own eggs. Three, once a cuckoo chick is hatched it removes host eggs from the nest to ensure larger share in the host parent’s food supply.
Cuckoo Search algorithm mimics the above behavior to obtain optimized solution to problems with large solution spaces. When applied to classifier optimization, each nest represents a solution (i.e. classifier parameters) and the aim of cuckoo search is to arrive at optimum solution over several generations (i.e. iterations). Figure 2 describes the pseudo-code of Cuckoo Search. In this pseudo-code each nest represents a single solution. pa represents the probability with which cuckoo egg will be discovered and discarded by host (in our scenario, the probability that worst nest will be discarded in search of better nests), such that paε [0, 1]. In this algorithm, Levy Flight is performed to generate new nests (solutions). Flight behavior of many birds and insects has been observed to follow patterns of Levy Flight (Yang and Deb, 2010).
A Lévy Flight is a kind of random walk in which the step-lengths have a probability distribution that is heavy-tailed (Wikipedia, 2012). Variation in flight direction is distributed according to the power law series, with infinite variance and mean (Gandomi et al, 2011):
(1) Given an initial solution xi(t) at time t, a new
solution at time t+1 i.e. xi(t+1) is generated using Levy Flight as follows:
xi(t+1) = xi(t) + Levy(λ) (2)
Here, is step length and is used to scale the effect of Levy Flight. Its value is greater than 0 (usually equal to 1). Operator denotes point to point multiplication.
Algorithm 1: Cuckoo Search via Levy Flights
Begin
Initialize randomly a population of ‘n’ host nests (i.e. solutions) as xi, (i = 1, 2,…, n). Apply problem-specific fitness function, f(x) to determine the best nest with best fitness value WHILE (best fitness value is below a threshold t1 OR number of iterations is below a threshold t2) Discard a fraction paε [0,1] of the worst nests Generate new nests using Levy Flight Replace discarded nests with new nest using biased random walks Find current best nest in the current population using f(x) IF (fitness (current best nest) > fitness (best nest)) Update best nest = current best nest End IF End WHILE Output best nest End
Figure 2. Cuckoo Search Pseudocode 2. Material and Methods
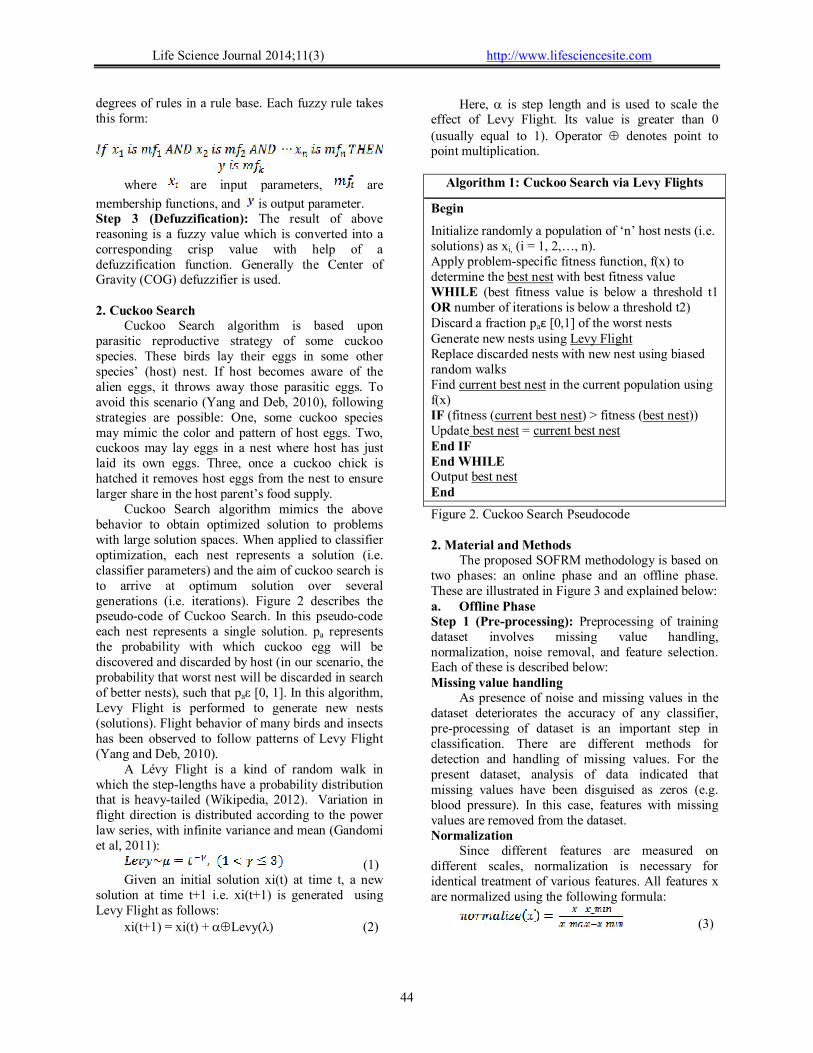
The proposed SOFRM methodology is based on two phases: an online phase and an offline phase. These are illustrated in Figure 3 and explained below: a. Offline Phase Step 1 (Pre-processing): Preprocessing of training dataset involves missing value handling, normalization, noise removal, and feature selection. Each of these is described below: Missing value handling
As presence of noise and missing values in the dataset deteriorates the accuracy of any classifier, pre-processing of dataset is an important step in classification. There are different methods for detection and handling of missing values. For the present dataset, analysis of data indicated that missing values have been disguised as zeros (e.g. blood pressure). In this case, features with missing values are removed from the dataset. Normalization
Since different features are measured on different scales, normalization is necessary for identical treatment of various features. All features x are normalized using the following formula:
(3)
Life Science Journal 2014;11(3) http://www.lifesciencesite.com
45
Figure 3. SOFRM Architecture Feature Selection
We need to select only the most informative features from the training dataset for simpler FRM implementation and better classification accuracy. Accordingly, we have applied the Weiss/Indurkhya 'independent features' significance testing method (Weiss and Indurkhya, 1997) to gauge significance of each feature in describing the output. The features with highest significance are retained by the system and the rest are discarded. Noise Removal
Noise refers to outlier samples in the training dataset. K-means clustering (Wikipedia, 2013) algorithm has been used to detect outliers. During clustering we initially use all input attributes of the dataset (except those discarded due to missing values). Then we remove the least significant attribute according to Weiss/Indurkhya 'independent features' significance mentioned above, and cluster
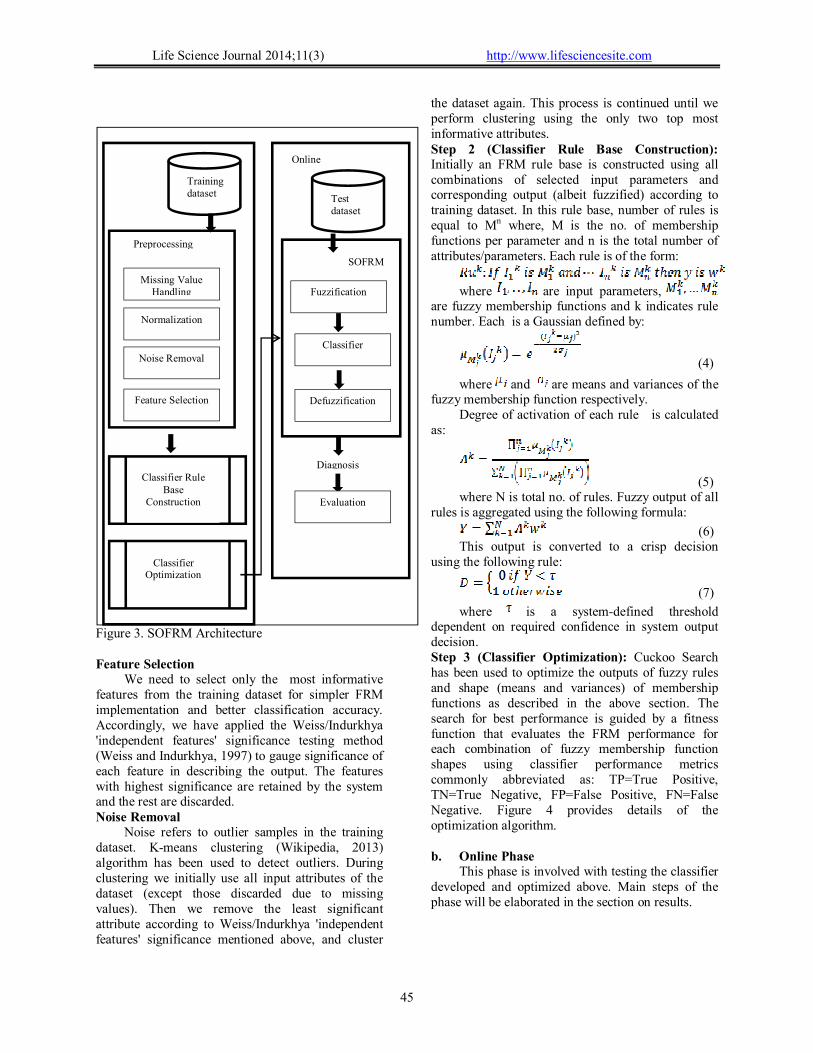
the dataset again. This process is continued until we perform clustering using the only two top most informative attributes. Step 2 (Classifier Rule Base Construction): Initially an FRM rule base is constructed using all combinations of selected input parameters and corresponding output (albeit fuzzified) according to training dataset. In this rule base, number of rules is equal to Mn where, M is the no. of membership functions per parameter and n is the total number of attributes/parameters. Each rule is of the form:
where are input parameters,
are fuzzy membership functions and k indicates rule number. Each is a Gaussian defined by:
(4)
where and are means and variances of the fuzzy membership function respectively.
Degree of activation of each rule is calculated as:
(5) where N is total no. of rules. Fuzzy output of all
rules is aggregated using the following formula:
(6) This output is converted to a crisp decision
using the following rule:
(7)
where is a system-defined threshold dependent on required confidence in system output decision. Step 3 (Classifier Optimization): Cuckoo Search has been used to optimize the outputs of fuzzy rules and shape (means and variances) of membership functions as described in the above section. The search for best performance is guided by a fitness function that evaluates the FRM performance for each combination of fuzzy membership function shapes using classifier performance metrics commonly abbreviated as: TP=True Positive, TN=True Negative, FP=False Positive, FN=False Negative. Figure 4 provides details of the optimization algorithm. b. Online Phase
This phase is involved with testing the classifier developed and optimized above. Main steps of the phase will be elaborated in the section on results.
Training dataset
Missing Value Handling
Noise Removal
Feature Selection
Preprocessing
Classifier Rule Base
Construction
Online
Test dataset
Classifier
Diagnosis
Evaluation
Normalization
Defuzzification
Fuzzification
SOFRM
Classifier Optimization
Life Science Journal 2014;11(3) http://www.lifesciencesite.com
46
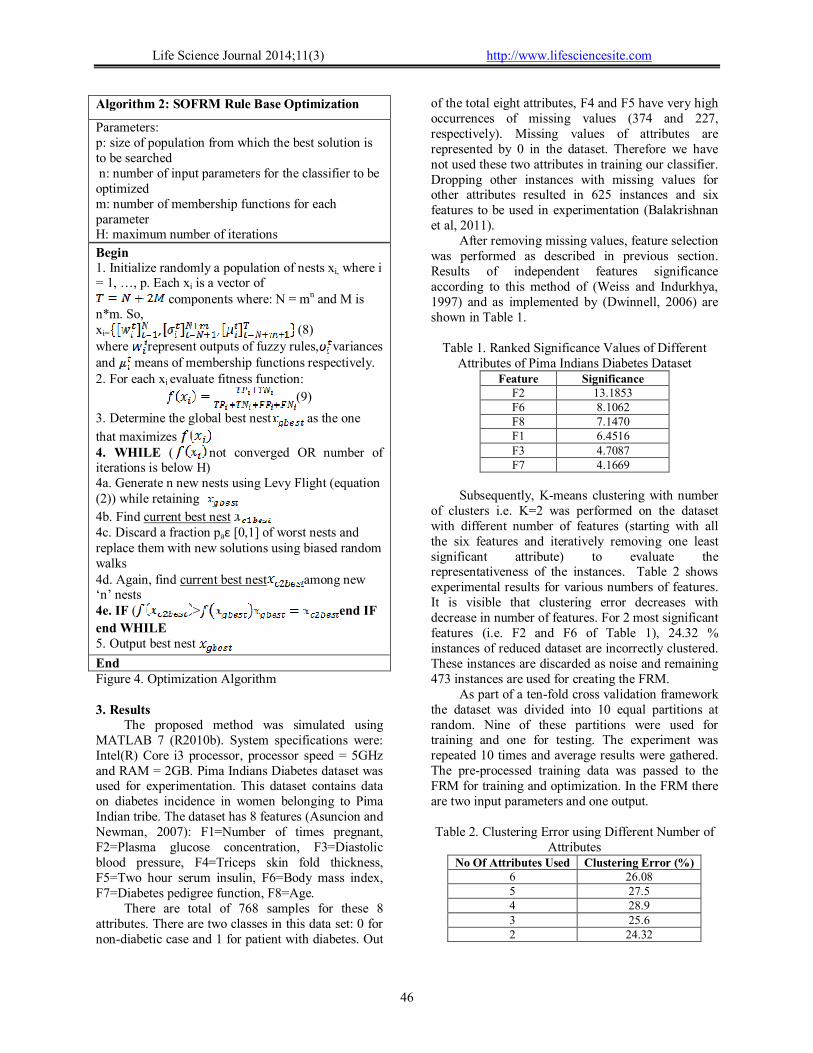
Algorithm 2: SOFRM Rule Base Optimization
Parameters: p: size of population from which the best solution is to be searched n: number of input parameters for the classifier to be optimized m: number of membership functions for each parameter H: maximum number of iterations
Begin 1. Initialize randomly a population of nests xi, where i = 1, …, p. Each xi is a vector of
components where: N = mn and M is n*m. So, xi= (8) where represent outputs of fuzzy rules, variances and means of membership functions respectively. 2. For each xi evaluate fitness function:
(9)
3. Determine the global best nest as the one
that maximizes 4. WHILE ( not converged OR number of iterations is below H) 4a. Generate n new nests using Levy Flight (equation (2)) while retaining
4b. Find current best nest 4c. Discard a fraction paε [0,1] of worst nests and replace them with new solutions using biased random walks 4d. Again, find current best nest among new ‘n’ nests 4e. IF ( > end IF
end WHILE 5. Output best nest
End Figure 4. Optimization Algorithm 3. Results
The proposed method was simulated using MATLAB 7 (R2010b). System specifications were: Intel(R) Core i3 processor, processor speed = 5GHz and RAM = 2GB. Pima Indians Diabetes dataset was used for experimentation. This dataset contains data on diabetes incidence in women belonging to Pima Indian tribe. The dataset has 8 features (Asuncion and Newman, 2007): F1=Number of times pregnant, F2=Plasma glucose concentration, F3=Diastolic blood pressure, F4=Triceps skin fold thickness, F5=Two hour serum insulin, F6=Body mass index, F7=Diabetes pedigree function, F8=Age.
There are total of 768 samples for these 8 attributes. There are two classes in this data set: 0 for non-diabetic case and 1 for patient with diabetes. Out
of the total eight attributes, F4 and F5 have very high occurrences of missing values (374 and 227, respectively). Missing values of attributes are represented by 0 in the dataset. Therefore we have not used these two attributes in training our classifier. Dropping other instances with missing values for other attributes resulted in 625 instances and six features to be used in experimentation (Balakrishnan et al, 2011).
After removing missing values, feature selection was performed as described in previous section. Results of independent features significance according to this method of (Weiss and Indurkhya, 1997) and as implemented by (Dwinnell, 2006) are shown in Table 1.
Table 1. Ranked Significance Values of Different
Attributes of Pima Indians Diabetes Dataset Feature Significance
of clusters i.e. K=2 was performed on the dataset with different number of features (starting with all the six features and iteratively removing one least significant attribute) to evaluate the representativeness of the instances. Table 2 shows experimental results for various numbers of features. It is visible that clustering error decreases with decrease in number of features. For 2 most significant features (i.e. F2 and F6 of Table 1), 24.32 % instances of reduced dataset are incorrectly clustered. These instances are discarded as noise and remaining 473 instances are used for creating the FRM.
As part of a ten-fold cross validation framework the dataset was divided into 10 equal partitions at random. Nine of these partitions were used for training and one for testing. The experiment was repeated 10 times and average results were gathered. The pre-processed training data was passed to the FRM for training and optimization. In the FRM there are two input parameters and one output.
Table 2. Clustering Error using Different Number of
Attributes No Of Attributes Used Clustering Error (%)
6 26.08 5 27.5 4 28.9 3 25.6 2 24.32
Life Science Journal 2014;11(3) http://www.lifesciencesite.com
47
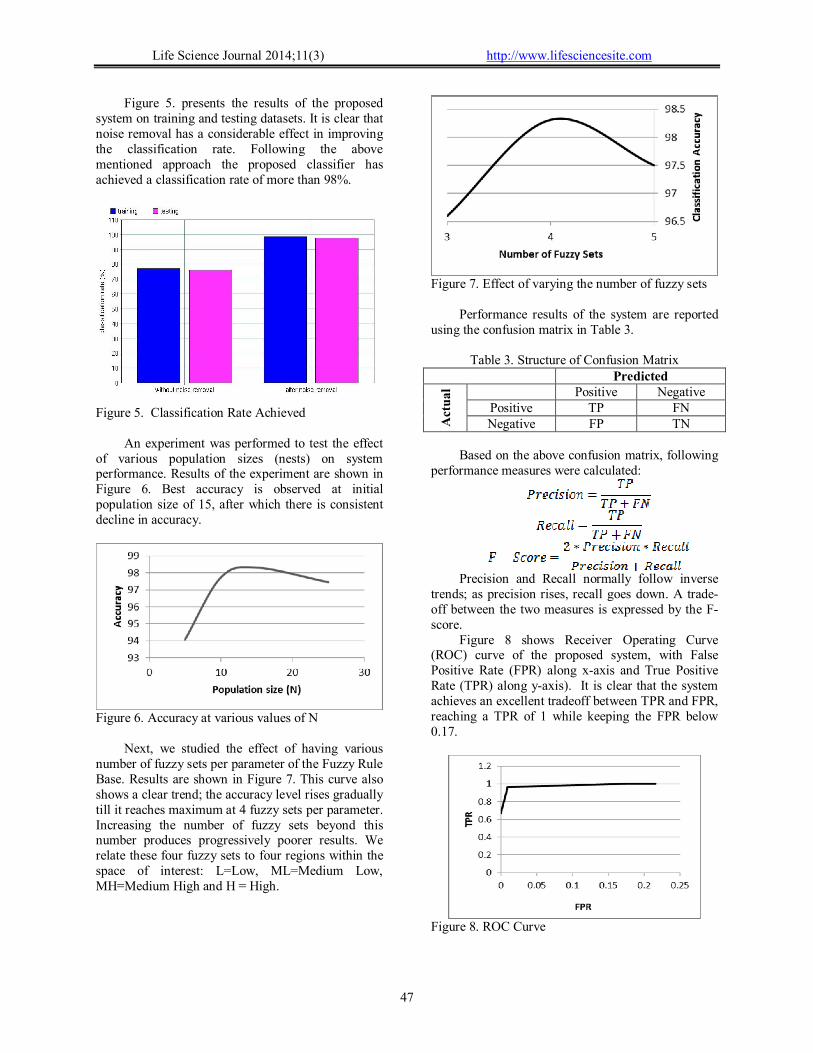
Figure 5. presents the results of the proposed system on training and testing datasets. It is clear that noise removal has a considerable effect in improving the classification rate. Following the above mentioned approach the proposed classifier has achieved a classification rate of more than 98%.
Figure 5. Classification Rate Achieved
An experiment was performed to test the effect
of various population sizes (nests) on system performance. Results of the experiment are shown in Figure 6. Best accuracy is observed at initial population size of 15, after which there is consistent decline in accuracy.
Figure 6. Accuracy at various values of N
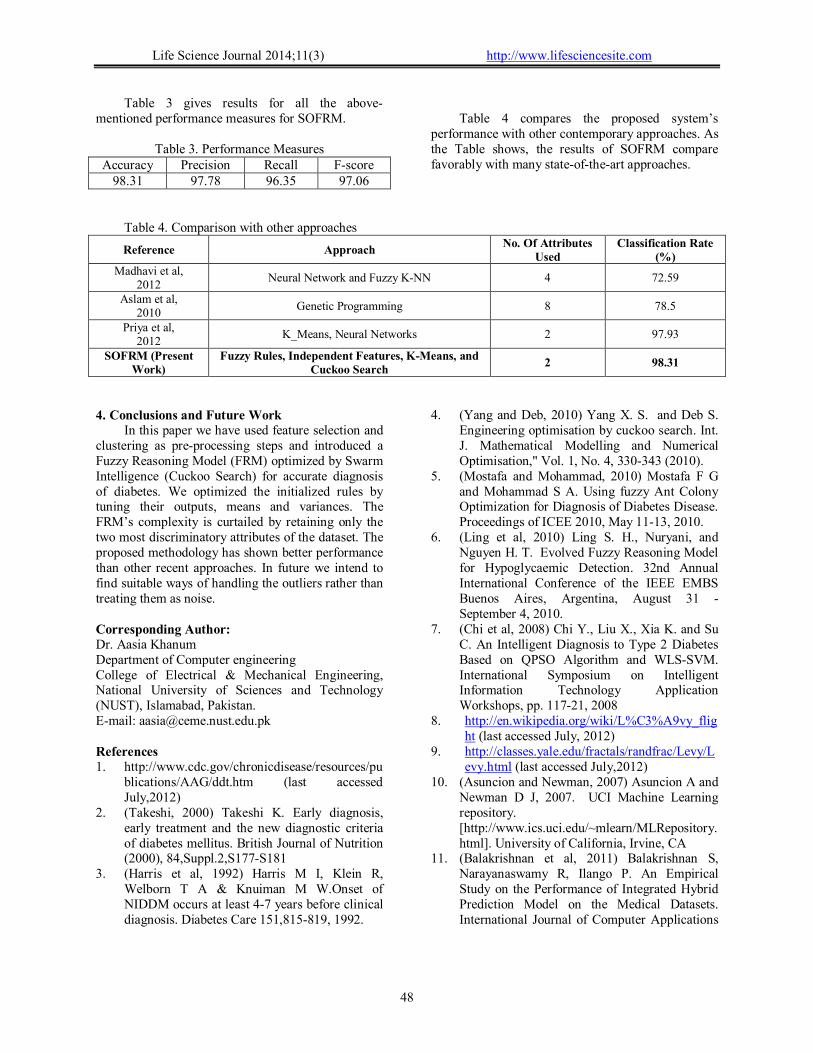
Next, we studied the effect of having various
number of fuzzy sets per parameter of the Fuzzy Rule Base. Results are shown in Figure 7. This curve also shows a clear trend; the accuracy level rises gradually till it reaches maximum at 4 fuzzy sets per parameter. Increasing the number of fuzzy sets beyond this number produces progressively poorer results. We relate these four fuzzy sets to four regions within the space of interest: L=Low, ML=Medium Low, MH=Medium High and H = High.
Figure 7. Effect of varying the number of fuzzy sets
Performance results of the system are reported
using the confusion matrix in Table 3.
Table 3. Structure of Confusion Matrix Predicted
Act
ual
Positive Negative Positive TP FN Negative FP TN
Based on the above confusion matrix, following
performance measures were calculated:
Precision and Recall normally follow inverse
trends; as precision rises, recall goes down. A trade-off between the two measures is expressed by the F-score.
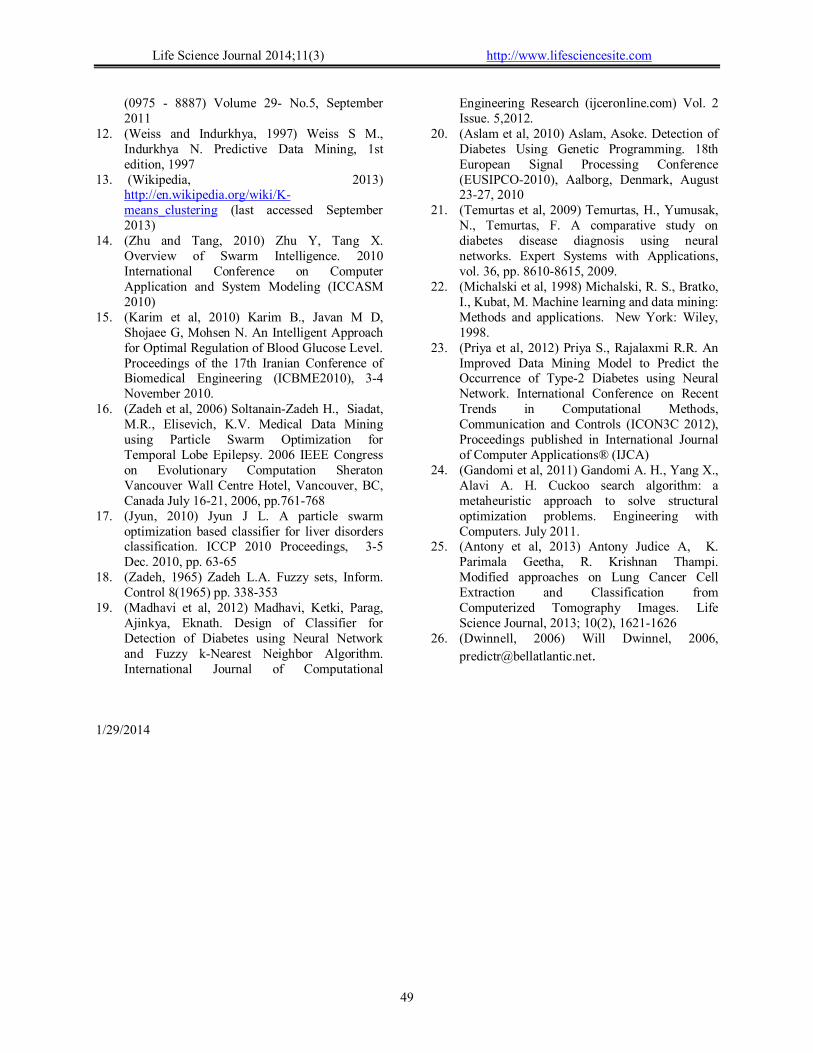
Figure 8 shows Receiver Operating Curve (ROC) curve of the proposed system, with False Positive Rate (FPR) along x-axis and True Positive Rate (TPR) along y-axis). It is clear that the system achieves an excellent tradeoff between TPR and FPR, reaching a TPR of 1 while keeping the FPR below 0.17.
Figure 8. ROC Curve
Life Science Journal 2014;11(3) http://www.lifesciencesite.com
48
Table 3 gives results for all the above-mentioned performance measures for SOFRM.
performance with other contemporary approaches. As the Table shows, the results of SOFRM compare favorably with many state-of-the-art approaches.
Table 4. Comparison with other approaches
Reference Approach No. Of Attributes
Used Classification Rate
(%) Madhavi et al,
2012 Neural Network and Fuzzy K-NN 4 72.59
Aslam et al, 2010
Genetic Programming 8 78.5
Priya et al, 2012
K_Means, Neural Networks 2 97.93
SOFRM (Present Work)
Fuzzy Rules, Independent Features, K-Means, and Cuckoo Search
2 98.31
4. Conclusions and Future Work
In this paper we have used feature selection and clustering as pre-processing steps and introduced a Fuzzy Reasoning Model (FRM) optimized by Swarm Intelligence (Cuckoo Search) for accurate diagnosis of diabetes. We optimized the initialized rules by tuning their outputs, means and variances. The FRM’s complexity is curtailed by retaining only the two most discriminatory attributes of the dataset. The proposed methodology has shown better performance than other recent approaches. In future we intend to find suitable ways of handling the outliers rather than treating them as noise. Corresponding Author: Dr. Aasia Khanum Department of Computer engineering College of Electrical & Mechanical Engineering, National University of Sciences and Technology (NUST), Islamabad, Pakistan. E-mail: [email protected] References 1. http://www.cdc.gov/chronicdisease/resources/pu
blications/AAG/ddt.htm (last accessed July,2012)
2. (Takeshi, 2000) Takeshi K. Early diagnosis, early treatment and the new diagnostic criteria of diabetes mellitus. British Journal of Nutrition (2000), 84,Suppl.2,S177-S181
3. (Harris et al, 1992) Harris M I, Klein R, Welborn T A & Knuiman M W.Onset of NIDDM occurs at least 4-7 years before clinical diagnosis. Diabetes Care 151,815-819, 1992.
4. (Yang and Deb, 2010) Yang X. S. and Deb S. Engineering optimisation by cuckoo search. Int. J. Mathematical Modelling and Numerical Optimisation," Vol. 1, No. 4, 330-343 (2010).
5. (Mostafa and Mohammad, 2010) Mostafa F G and Mohammad S A. Using fuzzy Ant Colony Optimization for Diagnosis of Diabetes Disease. Proceedings of ICEE 2010, May 11-13, 2010.
6. (Ling et al, 2010) Ling S. H., Nuryani, and Nguyen H. T. Evolved Fuzzy Reasoning Model for Hypoglycaemic Detection. 32nd Annual International Conference of the IEEE EMBS Buenos Aires, Argentina, August 31 - September 4, 2010.
7. (Chi et al, 2008) Chi Y., Liu X., Xia K. and Su C. An Intelligent Diagnosis to Type 2 Diabetes Based on QPSO Algorithm and WLS-SVM. International Symposium on Intelligent Information Technology Application Workshops, pp. 117-21, 2008
10. (Asuncion and Newman, 2007) Asuncion A and Newman D J, 2007. UCI Machine Learning repository. [http://www.ics.uci.edu/~mlearn/MLRepository.html]. University of California, Irvine, CA
11. (Balakrishnan et al, 2011) Balakrishnan S, Narayanaswamy R, Ilango P. An Empirical Study on the Performance of Integrated Hybrid Prediction Model on the Medical Datasets. International Journal of Computer Applications
Life Science Journal 2014;11(3) http://www.lifesciencesite.com
49
(0975 - 8887) Volume 29- No.5, September 2011
12. (Weiss and Indurkhya, 1997) Weiss S M., Indurkhya N. Predictive Data Mining, 1st edition, 1997
13. (Wikipedia, 2013) http://en.wikipedia.org/wiki/K-means_clustering (last accessed September 2013)
14. (Zhu and Tang, 2010) Zhu Y, Tang X. Overview of Swarm Intelligence. 2010 International Conference on Computer Application and System Modeling (ICCASM 2010)
15. (Karim et al, 2010) Karim B., Javan M D, Shojaee G, Mohsen N. An Intelligent Approach for Optimal Regulation of Blood Glucose Level. Proceedings of the 17th Iranian Conference of Biomedical Engineering (ICBME2010), 3-4 November 2010.
16. (Zadeh et al, 2006) Soltanain-Zadeh H., Siadat, M.R., Elisevich, K.V. Medical Data Mining using Particle Swarm Optimization for Temporal Lobe Epilepsy. 2006 IEEE Congress on Evolutionary Computation Sheraton Vancouver Wall Centre Hotel, Vancouver, BC, Canada July 16-21, 2006, pp.761-768
17. (Jyun, 2010) Jyun J L. A particle swarm optimization based classifier for liver disorders classification. ICCP 2010 Proceedings, 3-5 Dec. 2010, pp. 63-65
18. (Zadeh, 1965) Zadeh L.A. Fuzzy sets, Inform. Control 8(1965) pp. 338-353
19. (Madhavi et al, 2012) Madhavi, Ketki, Parag, Ajinkya, Eknath. Design of Classifier for Detection of Diabetes using Neural Network and Fuzzy k-Nearest Neighbor Algorithm. International Journal of Computational
Engineering Research (ijceronline.com) Vol. 2 Issue. 5,2012.
20. (Aslam et al, 2010) Aslam, Asoke. Detection of Diabetes Using Genetic Programming. 18th European Signal Processing Conference (EUSIPCO-2010), Aalborg, Denmark, August 23-27, 2010
21. (Temurtas et al, 2009) Temurtas, H., Yumusak, N., Temurtas, F. A comparative study on diabetes disease diagnosis using neural networks. Expert Systems with Applications, vol. 36, pp. 8610-8615, 2009.
22. (Michalski et al, 1998) Michalski, R. S., Bratko, I., Kubat, M. Machine learning and data mining: Methods and applications. New York: Wiley, 1998.
23. (Priya et al, 2012) Priya S., Rajalaxmi R.R. An Improved Data Mining Model to Predict the Occurrence of Type-2 Diabetes using Neural Network. International Conference on Recent Trends in Computational Methods, Communication and Controls (ICON3C 2012), Proceedings published in International Journal of Computer Applications® (IJCA)
24. (Gandomi et al, 2011) Gandomi A. H., Yang X., Alavi A. H. Cuckoo search algorithm: a metaheuristic approach to solve structural optimization problems. Engineering with Computers. July 2011.
25. (Antony et al, 2013) Antony Judice A, K. Parimala Geetha, R. Krishnan Thampi. Modified approaches on Lung Cancer Cell Extraction and Classification from Computerized Tomography Images. Life Science Journal, 2013; 10(2), 1621-1626