26
Conducted for the SMMT by LIGHT COMMERCIAL VEHICLES DELIVERING FOR THE UK ECONOMY 2019 REPORT

Conducted for the SMMT by
LIGHT COMMERCIAL VEHICLES DELIVERING FOR THE UK ECONOMY 2019 REPORT
THE GROWING IMPORTANCE OF LIGHT COMMERCIAL VEHICLES TO THE UK ECONOMY THE SOCIETY OF MOTOR MANUFACTURERS AND TRADERS
| Page 2 |
INTRODUCTION
Page 3 FOREWORD
Page 4 EXECUTIVE SUMMARY
Page 6 1: THE GROWTH OF THE LCV PARC
Page 9 2: THE ROLE OF THE LCV BY INDUSTRY
Page 11 3: LCVs AS A KEY DRIVE OF THE ECONOMY
Page 14 4: THE LCV LIFECYCLE
Page 16 5: THE SME SECTOR
Page 17 6: THE ENVIRONMENTAL IMPACT OF LCVS
Page 22 7: FUTURE CHALLENGES FOR THE UK LCV SECTOR
Page 23 8: CONCLUSIONS
Page 24 APPENDIX
Page 25 ABOUT BEARINGPOINT
CONTENTS

THE GROWING IMPORTANCE OF LIGHT COMMERCIAL VEHICLES TO THE UK ECONOMY THE SOCIETY OF MOTOR MANUFACTURERS AND TRADERS
| Page 3 |
The UK’s light commercial vehicle sector has never been more important, driving the economy and supporting millions of jobs across the country. Whether making up part of the fleets of big business or supporting the thriving SME and sole-trader sector, these workhorses are the backbone of British society.
Light Commercial Vehicles: Delivering for the UK economy is the first report of its kind, delivering valuable market intelligence to this vital sector. There are currently some 4.6 million vans on UK roads, with almost all serving a role that will have a direct impact on the economy. For the first time, the study looks at how the van market has grown, why it has grown and exactly how these vehicles are being used.
The van parc has experienced significant growth in recent years, increasing by 59% since 2000, almost double that seen in the car sector. Commercial vehicle downsizing, a rise in self-employment and the boom in online shopping are all factors that have resulted in a record number of vans on our roads.
But the van is not merely a vehicle, it is an essential tool to businesses and the millions of workers they employ. Without the van, one in 10 British workers would not be able to carry out their work. This 3.4 million strong workforce has a combined annual wage bill of £56 billion – amounting to some 11% of GDP. Yet this only accounts for a small proportion of the sector’s true economic value. The UK is also home to two major LCV manufacturing plants, a thriving conversion and aftermarket sector, and a buoyant used and new van market, with the latter estimated to be worth around £10 billion a year.
New vans now offer a variety of features, often as standard, including advanced driver assistance, lane departure warning and autonomous emergency braking systems. These developments have helped maintain the sector’s strong safety record, on which the industry continues to work hard to improve.
Environmental concerns are at the top of industry’s agenda. Almost all of the UK’s van fleet is powered by diesel, something that should not be downplayed. Thanks to heavy investment from industry, the latest Euro 6 diesel vans on sale today are the cleanest in history and are already playing a vital part in improving air quality, as well as helping to address other environmental concerns, with average new van CO2 emissions having fallen more than 10% over the past five years.
Manufacturers are also bringing an exciting range of ultra low and zero emission vans to market. However, while industry can develop new technology, it can’t determine the rate of uptake. Alternatively fuelled vans accounted for only 0.3% of registrations last year, underlining the challenges to business in adopting electrified LCVs. If demand is to increase, we need to promote the benefits of this technology, address range and payload anxiety and tackle this sectors’ specific charging infrastructure requirements. Above all, we we need policies and incentives that encourage businesses to renew their fleets with the latest, cleanest technology that best suits their needs.
As this report highlights, the UK is home to a thriving van industry and dedicated workforce, and while there are complex challenges, the sector stands ready to meet them, always innovating and developing ever-more advanced technology to serve a changing society. The van will continue to be a vital tool in the growth of our economy for decades to come. n
Mike Hawes Chief Executive
LIGHT COMMERCIAL VEHICLES THE BACKBONE OF BRITISH SOCIETY
FOREWORD

THE GROWING IMPORTANCE OF LIGHT COMMERCIAL VEHICLES TO THE UK ECONOMY THE SOCIETY OF MOTOR MANUFACTURERS AND TRADERS
| Page 4 |
59% growth in the LCV sector
since 2000
60% of LCV parc is
driven by:
Vans support 10% of the UK’s workforce,
delivering a combined wage bill of £56 billion,
or 11% of UK GDP
3.4 m people use or depend on vans for their work
900,000 used vans change hands each year
The LCV’s contribution to the UK economy
The second (and third) life of the LCV
The LCV’s role in industry
LCV sector growth
Construction is the biggest
single user of LCVs
SECOND AND THIRD LIFE VANS
play a key role in the UK economy where
they are typically operated by SMEs and
sole traders
construction; wholesale,
retail and repair of motor
vehicles; manufacturing;
and transport and storage
1 Downsizing from HGVs to LCVs as businesses
seek to develop more agile supply chains
2A rise in self-employment
3Surge in online sales – the UK is the online
shopping capital of Europe with 83% of people buying goods and services online
What is fuelling this growth?
There are 4.6 million Light Commercial Vehicles (LCVs)1 driving on the UK’s roads, yet there has been limited structured research conducted into the growing importance and influence of this sector on the UK economy. Apart from licencing and traffic data, the Office of National Statistics and Department for Transport do not publish statistics on the van parc and its use. This is in contrast to the research and data captured on Heavy Goods Vehicles (HGV) where a parc of just 450,000 vehicles is monitored through the Continuing Survey of Roads Goods Transport (CSRGT).
This report, commissioned by the Society of Motor Manufacturers & Traders (SMMT), covers new ground, setting out the results of a qualitative research project conducted by BearingPoint, which blends insights gained from an analysis of available data
sources, economic modelling and interviews conducted with a wide spectrum of industry stakeholders. Full details of the data sources assessed, methodologies utilised and the organisations interviewed can be found in the report appendix.
EXECUTIVE SUMMARY
THE KEY FINDINGS IN THIS REPORT INCLUDE:

THE GROWING IMPORTANCE OF LIGHT COMMERCIAL VEHICLES TO THE UK ECONOMY THE SOCIETY OF MOTOR MANUFACTURERS AND TRADERS
| Page 5 |
EXECUTIVE SUMMARY
REPORT OBJECTIVES AND APPROACH
In developing this report BearingPoint has analysed and synthesised existing data sources, conducted economic modelling of that data, and cross referenced it with insights derived from interviews with a broad range of industry stakeholders in order to provide a broad and balanced overview of the LCV sector. Full details of the data sources assessed, methodologies utilised and the stakeholders interviewed can be found in the report appendix.
The report aims to provide an informed and balanced view for stakeholders and policy makers. It seeks to address gaps in understanding of the sector so that generalisations, stereotypes and false perceptions can be challenged with empirical facts. It also highlights a need for further primary research to be conducted
into this complex and diverse sector to ensure that there is an informed basis upon which to determine future decisions and policies regarding the LCV sector, enabling businesses to thrive rather than creating challenges for them to overcome
0.3% of new vans registered in 2018 were
ELECTRIFIED
The SME sector The environmental impact of the LCV
The LCV parc
When acquiring new vans, SMEs and sole traders are increasingly ordering high-spec vehicles, often with bespoke conversions
The majority of privately-owned vans are operated by a booming SME and sole trader sector
While UK new van CO2 emissions
have fallen -10.4% since 2013
Self-employment has risen from
3.3 million in 2001 to
4.8 million in 2017
20.8%increase
on the previous year
Alternative fuels will play an increasingly important role in reducing CO2 emissions. Further infrastructure development and funding programmes are required to support fleet renewal
There has been a progressive improvement in the environmental performance of the UK LCV parc.
Euro 6 standards reduce NOx by 84% and
PM by 95% compared with Euro 3.
Although LCVs only represent
15.4% of total UK traffic
they are most affected by congestion at
a cost of £6.5 billion
a significant drain on national productivity
2001-2600 Kgs GVW
LIGHT 4X4 UTILITIES
2601-3500 Kgs GVW
LCV Segment Parc
0
2.5
20172003
Mill
ions
Large LCVs were the dominant type of van to be registered
from 2003-2017,
tripling in number
Lorem ipsum
The report aims to provide an informed and balanced view for stakeholders and policy makers. It seeks to address gaps in understanding of the sector so that generalisations, stereotypes and false perceptions can be challenged with empirical facts.

THE GROWING IMPORTANCE OF LIGHT COMMERCIAL VEHICLES TO THE UK ECONOMY THE SOCIETY OF MOTOR MANUFACTURERS AND TRADERS
| Page 6 |
THE GROWTH OF THE LCV PARC1
In recent years, the LCV sector has been the fastest growing vehicle category in the UK. The broad range of LCV sizes and configurations has seen the sector capitalise upon changes in consumer dynamics and supply chain concepts to become the ‘workhorse’ of choice for UK business.
KEY FINDINGS
Since 2000, the LCV parc has grown by 59%, almost double that of the growth seen in the passenger car marketwhile, by contrast, the HGV parc has shrunk by 2%.
The bulk of this growth has been driven by demand for larger vans (2,600-3,500 kg Gross Vehicle Weight).
Factors fuelling this growth include a fundamental shift in consumer behaviour with the growth of online shopping, an increase in LCVs as businesses seek to develop more agile logistics operations in response to the growth in the ‘fulfilment from store’ model (a service which previously would have been completed by an HGV)2 and a rise in self-employment (from 3.3 million in 2001 to 4.8 million in 2017).3
This growth has had an associated impact on traffic with miles travelled by vans increasing by 56%, incomparison to a more modest 9% seen within the passenger car parc, since 2000, indicating the changing dynamicof the UK’s supply chain4 and reliance on the LCV sector to deliver goods and services.
The van category is hugely diverse with a wide range of sizes and configurations. These range from panel vans to pick-ups with open back loading areas and a range of specialist bodies and conversions serving such industries as construction; road maintenance; refrigerated food delivery; vehicle repair and recovery; and waste management and recycling. There is no requirement for a special licence to drive a van, a car licence is sufficient. This combination of factors makes them easy to acquire, configure and operate.
There are four classes of LCV:
n Small vans, typically up to 2 tonnes Gross Vehicle Weight (GVW) – this includes car-derived vans and small specialist vans.
n Medium vans, typically up to 2.6 tonnes GVW – this is the segment that is strongly favoured by the service industries..
n Large vans, up to 2.6 tonnes to 3.5 tonnes GVW - vehicles from this segment are deployed for a wide range of service, construction and parcel deliveries. This class is also often sold in chassis form (i.e. the frame of the LCV upon which the body is mounted) for specialist application in industries such as construction, road repair, waste management, removals and automotive recovery.
n Light 4x4 Utilities (Pickup trucks) – often used in the construction or agriculture sectors

THE GROWING IMPORTANCE OF LIGHT COMMERCIAL VEHICLES TO THE UK ECONOMY THE SOCIETY OF MOTOR MANUFACTURERS AND TRADERS
| Page 7 |
THE GROWTH OF THE LCV PARC (cont.)1Figure 1 shows the growth in the vehicle parc for cars, LCVs and HGVs in the UK. LCVs are clearly the fastest growing vehicle segment at more than double the rate of cars and with an average annual growth rate of 3%.
Figure 2 shows the picture of van growth by size segment. It shows sustained growth in registrations apart from the economic crisis in 2008/9 when the market turned down. Even then there was continuous growth in the overall LCV parc. One possible explanation for this downturn was that operators retained their vehicles for longer.
Although there has been steady growth in the LCV parc overall, this deeper analysis of vehicle registrations shows that large LCVs were the dominant type of van to be registered from 2003-2017, tripling in numbers, with all other categories expanding more modestly.
The impact on traffic of LCV growth is even more marked than its increase in the national vehicle parc. Since 2000, the 29% growth in the car parc has generated less than 9% increase in miles travelled by car while the 59% increase in the van parc has led to a 56% increase in the miles travelled by vans. While the number of cars on the road is increasing, average car mileage is falling; it is now just 8,500 miles per year while van mileage has remained nearly unchanged at 12,800 per year.
This is shown in Figure 3 on page 8.
100
130
120
110
140
150
160CARS LCVs
’04’03’02 ’05 ’06 ’07 ’08 ’09 ’10 ’11 ’12 ’13 ’14 ’15 ’16 ’17 ’182001
2000
=10
0
Figure 1 : UK PARC (INDEXED)
Figure 2 : LCV REGISTRATIONS AND PARC
0
50
100
150
200
250HCV
LIGHT CVS 2001-2600 Kgs GVW
LIGHT 4X4 UTILITIES
LIGHT CVS <2000 Kgs GVW
LIGHT CVS 2601-3500 Kgs GVW
LIGHT CVS 2001-2600 Kgs GVW LIGHT 4X4 UTILITIES
LIGHT CVS <2000 Kgs GVW
LIGHT CVS 2601-3500 Kgs GVW
’04 ’05 ’06 ’07 ’08 ’09 ’10 ’11 ’12 ’13 ’14 ’15 ’16 ’172003
Thou
sand
s
Vehicle Registrations LCV Segment Parc
0
0.5
1
1.5
2
2.5
’04 ’05 ’06 ’07 ’08 ’09 ’10 ’11 ’12 ’13 ’14 ’15 ’16 ’172003
Mill
ions

THE GROWING IMPORTANCE OF LIGHT COMMERCIAL VEHICLES TO THE UK ECONOMY THE SOCIETY OF MOTOR MANUFACTURERS AND TRADERS
| Page 8 |
Van traffic now accounts for 15.4% of all vehicle miles. Figures from Transport for London point to vans making up well over 20% of London traffic in the morning peaks (8.00am – 9.00am) and the National Traffic Forecast projects the national average to be 20% by 2035 with the London average being 22%.5
Interviews with industry stakeholders highlighted a number of reasons for the increase in registration and use of LCVs in recent years:
CHANGING CONSUMER BUYING PATTERNS: The buying of goods and services from bricks-and-mortar retailers has declined due to the increasing consumer trend to buy good online. Online shopping is particularly popular in the UK, research conducted in 2018 by Eurostat shows that the UK is, proportionally, the largest user of online shopping in the European Union, with 83% of individuals making purchases online during the past 12 months as opposed to the EU average of 60%.6 As a consequence, we are more likely to take delivery of goods and services at home or at places of work, which are distributed by LCVs.
DOWNSIZING FROM HGVS TO LCVS: Linked to this point, a theme that consistently emerged from the interviews was a general impression that downsizing from lighter HGVs to LCVs is occurring. Companies are looking to deploy more agile logistics solutions, particularly for deliveries into congested and restricted urban areas. Much of the recent growth of the LCV parc has been at the heavier end (2,600kg – 3,500kg). From this it appears that the world of freight service is polarising into very heavy HGV and upper end LCVs.
THE RISE IN SELF-EMPLOYMENT: Interviewees also highlighted that for SMEs and Sole Traders the van is often an essential tool of the trade
Other factors that have driven the continuing expansion of the LCV sector since 2000 include the lasting trend of UK urbanisation, the evolution of customised services to serve profitable business niches and the rise in demand for more flexible pick-ups.
THE GROWTH OF THE LCV PARC (cont.)1
❝ LCVs are the fastest growing form of road transport but they are the least well understood. The growth of the service sector as the UK continues to move from a manufacturing economy to a service-based economy is likely to further increase the demand for LCV activity. ❞Julian Allen, Senior Research Fellow, University of Westminster
80
95
90
85
100
105
110
115
120
125
130
’07 ’08 ’09 ’10 ’11 ’12 ’13 ’14 ’15 ’16 ’172006
Inde
x: 1
00=2
006
CARS LCV HGV
Figure 3 : TOTAL MILES RUN BY VEHICLE TYPE
THE GROWING IMPORTANCE OF LIGHT COMMERCIAL VEHICLES TO THE UK ECONOMY THE SOCIETY OF MOTOR MANUFACTURERS AND TRADERS
| Page 9 |
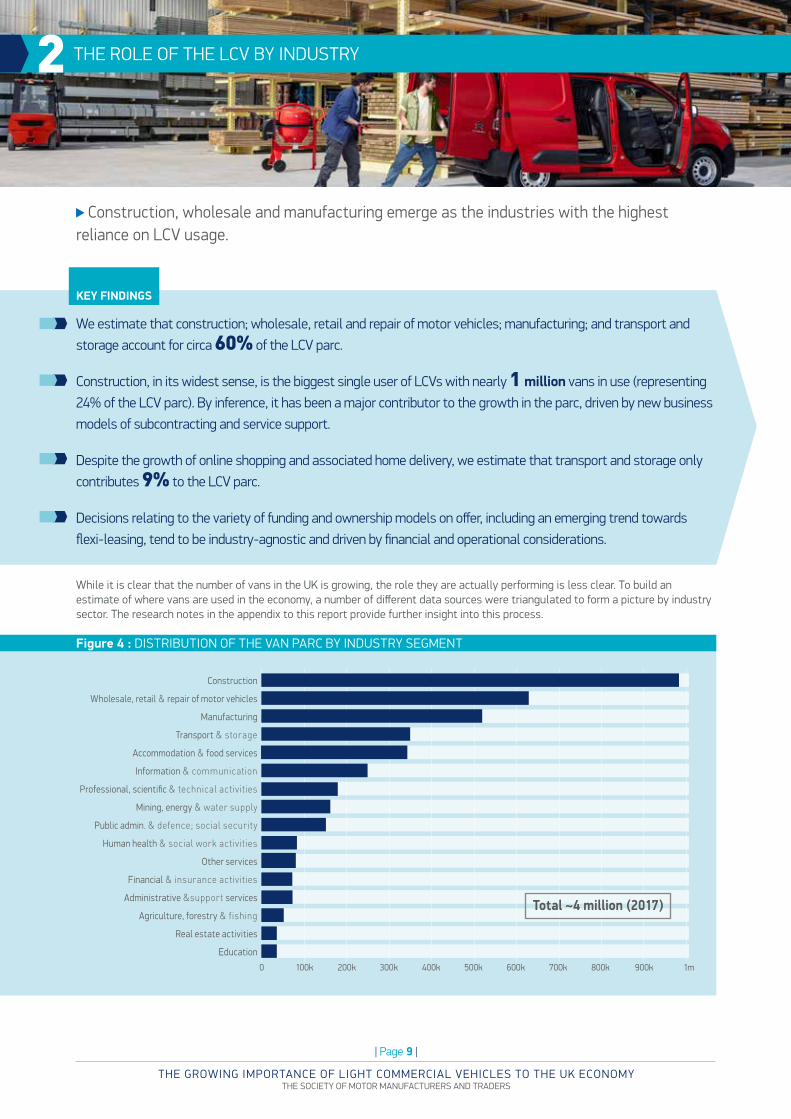
THE ROLE OF THE LCV BY INDUSTRY2
Construction, wholesale and manufacturing emerge as the industries with the highest reliance on LCV usage.
KEY FINDINGS
We estimate that construction; wholesale, retail and repair of motor vehicles; manufacturing; and transport and storage account for circa 60% of the LCV parc.
Construction, in its widest sense, is the biggest single user of LCVs with nearly 1 million vans in use (representing 24% of the LCV parc). By inference, it has been a major contributor to the growth in the parc, driven by new business models of subcontracting and service support.
Despite the growth of online shopping and associated home delivery, we estimate that transport and storage only contributes 9% to the LCV parc.
Decisions relating to the variety of funding and ownership models on offer, including an emerging trend towards flexi-leasing, tend to be industry-agnostic and driven by financial and operational considerations.
While it is clear that the number of vans in the UK is growing, the role they are actually performing is less clear. To build an estimate of where vans are used in the economy, a number of different data sources were triangulated to form a picture by industry sector. The research notes in the appendix to this report provide further insight into this process.
Figure 4 : DISTRIBUTION OF THE VAN PARC BY INDUSTRY SEGMENT
0 1m200k 300k 400k 500k 600k 700k 800k 900k100k
Wholesale, retail & repair of motor vehicles
Manufacturing
Mining, energy & water supply
Information & communication
Other services
Public admin. & defence; social security
Professional, scientific & technical activities
Administrative &support services
Human health & social work activities
Financial & insurance activities
Education
Real estate activities
Construction
Accommodation & food services
Agriculture, forestry & fishing
Transport & storage
Total ~4 million (2017)

THE GROWING IMPORTANCE OF LIGHT COMMERCIAL VEHICLES TO THE UK ECONOMY THE SOCIETY OF MOTOR MANUFACTURERS AND TRADERS
| Page 10 |
2 THE ROLE OF THE LCV BY INDUSTRY (cont.)
Construction; wholesale, retail and repair of motor vehicles; manufacturing; and transport and storage account for 60% of the parc. Perhaps surprisingly, transport and storage only contribute 9% to the parc by this analysis. This supports the findings of a study published by the RAC Foundation in 2016 that found that van delivery for internet fulfilment was 5% of the parc and perhaps only accounted for 10% of van traffic.7
As previously mentioned, these figures do not reveal the range of activities that take place within each segment. Just consider:
n Vans in construction support the full range of trades, from bricklayers, plasterers and plumbers, to lift and glazing installation. Vans are also used for road and public building construction and maintenance. Some will be operated by private contractors carrying out public building maintenance. But where those vans are part of a public sector fleet, they could be classified as public administration and defence.
n Vans in wholesale, retail and repair of motor vehicles will support activities such as food service providers, market stall traders, spare parts distribution, roadside repair and recovery and retailers that make their own deliveries such as the home delivery of grocery. But vans delivering food may also be in the accommodation and food services economic and employment category.
n Vans in the manufacturing sector will be used for customer deliveries, collection of supplies and the movement of equipment. However, those manufacturers may also use the services of transport and storage companies to undertake the same activities.
n Vans in the transport and storage sector will provide courier services, removals, house clearance, parcel and package distribution and emergency support for HGVs when that work is done in-house.
FUNDING AND OWNERSHIP MODELS
Stakeholder interviews provided valuable insights into the variations in ownership and funding models adopted across the different industries:
n The decision as to whether to outright purchase or lease a van is more often financial and speed of supply related rather than strategic. If a company needs its vehicles off the balance sheet, wants to control costs and manage cash flow then contract hire and leasing is preferred.
n If a company wants a turnkey solution then the outsourced fleet management benefits of contract hire, including maintenance, might appeal. This route is often attractive for companies without in-house fleet management capability.
n The fact that this is a financial rather than strategic decision is exemplified by interviews with two utility companies:
◆ One company recently took back ownership of its whole fleet in order to be confident that it can service vital infrastructure in a timely and efficient manner. Any
possible resultant increase in cost of operating the fleet is relatively insignificant when compared with the cost of maintaining the said infrastructure. However, this approach is by no means consistent across the industry.
◆ A second utility company placed greater emphasis on cost and outsourced its fleet to a third-party provider. In this instance, this has led to an efficient operation in which vehicle downtime is minimised and engineers are kept mobile allowing them to perform their key functions.
n The one industry which was consistently mentioned in interviews as acquiring vehicles mainly through outright purchase was construction. Perhaps not surprisingly, given the robust usage of vehicles on construction sites, the outright purchase of vans avoids the cost of ‘end of contract’ damage charges had they been leased.
THE RISE OF FLEXI-LEASING
Interviews with the major leasing companies and OEMs highlighted a trend towards so-called ‘flexi-leasing’.
n Historically vans have been contract hired over a period of 36-60 months with shorter term requirements being satisfied through daily rental companies.
n However, flexi leasing has emerged to bridge this gap with rental profiles of 12-24 months and flexible call off and de-fleeting of vans (i.e. shorten or the extend the lease length of the vehicle to suit user requirements).
n Demand for this new leasing profile has typically been driven by the companies bidding for large infrastructure contracts or industries where there is a seasonal variation in their need for vans.
INDUSTRY INVESTMENT IN LCV SPECIALISM
Given this increasingly complex landscape in terms of customer needs, funding and powertrain options it was also clear from our interviews that a number of the key suppliers to the LCV market, notably the OEMs, dealers, leasing companies and convertors, are investing heavily in their LCV expertise and increasingly taking on the roles of ‘trusted advisors’.

THE GROWING IMPORTANCE OF LIGHT COMMERCIAL VEHICLES TO THE UK ECONOMY THE SOCIETY OF MOTOR MANUFACTURERS AND TRADERS
| Page 11 |
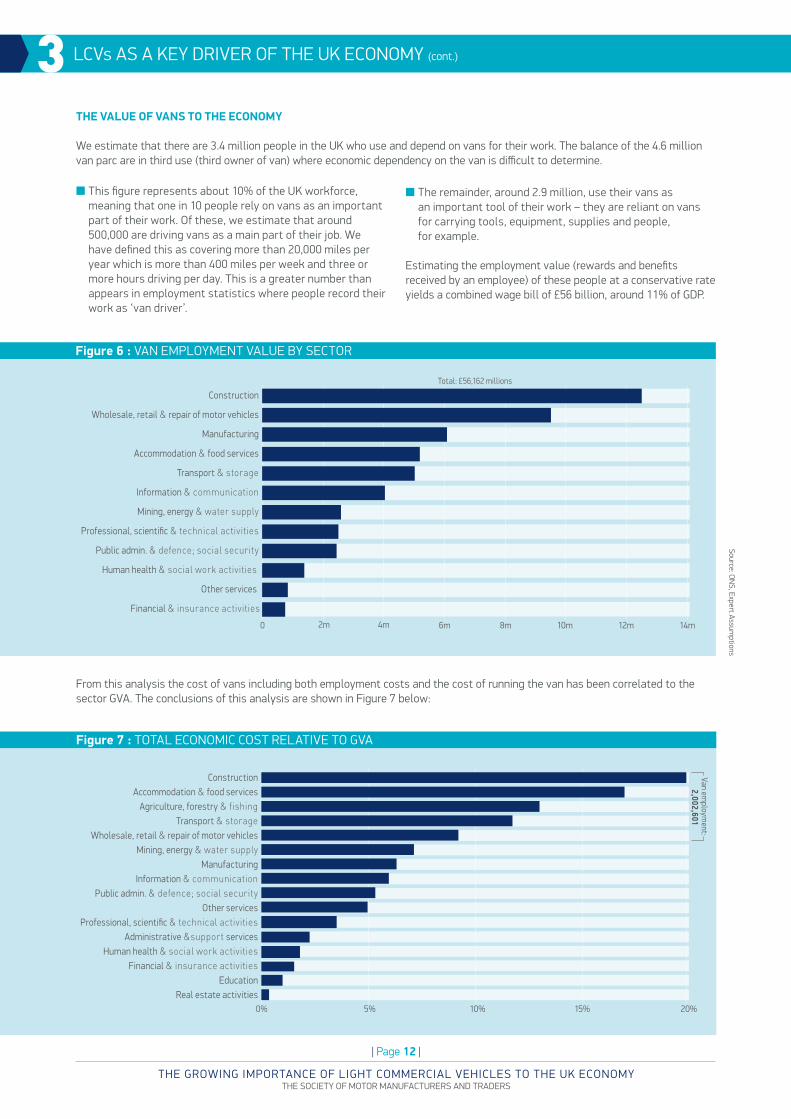
LCVs AS A KEY DRIVER OF THE UK ECONOMY3
LCVs play a critical role in delivering value for the UK economy with approximately one in 10 people relying on vans as an integral part of their job.
KEY FINDINGS
There are an estimated 3.4 million people who use or depend on vans for their work.
In effect, this represents 10% of the UK workforce, equating to a combined wage bill of £56 billion or 11% of UK GDP.
We estimate that around 500,000 people drive a van as the main part of their job.
In addition to this direct economic contribution, the LCV market also supports a flourishing sub-economy of van conversion companies.
The analysis in the previous section has been correlated with government statistics on the GVA (Gross Value Added) by sector (see Figure 5). This shows the van intensity per £1 million of GVA varies from around nine vans to a fraction of a van. GVA is a measure of the value of goods and services which are produced within an economy. What is clear is that van usage in the construction sector stands head and shoulders above other sectors, followed by accommodation and food services; agriculture, forestry and fishing; transport and storage; and wholesale, retail and repair of
motor vehicles in the vans per £1 million of GVA. Furthermore, the chart highlights the LCV’s range in significance across industries from playing a central role to those where usage is perhaps considered as more of a ‘nice to have’ rather than an essential tool to conduct business.
With the observations on the imprecision of sector classifications earlier in this report, it may be that some industries outsource more than others; this is invisible in current statistics and would benefit from further primary research.
Figure 5 : VANS PER £1M GVA
0 3 4 5 6 7 8 9 101 2
Vans per £1m GVA
Wholesale, retail & repair of motor vehicles
Manufacturing
Mining, energy & water supply
Information & communication
Other services
Public admin. & defence; social security
Professional, scientific & technical activities
Administrative &support services
Human health & social work activities
Financial & insurance activities
Education
Real estate activities
Construction
Accommodation & food services
Agriculture, forestry & fishing
Transport & storage
Source: ON
S, Expert Assumptions
THE GROWING IMPORTANCE OF LIGHT COMMERCIAL VEHICLES TO THE UK ECONOMY THE SOCIETY OF MOTOR MANUFACTURERS AND TRADERS
| Page 12 |
THE VALUE OF VANS TO THE ECONOMY
We estimate that there are 3.4 million people in the UK who use and depend on vans for their work. The balance of the 4.6 million van parc are in third use (third owner of van) where economic dependency on the van is difficult to determine.
n This figure represents about 10% of the UK workforce, meaning that one in 10 people rely on vans as an important part of their work. Of these, we estimate that around 500,000 are driving vans as a main part of their job. We have defined this as covering more than 20,000 miles per year which is more than 400 miles per week and three or more hours driving per day. This is a greater number than appears in employment statistics where people record their work as ‘van driver’.
n The remainder, around 2.9 million, use their vans as an important tool of their work – they are reliant on vans for carrying tools, equipment, supplies and people, for example.
Estimating the employment value (rewards and benefits received by an employee) of these people at a conservative rate yields a combined wage bill of £56 billion, around 11% of GDP.
From this analysis the cost of vans including both employment costs and the cost of running the van has been correlated to the sector GVA. The conclusions of this analysis are shown in Figure 7 below:
3 LCVs AS A KEY DRIVER OF THE UK ECONOMY (cont.)
Figure 6 : VAN EMPLOYMENT VALUE BY SECTOR
0% 20%10% 15%5%
Van employm
ent: 2,002,601
Wholesale, retail & repair of motor vehicles
ManufacturingMining, energy & water supply
Information & communication
Other servicesPublic admin. & defence; social security
Professional, scientific & technical activitiesAdministrative &support services
Human health & social work activitiesFinancial & insurance activities
EducationReal estate activities
ConstructionAccommodation & food services
Agriculture, forestry & fishingTransport & storage
Figure 7 : TOTAL ECONOMIC COST RELATIVE TO GVA
0 12m10m8m6m4m2m 14m
Total: £56,162 millions
Wholesale, retail & repair of motor vehicles
Manufacturing
Mining, energy & water supply
Information & communication
Other services
Public admin. & defence; social security
Professional, scientific & technical activities
Human health & social work activities
Financial & insurance activities
Construction
Accommodation & food services
Transport & storage
Source: ON
S, Expert Assumptions

THE GROWING IMPORTANCE OF LIGHT COMMERCIAL VEHICLES TO THE UK ECONOMY THE SOCIETY OF MOTOR MANUFACTURERS AND TRADERS
| Page 13 |
This demonstrates again the significance of vans in the construction sector with 20% of its GVA dependent on people who use a van, at least for some of their work. The significance of vans for the top five sectors down to wholesale, retail and motor repair segment of the economy covers the range 9% to 20% of GVA; the economic dependency could not be clearer.
THE THRIVING LCV CONVERSION MARKET
In addition to the core economic value derived from van deliveries of goods and services there are thriving secondary specialist and niche marketplaces served by LCV convertors.
The greater demand from consumers for professionalism has led to a larger number of LCV operators converting their vans for specialist use. LCV users also recognise the efficiencies that can be achieved through vehicle customisation: a well specified vehicle will allow them to perform their task more effectively.
Interviews with the LCV conversion companies highlighted a wide spectrum of conversions available, ranging from specialist racking, winches, on-board power sources and specialist lighting, through to cherry pickers and tippers. The industry offers totally bespoke propositions to customers and a number of OEMs have an ecosystem of convertors whose work often comes with full European whole vehicle type approval, meeting the same standards as the factory supplied vehicles.
Between 2010 and 2016 the average value of weekly online sales at predominantly food stores more than doubled to reach £141.9 million in 2016.9 The boom in online food shopping has also contributed substantially to the demand for LCVs converted for refrigeration.
n These vehicles must be robust as the demands on them are substantial; in some instances, one vehicle is used in three different shifts throughout the day.
n The additional weight that comes with refrigeration capability also means that the conversions they go through are very sophisticated and weight conscious, resulting in significant costs.
n The cost of such conversions and the high mileages the vehicles cover mean that refrigerated bodies are often refurbished and then reused on a new chassis.
Due to operators’ technological requirements there is an increasing demand for connectivity in vehicle conversions.
Companies need to distribute their products and services ever more efficiently, so modular components and cross docking are becoming increasingly important.
3 LCVs AS A KEY DRIVER OF THE UK ECONOMY (cont.)

THE GROWING IMPORTANCE OF LIGHT COMMERCIAL VEHICLES TO THE UK ECONOMY THE SOCIETY OF MOTOR MANUFACTURERS AND TRADERS
| Page 14 |
LCVs continue to play a vital role in the UK economy in their second and third lives where they support a thriving ecosystem of SMEs and sole traders.
KEY FINDINGS
Around 900,000 used vans change hands each year, the average age of vans on the road being around eight years.
Second and third life vans play a key role in the UK economy where they are typically operated by SMEs and sole traders.
Our interviews highlighted a thriving sub-contractor sector which plays a key role in supporting the construction and parcel delivery industries.
Around 900,000 vans change hands each year illustrating how the used van market is critical for the economy. Vans purchased from new tend to be de-fleeted on average after 48 to 60 months. Used vans reduce the capital outlay required of small traders and have lower depreciation cost. Vans in their second and third life tend to cover lower mileages compared with their first life (against the average of 12,800, the second and third life vans do 6,000 to 8,500 typically).
Based on the analysis of vans by industrial sector below, we have estimated the proportion of vans in use by sector is based on three users in a lifespan. This analysis has been triangulated to reconcile to high level statistics the number of vans in first use with the average miles undertaken. It serves to recognise the significance of second-hand vans in the SME economy in the different economic segments.
THE LCV LIFECYCLE4
0% 100%First Use Second Use Third Use
Wholesale, retail & repair of motor vehicles
Manufacturing
Mining, energy & water supply
Information & communication
Other services
Public admin. & defence; social security
Professional, scientific & technical activities
Administrative &support services
Human health & social work activities
Financial & insurance activities
Education
Real estate activities
Construction 30% 48% 22%
48% 42% 10%
35% 55% 10%
42% 40% 18%
47% 53%
52% 48%
50% 40% 10%
55% 45%
55% 45%
55% 45%
35% 45%
20%
55% 35%
10%
55% 35% 10%
55% 35% 10%
55% 45%
42% 42% 16%
Accommodation & food services
Agriculture, forestry & fishing
Transport & storage
Figure 8 : VAN USAGE BY INDUSTRY BY VEHICLE LIFE
Source: Expert Assumptions

THE GROWING IMPORTANCE OF LIGHT COMMERCIAL VEHICLES TO THE UK ECONOMY THE SOCIETY OF MOTOR MANUFACTURERS AND TRADERS
| Page 15 |
The industries with a substantial usage of second and third life vans operate through complex networks of subcontractors and specialists. Consistent with our data analysis, our interviews highlighted that this is particularly the case for both the construction industry and for parcel delivery:
n In construction there is a large ecosystem of SME and sole traders providing essential skills on site.
n The major parcel delivery firms often rely upon local couriers or ‘privateers’ for last mile delivery in those areas outside of their core networks.
n In both instances, parts of large contracts are subcontracted to SMEs or sole traders who are typically more cost sensitive and are more likely to operate vehicles that are in their second and third lives..
Analysis of van ownership costs based on cost per mile and capital depreciation shows that low costs per mile for SMEs reflect the lower cost of acquisition of second-hand vehicles. They run fewer miles which means reliability is less of a dependency; many small traders cannot sustain the investment of a new van so the ‘used’ market is the natural route to doing business. This effect is illustrated by average cost per van mile across the payload ranges and is illustrated for first and second uses in the figure below. The figures have been derived from a range of industry cost tables and normalised into standing (capital and fixed) and running costs (mileage related costs covering fuel, tyres and maintenance).
4 THE LCV LIFECYCLE (cont.)
0
20
10
30
40
50
60
70
5,000 10,000 15,000 20,000 25,000
Penc
e pe
r mile
Total cost per mile (pence )
FIRST USE SECOND USE
Figure 9 : TOTAL COST PER MILE BY FIRST AND SECOND USE VANS
Source: Industry cost tables

THE GROWING IMPORTANCE OF LIGHT COMMERCIAL VEHICLES TO THE UK ECONOMY THE SOCIETY OF MOTOR MANUFACTURERS AND TRADERS
| Page 16 |
The DfT definition of vans in private ownership does not really provide the full picture. The reality is that the vast majority of these private vans are in fact operated by SME businesses and sole traders.
However, despite this lack of data, our interviews have enabled us to build a picture of a thriving SME and sole trader van sector:
n Given the need to carefully manage costs and monthly cash flow, it is perhaps not surprising that LCVs in this sector tend to be acquired through contract hire, although not typically with maintenance.
n More of a surprise is that, despite this cost sensitivity, the vans operated by SMEs and sole traders tend to be at higher specification levels with features such as air
conditioning, alloy wheels, metallic paint and enhanced in car entertainment being the norm.
n Reasons cited for the adoption of such high spec vehicles include the fact that operators want their vans to be as comfortable as possible given their role as a ‘mobile office’, and the fact that the van often has multiple uses.
n Within the sole trader sector the uptake of pick-ups has increased partly as a result of their dual role as LCVs and SUVs.
Linked to this trend towards the selection of higher specification vehicles by the SME and sole trader sector, our interviews also highlighted that vans in this segment often benefit from bespoke conversion and professional livery with the van in effect becoming the embodiment of the professionalism and expertise of its owner.
THE SME SECTOR 5
The vast majority of privately owned LCVs are operated by SMEs and sole traders who typically operate higher specification vans than their corporate fleet counterparts.
KEY FINDINGS
Following the economic crisis in 2008/9 private ownership of LCVs overtook corporate ownership.
Our interviews revealed that the majority of these privately-owned vans are operated by a booming SME and sole trader sector.
When acquiring new vans, SMEs and sole traders are increasingly ordering high spec vehicles, often with bespoke conversions, e.g. specialist racking and on-board power sources, reflecting the role of their vans as both a mobile workplace and symbol of professionalism of their trade.
Figures from the Department for Transport (DfT) show that private ownership of vans overtook company ownership in 2009 at the time of the economic downturn as illustrated in Figure 10. The interviews provided some useful insights into this shift, implying that corporates accelerated their outsourcing and subcontracting policies to become more agile in their cost base following the economic shock of 2008/9.
Figure 10 : VANS IN COMPANY AND PRIVATE OWNERSHIP
0
1,500
1,000
5,000
2,000
2,500PRIVATE OWNERSHIP COMPANY OWNERSHIP
’04 ’05 ’06 ’07 ’08 ’09 ’10 ’11 ’12 ’13 ’14 ’15 ’16 ’172003
Thou
sand
s
Source: Departm
ent for Transport

THE GROWING IMPORTANCE OF LIGHT COMMERCIAL VEHICLES TO THE UK ECONOMY THE SOCIETY OF MOTOR MANUFACTURERS AND TRADERS
| Page 17 |
THE ENVIRONMENTAL IMPACT OF LCVs 6
The LCV industry is investing heavily in reducing CO2 and pollutant emissions through new engine technologies and alternative powertrains, alongside developing new safety features and innovative new telematics solutions.
KEY FINDINGS
There has been a progressive improvement in environmental performance of the UK LCV parc with the introduction of Euro 6 engines and the development of alternative powertrains.
However, only 0.3% of new vans registered in 2018 were electrified; 96.2% of vans on the road are still powered by diesel, highlighting the vital role that diesel will continue to play in the foreseeable future.10
Looking ahead, alternative fuels will play an increasingly important role in reducing CO2 emissions and while appetite for these vehicles exists, this is not resulting in registrations. Further infrastructure development and funding programmes are required to support market growth.
Although LCVs only represent 15.4% of total UK traffic and are more often a victim of congestion than a root cause, there are regional variances. For example, figures from Transport for London point to vans making up well over 20% of London traffic in the morning peaks (8.00am – 9.00am).
Given the key role of the van as a workhorse of the UK economy we have estimated the cost of congestion for operators as being £6.5 billion – a significant drain on national productivity.
LCVs have a strong safety record which the industry is working hard to maintain. OEMs are offering, and fleet operators increasingly mandating, the fitment of advanced safety features to new LCVs.
Telematics is increasingly being used as a fleet optimisation tool supporting vehicle safety and corporate Duty of Care.

THE GROWING IMPORTANCE OF LIGHT COMMERCIAL VEHICLES TO THE UK ECONOMY THE SOCIETY OF MOTOR MANUFACTURERS AND TRADERS
| Page 18 |
The figure below illustrates the extent to which LCV CO2 emissions have reduced -10.4% since 2013. With 96% of all LCVs being diesel powertrains, this highlights the important role that Euro 6 diesels play for LCV emissions reductions.
The reduction in CO2 emissions is not the only environmental improvement seen in vans in recent years. The Euro 6 diesel standard has reduced NOx by 84% and particulate matter by 95% compared with Euro 3, highlighting the dramatic improvements delivered by manufacturer investment in new technology.
Our interviews highlighted that the introduction of the London Ultra Low Emission Zone (ULEZ) and similar schemes will drive fleet segmentation and displacement with large fleet operators moving vehicles around the country to align their emissions standards with regional variations in ULEZ requirements.
In contrast, SMEs will not be able to manage their fleet in such a manner so they will be more affected by the introduction of the new schemes. In such instances it is possible that companies and sole traders will accept the costs incurred through ULEZ charges and will pass them on to their customers rather than renewing their vehicles.
6 THE ENVIRONMENTAL IMPACT OF LCVs (cont.)
160
155
150
165
170
175
180
185
190
2014 2015 2016 2017 20182013
Mea
n CO
2 emis
sion
s (g
ram
/km
)
Figure 12 : LCV CO2 EMISSIONS
LCVs AND THE ENVIRONMENT
Analysis of the CO2 performance of LCVs by emissions band11 between 2008 and 2017 shows a significant improved environmental performance of the model range by OEMs. It is clear that vehicles’ emissions performance has improved significantly in the space of 10 years with no detriment to van performance
CO2 BANDS
20%
15%
10%
5%
0%
25%
30%
35%
40%
45%
50%
111-120101-110 131-140121-130 151-165141-150 175-185166-175 185-200 201-225 226-255 0ver 2551-100
2008 2017
Figure 11 : LCVS SHARE OF CO2 BANDS 2008 V 2017
Source: SMM
TSource: SM
MT

THE GROWING IMPORTANCE OF LIGHT COMMERCIAL VEHICLES TO THE UK ECONOMY THE SOCIETY OF MOTOR MANUFACTURERS AND TRADERS
| Page 19 |
LCVS AND ALTERNATIVE POWERTRAINS
As ever stricter regulations are imposed on vehicles with respect to their emissions and environmental impact, the introduction of alternative powertrains will take on increased importance.
UK sales of battery-electric and plug-in hybrid electric vehicles grew to 5.8% of all new vehicle sales in the year to March 2019.12 However, the uptake of electrified vans is much lower, accounting for just 0.6% of registrations over the same period.
Electrification delivers a large reduction in CO2 emissions. In 2017 battery electric vans are estimated to have emitted 120g/km CO2e – a reduction of 67% in comparison with petrol and 60% diesel engine vans respectively (based on a reduction of electricity grid emissions).13 And although coming from a low base, from 2016 to 2017 there has been a 20.8% increase (to 6,347) in the number of low-emission vans).14 An Ultra-Low Emission Vehicle (ULEV), is a van which emits less than 75g CO2 per km driven. A Zero Emission Vehicle (ZEV) is a van which has no tailpipe emissions.).15
While electrified LCVs are almost universally welcomed in principle, there is some scepticism in relation to their practicality:
n These doubts centre around their ability to carry large
loads, cover long distances and perform tasks on sites for prolonged durations.
n Such concerns about their viability were not limited to those
operating in rural environments, where charging facilities are more limited and the distances covered are higher. They were also shared by those van fleets operating in cities.
n There are practical implications of a lack of an effective charging infrastructure and operational restrictions when it comes to van drivers bringing their vehicles home and charging them overnight. Public charging infrastructure for cars is not, in many cases, practical for vans. This is because the size of parking bays is not always sufficient and there is lack of availability at suitable charging locations for LCV owners to perform their roles.
However, despite this element of scepticism, a ‘target profile’ did emerge from our interviews where electrified LCVs are already being seen as a viable and preferable alternative to a conventional diesel van: n Operators in urban areas, with relatively low daily mileages,
light load carrying requirements and access to effective fast charging infrastructures can derive significant benefits from deploying electrified LCVs.
n This profile is typical of local councils and other public sector organisations which, as well as achieving lower emissions, also benefit from the strong environmentally friendly image of the electrified LCV
n Some of the organisations that we interviewed also cited improved driver satisfaction given that electrified LCVs tend to be easier and more pleasant to drive, due to being quieter
THE ENVIRONMENTAL IMPACT OF LCVs (cont.) 6❝ Policy makers see vehicles as a homogeneous entity. There needs to be a better understanding. An efficient freight and logistics sector helps congestion and air quality. It is essential that commercial vehicle activity is separated from private usage.❞Denise Beedell, Policy Manager – Vans and Urban, FTA
❝ Clean air zones are very hit and miss in terms of where and when they’re implemented. We want it to be more joined up in terms of what is going to happen – this is crucial when you’re operating a large fleet of vans.❞Steve Winter, Head of Fleet, British Gas

THE GROWING IMPORTANCE OF LIGHT COMMERCIAL VEHICLES TO THE UK ECONOMY THE SOCIETY OF MOTOR MANUFACTURERS AND TRADERS
| Page 20 |
6 THE ENVIRONMENTAL IMPACT OF LCVs (cont.)
to operate and typically having automatic transmissions.In addition, our interviews with leasing companies and OEMs highlighted that the total cost of ownership of electrified LCVs is getting much closer to diesel vehicles when taking into account full running costs, notably servicing and fuel. Moreover, where LCVs are operated in congestion charge zones there are significant additional potential savings.
To account for the additional weight that comes with battery powered and some other alternatively fuelled LCVs, SMMT worked with government to increase the payload threshold for driving licence requirements from 3.5 tonnes to 4.25 tonnes. The initiative, which is only available on certain alternatively fuelled vans, could support increased UK sales14.
While there is appetite for electrified LCVs from certain fleet operators and some government incentives are in place to encourage their adoption, the technical challenge of developing vehicles to address van driver concerns, the limited range of models available and the lack of availability in terms of battery supply and production are all factors that currently impact uptake and mean that the UK LCV sector could struggle to meet environmental targets set by the government.
Attention needs to be paid to this environmental disconnect, however, electric powertrains are not the only potential answer to the problem. Several of our interviewees suggested that hydrogen fuel cell powertrains would be the longer-term solution for the LCVs, as they will be lighter and have longer operational ranges, with electrified LCVs only performing a stop gap function. At the same time, industry is aware that other alternative powertrains, such as hybrid and gas, will play a key role in reducing vehicle emissions in the future.
Indeed, the £23 million grant funding, introduced in 2017 by the Hydrogen Transport Programme (HTP) to support the growth of refuelling infrastructure alongside the deployment of new vehicles, would reinforce this perspective.
LCVs AND CONGESTION
LCVs operating within city and urban environments are often cited as a cause of congestion. The growth in van traffic was discussed earlier together with forecasts for future growth.
An INRIX report on congestion costs measures the time lost in traffic as being 178 hours per vehicle. This is 9% of the working week and for LCVs there is a real cost to this loss.16
For vans that are mainly used for driving and delivering, the loss of 9% of productive time, particularly in the morning peak, may cause the business to employ extra people and vehicles than would be needed if the conditions were better, in turn increasing congestion.
We have estimated the cost of congestion for LCVs on this basis as being £6.5 billion – a significant drain on national productivity – particularly when one considers, as highlighted earlier in this report, the pivotal role of the van in terms of GVA carried and employment supported.17
Vans are not a major contributor to congestion as they account for only 15.4% of national traffic, however, regional variances exist and, in urban areas, time at the kerb side for vans that are delivering may contribute disproportionally to congestion. As mentioned previously, there are congestion hot spots and figures from Transport for London point to vans making up well over 20% of London traffic in the morning peaks (8.00am – 9.00am). This is now recognised in policy terms and the recent Mayor of London’s Freight Servicing Action Plan proposes a more integrated approach to the design and management of the conflicting demands for road and kerb space.
It is possible that the downsizing trend from HGVs to LCVs highlighted earlier in this report will cause more congestion on the UK’s roads as the same amount of goods will be moved in a larger number of vehicles. However, as we will discuss in our concluding section, new means of transportation and innovative new logistical techniques are increasingly being used which will help to create a more efficient supply chain for the last mile.
LCVs AND SAFETY
OEMs now offer an array of safety features, often fitted as standard, for their LCVs including Anti-lock Braking Systems (ABS), Advanced Driver Assistance Systems (ADAS), lane departure warning systems (LDWS) and autonomous emergency braking systems (AEBS). These safety features are increasingly being specified as pre-requisites in vehicle supply tenders issued by major fleet operators.
As with other modes of motorised transport, LCVs are becoming more ‘connected’ with telematics yielding useful data for improving various aspects of van and driver performance. Although telematics technology has been widely deployed in the HGV sector for many years, an increasing number of van operators are investing in technology to improve the safety and efficiency of their fleets. Companies have long realised that enhanced safety systems not only lower accident rates, they also reduce costs and improve customer service, reputation and efficiency.
❝ The Total Cost of Ownership (TCO) gap between eLCVs and diesel vans is narrowing and when factoring in ongoing fuel costs and where LCVs are operated in congestion charge zones there are significant potential savings.❞Mark Lovett, Head of Commercial Vehicles, LeasePlan

THE GROWING IMPORTANCE OF LIGHT COMMERCIAL VEHICLES TO THE UK ECONOMY THE SOCIETY OF MOTOR MANUFACTURERS AND TRADERS
| Page 21 |
6 THE ENVIRONMENTAL IMPACT OF LCVs (cont.)
In a recent study of LCV operators, 34% had implemented telematics in their fleet to monitor issues such as fuel consumption, driver behaviour and vehicle location. Of this segment, 93% said the reason for using telematics was to improve driver behaviour, 91% said they used digital solutions to locate vehicles and 88% stated the technology improved driver safety.18
Telematics technology is also being leveraged to address the van fleet operator’s Duty of Care obligations. A good example of this is the LeasePlan Driver Check app. which utilises a telematics feed from the van to support the driver in carrying out a physical check of the vehicle at the start of the day in order to confirm that it is fit to drive
The figure below shows the number of accidents per billion miles travelled by different vehicle types and would suggest LCVs have a strong safety record.
While LCVs do enjoy a strong safety record, with the increase of LCVs on UK roads the future management of this sector will need to be carefully monitored. Many of our interviewees referred to a lack of understanding in the sector of the implications of overloading vehicles. The pressure on operating costs and constraints in LCV capacity is having an impact on the overloading of vans. Industry is working closely with the DVSA on a number of campaigns to target overloading, however, recent DVSA figures state that of the 10,800 vans stopped by the roadside each year 88.5% are overloaded.
There is concern within the industry at the high rate of failure for LCVs at first presentation for MoT. These vehicles have much more demanding operating cycles than passenger cars, both in terms of mileage and payload, and this needs to be taken into consideration when considering the safety regime of the sector. Industry believes that the MOT test frequency for vans should be 1-1-1 (or annual testing), closer aligned with the test frequency required of heavier commercial vehicles.
The conclusion from our analysis in this chapter is that LCVs are often negatively regarded in the context of congestion, emissions and safety. However, advances in technology and innovation have resulted in significant improvements for this sector.
Source: Departm
ent for Transport
0
2
20
4
6
8
10
12
14
16
18
All Cars Heavy Goods Vehicles Vans/Light Goods Vehicles
2013 2014 2015 2016 2017
Fatal Accidents per billion miles
0
20
120
40
60
80
100
2013 2014 2015 2016 2017
Serious Accidents per billion miles
0
100
800
200
300
400
500
600
700
2013 2014 2015 2016 2017
Slight Accidents per billion miles
Figure 13 : ACCIDENT DATA BY VEHICLE TYPE

THE GROWING IMPORTANCE OF LIGHT COMMERCIAL VEHICLES TO THE UK ECONOMY THE SOCIETY OF MOTOR MANUFACTURERS AND TRADERS
| Page 22 |
FUTURE CHALLENGES FOR THE UK LCV SECTOR7
During our research we identified two key challenges facing the stakeholders within the UK LCV sector.
1. ENCOURAGING FLEET RENEWAL Our research highlighted the fierce pace of change that will be required in the UK LCV parc in order to meet the challenges of environmental policy and ambitions such as ULEZs, the Road to Zero strategy and Clean Air Zones. The alternatively fuelled van market is still in its infancy, and there are many factors affecting the pace of uptake. The lack of understanding of the benefits of the technology and range as well as payload anxiety are just some of the issues that are hampering adoption. Importantly, addressing LCV's specific infrastructure requirements is vital. New Euro 6 vans currently face no penalties or access restrictions anywhere in the country and continue to be the right choice for many businesses – helping to improve air quality and reduce carbon emissions. However, it will take a number of years for Euro 6 compliant vehicles to filter through the used market - the most common way for sole traders and SMEs to purchase a van. If businesses are unable to purchase a compliant vehicle, they face the prospect of penalties associated with their non-compliance. While larger organisations may be able to absorb these costs, SMEs and sole traders will surely not. It is an open question as to what will be the implications for their businesses and the customers that they serve. RECOMMENDATIONS
n Electrified vans accounted for only 0.3% of the new LCV market in 2018 - evidence that the government should maintain support for the Plug-In Van Grant beyond 2021.
n While industry supports government’s plan to introduce CO2-based Vehicle Excise Duty for vans it should be implemented in a way that ensures businesses pick the right vehicle for their needs, avoiding any unintended consequences. Government must work with industry and consumers during the implementation process.
n The introduction of ULEZ/CAZ should not deter from the need for a nationally unified transport network. The consistent implementation of the national framework is required with clear communication for LCV drivers so that they understand the requirements regardless of where they are operating.
n Diesel engines will still play a vital role in the commercial fleet sector for the foreseeable future. Alternative measures for last-mile delivery can only offer limited benefits in helping reduce congestion and pollution within towns and cities. Policies
to support the uptake of low and ultra-low emission vehicles, including the latest Euro 6 diesels and hydrogen powertrains, as well as measures to improve traffic flow, are required to help improve local air quality and reduce carbon emissions.
n There are a significant number of barriers to overcome to help support the uptake of electrified vans. These include higher capital costs, residual values, range, charging infrastructure and constrained payload.
2. THE CHANGING SHAPE OF LOGISTICS The UK transport sector is rapidly evolving. Suppliers, responding to rising consumer and business sector expectations, have developed agile, creative and flexible ways to make good on these demands. In addition, new cleaner and more fuel-efficient vehicles coupled with technology on and off the vehicle is improving usage and driving down costs. Despite this innovation, increasing congestion continues to place adverse pressure on the sector. A variety of ideas and initiatives are being trialled. These include regional collaboration and consolidation of courier companies and services. Businesses also now have a range of complementary options for last-mile deliveries in urban areas, including electric cargo bikes and autonomous robots. The vehicle supply chain has also developed customised, personal and more tailored solutions to match the needs of a more complex market. Our research has highlighted that the LCV sector has undoubtedly benefitted from a change in consumer buying behaviour, market structure and business model changes. As companies continue to innovate to become more flexible, responsive and efficient, the current role of the LCV as the workhorse of the UK’s supply chain looks set to continue. However, this needs to be balanced against the need to reduce congestion and improve the environment. RECOMMENDATIONS
n In the interests of minimising congestion, the sector needs recognition in local transport policies, consistent across authorities, to ensure ease of access and maintain efficiency.
n Local emissions regulations should enforce clear and uniform policies that apply across the UK.
This report clearly demonstrates the diversity and vibrance of the LCV sector, and its importance to the UK economy. The sector is making substantial strides forward in terms of innovation and environmental progress. As such, an ongoing and informed debate with policy-makers is needed to ensure that the sector continues to thrive and to contribute to the success of UK plc.

THE GROWING IMPORTANCE OF LIGHT COMMERCIAL VEHICLES TO THE UK ECONOMY THE SOCIETY OF MOTOR MANUFACTURERS AND TRADERS
| Page 23 |
However, the current unpredictability of the LCV operating environment is a source of uneasiness and debate among industry players. The report also highlights some future challenges that will require industry collaboration with other stakeholders, notably in relation to:
n Ensuring that the van parc can keep up with timelines associated with new environmental legislation and initiatives.
n Exploring the future role of the LCV as supply chain and logistics concepts evolve and leverage new technologies such as automation, electric cargo bikes and drones.
As such, greater understanding of LCVs and supporting their place as a key driver of the UK economy will help the country to thrive. These vehicles deserve to be recognised as a major driver of the UK economy, now and in the future.
This research in this report highlights a sector that is a vital component of the UK economy and society. LCVs play a critical role, well beyond the realms of home shopping, in terms of supporting large corporates, SMEs and sole traders working across a broad range of industries. It is because of these factors that we believe the van market is set to grow and become more influential, aided by its vehicles’ adaptability, excellent safety record and improving environmental credentials.
8 CONCLUSIONS
THE GROWING IMPORTANCE OF LIGHT COMMERCIAL VEHICLES TO THE UK ECONOMY THE SOCIETY OF MOTOR MANUFACTURERS AND TRADERS
| Page 24 |
APPENDIX
INTERVIEWEES
n Arval
n Bri Stor Systems Limited
n British Gas
n Committee on Climate Change
n Cox Automotive
n Driver and Vehicle Standards Agency
n Fiat Chrysler Automobiles
n Ford
n Freight Transport Association
n Future City Logistics
n Glass's Information Services
n Isuzu UK
n LeasePlan
n Paneltex
n PSA Group
n RAC Foundation
n Renault
n Retail Motor Industry Federation
n Road Haulage Association
n Ryder
n Tevo
n Transport for Greater Manchester
n Transport for London
n Transport Scotland
n University of Southampton
n University of Westminster
n Vauxhall
n Volkswagen Commercial Vehicles
n Welsh Water
n ZipCar UK
RESEARCH NOTES
The economic assessment of the impact of LCVs has been based on the Gross Value Added (GVA) by sector in the UK economy compared with estimates of the deployment of LCVs in each sector, their employment and operating costs.
GVA is the value of output less the value of intermediate consumption; it is a measure of the contribution to GDP made by an individual producer, industry or sector. GVA can be broken down by industry and institutional sector. The sum of GVA over all industries or sectors plus taxes on products minus subsidies on products gives gross domestic product.
The data used was extracted from the UK Office of National Statistics, SMMT and industry reports, together with the application of industry expertise. The central step to the research was the estimation of vans deployed by sector and by ownership stages; the process used was one of triangulation of a number of sources, including the LCV parc, age distribution, used van usage patterns, mileage distributions and research on van use by the Freight Transport Association, Transport for London and Cranfield University. It is important to note that GVA sector economic data does not perfectly align with typical logistics classifications of vehicle use.
The employment value or cost is a conservative estimate based on the national minimum wage and associated social costs. Employment value is made up of direct and indirect employment. Direct employment is defined as individuals that use LCVs as the critical tool for delivering value, such as individuals that conduct parcel or food delivery. Indirect employment is defined as individuals that use LCVs as an important adjunct to their employment such as plumbers or construction workers. In addition to defining the employment value (or cost) per industry, the direct cost of ownership of LCVs is defined as the combination annual and standing costs including vehicle capital depreciation.
Data from the Department of Transport and industry reports have been used as a basis for estimating the cost of congestion and environmental and safety impacts on the UK economy. Congestion cost is the combination of traffic miles per year per vehicle, average hours lost in traffic per driver per year and the employee cost per year. Environmental cost estimates use emissions data (CO2, NOx, PM2.5, PM10) and cost per tonne of emissions. Safety cost estimates are calculated based on the number of accidents per vehicle and the cost per accident..
FOOTNOTES
1 Light Commercial Vehicle is the official term within the European Union for a commercial carrier
with a gross vehicle weight of no more than 3.5 metric tons.
Throughout the report the terms LCV and van are used interchangeably2 Mayor of London Transport Strategy Report3 Trends in Self-Employment in the UK Office for National Statistics4 Better Delivery: The Challenge for Freight, National Infrastructure Committee 5 Presentation Ian Wainwright to CILT (2019) 6 Eurostat: eCommerce statistics (2018)7 RAC Foundation, The Implications of Internet Shopping Growth on the
Van Fleet and Traffic Activity (2017)8 ‘Online Grocery shopping the United Kingdom’ Statista
9 The term ‘electrified LCVs’ refers to both PHEV and BEV 10 Car emissions bands have been used for the purpose of this analysis11 SMMT. This statistic relates to all vehicles in the market,
including passenger cars and electric vehicles12 Department for Transport, ‘Transport Energy Model’ (2018)13 The Van Excellence Report, FTA (201814 Low Carbon Vehicle Partnership and Cenex, ‘The Low Emission Van Guide’ (2016)15 For example, pure electric, and plug in hybrid16 INRIX, Congestion Costs (2019) 17 Please see Research Notes in Appendix for explanation of method18 Corporate Vehicle Observatory, Fleet Barometer (2017)

THE GROWING IMPORTANCE OF LIGHT COMMERCIAL VEHICLES TO THE UK ECONOMY THE SOCIETY OF MOTOR MANUFACTURERS AND TRADERS
| Page 25 |
ABOUT BEARINGPOINT
BearingPoint is an independent management and technology consultancy with European roots and a global reach. The company operates in four units: Consulting, Solutions, Business Services, and Ventures. Consulting covers the advisory business; Solutions provides the tools for successful digital transformation, advanced analytics and regulatory requirements; Business Services provides managed services beyond SaaS; Ventures drives the financing and development of start-ups. BearingPoint’s clients include many of the world’s leading companies and organisations. The firm has a global consulting network with more than 10,000 people and supports clients in more than 75 countries, engaging with them to achieve measurable and sustainable success.
BEARINGPOINT BIOGRAPHIES
JAMES RODGERJames Rodger is a Partner and Regional Leader for UK & Ireland as well as a Member of the Global Management Committee at BearingPoint. James has worked at BearingPoint for more than 13 years, and specialises in Automotive, Digital Strategy, and Operational performance improvement.
ALAN BRAITHWAITEAlan has worked in logistics and supply chain management for nearly 40 years. He has taken a particular interest in freight transport policy and investment, publishing widely on freight policy including being the lead author of the Chartered Institute of Logistics and Transport – Freight Vision 2035. He is the Chairman of the CILT's Freight and Logistics Policy Forum and has been sitting on the National Infrastructure Commission's Freight Policy Panel. In 2017 he authored a report for the RAC Foundation on the implications of internet shopping growth on the van fleet and traffic activity.
PETRA KRIVINSKASPetra has more than 18 years of Automotive OEM experience gained from roles within industry and professional services. Specialising in large scale transformation projects, customer experience design, digital business model innovation, new services development and revenue generation, Petra has worked with several industry leaders to define their future digital customer experience.
For more information, please visit:Homepage: www.bearingpoint.com LinkedIn: www.linkedin.com/company/bearingpointTwitter: @BearingPoint

THE SOCIETY OF MOTOR MANUFACTURERS AND TRADERS LIMITED71 Great Peter Street, London, SW1P 2BNTel: +44 (0)20 7235 7000E-mail: [email protected]
@SMMT SMMT
www.smmt.co.uk
SMMT, the ‘S’ symbol and the ‘Driving the motor industry’ brandline are registered trademarks of SMMT Ltd
DisclaimerThis publication contains general information and, although SMMT endeavours to ensure that the content is
accurate and up to date at the date of publication, no representation or warranty, express or implied, is made as to
its accuracy or completeness and therefore the information in this publication should not be relied upon. Readers
should always seek appropriate advice from a suitably qualified expert before taking, or refraining from taking, any
action. The contents of this publication should not be construed as advice or guidance and SMMT disclaims liability
for any loss, howsoever caused, arising directly or indirectly from reliance on the information in this publication.


