Page 1
I
Light-Emitting Polymers with On-Chain Triplet
Emitters
Dissertation
Zur Erlangung des akademischen Grades
Doktor der Naturwissenschaften
(Doktor rerum naturalium)
Eingereicht in der Fakultät 4 - Mathematik und Naturwissenschaften der
Bergischen Universität Wuppertal
von
Eike Heuser
aus Wuppertal
Wuppertal, 2016
Page 2
II
Die Dissertation kann wie folgt zitiert werden:
urn:nbn:de:hbz:468-20160614-094258-5[http://nbn-resolving.de/urn/resolver.pl?urn=urn%3Anbn%3Ade%3Ahbz%3A468-20160614-094258-5]
Page 3
III
Die vorliegende Arbeit entstand in der Zeit von Oktober 2010 bis Oktober 2013 in der
Arbeitsgruppe Funktionspolymere des Fakultät 4 - Mathematik und Naturwissenschaften der
Bergischen Universität Wuppertal unter Anleitung von Jun.-Prof. Dr. Elisabeth Holder.
1. Gutachter: Prof. Dr. Ullrich Scherf
2. Gutachter: Prof. Dr. Michael Tausch
Eingereicht am 16.02.2016
Mündliche Prüfung am 23.05.2016
Page 5
V
Meiner Familie in Dankbarkeit
Page 7
VII
Welch triste Epoche, in der es leichter ist, ein Atom zu zertrümmern als ein Vorurteil.
(Albert Einstein)
Wir müssen unbedingt Raum für Zweifel lassen, sonst gibt es keinen Fortschritt, kein
Dazulernen. Man kann nichts Neues herausfinden, wenn man nicht vorher eine Frage stellt.
Und um zu fragen, bedarf es des Zweifelns.
(Richard P. Feynman)
Page 8
VIII
Abstract
Organic Light-Emitting Devices (OLEDs) consist of subsequent semiconducting, organic
layers and, since this decade, can be found in consumer electronics e.g. in displays, chiefly in
mobile phones, or even for lighting. Their main advantages compared to Liquid Crystal
Displays (LCDs) are the thinner construction, flexibility and potentially higher efficiency.
Iridium(III) complexes are widely used as active emitter species in OLEDs as they are
capable of harvesting both, singlet and triplet excitons, thus, enhancing the efficiency of the
devices.
In this thesis, the synthesis and characterization of an iridium(III) complex triplet emitter is
presented that emits red light due to its 2-phenylisoquinoline cyclometalating ligands.
Furthermore, the emitter was furnished with a carbazolyl-functionalized ancillary ligand in
order to promote hole trapping at the emitter site. In addition, two series of copolymers based
on poly(9,9-dioctylfluorene) as backbone and varying ratios of green fluorescent fluoren-9-
one and the iridium(III) complex were synthesized for application in single active layer
OLEDs. The first series of copolymers P1-8 revealed color tune ability from green to red and
efficient energy transfer from the polymer backbone to the guest moieties. To improve hole
injection into the single active layer, two comonomers, fluorene-based 4,4'-(2,7-dibromo-9H-
fluorene-9,9-diyl)bis(N,N-diphenylaniline) and carbazole-based 3,6-dibromo-9-(2-
ethylhexyl)-9H-carbazole, were synthesized. Subsequently, optimized copolymers PW1-5
were prepared and tested in white light-emitting OLEDs (WOLEDs).
Moreover, a second iridium(III) complex with 6-fluoro-2-phenylbenzo[d]thiazole as
cyclometallating ligands and carbazolyl-functionalized ancillary ligand (Z)-6-(9H-carbazol-9-
yl)-5-hydroxy-2,2-dimethylhex-4-en-3-one was prepared as orange emitter and tested in an
OLED.
During the fabrication of polymer OLEDs (POLEDs), either inkjet printing or spin coating of
polymer solutions on underlying organic functional layers is usually applied. Spin coating
suffers from material of the underlying layer(s) being dissolved in the polymer solution and
washed away during the process. Thus, either orthogonal solvents or cross-linking of the
underlying layer(s) is needed. Both techniques require the introduction of functional groups,
either for cross-linking or for controlling the polarity, thus increasing the synthetic and
technical effort. As a possible solution, aqueous suspensions of a copolymer were prepared
with concentrations of up to 50 mg ∙ L-1
. In first attempts, the suspensions could be
successfully printed on glass substrates.
Page 9
IX
Table of Contents
1 Introduction .................................................................................................................................... 1 1.1 OLEDs – devices and materials ................................................................................................. 1 1.2 Device fabrication ...................................................................................................................... 6 1.3 Processes during device operation ............................................................................................. 7 1.4 Heavy metal transition complexes – harvesting excited triplet states ...................................... 10 1.5 Multicolor OLEDs – approaches to white light-emitting diodes (WOLEDs) .......................... 13 1.6 White light polymer organic light-emitting devices (WPLEDs) .............................................. 15 1.7 Phosphorescent iridium(III) complexes for OLED applications .............................................. 18 2 Aim and scope .............................................................................................................................. 21 3 Results and Discussion ................................................................................................................. 24 3.1 Properties of Ir(piq)2(carbacac) ................................................................................................ 24 3.2 Synthesis of comonomers ......................................................................................................... 25 3.2.1 Synthesis of iodine-functionalized Ir- complex [Ir(piq)2(dicacac)] ................................. 25 3.2.3 Synthesis of fluorene-based monomers ........................................................................... 34 3.2.4 Synthesis of a 9H-carbazole-based monomer ................................................................. 35 3.3 Synthesis of orange light-emitting complexes [(F-bt)2Ir(carbacac)] ........................................ 36 3.4 Synthesis and characterization of statistical copolymers for OLED applications .................... 42
3.4.1 Synthesis of statistical RGB copolymers for application in OLEDs ............................... 43 3.4.2 Microparticle suspensions of copoylmer P8 .................................................................... 49 3.4.3 Printing results of copolymers P1-8 ................................................................................ 52 3.4.4 P1-8 and their application in OLEDs .............................................................................. 54 3.4.5 Synthesis of statistical copolymers for (WOLEDs) ......................................................... 58
3.5 Results of OLED with a novel orange triplet emitter ............................................................... 65 4 Summary and Outlook .................................................................................................................. 68 5 Experimental ................................................................................................................................. 69 5.1 Materials ................................................................................................................................... 69 5.2 Solvents .................................................................................................................................... 69 5.3 Instrumentation ......................................................................................................................... 69 5.4 Monomer Synthesis .................................................................................................................. 71
5.4.1 3,6-diiodo-9H-carbazole (1) ............................................................................................ 71 5.4.2 ethyl 2-(3,6-diiodo-9H-carbazol-9-yl)acetate (2) ............................................................ 72 5.4.3 (Z)-1-(3,6-diiodo-9H-carbazol-9-yl)-4-hydroxy-5,5-dimethylhex-3-en-2-one (3) .......... 72 5.4.4 1-phenylisoquinoline (4) .................................................................................................. 73 5.4.5 [(piq)4Ir2Cl2] complex (5) ................................................................................................ 74 5.4.6 [(piq)2Ir(carbacac)] complex (6) ...................................................................................... 74 5.4.7 4,4'-(2,7-dibromo-9H-fluorene-9,9-diyl)bis(N,N-diphenylaniline) (7) ............................ 75 5.4.8 2,7-dibromo-9,9-dioctyl-9H-fluorene (8) ........................................................................ 76 5.4.9 3,6-dibromo-9-(2-ethylhexyl)-9H-carbazole (9) ............................................................. 77 5.4.10 N-(4-fluorophenyl)benzamide (10) .................................................................................. 77 5.4.11 N-(4-fluorophenyl)benzothioamide (11) ......................................................................... 78 5.4.12 6-fluoro-2-phenylbenzo[d]thiazole (12) .......................................................................... 79 5.4.13 [(F-bt)4Ir2Cl2] complex (13) ............................................................................................ 79 5.4.14 [(F-bt)2Ir(carbacac)] complex (14) .................................................................................. 80
5.5 Polymer Synthesis .................................................................................................................... 81 5.5.1 General procedure for preparation of copolymers P1-8 .................................................. 81 5.5.2 General procedure for preparation of copolymers PW2-4 ............................................... 84 5.5.3 Copolymer PW5 .............................................................................................................. 85
6 List of Figures ............................................................................................................................... 87 7 List of Schemes ............................................................................................................................ 89 8 Appendix ...................................................................................................................................... 90 8.A 2D
1H-
1H COSY-NMR spectrum of PW5 (excerpt) ............................................................... 90
9 Acknowledgement ........................................................................................................................ 92 10 Literature ....................................................................................................................................... 94
Page 10
1
1. Introduction
In the last decades, organic light-emitting diodes (OLEDs) have received high attention in the
advancing field of display technology and solid state lighting. Since the discovery of
electroluminescence (EL) in organic materials by A. Bernanose in the early 1950s[1]
and of
electric conductivity in polymers with alternating double and single bonds as polyacetylene
(PA) by Shirakawa et al., OLEDs have been developed to market maturity.[2]
Today, they are
used in a wide variety of consumer electronics, such as mobile phones, while bigger full color
displays, e.g., for televisions, are still not available at reasonable prices. At the beginning of
2010, HTC fabricated the first mobile phone with an OLED display (manufactured by
Samsung) that was successfully established on the market at a reasonable price. Since then,
especially Samsung has developed various smartphones with full-color OLED screens with
sales as high as 50 million devices, e.g., for the Samsung Galaxy S3.[3]
In 2014, LG
Electronics announced the first curved, flexible smartphone, equipped with an OLED
display.[4]
In this emerging market, as well as in potential new markets as TV flat panel
displays and solid state lighting, the development of high efficient OLEDs is of great interest
for the industry. Still, major problems need to be solved: the lower efficiency and long term
stability of blue emitters compared to their red and green counterparts,[5]
encapsulation of
flexible devices and cost efficient manufacturing.
1.1 OLEDs – devices and materials
In this paragraph, a simplified device structure of an OLED is presented along with a short
description of commonly used materials.
OLEDs are fabricated by adding several (semi)conductive layers on top of a transparent
substrate. The individual layer thickness is usually in the range of a few nanometers (nm) up
to a few hundred nm. A simplified device structure is shown in Figure 1. The functional
principle of an OLED is based on the movement of charges. Positive charges (holes) migrate
from the anode towards optional transport layers to a layer containing an emitter material.
Simultaneously, negative charges (electrons) are injected from the cathode and move towards
the emitter layer where the positive and negative charges combine to form an exciton. An
Page 11
2
exciton can be seen as a bound state of an electron and an electron hole that are attracted
through electrostatic Coulomb force.[6]
The subsequent recombination of the charges leads to
an excited state of the molecule at that the exciton was formed. Subsequent relaxation of the
excited states takes place until the lowest excited state is reached which then relaxes to the
ground state by emitting electromagnetic waves or by concurrent relaxation modes.
While glass is usually used as a transparent substrate because it is cheap and impermeable for
oxygen and moisture, transparent plastic foils allow the production of flexible OLEDs.
However, up to now, there is no foil available that is adequately impermeable for oxygen
which has an impact on the long term stability of OLEDs as well as on the performance due to
efficient quenching of the excited states.[7]
Indium tin oxide (ITO) is widely used as an anode material because of its high transparency in
the visible range of the electromagnetic spectrum and low electrical resistivity of
2 - 4 ∙ 10-4
Ω ∙ cm-1
.[8-9]
Due to the fact that indium is a rare element and therefore expensive,
alternative metal oxides[10]
as well as carbon nanotubes[11]
and graphene[12]
are currently being
investigated as anode materials.
glass
Anode (ITO)
HIL
HTL
EML
cathode
+ +
+
+
+ -
+
holes
-
electrons
light
Figure 1. Schematic representation of a multi-layer device architecture.
ETL
-
- -
cathode
Page 12
3
Hole injection layers (HIL) are used to facilitate the injection of positive charges (holes) into a
hole transport layer (HTL) by replacing the high barrier for charge injection with a cascade of
lower barriers.[13-14]
Common materials are PEDOT:PSS, an ionomer of poly(3,4-
ethylenedioxythiophene) and poly(styrenesulfonate) as well as triphenyl-diamine (TPD) and
naphthyl-phenyl-diamine (NPD) and other triarylamines with ‘bi-phenyl’ substructures
(Scheme 1).[15]
Scheme 1. Chemical structures of common hole injection materials.
Depending on the architecture of an OLED, the hole transport layer allows for the migration
of positive charges towards the emitting layer, or, in some cases, is also utilized as the host
material for an emitter. The first efficient OLED fabricated by Tang and VanSlyke[16]
consisted of only two layers between the electrodes: namely a TPD derivate[17]
as HTL and 8-
hydroxyquinline aluminum, a fluorescent metal chelate complex, as luminescent material that
is also capable of electron transport.[18-19]
It was the first device to operate at voltages below
several hundred volts (turn-on voltage of about 3V) and proved that, in this two-layer
architecture, recombination of positive and negative charges and electroluminescence occur in
the middle of the layers[16]
. It was the starting point of OLED development as we know it
today.[20]
Since then, other HTL materials have been developed for optimized device
architecture. Among these are polymers such as poly(N-vinyl carbazole) (PVK)[21]
, various
star-shaped materials derived from 1,3,5-tris(diphenylamino)benzene (TDAB)[22]
,
Page 13
4
triphenylamine derivates (TPD) type molecules like N,N'-bis(3-methylphenyl)-N,N'-
diphenylbenzidine, spiro-linked molecules such as ‘Spiro-2’[23]
and carbazole-based
materials like 5,11-di(naphthalen-1-yl)-5,11-dihydroindolo[3,2-b]carbazole (Scheme 2).[15]
Scheme 2. Chemical structures of common hole transport materials.
Materials for the emitting layer (EML) can be divided into two classes, fluorescent and
phosphorescent substances. In both cases, the materials are usually doped into a matrix to
form a host-guest doped emitter system. With optimized transport and luminescent properties,
the host material may be used with various fluorescent or phosphorescent guest materials
leading to electroluminescence of high efficiency. The operational stability may also be
improved by transferring the exciton to a highly stable and emissive guest, thus minimizing
the possibility of non-radiative decay.[15, 24]
Various matrices have been developed, most of
them being derivates of hole and/or electron transport materials.
Page 14
5
Among others, fluorescent emitters were derived from coumarin, e.g., 10-(2-benzothiazolyl)-
1,1,7,7-tetramethyl-2,3,6,7-tetrahydro-1H,5H,11H-[l]benzo-pyrano[6,7,8-ij]quinolizin-11-
one, known as C-545T,[15]
which emits in the green region of the electromagnetic spectrum,
just like N,N’-diethylquinacridone (DEQ)[25]
. One example of a red emitter is given by 4-
(dicyanomethylene)-2-t-butyl-6-(1,1,7,7-tetramethyljulolidyl-9-enyl)-4H-pyran (DCJTB)[26-
28].
Phosphorescence in common organic molecules is known to be weak.[29]
Even though new
approaches like bypassing Kasha’s rule of internal conversion in order to enhance the yield of
the triplet and singlet excitons for light out-coupling have been recently developed,[30]
harvesting of the excited triplet states is usually achieved by incorporating heavy transition
metal complexes as guests. These allow intersystem crossing (ISC) due to their strong spin-
orbit coupling.[31]
Especially by using platinum(II) and iridium(III) complexes, it is possible
to achieve nearly 100% internal quantum efficiency.[32-33]
Scheme 3. Chemical structures of examples for a) fluorescent organic molecules. b)
phosphorescent iridium(III) and platinum(II) complexes.
Page 15
6
Therefore, a wide variety of cyclometallating and ancillary ligands have been developed
allowing for emission wavelength tuning from ultra violet (UV) to the infrared. Scheme 3 a)
illustrates some fluorescent organic materials that have been applied in OLEDs. Scheme 3 b)
presents a selection of phosphorescent iridium(III)[32, 34]
and platinum(II)[33, 35]
complexes with
acetylacetonate (acac) ancillary ligands.
In the electron transporting layer (ETL), electrons are injected from the cathode to migrate to
the emitting layer. Depending on the workfunction of cathode material and EML, various
different materials have been developed. Two commonly used ETL-materials are outlined in
Scheme 4, 2-([1,1'-biphenyl]-4-yl)-5-(4-(tert-butyl)phenyl)-1,3,4-oxadiazole (t-Bu-PBD) and
1,3,5-tris(2-N-phenylbenzimidazolyl) benzene (TPBI).[36-37]
Lately, conjugated
polyelectrolytes have been developed allowing the use of high work function metals as
cathodes, such as gold.[38]
Scheme 4. Chemical structures of two examples of widely used electron transport materials.[36]
1.2 Device fabrication
Depending on the desired device architecture and the applied active materials, different
techniques for the fabrication of OLEDs are used in order to form thin films.
Small molecules can be deposited on surfaces by vapor phase deposition.[39-40]
The material is
vaporized at raised temperature in a hot-walled chamber where it condenses on the cooled
substrate. By repeating this step again with a different material, subsequent thin layers can be
achieved. The main drawbacks are the high costs when it comes to mass production and the
limitation to small molecules that are evaporable and stable at raised temperature.
Page 16
7
Another technique is spin coating where a material is dissolved in a solvent and the solution is
slowly dropped onto the middle of a substrate which is rotating around its central axis.[41-42]
Due to the centrifugal force, the solution is quickly spread while the solvent evaporates,
leaving a thin film of the material. The thickness of the films depends on the concentration of
the solution, the solvent’s properties like viscosity and volatility, and the angular speed
applied. The advantage of this technique is the fast and cost-effective production. It allows the
processing of materials that are not stable enough for vapor deposition or those having higher
molecular weights, e.g., (co)polymers. However, fabrication of multiple layers via spin
coating can cause problems due to the fact that the solvent of the new layer can remove parts
of the material of the underlying layer if these are soluble in the used solvent. Therefore,
orthogonal solvents are needed, requiring the development of, e.g., water-soluble materials.
Much research effort has been spent to circumvent the need of orthogonal solvents, e.g. by
applying spray[43]
and inkjet-printing[44]
techniques as well as by cross-linking a layer to the
underlying layer by either thermal annealing[45-46]
or irradiation of allyl-functionalized
compounds.[47]
1.3 Processes during device operation
Figure 2 depicts a simplified schematic illustration of a multilayer OLED during operation.[48]
Figure 2. Simplified energy diagram of a multilayer OLED showing the HOMO and LUMO
levels of the different layers.[48]
Page 17
8
As mentioned before, holes are injected from the anode into the HIL from where they migrate
in the electric field of the applied bias towards the HTL into the EML. An optional hole
blocking layer (HBL) is introduced with a low-lying highest occupied molecule orbital
(HOMO) in order to prevent the holes from reaching the ETL, where the formation of
excitons is undesired, or even the cathode, where they would be quenched. The electrons are
injected into the lowest unoccupied molecule orbital (LUMO) of the electron injection layer
(EIL) and migrate towards the ETL to the EML. The electron blocking layer (EBL) with its
high-lying LUMO hinders the electrons from reaching the HTL or even the anode. When an
electron-hole pair recombines, it forms an exciton, an excited state on a molecule. It is well
known from spin statistics that the probability of forming a singlet exciton is 25%, whereas
the probability of forming a triplet exciton is 75% when organic molecules are electrically
excited.[49]
Due to the fact that transitions from the triplet states to the singlet ground state are
forbidden by spin statistics, only the excited singlet states can relax to the ground state by
emitting photons. This is usually a very fast process in the order of 1 to 100 ns. The excited
triplet states are transformed into heat through vibrational modes and, thus, are lost for the
emission. This means, fluorescent OLEDs can only reach a maximum internal quantum
efficiency of 25%. To avoid this limit, heavy transition metal complexes can be used as
emitters. The strong spin-orbit coupling between the transition metal and the ligands leads to
the singlet and triplet states mixing, thus allowing intersystem crossing (ISC) and therefore
efficient fluorescence and phosphorescence at room temperature.[50]
In theory, an internal
quantum efficiency of 100% is possible and many research groups have already claimed to
have materials that show 100% internal quantum efficiency in OLEDs.[51-52],[32]
Figure 3
illustrates the most important transitions between molecular orbitals (MO) in a modified
Jablonski diagram.[53]
Due to an exciton being formed on the molecule, an excited state of the molecule gets
populated, thus resulting either in an excited singlet (Sn) or excited triplet state (Tn). In the
case of an excited singlet state, the electron will relax to the lowest excited singlet state S1
through internal conversion (IC). This is a very fast process in the order of 100 fs in which the
excess energy of the electronical and vibrational excited molecule is quickly transferred to
surrounding molecules (intermolecularly) or intramolecularly due to electron-vibrational
interactions.
Page 18
9
Figure 3. A modified Jablonski diagram showing non-radiative transitions (curved, black lines),
spin-allowed radiative transitions (fluorescence, blue) and spin-forbidden radiative transitions
(phosphorescence, red). Additional, non-radiative relaxation pathways from S1 and T1 to S0 are
indicated by solid black arrows. Electronic singlet states are named S0…Sn, triplet states are
named T1…Tn. Vibronical states within electronic states are named Vn.
From the lowest excited singlet state (S1), the further non-radiative transition to the singlet
ground-state (S0) is hindered by a large energy gap and is therefore much slower than the fast
radiative relaxation (fluorescence) which usually occurs in the order of nanoseconds. In the
case of a triplet exciton being formed, it will quickly decay via IC to the lowest triplet state
T1. In the case of a weak spin-orbit coupling, e.g., in hydrocarbons, the radiative transition to
the singlet ground state is spin-forbidden (kinetically unfavorable) and therefore orders of
magnitude weaker than the fluorescence from excited singlet S1 states. Thus, the triplet
lifetime in hydrocarbons is quite long being in the range of milliseconds or even seconds.
During its lifetime, the excited triplet state is very likely to be quenched by bimolecular
interactions with other triplet or singlet excitons or charge carriers and therefore wasted for
the generation of light.
Page 19
10
1.4 Heavy metal transition complexes – harvesting excited triplet states
As described in chapter 1.1, complexes of heavy transition metals like ruthenium, iridium and
platinum have been widely used as phosphorescent dopants for OLEDs. This is because they
are capable of forming emissive excited states due to efficient mixing of singlet and triplet
states.[54]
These mixed states are visible in the absorption and emission spectra of the
complexes. Figure 4 depicts the chemical structure of an orange light-emitting iridium(III)
complex and its normalized absorption and emission spectra in chloroform solution.[55]
The
absorption spectrum is dominated by strong bands below 300 nm which can be mainly
attributed to transitions from the S0 ground state to various singlet ligand-to-ligand-charge-
transfer (1LLCT) and singlet ligand-centered (
1LC) states whereas the weaker bands between
400 nm and 550 nm mainly arise from transitions to singlet metal-to-ligand-charge-transfer
(1MLCT) states. The emissive T1 state at 625 nm is of mixed
3LC and
3MLCT character.
300 400 500 600 7000.0
0.2
0.4
0.6
0.8
1.0
0.0
0.2
0.4
0.6
0.8
1.0
No
rma
lize
d e
mis
sio
n [
a.u
.]
No
rma
lize
d a
bs
orp
tio
n [
a.u
.]
Wavelength [nm]
Absorption
Emission
Figure 4. Normalized absorption and emission spectra of an iridium(III) complex (chloroform
solution at a concentration of 10-5
M).[55]
Page 20
11
Due to concentration quenching, pristine layers of iridium(III) complexes in OLEDs usually
reveal very low efficiencies.[56]
Hence, the phosphorescent dyes are blended into a proper host
matrix.[54]
Self-evidently, singlet and triplet excitons may be formed directly on the guest or
on the host material. In the case of direct exciton generation on the dye, the matrix only
functions as a charge transport layer. The phosphorescent dye should then behave as a charge
trap and recombination site. In order to reach acceptable device performance, excitons formed
on the host material have to efficiently transfer the exciton energy to the guest molecules.
Two possible mechanisms of energy transfer
Figure 5. Simplified illustration of energy transfer processes. a) Förster energy transfer; b)
Singlet Dexter energy transfer; c) Triplet Dexter energy transfer.[57]
(exciton energy) from the host to the guest are postulated. These are, on the one hand,
Förster[58]
transfer of singlet excitons and, on the other hand, Dexter[59]
transfer of singlet and
triplet excitons. In the case of Förster transfer, the absorption band of the phosphorescent dye
needs a good overlap with the emission bands of the host. As most dyes have their absorption
maximum in the blue region of the electromagnetic spectrum, wide bandgap materials are
Page 21
12
commonly used as host materials in order to fulfill this requirement. Regarding Dexter
transfer, the crucial requirement is that the energy of the excitons on the host matches the
exciton energies on the guest.[60],[61]
Figure 5 illustrates a simplified overview of the possible
Förster and Dexter energy transfer mechanisms.
In the case of the Förster mechanism (Figure 5a), an excited donor molecule relaxes into the
ground-state. The energy that is released during this process is simultaneously transferred
non-radiatively via resonance to an acceptor molecule. The result is a donor molecule in
ground-state and an excited singlet state on the acceptor molecule. This mechanism depends
on some prerequisites. Apart from the orientation of the molecules influencing the dipole
transition and absorption dipole, the distance between donor and acceptor molecules have to
be < 10 nm as the efficiency is reduced with increasing distance by the factor of r6 due to the
Coulombic interaction. Figure 5 b) and c) illustrate the Dexter mechanism for singlet and
triplet transfer, respectively. In this case, electrons hop from the LUMO of the donor to the
LUMO of the acceptor while, simultaneously, an electron from the HOMO of the acceptor
hops to the HOMO of the donor. For the Dexter mechanism, an overlap of the wave functions
of the orbitals is necessary. This limits the possible distance between acceptor and donor to
approximately 1 nm. In order to investigate the mechanisms of energy transfer in host-guest
environments, Cleave et al. studied the transfer processes between a phosphorescent
porphyrin, platinum(II) 2,3,7,8,12,13,17,18-octaethyl-21H,23H-porphyrin (PtOEP), and a
series of host materials (Figure 6).[62]
Based on their results, the following cases can be
distinguished:
a) Exciton formation on the guest occures when it acts as a trap for one or both charges. Here,
the HOMO of the host is lower than the HOMO of the guest. In consequence, holes will be
trapped on the dye.
b) Dexter transfer occures when the guest is doped into a polymer blend where it only forms
shallow charge traps so that excitons are predominantly formed on the host material. Besides
singlet exciton transfer from host to guest, also triplet exciton energy transfer appears.
c) In case of offset HOMO and LUMO levels and additionly when the offset value is higher
than the coulomb binding energy of the exciton, charge separation will occur and neither
emission from the dye nor any energy transfer will be observed.
Page 22
13
Figure 6. Schematic presentation of HOMO an LUMO levels according to studies of Cleave et
al.[62]
d) If the LUMO of the host is lower in energy than the LUMO of the dye, energy back
transfer from the guest to the host occurs in this system.
In summary, host and guest materials need to fit in terms of HOMO and LUMO levels to
meet the intended operation mode of the device.
1.5 Multicolor OLEDs – approaches to white light-emitting diodes (WOLEDs)
Multicolor OLEDs are of exceedingly interest for lighting and display technology. While
monochromatic OLEDs are relatively easy to fabricate and long-term color stability for most
applications is of minor importance, multicolor OLEDs are often used as flat panel displays or
for lighting applications where long-term stability of the individual colors plays an important
role.
White light emission can be realized a) by adding the three basic colors red, green and blue
(RGB), b) by utilizing the complementary colors blue and yellow (BY), or c) by a single
Page 23
14
broadband emission between 400 nm and 700 nm. In the latter case, pure white light emission
could be achieved, similar to daylight. The approach via RGB already allows white light
emission sufficient enough for industrial use, e.g., in flat panel displays. The color purity of
white light emission from blue/yellow devices is not usually sufficient for full color flat panel
displays as they are not able to render saturated colors such as red. Thus, approaches for better
color rendering by adding a red dye to BY devices have been recently developed.[63]
Figure 7. Simplified examples of device architectures for WOLEDs.[48]
a) EML with 3 color sub-
layers, b) mixture (blend) of RGB emitter molecules, c) pixelated architecture, d) stacked design,
e) single component white light-emitting device. Dark grey layers represent reflective electrodes,
transparent, light grey layers represent transparent electrodes and the light blue bottom layers
represent transparent substrates (glass). For simplicity and better visibility, additional
functional layers (HTL, ETL etc.) are not shown.
Figure 7 outlines a selection of white light-emitting OLED architectures. While a), c) and d)
represent device architectures with separated red, green and blue light-emitting layers, b) and
e) depict concepts of single layer emitter devices. The former allow the use of different host
materials in the EML while the latter need to get by with only one host material. In Figure 7
a) three separate sub-layers for each color are casted on top of each other without any
Page 24
15
separating functional layers.[64]
Figure 7 b) shows a blend of red, green and blue emitters that
are applied in a single layer along with a matrix.[65]
A pixelated approach as found in
multicolor flat panel displays is given in Figure 7 c). Multiple OLEDs can be stacked on top
of each other allowing the variation of the current through each emitting layer and therefore
tuning the emission color of the whole device as depicted in Figure 7 d).[66]
Finally, in Figure
7 e), a single emitter to achieve white light by obtaining radiative decay from the individual
excited emitter as well as from an exciplex/excimer is used.[67-68]
1.6 White light polymer organic light-emitting devices (WPLEDs)
In this section the focus will be on white light-emitting devices based on polymers. Therefore,
an overview of different approaches utilizing polymer systems is given and some examples
are discussed exemplarily.
Polymers can play different roles in OLEDs. They can act as host materials for small emissive
molecules as depicted in Figure 8 a). Kido et al. published the first device by incorporating
three fluorescent dyes in a poly(N-vinylcarbazole) (PVK) matrix.[65, 69]
Later, Huang et al.
reported on a device with a poly(fluorene) (PF) host material doped with orange light-emitting
rubrene and electron transporting PBD resulting in an efficient WOLED.[70]
Kawamura et al.
gave an account of iridium(III) complexes used as phosphorescent guest materials in a PVK
matrix reaching a power efficiency of 1.4 lm/W.[71]
Since then, various enhancements in
device architecture and materials have been reported.[72-73]
Cheng et al. reached power
efficiencies as high as 25.6 lm/W in devices with two phosphorescent iridium(III) complexes
doped into a silane-based wide band-gap polymer.[74]
Furthermore, polymers can also be the light-emitting species. Figure 8 b) outlines a device
with two separated polymer layers, one emitting blue light and the other one yellow light. To
overcome the difficulties in the device preparation (see chapter 1.2), the first polymer needs to
be cross-linked to the underlying functional layer. Moreover, the recombination zone should
be close to the interface in order to realize emission from both species.[48]
Page 25
16
Figure 8. Concepts of polymeric arrangements applied in organic white light-emitting devices. a)
polymer as a host material for small emitter molecules. b) separated light-emitting polymers. c)
blend of light-emitting polymers. d) single copolymer with red, green and blue light-emitting
blocks. [48]
Chao et al. described a device with a PVK and poly(2-dodecyl-p-phenylene) (C12O-PPP)
layer.[75]
White light emission was achieved due to exciplex emission at the interface, when
toluene was used as good solvent for both layers allowing the mixing of the polymers. When
n-hexane was used as solvent, no mixing occurred because PVK is insoluble in n-hexane, thus
resulting in blue fluorescence from C12O-PPP layer only and the PVK acting mainly as a
HTL. Further work on this topic was done by Thompson et al. who compared a wide range of
bilayer devices and also found emission from exciplexes at the interface.[76]
Köhnen et al.
fabricated a device with super yellow[77]
as a yellow fluorescent emitter and polyfluorene as a
blue fluorescent emitter on top.[78]
The yellow layer was cross-linked to the HIL before the
polyfluorene layer was applied. All prepared devices revealed good color stability and distinct
blue and yellow emission without exciplex emissions.
White light-emission from blended polymers as illustrated in Figure 8 c) was realized by
Tasch et al., who used a methyl substituted ladder-type polyparaphenylene (m-LPPP) as a
blue light-emitting polymer blended with orange-red light-emitting poly(perylene-co-
Page 26
17
diethynylbenzene) (PPDB).[79]
An external quantum efficiency (EQE) of 1.2 % was reported
when poly(methylenemethacrylat) (PMMA) was added to the emissive layer in order to
reduce the Förster energy transfer.[80]
Another approach was realized by Hu et al. by using
blue and green light-emitting polymers along with a red light-emitting small molecule dye.[81]
In an optimized device architecture, an external quantum efficiency of 2.6% was reached. An
external quantum efficiency of 6% was achieved by Huang et al. by blending polyfluorene as
a blue emitter with poly[2-methoxy-5-(2′-ethyl-hexyloxy)-1,4-phenylene vinylene] (MEH-
PPV), and optimizing the electronic-energy profile as well as the device architecture with a
hole blocking layer of caesium carbonate.[82]
Finally, white light-emitting polymers can either contain blue and orange, or red, green and
blue chromophores in the backbone or (partly) in the side chain, as outlined in Figure 8 d) for
RGB copolymers. Moreover, either singlet, a mixture of singlet and triplet emitters, or solely
triplet emitters can be used. An example for an all fluorescent conjugated RGB copolymer
was given by Liu et al. in 2005.[83]
They synthesized a copolymer via Suzuki cross-coupling
of 9,9-dioctylfluorene (PF)-based monomers as blue emitter, 4-diphenylamino-1,8-
naphthalimide (DPAN)-based monomers as a green emitter and 4,7-bis(5-(4-(N-phenyl-N-(4-
methylphenyl)amino)phenyl)-thienyl-2-)-2,1,3-benzothiadiazole (TPATBT)-based monomers
as a red emitter. While TPATBT was incorporated in the main chain, DPAN was attached to
the main chain via an alkyl chain. Incomplete energy transfer from the fluorene units to the
TPATBT and DPAN resulted in red, green and blue emission. The fabricated devices revealed
no color dependency on voltage, but the device performance was quite low (0.83 lm/W). Liu
et al. investigated a WPLED using a polyfluorene-based polymer where a blue
dimethylamino-naphthalimide (DMAN) and orange 4-(4-(diphenylamino)phenyl)-7-(4-(N-
phenyl-N-(4-methoxyphenyl)amino)phenyl)-2,1,3-benzothiadiazole fluorescent emitter were
attached via alkyl spacers to the polymer backbone.[84]
The fabricated device reached an
efficiency of 8.5 lm/W. The increase in efficiency was explained by the red shift of the blue
emission of DMAN compared to PF and its higher photoluminescence (PL) quantum
efficiency.
A coverage of the whole visible spectrum from 400 nm to 700 nm was achieved by Liu et al.
in 2007 by attaching blue, red and green fluorescent chromophores to a polyfluorene main
chain.[85]
The fabricated devices revealed good color stability and efficiency as high as 5.4
lm/W. A mixture of fluorescent and phosphorescent chromophores incorporated into the main
chain was reported by Zhen et al. with a polyfluorene being the backbone as well as the blue
fluorescent emitter and benzothiadiazole (BT) as an additional green fluorescent emitter.[86]
Page 27
18
An incorporated iridium complex [iridium(III)bis(2-(2’-benzo[4,5-α]-thienyl)pyridinato-
N,C3’)2,2,6,6-tetramethyl-3,5-heptanedione] ([(btp)2Ir(tmd)]) served as a red triplet emitter.
The devices prepared revealed an external quantum efficiency of up to 3.8% and color stable
white light emissions independent of the bias. Another approach was published by Jiang et
al.[87]
The reported copolymer consisted of a polyflourene backbone in which BT as green
fluorescent emitter units and 3,6-dibromo-9-(iridium(III)bis(2-phenylquinoline-N,C2′))-14-
trifluoro-11,13-tetradecyldiketone)carbazole[88]
as red emitter units being incorporated into
the copolymer main chain via a carbazole moiety were used. The devices revealed acceptable
color stabilities and luminance efficiencies of up to 6.1 cd/A. For deeper insights on other
device concepts of WPLEDs, reference is to be taken to the reviews of Wu[89]
and Reineke.[48]
1.7 Phosphorescent iridium(III) complexes for OLED applications
Iridium(III) complexes are widely used as phosphorescent emitters in OLEDs (see chapter
1.4). Since the pioneering work of Thompson and Forrest,[31]
a wide range of homoleptic
iridium(III) complexes with three identical ligands,[90]
as tris[2-phenylpyridinato-
C2,N]iridium(III) [Ir(PPy)3], on the one hand, and heteroleptic iridium(III) complexes, with at
least one different ligand, on the other hand, have been successfully developed and tested in
OLEDs. Apart from their already discussed property of harvesting singlet and triplet excitons,
their second main advantage is their easy color tuning ability. As figured out by
computational studies of fac-Ir(PPy)3, this is due to the HOMO of the complex being centered
on a iridium(III) d-orbital and the LUMO being localized on the π-orbital of the
cyclometalating ligand.[34, 91]
By adding electron withdrawing groups (EWG) to its phenyl
ring, the HOMO is stabilized resulting in a blue shift of the emission as observed in
[Ir(Fppy)3] compared to [Ir(PPy)3] (Scheme 5). In contrast, adding electron releasing groups
to the phenyl ring results in a red shift of the emission spectrum by destabilizing the HOMO
as observed in tris[1-phenylisoquinoline-C2,N]iridium(III) [Ir(piq)3].
[92] A similar effect of
color shifting of the emission bands can be achieved by exchanging the ancillary ligand in
heteroleptic complexes. Even though the HOMO of the complexes is mostly metal-located
and the LUMO is mainly located on the cyclometalating ligands, resulting in the fact that the
ancillary ligand is not directly involved in the emissive transition, the ligand structure
influences the electron density significantly at the metal center.[93-94]
For example, exchanging
the acetylacetonate (acac) ligand of FIr(acac) with a stronger electron withdrawing ligand e.g.
Page 28
19
picolinate as in Fir(pic), results in a blue shift of the maximum emission wavelength by 20
nm.[95-96]
Scheme 5. Chemical structures and corresponding PL maximum of five selected iridium(III)
complexes.
The synthesis of homoleptic and heteroleptic Ir(III) complexes is usually carried out by
synthesizing a precursor complex of the general formula [Ir(III)(C^N)2-µ-Cl]2.[97]
There,
iridium(III)chloride ∙ x H2O is treated with 2.5 equivalents of the cyclometalating ligand in a
3:1 mixture of 2-ethoxyethanol and water under inert gas. Biscyclometalated iridium(III)
complexes can be obtained via the so called bridge-splitting method by stirring the
iridium(III) precursor complex with the ancillary ligand and a weak base like potassium
carbonate in high boiling point alcohols like 2-ethoxyethanol.[98],[99]
The complexes can be
purified via column chromatography and recrystallization.
Triscyclometalated iridium(III) complexes are usually obtained by utilizing silver triflate as
reagent.[100], [101]
Depending on the reaction temperature, thermodynamically favored facial
complexes or kinetically favored meridional complexes are obtained (Scheme 6). Microwave
assisted synthesis for bis- and triscyclometalated iridium(III) complexes has been reported as
Page 29
20
well, allowing shorter reaction times. However, the yields remain lower than those achieved
using conventional methods.[102],[103]
Scheme 6 . Synthesis route to bis- and triscyclometalating iridium(III) complexes.
Page 30
21
2. Aim and scope
As outlined in chapter 1, polymers as active layers in OLEDs have advantages in device
fabrication regarding costs and simplicity. Following the described design rules, they also
show excellent film forming properties and color stability independent of the applied bias.
The aim of the project was the synthesis and characterization of emissive copolymers in
which iridium complexes are incorporated. Notably, the copolymers had to be suitable for
color tuning in the visible spectrum (RGB) and, ultimately, for white light emission.
Moreover, facile fabrication properties like good solubility and high thermal stability were
crucial requirements.
9,9-dioctyl-9H-fluorene 8 has been used in all copolymers as the main repeating unit of the
copolymer backbone because polyfluorene-type polymers have proven to be appropriate host
materials in OLEDs due to their wide HOMO-LUMO band-gap, high thermal stability,
efficient energy transfer and blue emission.[70, 104-105]
Moreover, the octyl side chains should
enhance the solubility in various organic solvents. In a first series of copolymers, 9H-
fluorene-9-one was incorporated into the backbone as green emitter along with varying
amounts of a red light-emitting phosphorescent iridium(III) complex (Scheme 7).
Scheme 7. Chemical structure of the planned series of copolymers.
Page 31
22
The complex was provided with 2-phenylisoquinoline (piq) as cyclometalating ligands and
thus served as a red emitter. A carbazolyl-functionalized ancillary ligand was used to promote
hole trapping at the emitter site.[106]
The electron rich carbazole moiety should lower the
reduction potential of the neighboring 9,9-dioctylfluorene units in the copolymer chain and
render the material p-conductive.[107]
The electron deficient 9H-fluorene-9-one comonomer
unit should support electron trapping.[108]
Although iridium(III) complexes with 2-
phenylisoquinoline (piq) cyclometalating ligands show slightly lower quantum yields as those
with 2-naphthylpyridine (npy), piq was favored over npy due to its red-shifted emission, thus
allowing a better color tunability for white light emission.[34]
As the iridium(III) complex is
known to be stable under Suzuki-type cross-coupling conditions, while the reaction conditions
of the nickel-mediated Yamamoto protocol appeared to be unsuitable, all copolymers were
prepared via Suzuki-type cross-coupling.
In order to solve the problem of orthogonal solvents needed when preparing subsequent
organic layers from solutions by spin coating or printing, a promising approach by Kanelidis
et al.[109]
was adapted. Microparticle suspensions of the copolymers in water were prepared
and evaluated for inkjet printing by Dr. Anke Teichler at the University of Jena, Germany.
White light-emitting copolymers were prepared (Scheme 8) and subsequently corresponding
single component WPLEDs were fabricated by M.Sc. D. Abbaszadeh at the University of
Groningen, the Netherlands. Notably, enhancement of charge injection is a crucial parameter
of single layer devices. Thus, the copolymers for WPLEDs were further optimized by using
either triarylamine-functionalized fluorene or 2-ethylhexyl-functionalized carbazole
comonomers for incorporation into the copolymer backbone.
Page 32
23
.
Scheme 8. Chemical structures of copolymers PW1-5.
Page 33
24
3. Results and Discussion
3.1 Properties of Ir(piq)2(carbacac)
The monomeric iridium(III) complex [Ir(piq)2(carbacac)] (Scheme 9) that is used as the red
light-emitting building block in all copolymers was previously synthesized by N. Tian.[34, 110]
It reveals high thermal stability of over 350°C and a luminescence QE of 31%. The PL
emission maximum is located at λmax = 624 nm in chloroform solution.
Scheme 9. Chemical structure of iridium(III) complex [Ir(piq)2(carbacac)] as synthesized by
N.Tian.[34],[110],[111]
The structural design of the complex allows hole-trapping at the carbazolyl moiety, thus
enhancing the probability of exciton formation at the emitter site.[106]
Moreover, its 9H-
carbazol substructure is also the base for incorporation of the complex into the copolymers:
9H-carbazol can be easily functionalized in 3- and 6-position due to the mesomeric effect of
the nitrogen atom in 9-position, thus activating the 1, 3, 6 and 8-positions, as depicted in
Scheme 10. As with diphenylamines, the para-positions with respect to the nitrogen are the
most reactive ones, thus allowing the selective functionalization of the 3- and 6-position only.
Furthermore, its amine hydrogen is sufficiently acidic, allowing the introduction of a manifold
of functionalities by nucleophilic substitution.[112]
Page 34
25
Scheme 10. Aromatic resonance structures of 9H-carbazole.
Since conjugation would influence the electron withdrawing effect of the acetylacetonate
ligand, a methylene group was introduced as spacer, thus separating the conjugated backbone
from the ancillary ligand while keeping the distance of the carbazole unit to the iridium(III)
complex as close as possible. Thus, comparable properties of the complex for different
polymer backbones should be consectaneous. Furthermore, the bulky tert-butyl moiety of the
acetylacetonate enhances the solubility of the complex in organic solvents as well as its
thermal and chemical stability.[113]
3.2 Synthesis of comonomers
3.2.1 Synthesis of iodine-functionalized Ir- complex [Ir(piq)2(dicacac)]
Our decision was to incorporate the complex into the polymer backbone via its carbazole
functionality. Obviously, the most efficient route in terms of the synthetic effort would be the
introduction of bromine or iodine moieties in the 3- and 6-position of the carbazole. Due to
the fact that 3,6-dibrominated 9H-carbazoles show reduced reactivity in Suzuki-Miyaura
cross-coupling reactions compared to 2,7-dibrominated fluorenes, iodine was preferred over
bromine as functional group in 9H-carbazol. The synthesis of the iodine-functionalized
ancillary ligand was carried out by following the synthetic concept as depicted in Scheme 11.
While aromatic hydrocarbons usually cannot be iodinated with elementary iodine, many
aromatic heterocycles like 9H-carbazole can be easily iodinated with good regio-selectivity.
In order to iodinate 9H-carbazol to 3,6-diiodo-9H-carbazole 1, a modified method according
to Tucker et al.[114]
was applied which resulted in higher yields compared to microwave-
assisted oxidative halogenation with hydrogen iodide and hydrogen peroxide.[115-116]
Page 35
26
Scheme 11. Synthesis of ancillary ligand 3. a) KI, KIO3, acetic acid, 80°C 45 min; b) K2CO3,
ethyl bromoacetate, DMF, 60°C → rt; c) pinacolone, KHMDS, THF, 0°C → rt, overnight.
Here, potassium iodide and 9H-carbazole were dissolved in boiling acetic acid, and excess
potassium iodate was added in small portions at 80°C. After precipitation with an excess of
water, colorless crystals were obtained which were then purified by either recrystallization
from ethanol or column chromatography to separate from the by-products, esp. 3-iodo-9H-
carbazole. 3,6-diiodo-9H-carbazole 1 was characterized by NMR spectroscopy and GC-MS
measurements.
12 11 10 9 8 7
ppm
a
b
c
d a
b
c
d
Figure 9. 1H-NMR spectrum of 1 recorded in DMSO-d6 at room temperature.
Page 36
27
The 1H-NMR spectrum of 1 (Figure 9), recorded in DMSO-d6, shows the expected resonances
of the three different remaining aromatic hydrogens. These are a singlet with a chemical shift
of δ = 8.57 ppm for the protons in 4 and 5 position and two doublets with a coupling constant
of J = 8.5 Hz at δ = 7.67 and 7.36 ppm for the protons in 1 and 8 as well as 2- and 7-positions.
Moreover, a broadened resonance of the amine proton is visible at δ = 11.54 ppm. In the
13C{
1H}-NMR spectrum the resonances of the carbons in 3 and 6 positions are shifted to
higher field from δ = 120 to 81.8 ppm compared to the educt 9H-carbazole, due to the
combination of mesomeric and inductive effects of the iodine atoms, thus proving the
successful introduction of the iodine. Additionally, the molecule mass peak was found in GC-
MS measurements at a mass-to-charge ratio of m/z = 419.
Ethyl 2-(3,6-diiodo-9H-carbazol-9-yl)acetate 2 was obtained by treating 1 with potassium
carbonate in dry DMF in order to abstract the amine hydrogen. In a nucleophilic substitution,
the product was formed by adding ethyl bromoacetate to the solution.[117]
8 6 4 2 0
e
fdb
c
a
ppm
a
b
c
d
e
f
Figure 10. 1H-NMR spectrum of 2, recorded in CDCl3 at room temperature.
Page 37
28
After complete precipitation with excess water and drying, the product could be afforded in
quantitative yields. Compared to the 1H-NMR spectrum of 1, the hydrogen of the amine
resonance at δ = 11.54 ppm is no longer present (Figure 10). Instead, a triplet at δ = 1.24 ppm
with a coupling constant of J = 7.1 Hz and a quartet at δ = 4.22 ppm with corresponding
coupling constant are found in the spectrum which are attributed to the ethyl moiety. An
additional singlet at δ = 4.94 ppm is assigned to the methylene-bridge. The resonances of the
aromatic region are only slightly shifted due to the introduced acetate.
In the 13
C{1H}-NMR spectrum the resonances of the aromatic region are barely shifted. Four
new signals originate from the ethyl group (δ = 14.11 ppm, δ = 61.93 ppm), the methylene-
bridge (δ = 44.75 ppm) and the quaternary carbon of the ester group (δ = 167.70 ppm). The
molecule mass peak was found at m/z ([M+Na]+) = 527.89.
The last step in the synthetic route towards the ligand is a nucleophilic acylation of pinacolone
with 2. Sterically hindered potassium hexamethyldisilazane (KHMDS) is used as a base in
order to abstract an α-proton from the pinacolone.[34]
Compared to 2, the aromatic region of
the 1H-NMR spectrum of 3 remains unchanged (Figure 11). Also the singlet at δ = 4.94 ppm,
representing the methylene bridge, is found in the same position. The resonances of the ethyl
group have been replaced by a singlet at δ = 1.04 ppm with a relative integral of nine
hydrogens, representing the nine methyl protons of the introduced tert-butyl group.
Additionally, a singlet at δ = 5.34 ppm with a relative intensity of one hydrogen atom can be
attributed to the keto-enol-tautomer, indicating that the equilibrium is on the side of the enol
rather than the diketone. The corresponding alcohol proton resonance is found at
δ = 15.43 ppm as a broad singlet. The 13
C{1H}-NMR spectrum of 3 is dominated by a
resonance at δ = 27.1 ppm which is assigned to the three methyl carbon atoms of the tert-
butyl group. Moreover, at δ = 200.1 and190.2 ppm, resonances of the carbonyl and alcohol
carbons of the keto-enol tautomer are visible. In the recorded mass spectrum, the molecule
peak of 3 was found at m/z [M+Na]+ = 581.94 g/mol.
Page 38
29
8 7 6 5 1.5 1.0 0.5
e
d
ppm
a
b
c
d
e
fa
bc
f
Figure 11. 1H-NMR spectrum of 3, recorded in CDCl3 at room temperature.
1-Phenylisoquinoline 4 as the cyclometalating ligand was synthesized via Suzuki cross-
coupling of 1-chloroisoquinoline and phenylboronic acid with sodium carbonate as base and
tetrakis(triphenlyphsophine)palladium(0) as catalyst (Scheme 12).[34-35, 118]
In accordance with
the literature, the 1H-NMR spectrum consists of four doublets with a relative intensity of one
proton each at δ = 8.65, 8.14, 7.92 and 7.68 ppm as well as two multiplets - one with a
relative intensity of three protons at δ = 7.76 - 7.00 ppm and one with a relative intensity of
four protons between δ = 7.60 and 7.50 ppm.[119]
Doublets at δ = 8.65 and 7.68 ppm can be
assigned to the 3 and 4 position of the isoquinoline moiety, respectively. The five protons of
the phenyl ring can be assigned to multiplet resonances at δ = 7.56 ppm and δ = 7.73 ppm,
respectively. In the 13
C{1H}-NMR spectrum of 4 13 resonances are visible, as expected. The
molecule mass peak was found at m/z [M+] = 205.09
Page 39
30
Scheme 12. Top: Synthesis of 1-phenylisoquinoline 5 and [(piq)2Ir(carbacac)] 7. a) Na2CO3,
Pd(PPh3)4, toluene/water (3:1 v/v), Aliquat® 336, 85°C, 24h. b) IrCl3 ∙ x H2O, 2-
ethoxyethanol/water, 130°C, 24h. c) 3, K2CO3, 2-ethoxyethanol, 2h, 130°C. Bottom: Proposed
structures of the µ-chloro-bridged iridium(III) precursor dimer complex (edge-sharing
bioctahedral) (6) (left) and proposed octahedral structure of the facial [(piq)2Ir(carbacac)]
complex (7) (right)[120]
.
The synthesis of the iridium(III) complex 6 was performed in two steps. First, a µ-chloro-
bridged dimer complex 5 was synthesized following a modified route by Nonoyama.[97]
Here,
iridium(III)chloride hydrate is stirred overnight with 4 in 2-ethoxyethanol at reflux
temperature to obtain a red powder which is filtered off and washed with excess ethanol to
give 5 in 70.5% yield. At room temperature, the product is insoluble in common organic
solvents and water.
(Z)-((1-(3,6-diiodo-9H-carbazol-9-yl)-5,5-dimethyl-4-oxohex-2-en-2-yl)oxy)bis(2-
(isoquinolin-1-yl)phenyl)iridium(III) 6 was synthesized following a slightly modified protocol
developed by Tian et al.[7]
Precursor complex 5 and ligand 3 were stirred with potassium
carbonate in 2-ethoxyethanol at reflux temperature for two hours. After workup and cleaning,
a red powder was obtained in 82.3 % yield which revealed good solubility in common organic
solvents, e.g, chloroform, dichloromethane and acetone.
Page 40
31
9 8 7 6 5 0.7 0.6
d
e
q,q'
p,p'
c
o,o'h,h'
b
k',l'
k,l
a
g,g'
n,n'
mmmm
m
g'
f
p'
q'
o'n'm'
l'k'
j'
h'
qp
o
nm
l
k jh
gd
f
e c b
ppm
a
j,j'
Figure 12. Cuttings of 1H-NMR spectrum of 6. The assignment was done with the assistance of
additional 1H-
1H-COSY-NMR experiments.
The 1H-NMR spectrum of 6 (Figure 12) revealed the expected resonances, which were
assigned with the help of additional 1H-
1H-COSY-NMR experiments. Due to the fact that the
ancillary ligand is asymmetric, the protons of the 1-phenylisoquinoline cyclometalating
ligands are not chemical equivalent. This is apparent in the 1H-NMR spectrum where all
resonances of the cyclometalating ligands are split. The resonances of the ancillary ligand are
not splitted due to the free rotation of the carbazole as well as the tert-butyl group, except for
proton d which is part of the rigid structure. With additional 1H-
13C-HSQC-NMR
experiments, the resonances of the 13
C{1H}-NMR spectrum could successfully assigned. The
measured infra-red (IR) spectrum revealed the bands for the aliphatic carbon-hydrogen
valence vibration at ν = 3040 cm-1
, as well as the expected aromatic carbon-hydrogen valence
vibration at v = 3040 cm-1
. A weak band at v = 1710 cm-1
occurs due to the carbonyl
stretching vibration (Figure 13). In atmospheric pressure laser ionization – mass spectrometry
(APLI-MS) measurements, the molecule mass peak was found at a mass to charge ratio of
m/z = 1159 with the expected isotope pattern (Figure 14).
Page 41
32
4000 3500 3000 2500 2000 1500 1000 500
60
70
80
90
100
tra
ns
mis
sio
n [
%]
wavenumber [cm-1
]
Figure 13. IR (ATR) spectrum of 6.
1156 1158 1160 1162 1164
[m/z]
Figure 14. Normalized relevant section of the measured (solid line) and simulated (dashed line)
high-resolution mass spectra of 6.
Page 42
33
UV/Vis absorption and emission spectra were recorded in chloroform solution and are
depicted in Figure 15.
300 400 500 600 700 800 9000.0
0.2
0.4
0.6
0.8
1.0
0.0
0.2
0.4
0.6
0.8
1.0
No
rma
lized
em
iss
ion
[a.u
.]
No
rma
lzed
ab
so
rpti
on
[a.u
.]
Normalized absorption
Normalized emission
Wavelength [nm]
Figure 15. Normalized absorption and emission spectra of 6 in chloroform solution (exc. 480 nm,
10-5
M).
The absorption spectrum is dominated by several strong bands between λ= 250 - 300 nm
which can be attributed to spin-allowed π π* transitions of the cyclometalating ligands
(inter-ligand, IL). Shoulders between λ = 300 - 500 nm are mainly attributed to 1LC (ligand
centered) and 1MLCT (metal to ligand charge transfer) transitions.
[121] The tail in the region of
λ = 500 - 600 nm can most likely be assigned to 3MLCT and
3LC transitions.
[122] As
mentioned in the introduction, the cyclometalating piq-ligands own a strong contribution to
the emission color of the iridium(III) complex, while the contribution of the ancillary ligand 3
is only low. Therefore, the emission spectrum consists of only one band which is assigned to
the transition from the lowest lying triplet state to the ground state and is found at λmax = 622
nm.
Page 43
34
3.2.3 Synthesis of fluorene-based monomers
Two fluorene-based monomers were also synthesized (Scheme 13). 4,4'-(2,7-dibromo-9H-
fluorene-9,9-diyl)bis(N,N-diphenylaniline) 7 was synthesized to promote hole-injection in the
prepared single-layer OLEDs by increasing the HOMO level of the polymer (HOMOPF ~ -
5.8 eV; HOMOPF-Arylamine ~ -5.2 eV – 5.5 eV). Other benefits are the low ionization potential,
tridimensional steric and good UV-light harvesting properties.[123-125]
The synthesis was
carried out by treating 2,7-dibromo-9H-fluoren-9-one with N,N-diphenylbenzeneamine and
methanesulfonic acid as catalyst above the melting point of N,N-diphenylbenzeneamine.[126-
127]
Scheme 13. Synthesis of fluorene-based monomers 7 and 8. a) N,N-diphenylbenzeneamine,
methansulfonic acid, 140°C, 6h, yield 90 %. b) 1-bromooctane, phase transfer catalyst, sodium
hydroxide (aq), 60°C, 15h, yield 86%.
2,7-dibromo-9,9-dioctyl-9H-fluorene 8 was used as repeat unit of the polymer backbone in all
copoloymers for two main reasons: polyfluorenes show efficient electroluminescence and
high charge carrier mobility.[128-129]
Moreover, especially alkyl-functionalized polyfluorenes
reveal good solubility in common organic solvents and are therefore easily processable from
their solutions.[130]
Fluorenes as well as polyfluorenes not functionalized in the 9-position tend
to degrade by autoxidation under fluorene-9-one formation. As a consequence, the PL and EL
emissions of fluorene-based materials have a tendency to show red-shifted emission bands in
the region of 520 - 560 nm due to the keto defects. Efficient energy transfer to these defects
Page 44
35
results in blue-green or even green emission.[131]
To avoid degradation, the introduction of
alkyl moieties in 9-position is an efficient and facile option.
In thin films, poly(9,9-dioctylfluorenes) show a unique packing behavior apart from the
amorphous glassy phase, the so called β-phase, in which stacking of the polymers chains leads
to areas of higher organization.[132]
8 was prepared from 2,7-dibromo-9H-fluorene by stirring with aq. sodium hydroxide and 1-
bromooctane in the presence of tetrabutylammonium bromide (TBABr) as phase-transfer
catalyst.[133]
While in the introduction the abbreviation ‘PF’ was used to describe
polyfluorene, from now on PF means poly(9,9-dioctylfluornene)
Both monomers 7 and 8 were characterized by 1H-NMR,
13C{
1H}-NMR and LC-MS
measurements. The data received correspond to common sources of literature.[126, 134]
3.2.4 Synthesis of a 9H-carbazole-based monomer
In addition to compound 7, 3,6-dibromo-9-(2-ethylhexyl)-9H-carbazole 9 was synthesized as
a comonomer in order to test its adequacy as hole injection-promoting material in single-layer
WOLEDs (Scheme 14).
Scheme 14. Synthesis of 3,6-dibromo-9-(2-ethylhexyl)-9H-carbazole. a) sodium hydride, THF, 3-
(bromomethyl)heptan, rt, 99%.
9 has been used in previous studies about copolymer-based hole injection/transport and
revealed good results when applied in OLEDs.[135-136]
It was synthesized in a SN2 type
reaction by treating 3,6-dibromo-9H-carbazole with sodium hydride as base in THF and
subsequently adding 3-(bromomethyl)heptan. After work-up and purification, 9 was received
Page 45
36
as a colorless oil in 99% yield. It was characterized by NMR spectroscopy and mass-
spectrometry.
3.3 Synthesis of orange light-emitting complexes [(F-bt)2Ir(carbacac)]
In 2011, Wang et al. reported an orange light-emitting iridium(III) complex with a fluoro-
functionalized benzothiadiazole ligand which was used as an emitter in monochromatic
OLEDs (Scheme 15).[137]
Scheme 15. Chemical structure of the orange light-emitting iridium(III) complex as reported by
Wang et al.[137]
Devices with the following structure were presented: ITO/PEDOT:PSS (40 nm)/Ir:CBP (5
wt%, 30 nm)/TPBI(45 nm)/LiF (1 nm)/Al, with ‘Ir’ being the iridium complex and CBP being
4,4’-bis(carbazol-9-yl)biphenyl.
The OLEDs exhibited the highest efficiencies reported to date at that time with 71.6 cd ∙ A-1
and efficacy of 44.9 lm ∙ W-1
at a voltage of 5V. Additionally, two-element WOLEDs were
fabricated via an additional blue-emitting Firpic:CBP layer. In an optimized WOLED-
structure of ITO/PEDOT:PSS (40 nm)/Ir:CBP (1 wt%, 10 nm)/Firpic:CBP (10 wt%, 20
nm)/TPBI (45 nm)/LiF (1 nm)/Al, an efficiency 68.6 cd ∙ A-1
and efficacy of 34.0 lm ∙ W-1
at
6V were achieved.
This encouraged us to substitute the ancillary acetylacetonate ligand of [(F-bt)2Ir(acac)] with
our carbazole-functionalized acetylacetonate ligand 3 in order to investigate the photophysical
properties of the nre complex as well as its suitability as dye in OLEDs. The synthesis route is
outlined in Scheme 16.
Page 46
37
Scheme 16. Synthetic route to the orange light-emitting complex 15. a) PCL3, toluene, reflux, 6h.
b) Lawesson’s reagent, toluene, reflux, 15h. c) K3Fe(CN)6, NaOH, water, reflux, 3h. d) IrCl3 ∙ x
H2O, 2-ethoxyethanol, water, reflux, 12h. e) (3), 2-ethoxyethanol, Na2CO3, reflux, 2h.
The synthesis of the fluoro-functionalized benzothiadiazole ligand (F-bt) was carried out
following the synthesis route by Wang[137]
and Singh[138]
. First, N-(4-fluorophenyl)benzamide
10 was synthesized by treating 4-fluoroaniline and benzoic acid with phosphorus trichloride
in boiling toluene. The colorless solid was isolated in yields of 62% and was characterized by
1H-NMR,
13C{
1H}-NMR and LC-MS measurements. Additional
1H-
1H-COSY-NMR as well
as 1H-
13C-HSQC-NMR experiments were performed in order to assign all resonances. The
1H-NMR spectrum reveals the expected doublet (δ = 7.89 ppm) and triplet (δ = 7.52 ppm,
δ = 7.59 ppm) resonances for the non-substituted phenyl ring. The fluoro substituent leads to
multiplet resonances of the protons in 3- and 5-position of the fluorophenyl ring
(δ = 7.63 ppm, δ = 7.10 ppm). Finally, the resonance of the amine proton shows a broad
singlet δ = 7.82 ppm. In the 13
C{1H}-NMR spectrum, the quaternary carbon bond to the
fluoro atom appears as a doublet at δ = 159.6 ppm with J = 244.1 Hz . Additional doublets of
Page 47
38
the carbon atoms of the fluoro substituted phenyl ring show signals at δ = 122.1 ppm (J = 7.9
Hz) and δ = 115.8 ppm (J = 22.7 Hz) due to 5J and
4J coupling, respectively. Furthermore, the
carbonyl carbon resonance appears at δ = 165.7 ppm. In the mass spectrum, the expected
molecule peak [M+H]+ was found at m/z = 216.07.
The synthesis of N-(4-fluorophenyl)benzothioamide 11 was carried out by treating 10 with a
small excess of the sulfonation reagent “Lawsesson’s Reagent” in dry toluene at reflux
overnight. After work-up and purification, the colorless material was obtained in 82% yield.
In the 1H-NMR spectrum no noteworthy shifts of the aromatic hydrogen atoms occur; the
amine proton resonance appeared at δ = 9.01 ppm. The 13
C{1H}-NMR spectra recorded
showed similar chemical shifts for the aromatic carbon atoms compared to compound 10.
Most significantly, the new resonance at δ = 198.9 ppm for the thioketone and the missing
resonance around δ = 165 ppm for the carbon of the carbonyl group both proved successful
conversion. The LC-MS mass spectrum revealed the molecule mass peak [M+H]+ at m/z =
232.1.
Finally, 6-fluoro-2-phenylbenzo[d]thiazole 12 was synthesized via an oxidative ring closure
by treating N-(4-fluorophenyl)benzothioamide 11 with an aqueous solution of potassium
ferricyanid(III) in the presence of sodium hydroxide.[139]
The product was purified by
recrystallization from methanol and was obtained in 94 % yield.
Compared to 11, the 1H-NMR spectrum shows just slight differences regarding the non-
substituted phenyl ring. A multiplet at δ = 8.11 - δ = 8.07 ppm for the hydrogens in ortho-
position and an overlapped multiplet for the m- and p-hydrogens at δ = 7.52 ppm became
evident. For the fluoro-substituted benzene ring, three resonances at δ = 8.04 ppm (dd),
δ = 7.60 ppm (dd) and δ = 7.25 ppm (td) were found, indicating the successful ring closure.
As expected, the resonance for the amine proton can no longer be found. In the 13
C{1H}-
NMR spectrum, most significantly, the sulfur double-bonded carbon resonance at δ = 198.9
ppm is not present anymore and instead a new resonance at δ = 167.7 ppm is visible for the
sulfide carbon. The 13
C-DEPT-NMR now shows six quaternary carbons instead of five for 11.
Moreover, the ligand’s mass peak was found at m/z [M+H]+ = 230.1
Page 48
39
Scheme 17. Synthesis of ancillary ligand 2b. a) K2CO3, ethyl bromoacetate, DMF, 60°C → rt,; b)
pinacolone, THF, KHMDS, 0°C → rt, overnight.
In order to build up complex 14, ligand (Z)-6-(9H-carbazol-9-yl)-5-hydroxy-2,2-dimethylhex-
4-en-3-one 2b had to be synthesized (Scheme 17). The synthesis was executed based on that
of ligand 3 (Scheme 11). Hereby, 9H-carbazole was used as starting material and an
ethylacetate moiety was introduced in 9-position to yield ethyl 2-(9H-carbazol-9-yl)acetate
1b. In the second step, a claisen-type condensation of pinacolone and 1b yielded (Z)-6-(9H-
carbazol-9-yl)-5-hydroxy-2,2-dimethylhex-4-en-3-one 2b in 67%.
In the aromatic region of the 1H-NMR spectrum of 2b, four resonances with relative
intensities of two protons each at δ = 8.15 (d), 7.50 (t), 7.37 (d) and 7.32 (m) represent the
hydrogens of the aromatic 9H-carbazol moiety. A new singlet at δ = 15.54 ppm is assigned to
the alcoholic proton of the acetylacetate’s enol tautomer. Moreover, a singlet at δ = 5.36 ppm
is caused by the proton of the methin bridge of the keto-enol tautomer. The relative intensity
of both hydrogen resonances is close to one (0.95 and 0.97), which indicates that the
equilibrium of the keto-enol-tautomerism is almost completely on the enol side. Finally, the
three methyl groups of the tert-butyl group appear as a singlet at δ = 1.00 ppm with an
intensity of 9 protons in accordance to the literature[7, 111]
Subsequently, complex 14 was prepared in the same two-step synthesis route as for complex
6. µ-Chloro-bridged precursor complex 13 was obtained by stirring iridium(III) chloride
hydrate and ligand 12 in 2-ethoxyethanol and water at reflux temperature for 12 hours. The
raw product was washed with excess ethanol before drying. As 5, 13 appeared to be insoluble
Page 49
40
in common organic solvents at room temperature. Subsequently, 13 was treated with sodium
carbonate and 2b in 2-ethoxyethanol as solvent at 130°C for two hours to yield 14 in 67%.
The 1H-NMR spectrum of complex 14 is shown in Figure 16. The proton resonances of the F-
bt ligands are split due to the asymmetry of the complex. While proton m of the ancillary
ligand is part of the rigid system, and thus, appears as a split resonance, proton n and protons
h-k are allowed to rotate free and therefore the 1H-NMR spectrum shows unsplit resonances.
8.5 8.0 7.5 7.0 6.5 6.0 5.5 5.0 0.5 0.0
ppm
a b
c
de
f
hi
a
gc
j
k
b
l
m
n
b
d e
fg
h
ijk
l
m
n
Figure 16. 1H-NMR spectrum of complex 14, recorded in CDCl3 at room temperature.
Assignments of the resonances were conducted with the assistance of additional 1H-
1H-COSY-
NMR measurements.
The UV-Vis absorption spectrum of complex 14 in chloroform solution is presented in Figure
17. According to DFT calculations, the local maximum at λ = 327 nm can be assigned to
ligand-centered (LC) π π* transitions of the cyclometalating ligands.[55]
Additional
shoulders appear at λ = 405, 445 and 485 nm. The band at λ = 405 nm is originating from
spin-allowed transitions from the ground state to singlet metal-to-ligand charge transfer
(1MLCT) states, while the other bands λ > 445 nm are due to spin-forbidden transitions from
the ground state to triplet metal-to-ligand charge transfer (3MLCT) states. The emission band
reveals a maximum at λmax = 560 nm and a shoulder at λ = 595 nm. The quantum yield of
Page 50
41
Φ = 29% was determined according to the method of Demas and Crosby.[140]
Table 1
summarizes the photophysical properties in chloroform solution.
300 400 500 600 7000.0
0.2
0.4
0.6
0.8
1.0
0.0
0.2
0.4
0.6
0.8
1.0
No
rmalize
d e
mis
sio
n [
a.u
.]
No
rmalize
d a
bso
rpto
n [
a.u
.]
Wavelength [nm]
Figure 17. Normalized absorption and emission spectra of complex 14 in chloroform solution
(room temperature, 10-5
M, dashed line) and in the solid state (room temperature, spin-casted
from 5 mg ∙ L-1
chloroform solution, solid line). Excitation wavelength: λ = 460 nm.
In the solid state, an absorption maximum was found at λmax = 330 nm, again assigned to π
π* transitions of the cyclometalating ligands. The photoluminescence spectrum shows a
maximum at λmax = 568 nm with a shoulder at λ = 598 nm.
Moreover, APLI-MS measurements were performed. Figure 18 presents the measured
isotopic pattern of complex 14 as well as a corresponding simulation.
Table 1. Optical properties of complex 14 recorded in chloroform solution (10-5
M).
Absorbance
[nm] (log ε, [L ∙ mol-1
∙ cm-1
])
Maximum Emission λ
[nm]
Quantum yield Θ
[%]
264 (4.79), 294 (4.74), 328
(4.63), 400 (3.94), 445 (3.94),
488 (3.82)
558 29
Page 51
42
952 953 954 955 956 957 958 959
measured
simulated
m/z
Figure 18. Normalized relevant section of the measured (solid line) and simulated (dashed line)
high-resolution mass spectra of 14.
3.4 Synthesis and characterization of statistical copolymers for OLED applications
As already stated in the introduction, the need of orthogonal solvents in the fabrication of
OLEDs by spin coating and printing is one of the most challenging problems. Vacuum
deposition of organic materials is commonly used to circumvent this problem. However, this
technique has some requirements regarding the material. For example, it must be stable at
elevated temperatures. It also has to be evaporable, which consequently limits this technique
to small molecules. Hence, high molecular weight polymers are precluded from vacuum
deposition. The third method of circumventing orthogonal solvents is cross-linking the layers
to each other and therefore rendering them insoluble. Then again, this technique also has
some disadvantages, such as additional synthetic effort in preparation of cross-linkable
materials. Hence, there is a demand for a technique that allows the forming of thin films of
organic compounds and polymers from polar solvents. Water-soluble copolymers have
already been evaluated and OLEDs were prepared from ionic polymers.[141]
In this chapter,
the synthesis and characterization of a series of copolymers is described. Subsequently, a
Page 52
43
concept of printing thin films of the copolymers from aqueous micro-particle suspensions is
presented which allows printing of non-polar copolymers from water. Finally, the results of
preliminary attempts of printing the copolymers from their solutions is presented as well as
results from their application in OLEDs.
3.4.1 Synthesis of statistical RGB copolymers for application in OLEDs
A series of copolymers P1-8 were prepared via Suzuki cross-coupling condensation with
different ratios of the monomers. This protocol was used due to the stability of the iridium(III)
complex under these conditions in contrast to the conditions of the Yamamoto protocol in
which the complex decomposes.
The copolymer backbone mainly consists of 9,9-dioctylfluorene units. Fluorene-9-one was
used as green fluorescent emitter and the above described iridium(III) complex 6 was
incorporated as red phosphorescent emitter. Depending on the feed-ratio of the emitter
molecules in respect to the fluorescent blue polyfluorene backbone and taking the energy
transfer into account, the synthesis of copolymers with distinctive emission colors from red to
blue is possible. The copolymers were end-capped with bromobenzene and phenylboronic
acid. Scheme 18 depicts the monomers used in the synthesis and the structure of the statistical
copolymers. In this first series, no further charge injection enhancing components were added.
2,7-dibromo-9H-fluorene-9-one and 9,9-dioctyl-9H-fluorene-2,7-diboronic acid bis(1,3-
propanediol) ester were bought from commercial sources. After purification by precipitation
and Soxhlet-extraction with acetone, the phosphorescent metallo-copolymers were received
with number average molar masses (Mn) ranging from 4000 to 17300 g ∙ mol-1
with
polydispersity indices of 1.7 to 2.3. The copolymers reveal high thermal stability of at least
354 °C (at 5% weight loss). The molecular weight appears to be mainly determined by the
feed-ratio of the iridium(III) complex monomer. P5 and P6 (no iridium(III) complex) possess
the highest molecular weights, while P1, P7 and P8 (feed-ratio of 5 mol% iridium(III)
complex) reveal molecular weights (Mw) below 10000 g ∙ mol-1
. The monomer feed-ratios,
copolymer composition and GPC results are summarized in Table 2.
Page 53
44
Scheme 18. Synthesis of the first copolymer series containing phosphorescent iridium(III)
complex 6.
Page 54
45
Table 2. Monomer feed-ratio, GPC results and PLQE of metallo-copolymers (P1-8). The
copolymer composition, estimated by 1H-NMR measurements, is given in parentheses.
Entry Fluorene
[mol%]
Fluoren-9-one
[mol%]
Ir(III) complex
[mol%]
Mn
[g∙mol-1
]
Mw
[g∙mol-1
]
PDI PLEQ#
[%]
P1 90 (90.6) 5 (6.1) 5 (3.3) 4100 9300 2.3 n.m.
P2 92 (93.3) 5 (5.6) 3 (1.1) 10600 17900 1.7 n.m.
P3 93 (94.4) 5 (5.0) 2 (0.6) 9200 15900 1.7 n.m.
P4 94 (94.4) 5 (5.3) 1 (0.3) 9100 19200 2.1 25.0
P5 95 (94.7) 5 (5.3) 0 (0.0) 14600 29200 2.0 21.4
P6 98 (97.7) 2 (2.3) 0 (0.0) 17300 33700 1.9 n.m.
P7 93 (93.4) 2 (3.3) 5 (3.3) 4000 8000 2.0 n.m.
P8 95 (97.1) 0 (0.0) 5 (2.9) 4300 8800 2.0 25.9 #
measured in chloroform solution at room temperature. n.m.: not measured.
The copolymers P1-8 reveal glass transition temperatures (Tg) ranging from 65.4 °C to
87.5 °C. The decomposition temperature (Td) at 5% weight loss was found at around 400°C
(Table 3).
Table 3. Glass transition temperatures (Tg) and decomposition temperatures (Td) of copolymers
P1-8.
Entry Tg
[°C]
Td (5% weight loss)
[°C]
P1 87.5 354
P2 72.8 391
P3 68.9 416
P4 79.8 416
P5 73.5 415
P6 66.2 419
P7 68.9 395
P8 65.4 397 Tg of pristine poly(9,9-dioctylfluorene) is usually in the range of 70°C – 80°C.
[142]
1H-NMR spectra were recorded for all copolymers P1-8. Figure 19 shows an overlay of the
1H-NMR spectra of P1 and of the iridium(III) complex-monomer 6. Several common
resonances can be found in both spectra, e.g., at δ = 9.0, 5.2, 4.6 and 0.7 ppm, these showing
the successful incorporation of monomer 6 into the copolymer chain.
The fluorene-9-one resonances are mostly overlaid by the resonances of the dioctylfluorene
units, but one resonance at 8.1 ppm can be distinguished from the others. To calculate the
copolymers composition, the areas under the resonances at 9.0 ppm (Ir(III) complex) and 8.1
ppm (fluorene-9-one) were compared to those of the two α-methylene groups of the
Page 55
46
ppm
9 8 7 6 5 3 2 1 0
Figure 19. Overlay of 1H-NMR spectra of monomer 7 (black line) and copolymer P1 (red line).
Both spectra were recorded in CDCl3 at room temperature. The intensity of the spectrum of P1
is magnified for clarity.
fluorene’s octyl chains. The results are summarized in Table 2. While the content of fluorene-
9-one units found in the copolymers varies only slightly with the different feed-ratios, the
amount of incorporated Ir(III) complex units is lower than expected, which can be attributed
to the reduced coupling reactivity of 3,6-halogenated 9H-carbazoles (see 3.2.1).
Photoluminescence quantum efficiencies (PLQE) in chloroform solution were determined for
P4, P5 and P8 as examples for copolymers containing only fluoren-9-one (P5), only Ir(III)
complex (P8) or both guest units (P4) (Table 2).
UV/Vis absorption and emission spectra were recorded in solution as well as the solid state.
The thin films were prepared on quartz-glass substrates from 7 mg ∙ ml-1
solutions in
toluene/ortho-dichlorbenzene (ODCB) (80/20 v/v) on a spin coater at 1500 rpm for
60 seconds. The solution spectra of the copolymers were measured in toluene/ODCB
(80/20 v/v) at a concentration of c = 10-5
M. The absorption spectra in solution (Figure 20) are
Page 56
47
dominated by one broad absorption band for each copolymer at max = 371 - 386 nm which
can be assigned to π π* transitions of the polyfluorene backbone.
350 400 450 500 550 600 6500.0
0.2
0.4
0.6
0.8
1.0
0.0
0.2
0.4
0.6
0.8
1.0
No
rmalize
d e
mis
sio
n [
a.u
.]
No
rmalize
d a
bso
rpti
on
[a.u
.]
Wavelength [nm]
P1
P2
P3
P4
P5
P6
P7
P8
Figure 20. Normalized absorption and emission spectra of copolymers P1-8, recorded in
toluene/ODCB (80/20 v/v) at concentration of 10-5
M. Excitation wavelength: 350 nm.
Comparing the feed-ratios of the iridium(III) complex comonomer with the maximum
absorption wavelength shows that increasing the feed-ratio of the iridium(III) complex
monomer shifts the maximum absorption wavelength to higher energy: the complex units
partially break the conjugation of the polyfluorene backbone, raising its π π* transition
energy.
Consequently, the feed-ratio of the fluoren-9-one comonomer does not have a visible
influence on the absorption maximum of the copolymers.
In the normalized emission spectra, two dominant transitions at λ = 415 and a shoulder at
440 nm appear. The former is typical for fluorene-based (co)polymers and originates from S0
S1 transitions in accordance with Kasha’s rule. The latter as well as the small shoulder at
λ = 470 nm are side bands.[143-144]
All copolymers contain fluoren-9-one units except for P8. It
is well known for PF-based copolymers with fluoren-9-one on-chain units that Förster energy
Page 57
48
transfer occurs from the polyfluorene to the fluoren-9-one units resulting in an emission band
at around 550 nm.[145]
350 400 450 500 550 600 6500.0
0.2
0.4
0.6
0.8
1.0
0.0
0.2
0.4
0.6
0.8
1.0 P1
P2
P3
P4
P5
P6
P7
P8
No
rma
lize
d e
mis
sio
n [
a.u
.]
No
rma
lize
d a
bs
orp
tio
n [
a.u
.]
Wavelength [nm]
Figure 21. Normalized absorption and emission spectra of copolymers P1-8 recorded in solid
state. Excitation wavelength: 350 nm.
In solid state (Figure 21), the absorption spectra of copolymers P1-8 remain similar to those
of the solutions. The absorption maxima are slightly bathochromically shifted. Small
shoulders appear at λ = 430 nm, indicating a β-phase formation.[146]
In the emission spectra, efficient Förster energy transfer from the polyfluorene backbone to
the two different guest moieties results in a decreased emission from the host. Depending on
the amount of fluoren-9-one and triplet emitter in the backbone, the two emission bands of the
polyfluorene at λ = 430 and 460 nm appear in different intensities. P8, for instance,
synthesized with a feed-ratio of 5 mol% iridium(III) complex and no fluoren-9-one,
incomplete energy transfer results. Thus, emission in the blue region of the spectrum still
appears. In case of P5, synthesized with a feed-ratio of 5 mol% of fluoren-9-one and no
iridium(III) complex, the energy transfer is almost complete, resulting in almost no blue
emission around λ = 450 nm. The energy transfer to the fluoren-9-one appears to be more
efficient than to the iridium(III) complex. A reason for this may be that the fluoren-9-one is
Page 58
49
incorporated directly into the chain, minimizing the distance to excited states on the
polyfluorene blocks, while the iridium(III) complex is situated in the periphery of the
chain.[36]
P1-5 were synthesized with a feed-ratio of 5 mol% fluoren-9-one and decreasing
feed-ratios of iridium(III) complex of 5 mol% (P1), 3 mol% (P2), 2 mol% (P3), 1 mol% (P4)
and 0 mol% (P5), respectively. In the case of P5, as mentioned above, the energy transfer to
the guest is almost complete, resulting in greenish emission at λ = 550 nm. By increasing the
feed-ratio of the iridium(III) complex, the red phosphorescence at λ = 620 nm arises. While in
case of P4 the green emission is still dominant, at a feed-ratio of 2 mol% in case of P3 the
phosphorescence at λ = 620 nm is dominant. For P1, the greenish emission is almost
completely vanished in favor of the phosphorescence. An additional energy transfer from the
fluoren-9-one to the iridium(III) complex may take place due to the spectral overlap of the
emission band of the fluoren-9-one with the 1MLCT and
3MLCT absorption bands of the
iridium(III) complex. P1, P7 and P8 were synthesized with a constant feed-ratio of 5 mol%
for the triplet emitter and 5 mol%, 2 mol% and 0 mol% of fluoren-9-one, respectively. The
blue emission bands are reduced with increasing feed-ratio of fluoren-9-one relative to the
emission of the triplet emitter. For P1, almost no emission was measured, indicating a
complete energy transfer to the guest units. For P7, weak emission bands appear in the blue
region. The greenish emission is approximately equal to the emission of P1 relative to the red
phosphorescence of the triplet emitter, indicating a saturation of the fluoren-9-one emission
already at a feed-ratio of 2 mol%.
In conclusion, eight statistical copolymers based on a polyfluorene backbone were
synthesized. Varying feed-ratios of fluoren-9-one and iridium(III) complex led to copolymers
that exhibit tunable photoluminescence from green to red. The energy transfer from the host
to the fluorene-9-one guest in copoylmers without Ir(III) complex is already saturated at feed-
ratios of 2 mol%. The results were used to estimate the monomer feed-ratios for the design of
white light-emitting copolymers for OLED applications (see chapter 3.4.5).
3.4.2 Microparticle suspensions of copoylmer P8
Solution processing of polymer-based materials during multilayer OLEDs fabrication requires
the need of orthogonal solvents. Thus, the consecutive materials need to be soluble in
contrarily polar solvents. This presupposes the utilization of polar materials which can be
made by the introduction of polar side-groups like polyglycol groups or even ionic moieties,
Page 59
50
both resulting in higher synthetic efforts. In order to solve the problem of the need of
orthogonal solvents in the fabrication of polymer-OLEDs (PLEDs), an aqueous solution of a
non-polar organic copolymer would be needed. The preparation of a microparticle-based
suspension of a non-polar polymer may be a promising and sufficient alternative to
circumvent this problem.
The preparation of the microparticle
suspensions was performed by
following a slightly modified method of
Kanelidis.[109]
First, the copolymer was
diluted in THF which is miscible with
water. 1 ml of the THF solution was
drawn up into a syringe and was quickly
injected through a micro porous filter
into a round bottom flask filled with
water under ultra-sonication. In this
process, the copolymer chains collapse
immediately and form particles.
Without ultra-sonication, the copolymer
precipitates due to aggregation. The suspension was left in the ultra-sonic bath for another two
minutes. Subsequently, the THF was removed in vacuum. The result is a suspension of the
copolymer with no visible particles, in contrast to the experiments without ultra-sonication,
with streaks and visible particles. A maximum concentration of 50 mg ∙ L-1
was possible.
Experiments with higher concentration led to precipitation and the formation of streaks. The
suspensions are stable at least for several days, although the emission spectra reveal reduced
phosphorescence from the iridium(III) complex emitter over time, presumably due to
absorption of THF residues. The suspensions obtained were investigated by UV/Vis
spectroscopy and the results are presented in Figure 23. While the THF solution does not emit
a visible red phosphorescence under UV light, the aqueous suspension appears red under UV
irradiation, indicating an efficient energy transfer from the copolymer backbone to the
iridium(III) emitter. Thus, the PL maximum is found at λ = 620 nm, originating from the
iridium(III) complex, and shoulders at λ = 436 and 464 nm originating from the backbone,
respectively.
Figure 22. Aqueous suspension of P8 (left) and
corresponding solution in THF (right) under
UV irradiation.
Page 60
51
300 400 500 600 7000.0
0.2
0.4
0.6
0.8
1.0
0.0
0.2
0.4
0.6
0.8
1.0
No
rma
lize
d e
mis
sio
n [
a.u
.]
No
rma
lize
d a
bs
orp
tio
n [
a.u
.]
Wavelength [nm]
P8 8 mg· L-1
P8 12 mg· L-1
P8 16 mg· L-1
P8 8 mg· L-1
P8 12 mg· L-1
P8 16 mg· L-1
Figure 23. Normalized UV/Vis absorption (solid) and emission (dashed) spectra of aqueous
copolymer suspensions of P8 at concentrations of 8, 12 and 16 mg ∙ L-1
.
The UV/Vis absorption spectra of the aqueous suspensions of P8 at concentrations of 8, 12,
and 16 mg ∙ L-1
revealed a maximum absorbance at 376 nm. Compared to the measurements
in solid state, the absorption band is blue-shifted by 6 nm. Compared to those of the
toluene/ODCB (80/20 v/v) solutions, no change in in the maximum absorption wavelength
can be observed. The spectra reveal shoulders at λ = 430 nm which are typical for the β-phase
that usually occurs in the solid state, e.g., thin films, and reveal the solid state character of the
microparticles. In preliminary attempts, Dr. Anke Teichler of the group of Prof. Dr. U. S.
Schubert at the University of Jena, Germany, was able to inkjet print the aqueous suspension
on glass substrates, but printing on organic layers remains difficult due to dewetting.
Page 61
52
3.4.3 Printing results of copolymers P1-8
For the fabrication of multilayer devices, e.g., for OLEDs, organic thin film transistors
(OFETs) or organic solar cell applications, (co)polymers cannot be processed by vacuum
deposition techniques due to their high molecular weights (see chapter 1.2). While spin
coating is just suitable for small area devices, the fabrication of large area devices with
controllable layer thickness is mostly conducted by inkjet printing techniques.[147]
The copolymers P1-8 described in the last preceding paragraphs were investigated for their
suitability for inkjet printing. All measurements in this chapter were performed by Dr. Anke
Teichler of the group of Prof. Dr. U. S. Schubert at the University of Jena, Germany. The
printing was performed on 6 mm × 6 mm glass substrates at room temperature from
toluene/o-DCB (80/20 v/v) solution (7 mg/mL). The printing was performed on an Autodrop
professional system from microdrop technologies (Norderstedt, Germany) equipped with
piezo-based micropipettes with an inner nozzle diameter of 70 µm.
Table 3. Varied Inkjet Printing Parameters of the printed Films of P1-8.
Copolymer
Dot
spacing
[µm]
Substrate
temperature
[°C]
Film
thickness
[nm]
Surfaces
roughness
[nm]
P1 225 35°C 60 10
P2 215 RT 45 8
P3 240 RT 35 9
P4 140 RT 180 28
P5 180 RT 110 35
P6 205 RT 70 9
P7 220 RT 55 12
P8 220 RT 60 11
The resulting films revealed low surface roughness of 8 to 35 nm. Table 3 summarizes the
printing parameters and results.
Figure 24 shows the normalized absorption and emission spectra of the printed thin films.
Compared to the photophysical results of the spin-coated films, the absorption spectra of the
copolymers P1-P8 from inkjet printing reveal reduced shoulders at λ = 435 nm that are
supposed to originate from β-phase aggregation. It is also significant that emission at
Page 62
53
350 400 450 500 550 600 6500.0
0.2
0.4
0.6
0.8
1.0
0.0
0.2
0.4
0.6
0.8
1.0 P1
P2
P3
P4
P5
P6
P7
P8
No
rma
lize
d e
mis
sio
n [
a.u
.]
Wavelength [nm]
No
rma
lize
d a
bs
orp
tio
n [
a.u
.]
Figure 24. Normalized absorption and emission spectra of metallo-copolymers 1-8 inkjet printed
on glass substrate from toluene/o-DCB (80/20 v/v) solution (7 mg/mL).
λ = 550 nm is slightly increased relative to the red phosphorescence from the iridium(III)
complex in copolymers P1 and P2.
Optical profiler images of printed copolymers P5 and P6 are presented in Figure 25, revealing
the low roughness of the printed films.
Figure 25. Optical profiler images of inkjet printed polymers P5 (left) and P6 (right). Film
size: 6 by 6 mm2.
Page 63
54
3.4.4 P1-8 and their application in OLEDs
Copolymers P1-8 were designed to be used as active materials in OLEDs. In order to
investigate their properties in OLEDs, samples of the copolymers were sent to the group of
Prof. P. Blom, University of Groningen, Netherlands. All measurements presented within this
chapter were done by M. Sc. D. Abbazadeh.
For all copolymers P1-8, OLEDs of the device structure glass\ITO\PEDOT:PSS
(60 nm)\copolymer\Ba (5 nm)\Al(100 nm) were fabricated (Figure 26). It should be noted that
neither an HTL nor an ETL layer was applied, supposing that the carbazole functionality of
the iridium(III) complex already promotes hole transport. The layer thicknesses of the active
copolymer layers of the devices varied from 80 nm to 230 nm. Table 4 depicts the layer
thicknesses of the active material.
The electroluminescence spectra of devices with copolymers P2-5 are shown in Figure 27. In
these materials, the feed-ratio of the fluoren-9-one is kept constant at 5 mol%, while the feed-
ratio of the iridium(III) complex is decreased from 3 to 0 mol%. For all materials, no EL-
emission in the polyfluorenes region is observed which may be due to charge trapping effects
at the metal complexes or efficient energy transfer from the copolymer backbone to the guest
moieties.
Table 4. Thicknesses of the active layers
in the prepared OLEDs.
Copolymer (feed-ratio)
Active layer thickness
[nm]
P1 (PF90PFO5Ir5) 80 P2 (PF92PFO5Ir3) 105 P3 (PF93PFO5Ir2) 130 P4 (PF94PFO5Ir1) 170 P5 (PF95PFO5Ir0) 230 P6 (PF98PFO2Ir0) 100 P7 (PF93PFO2Ir5) 90 P8 (PF95PFO0Ir5) 110
Figure 26. Schematic illustration of the
device architecture prepared with
copolymers P1-8.
Page 64
55
300 400 500 600 700 800-0.2
0.0
0.2
0.4
0.6
0.8
1.0
No
rma
lized
EL
[a.u
.]
Wavelength [nm]
P2
P3
P4
P5
Figure 27. Normalized electroluminescence spectra of OLED devices with copolymers P2-5 as
active layers.
The emission spectrum of P2 reveals an emission maximum of λmax = 620 nm that can be
assigned to T1 S0 transitions in the complex. P3 shows the same maximum absorption band
as P2, but reveals an additional emission at λ = 530 nm. For P4, the emission bands in the
green region are increased compared to P3, according to the lowered feed-ratio of iridium(III)
complex. For P5, no emission in the red (620 nm) is observed, the emission band maximum is
found at λ = 533 nm with a shoulder at λ = 565 nm. The shoulder may be a result of interface
defects.[148]
Figure 28 depicts the EL spectra of devices containing P1, P7 and P8. Due to the high Ir(III)
complex content, the emission band is located at 624 nm for all three copolymers. While P1
and P7 show low emission in the green region, P8, which was synthesized without fluorene-
9-one, inexplicably, exhibits notably high emission at 530 nm.
Page 65
56
300 400 500 600 700 8000.0
0.2
0.4
0.6
0.8
1.0
No
rma
lize
d E
L (
a.u
.)
Wavelength [nm]
P1
P7
P8
Figure 28. Normalized electroluminescence spectra of OLED devices with copolymers P1, P7
and P8 as active layers.
Figure 29 and 30 show current-voltage (J-V) curves and corresponding detector photocurrents
of two series of devices containing the copolymers. In Figure 29, P1, P7 and P8 are
compared. These copolymers were synthesized with a constant feed-ratio of 5 mol% of the
iridium(III) triplet emitter complex and feed-ratios of 0, 2 and 5 mol% for the fluoren-9-one
component, respectively. It can be observed that the current density as well as the detector
photocurrent increases with the feed-ratio of fluoren-9-one.
The turn-on-voltage is decreased from 5.8 V for P8 to 4.6 V for P1. The turn-on-voltage is
essentially determined by the emission color (photon energy) and other factors such as
thermal relaxation energy Stokes shift, injection barriers at different interfaces and potential
drops due to charge transport.[149]
Page 66
57
-2 0 2 4 6 8 10 12 14 16
10-4
10-3
10-2
10-1
100
101
102
P1 PF90PFO5Ir5
P7 PF93PFO2I5
P8 PF95PFO0Ir5
Voltage [V]
J [
A·m
-2]
10-7
10-6
10-5
10-4
10-3
10-2
10-1
100
101
102
Jp
ho
toc
urr
en
t [A
·m-2
]
Figure 29. J-V curves and detector photocurrent measured for devices containing P1, P7, P8.
Figure 30 depicts the current-voltage characteristics of a second series of devices. Here, the
feed-ratio of the fluorene-9-one moiety was kept constant at 5 mol% whereas the feed-ratio of
the triplet emitter complex 7 was varied from 3 (P2) over 2 (P3) to 1 mol% (P4).
While the device fabricated with P4 as active layer revealed the lowest current density
measured, the devices with P3 and P2 showed higher current densities, respectively. The
photocurrent of the devices also increased with higher amounts of iridium(III) complex feed-
ratio. Furthermore, the turn-on voltage decreased from 7.4 V (P4) to 6.0 V (P2) showing
similar behavior compared to the previous measurements.
Page 67
58
-2 0 2 4 6 8 10 12 14 16
10-4
10-3
10-2
10-1
100
101
102
J [
A·m
-2]
P2 PF92PFO5Ir3
P3 PF93PFO5Ir2
P4 PF94PFO5Ir1
Voltage [V]
10-8
10-7
10-6
10-5
10-4
10-3
10-2
10-1
100
101
102
Jp
ho
toc
urr
en
t [A
·m-2
]
· · ·
Figure 30. J-V curves and detector photocurrent measured for devices containing P2-4.
3.4.5 Synthesis of statistical copolymers for (WOLEDs)
As already stated in the introduction, white OLEDs are expected to play an important role in
future ambient lighting applications. The concept of using RGB dyes to produce white light
allows pure white emission compared to e.g., blue/yellow dye combinations. The same
concept of fluorescent blue and green dyes and a phosphorescent red dye as presented in
chapter 3.4.1 was used to prepare copolymers that should emit white light. Furthermore, 4,4'-
(2,7-dibromo-9H-fluorene-9,9-diyl)bis(N,N-diphenylaniline) 7 was also incorporated in order
to further improve hole-injection and transport properties. The synthesis was carried out
according to the previously described route of RGB copolymers (chapter 3.4.1). The
necessary feed-ratios of the monomers, especially of the dyes, were estimated on the basis of
the electroluminescence spectra of the RGB copolymers as well as empirical values. The
amount of 7 was fixed and chosen to be 10 mol%. The structure of the statistical copolymers
as well as the comonomer feed-ratios are shown in Scheme 19 and Table 5.
Page 68
59
Scheme 19. Top: Chemical structures of the statistical copolymers PW1-4 with triarylamine-
functionalized fluorene units. Bottom: chemical structure of the statistical copolymer PW5 with
2-ethylhexyl-functionalized 9H-carbazole units.
Page 69
60
Table 5. Monomer feed-ratios for the synthesis of copolymers PW1-4.
Name Dioctylfluorene 8
[mol%]
Fluoren-9-one
[mol%]
Ir(III) complex 6
[mol%]
Triarylaminfluorene 7
[mol%]
PW1 99.0 0.8 0.2 0
PW2 89.4 0.2 0.4 10.0
PW3 89.25 0.25 0.5 10.0
PW4 89.1 0.3 0.6 10.0
Additionally, the ethylhexyl-functionalized 9H-carbazole 9 was used instead of the
triarylamine-functionalized fluorene 7 in copolymer PW5. The feed-ratio of monomer 9 was
10 mol%, too (Table 6).
Table 6. Monomer feed-ratios for the synthesis of copolymer PW5.
Name Dioctylfluorene 8
[mol%]
Fluoren-9-one
[mol%]
Ir(III) complex 6
[mol%]
Carbazol 9
[mol%]
PW5 89.3 0.2 0.5 10.0
The GPC results as well as glass transition temperatures (Tg) and decomposition temperatures
(Td) of all white copolymers are presented in Table 7.
Table 7. GPC results of copolymers (UV detector, CHCl3) and corresponding glass transition-
and decomposition temperatures.
Name Mn
[g∙mol-1
]
Mw
[g∙mol-1
]
PDI Tg
[°C]
Td*
[°C]
PW1 11300 17500 1.55 64.8 421
PW2 7300 11400 1.56 70.7 405
PW3 11400 15800 1.39 80.7 412
PW4 8500 14700 1.73 68.3 406
PW5 11600 16200 1.40 71.1 413
* @ 5% weight loss
The 1H-NMR spectra (exemplarily for PW1, Figure 32), recorded in CDCl3 at room
temperature, showed the same broadened resonances of the dioctylfluorene chains in the
aromatic region at δ = 7.85 ppm and δ = 7.70 ppm as for copolymers P1-8. The phenyl end-
groups were found at a chemical shift of δ = 7.65 - 7.62 ppm (m), 7.51 ppm (t, 7.3 Hz)
and 7.40 ppm (t, 7.4 Hz), respectively. The resonances of the Ir(III) complex as well as the
fluorene-9-one units were too weak compared to the noise of the signal to allow for an
estimation of the copolymer’s composition. As already described for P1-8, the resonances of
the octyl side chains were found at δ = 2.13 , 1.15 and 0.84 ppm, respectively. For the
Page 70
61
copolymers PW2-4, with incorporated triarylamine-functionalized fluorene, the additional
resonances of the phenyl ring protons appear as three multiplets between δ = 7.29 – 7.02 ppm
in accordance with similar copolymers reported in the literature.[126, 150]
For PW5, the
resonance of the aliphatic α-CH2 in the ethylhexyl-functionalized 9H-carbazole is represented
by a broadened signal at δ = 4.17 ppm (Figure 33).
9.0 8.0 7.0 6.0 5.0 4.0 3.0 2.0 1.0 0.0
ppm
Figure 31. 1H-NMR spectrum of PW1 recorded in CDCl3 at room temperature.
Figure 32. Picture of
photoluminescence of PW2, spin-
coated from chloroform solution
on a glass substrate.
Page 71
62
10 9 8 7 6 5 4 3 2 1 0
5.4 5.2 5.0 4.8 4.6
ppm
ppm
Figure 33. 1H-NMR spectrum of PW5 recorded in CDCl3 at room temperature.
The 3J coupling to the aliphatic tert. carbon can be seen in the two-dimensional
1H-
1H-COSY-
NMR spectrum (Appendix A). Its resonance is overlapped by the resonances of the α-CH2
protons of the octyl side chains which is located at δ = 2.15 ppm. The resonances of the α-
CH2 and CH group of the Ir(III) complex’s ancillary ligand were found at δ = 5.17 and 4.17
ppm, respectively (insert of Figure 33). Other resonances of the Ir(III) complexes’
cyclometallating ligands were too weak.
The normalized absorption spectra in solid state are dominated by a strong band with a
maximum located at λ = 380 nm which represents S0 S1 transitions of the 9,9-
dioctylfluorene backbone (Figure 34).
The normalized PL spectra recorded in thin-film state are shown in Figure 35. PW1 was
synthesized with a feed-ratio of 0.2 mol% of the red light-emitting iridium(III) complex,
resulting in insufficient emission at λ = 650 nm. The spectrum is dominated by an emission
band at λ = 535 nm which is assigned to the fluoren-9-one moieties. The emission bands at
λ = 420 nm as well as the shoulder at λ = 445 nm originate from fluorescence of the
copolymer backbone (see chapter 3.4.1). Accordingly, the feed-ratio of the triplet emitter 6 in
Page 72
63
PW2 was increased to 0.4 mol%, while the feed-ratio of the fluoren-9-one monomer was
reduced to a fourth.
Simultaneously, monomer 7 was introduced. This results in an enhanced emission in the blue
and red region of the spectrum relative to the greenish fluorescence. For PW3 and PW4, the
feed-ratios of the fluorene-9-one and triplet emitter were raised slightly which, as expected,
translates into lower blue emission in favor of increased greenish and red emission.
Surprisingly, PW4 showed increased bluish emission over green and red if compared to PW2
and PW3.
300 400 500 6000.0
0.2
0.4
0.6
0.8
1.0 PW1
PW2
PW3
PW4
PW5
No
rmalize
d a
bso
rpti
on
[a.u
.]
wavelength [nm]
Figure 34. Normalized absorption spectra of copolymers PW1-5 recorded in solid state.
Page 73
64
400 450 500 550 600 650 700 7500.0
0.2
0.4
0.6
0.8
1.0 PW1
PW2
PW3
PW4
PW5
No
rmalize
d e
mis
sio
n [
a.u
.]
wavelength [nm]
Figure 35. Photoluminescence spectra of PW1-5 solid state films, spin-coated from chloroform
solutions.
Figure 36. Picture of a flask containing an aqueous suspension (16 mg ∙ L-1
) of PW2 (left) and
glass substrate with a thin film of PW2, drop-casted from chloroform solution (right) under UV
irradiation.
To study the properties of PW1-5 in electroluminescent devices, the polymeric materials were
sandwiched between an ITO/PEDOT:PSS anode and a Ba/Al cathode by M. Sc. D.
Page 74
65
Abbazadeh of the group of Prof. P. Bloom at the University of Eindhoven, Netherlands. The
electroluminescence spectra (Figure 37) revealed almost no blue emission, indicating the
absence of electroluminescence from the dioctylfluorene backbone. It turns out that such
OLEDs containing PW3-5 exhibit promising ratios of red and green emission that can fulfill
the requirements for suitable WOLED. Unfortunately, due to the missing blue emission, all
devices are dominated by the green and red components and thus appear greenish/red to the
human eye. In order to prepare real RGB WOLEDs with this concept, the overall feed-ratios
of fluorene-9-one and triplet emitter would need to be lowered even more, by preserving the
fluorene-9-one to iridium(III) complex ratio.
300 400 500 600 700 800
0.0
0.2
0.4
0.6
0.8
1.0
wavelength [nm]
PW1 12 mA
PW1 22 mA
PW2 20 mA
PW3 12 mA
PW4 17 mA
PW5 8 mA
No
rmalized
EL
[a
.u.]
Figure 37. Normalized electroluminescence of devices prepared with copolymers PW1-5.
3.5 Results of OLED with a novel orange triplet emitter
The orange Ir-triplet emitter complex 14 introduced in chapter 3.3 was tested as an emitter in
an OLED device prepared by the group of Prof. H. Bolink at the University of Valencia,
Page 75
66
Spain. Additional theoretical studies on the complex were executed by the group of Prof. Dr.
W. Thiel at the Max-Planck-Institut für Kohlenforschung, Mühlheim / Ruhr, Germany.
The devices were prepared by spin coating an 100 nm PEDOT:PSS layer onto pre-cleaned
ITO coated glass substrate and subsequently applying a layer of poly(N,N,(diphenyl)-N’,N’di-
(4-hexylphenyl)-4,4’-biphenyldiamine (pTPD) as hole transport layer and electron blocking
layer. The orange complex 14 was used as a dye in the N,N’-bis(1-naphtalenyl)-N-N’-
bis(phenylbenzidine) (NPB) layer at a ratio of 10 wt%. 2,9-dimethyl-4,7-diphenyl-1,10-
phenanthroline (bathocuproine, BCP) was thermally evaporated on top as a hole blocking
layer. Finally, caesium carbonate was co-evaporated together with BCP (17 wt%) to serve as
an electron transport and injection layer and aluminum was evaporated as cathode
material.[151]
Figure 38 illustrates the device architecture and corresponding layer thicknesses.
The prepared device revealed a maximum brightness of 13800 cd ∙ m-2
at 6.8 V that decreased
with higher applied voltage (Figure 39). Due to the low turn-on voltage of 2.1 V, the device
showed higher brightness levels compared to the reference device at low voltages. The
reference device published by Wang et al. was reported with a turn-on voltage of 4 V. and a
maximum brightness of 64800 cd ∙ m-2
at 11 V.[137]
The measured maximum luminous efficiency of 9.5 cd ∙ A-1
@ 3.1 V (Figure 40) is lower
than that of the reference device (71.6 cd ∙ A-1
@ 5 V), so further device optimization is
needed.
Figure 38. Device architecture of
fabricated OLEDs and
corresponding layer thicknesses.
Page 76
67
-2 0 2 4 6 81E-5
1E-4
1E-3
0.01
0.1
1
10
100
1000
10000
100000
1E-5
1E-4
1E-3
0.01
0.1
1
10
100
1000
10000
100000
Cu
rren
t d
en
sit
y [
A·m
-2]
Voltage [V]
Lu
min
an
ce
[C
d·m
-2]
Figure 39. Luminance and current density of an OLED containing complex 14.
2 3 4 5 6 7 80
2
4
6
8
10
Lu
min
ou
s e
ffic
ien
cy [
Cd
·m-2
]
Voltage [V]
Figure 40. Luminous efficiency of OLED, fabricated with complex 14.
Page 77
68
4. Summary and Outlook
A series of statistical copolymers containing red, green and blue light-emitting units were
successfully synthesized for application as active emitting layer in OLEDs. Full color tune
ability from green to red was realized by careful estimation of the monomer feed-ratios. The
copolymers were suitable as single-layer OLEDs due to 9H-carbazole moieties attached to the
polymer backbone, thus, possibly allowing for charge trapping at the emitter side. The
phosphorescent iridium(III) complex should enhance the internal quantum efficiency of the
devices due to its ability to harvest triplet as well as singlet excitons. Excellent solubility and
film forming properties were ensured by using 9,9-dioctylfluorene as the copolymer
backbone. Printed films from toluene/o-DCB solutions of the copolymers showed good film
forming properties with low surface roughness.
In an attempt to facilitate the processing of subsequent organic layers in PLED fabrication,
which usually requires either orthogonal solvents (and therefore water-soluble components) or
an additional cross-linking step, aqueous suspensions of copolymer P8 were prepared. The
suspensions turned out to be stable for at least several days and could be prepared in
concentrations of up to 50 mg ∙ L-1
. Printing the suspensions on glass substrates proved to be
successful, but printing on organic layers suffered from dewetting. Provided this problem can
be solved in the future, interesting fabrication processes for OLEDs may be developed.
The series of copoylmers P1-8 were applied in OLEDs and the properties of the devices were
investigated. It could be proved that the current density and turn-on voltages of the devices
are dependent on the feed-ratios of fluoren-9-one and iridium(III) complex.
In an attempt to synthesize copolymers for WOLEDs, a third series of copolymers was
synthesized. The monomer feed-ratios were varied towards balanced intensities of blue, green
and red light emission. The fabricated devices, however, revealed insufficient emission in the
blue region, thus appearing greenish. On the other hand, with lower fluorene-9-one and
iridium(III) complex feed-ratios, white light emission following the applied design rules may
be possible.
Finally, an orange emitting iridium(III) complex was synthesized. The OLED containing the
complex revealed a low turn-on voltage of 2.1 V and high brightness of up to 13800 cd ∙ m-2
at 6.8 V. Nevertheless, the maximum luminous efficiency of 9.5 cd ∙ A-1
@ 3.1 V needs
further optimization.
Page 78
69
5. Experimental
5.1 Materials
All commercially available reagents and starting materials were used without further
purification. Unless otherwise specified, all reactions were carried out using standard
Schlenck techniques under argon as inert protective gas.
2,7-dibromofluorene-9-one was prepared by M.Sc. Eduard Preis and was recrystallized from
ethanol prior to use.
5.2 Solvents
Solvents were used in commercial p.a. quality. Dry THF and DMF were purchased from
Acros GmbH or SigmaAldrich GmbH. Degassed solvents were prepared applying
sparging[152]
or vacuum degasification techniques.
5.3 Instrumentation
Preparative column chromatography
For purification, column chromatography was performed utilizing silica-gel by either Merck
(particle size 40 – 63 µm) or Acros (0.06 – 0.2 mm).
LC-MS
LC-MS measurements were performed on a Bruker Daltonics MICROTOF with Agilent 1100
series HPLC unit.
APLI-MS
APLI-MS measurements were carried out on a Bruker Daltronics MICROTOF with APLI
unit (APCI source by Bruker Daltronics) and KrF – Laser ATLEX-SI by ATL.
Page 79
70
GC-MS
GC-MS measurements were executed on either a GC 17A QP 5050 by Shimadzu or 7890 GC
gas chromatograph with 5975C MSD by Agilent Technologies.
NMR-spectroscopy
NMR measurements were conducted on Bruker Avance 400 or Avance III 600 spectrometer.
IR-spectroscopy
IR-spectroscopy was performed on a Jasco FT/IR-4200 spectrometer with an ATR unit from
Specac.
UV-Vis-spectroscopy
UV-Vis absorption spectra were recorded on a Jasco V-670 UV/Vis spectrometer.
Fluorescence spectroscopy
Fluorescence spectra were measured using a Varian Cary Eclipse fluorescence spectrometer.
PLQE was measured on Horiba FluoroMax 4 with F-3029 Quanta-φ accessory.
Gel permeation chromatography (GPC)
GPC measurements were carried out on a Agilent SECurity System with PSS as standard and
VWD G1329A ALS UV-detector and a C1362A RI-detector. Columns: MZ Gel SDplus 5
µm, 30 ∙ 0,8 cm (2x), 5 ∙ 0,8 cm precolumn.
Thin-layer chromatography (TLC)
For TLC, silica gel plates with 0,2 mm layer thickness and fluorescence indicator from
Macherey-Nagel were used. The spots were visualized with a UV-lamp at λ = 254 nm or 366
nm, respectively.
Thermogravimetric analysis (TGA)
Page 80
71
TGA was conducted using a Mettler/Toledo TGA/DSC1 STAR System with SDTA Sensor in
a small oven.
Differential Scanning Calorimetrie (DSC)
DSC was performed on a Mettler/Toledo DSC1 STAR System at a heat-/cooling rate of 10K∙
min-1
.
5.4 Monomer Synthesis
5.4.1 3,6-diiodo-9H-carbazole (1)[114]
9H-carbazol (8.35 g, 50 mmol) was dissolved in 180 ml boiling acid in a two necked flask
equipped with reflux condenser. KI (11.0 g, 70 mmol) was added and the solution was
allowed to cool down to 80°C. Subsequently, KIO4 (16.0 g, 70 mmol) was added in small
portions over 5 min. The mixture was stirred for 30 min at 80°C, heated to 120°C and stirred
for another 15 min. Subsequently, the solution is allowed to cool down to room temperature.
The precipitated brownish crystals are filtered off and washed with excess water. The filtrate
is poured into excess water and the precipitated crystals are filtered off and washed with
excess water. The combined crystals are purified by column chromatography (n-hexane/ethyl
acetate 10:3 (v/v)) to yield 14.1 g (34 mmol, 67.4 %) colorless crystals.
1H-NMR (600 MHz, DMSO-d6): δ [ppm] = 11.54 (s, 1H), 8.58 (d, J = 1.7 Hz, 2H), 7.67 (dd,
J = 8.5, 1.7 Hz, 2H), 7.36 (d, J = 8.5 Hz, 2H). 13
C-NMR (150 MHz, DMSO): δ [ppm] =
138.8, 134.1, 129.2, 123.8, 113.5, 81.8. GC-MS: m/z [M]+ calcd.: 418,87, found: 419. IR
(ATR): ν [cm-1
] = 3450 – 3200 (N-H), 3055 (Carom-H), 1597 (C=C), 1457, 1422, 1274, 1124,
1041, 890.
Page 81
72
5.4.2 ethyl 2-(3,6-diiodo-9H-carbazol-9-yl)acetate (2)[106]
3,6-diiodo-9H-carbazole (1) (9.6 g, 22.9 mmol) was dissolved in 100 ml dry DMF and stirred
with K2CO3 (6.3 g, 45.7 mmol) at 60°C for 1.5 hours. The solution was cooled down to rt and
ethyl 1-bromoacetate (8.4g, 50.3 mmol) was added via a syringe. The mixture was stirred at rt
for 2 hours and subsequently heated to 50°C. After one hour, the flask was cooled down to rt,
the reaction quenched with 150 ml water and the mixture poured into ice-cooled water. The
precipitate was filtered off, washed with excess water and dried in vacuum to yield 11.5 g
(22.9 mmol, 99.6 %) of a colorless solid.
1H-NMR (400 MHz, CDCl3): δ [ppm] = 8.36 (d, J = 1.5 Hz, 2H), 7.75 (dd, J = 8.6, 1.7 Hz,
2H), 7.13 (d, J = 8.6 Hz, 2H), 4.94 (s, 2H), 4.22 (q, J = 7.1 Hz, 2H), 1.24 (t, J = 7.1 Hz, 3H).
13C-NMR (101 MHz, CDCl3): δ [ppm] = 167.7, 139.7, 134.9, 129.5, 124.4, 110.6, 82.7, 61.9,
44.8, 14.1. LC-MS: [M+Na]+ calcd.: m/z = 527.89, found: m/z = 527.89.
5.4.3 (Z)-1-(3,6-diiodo-9H-carbazol-9-yl)-4-hydroxy-5,5-dimethylhex-3-en-2-one (3)[106]
3,3-dimethylbutan-2-one (4.3 g, 43.6 mmol) were dissolved in 150 ml dry DMF and cooled
down in an ice-bath. KHMDS (0.7M solution in toluene, 81.8 g, 65.4 mmol) was added drop
wise to the solution over 10 minutes. The ice-bath was removed and the mixture stirred for
one hour at rt. Subsequently, a solution of ethyl 2-(3,6-diiodo-9H-carbazol-9-yl)acetate (2)
(11.0 g, 21.8 mmol) in 50 ml dry DMF was added drop wise within 10 minutes and stirred
overnight at rt. The reaction mixture was poured into excess water, acidified with 2M HCl and
extracted three times with chloroform. The united organic phase was dried over MgSO4 and
Page 82
73
subsequently the solvent removed in vacuum. The residue was purified by silica column
chromatography (ethyl acetate/n-hexane 1:3 (v/v)) to yield a colorless solid (11.0 g, 90.6 %).
1H-NMR (600 MHz, CDCl3): δ [ppm] = 8.38 (d, J = 1.5 Hz, 2H), 7.75 (dd, J = 8.5, 1.6 Hz,
2H), 7.13 (d, J = 8.6 Hz, 2H), 5.34 (s, 1H), 4.95 (s, 2H), 1.04 (s, 9H). 13
C-NMR (151 MHz,
CDCl3): δ [ppm] = 200.1, 190.2, 139.7, 135.0, 129.6, 124.3, 110.8, 92.6, 82.8, 48.6, 38.8,
27.1. IR (ATR): ν [cm-1
] = 3054, 2970, 2877, 1707, 1582, 1467, 1424, 1352, 1275, 1202,
1144, 984, 921, 868, 783, 623, 549. LC-MS calcd.: m/z = 558.95, found: m/z [M+Na]+ =
581.94.
5.4.4 1-phenylisoquinoline (4)[118]
Phenylboronic acid (2.46 g, 20.2 mmol), 1-chlorisoquinoline (3.0 g, 18.3 mmol),
Tetrakis(triphenylphosphine)palladium(0) (1.06 g, 0.92 mmol) and 50 ml degassed toluene
were placed in a 2-necked flask with magnetic stirring and septum. 25 ml of a degassed 2M
aqueous solution of Na2CO3 and 5 ml degassed ethanol were added via syringe and
subsequently the mixture was vigorously stirred at 80°C for 15 hours. After cooling to rt, 150
ml chloroform were added and the organic phase was washed with brine (100 ml), water (2x
100 ml) and dried over MgSO4. The solvents were removed in vacuum and the residue was
purified by column chromatography (n-hexane:ethyl acetate (3:1 v/v)) to yield a colorless
solid (2.97 g, 78.9%).
1H-NMR (600 MHz, CDCl3): δ [ppm] = 8.65 (d, J = 5.7 Hz, 1H), 8.14 (dd, J = 8.5, 0.8 Hz,
1H), 7.92 (d, J = 8.3 Hz, 1H), 7.75 – 7.70 (m, 3H), 7.68 (d, J = 5.6 Hz, 1H), 7.59 – 7.55 (m,
3H), 7.55 – 7.50 (m, 1H). 13
C-NMR (151 MHz, CDCl3): δ [ppm] = 160.7, 142.0, 139.4,
136.9, 130.1, 129.9, 128.6, 128.3, 127.6, 127.2, 127.0, 126.7, 119.9. LC-MS: calcd.: [M+H]+
m/z = 206.09, found: [M+H]+ m/z = 206.11.
Page 83
74
5.4.5 [(piq)4Ir2Cl2] complex (5)[97]
1-phenylisoquinoline (4) (1.20 g, 5.85 mmol) and iridium(III) chloride hydrate (0.76 g, 2.54
mmol) were refluxed in 30 ml degassed 2-ethoxyethanol and 10 ml degassed water for 15
hours. After cooling to rt, the precipitated product was filtered off, washed with excess water
and ethanol and dried in vacuum to yield a deep-red powder (1.14 g, 70.5%).
1H-NMR (600 MHz, DMSO): δ [ppm] = 9.76 (d, J = 6.1 Hz, 1H), 9.60 (d, J = 6.3 Hz, 1H),
8.94 (d, J = 8.5 Hz, 1H), 8.88 (d, J = 8.5 Hz, 1H), 8.25 (dd, J = 13.9, 8.1 Hz, 2H), 8.20 (d, J =
8.2 Hz, 1H), 8.15 (d, J = 7.9 Hz, 1H), 8.04 (d, J = 6.4 Hz, 1H), 7.99 – 7.82 (m, 5H), 7.03 (t, J
= 7.4 Hz, 1H), 6.93 (t, J = 7.4 Hz, 1H), 6.80 (t, J = 7.3 Hz, 1H), 6.65 (t, J = 7.3 Hz, 1H), 6.34
(d, J = 7.6 Hz, 1H), 5.59 (d, J = 7.4 Hz, 1H). IR (ATR): ν [cm-1
] = 3042, 1570, 1533, 1499,
1437, 1375, 1266, 1155, 1038, 812, 729, 670, 582. APLI-MS: [M]+ calcd.: m/z = 1272.19,
found: m/z [M] +
= 1272.17.
5.4.6 [(piq)2Ir(carbacac)] complex (6)
[(piq)4Ir2Cl2] (5) (1.2 g, 0.94 mmol), (Z)-1-(3,6-diiodo-9H-carbazol-9-yl)-4-hydroxy-5,5-
dimethylhex-3-en-2-one (4) (1.16 g, 2.07 mmol), K2CO3 (0.91 g, 6.60 mmol) and 1,4-
diiodobenzene (6.22 g, 18.90 mmol) were placed in a Schlencktube and dissolved in 50ml
Page 84
75
degassed 2-ethoxyethanol. The mixture was stirred at 110°C for 2 hours and subsequently
allowed to cool down to rt. The red solution was carefully neutralized with 2M HCl and
poured into 150 ml chloroform. The organic phase was washed three times with water and
dried over MgSO4. The solvents were removed in vacuum and the residue was purified by
column chromatography (n-hexane/ethyl acetate (3:1 v/v)) to yield a deep-red solid (1.80 g,
82.3 %).
1H-NMR (600 MHz, CDCl3): δ [ppm] = 8.98 (d, J = 8.0 Hz, 2H), 8.18 (d, 1H), 8.18 (d, 1H),
8.15 (d, J = 8.0 Hz, 1H), 8.07 (s, 2H), 8.03 (d, J = 6.2 Hz, 1H), 7.98 (d, 1H), 7.98 (d, 1H),
7.83 (t, 1H), 7.83 (t, 1H), 7.7 (t, 1H), 7.7 (t, 1H), 7.33 (d, J = 8.5 Hz, 1H), 7.25 (d, J = 6.3 Hz,
1H), 7.12 (d, J = 6.2 Hz, 1H), 6.97 (t, J = 7.5 Hz, 1H), 6.89 (t, J = 7.6 Hz, 1H), 6.86 (d, J =
8.5 Hz, 2H), 6.67 (t, J = 7.3 Hz, 1H), 6.63 (t, J = 7.4 Hz, 1H), 6.39 (d, J = 7.6 Hz, 1H), 6.35
(d, J = 7.7 Hz, 1H), 5.25 (s, 1H), 4.61 (d, J = 16.2 Hz, 1H), 4.49 (d, J = 15.7Hz, 1H), 0.67 (s,
9H). 13
C-NMR (101 MHz, CDCl3): δ [ppm] = 197.0, 179.4, 169.1, 168.7, 151.6, 151.4, 146.4,
146.3, 140.3, 140.1, 139.6, 137.0, 137.00, 134.1, 134.0, 130.7, 130.6, 129.7, 129.4, 128.9,
128.6, 127.8, 127.6, 127.3, 127.2, 126.7, 126.1, 126.0, 123.8, 120.4, 120.2, 119.5, 119.3,
111.3, 93.1, 81.9, 77.3, 77.0, 76.7, 51.3, 41.1, 27.6. IR (ATR): ν [cm-1
] = 3041, 2955, 1707,
1573, 1498, 1423, 1354, 1318, 1276, 1217, 1146, 1038, 863, 802, 731, 670, 627, 574. APLI-
MS: clacd.: [M]+ m/z = 1159.07, found: [M]
+ m/z = 1159.05. UV-VIS: Abs. (CHCl3): λmax
[nm] = 242, 275, 298, 344, 412, 480. PL (CHCl3, Ex. 480 nm): λmax [nm] = 622 nm.
5.4.7 4,4'-(2,7-dibromo-9H-fluorene-9,9-diyl)bis(N,N-diphenylaniline) (7)[126]
2,7-dibromo-9H-fluorene-9-one (5.0 g, 14.8 mmol), Triphenylamine (36.3 g, 148 mmol) and
methansulfonic acid (1.42 g, 14.8 mmol) were stirred at 140°C for 6 hours. After cooling to rt,
the solid is dissolved in 200 ml CH2Cl2 and the solution washed three times with 50 ml of a
saturated aqueous Na2CO3 solution and finally with 50 ml of water. The organic phase is
dried over MgSO4 and subsequently the solvent is removed in vacuum. Column
Page 85
76
chromatography with n-hexane/CH2Cl2 (10:3 10:4 (v/v)) yields a colorless solid (10,76 g,
89.7 %).
1H-NMR (400 MHz, CDCl3): δ [ppm] = 7.59 (d, J = 8.1 Hz, 2H), 7.55 (d, J = 1.6 Hz, 2H),
7.50 (dd, J = 8.1, 1.7 Hz, 2H), 7.26 (dd, J = 8.3, 7.5 Hz, 8H), 7.13 – 7.09 (m, 8H), 7.06 – 7.00
(m, 8H), 6.96 – 6.92 (m, 4H). 13
C-NMR (101 MHz, CDCl3): δ [ppm] 153.5, 147.5, 146.7,
138.0, 137.7, 130.80, 129.4, 129.3, 128.7, 124.7, 123.1, 122.8, 121.8, 121.5. MS (APLI):
calcd.: m/z [M]+ = 810.11, found: m/z [M]
+ = 810.11.
5.4.8 2,7-dibromo-9,9-dioctyl-9H-fluorene (8)
2,7-dibromo-9H-fluorene (10.0 g, 30.9 mmol), a solution of 25.7 g NaOH in 25 ml H2O and 2
drops of Aliquat® 100 were placed in a 3-necked flask and 1-bromooctane (59.6 g, 309 mmol)
was added. The mixture was stirred at 60°C overnight and subsequently 150 ml water were
added. After 3x extraction with diethyl ether, the organic phase was washed with brine and
water and dried over MgSO4. The solvent was removed in vacuum and the residue was
diluted in 100 ml ethanol and subsequently cooled down to -78°C. While cooling down, a
colorless solid precipitates that is filtered off, dried and recrystallized from ethanol (yield:
85.7%).
1H-NMR (600 MHz, CDCl3): δ [ppm] = 7.54 (dd, J = 7.6, 0.7 Hz, 2H), 7.48 (d, J = 1.8 Hz,
2H), 7.47 (s, 2H), 1.95 – 1.90 (m, 4H), 1.30 – 1.04 (m, 20H), 0.86 (t, J = 7.3 Hz, 6H), 0.66 –
0.58 (m, 4H). 13
C-NMR (151 MHz, CDCl3): δ [ppm] = 152.6, 139.1, 130.2, 126.2, 121.5,
121.1, 55.7, 40.1, 31.7, 29.8, 29.1, 29.1, 23.6, 22.6, 14.0. MS (APCI): calcd.: [M]+ m/z =
548.15, found: m/z [M]+ = 548.15.
Page 86
77
5.4.9 3,6-dibromo-9-(2-ethylhexyl)-9H-carbazole (9)[136]
3,6-dibromo-9H-carbazole (2.0 g, 6.15 mmol) and NaH (370 mg, 15.4 mmol) were dissolved
in 250 ml dry DMF and stirred for 30 min at 60°C. After cooling to rt, 3-bromoheptane (1.78
g, 9.2 mmol) was added dropwise via a syringe and stirred for another 30 min. Subsequently,
the mixture was poured into 350 ml ice cooled water and placed in the fridge for 3 hours. The
precipitate is filtered off and purified by silica column chromatography (n-hexane:ethyl
acetate 0:3 (v/v)) to yield a colorless, transparent oil (2,67 g, 99.2%).
1H-NMR (400 MHz, CDCl3): δ [ppm] = 8.16 (d, J = 1.9 Hz, 2H), 7.56 (dd, J = 8.7, 1.9 Hz,
2H), 7.28 (d, J = 1.9 Hz, 2H), 4.12 (dd, J = 7.5, 1.7 Hz, 2H), 2.05 – 1.96 (m, 1H), 1.43 – 1.21
(m, 8H), 0.92 (t, J = 7.4 Hz, 3H), 0.8 (t, J = 7.1 Hz, 3H). 13
C-NMR (101 MHz, CDCl3): δ
[ppm] =139.8, 129.0, 123.4, 123.2, 111.9, 110.7, 77.3, 77.00, 76.7, 47.7, 39.3, 31.0, 28.7,
24.3, 23.0, 14.0, 10.8. LC-MS: calcd.: m/z [M]+ = 546.02, found: m/z [M]
+ = 546.02.
5.4.10 N-(4-fluorophenyl)benzamide (10)[137]
4-fluoroaniline (5.0 g, 44.5 mmol) and benzoic acid (4.2 g, 34.4 mmol) are dissolved in 80 ml
dry toluene and stirred at reflux temperature. Then phosphorous trichloride (5.7 g, 42.2 mmol)
is added dropwise within 15 min. The solution is stirred for 2.5 hours and subsequently
allowed to cool to rt. The reaction is then quenched with the addition of 10 ml water. After the
solvent is evaporated in vacuum, the residue is washed with excess water, dried, and
recrystallized from acetone (4.06 g, 62.4%).
Page 87
78
1H-NMR (600 MHz, CDCl3): δ [ppm] = 7.91 – 7.87 (m, 2H), 7.82 (s, 1H), 7.65 – 7.61 (m,
2H), 7.61 – 7.57 (m, 1H), 7.52 (t, J = 7.6 Hz, 2H), 7.12 – 7.07 (m, 2H). 13
C-NMR (151 MHz,
CDCl3): δ [ppm] = 165.7, 159.6 (d, J = 244.1 Hz), 134.8, 133.9, 132.0, 128.9, 127.0, 122.1 (d,
J = 7.9 Hz), 115.8 (d, J = 22.7 Hz). LC-MS: calcd.: m/z [M+H]+ = 216.07, found: m/z
[M+H]+ = 216.07.
5.4.11 N-(4-fluorophenyl)benzothioamide (11)[137]
N-(4-fluorophenyl)benzamide (10) (10 g, 46.5 mmol) and Lawsesson’s Reagent (10.3 g, 25.6
mmol) were dissolved in dry toluene and heated to reflux over night with constant stirring.
After cooling down to rt, the organic phase was washed with water and subsequently dried
over MgSO4. The solvent was removed in vacuum and the residue dissolved in 10 ml
dichloromethane and subsequently precipitated by adding 50 ml n-hexane and removing the
dichloromethane under reduced pressure. The flask was kept in the fridge over-night and
finally the colorless solid was filtered off, washed with ice-cooled n-hexane and dried. The
filtrate was collected, the n-hexane removed under reduced pressure and the residue purified
by column chromatography on silica gel (n-hexane:EtAc 10:3 (v/v)). The combined solids
added up to 8.79 g (81.8 % yield) of a colorless solid.
1H-NMR (400 MHz, CDCl3): δ [ppm] = 9.01 (s, 1H), 7.85 (d, J = 7.4 Hz, 2H), 7.70 (dd, J =
7.9, 4.8 Hz, 2H), 7.53 (t, J = 7.1 Hz, 1H), 7.45 (t, J = 7.4 Hz, 2H), 7.14 (t, J = 8.4 Hz, 2H).
13C-NMR (101 MHz, CDCl3): δ [ppm] = 198.9, 160.8 (d, J = 247.5 Hz), 142.7, 134.9, 131.4,
128.6, 126.1, 126.0 (d, J = 8.2 Hz), 115.8 (d, J = 22.8 Hz). LC-MS: calcd.: m/z [M+H]+ =
232.05, found: m/z [M+H]+ = 232.1.
Page 88
79
5.4.12 6-fluoro-2-phenylbenzo[d]thiazole (12)[137]
N-(4-fluorophenyl)benzothiaamide) (11) (2.2g, 9.51 mmol) was wetted with a few drops of
ethanol and blended with 8 eq. of NaOH (as aqueous 30 wt% solution). Subsequently the
mixture is diluted with water to 10 wt%. Subsequently, it is added dropwise to a stirred
solution of potassium ferricyanide (III) (12.52 g, 38.04 mmol) in 62.5 ml water at 85°C. After
3 hours, the solution is allowed to cool down to rt and 75 ml water are added. After
neutralization with 2M HCl, the mixture is extracted with dichloromethane (3x 50 ml), the
combined organic phase is dried over MgSO4 and finally the solvent removed in vacuum. The
residue was recrystalized from methanol to yield a colorless solid (2.06 g, 94%).
1H-NMR (400 MHz, CDCl3): δ [ppm] = 8.10 – 8.07 (m, 2H), 8.04 (dd, J = 9.0, 4.8 Hz, 1H),
7.60 (dd, J = 8.1, 2.5 Hz, 1H), 7.54 – 7.49 (m, 3H), 7.30 – 7.22 (m, 1H). 13
C-NMR (151 MHz,
CDCl3): δ [ppm] = 167.8 (s), 160.5 (d, J = 245.8 Hz), 150.8 (s), 136.1 (d, J = 11.4 Hz), 133.4
(s), 131.0 (s), 129.1 (s), 127.5 (s), 124.1 (d, J = 9.0 Hz), 115.0 (d, J = 24.4 Hz), 107.8 (d, J =
26.6 Hz). LC-MS: calcd.: m/z [M+H]+ = 230.04, found: m/z [M+H]
+ = 230.05.
5.4.13 [(F-bt)4Ir2Cl2] complex (13)[137]
Iridium(III) chloride hydrate (0.79g, 3.95 mmol) and 6-fluoro-2-phenylbenzo[d]thiazole (12)
(2.00 g, 8.68 mmol) were stirred in a mixture of 30 ml 2-ethoxyethanol and 10 ml water for
15 hours at 130°C. After cooling to rt, the precipitate was filtered off, washed with excess
ethanol and dried in vacuum. The crude product was used in the following reaction without
further purification.
Page 89
80
IR (ATR) [cm-1
] 3104, 3047, 2972, 1694, 1570, 1447, 1250, 1190, 1021, 965, 907, 849, 814,
757, 679, 577.
5.4.14 [(F-bt)2Ir(carbacac)] complex (14)
[(F-pbt)4Ir2Cl2] (13) (150 mg, 0.11 mmol), (Z)-6-(9H-carbazol-9-yl)-5-hydroxy-2,2-
dimethylhex-4-en-3-one (84 mg, 0.273 mmol) and K2CO3 (106 mg, 0.77 mmol) were placed
in a flask and 20 mL degassed 2-ethoxyethanol were added. The mixture was heated to reflux
for 2h with constant stirring. After cooling to rt, the solvent was evaporated and the crude
product purified by silica column chromatography with n-hexane/ethyl acetate (10:3 v/v) as
eluent to yield an orange powder (140 mg, 67%).
1H-NMR (600 MHz, CDCl3): δ [ppm] = 8.03 (d, J = 7.5 Hz, 2H), 7.78 (dd, J = 9.0, 4.7 Hz,
1H), 7.74 (dd, J = 9.0, 4.8 Hz, 1H), 7.60 (dd, J = 12.2, 7.6 Hz, 2H), 7.58 – 7.53 (m, 2H), 7.23
(t, J = 7.3 Hz, 2H), 7.19 (t, J = 7.3 Hz, 2H), 7.03 (d, J = 8.1 Hz, 2H), 6.96 (td, J = 8.8, 2.5 Hz,
1H), 6.92 – 6.85 (m, 2H), 6.79 (td, J = 8.9, 2.5 Hz, 1H), 6.64 (q, J = 7.2 Hz, 2H), 6.46 (d, J =
7.7 Hz, 1H), 6.42 (d, J = 7.8 Hz, 1H), 5.19 (s, 1H), 4.59 (dd, J = 40.5, 16.7 Hz, 2H), 0.65 ppm
(s, 9H). 13
C-NMR (100 MHz, CDCl3) δ [ppm] = 27.4, 41.1, 50.8, 94.0, 108.5, 108.7, 108.9,
115.3, 115.5, 115.7, 115.9, 119.0, 120.0, 120.7, 120.8, 120.1, 121.0, 121.2, 121.3, 121.8,
125.5, 125.5, 125.7, 129.8, 130.0, 131.8, 132.0, 132.1, 132.2, 135.0, 135.4, 140.6, 141.4,
141.5, 141.7, 146.9, 147.1, 147.9, 159.0, 159.1, 161.5, 161.6, 181.7, 197.6 ppm. FT-IR
(ATR): νmax [cm-1
] = 3048 (C-Harom), 2956-2860 (C-H), 1900br, 1575s, 1511, 1457s, 1415s,
1323, 1295, 1244, 1200, 1152, 1048, 1018, 993, 912, 849, 750, 721; UV/Vis: Abs (CHCl3):
λmax [nm] = 250, 264, 294, 328, 400sh, 445, 488sh. Abs (film): λmax [nm] = 269, 295, 329,
400sh, 448, 488sh. PL (exc. 460 nm, CHCl3): λmax [nm] = 558, 598sh nm; PL (exc. 460 nm,
film): λmax [nm] = 562, 602sh. APLI-MS (ESI): m/z calcd (%) for IrS2F2O2N3C46H34: 953
(20%), 954 (28), 955 (M+, 39), 956 (20), 957 (8), 958 (3), found: 953 (20%), 954 (28), 955
Page 90
81
(M+, 39), 956 (20), 957 (8), 958 (3) ; elemental analysis calc (%) for IrS2F2O2N3C46H34: C
57.85, H 3.59, N 4.40, S 6.71; found: C 57.46, H 3.66, N 4.27, S 6.24.
5.5 Polymer Synthesis
5.5.1 General procedure for preparation of copolymers P1-8
500 mg 9,9-dioctyl-9H-fluorene-2,7-diboronic acid bis(1,3-propandiol)ester (0.90 mmol), 2,7-
dibromo-9,9-dioctyl-9H-fluorene (8), [(Dicacac)Ir(piq)2] (6), 2,7-dibromo-9H-fluoren-9-one,
72.4 mg Tetrakis(triphenylphosphine)-palladium(0) (0.06 mmol) and two drops of Aliquat®
336 were placed in a 100 ml two-necked flask with reflux condenser and septum. The
apparatus was flushed with argon three times and 30 ml degassed toluene and 10 ml of a
degassed 2M Na2CO3 aqueous solution were added via syringe. The mixture was stirred at
85°C for 48h. The solution was cooled down and 0.13 ml bromobenzene (1.25 mmol) were
added and the solution stirred for 24h at 85°C. Afterwards, the solution was again cooled
down a bit and 460 mg Phenylboronic acid (3.76 mmol) were added and the solution stirred
again for 24h. After cooling down to rt, the mixture was diluted in 150 ml chloroform and the
organic layer washed with 50 ml brine (1x) and 50 ml H2O (2x). The organic layer was dried
over MgSO4 and the solvents removed in vacuum. The residue was dissolved in 10 ml
chloroform and precipitated in methanol at -78°C. The solid was filtered off, dried, and
extracted with acetone for 48h.
P1 (PF90PFO5Ir5)
Yield 441 mg (58.5 %). 1H-NMR (600 MHz, CDCl3): δ [ppm] = 7.87, 7.71, 7.63, 7.52, 7.43,
2.16, 1.18, 0,85. UV/Vis: Abs (CHCl3): λmax [nm], ε [L ∙ mol-1
∙ cm-1
)] = 371, 186000. PL
(exc. 380 nm, CHCl3): λmax [nm] = 414. Tg = 87°C. Td (5% decomposition) = 354°C. GPC
(CHCl3, RID): Mn = 6500 g ∙ mol-1
, Mw = 10400 g ∙ mol-1
, PDI = 1.6.
Page 91
82
P2 (PF92PFO5Ir3)
Yield 334 mg (45.4 %). 1H-NMR (600 MHz, CDCl3): δ [ppm] = 7.87, 7.71, 7.63, 7.52, 7,43,
2.16, 1.18, 0,85. UV/Vis: Abs (CHCl3): λmax [nm], ε [L ∙ mol-1
∙ cm-1
)] = 380, 740095. PL
(exc. 380 nm, CHCl3): λmax [nm] = 418. Tg = 73°C. Td (5% decomposition) = 391°C. GPC
(CHCl3, RID): Mn = 10600 g ∙ mol-1
, Mw = 17900 g ∙ mol-1
, PDI = 1.7.
P3 (PF93PFO5Ir2)
Yield 446 mg (61.4 %). 1H-NMR (600 MHz, CDCl3): δ [ppm] = 7.87, 7.71, 7.63, 7.52, 7.43,
2.16, 1.18, 0,85. UV/Vis: Abs (CHCl3): λmax [nm], ε [L ∙ mol-1
∙ cm-1
)] = 383, 465349.
PL (exc. 380 nm, CHCl3): λmax [nm] = 418. Tg = 69°C. Td (5% decomposition) = 416°C. GPC
(CHCl3, RID): Mn = 9200 g ∙ mol-1
, Mw = 15900 g ∙ mol-1
, PDI = 1.7.
P4 (PF94PFO5Ir1)
Yield 376 mg (52.2 %). 1H-NMR (600 MHz, CDCl3): δ [ppm] = 7.87, 7.71, 7.63, 7.52, 7.43,
2.16, 1.18, 0,85. UV/Vis: Abs (CHCl3): λmax [nm], ε [L ∙ mol-1
∙ cm-1
)] = 381, 396897. PL
(exc. 380nm, CHCl3): λmax [nm] = 416. Tg = 80°C. Td (5% decomposition) = 416°C. GPC
(CHCl3, RID): Mn = 9100 g ∙ mol-1
, Mw =19200 g ∙ mol-1
, PDI = 2.1.
P5 (PF95PFO5Ir0)
Yield 457 mg (64.5 %). 1H-NMR (600 MHz, CDCl3): δ [ppm] = 7.87, 7.71, 7.63, 7.52, 7.43,
2.16, 1.18, 0,85. UV/Vis: Abs (CHCl3): λmax [nm], ε [L ∙ mol-1
∙ cm-1
)] = 384, 508681. PL
(exc. 380 nm, CHCl3): λmax [nm] = 418 nm. Tg = 73°C. Td (5% decomposition) = 415°C. GPC
(CHCl3, RID): Mn = 14600 g ∙ mol-1
, Mw = 29200 g ∙ mol-1
, PDI = 2.0.
P6 (PF98PFO2Ir0)
Yield 377 mg (52.3 %). 1H-NMR (600 MHz, CDCl3): δ [ppm] = 7.87, 7.71, 7.63, 7.52, 7.43,
2.16, 1.18, 0,85. UV/Vis: Abs (CHCl3): λmax [nm], ε [L ∙ mol-1
∙ cm-1
)] = 386 nm, 527588. PL
(exc. 380 nm, CHCl3): λmax [nm] = 416 nm. Tg = 66°C. Td (5% decomposition) = 419°C. GPC
(CHCl3, RID): Mn = 17300 g ∙ mol-1
, Mw = 33700 g ∙ mol-1
, PDI = 1.9.
Page 92
83
P7 (PF93PFO2Ir5)
Yield 439 mg (57.3 %). 1H-NMR (600 MHz, CDCl3): δ [ppm] = 7.87, 7.71, 7.63, 7.52, 7.43,
2.16, 1.18, 0,85. UV/Vis: Abs (CHCl3): λmax [nm], ε [L ∙ mol-1
∙ cm-1
)] = 379, 243898. PL
(exc. 380 nm, CHCl3): λmax [nm] = 416 nm. Tg = 69°C. Td (5% decomposition) = 395°C. GPC
(CHCl3, RID): Mn = 4000 g ∙ mol-1
, Mw = 8000 g ∙ mol-1
, PDI = 2.0.
P8 (PF95PFO0Ir5)
Yield 479 mg (54.2 %). 1H-NMR (600 MHz, CDCl3): δ [ppm] = 7.87, 7.71, 7.63, 7.52, 7.43,
2.16, 1.18, 0,85. UV/Vis: Abs (CHCl3): λmax [nm], ε [L ∙ mol-1
∙ cm-1
)] = 378 nm, 143310. PL
(exc 380 nm, CHCl3): λmax [nm] = 416 nm. Tg = 69°C. Td (5% decomposition) = 395°C. GPC
(CHCl3, RID): Mn = 4300 g ∙ mol-1
, Mw = 8800 g ∙ mol-1
, PDI = 2.0.
PW1
400 mg 9,9-dioctyl-9H-fluorene-2,7-diboronic acid bis(1,3-propandiol)ester (0.72 mmol), 385
mg 2,7-dibromo-9,9-dioctyl-9H-fluorene (8) (0.70 mmol), 3.32 mg [(Dicacac)Ir(piq)2] (6)
(0.002 mol), 3.87 mg 2,7-dibromo-9H-fluoren-9-one (0.01 mmol), and 49.7 mg
Tetrakis(triphenylphosphine)palladium(0) (0.04 mmol) and two drops of Aliquat® 336 were
placed in a 100 ml two-necked flask with reflux condenser and septum. The apparatus was
flushed with argon three times and 30 ml degassed toluene and 10 ml of a degassed 2M
Na2CO3 aqueous solution were added via syringe. The mixture was stirred at 85°C for 48h.
The solution was cooled down a bit and 52.4 mg Phenylboronic acid (0.43 mmol) were added
and the solution stirred for 24h at 85°C. Afterwards, the solution was again cooled down a bit
and 164 mg iodobenzene (0.72 mmol) were added and the solution stirred again for 24h. After
cooling down to rt, the mixture was diluted in 150 ml chloroform and the organic layer
washed with 50 ml brine (1x) and 50 ml H2O (2x). The organic layer was dried over MgSO4
and the solvents removed in vacuum. After purification via short column chromatography
(silica gel, tolunene/n-hexane 3:10 v/v), the product was dissolved in 10 ml chloroform and
precipitated in methanol at -78°C. The solid was filtered off, dried, and extracted with acetone
for 48h.
Yield 140 mg (22.0%). 1
H-NMR (600 MHz, CDCl3): δ [ppm] = 8.00, 7.87, 7.71, 7.62, 7.52,
7.40, 2.15, 1.17, 0.85. UV/Vis: Abs (film): λmax [nm] = 380. PL (exc. 380 nm, film): λmax
Page 93
84
[nm] = 534. Tg = 64.8°C. Td (5% decomposition) = 421°C. GPC (CHCl3, UV): Mn = 11300 g
∙ mol-1
, Mw = 17500 g ∙ mol-1
, PDI = 1.55.
5.5.2. General procedure for preparation of copolymers PW2-4
500 mg 9,9-dioctyl-9H-fluorene-2,7-diboronic acid bis(1,3-propandiol)ester (0.90 mmol), 2,7-
dibromo-9,9-dioctyl-9H-fluorene (8), [(Dicacac)Ir(piq)2] (6), 2,7-dibromo-9H-fluoren-9-one,
and 49 mg Tetrakis(triphenylphosphine)palladium(0) (0.04 mmol), 4,4'-(2,7-dibromo-9H-
fluorene-9,9-diyl)bis(N,N-diphenylaniline) (7) (145 mg, 0.18 mmol) and two drops of
Aliquat® 336 were placed in a 100 ml two-necked flask with reflux condenser and septum.
The apparatus was flushed with argon three times and 30 ml degassed toluene and 10 ml of a
degassed 2M Na2CO3 aqueous solution were added via syringe. The mixture was stirred at
85°C for 48h. The solution was cooled down a bit and 52.4 mg Phenylboronic acid
(0.43 mmol) were added and the solution stirred for 24h at 85°C. Afterwards, the solution was
again cooled down a bit and 164 mg iodobenzene (0.72 mmol) were added and the solution
stirred again for 24h at 85°C. Afterwards, the solution was again cooled down a bit and 460
mg Phenylboronic acid (3.76 mmol) were added and the solution stirred again for 24h. After
cooling down to rt, the mixture was diluted in 150 ml chloroform and the organic layer
washed with 50 ml brine (1x) and 50 ml H2O (2x). The organic layer was dried over MgSO4
and the solvents removed in vacuum. After purification via short column chromatography
(silica gel, tolunene/n-hexane 3:10 v/v), the product was dissolved in 10 ml chloroform and
precipitated in methanol at -78°C. The solid was filtered off, dried, and extracted with acetone
for 48h.
PW2
Yield 201 mg (25.8%). 1H-NMR (600 MHz, CDCl3): δ [ppm] = 7.87, 7.71, 7.63, 7.52, 7.41,
7.25, 7.12, 7.02, 2.14, 1.17, 0.84. UV/Vis: Abs (film): λmax [nm] = 377. PL (exc. 380 nm,
film): λmax [nm] = 422. Tg = 70.7°C. Td (5% decomposition) = 405°C. GPC (CHCl3, UV): Mn
= 7300 g ∙ mol-1
, Mw = 11400 g ∙ mol-1
, PDI = 1.56.
Page 94
85
PW3
Yield: 91 mg (11%). 1H-NMR (400 MHz, CDCl3): δ [ppm] = 7.85, 7.70, 7.62, 7.51, 7.39,
7.25, 7.13, 7.02, 2.13, 1.16, 0.84. UV/Vis: Abs (film): λmax [nm] = 383. PL (exc. 380 nm,
film): λmax [nm] = 422. Tg = 80.7°C. Td (5% decomposition) = 412°C. GPC (CHCl3, UV): Mn
= 11400 g ∙ mol-1
, Mw = 15800 g ∙ mol-1
, PDI = 1.39.
PW4
Yield: 305 mg (39.2%). 1H-NMR (400 MHz, CDCl3): δ [ppm] = 7.85, 7.70, 7.61, 7.51, 7.40,
7.25, 7.11, 7.02, 2.13, 1.16, 0.84. UV/Vis: Abs (film): λmax [nm] = 383. PL (exc. 380 nm,
film): λmax [nm] = 420. Tg = 68.3°C. Td (5% decomposition) = 406°C. GPC (CHCl3, UV): Mn
= 8500 g ∙ mol-1
, Mw = 14700 g ∙ mol-1
, PDI = 1.73.
5.5.3. Copolymer PW5
500 mg 9,9-dioctyl-9H-fluorene-2,7-diboronic acid bis(1,3-propandiol)ester (0.90 mmol), 386
mg 2,7-dibromo-9,9-dioctyl-9H-fluorene (8) (0.70 mmol), 10.4 mg [(Dicacac)Ir(piq)2] (6)
(0.009 mmol), 1.21 mg 2,7-dibromo-9H-fluoren-9-one (0.004 mmol), and 49 mg
Tetrakis(triphenylphosphine)palladium(0) (0.03 mmol), 78.3 mg 3,6-dibromo-9-(2-
ethylhexyl)-9H-carbazole (9) (0.18 mmol) and two drops of Aliquat® 336 were placed in a
100 ml two-necked flask with reflux condenser and septum. The apparatus was flushed with
argon three times and 30 ml degassed toluene and 10 ml of a degassed 2M Na2CO3 aqueous
solution were added via syringe. The mixture was stirred at 85°C for 48h. The solution was
cooled down a bit and 52.4 mg Phenylboronic acid (0.43 mmol) were added and the solution
stirred for 24h at 85°C. Afterwards, the solution was again cooled down a bit and 164 mg
iodobenzene (0.72 mmol) were added and the solution stirred again for 24h. After cooling
down to rt, the mixture was diluted in 150 ml chloroform and the organic layer washed with
50 ml brine (1x) and 50 ml H2O (2x). The organic layer was dried over MgSO4 and the
solvents removed in vacuum. After purification via short column chromatography (silica gel,
tolunene/n-hexane 3:10 v/v), the product was dissolved in 10 ml chloroform and precipitated
in methanol at -78°C. The solid was filtered off, dried, and extracted with acetone for 48h.
Page 95
86
Yield 218 mg (30.7%). 1H-NMR (600 MHz, CDCl3) δ [ppm] = 7.87, 7.71, 7.63, 7.52, 7.40,
4.27, 2.15, 1.43, 1.17, 0.85. UV/Vis: Abs (film): λmax [nm] = 383. PL (exc. 380 nm, film):
λmax [nm] = 422. Tg = 71.1°C. Td (5% decomposition) = 413°C. GPC (CHCl3, UV): Mn =
116300 g ∙ mol-1
, Mw = 16200 g ∙ mol-1
, PDI = 1.40.
Page 96
87
6. List of Figures
Figure 1. Schematic representation of a multi-layer device architecture. .................................. 2
Figure 2. Simplified energy diagram of a multilayer OLED ..................................................... 7
Figure 3. A modified Jablonski diagram .................................................................................... 9
Figure 4. Normalized absorption and emission spectra of an iridium(III) complex ................ 10
Figure 5. Simplified illustration of energy transfer processes ................................................. 11
Figure 6. Schematic presentation of HOMO an LUMO levels ................................................ 13
Figure 7. Simplified examples of device architectures for WOLEDs ...................................... 14
Figure 8. Concepts of polymeric arrangements applied in organic WOLEDs ......................... 16
Figure 9. 1H-NMR spectrum of 1 recorded in DMSO-d6 at room temperature. ...................... 26
Figure 10. 1H-NMR spectrum of 2, recorded in CDCl3 at room temperature. ......................... 27
Figure 11. 1H-NMR spectrum of 3, recorded in CDCl3 at room temperature. ......................... 29
Figure 12. Cuttings of 1H-NMR spectrum of 6. ....................................................................... 31
Figure 13. IR (ATR) spectrum of 6. ......................................................................................... 32
Figure 14. Normalized relevant section of high-resolution mass spectra of 6. ........................ 32
Figure 15. Normalized absorption and emission spectra of 6 .................................................. 33
Figure 16. 1H-NMR spectrum of complex 14 .......................................................................... 40
Figure 17. Normalized absorption and emission spectra of complex 14 ................................. 41
Figure 18. Normalized relevant section of high-resolution mass spectra of 14. ...................... 42
Figure 19. Overlay of 1H-NMR spectra of monomer 7 copolymer P1 .................................... 46
Figure 20. Normalized absorption and emission spectra of copolymers P1-8 (solution) ........ 47
Figure 21. Normalized absorption and emission spectra of copolymers P1-8 (film) .............. 48
Figure 22. Aqueous suspension of P8 and corresponding solution under UV irradiation. ...... 50
Figure 23. Normalized UV/Vis spectra of aqueous copolymer suspensions of P8 .................. 51
Figure 24. Normalized absorption and emission spectra of inkjet printed P1-8 ...................... 53
Page 97
88
Figure 25. Optical profiler images of inkjet printed polymers P5 and P6 ............................... 53
Figure 26. Schematic illustration of the device architecture prepared with copolymers P1-8 . 54
Figure 27. Normalized electroluminescence spectra of OLED devices with P2-5 .................. 55
Figure 28. Normalized electroluminescence spectra of OLED devices with P1, P7-P8.......... 56
Figure 29. J-V curves and detector photocurrent measured for devices with P1, P7-P8 ......... 57
Figure 30. J-V curves and detector photocurrent measured for devices containing P2-4........ 58
Figure 31. 1H-NMR spectrum of PW1 recorded in CDCl3 at room temperature. .................... 61
Figure 32. Picture of photoluminescence of film of PW2 ........................................................ 61
Figure 33. 1H-NMR spectrum of PW5 recorded in CDCl3 at room temperature. .................... 62
Figure 34. Normalized absorption spectra of copolymers PW1-5 recorded in solid state. ...... 63
Figure 35. Photoluminescence spectra of PW1-5 (film) .......................................................... 64
Figure 36. Picture of aqueous suspension and film of PW2 under UV irradiation. ................. 64
Figure 37. Normalized electroluminescence of devices with copolymers PW1-5................... 65
Figure 38. Device architecture of fabricated OLEDs and corresponding layer thicknesses. ... 66
Figure 39. Luminance and current density of an OLED containing complex 14. ................... 67
Figure 40. Luminous efficiency of OLED, fabricated with complex 14. ................................ 67
Page 98
89
7. List of Schemes
Scheme 1. Chemical structures of common hole injection materials. ....................................... 3
Scheme 2. Chemical structures of common hole transport materials. ....................................... 4
Scheme 3. Chemical structures of emitter molecules................................................................. 5
Scheme 4. Chemical structures of two examples of electron transport materials ...................... 6
Scheme 5. Chemical structures and PL maximum of five selected iridium(III) complexes .... 19
Scheme 6 . Synthesis route to bis- and triscyclometalating iridium(III) complexes. ............... 20
Scheme 7. Chemical structure of the planned series of copolymers. ....................................... 21
Scheme 8. Chemical structures of copolymers PW1-5. ........................................................... 23
Scheme 9. Chemical structure of iridium(III) complex [Ir(piq)2(carbacac)] ........................... 24
Scheme 10. Aromatic resonance structures of 9H-carbazole. .................................................. 25
Scheme 11. Synthesis of ancillary ligand 3. ............................................................................. 26
Scheme 12. Synthesis of 1-phenylisoquinoline and [(piq)2Ir(carbacac)]. ................................ 30
Scheme 13. Synthesis of fluorene-based monomers 7 and 8 ................................................... 34
Scheme 14. Synthesis of 3,6-dibromo-9-(2-ethylhexyl)-9H-carbazole. .................................. 35
Scheme 15. Chemical structure of a known orange light-emitting iridium(III) complex ........ 36
Scheme 16. Synthetic route to the orange light-emitting complex 15 ..................................... 37
Scheme 17. Synthesis of ancillary ligand 2b ............................................................................ 39
Scheme 18. Synthesis of the first copolymer series ................................................................. 44
Scheme 19. Chemical structures of the statistical copolymers PW1-5 .................................... 59
Page 99
90
8. Appendix
8.A 2D 1H-
1H COSY-NMR spectrum of PW5 (excerpt)
Appendix A. Excerpt of 2D 1H-
1H COSY-NMR spectrum of PW5.
Page 100
91
9. List of publications
Unveiling Photodeactivation Pathways for a New Iridium(III) Cyclometalated Complex,
Daniel Escudero, Eike Heuser, Robert J. Meier, Michael Schäferling, Walter Thiel, Elisabeth
Holder, Chemistry – A European Journal, 2013, 15639 DOI: 10.1002/chem.201301291
Page 101
92
10. Acknowledgement
At the end of my thesis, I would like to thank all the people that contributed to my studies and
who supported me with their motivation, encouragement, knowledge and know-how and who
made the working hours an unforgettable experience for me.
First of all, I would like to thank my supervisor, Jun.-Prof. Dr. Elisabeth Holder for the
continuous support of my Ph.D. studies as well as her motivation, patience and sharing of
knowledge.
I am very thankful to Prof. Dr. Ullrich Scherf and Prof. Dr. Michael Tausch for reviwing this
thesis as referees.
Furthermore, I would like to thank the co-workers and staff of the functional polymers group
and macromolecular chemistry for their endless support and all the fun we had. I will never
forget you and the great times we had together.
My special thanks go to Anke Helfer, Dr. Michael Forster, Dr. Sibylle Allard and Kerstin
Müller of the macromolecular chemistry group for their support and having an open ear for all
sorts of problems.
Anke Helfer is furthermore acknowledged for countless APLI-MS, GPC, TGA and DSC
measurements and for being there whenever needed.
Andreas Siebert of the organic chemistry department is acknowledged for performing all
NMR measurements.
I would also like to thank all cooperation partners, especially M. Sc. D. Abbazadeh of the
group of Prof. P. Bloom at the University of Eindhoven, Netherlands, for preparing the
polymer OLEDs and investigating their properties, the group of Prof. Dr. H. Bolink at the
University of Valencia, Spain, for preparing and investigating OLEDs with the orange emitter
and last but not least, Dr. Anke Teichler of the group of Prof. Dr. U. S. Schubert at the
University of Jena, Germany, for performing the inkjet printing experiments.
Furthermore, I thank the Dutch Polymer Institute (DPI) for funding and supporting my
research activities.
Page 102
93
Finally, I take this opportunity to express the profound gratitude to my beloved wife, my
parents and my sister. Without their endless love and support I received, this thesis would not
have been possible.
Page 103
94
11. Literature
1. A. Bernanose, M. C., P. Vouaux, J. Chim. Phys. Phys.- Chim. Biol., 1953, 50, 64.
2. Shirakawa, H.; Louis, E. J.; MacDiarmid, A. G.; Chiang, C. K.; Heeger, A. J., J.
Chem. Soc., Chem. Commun., 1977, 578.
3. Yoo-chul, K., Galaxy S4 to hit market today
http://www.koreatimes.co.kr/www/news/tech/2013/04/133_134603.html (accessed
05.02.2015).
4. LG Electronics, LG G Flex Product Page. http://www.lg.com/de/handy/lg-G-Flex
(accessed 12.03.2014).
5. Adhikari, R. M.; Mondal, R.; Shah, B. K.; Neckers, D. C., J. Org. Chem., 2007, 72,
4727.
6. Razeghi, M., Fundamentals of Solid State Engineering. Springer: 2009.
7. Fischer, L. H.; Stich, M. I. J.; Wolfbeis, O. S.; Tian, N.; Holder, E.; Schäferling, M.,
Chem. Eur. J., 2009, 15, 10857.
8. Kim, H.; Piqué, A.; Horwitz, J. S.; Mattoussi, H.; Murata, H.; Kafafi, Z. H.; Chrisey,
D. B., Appl. Phys. Lett., 1999, 74, 3444.
9. Kim, H.; Gilmore, C. M.; Piqué, A.; Horwitz, J. S.; Mattoussi, H.; Murata, H.; Kafafi,
Z. H.; Chrisey, D. B., J. Appl. Phys., 1999, 86, 6451.
10. Fortunato, E.; Ginley, D.; Hosono, H.; Paine, D. C., MRS Bull., 2007, 32, 242.
11. Li, J.; Hu, L.; Wang, L.; Zhou, Y.; Grüner, G.; Marks, T. J., Nano Lett., 2006, 6, 2472.
12. Bae, S.; Kim, H.; Lee, Y.; Xu, X.; Park, J.-S.; Zheng, Y.; Balakrishnan, J.; Lei, T.; Ri
Kim, H.; Song, Y. I.; Kim, Y.-J.; Kim, K. S.; Ozyilmaz, B.; Ahn, J.-H.; Hong, B. H.;
Iijima, S., Nature Nanotech., 2010, 5, 574.
13. Wang, H.; Klubek, K. P.; Tang, C. W., Appl. Phys. Lett., 2008, 93, 093306.
14. Staudigel, J.; Stößel, M.; Steuber, F.; Simmerer, J., J. Appl. Phys., 1999, 86, 3895.
15. Hung, L. S.; Chen, C. H., Mater. Sci. Eng., R, 2002, 39, 143.
16. Tang, C. W.; VanSlyke, S. A., Appl. Phys. Lett., 1987, 51, 913.
17. Abkowtz, M.; Pai, D. M., Philos. Mag. B, 1986, 53, 193.
Page 104
95
18. Kalinowski, J., International Journal of Electronics, 1996, 81, 377.
19. Boris Minaev, H. A., He Tian, Zhijun Ning and Xin Li Organic Light Emitting Diode
- Material, Process and Devices. InTech: 51000 Rijeka, Croatia, 2011.
20. Perumal, S.; Minaev, B.; Ågren, H., J. Phys. Chem. C, 2013, 117, 3446.
21. Jiang, C.; Yang, W.; Peng, J.; Xiao, S.; Cao, Y., Adv. Mater., 2004, 16, 537.
22. Costa, J. C. S.; Santos, L. M. N. B. F., J. Phys. Chem. C, 2013, 117, 10919.
23. Tokito, S.; Noda, K.; Shimada, K.; Inoue, S.-i.; Kimura, M.; Sawaki, Y.; Taga, Y.,
Thin Solid Films, 2000, 363, 290.
24. Shi, J.; Tang, C. W., Appl. Phys. Lett., 1997, 70, 1665.
25. Murata, H.; Merritt, C. D.; Inada, H.; Shirota, Y.; Kafafi, Z. H., Appl. Phys. Lett.,
1999, 75, 3252.
26. Moon, C.-B.; Song, W.; Meng, M.; Kim, N. H.; Yoon, J.-A.; Kim, W. Y.; Wood, R.;
Mascher, P., J. Lumin., 2014, 146, 314.
27. Tao, S.; Niu, L.; Yu, J.; Jiang, Y.; Zhang, X., J. Lumin., 2010, 130, 70.
28. Lee, K.-H. K., Sung-Min ; Kim, Jeong-Yeon ; Kim, Young-Kwan ; Yoon, Seung-Soo,
Bull. Korean Chem. Soc., 2010, 31, 2884.
29. Köhler, A.; Wilson, J. S.; Friend, R. H., Adv. Eng. Mater., 2002, 4, 453.
30. Chaudhuri, D.; Sigmund, E.; Meyer, A.; Röck, L.; Klemm, P.; Lautenschlager, S.;
Schmid, A.; Yost, S. R.; Van Voorhis, T.; Bange, S.; Höger, S.; Lupton, J. M., Angew.
Chem. Int. Ed., 2013, 52, 13449.
31. Baldo, M. A.; O'Brien, D. F.; You, Y.; Shoustikov, A.; Sibley, S.; Thompson, M. E.;
Forrest, S. R., Nature, 1998, 395, 151.
32. Adachi, C.; Baldo, M. A.; Thompson, M. E.; Forrest, S. R., J. Appl. Phys., 2001, 90,
5048.
33. Wang, Z. B.; Helander, M. G.; Hudson, Z. M.; Qiu, J.; Wang, S.; Lu, Z. H., Appl.
Phys. Lett., 2011, 98, 213301.
34. Tian, N.; Lenkeit, D.; Pelz, S.; Fischer, L. H.; Escudero, D.; Schiewek, R.; Klink, D.;
Schmitz, O. J.; González, L.; Schäferling, M.; Holder, E., Eur. J. Inorg. Chem., 2010,
4875.
Page 105
96
35. Kourkoulos, D.; Karakus, C.; Hertel, D.; Alle, R.; Schmeding, S.; Hummel, J.; Risch,
N.; Holder, E.; Meerholz, K., Dalton Trans., 2013, 42, 13612.
36. Du, B.; Wang, L.; Wu, H.; Yang, W.; Zhang, Y.; Liu, R.; Sun, M.; Peng, J.; Cao, Y.,
Chem. Eur. J., 2007, 13, 7432.
37. Li, Z.; Li, Z. R.; Meng, H., Organic Light-Emitting Materials and Devices. CRC
Press: 2006.
38. Seo, J. H.; Namdas, E. B.; Gutacker, A.; Heeger, A. J.; Bazan, G. C., Appl. Phys. Lett.,
2010, 97, 043303.
39. Baldo, M. A.; Kozlov, V. G.; Burrows, P. E.; Forrest, S. R.; Ban, V. S.; Koene, B.;
Thompson, M. E., Appl. Phys. Lett., 1997, 71, 3033.
40. Zhou, T. X.; Ngo, T.; Brown, J. J.; Shtein, M.; Forrest, S. R., Appl. Phys. Lett., 2005,
86, 021107.
41. Scriven, L. E., MRS Online Proceedings Library, 1988, 121, 717.
42. Schubert, D.; Dunkel, T., Mater. Res. Innovations, 2003, 7, 314.
43. Colella, S.; Mazzeo, M.; Melcarne, G.; Carallo, S.; Ciccarella, G.; Gigli, G., Appl.
Phys. Lett., 2013, 102, 203307.
44. Teichler, A.; Perelaer, J.; Schubert, U. S., J. Mater. Chem. C, 2013, 1, 1910.
45. Adhikari, R.; Postma, A.; Li, J.-H.; Hirai, T.; Bown, M.; Ueno, K., Journal of the
Society for Information Display, 2013, 21, 151.
46. Cha, S. J.; Cho, S.-N.; Lee, W.-H.; Chung, H.-S.; Kang, I.-N.; Suh, M. C., Macromol.
Rapid Commun., 2014, 35, 807
47. Lee, J.; Han, H.; Lee, J.; Yoon, S. C.; Lee, C., J. Mater. Chem. C, 2014, 2, 1474.
48. Reineke, S.; Thomschke, M.; Lüssem, B.; Leo, K., Rev. Mod. Phys., 2013, 85, 1245.
49. Tandon, K.; Ramasesha, S.; Mazumdar, S., Phys. Rev. B: Condens. Matter, 2003, 67,
045109.
50. Holder, E.; Langeveld, B. M. W.; Schubert, U. S., Adv. Mater., 2005, 17, 1109.
51. Meng, L.-C.; Hou, Y.-B.; Lou, Z.-D.; Teng, F.; Yao, X.; Liu, X.-J.; Tang, A.-W.;
Peng, J.-B., Synth. Met., 2013, 172, 63.
52. Jeon, S. O.; Yook, K. S.; Joo, C. W.; Lee, J. Y., Org. Electron., 2010, 11, 881.
Page 106
97
53. Minaev, B.; Baryshnikov, G.; Agren, H., Phys. Chem. Chem. Phys., 2014, 16, 1719.
54. Yang, X.; Neher, D., Organic Light Emitting Devices: Synthesis, Properties and
Applications. 1st edition 2006 ed.; Wiley-VCH Verlag GmbH & Co KGaA,
Weinheim, Germany: 2006.
55. Escudero, D.; Heuser, E.; Meier, R. J.; Schäferling, M.; Thiel, W.; Holder, E., Chem.
Eur. J., 2013, 19, 15639.
56. Wang, Y.; Herron, N.; Grushin, V. V.; LeCloux, D.; Petrov, V., Appl. Phys. Lett.,
2001, 79, 449.
57. ChemWiki - The Dynamic Chemistry Textbook, Dexter Energy Transfer.
http://chemwiki.ucdavis.edu/Core/Theoretical_Chemistry/Fundamentals/Dexter_Ener
gy_Transfer (accessed 06.05.2014).
58. Förster, T., Ann. Phys., 1948, 437, 55.
59. Dexter, D. L., J. Chem. Phys., 1953, 21, 836.
60. Kappaun, S.; Slugovc, C.; List, E., Int. J. Mol. Sci., 2008, 9, 1527.
61. Köhler, A.; Bässler, H., Mater. Sci. Eng., R, 2009, 66, 71.
62. Cleave, V.; Yahioglu, G.; Le Barny, P.; Hwang, D. H.; Holmes, A. B.; Friend, R. H.;
Tessler, N., Adv. Mater., 2001, 13, 44.
63. He, G.; Zheng, L., Opt. Lett., 2010, 35, 2955.
64. Kido, J.; Kimura, M.; Nagai, K., Science, 1995, 267, 1332.
65. Kido, J.; Shionoya, H.; Nagai, K., Appl. Phys. Lett., 1995, 67, 2281.
66. Burrows, P. E.; Forrest, S. R.; Sibley, S. P.; Thompson, M. E., Appl. Phys. Lett., 1996,
69, 2959.
67. Williams, E. L.; Haavisto, K.; Li, J.; Jabbour, G. E., Adv. Mater., 2007, 19, 197.
68. Kalinowski, J.; Cocchi, M.; Virgili, D.; Fattori, V.; Williams, J. A. G., Adv. Mater.,
2007, 19, 4000.
69. Kido, J.; Hongawa, K.; Okuyama, K.; Nagai, K., Appl. Phys. Lett., 1994, 64, 815.
70. Huang, J.; Hou, W.-J.; Li, J.-H.; Li, G.; Yang, Y., Appl. Phys. Lett., 2006, 89, 133509.
71. Kawamura, Y.; Yanagida, S.; Forrest, S. R., J. Appl. Phys., 2002, 92, 87.
Page 107
98
72. Wu, H. B.; Zou, J. H.; Liu, F.; Wang, L.; Mikhailovsky, A.; Bazan, G. C.; Yang, W.;
Cao, Y., Adv. Mater., 2008, 20, 696.
73. Huang, F.; Shih, P.-I.; Shu, C.-F.; Chi, Y.; Jen, A. K. Y., Adv. Mater., 2009, 21, 361.
74. Cheng, G.; Fei, T.; Duan, Y.; Zhao, Y.; Ma, Y.; Liu, S., Opt. Lett., 2010, 35, 2436.
75. Chao, C.-I.; Chen, S.-A., Appl. Phys. Lett., 1998, 73, 426.
76. Thompson, J.; Blyth, R. I. R.; Mazzeo, M.; Anni, M.; Gigli, G.; Cingolani, R., Appl.
Phys. Lett., 2001, 79, 560.
77. Becker, H.; Spreitzer, H.; Kreuder, W.; Kluge, E.; Schenk, H.; Parker, I.; Cao, Y.,
Adv. Mater., 2000, 12, 42.
78. Kohnen, A.; Irion, M.; Gather, M. C.; Rehmann, N.; Zacharias, P.; Meerholz, K., J.
Mater. Chem., 2010, 20, 3301.
79. Tasch, S.; List, E. J. W.; Ekström, O.; Graupner, W.; Leising, G.; Schlichting, P.;
Rohr, U.; Geerts, Y.; Scherf, U.; Müllen, K., Appl. Phys. Lett., 1997, 71, 2883.
80. Granström, M.; Inganäs, O., Appl. Phys. Lett., 1996, 68, 147.
81. Hu, B.; Karasz, F. E., J. Appl. Phys., 2003, 93, 1995.
82. Huang, J.; Li, G.; Wu, E.; Xu, Q.; Yang, Y., Adv. Mater., 2006, 18, 114.
83. Liu, J.; Zhou, Q. G.; Cheng, Y. X.; Geng, Y. H.; Wang, L. X.; Ma, D. G.; Jing, X. B.;
Wang, F. S., Adv. Mater., 2005, 17, 2974.
84. Liu, J.; Shao, S. Y.; Chen, L.; Xie, Z. Y.; Cheng, Y. X.; Geng, Y. H.; Wang, L. X.;
Jing, X. B.; Wang, F. S., Adv. Mater., 2007, 19, 1859.
85. Liu, J.; Chen, L.; Shao, S. Y.; Xie, Z. Y.; Cheng, Y. X.; Geng, Y. H.; Wang, L. X.;
Jing, X. B.; Wang, F. S., Adv. Mater., 2007, 19, 4224.
86. Zhen, H.; Xu, W.; Yang, W.; Chen, Q.; Xu, Y.; Jiang, J.; Peng, J.; Cao, Y., Macromol.
Rapid Commun., 2006, 27, 2095.
87. Jiang, J. X.; Xu, Y. H.; Yang, W.; Guan, R.; Liu, Z. Q.; Zhen, H. Y.; Cao, Y., Adv.
Mater., 2006, 18, 1769.
88. Jiang, J.; Jiang, C.; Yang, W.; Zhen, H.; Huang, F.; Cao, Y., Macromolecules, 2005,
38, 4072.
89. Wu, H.; Ying, L.; Yang, W.; Cao, Y., Chem. Soc. Rev., 2009, 38, 3391.
Page 108
99
90. McNaught, A. D.; Wilkinson, A., IUPAC. Compendium of Chemical Terminology,
2nd ed. (the "Gold Book"). WileyBlackwell; 2nd Revised edition edition.
91. Karatsu, T.; Takahashi, M.; Yagai, S.; Kitamura, A., Inorg. Chem., 2013, 52, 12338.
92. Tsuboyama, A.; Iwawaki, H.; Furugori, M.; Mukaide, T.; Kamatani, J.; Igawa, S.;
Moriyama, T.; Miura, S.; Takiguchi, T.; Okada, S.; Hoshino, M.; Ueno, K., J. Am.
Chem. Soc., 2003, 125, 12971.
93. You, Y.; Park, S. Y., J. Am. Chem. Soc., 2005, 127, 12438.
94. Kwon, T.-H.; Kim, M. K.; Kwon, J.; Shin, D.-Y.; Park, S. J.; Lee, C.-L.; Kim, J.-J.;
Hong, J.-I., Chem. Mater., 2007, 19, 3673.
95. Holmes, R. J.; Forrest, S. R.; Tung, Y.-J.; Kwong, R. C.; Brown, J. J.; Garon, S.;
Thompson, M. E., Appl. Phys. Lett., 2003, 82, 2422.
96. Adachi, C.; Kwong, R. C.; Djurovich, P.; Adamovich, V.; Baldo, M. A.; Thompson,
M. E.; Forrest, S. R., Appl. Phys. Lett., 2001, 79, 2082.
97. Nonoyama, M., Bull. Chem. Soc. Jpn., 1974, 47, 767.
98. Dixon, I. M.; Collin, J.-P.; Sauvage, J.-P.; Flamigni, L.; Encinas, S.; Barigelletti, F.,
Chem. Soc. Rev., 2000, 29, 385.
99. Sprouse, S.; King, K. A.; Spellane, P. J.; Watts, R. J., J. Am. Chem. Soc., 1984, 106,
6647.
100. Ulbricht, C.; Beyer, B.; Friebe, C.; Winter, A.; Schubert, U. S., Adv. Mater., 2009, 21,
4418.
101. Colombo, M. G.; Brunold, T. C.; Riedener, T.; Guedel, H. U.; Fortsch, M.; Buergi, H.-
B., Inorg. Chem., 1994, 33, 545.
102. Konno, H.; Sasaki, Y., Chem. Lett., 2003, 32, 252.
103. Kaori, S.; Noriyuki, M.; Hiroshi, K.; Yuji, H.; Hisakazu, T.; Takeko, M., Jpn. J. Appl.
Phys., 2004, 43, 2733.
104. Leclerc, M., J. Polym. Sci., Part A: Polym. Chem., 2001, 39, 2867.
105. Lin, Y.; Ye, T.-L.; Chen, Y.; Ma, D.-G.; Chen, Z.-K.; Dai, Y.-F.; Li, Y.-X., J. Polym.
Sci., Part A: Polym. Chem., 2010, 48, 5930.
106. Tian, N.; Thiessen, A.; Schiewek, R.; Schmitz, O. J.; Hertel, D.; Meerholz, K.; Holder,
E., J. Org. Chem., 2009, 74, 2718.
Page 109
100
107. Chua, L.-L.; Zaumseil, J.; Chang, J.-F.; Ou, E. C. W.; Ho, P. K. H.; Sirringhaus, H.;
Friend, R. H., Nature, 2005, 434, 194.
108. Uckert, F.; Setayesh, S.; Müllen, K., Macromolecules, 1999, 32, 4519.
109. Kanelidis, I.; Altintas, O.; Gasse, J.-C.; Frahm, R.; Eychmuller, A.; Holder, E., Polym.
Chem., 2011, 2, 2597.
110. Tian, N.; Aulin, Y. V.; Lenkeit, D.; Pelz, S.; Mikhnenko, O. V.; Blom, P. W. M.; Loi,
M. A.; Holder, E., Dalton Trans., 2010, 39, 8613.
111. Tian, N., PhD thesis, Bergische Universität Wuppertal, Wuppertal, 2012.
112. Backes, J.; Brunner, E.; Eberbach, W.; Gossauer, A.; Jutz, C.; Kreher, R. P.; Rudorf,
W. D.; Sauter, F.; Stütz, P., Houben-Weyl Methods of Organic Chemistry Vol. E 6a,
4th Edition Supplement: Hetarenes I (Five-Membered Rings with One Heteroatom in
the Ring System). Thieme: 2014.
113. Crabtree, R. H., The Organometallic Chemistry of the Transition Metals. Wiley: 2014.
114. Tucker, S. H., J. Chem. Soc., 1926, 129, 546.
115. Podgoršek, A.; Zupan, M.; Iskra, J., Angew. Chem., 2009, 121, 8576.
116. Bogdal, D.; Lukasiewicz, M.; Pielichowski, J., Green Chem., 2004, 6, 110.
117. Conn, M. M.; Deslongchamps, G.; de Mendoza, J.; Rebek, J., J. Am. Chem. Soc.,
1993, 115, 3548.
118. Liu, S.-J.; Zhao, Q.; Fan, Q.-L.; Huang, W., Eur. J. Inorg. Chem., 2008, 2177.
119. Movassaghi, M.; Hill, M. D., Org. Lett., 2008, 10, 3485.
120. Beyer, B.; Ulbricht, C.; Winter, A.; Hager, M. D.; Hoogenboom, R.; Herzer, N.;
Baumann, S. O.; Kickelbick, G.; Gorls, H.; Schubert, U. S., New J. Chem., 2010, 34,
2622.
121. Tian, N.; Lenkeit, D.; Pelz, S.; Kourkoulos, D.; Hertel, D.; Meerholz, K.; Holder, E.,
Dalton Trans., 2011, 40, 11629.
122. Beyer, B.; Ulbricht, C.; Escudero, D.; Friebe, C.; Winter, A.; González, L.; Schubert,
U. S., Organometallics, 2009, 28, 5478.
123. Zhuang, X.-D.; Chen, Y.; Li, B.-X.; Ma, D.-G.; Zhang, B.; Li, Y., Chem. Mater.,
2010, 22, 4455.
Page 110
101
124. Lin, H.-Y.; Liou, G.-S.; Lee, W.-Y.; Chen, W.-C., J. Polym. Sci., Part A: Polym.
Chem., 2007, 45, 1727.
125. Prachumrak, N.; Thangthong, A. m.; Tarsang, R.; Keawin, T.; Jungsuttiwong, S.;
Sudyoadsuk, T.; Promarak, V., Tetrahedron Lett., 2012, 53, 5492.
126. Kanelidis, I.; Ren, Y.; Lesnyak, V.; Gasse, J.-C.; Frahm, R.; Eychmüller, A.; Holder,
E., J. Polym. Sci., Part A: Polym. Chem., 2011, 49, 392.
127. Ego, C.; Grimsdale, A. C.; Uckert, F.; Yu, G.; Srdanov, G.; Müllen, K., Adv. Mater.,
2002, 14, 809.
128. Scherf, U.; List, E. J. W., Adv. Mater., 2002, 14, 477.
129. Kamtekar, K. T.; Vaughan, H. L.; Lyons, B. P.; Monkman, A. P.; Pandya, S. U.;
Bryce, M. R., Macromolecules, 2010, 43, 4481.
130. Kim, G. Y.; Choi, M.-C.; Song, M.; Jin, S.-H.; Liaw, D.-J.; Wu, H.-Y.; Huang, Y.-C.;
Ha, C.-S., J. Nanosci. Nanotechnol., 2012, 12, 5735.
131. Pasini, M.; Giovanella, U.; Betti, P.; Bolognesi, A.; Botta, C.; Destri, S.; Porzio, W.;
Vercelli, B.; Zotti, G., ChemPhysChem, 2009, 10, 2143.
132. Prins, P.; Grozema, F. C.; Nehls, B. S.; Farrell, T.; Scherf, U.; Siebbeles, L. D. A.,
Phys. Rev. B: Condens. Matter, 2006, 74, 113203.
133. Zhu, H.; Tong, H.; Gong, Y.; Shao, S.; Deng, C.; Yuan, W. Z.; Zhang, Y., J. Polym.
Sci., Part A: Polym. Chem., 2012, 50, 2172.
134. Wang, R.; Wang, W.-Z.; Yang, G.-Z.; Liu, T.; Yu, J.; Jiang, Y., J. Polym. Sci., Part A:
Polym. Chem., 2008, 46, 790.
135. Wang, H.; Ryu, J.-T.; Kwon, Y., J. Appl. Polym. Sci., 2011, 119, 377.
136. Huang, J.; Niu, Y.; Yang, W.; Mo, Y.; Yuan, M.; Cao, Y., Macromolecules, 2002, 35,
6080.
137. Wang, R.; Liu, D.; Ren, H.; Zhang, T.; Yin, H.; Liu, G.; Li, J., Adv. Mater., 2011, 23,
2823.
138. Singh, H.; Singh, A. K.; Sharma, S.; Iyer, R. N.; Srivastava, O. P., J. Med. Chem.,
1977, 20, 826.
139. Joule, J. A.; Mills, K., Heterocyclic Chemistry. Wiley: 2013.
140. Crosby, G. A.; Demas, J. N., J. Phys. Chem., 1971, 75, 991.
Page 111
102
141. Song, S.; Kim, J. Y.; Suh, H.; Jin, Y., Mol. Cryst. Liq. Cryst., 2012, 567, 171.
142. Kasama, D.; Takata, R.; Kajii, H.; Ohmori, Y., Thin Solid Films, 2009, 518, 559.
143. Dias, F. B.; Maçanita, A. L.; Seixas de Melo, J.; Burrows, H. D.; Güntner, R.; Scherf,
U.; Monkman, A. P., J. Chem. Phys., 2003, 118, 7119.
144. Knaapila, M.; Winokur, M., Structure and Morphology of Polyfluorenes in Solutions
and the Solid State. In Polyfluorenes, Scherf, U.; Neher, D., Eds. Springer Berlin
Heidelberg: 2008; Vol. 212, pp 227.
145. List, E. J. W.; Guentner, R.; Scanducci de Freitas, P.; Scherf, U., Adv. Mater., 2002,
14, 374.
146. Montilla, F.; Ruseckas, A.; Samuel, I. D. W., Chem. Phys. Lett., 2013, 585, 133.
147. Singh, M.; Haverinen, H. M.; Dhagat, P.; Jabbour, G. E., Adv. Mater., 2010, 22, 673.
148. Scherf, U.; Neher, D., Polyfluorenes. Springer: Berlin, 2008.
149. Zou, D.; Tsutsui, T., J. Appl. Phys., 2000, 87, 1951.
150. Thangthong, A. m.; Prachumrak, N.; Namuangruk, S.; Jungsuttiwong, S.; Keawin, T.;
Sudyoadsuk, T.; Promarak, V., Eur. J. Org. Chem., 2012, 5263.
151. Wetzelaer, G.-J. A. H.; Hartmann, D.; Santamaría, S. G.; Pérez-Morales, M.; Portillo,
A. S.; Lenes, M.; Sarfert, W.; Bolink, H. J., Org. Electron., 2011, 12, 1644.
152. Dong, M. W., Precision in HPLC. Mastering the art of HPLC. Today's Chemist at
Work. 2000, 28.


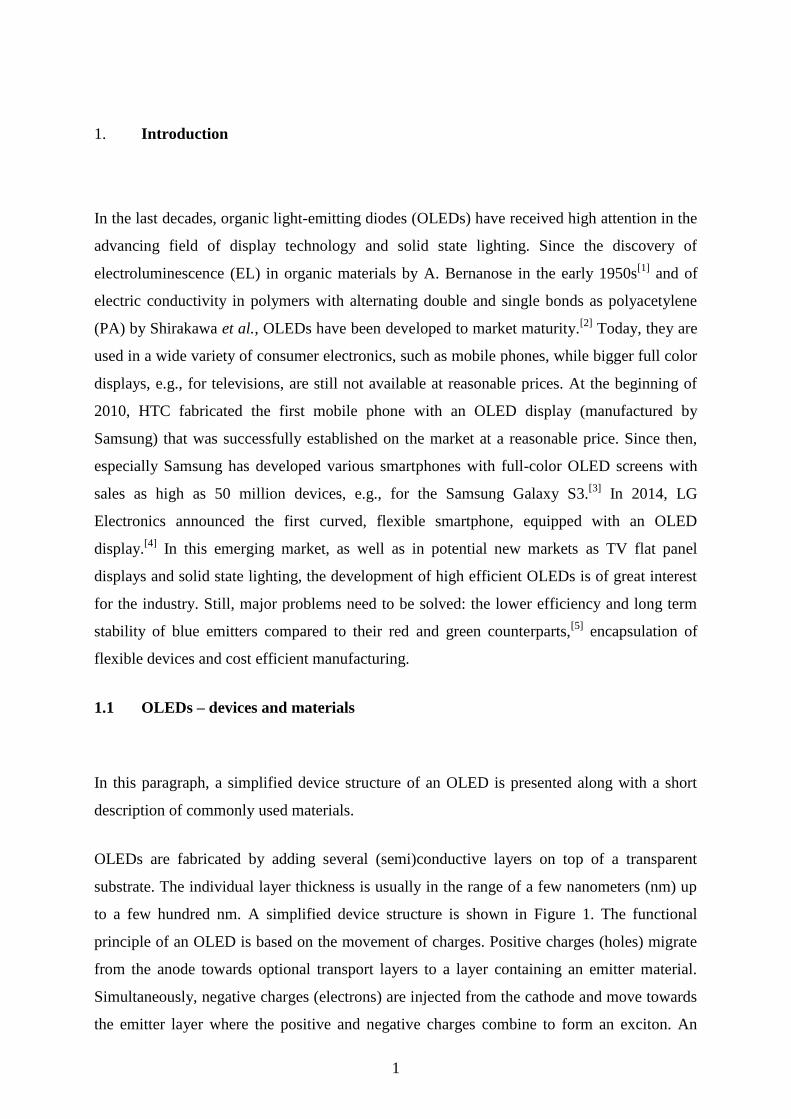
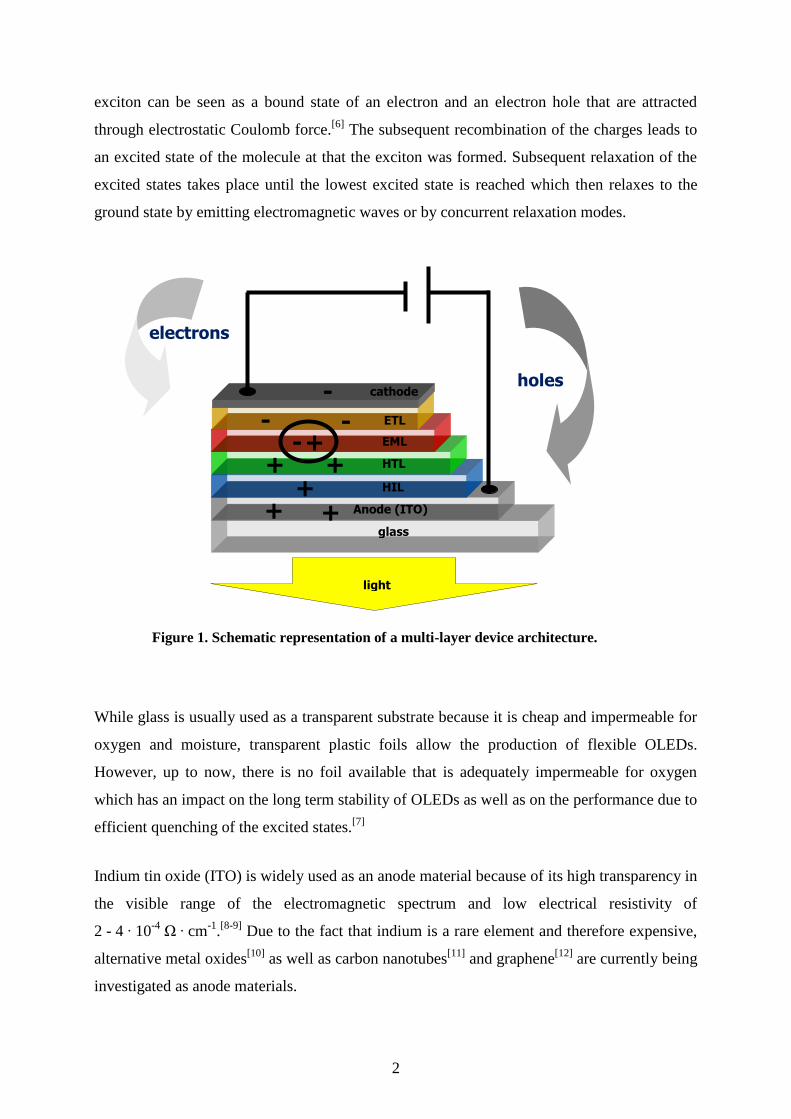
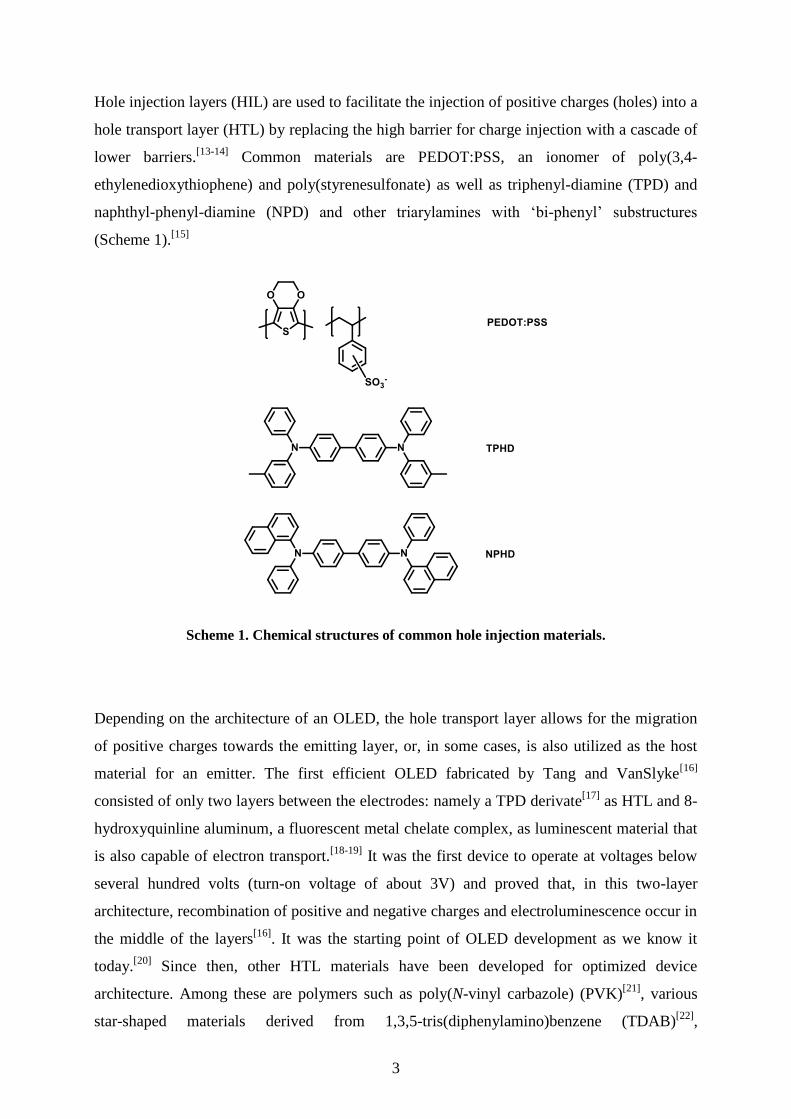


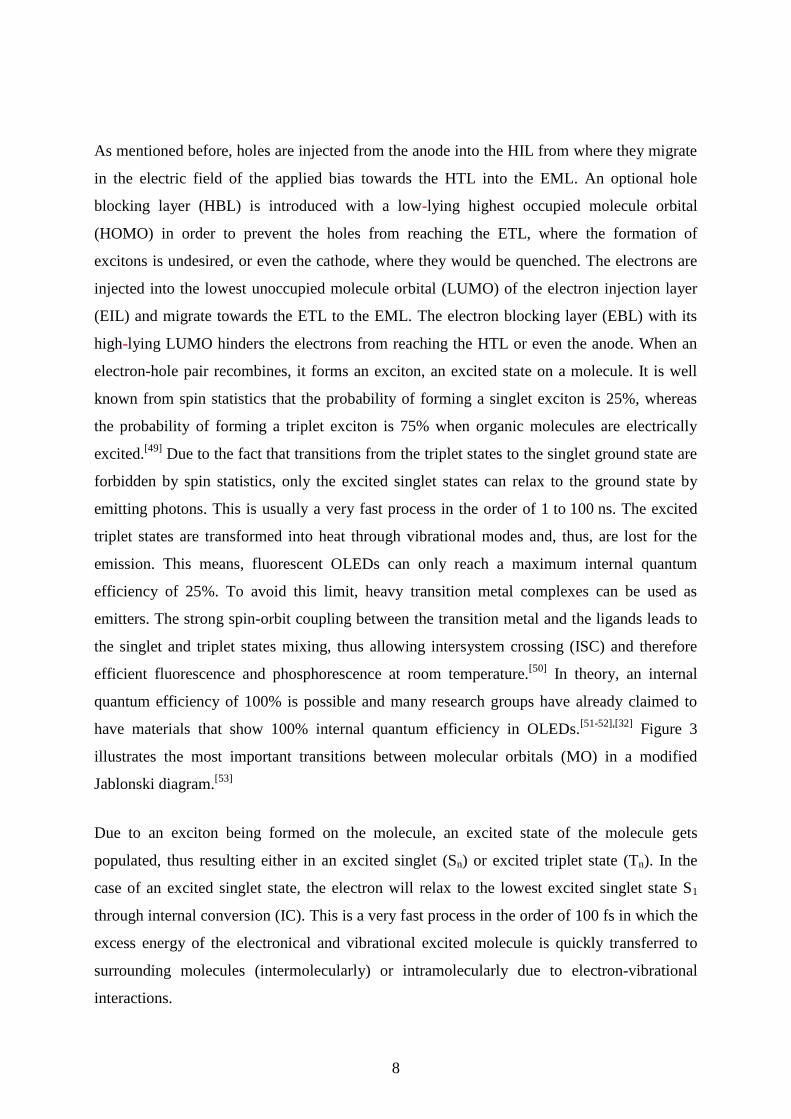


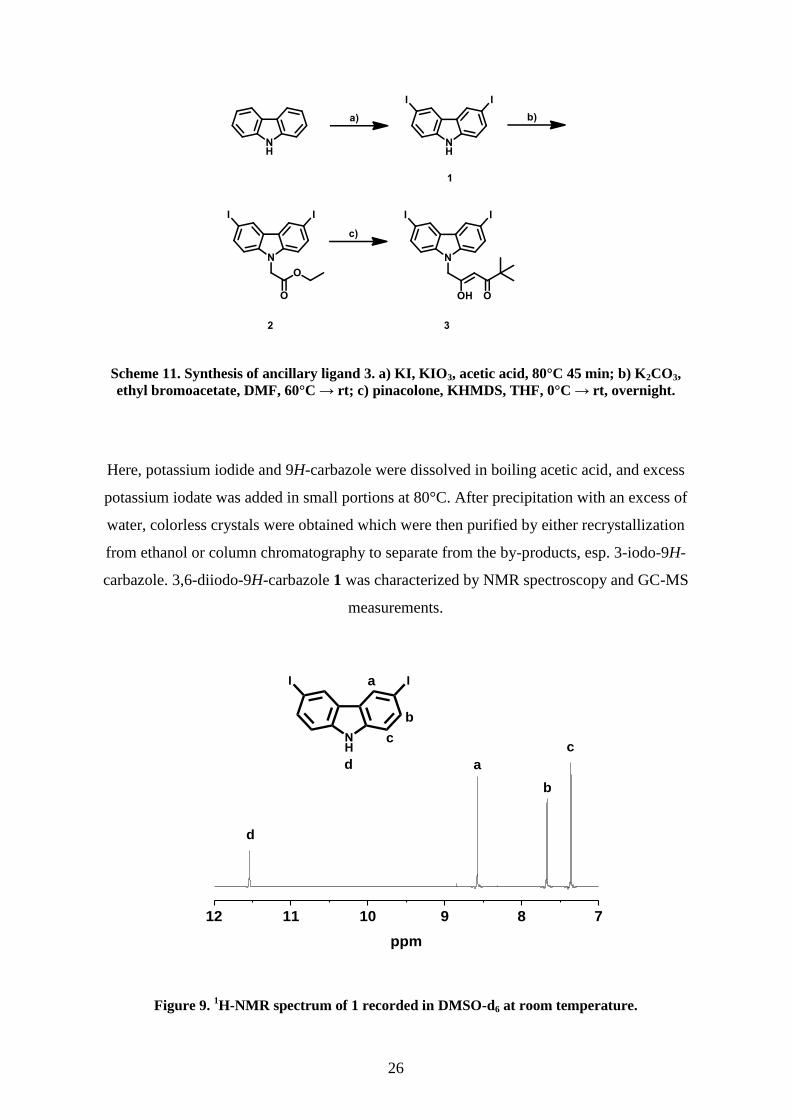
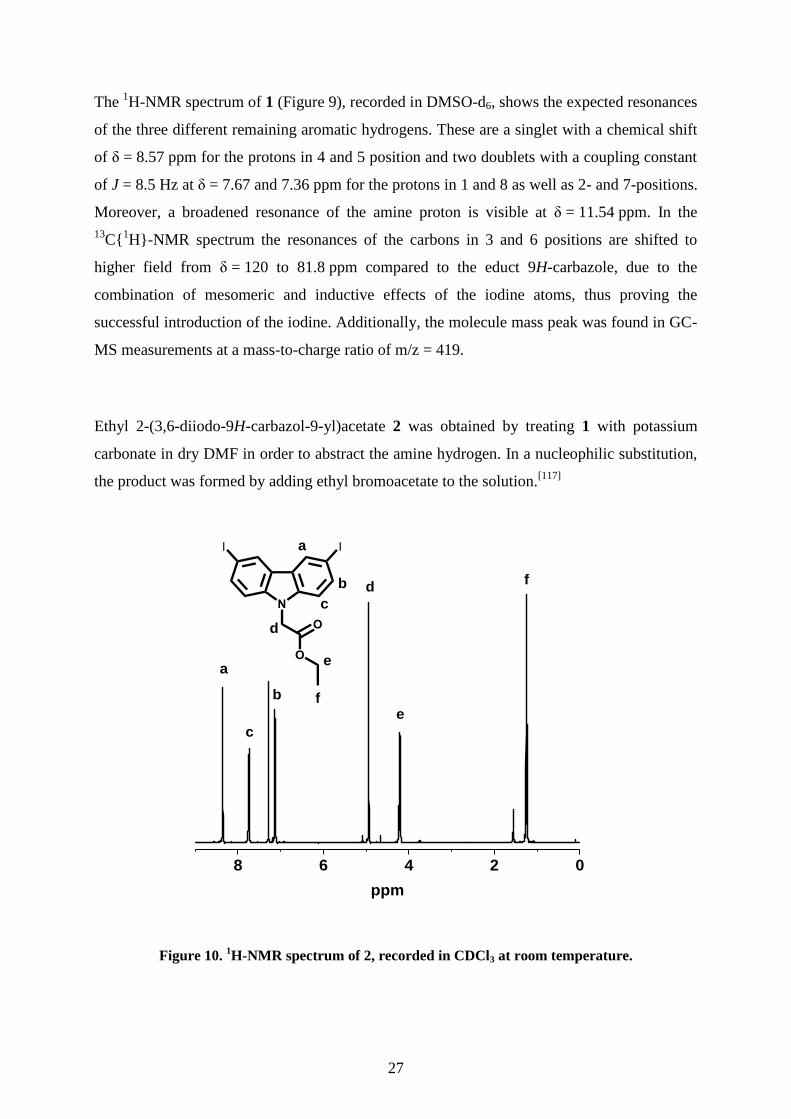


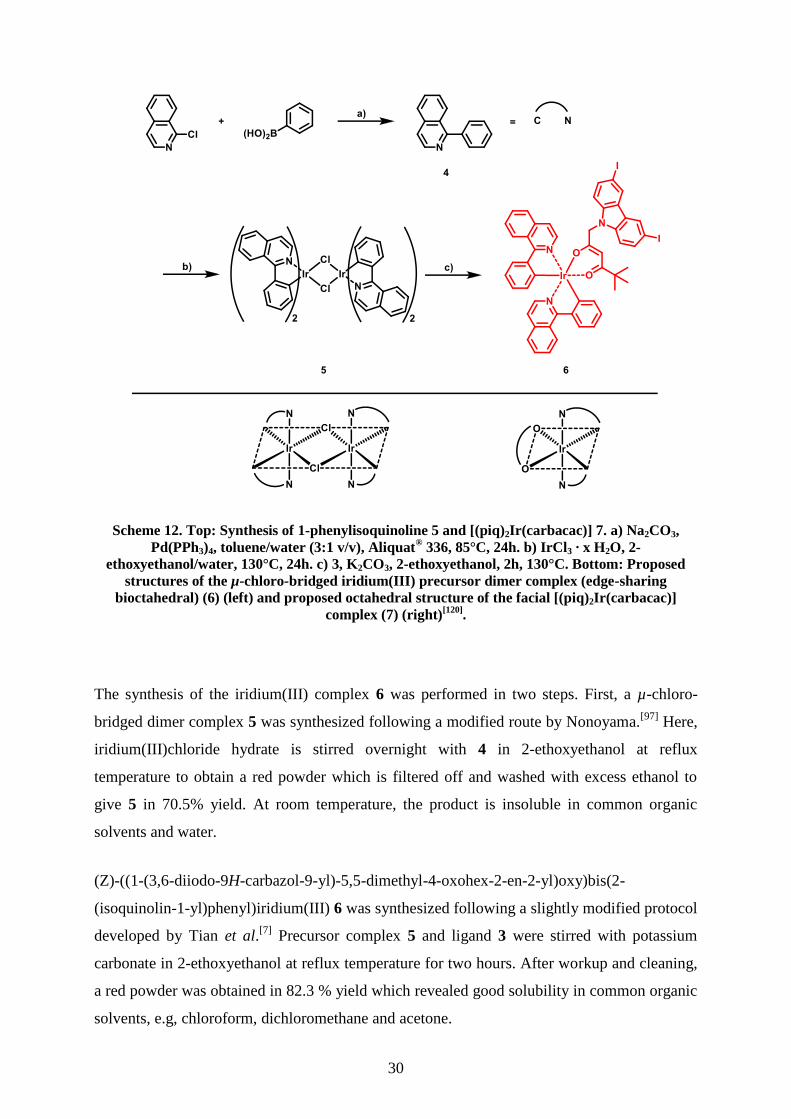


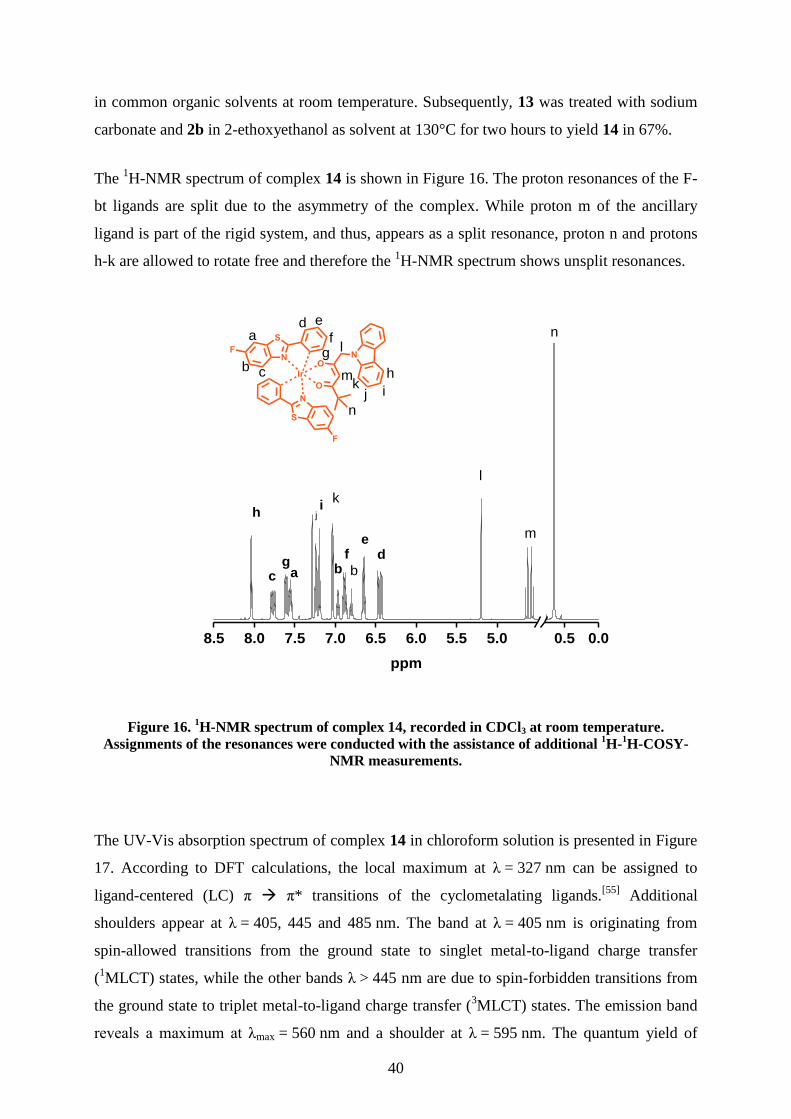

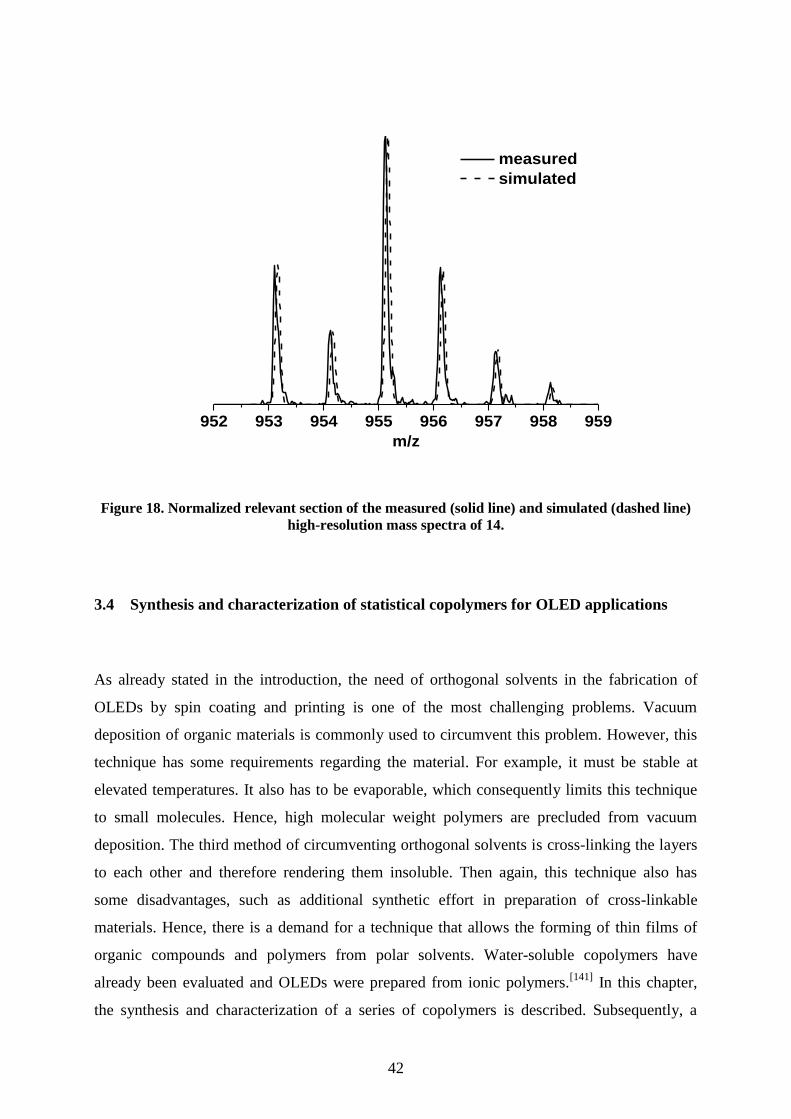
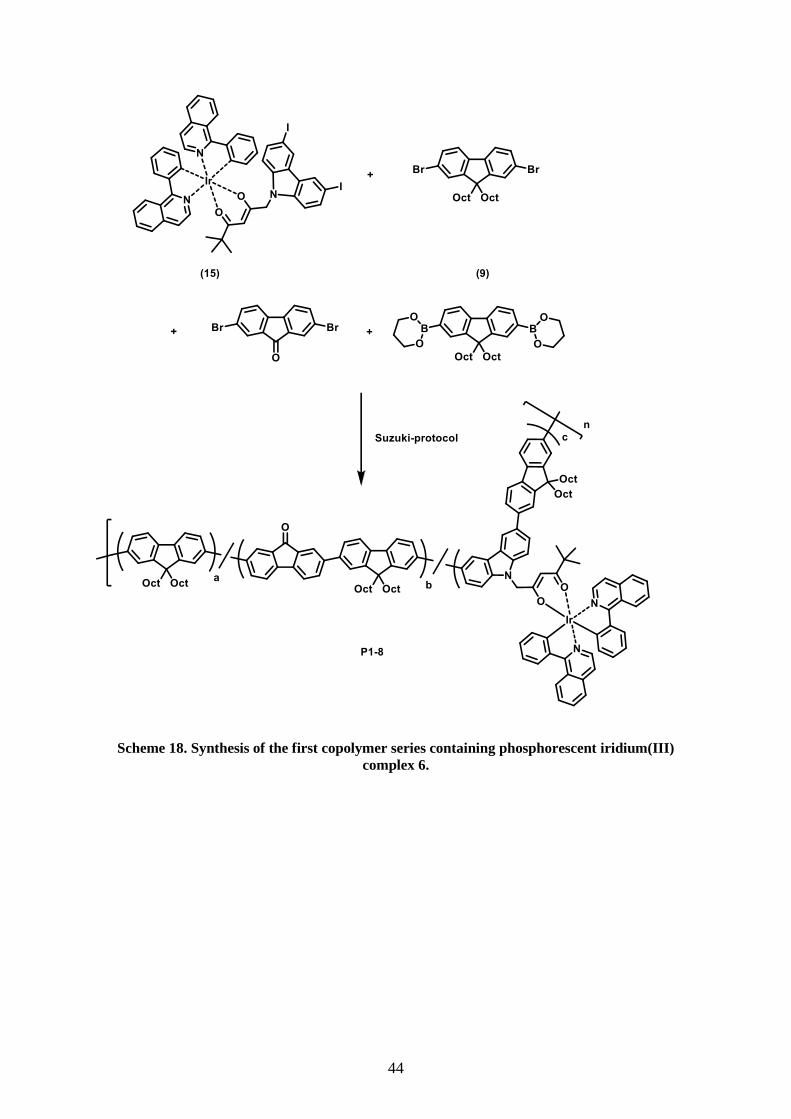
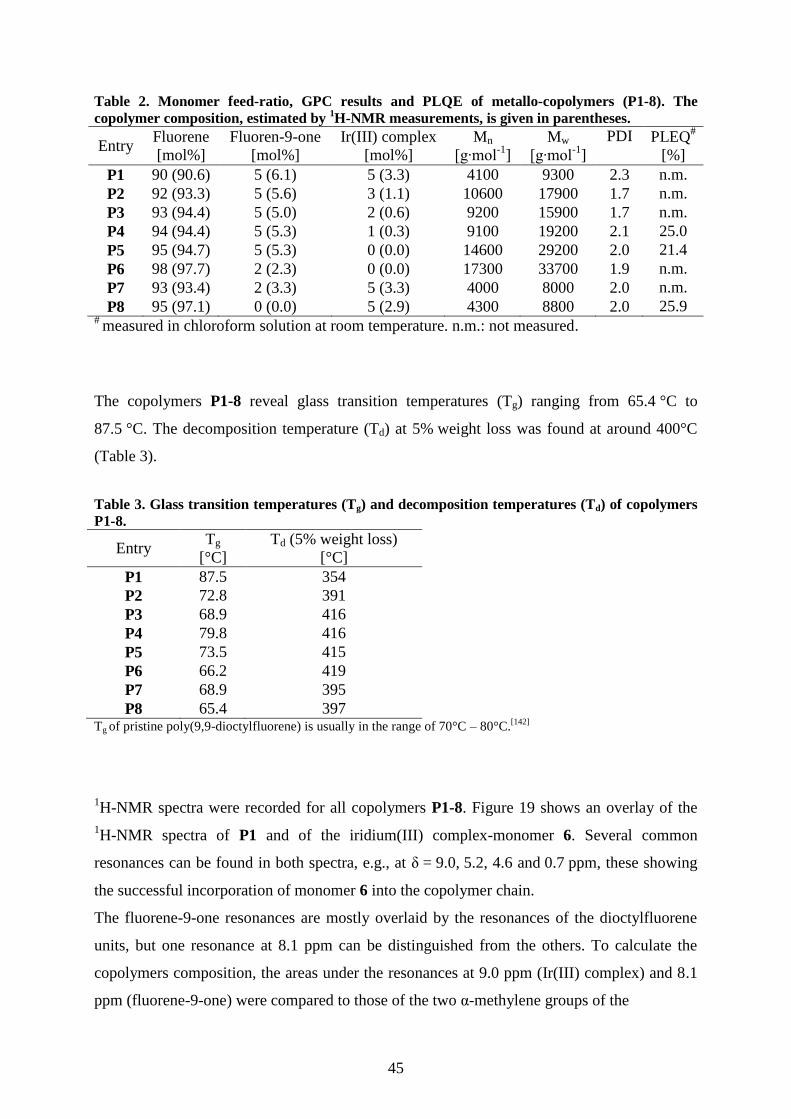

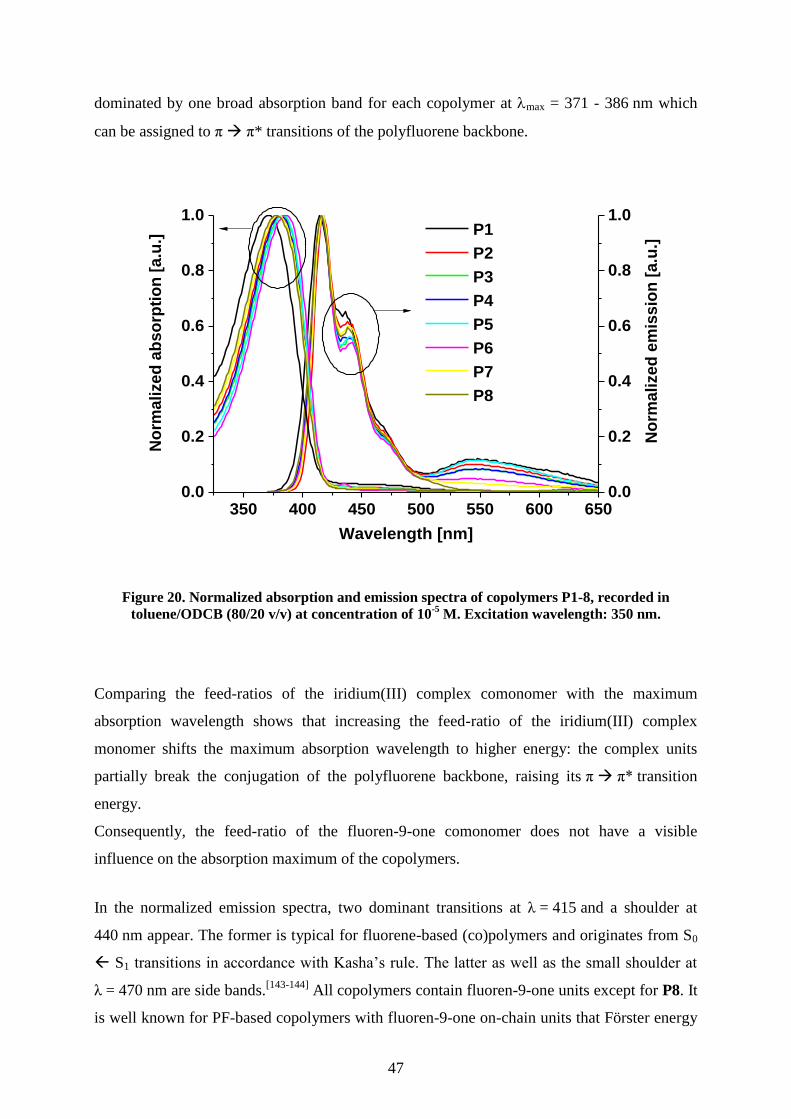


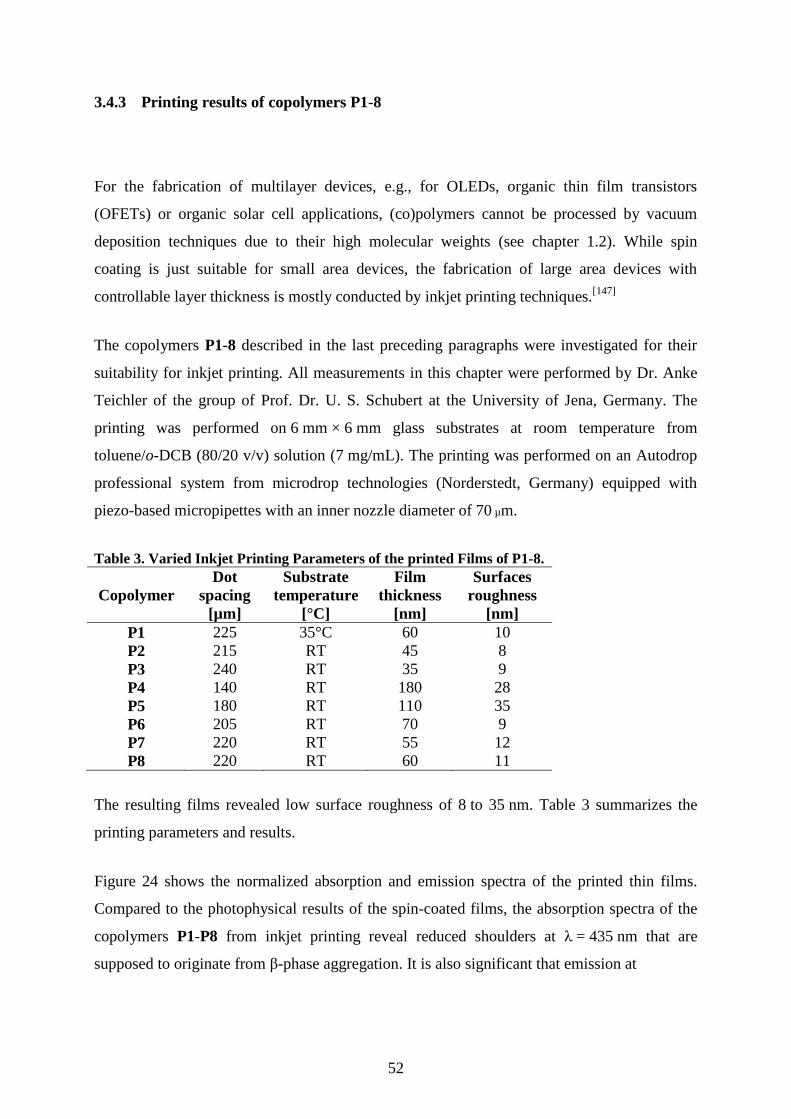
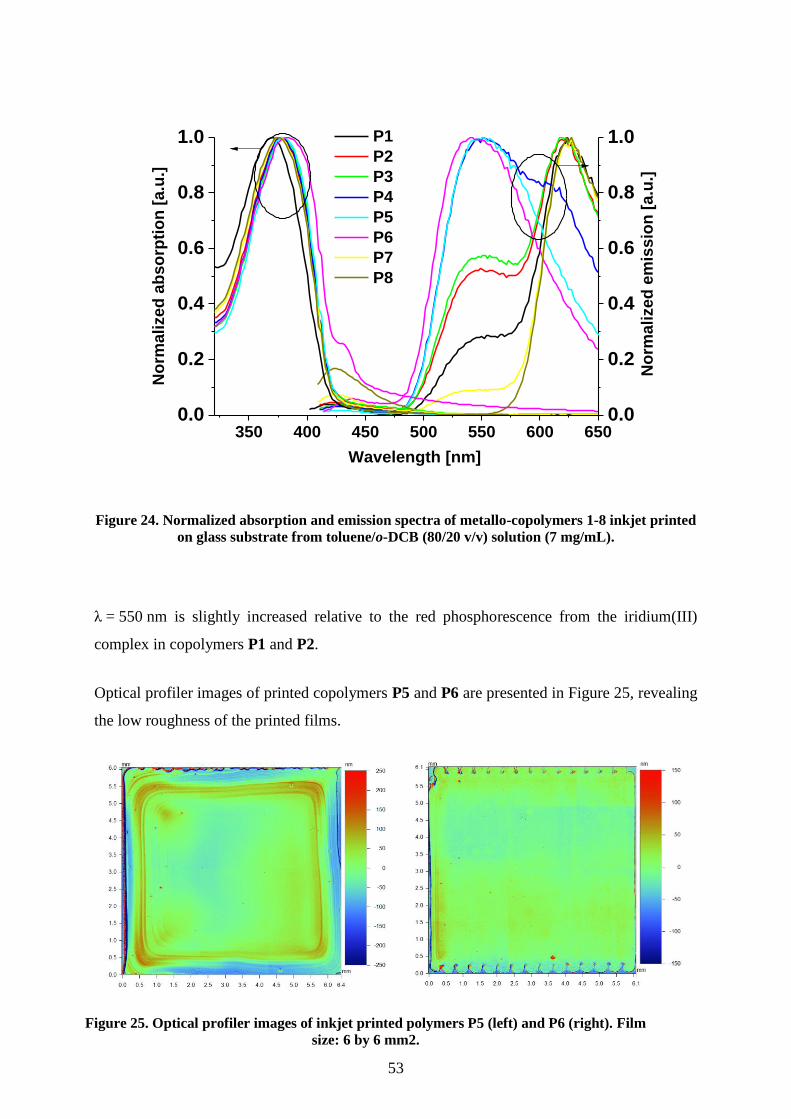


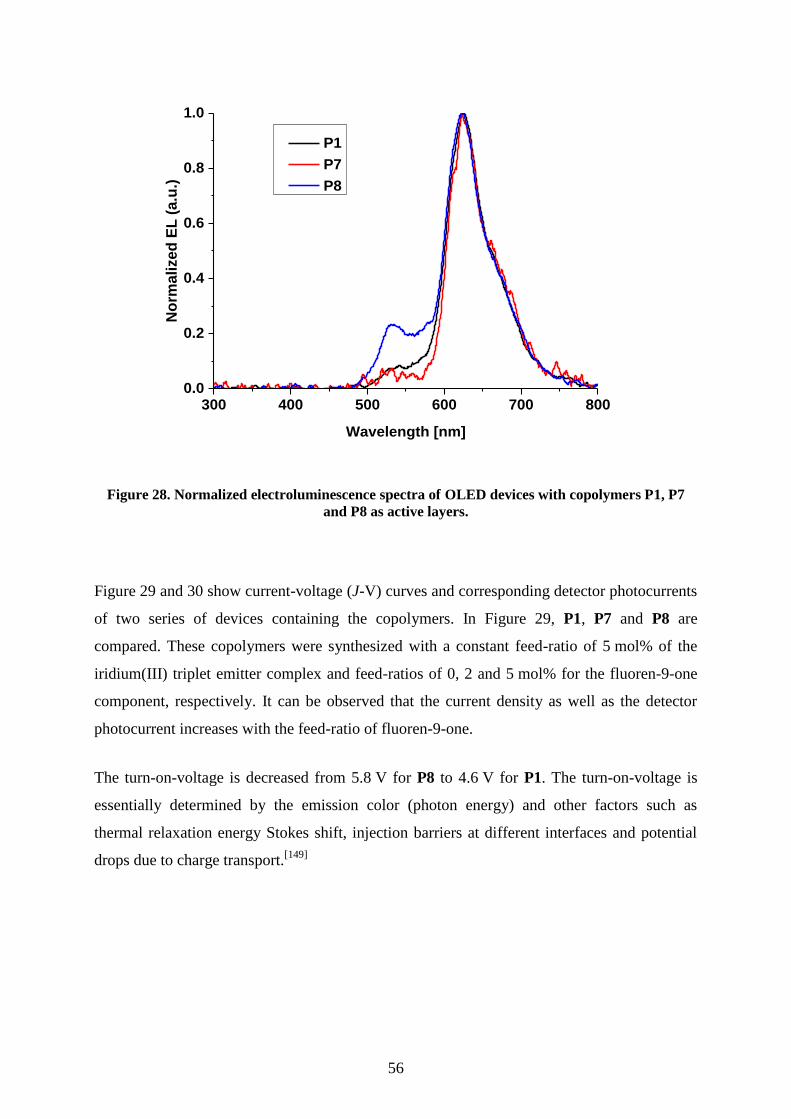


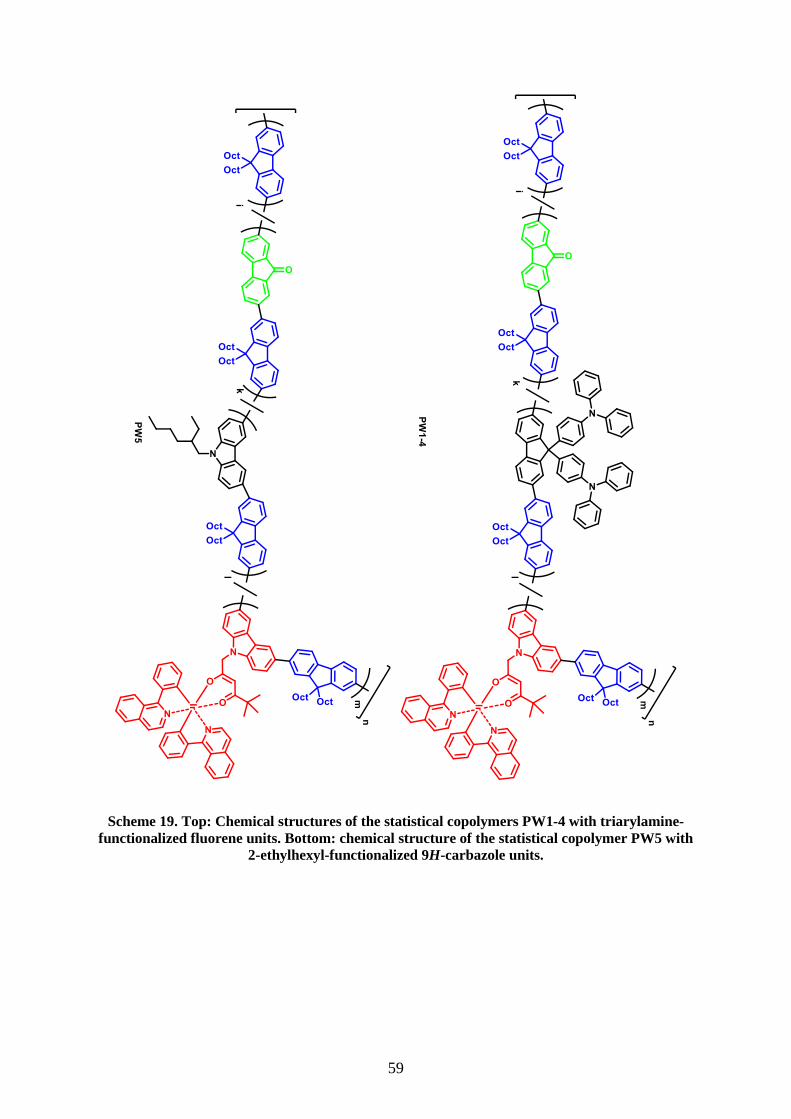


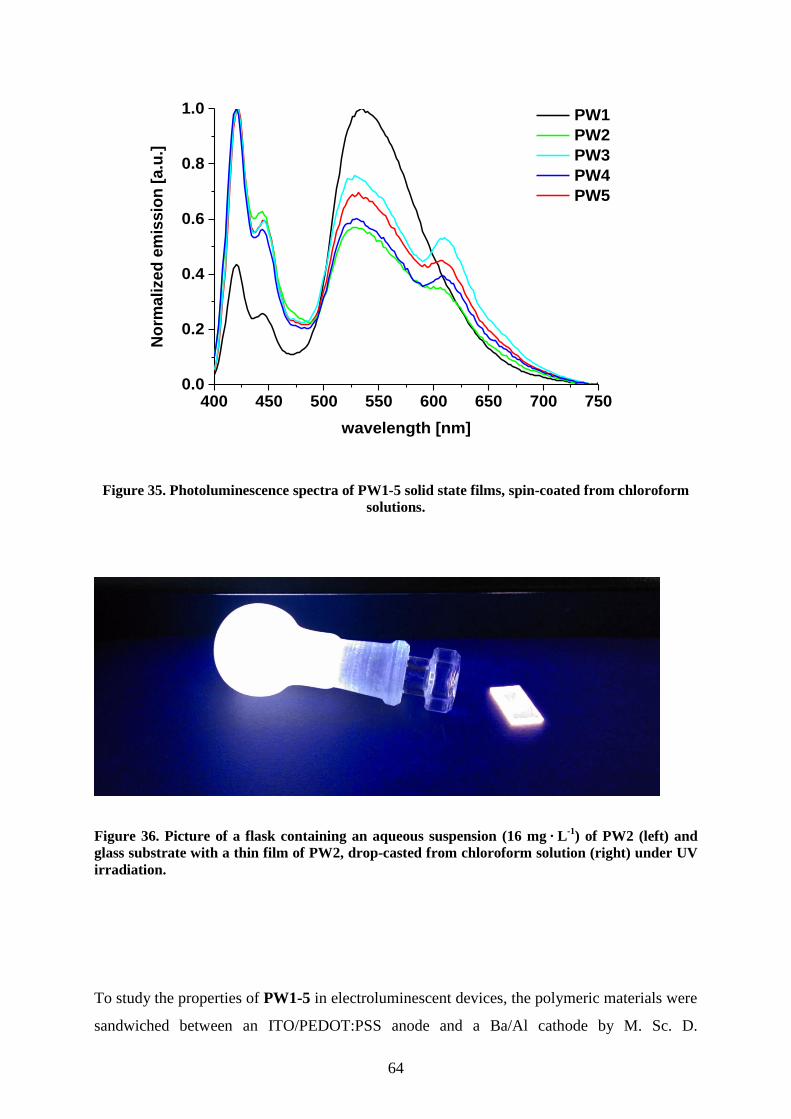


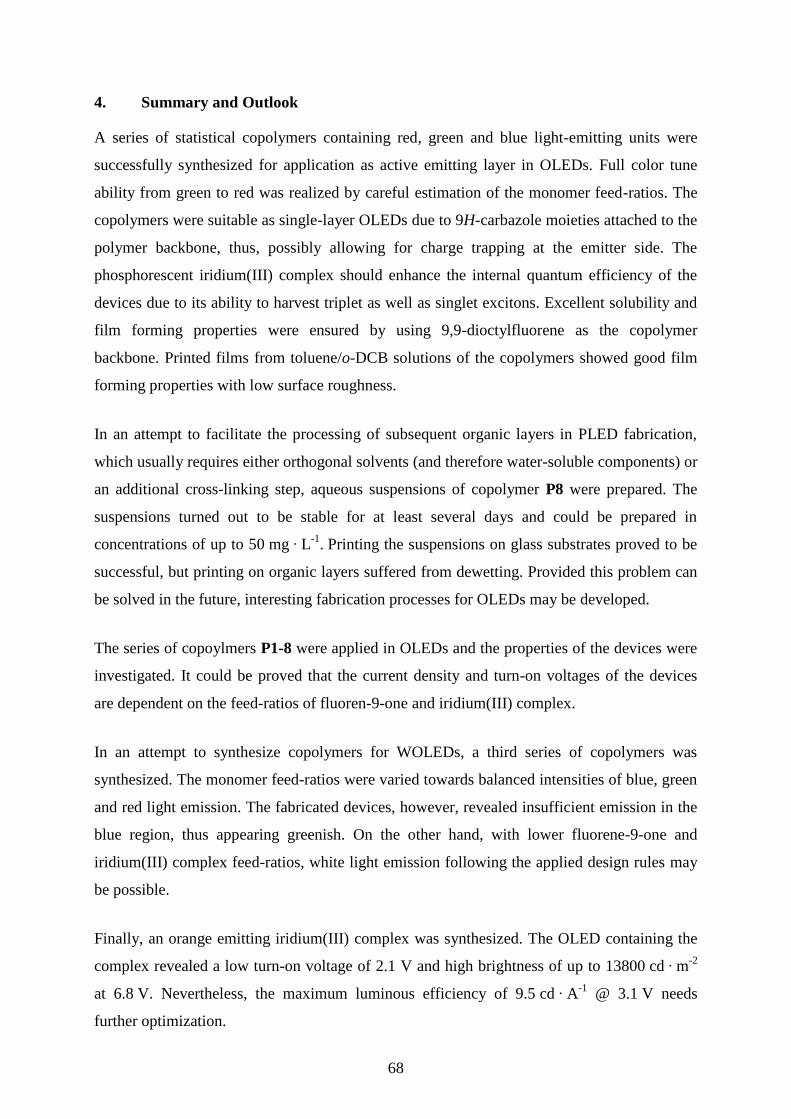


![URANIUM - National Film Board of Canada1].pdf · alpha emitters are the least harmful while gamma emitters are more dangerous than beta emitters. Inside the body, however, alpha emitters](https://static.documents.pub/doc/80x56/604a60e06cb0dd2c8f04d503/uranium-national-film-board-of-1pdf-alpha-emitters-are-the-least-harmful-while.jpg)