Light, medium or strong? Different solutions for different needs HSBC Managed Solutions (An open ended Fund of Funds Scheme) New Fund Offer: 09 April to 23 April 2014 A need-based investment solution that helps you meet your financial goals
Transcript
Light,
medium
or strong?
Different solutions for different needs
HSBC Managed Solutions (An open ended Fund of Funds Scheme)
New Fund Offer: 09 April to 23 April 2014
A need-based investment solution that helps you meet your financial goals
Why invest?
3
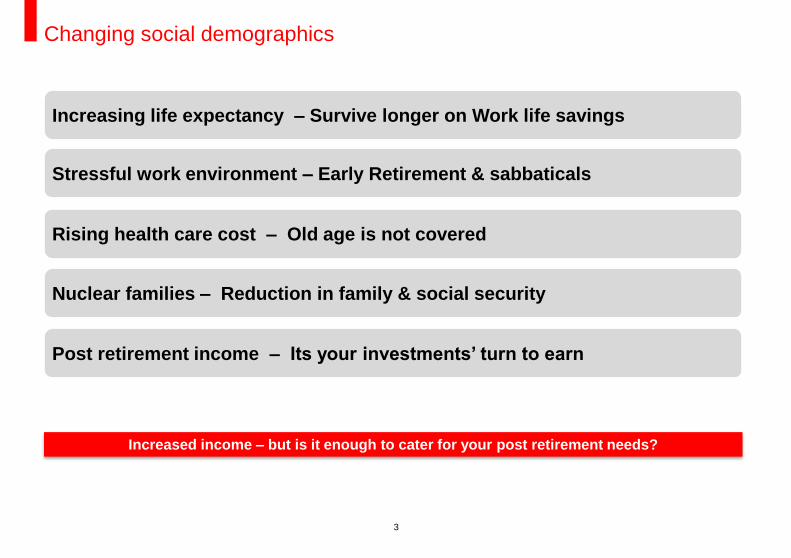
Changing social demographics
Increasing life expectancy – Survive longer on Work life savings
Post retirement income – Its your investments’ turn to earn
Stressful work environment – Early Retirement & sabbaticals
Rising health care cost – Old age is not covered
Nuclear families – Reduction in family & social security
Increased income – but is it enough to cater for your post retirement needs?
4
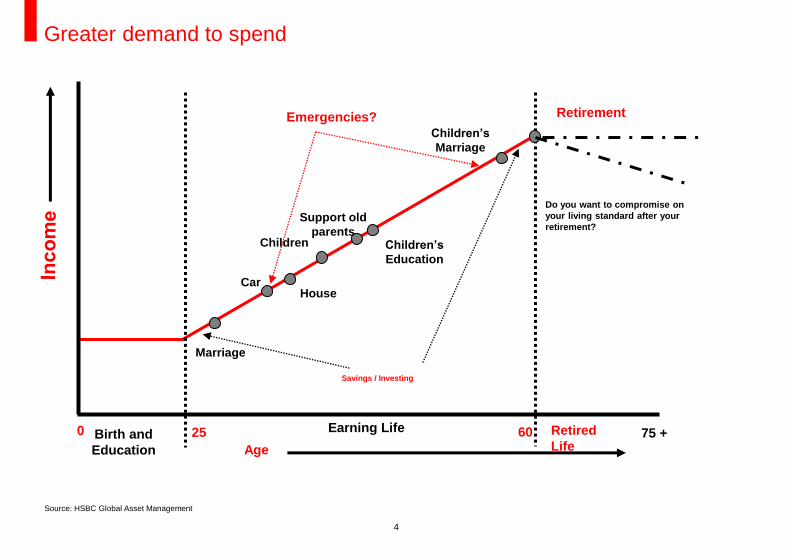
Source: HSBC Global Asset Management
Greater demand to spend
Birth and
Education
0 25 60 Earning Life 75 + Retired
Life
Marriage
House
Children’s
Education
Children’s
Marriage
Retirement
Age
Do you want to compromise on
your living standard after your
retirement?
Emergencies?
Car
Children
Savings / Investing
Support old
parents
5
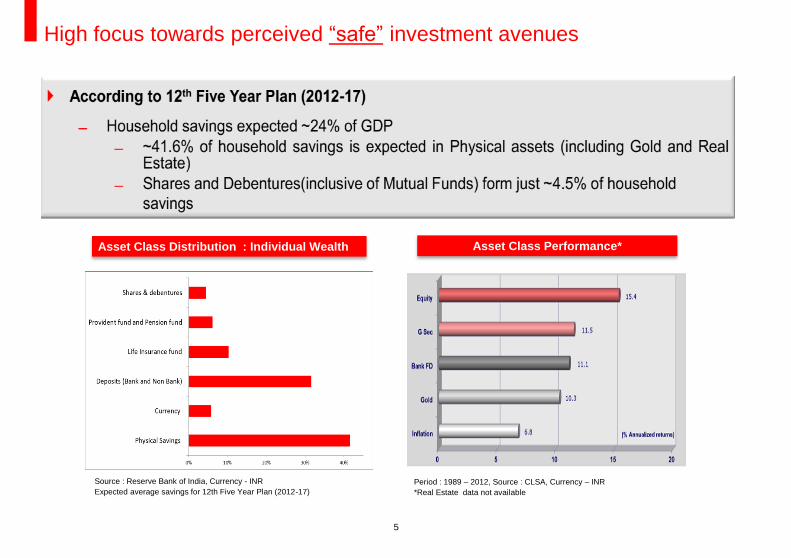
Source : Reserve Bank of India, Currency - INR
Expected average savings for 12th Five Year Plan (2012-17)
High focus towards perceived “safe” investment avenues
Asset Class Performance* Asset Class Distribution : Individual Wealth
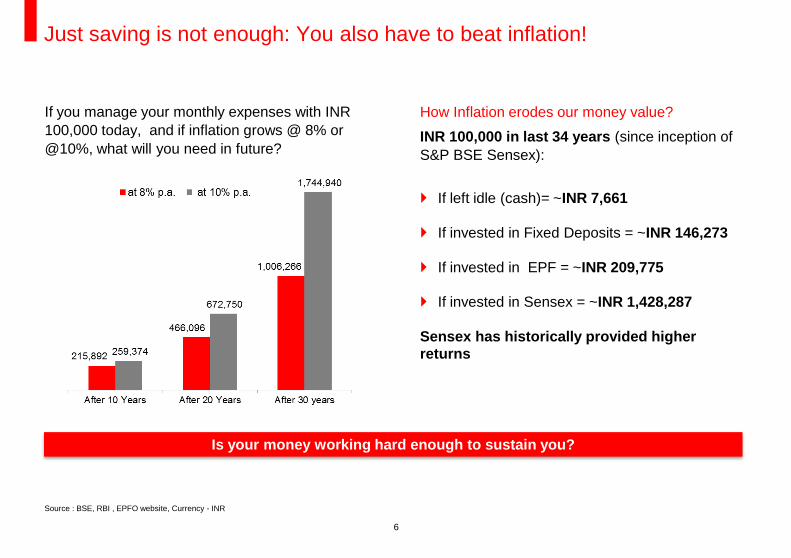
Just saving is not enough: You also have to beat inflation!
How Inflation erodes our money value?
INR 100,000 in last 34 years (since inception of
S&P BSE Sensex):
If left idle (cash)= ~INR 7,661
If invested in Fixed Deposits = ~INR 146,273
If invested in EPF = ~INR 209,775
If invested in Sensex = ~INR 1,428,287
Sensex has historically provided higher
returns
Is your money working hard enough to sustain you?
7
Inflation : A real threat
Prepare for retirement while we earn and more importantly while we can
Enhance our purchasing power instead of protecting current value
Why invest - Takeaways
Where to invest?
9
Gold: Allocate in moderation
Can be volatile
Real Estate
Project delays
Title issues
Liquidity concerns
Commodities: Regulations still evolving
Not fully understood by retail investors
Alternative Investments: Means to diversify
So how do we go about investing?
10
It is “ too risky”
“Led by Foreign Institutional Investors (FII) and speculators”
“We have lost money in equities”
“We have not seen the markets provide positive returns over last 5 years”
Equities are a “game changer”
“It is an asset class for the long term”
“Historically, equities have provided 15.4% compounded annualised returns – better than other asset classes” (Source: CLSA: 1989-2012, Currency - INR)
Equities – Different perspectives
Both are right!
11
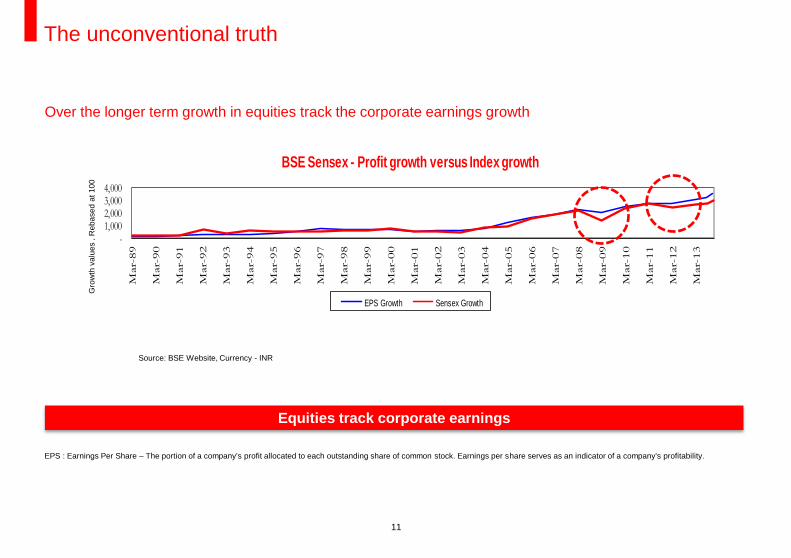
Over the longer term growth in equities track the corporate earnings growth
EPS : Earnings Per Share – The portion of a company's profit allocated to each outstanding share of common stock. Earnings per share serves as an indicator of a company's profitability.
The unconventional truth
Source: BSE Website, Currency - INR
Gro
wth
va
lue
s , R
eb
ase
d a
t 1
00
Equities track corporate earnings
- 1,000 2,000 3,000 4,000
Mar-
89
Mar-
90
Mar-
91
Mar-
92
Mar-
93
Mar-
94
Mar-
95
Mar-
96
Mar-
97
Mar-
98
Mar-
99
Mar-
00
Mar-
01
Mar-
02
Mar-
03
Mar-
04
Mar-
05
Mar-
06
Mar-
07
Mar-
08
Mar-
09
Mar-
10
Mar-
11
Mar-
12
Mar-
13
BSE Sensex - Profit growth versus Index growth
EPS Growth Sensex Growth
12
Likelihood of loss versus duration of investment
You need to give it time
Time in market more important than timing the market
0%
Analysis based on Sensex data since March 1979, as on March 2013, Currency - INR
Source: BSE, HSBC Global Asset Management, India
13
Investor returns depend more on Investor behaviour and risk profile rather than the
market behaviour
Performance chasing syndrome?
Buy the “best performing” asset class
The “best performing” stock
The “best performing” fund
Where is the disconnect?
14
Let us consider the “best performing” markets
Country Equity Performance
Source: Bloomberg
UK
UK
UK
UK
UK
UK
UK
UK
Better
Performing
Worser
Performing
15
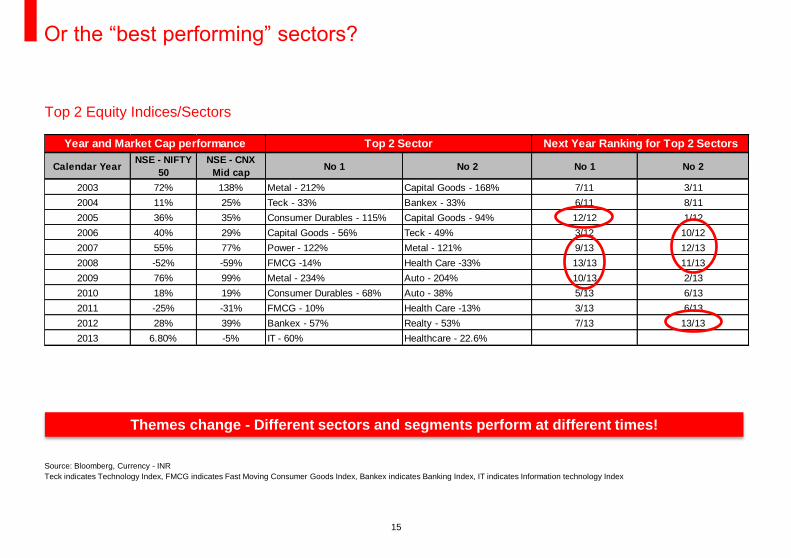
Source: Bloomberg, Currency - INR
Teck indicates Technology Index, FMCG indicates Fast Moving Consumer Goods Index, Bankex indicates Banking Index, IT indicates Information technology Index
Or the “best performing” sectors?
Top 2 Equity Indices/Sectors
Calendar YearNSE - NIFTY
50
NSE - CNX
Mid capNo 1 No 2 No 1 No 2
2003 72% 138% Metal - 212% Capital Goods - 168% 7/11 3/11
2011 -25% -31% FMCG - 10% Health Care -13% 3/13 6/13
2012 28% 39% Bankex - 57% Realty - 53% 7/13 13/13
2013 6.80% -5% IT - 60% Healthcare - 22.6%
Year and Market Cap performance Top 2 Sector Next Year Ranking for Top 2 Sectors
Themes change - Different sectors and segments perform at different times!
16
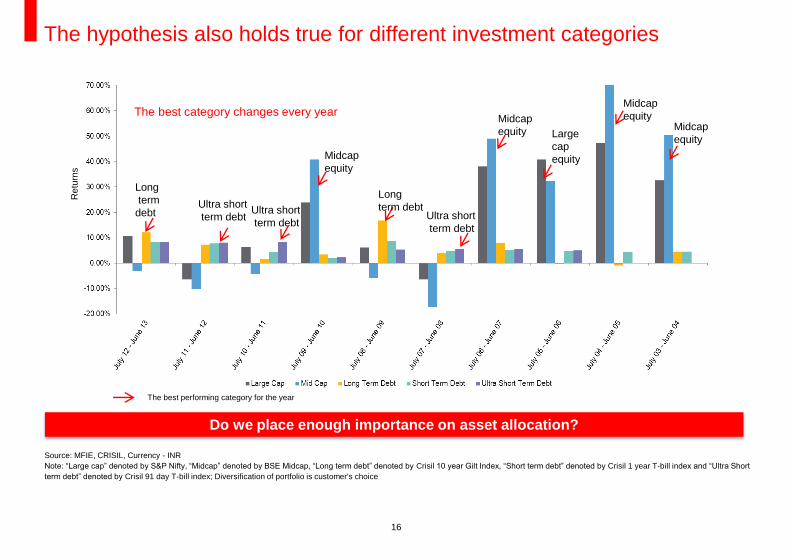
The hypothesis also holds true for different investment categories
Source: MFIE, CRISIL, Currency - INR
Note: “Large cap” denoted by S&P Nifty, “Midcap” denoted by BSE Midcap, “Long term debt” denoted by Crisil 10 year Gilt Index, “Short term debt” denoted by Crisil 1 year T-bill index and “Ultra Short
term debt” denoted by Crisil 91 day T-bill index; Diversification of portfolio is customer's choice
Do we place enough importance on asset allocation?
Ultra short
term debt
Midcap
equity Midcap
equity Large
cap
equity
Midcap
equity
Long
term debt
Midcap
equity
Ultra short
term debt
Ultra short
term debt
Long
term
debt
The best category changes every year
Retu
rns
The best performing category for the year
Is there a solution that we can consider?
18
Factors that explain variation between portfolio performances
Source: Brinson et al, 1986
Asset allocation: Key determinant of portfolio returns
Most time spent on the 6% viz. security selection, market timing
19
Multi-asset portfolios spread investments both across asset classes and across geographies
Ensures that the portfolio does not become over-reliant on a single asset class or a single country or
sector
Asset classes typically have a low correlation - combining assets with low correlations helps reduce
overall portfolio volatility
Low Correlation between various investment segments (2003-14)
Why should we consider multi-asset portfolios?
Period : 1 April 2003 to 31 January 2014, Source: CRISIL, BSE, Bloomberg
Large Cap denoted by BSE Sensex, Long Term Debt denoted by CRISIL Composite Bond Fund Index, Mid cap denoted by BSE Midcap
Index, Short Term Debt denoted by CRISIL Short Term Bond Fund Index, Offshore Equity denoted by MSCI World Index
Correlation Coefficient Large Cap Long Term Debt Midcap Short Term Debt Offshore Equity Gold
Large Cap 1.00 0.22 0.89 0.17 0.45 -0.01
Long Term Debt 0.22 1.00 0.25 0.89 0.03 -0.02
Midcap 0.89 0.25 1.00 0.17 0.45 0.03
Short Term Debt 0.17 0.89 0.17 1.00 -0.02 0.03
Offshore Equity 0.45 0.03 0.45 -0.02 1.00 0.02
Gold -0.01 -0.02 0.03 0.03 0.02 1.00
20
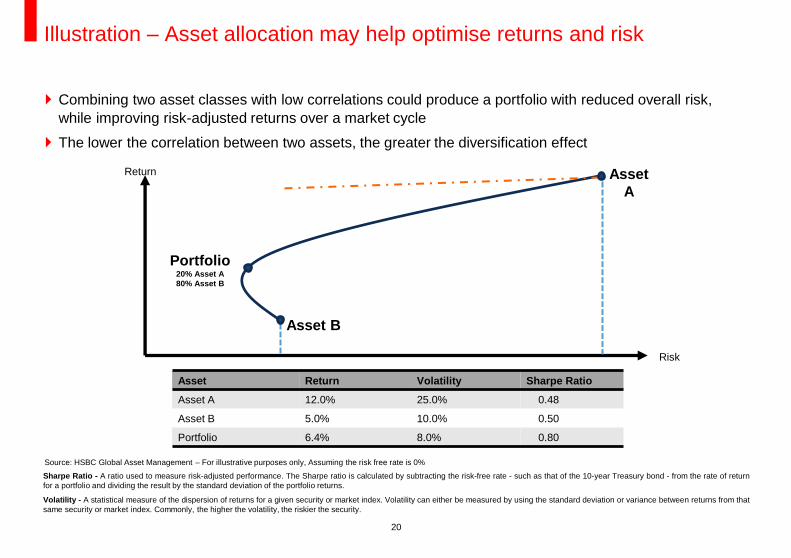
Combining two asset classes with low correlations could produce a portfolio with reduced overall risk,
while improving risk-adjusted returns over a market cycle
The lower the correlation between two assets, the greater the diversification effect
Source: HSBC Global Asset Management – For illustrative purposes only, Assuming the risk free rate is 0%
Illustration – Asset allocation may help optimise returns and risk
Risk
Asset
A
Asset B
Return
Portfolio 20% Asset A
80% Asset B
Asset Return Volatility Sharpe Ratio
Asset A 12.0% 25.0% 0.48
Asset B 5.0% 10.0% 0.50
Portfolio 6.4% 8.0% 0.80
Sharpe Ratio - A ratio used to measure risk-adjusted performance. The Sharpe ratio is calculated by subtracting the risk-free rate - such as that of the 10-year Treasury bond - from the rate of return
for a portfolio and dividing the result by the standard deviation of the portfolio returns.
Volatility - A statistical measure of the dispersion of returns for a given security or market index. Volatility can either be measured by using the standard deviation or variance between returns from that
same security or market index. Commonly, the higher the volatility, the riskier the security.
21
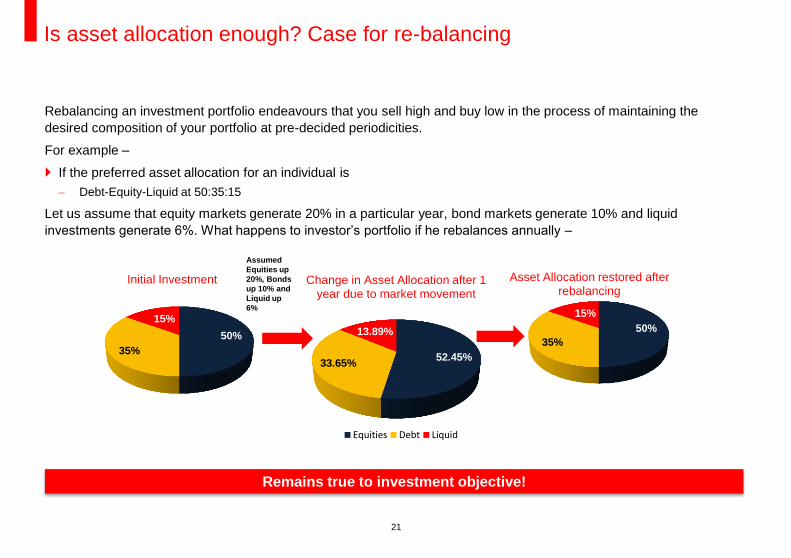
Rebalancing an investment portfolio endeavours that you sell high and buy low in the process of maintaining the
desired composition of your portfolio at pre-decided periodicities.
For example –
If the preferred asset allocation for an individual is
Debt-Equity-Liquid at 50:35:15
Let us assume that equity markets generate 20% in a particular year, bond markets generate 10% and liquid
investments generate 6%. What happens to investor’s portfolio if he rebalances annually –
Is asset allocation enough? Case for re-balancing
50%
35%
15%
Initial Investment
52.45% 33.65%
13.89%
Change in Asset Allocation after 1 year due to market movement
Equities Debt Liquid
50%
35%
15%
Asset Allocation restored after rebalancing
Assumed
Equities up
20%, Bonds
up 10% and
Liquid up
6%
Remains true to investment objective!
Can we dynamically allocate assets in keeping with the
investment objective?
HSBC Managed Solutions
24
Multi asset (Domestic and Offshore Equity, Fixed Income, Liquid and Gold) portfolios
which are actively managed
Constructed to optimize returns whilst managing risk
Offers transactional efficiency to the investor
A unique investment solution for Indian investors
HSBC Managed Solutions: A wealth imperative
25
An Investment Solution
Designed to meet the needs and preferences of investors
Considers investors' risk profile and deliver solutions to meet investment goals
Uses active asset allocation to achieve optimal mix
Fund of Funds (FOF) feeding into HSBC/Third Party funds*
Merits
Risk Profile based Asset allocation Buckets
Supports long term Goal Based Investment Planning
Risk aware investment experience matched to customer needs