Light-powered autonomous and directional molecular motion based on a dissipative self-assembling system
Giulio Ragazzon, Massimo Baroncini, Serena Silvi, Margherita Venturi and Alberto Credi*
Supplementary Information
Table of Contents
1. General Methods Page S2
2. NMR Spectroscopy S8
3. UV-Visible Spectroscopy S9
4. References S21
Light-powered autonomous and directional molecular motion of a dissipative self-assembling
system
SUPPLEMENTARY INFORMATIONDOI: 10.1038/NNANO.2014.260
NATURE NANOTECHNOLOGY | www.nature.com/naturenanotechnology 1
© 2014 Macmillan Publishers Limited. All rights reserved.
S2
1. General Methods
Materials and Characterization Methods. Compound 1 was synthesized according to previously
published procedures 1 . Compounds E-2+, 3+ and EE-4+ were available from previous
investigations2. Solvents were dried according to literature procedures. The 1H and 13C NMR
spectra were recorded at 298 K in CD2Cl2 with a Varian Mercury 400 spectrometer with the
deuterated solvent as the lock and the residual solvent as the internal standard.
UV-Visible Spectroscopy and Photochemistry. Absorption spectra were recorded with a Varian
Cary 50Bio, Agilent Technologies Cary 300 and Perkin Elmer Lambda45 spectrophotometers, on
air equilibrated CH2Cl2 (Romil) solutions at room temperature (ca. 20°C), with concentrations
ranging from 1×10⁻⁵ to 1×10⁻³ M. Solutions were examined in 1-cm spectrofluorimetric quartz
cells. Dedicated spectrophotometric cells endowed with two compartments separated by a quartz
wall were employed for a careful determination of the sum of the absorption spectra of the
separated components (unmixed solutions) and the absorption spectrum of their complex (mixed
solutions). The experimental error on the wavelength values was estimated to be ±1 nm.
Photochemical reactions were performed on CH2Cl2 solutions at room temperature (ca. 20°C),
thoroughly stirred and eventually argon-purged (if irradiated for more than typically 1 h), by using a
Hanau Q400 or Helios Italquartz Polymer 125 medium pressure Hg lamp (respectively 150 and 125
W); 1H NMR photochemical isomerization experiments were performed in air equilibrated CD2Cl2
solutions irradiated directly inside the NMR tube. The selection of the desired irradiation
wavelength (287, 365 or 436 nm) was accomplished by the use of an appropriate interference filter.
The number of incident photons, determined by ferrioxalate actinometry in its micro version3, was
2.4×10⁻⁸ Einstein min–1 at 287 nm, 1.0×10⁻⁷ Einstein min–1 at 365 nm, and 2.4×10⁻⁷ Einstein min–1
at 436 nm. The E→Z photoisomerization quantum yield (λirr= 365 nm) was determined from the
disappearance of the ππ* absorption band of the azobenzene unit of the reactant at low conversion
percentages (<10%; extrapolation to t=0 was made). The fraction of light transmitted at the
irradiation wavelength was taken into account in the calculation of the yields. The experimental
error on the quantum yield values was estimated to be ±10%.
UV-Visible Spectroscopic Measurements. Reaction kinetic profiles were collected on air-
equilibrated CH2Cl2 (Romil) solutions at 20°C. Threading processes were investigated by
monitoring the time-dependent spectroscopic changes observed after addition of a concentrated
(typically mM) solution of the axle to a more diluted ring solution. Dethreading reactions were
triggered by dilution and were studied by monitoring the time-dependent spectroscopic changes
observed after rapid mixing of the investigated complex with the solvent. Thermal Z→E
© 2014 Macmillan Publishers Limited. All rights reserved.
S3
isomerization reactions were performed at 20°C in the dark, monitoring the time-dependent
absorption changes with a spectrophotometer. In all cases the data were elaborated by means of the
SPECFIT fitting program4. Threading processes were modeled according to a mixed-order scheme,
that is, second order (threading) and first order (dethreading) opposing reactions (equation S1)
1 + Guest [1⊃Guest] (S1)
Dethreading processes and thermal Z→E isomerization reactions were modelled according to first-
order kinetics. The values reported in Table 1 are typically an average of at least 3 independent
experiments. The estimated experimental error for kin values is ±20%; consequently, the error on the
threading energy barriers is δΔG‡in ≈ RT δkin/kin = 0.20RT ≈ 0.12 kcal mol–1 at 20°C. As for the
dethreading rate constants, δkout/kout = [(δkin/kin)2 + (δK/K)2]½ ≈ ±30%; the error on the dethreading
energy barriers is δΔG‡out ≈ RT δkout/kout = 0.30RT ≈ 0.18 kcal mol–1 at 20°C.
Spectroscopic titrations. Stability constants were determined from titration curves obtained by
measuring the luminescence intensity of 1 (λexc = 272 nm) upon addition of small aliquots of a
concentrated solution of the considered guest to 2.5 mL of a dilute solution (typically, 50 µM) of 1
in CH2Cl2 at 20°C. To minimize inner filter effects, the emission detection was performed on
isosbestic point (390 nm). In the case of the [1⊃3]+ complex, the absorbance changes at 325 nm
were used to obtain the binding isotherm, because the luminescence intensity of 1 is not affected by
addition of 3+. In all cases the constants were calculated by means of the SPECFIT fitting program
according to a 1:1 binding model4. The estimated experimental error on K values is ±20%;
consequently, the error on the free energy change values is δΔG° ≈ RT δK/K = 0.20RT ≈ 0.12 kcal
mol–1 at 20°C.
Microscopic reversibility considerations. For a square network of chemical reactions such as that
represented in Fig. S1, microscopic reversibility imposes that when the cycle is at thermodynamic
equilibrium each individual process must be equilibrated and its net rate must be zero (v1 = v2 = v3 =
v4 = 0). The equilibrium constant of reaction A!B must correspond to the product of the
equilibrium constants of reactions A!D, D!C and C!B. In other words, K1 = K4 × K3 × 1/K2, or
K1/K3 = K4/K2 (S2)
It should be noted that equation (S2) is not strictly valid when photochemical reactions are involved,
as microscopic reversibility does not apply. However, the observation of a behaviour deviating from
kin
kout
© 2014 Macmillan Publishers Limited. All rights reserved.
S4
equation (S2) for the cycle shown in Fig. 3 (or Fig. S2 below) can be taken as an experimental
evidence that the system does not fulfil detailed balance.
Supplementary Fig. 1. Square cycle consisting of four chemical equilibria. The indicated parameters refer
to the reactions read from left to right and from top to bottom. Detailed balance states that, at equilibrium, all
net rates are zero.
Kinetic modelling. The modelling of the kinetic behaviour of the system was performed by means
of the SPECFIT software4. The mechanism used to simulate the experimental behaviour is depicted
in Fig. S2 below and corresponds to that shown in Fig. 3.
Supplementary Fig. 2. Kinetic scheme used to simulate the experimental behaviour. Photo and thermal
Z→E isomerization processes - here shown as separate processes for clarity - will be modelled by a single
cumulative rate constant (see text for details).
Indexes f and c denote free and complexed axles, respectively, whereas hν and Δ indicate
photoisomerization and thermal isomerization reactions, respectively. The threading and
dethreading processes are modelled as bimolecular and unimolecular processes, respectively; the
© 2014 Macmillan Publishers Limited. All rights reserved.
S5
corresponding rate constants are second-order (kin) and first-order (kout) constants. Z→E Thermal
isomerization processes (Δ) are unimolecular processes. Under the employed experimental
conditions (irradiation with monochromatic light and low absorbance at the irradiation wavelength),
photoisomerization reactions (hν) can be treated as unimolecular processes. In fact, the
photoisomerization quantum yield is expressed as:
νhNVCΔ
−=Φ (S3)
in which ΔC is the concentration change corresponding to the disappearance of the reactant (e.g.,
the E form for the E→Z photoisomerization) in a given time interval, V is the volume of the
irradiated sample and Nhν is the number of photons absorbed by the reactant in the same time
interval. Such a number is the product of the photon flow (Fhν), the fraction of light absorbed at the
irradiation wavelength (ℑirr) and the time interval (Δt):
N hν = Fhν ℑirr Δt = Fhν (1−10−Airr ) Δt (S4)
The exponential term in equation (S4) can be expanded and, if the absorbance at the irradiation
wavelength is reasonably low (typically <0.1), orders higher than 1 can be neglected5. Hence,
N hν ≈ Fhν Airr Δt = Fhν εirrb C Δt (S5)
in which εirr, b and C are the molar absorption coefficient of the reactant at the irradiation
wavelength, the optical path length and the reactant concentration. Substitution in equation (S3)
yields equation (S6):
Φ = −ΔC V
Fhνεirrb C Δt (S6)
which, after rearrangement, results in equation (S7).
−ΔCΔt
=Φ Fhν εirrb C
V= k C (S7)
© 2014 Macmillan Publishers Limited. All rights reserved.
S6
showing that the photoreaction obeys a first order kinetic law.
The values of the parameters related to chemical equilibria used in the simulation correspond to the
experimental ones reported in Table 1 and Table S1. The apparent first-order rate constant for the
E→Z photoisomerization processes of the free (kfE,hν) and complexed (kcE,hν) axles were estimated
from the photoisomerization quantum yield (determined from photochemical experiments), the
photon flow (Einstein s–1, measured by chemical actinometry), the molar absorption coefficient
(determined from the absorption spectra), the irradiated volume (3 mL) and the optical path length
(1 cm), according to equation (S7). They resulted to be kfE,hν = 1.5×10⁻³ s–1 and kcE,hν = 1.8×10⁻³ s–1.
Upon optimization of the fitting, the value of kfE,hν was adjusted to 1.6×10⁻³ s–1 (well within
experimental error). The cumulative apparent first-order rate constant of the Z→E photochemical
and thermal isomerization processes (e. g., for the free axle, kfZ = kZ,hν + kfZ,Δ) were estimated from
the composition of the photostationary state, taking advantage of equation (S8) valid at the PSS6:
εEΦE→Z
εZΦZ→E
=[Z ]PSS[E ]PSS
(S8)
Combination with equation (S7) yields
kfE ,hνkfZ
=[Z -2+]PSS[E -2+]PSS (S9)
kcE ,hνkcZ
=[1⊃ Z -2+]PSS[1⊃ E -2+]PSS (S10)
The resulting upper limiting values are kfZ < 6.7×10⁻⁵ s–1 and kcZ < 1.8×10⁻⁵ s–1. The thermal Z→E
isomerization rate constants reported in Table S1 are lower limiting values for the same processes.
Upon optimization of the fitting the value of kfZ was adjusted within the experimental error to
8.0×10⁻⁵ s–1 and kcZ was set equal to 1.8×10⁻⁶ s–1.
The simulation presented in Fig. 4 was obtained in three steps. First 1 and E-2+ were associated,
without taking into account the equilibria involving light, i.e, the dark association of the
components was simulated. Then, to reproduce the fast isomerization performed in the experiment,
the obtained equilibrium concentrations for E-2+ and [1⊃E-2]+ were mathematically converted to
96% Z-isomer. Finally, the simulation was performed taking into account all the rate constants
© 2014 Macmillan Publishers Limited. All rights reserved.
S7
described above; the emission intensity was obtained normalizing the concentration of free ring for
its equilibrium value after the initial association of 1 and E-2+.
Energetic considerations. The free energy change of the system upon performing directional
cycling can be calculated from equation (S11), in which the partition constant K is the ratio of the
clockwise (Pcw) to counterclockwise (Pccw) rates. This quantity corresponds to the maximum
amount of energy that could in principle be converted into useful work. From the simulation of the
experimental behaviour under our set of conditions we found that Pcw/Pccw = 160; thus, at 20°C
ΔG = −RT lnK = −RT lnPcw
Pccw
= −3.0 kcal mol−1 (S11)
which corresponds to an energy of 5.1 kBT. This result is identical to that calculated by using the
generalized fluctuation-dissipation theorem for a closed reaction cycle coupled to an external
energy source7,8.
Under the conditions employed, the cycling quantum yield is 2.3×10⁻³ moles einstein-1, as
calculated from equation (S12):
Φcycl =Ncycles
N hν
=vcycl Δt V
Fhν (1−10−Airr ) Δt= 2.3×10⁻³ (S12)
where the number of cycles (Ncycles) performed in a given time interval (Δt) is calculated from the
cycling rate (vcycl = 1.7×10⁻¹⁰ M s–1) obtained from the kinetic simulation (see above). The number
of photons absorbed (Nhν) is given by equation (S3). It follows that, to perform a cycle under these
conditions, ca. 1 / 2.3×10⁻³ ≈ 430 photons of 365-nm light (78 kcal mol–1) are needed on average.
Therefore, the maximum energy conversion efficiency is
ηmax =ΔEmaxNhν
=3.0
430×78= 9×10⁻⁵
(S13)
These figures show that the system is able to exploit only a tiny fraction of the input light energy
because, perhaps not surprisingly, most of the energy is wasted into heat in excited-state vibrational
relaxation processes.
© 2014 Macmillan Publishers Limited. All rights reserved.
S8
2. NMR Spectroscopy
Supplementary Fig. 3. Partial 1H NMR (400 MHz, CD2Cl2, 298 K) spectra of (a) a solution of 1 (3 mM)
and [EE-4]PF6 (3 mM) and (b) the same solution after exhaustive irradiation at λ = 365 nm.
Supplementary Fig. 4. Partial 1H NMR (400 MHz, CD2Cl2, 298 K) spectra of (a) a solution of 1 (3 mM)
and [E-2]PF6 (3 mM) and (b) the same solution after exhaustive irradiation at λ = 365 nm.
© 2014 Macmillan Publishers Limited. All rights reserved.
S9
3. UV-Visible Spectroscopy
Supplementary Table 1. Spectroscopic and photochemical data of the investigated compounds (CH2Cl2,
r.t.).
Compound Absorption Luminescence Isomerization
λmax, nm
ε, M–1 cm–1 λmax, nm
Φem τ, ns ΦE→Z (λirr, nm)
Z/E PSS, % (λirr, nm)
kZ,Δ, s–1
1 268 324
9500 7900
343 0.26 9.8 –– –– ––
E-2+ 332 448
23000 700
[a] [a] [a] 0.15 (365) 0.30 (346) 0.15 (287)
>96 (365) ––
[1⊃E-2]+ 323 448
30000 700
–– <10–4 –– 0.15 (365) 0.30 (436) 0.15 (287)
>99 (365) ––
Z-2+ 287 437
5500 1700
[a] [a] [a] –– –– 1.4×10⁻⁶ [b]
[1⊃Z-2]+ 323 437
9400 1700
–– <10–4 –– –– –– 1.3×10⁻⁶ [b]
3+ [c] [c] [a] [a] [a] –– –– ––
[1⊃3]+ 268 322
9800 7600
343 0.26 –– –– –– ––
EE-4+ 335 441
43000 1200
[a] [a] [a] 0.15 (365) >96 (365)[d] ––
[1⊃EE-4]+ 323 441
46000 1200
–– <10–4 –– 0.15 (365) 0.15 (287)
>96 (365)[d] ––
ZZ-4+ 289 436
10000 2900
[a] [a] [a] –– –– 4×10⁻⁶ [b]
[1⊃ZZ-4]+ –– –– –– <10–4 –– –– –– ––
[a] Not luminescent.
[b] Performed at 20 °C.
[c] The compound does not absorb in the investigated spectral region (250-800 nm).
[d] According to a statistical distribution of the E and Z azobenzene units, the composition of the PSS in terms of the
various isomeric forms is 92% ZZ, 8% EZ and a negligible amount of EE.
© 2014 Macmillan Publishers Limited. All rights reserved.
S10
Supplementary Table 2. Composition of the photostationary state for the free and complexed axle 2 under
different irradiation conditions, determined from the disappearance of the ππ* absorption band of the
azobenzene unit of the axle.
λirr (nm) Z-2+ (%) [1⊃Z-2]+ (%)
287 24 31
365 96 >99
436 16 16
© 2014 Macmillan Publishers Limited. All rights reserved.
S11
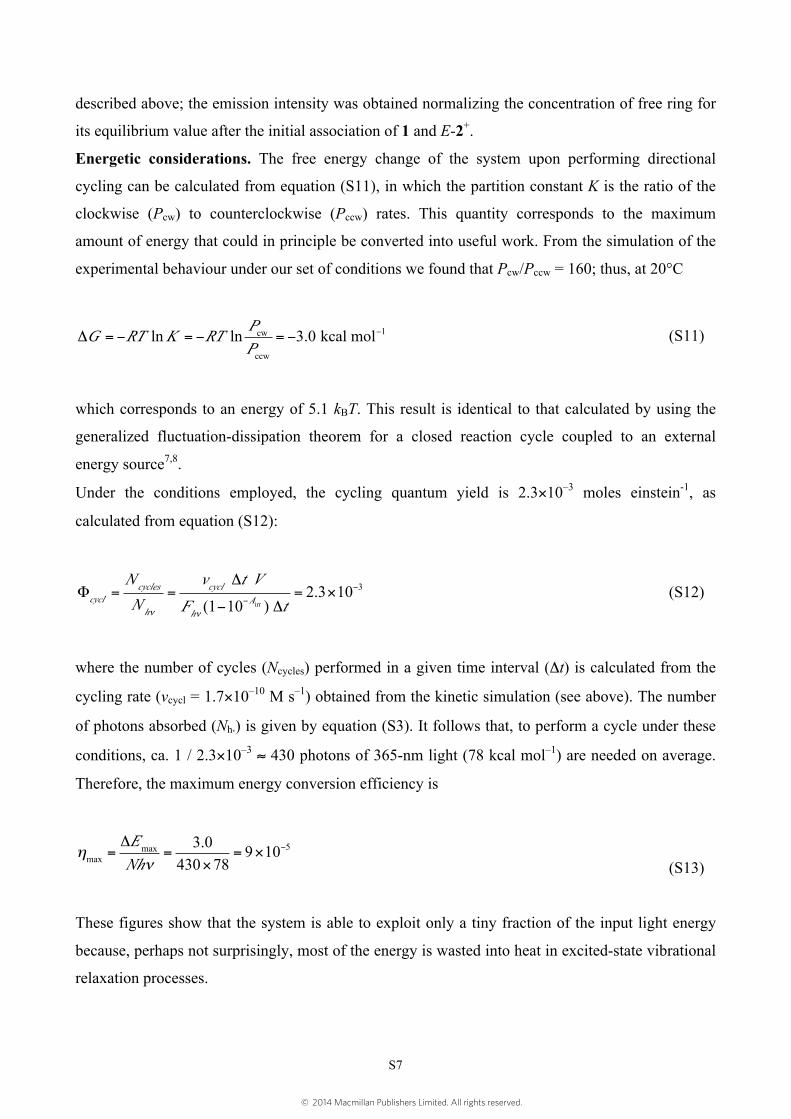
Supplementary Fig. 5. Absorption (full line, left scale) and luminescence (right scale) emission (dashed line,
λexc = 272 nm) and excitation (dotted line, λmax = 345 nm) spectra of macrocycle 1 (air equilibrated CH2Cl2,
r.t.).
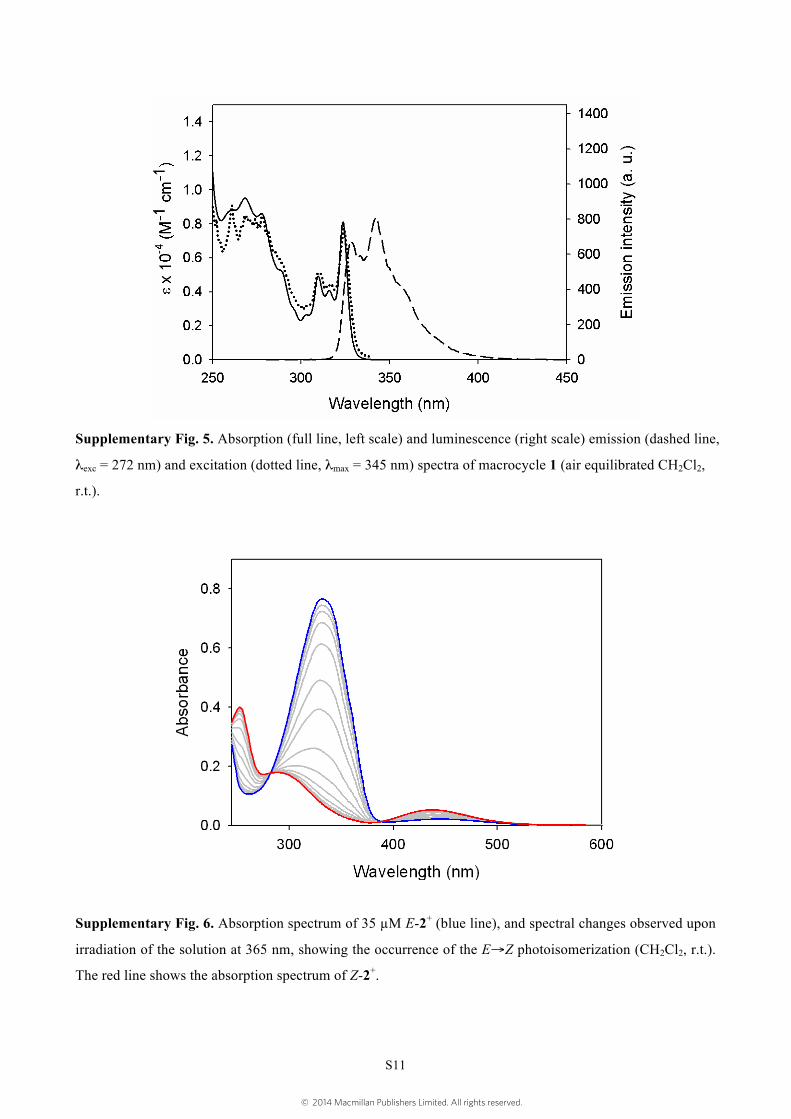
Supplementary Fig. 6. Absorption spectrum of 35 µM E-2+ (blue line), and spectral changes observed upon
irradiation of the solution at 365 nm, showing the occurrence of the E→Z photoisomerization (CH2Cl2, r.t.).
The red line shows the absorption spectrum of Z-2+.
© 2014 Macmillan Publishers Limited. All rights reserved.
S12
Supplementary Fig. 7. Sum of the absorption spectra of 20 µM 1 and E-2+ (black line), and absorption
spectrum of the mixture of the two compounds (red line) at the same concentration (CH2Cl2, r.t.). Dedicated
spectrophotometric cells with separated compartments allowed a careful in situ determination of the spectra
of unmixed and mixed solutions.
Supplementary Fig. 8. Observation of the dethreading of [1⊃E-2]+. Time-dependent luminescence changes
(λexc = 272 nm, λem = 390 nm) upon 20-fold dilution of a solution of 75 µM 1 and E-2+ (86% initial
complexation) in CH2Cl2 at 20 °C. The full line is the data fit according to a first-order kinetic equation.
© 2014 Macmillan Publishers Limited. All rights reserved.
S13
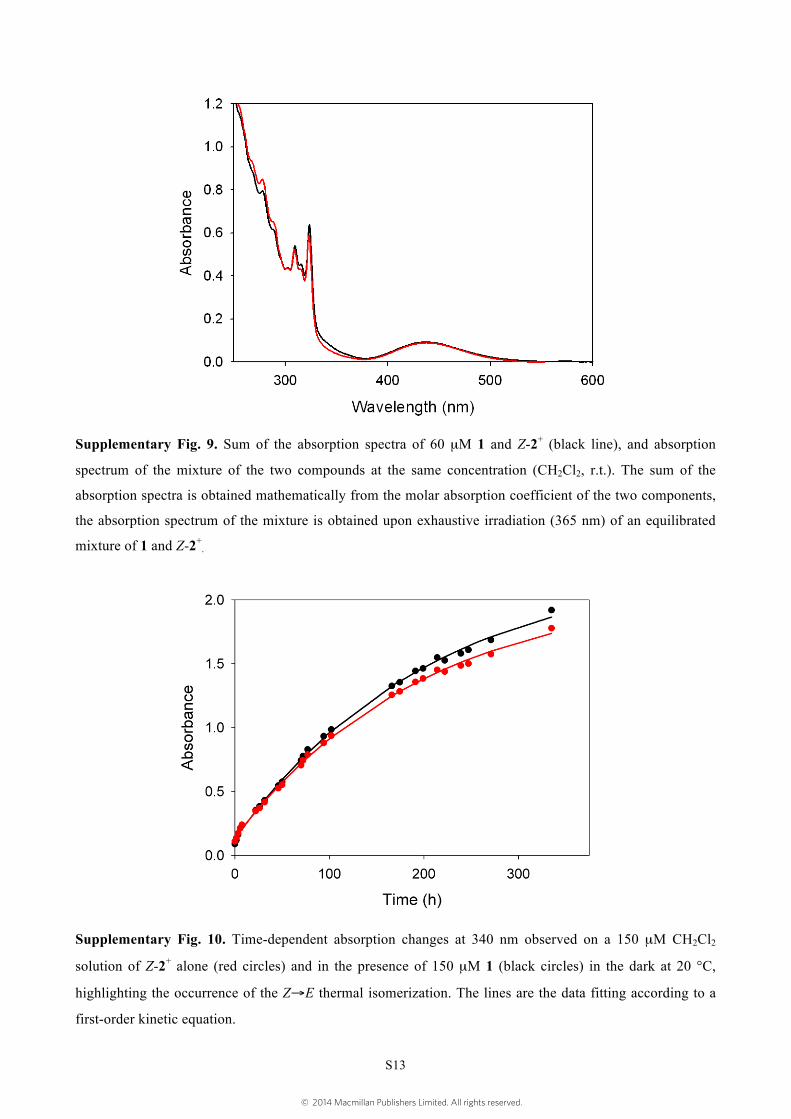
Supplementary Fig. 9. Sum of the absorption spectra of 60 µM 1 and Z-2+ (black line), and absorption
spectrum of the mixture of the two compounds at the same concentration (CH2Cl2, r.t.). The sum of the
absorption spectra is obtained mathematically from the molar absorption coefficient of the two components,
the absorption spectrum of the mixture is obtained upon exhaustive irradiation (365 nm) of an equilibrated
mixture of 1 and Z-2+.
Supplementary Fig. 10. Time-dependent absorption changes at 340 nm observed on a 150 µM CH2Cl2
solution of Z-2+ alone (red circles) and in the presence of 150 µM 1 (black circles) in the dark at 20 °C,
highlighting the occurrence of the Z→E thermal isomerization. The lines are the data fitting according to a
first-order kinetic equation.
© 2014 Macmillan Publishers Limited. All rights reserved.
S14
Supplementary Fig. 11. Sum of the absorption spectra of 30 µM 1 and a 1.0 mM 3+ (black line), and
absorption spectrum of the mixture of the two compounds at the same concentration (CH2Cl2, r.t.). Dedicated
spectrophotometric cells with separated compartments allowed a careful in situ determination of the spectra
of unmixed and mixed solutions.
Supplementary Fig. 12. Titration curve, obtained from the absorbance values at 325 nm, observed upon
addition of 3+ to a 80 µM solution of 1 in CH2Cl2 at 20 °C. The full line represents the data fitting according
to a 1:1 binding model.
© 2014 Macmillan Publishers Limited. All rights reserved.
S15
Supplementary Fig. 13. Observation of the dethreading of [1⊃3]+. Time-dependent absorbance changes at
325 nm upon 6-fold dilution of a solution of 175 µM 1 and 3+ (66 % initial complexation) in CH2Cl2 at 20 °C.
The full line is the data fit according to a first-order kinetic equation. To enhance the increase in the
absorbance 5 cm pathlength cuvettes were used in this experiment.
Supplementary Fig. 14. Absorption spectrum of 22 µM EE-4+ (blue line), and absorption spectrum of ZZ-4+
(red line), obtained upon exhaustive irradiation of the solution at 365 nm (CH2Cl2, r.t.).
© 2014 Macmillan Publishers Limited. All rights reserved.
S16
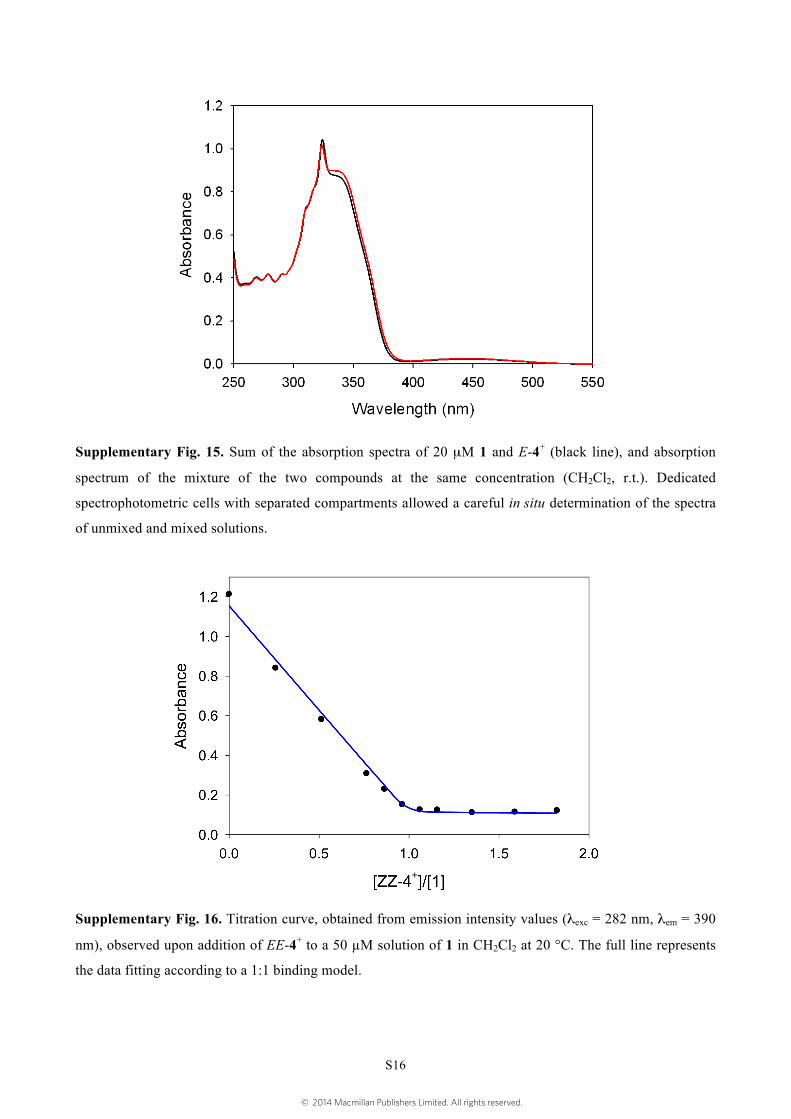
Supplementary Fig. 15. Sum of the absorption spectra of 20 µM 1 and E-4+ (black line), and absorption
spectrum of the mixture of the two compounds at the same concentration (CH2Cl2, r.t.). Dedicated
spectrophotometric cells with separated compartments allowed a careful in situ determination of the spectra
of unmixed and mixed solutions.
Supplementary Fig. 16. Titration curve, obtained from emission intensity values (λexc = 282 nm, λem = 390
nm), observed upon addition of EE-4+ to a 50 µM solution of 1 in CH2Cl2 at 20 °C. The full line represents
the data fitting according to a 1:1 binding model.
© 2014 Macmillan Publishers Limited. All rights reserved.
S17
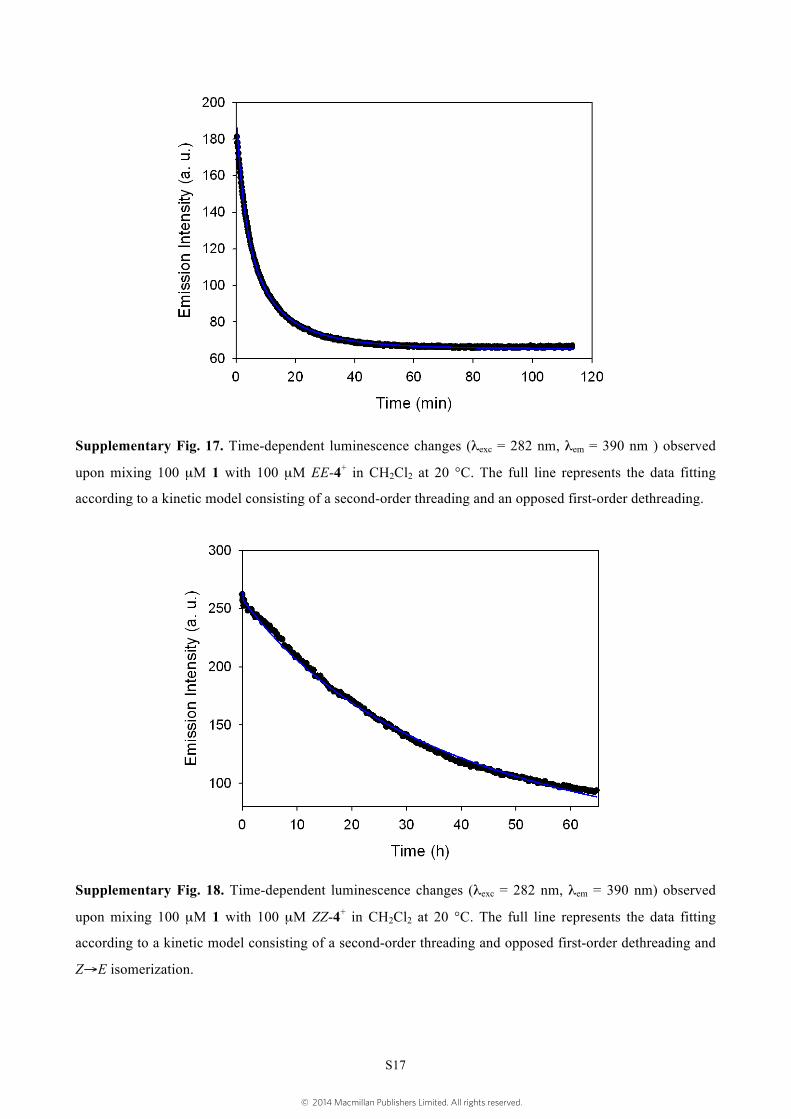
Supplementary Fig. 17. Time-dependent luminescence changes (λexc = 282 nm, λem = 390 nm ) observed
upon mixing 100 µM 1 with 100 µM EE-4+ in CH2Cl2 at 20 °C. The full line represents the data fitting
according to a kinetic model consisting of a second-order threading and an opposed first-order dethreading.
Supplementary Fig. 18. Time-dependent luminescence changes (λexc = 282 nm, λem = 390 nm) observed
upon mixing 100 µM 1 with 100 µM ZZ-4+ in CH2Cl2 at 20 °C. The full line represents the data fitting
according to a kinetic model consisting of a second-order threading and opposed first-order dethreading and
Z→E isomerization.
© 2014 Macmillan Publishers Limited. All rights reserved.
S18
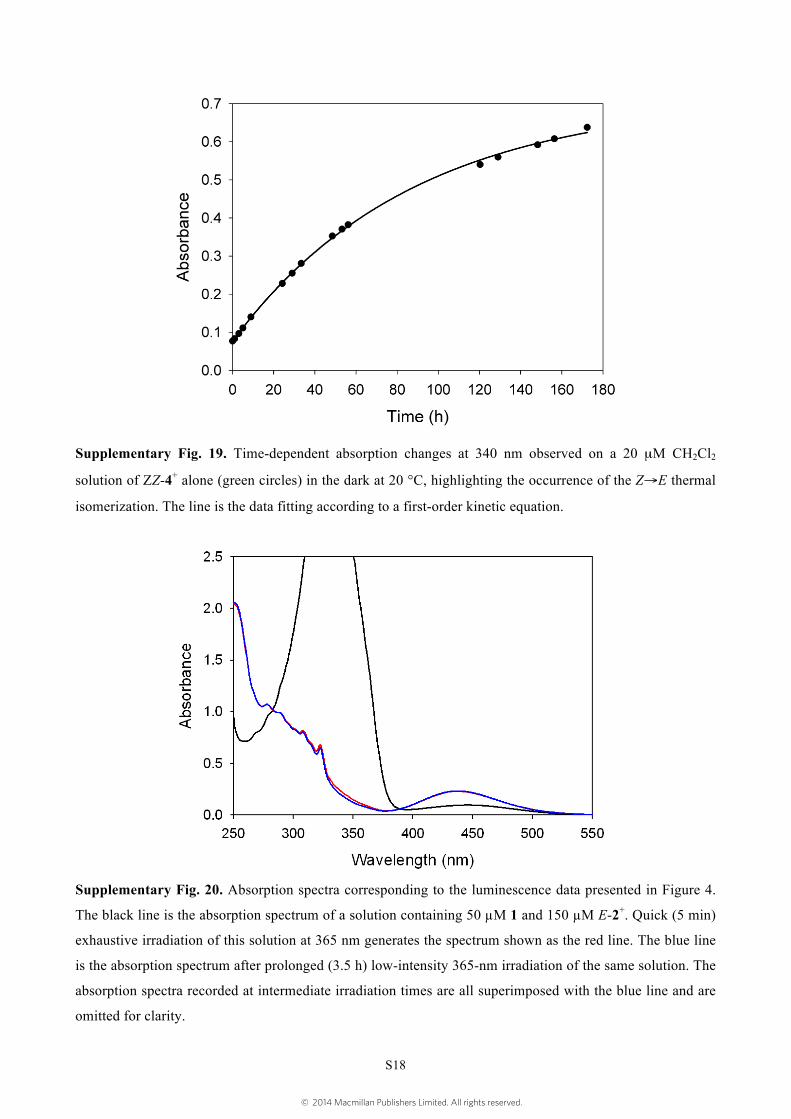
Supplementary Fig. 19. Time-dependent absorption changes at 340 nm observed on a 20 µM CH2Cl2
solution of ZZ-4+ alone (green circles) in the dark at 20 °C, highlighting the occurrence of the Z→E thermal
isomerization. The line is the data fitting according to a first-order kinetic equation.
Supplementary Fig. 20. Absorption spectra corresponding to the luminescence data presented in Figure 4.
The black line is the absorption spectrum of a solution containing 50 µM 1 and 150 µM E-2+. Quick (5 min)
exhaustive irradiation of this solution at 365 nm generates the spectrum shown as the red line. The blue line
is the absorption spectrum after prolonged (3.5 h) low-intensity 365-nm irradiation of the same solution. The
absorption spectra recorded at intermediate irradiation times are all superimposed with the blue line and are
omitted for clarity.
© 2014 Macmillan Publishers Limited. All rights reserved.
S19
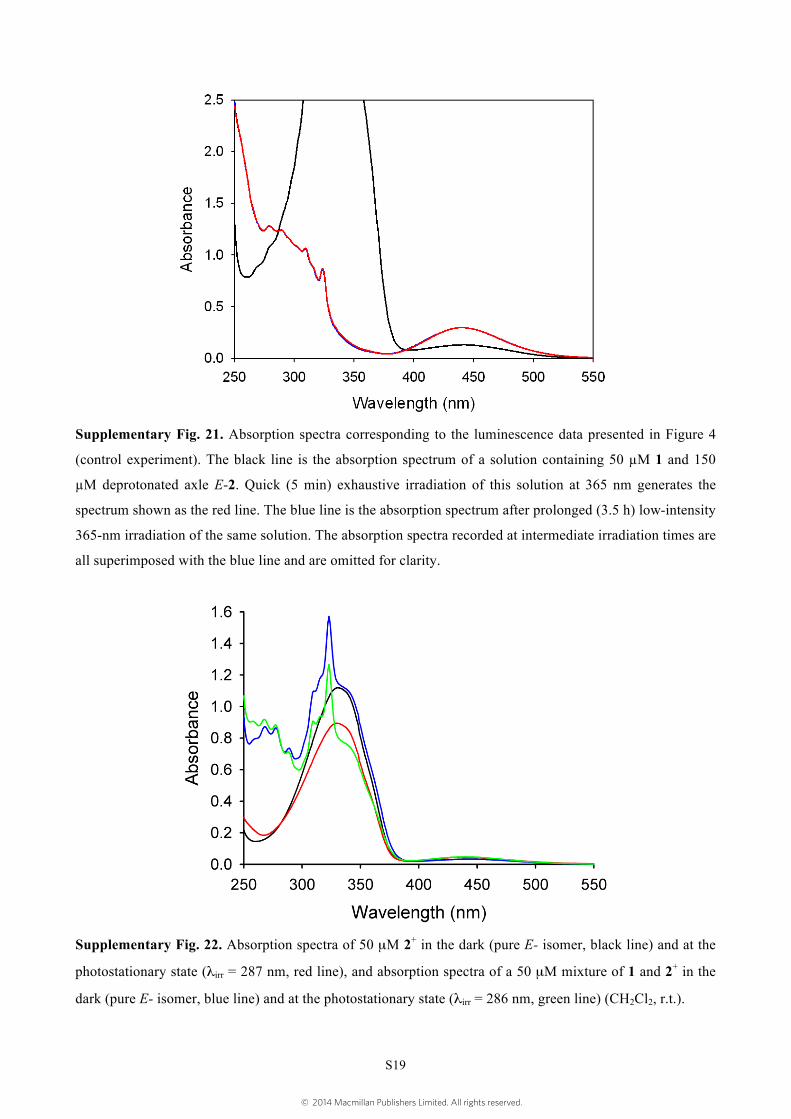
Supplementary Fig. 21. Absorption spectra corresponding to the luminescence data presented in Figure 4
(control experiment). The black line is the absorption spectrum of a solution containing 50 µM 1 and 150
µM deprotonated axle E-2. Quick (5 min) exhaustive irradiation of this solution at 365 nm generates the
spectrum shown as the red line. The blue line is the absorption spectrum after prolonged (3.5 h) low-intensity
365-nm irradiation of the same solution. The absorption spectra recorded at intermediate irradiation times are
all superimposed with the blue line and are omitted for clarity.
Supplementary Fig. 22. Absorption spectra of 50 µM 2+ in the dark (pure E- isomer, black line) and at the
photostationary state (λirr = 287 nm, red line), and absorption spectra of a 50 µM mixture of 1 and 2+ in the
dark (pure E- isomer, blue line) and at the photostationary state (λirr = 286 nm, green line) (CH2Cl2, r.t.).
© 2014 Macmillan Publishers Limited. All rights reserved.
S20
Supplementary Fig. 23. Absorption spectra of 50 µM 2+ in the dark (pure E- isomer, black line) and at the
photostationary state (λirr = 436 nm, red line), and absorption spectra of a 50 µM mixture of 1 and 2+ in the
dark (pure E- isomer, blue line) and at the photostationary state (λirr = 436 nm, green line) (CH2Cl2, r.t.).
Supplementary Fig. 24. Absorption spectra of the sum of 55 µM 1 and 2+ in the dark (pure E- isomer, black
line) and at the photostationary state (λirr = 365 nm, red line) and absorption spectra of a 55 µM mixture of
the two components in the dark (pure E- isomer, blue line) and at the photostationary state (λirr = 365 nm,
green line) (CH2Cl2, r.t.).
© 2014 Macmillan Publishers Limited. All rights reserved.
S21
4. References
1. Pedersen, C. J. J. Am. Chem. Soc. 89, 7017 (1969).
2. Baroncini, M., Silvi, S., Venturi, M. & Credi, A. Angew. Chem. Int. Ed. 51, 4223 (2012).
3. Montalti, M., Credi, A., Prodi, L. & Gandolfi, M. T. Handbook of Photochemistry – Third
Edition (CRC Press, 2006).
4. Binstead, R.A. SPECFIT (Spectrum Software Associates, Chapel Hill, USA, 1996).
5. Credi, A. & Prodi, L. J. Mol. Struct., in press; DOI: 10.1016/j.molstruc.2014.03.028.
6. Klán, P. & Wirz, J. Photochemistry of Organic Compounds: From Concepts to Practice (Wiley,
New York, 2009) p. 117.
7. Astumian, R. D. Phys. Chem. Chem. Phys. 9, 5067 (2007).
8. Coskun, A., Banaszak, M., Astumian, R. D., Stoddart, J. F. & Grzybowski, B. A. Chem. Soc.
Rev. 41, 19 (2012).
© 2014 Macmillan Publishers Limited. All rights reserved.